Vulnerability and Social Protection in Malawi - Institute of
99
IDS DISCUSSION PAPER 387 Vulnerability and Social Protection in Malawi Stephen Devereux, Bob Baulch, Ian Macauslan, Alexander Phiri and Rachel Sabates-Wheeler November 2006 Institute of Development Studies at the University of Sussex Brighton BN1 9RE UK IDS DISCUSSION PAPER 387 01
Transcript of Vulnerability and Social Protection in Malawi - Institute of

IDS DISCUSSION PAPER 387
Vulnerability and Social Protection in Malawi
Stephen Devereux, Bob Baulch, Ian Macauslan, Alexander Phiri andRachel Sabates-WheelerNovember 2006
Institute of Development Studies at the University of Sussex Brighton BN1 9RE UK
IDS DISCUSSION PAPER 387
01

Vulnerability and Social Protection in MalawiStephen Devereux, Bob Baulch, Ian Macauslan, Alexander Phiri and Rachel Sabates-WheelerFirst published by the Institute of Development Studies in November 2006© Institute of Development Studies 2006ISBN-13: 978 1 85864 628 6ISBN-10: 1 85864 628 6
A catalogue record for this publication is available from the British Library.All rights reserved. Reproduction, copy, transmission, or translation of any part of this publication may be madeonly under the following conditions:l with the prior permission of the publisher; orl with a licence from the Copyright Licensing Agency Ltd., 90 Tottenham Court Road, London W1P 9HE, UK, or
from another national licensing agency; orl under the terms set out below.
This publication is copyright, but may be reproduced by any method without fee for teaching or non-profit purposes, but not for resale. Formal permission is required for all such uses, but normally will be granted immediately. For copying in any other circumstances, or for re-use in other publications, or for translation oradaptation, prior written permission must be obtained from the publisher, and a fee may be payable.
Available from:Communications UnitInstitute of Development Studies at the University of SussexBrighton BN1 9RE, UK.Tel: +44 (0)1273 678269Fax: +44 (0)1273 621202Email: [email protected]/ids/bookshop
Typeset by Warwick Printing, Warwick UK. Printed by ImageData Group, Brighton UK.IDS is a charitable company limited by guarantee and registered in England (No. 877338).
IDS DISCUSSION PAPER 387
02

IDS DISCUSSION PAPER 387
03
Vulnerability and Social Protection in Malawi
Stephen Devereux, Bob Baulch, Ian Macauslan, Alexander Phiri andRachel Sabates-Wheeler
Abstract
Vulnerability appears to be rising for many Malawians, whose exposure to livelihood shocksis increasing while their ability to cope is decreasing. The first part of this report draws onrecently published studies and analysis of the 2004/05 Integrated Household Survey datasetto explore the nature of vulnerability in Malawi. Most livelihoods in Malawi depend on agriculture, but agricultural vulnerability is extremely high due to erratic rainfall, inequality inlandholdings, constrained access to inputs, limited diversification and weak markets. Non-economic factors that compound economic risks include demographic and health risks,gendered vulnerabilities, social change and governance failures.
Economic vulnerability, defined as the risk of future monetary poverty, is high because ofthe heavy concentration of Malawians clustered close to the poverty line, and because ofthe frequency and severity of covariant shocks such as droughts, floods and food price fluctuations, as well as idiosyncratic shocks such as accidents, illness and death of familymembers. The economic, demographic and social impacts of HIV/AIDS are especially devastating. Monetary and subjective indicators of vulnerability are related to demographiccharacteristics (female- and older-headed households, orphans), lack of assets, geographiclocation (with a north-south gradient of rising vulnerability) and multiple shocks. Policy priorities derived from this analysis include: stabilise food prices, enhance access to agricultural inputs, and identify labour-saving technologies for labour-constrained households. More generally, social protection and livelihood promotion measures, togetherwith an enabling environment, are central to addressing vulnerability in Malawi.
The second part of this report reviews a range of ongoing and discontinued social protection mechanisms in Malawi. Free inputs distribution (‘Starter Packs’) followed theabolition of fertiliser subsidies in the 1990s, and had positive impacts on food productionand prices. Public works programmes (food-, cash- or inputs-for-work), social funds (theMalawi Social Action Fund) and food transfers (food aid, school feeding) also have long histories in Malawi, but have demonstrated limited impacts. Finally, unconditional cashtransfers are increasingly popular, which this review endorses with the qualification thatongoing pilot projects need to be institutionalised within a comprehensive, governmentowned, national social protection strategy.
Keywords: Malawi, poverty, social protection, vulnerability.
IDS DISCUSSION PAPER 387
04
Bob Baulch is an Agricultural/Development Economist and IDS Fellow who works onrural poverty, poverty dynamics, and food price analysis. Other interests include agricultural marketing, commodity price stabilisation, econometrics, household surveys,microeconomic determinants of inequality, and poverty monitoring and targeting. Bobhas long-term experience in Papua New Guinea, the Philippines, Sudan and Vietnam.
Stephen Devereux is a Development Economist and IDS Fellow who works on food security, rural livelihoods, poverty reduction and social protection. His research experiencehas mainly been in Africa, especially Ethiopia, Ghana, Malawi and Namibia. His booksinclude 'Fieldwork in Developing Countries', 'Theories of Famine', and 'Food Security inSub-Saharan Africa'.
Ian Macauslan is an MPhil Student at IDS whose recent focus is on social protection p o l i t i c s and policies. He is currently researching the politics of the National RuralEmployment Guarantee Act in India and has just completed work on synergies betweensocial protection and agriculture in Africa. Before coming to IDS, Ian worked for NGOs,researching vulnerability in rural Cambodia and adolescent migration in rural India.
Alexander Phiri is an Agricultural Economist and Lecturer at Bunda College ofAgriculture, University of Malawi. His main research focus over the last decade has beenon grain legume production and markets. He also has extensive experience in baselinestudies, rural project evaluations and policy analysis. His research experience has been inMalawi, Mozambique, Tanzania, Zambia and Zimbabwe.
Rachel Sabates-Wheeler is a Development Economist and IDS Fellow with extensiveexperience in rural development, institutional analysis and social policy. Although her geographic research focus has been primarily in Eastern Europe and Central Asia, sincejoining IDS she has become involved with poverty analysis work relating to PRSPs, socialprotection and migration in Africa. She is currently involved in a number of studies thatexplore understandings of risk and vulnerability both conceptually and empirically.

Attributions and acknowledgementsThis Discussion Paper draws together under one cover two related reports that were commissioned by DFID Malawi. The first study, ‘Vulnerability to Chronic Poverty andMalnutrition in Malawi’, was written by a team from IDS and Bunda College, University ofMalawi. As team leader, Stephen Devereux compiled the report and wrote or co-authoredChapters 1, 3 and 6. Bob Baulch and Rachel Sabates-Wheeler conducted the empiricalanalysis of the Malawi Integrated Household Survey 2004/05. In addition, Bob co-authoredChapter 2 and wrote Chapter 4, while Rachel co-authored Chapters 1 and 2, and wroteChapter 5. Alexander Phiri wrote two background papers that contributed to Chapter 3.The second study, ‘Review of Social Protection Instruments in Malawi’, was written byStephen Devereux and Ian Macauslan.
We would like to thank the following individuals for their support and various inputs to thisreport:
l∑ DFID Malawi: Sharon Kinsley, Mulle Chikoko, Leigh Stubblefield, Roger Wilson, Andrea Cook, Isabelle Cardinal, Dennis Pain, Mark Davies, and Yamikani Banda
l University of Sussex: Catherine Lowery and Santiago Ripoli, for research assistance, Mike Campbell (Geography Department), for producing the maps, Henry Lucas (IDS), for DHS data analysis, and Jenny Edwards (IDS), for administrative support
l Government of Malawi: Ben Botolo, Dan Mwabumba and Charles Rathman, from the Ministry of Economic Planning and Development (MEPD); Madson Mwadiwa, Permanent Secretary for the Department for Poverty & Disaster Management Affairs(DPDMA)
l Poverty and Vulnerability Assessment (PVA) Team: Kathleen Beegle, Antonio Nucifora, Benjamin Davis, Harold Alderman
l IFPRI: Todd Benson, for sharing geo-referenced mapping files for Malawi
l Participants in two national workshops held in Lilongwe in August and December 2005.
IDS DISCUSSION PAPER 387
05

IDS DISCUSSION PAPER 387
06

Section 1
Vulnerability to Chronic Povertyand Malnutrition in Malawi
IDS DISCUSSION PAPER 387
07

IDS DISCUSSION PAPER 387
08

Contents1 Introduction and conceptual framework 13
1.1 Introduction 13
1.2 Conceptual framework 13
1.2.1 Defining vulnerability 14
1.2.2 Vulnerability scenarios 15
1.3 Structure of this report 16
2 Data sources for analysing vulnerability in Malawi 18
2.1 Introduction 18
2.2 Integrated Household Surveys (IHS) 18
2.3 Complementary Panel Survey (CPS) 20
2.4 Malawi Atlas of Social Statistics 20
2.5 Malawi Vulnerability Assessment Committee (MVAC) 20
2.6 Demographic and Health Surveys (DHS) 21
2.7 Core Welfare Indicator Questionnaire (CWIQ) 22
2.8 Nutrition and food security surveillance 22
3 Review of literature on vulnerability in Malawi 23
3.1 Definitions and conceptual approaches 23
3.2 Sources of vulnerability 23
3.2.1 Vulnerability in agriculture 23
3.2.2 Economic shocks and processes 27
3.2.3 Health and nutrition risks 30
3.2.4 Demographic vulnerability 33
3.2.5 Political and social vulnerabilities 34
3.3 Conclusions 35
4 Vulnerability in the Malawi IHS-2 Data 37
4.1 Introduction 37
4.2 Sources of vulnerability 38
4.3 Estimating changes in welfare over time 40
4.4 Conclusions 44
5 Subjective poverty and social exclusion in Malawi: an analysis using IHS-2 Data 45
5.1 Introduction 45
5.2 Data and data limitations 45
IDS DISCUSSION PAPER 387
09

5.3 Changes in wellbeing 46
5.3.1 Factors associated with changes in wellbeing 46
5.3.2 Changes in wellbeing by gender of household head 49
5.4 Comparing subjective and monetary poverty measurements 49
5.5 Social understandings of poverty: vulnerable groups 52
5.5.1 Do poor households have more orphans? 53
5.5.2 Are poorer female-headed households caring for orphans more vulnerable than other poor households? 55
5.6 Other ‘vulnerable groups’ 56
5.7 Conclusions 58
6 Implications for policy 59
6.1 Introduction 59
6.2 Social protection 59
6.3 Livelihood promotion 60
6.4 Conclusion 61
References 62
Annex tables 65
Tables
Table 1 IHS-2 Questionnaires: relevant modules for vulnerability analysis 19
Table 2 Access to health services and drinking water in Malawi (% of households) 31
Table 3 Poverty in Malawi by region and gender of household head, 2004/5 35
Table 4 The poverty headcount with alternative poverty lines 37
Table 5 Frequency of shocks at the household level 38
Table 6 Impact of household-level shocks in Malawi 39
Table 7 Frequency and impact of community-wide shocks 40
Table 8 Changes in ownership of durable assets 41
Table 9 Determinants of changes in the durable asset index 43
Table 10 Multinomial logit model for estimating perceptions in change in wellbeingover the last year 47
Table 11 Multinomial logit including change variables plus time-invariantcharacteristics 48
Table 12 Characteristics of households with and without orphans aged 0–18 years 54
Table 13 Language groups in Malawi 65
Table 14 Property tenure systems in Malawi 65
Table 15 Comparison of monetary and subjective poverty measurements 66
IDS DISCUSSION PAPER 387
10

Figures
Figure 1 Vulnerability scenarios for Malawi 15
Figure 2 Cumulative effect of regular shocks 16
Figure 3 Maize production in Malawi, 1990–2001 (metric tonnes) 24
Figure 4 Maize production in Malawi (MT) by ADD, 1984–2002 25
Figure 5 Maize hectarage in Malawi by variety, 1984–2002 25
Figure 6 Lorenz curves for land in Malawi, 2004/5 26
Figure 7 Lorenz curves for livestock in Malawi, 2004/5 26
Figure 8 Fertiliser price trends in Malawi, 1990–2003 27
Figure 9 Supply and demand for ‘ganyu’ labour, 1992–2002, rural Zomba 28
Figure 10 Average maize and cassava prices in Malawi, 2000–2 (MK/kg) 29
Figure 11 Impacts of food crisis on household maize stocks and asset losses, 2001/2 30
Figure 12 Self-assessed poverty in Central Malawi, before and after the 2001/2 c r i s i s 30
Figure 13 Child malnutrition in Malawi, 2004 31
Figure 14 Education in Malawi, by gender 32
Figure 15 ‘North-to-south gradients’ in food stress and malnutrition in Malawi 32
Figure 16 Infant and child mortality rates in Malawi, 1955–2015 33
Figure 17 Histogram of per capita expenditures with ultra- and total poverty lines 38
Figure 18 Scatter plot of the asset index in 2003/4 and 2004/5 42
Figure 19 Self-reported declines in wellbeing in Malawi 46
Figure 20 Are shocks felt equally by the poor and the non-poor? 47
Figure 21 Shocks affect female-headed households more than male-headedhouseholds 49
Figure 22 A comparison of monetary and subjective poverty in Malawi, by region 50
Figure 23 Correlates of poverty that are significant in monetary and subjective measurements 51
Figure 24 Differences in correlates of poverty according to poverty measurement 52
Figure 25 Distribution of orphans across income quintiles 53
Figure 26 Female-headed households have more orphans and they are poorer 54
Figure 27 Land per capita by different household categories 55
Figure 28 Levels of durable assets owned by different household categories 55
Figure 29 Percent of monetarily poor households according to language groupings 56
Figure 30 Percent of subjectively poor households according to language groupings 57
Figure 31 Households with disabled members 57
IDS DISCUSSION PAPER 387
11

IDS DISCUSSION PAPER 387
12
1 Introduction and conceptual framework
1.1 Introduction
This study aims to develop a conceptual framework to improve the understanding of vulnerability to chronic poverty and malnutrition in Malawi. The project started with areview of available evidence and thinking on the poverty and vulnerability context inMalawi, and developed an evidence-based conceptual framework. Next the framework waselaborated and tested empirically, drawing on the 2004/5 Integrated Household Survey(IHS-2) and other datasets, to strengthen the analysis and refine the conceptual framework.The overall intention was to draw out implications for social protection policy and relatedprogramming in Malawi.
1.2 Conceptual framework
Our conceptual approach draws on several insights from the risk and vulnerability literature,including the following propositions: (1) that vulnerability is a complex and multidimensionalconcept; (2) that vulnerability must be understood in relation to outcomes of interest (‘vulnerable to…’); (3) that individuals, households and communities are not passive in theface of vulnerability but adopt a range of responses; and (4) that policy interventions canaddress vulnerability in many discrete ways. Our approach can be simply encapsulated in thefollowing statement, which provides an organising framework for the work on vulnerabilitythat is undertaken in this project:
Vulnerability is conceptualised in relation to specified outcomes (chronic poverty, malnutrition) and is mediated by both household responses (coping strategies) and p o l i c yinterventions (risk reduction, risk mitigation, risk coping).
A conceptual framework for analysing vulnerability to chronic poverty and malnutrition inMalawi expands on the highlighted elements of this statement. The framework has sevencomponents:
Generic vulnerability categories: agricultural vulnerabilities; economic shocks andprocesses; health risks; demographic vulnerability; political, legal and social risks.
Malawi-specific vulnerability factors: these are directly related to the above list ofgeneric vulnerability categories: for example, under ‘agricultural vulnerabilities’ weconsider erratic rainfall and soil fertility decline; under ‘economic shocks and processes’,weak markets and undiversified livelihoods; ‘health risks’ include malnutrition and HIV/AIDS, and so on.
Outcomes of vulnerability: in the context of this project, the main outcomes of interestare chronic poverty and malnutrition.
Household responses to vulnerability: these include agricultural intensification, livelihooddiversification, and ‘coping strategies’.
Generic policy responses to vulnerability: following standard risk analytical frameworks,these include ‘risk reduction’, ‘risk mitigation’ and ‘risk coping’.
Specific policy responses to vulnerability: under ‘risk reduction’, these include economicgrowth and employment creation policies; under ‘risk mitigation’, livelihood diversification and insurance mechanisms; and under ‘risk coping’, safety nets (e.g. foodaid) and broader social protection policies – recognising that some forms of socialprotection also have impacts on risk reduction and risk mitigation.
IDS DISCUSSION PAPER 387
13
Relevant policies in Malawi: these are directly related to specific policy responses –Malawi’s Poverty Reduction Strategy relates to economic growth; MASAF is partly anemployment creation programme; there is already a National Safety Net Strategy;and there will be a Social Protection Strategy in 2007.
1.2.1 Defining vulnerability
A common way of conceptualising vulnerability is to view it as a product of two components:exposure to hazard (a shock or process) and resilience, or the ability to manage the hazard.From the perspective of vulnerable Malawians, hazards could include natural shocks such asdrought, or economic shocks such as currency depreciation. Resilience relates to ‘copingstrategies’ at the individual, household, community and group levels. People can protectthemselves against the risk that a hazard will undermine their livelihood by drawing on savings, diversifying their livelihoods to spread risk, building social networks that can provideinformal social assistance in times of need, and so on. When all these risk-coping mechanisms fail, people become acutely vulnerable to even minor shocks. As will be arguedlater in this paper, many Malawians are more vulnerable today than in the past because hazards appear to have increased – rainfall and food production are erratic, HIV/AIDS isspreading, markets are weak and prices are volatile – and their ability to cope has declined –livelihoods are dangerously undiversified, repeated shocks have eroded assets and savings,informal networks are less willing or able to provide assistance.
Understanding vulnerability in two-dimensional space is important as it illustrates the verydifferent policy responses that need to be taken in relation to what constitutes the vulnerability of any one person, household, community, or ‘vulnerable group’. It is particularlyuseful for acute situations requiring an immediate response. That is, at any one time it ispossible to construct a static vulnerability profile that indicates whether the hazard or theability to cope is the main determinant of vulnerability. Policies appropriate to the compositenature of the vulnerability can then be designed. However, to understand vulnerability fullyit is not enough to simply take a one-period view; we need know what happens in the nextperiod. Vulnerability needs to be forward-looking, as it makes a prediction about futurepoverty (or other outcomes). Vulnerability does not simply refer to those who are likely tobecome poor in the future due to an unexpected shock, but also to those who will remainpoor, those who will fall deeper into poverty and those who may fall into poverty due topredicable fluctuations such as seasonality. This disaggregation is important as the policyimplications are very different for these different groups.
An understanding of vulnerability is further complicated by the notion of ‘ability to manage’.We argue that the ability to manage shocks or hazards is a complex function of existing behaviour, reflected in livelihood profiles that themselves represent long-term or structuraladaptation to predictable shocks; crisis response behaviour (such as the ability to rely onformal and informal insurance and networks in times of crisis), which is constrained byestablished livelihoods; and by external (policy) response to a predicted and actual crisis.
It is important to emphasise that vulnerability, poverty and food insecurity are not synonymous, although the three concepts do overlap and all of them are responsible forcausing malnutrition, one outcome indicator of interest in this study. Specifically, vulnerabilityis a broader concept than poverty, in at least three ways:
(1) The non-poor are also vulnerable to future poverty (some definitions of vulnerability refer to people whose income is within, say, 20 per cent of the poverty line).
(2) Vulnerability incorporates various non-income aspects of ill-being, such as insecurity, social exclusion and political marginalisation, while poverty measures focus on income and assets.
(3) Vulnerability is a dynamic concept, which is both forward-looking and constantly changing, while poverty is a static concept that measures proxies for wellbeing at a point in time.
IDS DISCUSSION PAPER 387
14

Policy implications of vulnerability are also broader than efforts to reduce poverty –a l t h o u g h it is true that wealthier people tend to be less vulnerable, because they havemore income and assets to buffer them against hazardous shocks and adverse processes.Policy interventions to manage vulnerability can either aim to reduce or spread risk (e.g. bysupporting livelihood diversification), or to strengthen resilience (e.g. by introducing socialinsurance mechanisms such as weather insurance for farmers). In the absence or failure ofthese measures, public interventions need to deliver safety nets (e.g. food aid) and otherforms of social protection (e.g. orphan carer grants) to those affected by shocks andprocesses that they are unable to cope with unassisted.
1.2.2 Vulnerability scenarios
The above conceptualisation of vulnerability as having two distinct and dynamic dimensionscan be illustrated in relation to the ‘vulnerability scenarios’ presented below.
Figure 1 Vulnerability scenarios for Malawi
Source: Sabates-Wheeler and Haddad (2005)
The stylised scenarios in Figure 1 highlight a few possibilities of dynamic situations. The bottom left-hand quadrant illustrates a slow-onset crisis, where management of risk isgradually eroded in a context of regularly repeated shocks (for instance, chronic poverty andthe run-down of assets in response of small but cumulatively devastating shocks). At theextreme left-hand side of the diagram we see that shocks and management ability aremutually exclusive. As we move to the right-hand side, shocks begin to erode the ability tomanage, however, the latter dominates the former. Over time, the shock increasinglyinteracts with and erodes the ability to manage, to a point when the effects of the shockoverwhelm the ability to manage. The top left-hand quadrant highlights a situation wherepublic and private actions combine to improve the ability to manage risk, despite continuedexposure to shocks (e.g. certain effective AIDS-management policies).
The bottom right-hand quadrant describes a scenario where both exposure to shock andability to manage are decreasing. This is a less intuitive scenario. An example may be a land-grab from the widow of a recently deceased man. This would be a major shock to thewoman and any children, stripping her of important productive assets and undermining herability to manage future hazards and shocks. While she may not experience substantialfuture shocks, it is possible that her ability to manage will be further undermined by discriminatory practices that alienate her from social networks, non-land assets and possible
IDS DISCUSSION PAPER 387
15

livelihood opportunities. The top right-hand quadrant is a ‘best case’ scenario – exposure toshock is reducing (e.g. by moving homes away from flood-prone areas) and ability to managerisk is increasing.
Clearly, the severity and frequency of shocks are crucial factors in determining the ability tomanage. Many different scenarios are possible, depending on the nature and severity ofhazards (a single devastating disaster such as an earthquake, a number of moderate shockssuch as a sequence of poor harvests, or a persistent process such as falling farm sizes overmany years); whether shocks are multiple and simultaneous, or individual and occasional;whether shocks are totally unexpected (such as a tsunami) or regular and predictable (suchas the annual hungry season). But vulnerability is not just a phenomenon that correspondsto shocks striking people at random, it is also socially constructed, being related to structuralrigidities and inequalities that perpetuate disadvantage, exclusion and marginalisation ofcertain groups of people in the long term. Certain types of vulnerabilities are establishedand reproduced through sociocultural norms, various forms of discrimination, and differentialaccess to political power. These factors are unlikely to present themselves as shocks, butrather as long-term declining trends in the ability to manage.
A final point to emphasise is that shocks and adverse processes often interact to reinforceeach other, so that transitory shocks can create or deepen chronic poverty. This point isillustrated in Figure 2. During a period of crisis (such as the 2001/2 food crisis in Malawi),people respond by engaging in ‘coping strategies’ such as borrowing, selling assets, rationingfood consumption, withdrawing children from school, and so on. The consequence ofadopting such ‘erosive’ coping strategies is that the household’s ability to generate futurelivelihoods is compromised, because its livelihood resources (including community support)have been compromised. When the next shock strikes, the household has fewer optionsand will again be forced to shed assets to survive. Over time, the ‘poverty ratchet’ effectthat repeated shocks have on increasingly weakened livelihoods steadily undermines theability to recover, and pushes people towards chronic poverty and destitution. This kind ofprocess may be affecting large numbers of people in rural Malawi.
Figure 2 Cumulative effect of regular shocks
1.3 Structure of this report
Chapter 2 describes several available data sources for analysing vulnerability in Malawi,notably the Integrated Household Survey (IHS-2) conducted in 2005. Chapter 3 reviews theliterature on vulnerability in Malawi, both conceptual approaches and analyses of risks and
IDS DISCUSSION PAPER 387
16

vulnerabilities of various kinds (agricultural, economic, health, demographic, political, legaland social). Chapter 4 analyses variables relating to income (expenditure) and asset vulnerability in the IHS-2 dataset, assesses household- and community-level shocks, andconstructs a ‘durable asset index’ to estimate changes in wellbeing over time. Chapter 5analyses indicators of subjective poverty and social exclusion in the IHS-2 dataset, comparesthese findings to monetary measures of poverty, and explores the relative vulnerability ofdifferent ‘vulnerable groups’ (such as orphans, or female-headed households). Chapter 6concludes and draws implications for policy.
IDS DISCUSSION PAPER 387
17

2 D ata sources for analysing vulnerability in Malaw i
2.1 Introduction
During the first phase of this study, various sources of data were reviewed for their relevance to the analysis of vulnerability to chronic poverty and malnutrition in Malawi.Among the datasets considered were the following:
l Integrated Household Surveys (IHS): IHS-1 and IHS-2l Complementary Panel Survey (CPS)l Malawi Atlas of Social Statisticsl Malawi Vulnerability Assessment Committee (MVAC)l Demographic and Health Surveys (DHS): 1992, 2000, 2004l Core Welfare Indicator Questionnaire (CWIQ).
2.2 Integrated Household Surveys (IHS)
Two ‘Integrated Household Surveys’ have been conducted in Malawi, in 1997/8 and 2004/5.These are usually referred to as IHS-1 and IHS-2.
The 1997/8 IHS was a comprehensive socioeconomic survey of living standards of householdsin all the (then) 25 districts of Malawi plus the four major urban centres. The NationalStatistical Office administered the two-part IHS questionnaire to 12,960 households over a12-month period between November 1997 and October 1998. However, after two roundsof data cleaning, the dataset shrunk to first 10,698 and then to 6,586 households (forwhom consistent consumption expenditure data, suitable for conventional poverty analysis,are available). Expansion factors (sampling weights) were derived for the 25 districts andfour urban areas, but in some districts, the number of households left after data cleaningwas ‘very small’. Nonetheless, district-level maps of the incidence and depth of poverty(headcount and poverty gap, etc.) have been produced from the IHS-1 data.
The IHS-1 questionnaire consisted of two parts, a ‘large questionnaire’, typically administeredto the respondent households in a single visit, plus a diary of expenditures kept over 14 days(either by the household head if s/he was literate, or through twice weekly visits by theenumerator). The use of the diary method in IHS-1 undermines its comparability with otherhousehold surveys conducted in Malawi – including the IHS-2 – which used the recallmethod. Indeed the use of diary methods for collecting expenditure data in poor countriesis now questioned by many survey experts.
The ‘large questionnaire’ of IHS-1 contains the following modules: household identifiers,household roster, current education of those under 25, past education of those over 25,health/morbidity, nutrition, fertility, deaths over the last 12 months, immunisation, income,employment, time use, migration, housing, assets (durables, livestock and land), credit, recallinformation on major household expenditures.
Although a number of extremely useful studies – in particular the National EconomicCouncil’s ‘Malawi Poverty Profile’ (2000) and ‘Determinants of Poverty’ (2001) – have beengenerated from the IHS-1, the quality of the enumeration and processing of questionnairesis generally regarded to be problematic in some respects.
A second IHS was conducted between March 2004 and March 2005, with a sample of11,280 households across 564 communities. Unlike IHS-1, which used a diary method, IHS-2used a 7-day recall period for collecting information on food consumption, and included a
IDS DISCUSSION PAPER 387
18

community questionnaire to collect information on infrastructure and basic services atTraditional Authority (TA) level. The data files were finalised by CSO and the World Bank,who also constructed the expenditure aggregates and poverty lines from the IHS-2. Thequality of the enumeration and processing of IHS-2 was said to constitute a ‘substantialimprovement’ over IHS-1.
There is no longitudinal element (panel) between households in IHS-1 and IHS-2, but anumber of retrospective questions (on shocks, durable assets, subjective wellbeing) areincluded in the IHS-2 questionnaire which are useful for analysing vulnerability-relatedissues. Unlike IHS-1, IHS-2 also included an anthropometric module for children under 5years old. Table 1 lists the variables in the IHS-2 household and community questionnairesthat are relevant to this study.
Table 1 IHS-2 questionnaires: relevant modules for vulnerability analysis
IDS DISCUSSION PAPER 387
19
Module Description Remarks Page
Household questionnaire:
AB Recent Shocks to Over the last 5 years, for three major shocks – 50 Household Welfare includes information on how widespread and
response
AC Deaths in Household Over the last 2 years – causes include accidents 51 and illness codes (including HIV-AIDS)
AD Child Anthropometry Measures weight and height (or length) of all 52 children aged 6–60 months. Asks about child participation in nutrition programmes
Y Social Safety Nets List of programmes from which the household 47 benefited over the last 3 years, plus the value of benefits in last year
M Durable Assets Ownership of 36 durable and productive assets, 29 with recall information on ownership over the last 5 years for 19 of the durable assets
F Security and Safety Over the last 3 years – subjective and objective 16–17on attacks and theft, including whether reportedto the police
D Health Self-reported illness over the last 2 and 4 weeks 10–12– also information on hospitalisation and its costs
AA Subjective Assessment Includes the minimum level of income to make 49of Wellbeing ends meet; adequacy of food, housing, clothing
and healthcare; 6-step ladder visualisation exercise
W Other Income Includes income from pensions 45
Community questionnaire:
CG Changes How community conditions have changed for 12–14worse or better (5-point scale) over the last 5 years; Q.50 asks about important events which made people worse off or better off over the last 5 years, useful for triangulation of module AB of the household questionnaire
CD Access to Basic Includes information on roads, bus services, 6–7 Services markets, ADMARC markets, clinics, schools,
mosques, etc.

2.3 Complementary Panel Survey (CPS)
The CPS is a longitudinal household survey conducted between January 2000 andSeptember 2002 by the International Food Policy Research Institute (IFPRI), the Centre forSocial Research (CSR) and the Poverty Monitoring System of the Government of Malawi.
The first round of the CPS was conducted in January–February 2000, drawing on a purposive sample of households that were ‘believed’ to have been surveyed in the IHS-1 of1997/8. The second round of the CPS was conducted in October–December 2000, with asample of 667 households. The third round was in July–August 2001, and surveyed 631households. The fourth round took place in August–September 2002, with a sample of 499households. Due to various problems with identifying the IHS-1 households, the theft ofround one questionnaires before they were entered and processed and problems in trackinghouseholds between rounds, just 291 households can be tracked between the IHS-1 androunds 1 to 4 of the CPS. Furthermore, seasonality and differences in the way in which datawas collected means that ‘the comparability of the CPS and IHS welfare indicators must beseriously questioned’ (Sharma et al 2002).
The CPS sample had four strata, enabling the rural Southern, rural Central and ruralNorthern regions of Malawi plus its four Urban centres to be identified separately. Giventhe sample size and level of attrition in the CPS noted above, it is unlikely that statisticsderived from it can be regarded as representative of these four regions.
The CPS has a common set of modules that appeared in all rounds. These are the household roster, education, morbidity, food security and coping strategies, labour andemployment, income, expenditures and transfers. Other modules (for example HIV/AIDS,negative economic shocks, household decision-making, pre-marriage assets, and time use,were included on an ad hoc basis to allow the investigation of additional topics of interest.
A number of useful papers have been prepared by IFPRI and the Government of Malawi,using the CPS and IHS-1 data (Government of Malawi 2000; Sharma and Yohannes 2005).
2.4 Malawi Atlas of Social Statistics
The ‘Malawi Atlas of Social Statistics’ was produced by the Government of Malawi and theInternational Food Policy Research Institute (IFPRI). The Atlas of Social Statistics providesdisaggregated data on poverty and a range of household-level demographic, economic andother variables. The data come from the 1998 Census and the 1998 IHS. Disaggregated estimatesof monetary poverty were produced by combining the Census and IHS data using small areaestimation techniques. The data are disaggregated to the Traditional Authority (TA) level.
Variables of interest include: population/sex ratio/growth rates/poverty headcount/ultra-poverty headcount. Marital status/depth/severity of poverty/orphanhood/literacy/schooling/water access and source/cooking/assets/distance/location.
2.5 Malawi Vulnerability Assessment Committee (MVAC)
Malawi’s ‘Vulnerability Assessment Committee’ (VAC) is a consortium committee of government, NGO and UN agencies that is chaired by the Ministry of Economic Planningand Development (formerly the National Economic Council). The MVAC has developed aseries of livelihood profiles that describe how households obtain their primary food requirements: these are called ‘baseline studies’, and they depict the sources of food andincome, as well as the expenditure patterns that households employ to survive. If thesebaselines are combined with monitoring information that describes changes in the differentvariables then it is possible to translate the changes into food equivalents. This means thatwe are able to observe how changes in food access occur as a result of changes in livelihoods, such as access to markets, price changes and labour markets.
IDS DISCUSSION PAPER 387
20

The main purpose of the MVAC is to assess and reduce vulnerability in Malawi.Methodologically, the MVAC is based on the Household Economy Approach (HEA). Thismethod of data collection is less cumbersome than a typical household multi-topic survey(such as a Living Standards Measurement Survey (LSMS) or the IHS), as it purposely collectsinformation at an aggregate level. That is, through focus groups, village-specific knowledge,key informant interviews and processes of triangulation the HEA specifies averages for themain variables of interest for clusters of groups, where within-group characteristics are relatively homogeneous (i.e. wealth categories). The data are presented in spreadsheetsaccording to wealth category (rich, middle, poor) and location (or livelihood zones). TheHEA approach is often used for monitoring vulnerability to changes in food access overtime and for predictive purposes. Models are typically constructed that introduce a shock toa livelihood system (such as the removal of a subsidy) and the implications this would havefor food access of different wealth groups are calculated.
The MVAC was set up in response to the food crisis of 2001/2. Between May and July 2003,the MVAC conducted a livelihood re-zoning exercise and an HEA baseline survey in 11 out of17 livelihood zones in Malawi. These activities form the first stage in the establishment of alivelihood information and monitoring system within the MVAC that is designed to generatea deeper understanding of rural livelihoods, food access issues and the ability of householdsfrom different wealth groups to cope with shocks and vulnerability. The baseline informationis employed as an analytical modelling tool by the MVAC (2004) for monitoring householdfood and livelihood security. It is also used to generate analysis for understanding the impactof different programming and policy on vulnerability, and food and livelihood security. TheLBVA (livelihood-based vulnerability approach) adopted by the MVAC is aimed at providingrelevant information and analysis on food access and livelihoods to different governmentministries, as well as international organisations and civil society to inform early warning,rural development strategies, poverty reduction, safety nets programming and food securitypolicy formulation.
The data comprise a large range of variables that would be useful for an analysis of povertyand vulnerability, including crop production data, consumption, livestock, income, expenditure,employment, sources of food, cash expenditure, AIDS and food security. It is also the closestavailable source of ‘dynamic’ longitudinal data in Malawi. However, it has limitations due tothe method of aggregation of households, which means that changes in food access due toshocks can only be assessed for the ‘typical’ or average household in any one wealth group.Also, assessing outcomes (food access) is derived in the sense that outcomes are simulatedaccording to assumptions about how a hazard will work through a livelihood system.
2.6 Demographic and Health Surveys (DHS)
Four ‘Demographic and Health Surveys’ (DHS) have been conducted in Malawi: in 1992,1996, 2000 and 2004. There was also a ‘DHS Ed’ survey in 2002, but this only collectedinformation on education.
The 1992 MDHS sampled 5,232 households, 4,840 women and 4,232 men. It also containeda facilities survey of 223 clinics, health stations, etc. The 1996 MDHS surveyed 2,898 households, 2,683 women and 2,658 men. The 2000 MDHS increased its sample size dramatically to 14,214 households, 13,220 women and 3,092 men. Finally, the 2004 MDHS,for which no results had been released by late 2005, sampled 15,000 households, 13,000women and 5,000 men.
DHS surveys do not collect information on incomes and expenditures, but are extremelyuseful for their comprehensive information on human development indicators, in particularmortality and malnutrition among children, and mothers’ health, education and wellbeing.Information about community characteristics, housing, and assets are also collected. DHSsurveys are useful for examining trends in wellbeing, both within and between countries,but do not contain a panel component, making the analysis of issues to do with povertydynamics and vulnerability difficult.
IDS DISCUSSION PAPER 387
21

The Macro-International website (www.measuredhs.com) has the reports for the 1992,1996 and 2000 MDHS but only an abstract for the DHS Ed Survey of 2002. The status ofthe 2004 MDHS was listed as ‘ongoing’ as of late 2005.
2.7 Core Welfare Indicator Questionnaire (CWIQ)
One CWIQ survey has been conducted in Malawi, in 2002, with technical support from the World Bank (which has conducted CWIQ surveys in 14 other African countries). Data collection occurred between September and November 2002, and a total of 9,819 households were surveyed (8,941 of which were rural and 878 urban). There were 31 sampling strata: the 27 districts plus four urban centres.
The CWIQ contains 10 modules: household roster, education, health, employment, household assets, household amenities, children under 5 years old, food security, safety andsecurity and HIV/AIDS. The CWIQ does not collect information on incomes and expenditures, but a set of pre-chosen poverty predictors (identified using the IHS-1) wereused to estimate poverty levels as per the standard CWIQ methodology. The HIV/AIDS section asks about people’s knowledge of HIV transmission and prevention, but it does notallow HIV infection rates to be estimated.
As a reflection of its acronym, the initial CWIQ survey reports (based on scanned questionnaires and pre-programmed standard tables) was produced just 1 month after thesurvey work was competed in December 2002. The main results of the CWIQ are summarised in a 139-page report by the National Statistics Office (NSO 2002).
2.8 Nutrition and food security surveillance
The Malawi Integrated Nutrition and Food Security Surveillance System produces monthly‘Data Reports’ on a number of indicators of malnutrition and food stress in sentinel sitesacross the country. Technical support is provided by ‘Action Against Hunger’, with fundingfrom the European Union. This system monitors the growth of 4,200 children in 12 districts,and assesses the food security status of their households using a short questionnaire. Thenutritional surveillance component reports on underweight children (weight-for-height) andmid upper-arm circumference (MUAC). The ‘food stress index’ combines eight indicators,including (1) households with <51kg cereals in their granary; (2) households earning <MK1,001in the last month; (3) meal frequency; (4) households reducing portions and (5) householdsgoing entire days without staple food. The questionnaire also monitors the proportion ofhouseholds looking for ganyu (casual employment).
IDS DISCUSSION PAPER 387
22

3 Review of literature on vulnerability in Malawi
3.1 Definitions and conceptual approaches
Vulnerability is defined by economists as the risk of future poverty. In Malawi’s context ofhigh baseline poverty, however, Sharma and Yohannes (2005) do not exclude the currentpoor from their definition of vulnerability as ‘the presence of a high degree of risk of slipping into deeper poverty’. They also point out that the extent of vulnerability is affectedby the depth of poverty: ’Since consequences of unexpected declines in income on welfarebecome harsher the poorer the households, vulnerability generally increases with poverty’.
Different analyses of vulnerability in Malawi adopt different conceptual and analyticalapproaches. Ellis et al (2002) consider historical and contemporary constraints to livelihooddiversification as a potential pathway out of rural poverty, and they provide a frameworkfor analysing poverty and vulnerability based on characteristics of different ‘wealth groups’such as assets owned (e.g. land, livestock), housing type, labour market participation andfood security status. TANGO (2004a) summarises the underlying causes of livelihood vulnerability and food insecurity in Malawi:
The current vulnerability in Malawi is the result of decades of exposure to macro-economic shocks, weather-induced production shortfalls, and demographic pressures.The government’s focus on national self-sufficiency has not been sustainable or appropriate in the context of rapid population growth, rising input costs and recurrentdroughts and floods. The country enjoys few employment opportunities outside ofagriculture, while market liberalisation has increased rural inequality and stratification.
Dorward and Kydd (2002) develop a framework for understanding vulnerability in Malawithat identifies interactions between structural economic weaknesses and transitory shocksor risks.
Low levels of financial and physical capital together with reliance on agriculture andnatural resources make poor rural economies and livelihoods particularly exposed andvulnerable to risks of natural shocks. These might arise from adverse weather (affectingcrop yields or damaging physical assets); human, crop or animal disease; or physicalinsecurity (as a result of crime, or political violence, or conflict). Where markets arethin and there are poor communications and high transport costs, isolated marketsare prone to large price risks when affected by local supply or demand shocks. This maybe particularly problematic for food crops with relatively inelastic demand and wherethere are large differences between local import and export parity prices.
3.2 Sources of vulnerability
Based on our own conceptual framework and a review of the literature, we subdivide thesources of vulnerability to poverty and malnutrition in Malawi into five clusters of factors: (1) agricultural, (2) economic, (3) health, (4) demographic, (5) political, legal and social v u l n e r a b i l i t i e s .
3.2.1 Vulnerability in agriculture
Over 85 per cent of the population of Malawi is rural, and 89 per cent of the labour forcewas employed in agriculture in 1998. Yet, despite employing most of the population and
IDS DISCUSSION PAPER 387
23

producing 72 per cent of Malawi’s total exports, agriculture accounts for only 36 per centof total value added to the Malawian economy, a large proportion of this coming from thecommercial estates, mainly tobacco (Wobst et al 2004). Malawi is no longer self-sufficientin maize, its staple food crop. Smallholder agriculture has consistently under-performed. Acombination of characteristics of the sub-sector raises the vulnerability of smallholderhouseholds in Malawi to both transitory shocks and chronic poverty. By common consensus,the following factors combine to cause food production to be either consistently or occasionally inadequate to meet consumption needs in many rural households:
1. Erratic rainfall: the near total dependence of rural households on rainfall for their livelihoods, both directly (for crop production) and indirectly (for ganyu employment), where rainfall is erratic and unpredictable, exposes farmers every year to the risk of drought or flooding within the growing season. Figure 3 illustrates the variability in maize production in Malawi, which is largely attributed to erratic rainfall. Although the trend in maize production is generally rising, the coefficient of variation has become greater since the early 1990s. This unpredictability of rains and harvests undermines food security and raises vulnerability. For instance, the food crisis of 2001/2 followed two bumper harvests (in 1999 and 2000) and a harvest (in 2001) thatwas actually 6 per cent above the 10-year average (Devereux and Tiba 2006).
Figure 3 Maize production in Malawi, 1990–2001 (metric tonnes)
Source: Tiba (2005)
Figure 4a shows that maize production over the past 20 years has been even morevariable at the Agricultural District (ADD) level than at aggregate (national) level. It alsoreveals that maize production is concentrated in a few districts (such as Lilongwe andKasungu), while food-insecure districts such as the Shire Valley produce much smallerharvests. Figure 4b reveals a substantial decline in production of local maize, which hasbeen compensated in recent years by corresponding increases in hybrid maize (Figure 4c)and composite maize (Figure 4d). Figure 5 illustrates this shift away from local maizetowards composite and hybrid varieties – in terms of hectarage planted to each. Thistrend could be interpreted as an encouraging indicator of agricultural intensification.
Dorward and Kydd (2002) note that risk lowers the productivity of rural economies inthree ways, by: (1) reducing returns to investment, (2) distorting investments ‘awayfrom those that maximise expected returns towards those that reduce risks‘, (3) discouraging investment altogether, because returns are low and investors are risk-averse. In this way, risk contributes to under-investment and hence to agriculturalstagnation and rural poverty in Malawi.
IDS DISCUSSION PAPER 387
24

Figure 4 Maize production in Malawi (MT) by ADD, 1984–2002
Figure 5 Maize hectarage in Malawi by variety, 1984–2002
Source: Phiri (2005b)
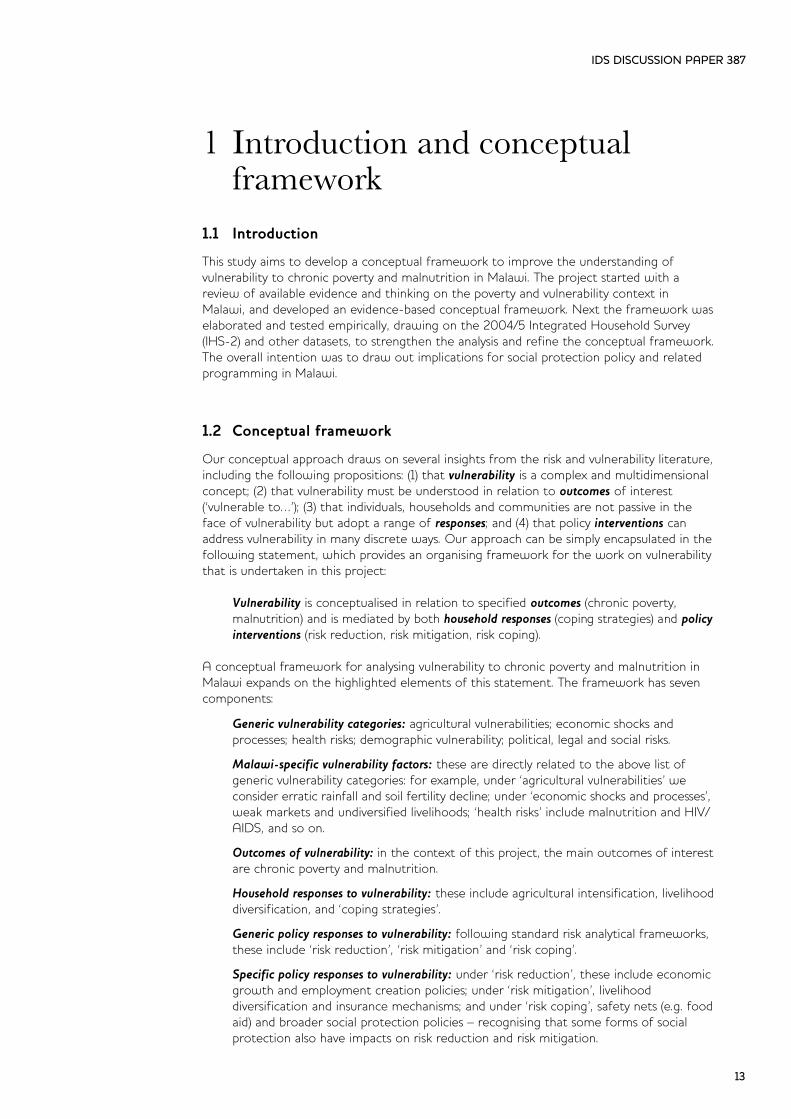
2. Land constraints: In just 20 years, between 1977 and 1998, population growth rates ofabout 2 per cent per annum resulted in a doubling of the Malawi population, with a corresponding doubling of population densities from 59 to 112 person/km2, and a halving of crop land per capita from 0.42 to 0.23 hectares (GoM 2000). Land is, however, very unequally distributed with the IHS-2 data revealing a Gini coefficient for cultivated land of 0.884 in 2004/5. This is primarily due to the presence of large estates: the land Gini falls to 0.437 when farms of less than 20 hectares are considered. Figure 6 shows this relationship graphically using Lorenz curves.
Land pressure intensifies from north to south, with median land cultivated falling from1.14 hectare/capita in the North, to 1.10 hectare/capita in the Centre and 0.823hectare/capita in the South. In 1988, 78 per cent of rural households cultivated lessthan one hectare of land; but by 2004/5, this proportion had risen to 91.4 per cent.
IDS DISCUSSION PAPER 387
25
(a) Total maize
(c) Hybrid maize (d) Composite maize
(b) Local maize7 0 0 , 0 0 0
6 0 0 , 0 0 0
5 0 0 , 0 0 0
4 0 0 , 0 0 0
3 0 0 , 0 0 0
2 0 0 , 0 0 0
1 0 0 , 0 0 0
0
3 5 0 , 0 0 0
3 0 0 , 0 0 0
2 5 0 , 0 0 0
2 0 0 , 0 0 0
1 5 0 , 0 0 0
1 0 0 , 0 0 0
5 0 , 0 0 0
0
6 0 0 , 0 0 0
5 0 0 , 0 0 0
4 0 0 , 0 0 0
3 0 0 , 0 0 0
2 0 0 , 0 0 0
1 0 0 , 0 0 0
0
7 0 , 0 0 0
6 0 , 0 0 0
5 0 , 0 0 0
4 0 , 0 0 0
3 0 , 0 0 0
2 0 , 0 0 0
1 0 , 0 0 0
0
IDS DISCUSSION PAPER 387
26
Figure 6 Lorenz curves for land in Malawi, 2004/5
Increasing land pressure is a source of vulnerability because poorer rural householdstend to cultivate less land, and because declining farm sizes have not been accompaniedby agricultural intensification, nor by diversification either within or outside agriculture.Instead, yields of staple food crops have remaining low, soil fertility has declined andcultivation of high-yielding varieties or high-value crops remains limited.
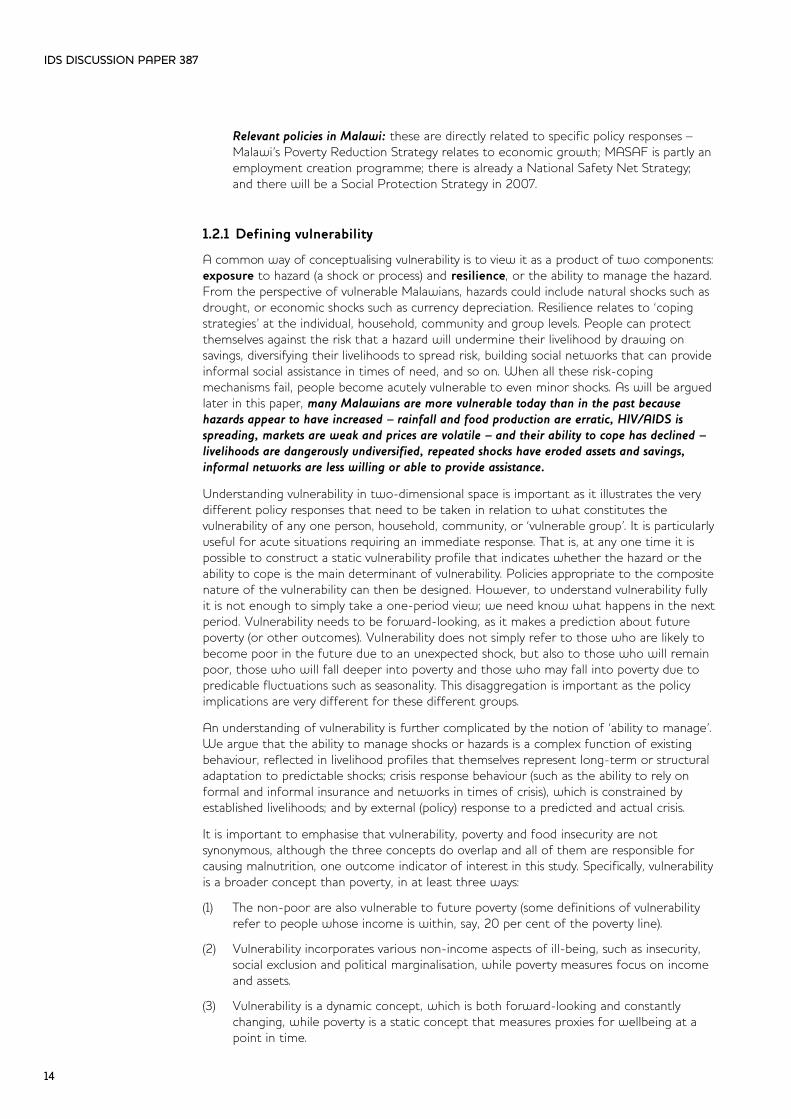
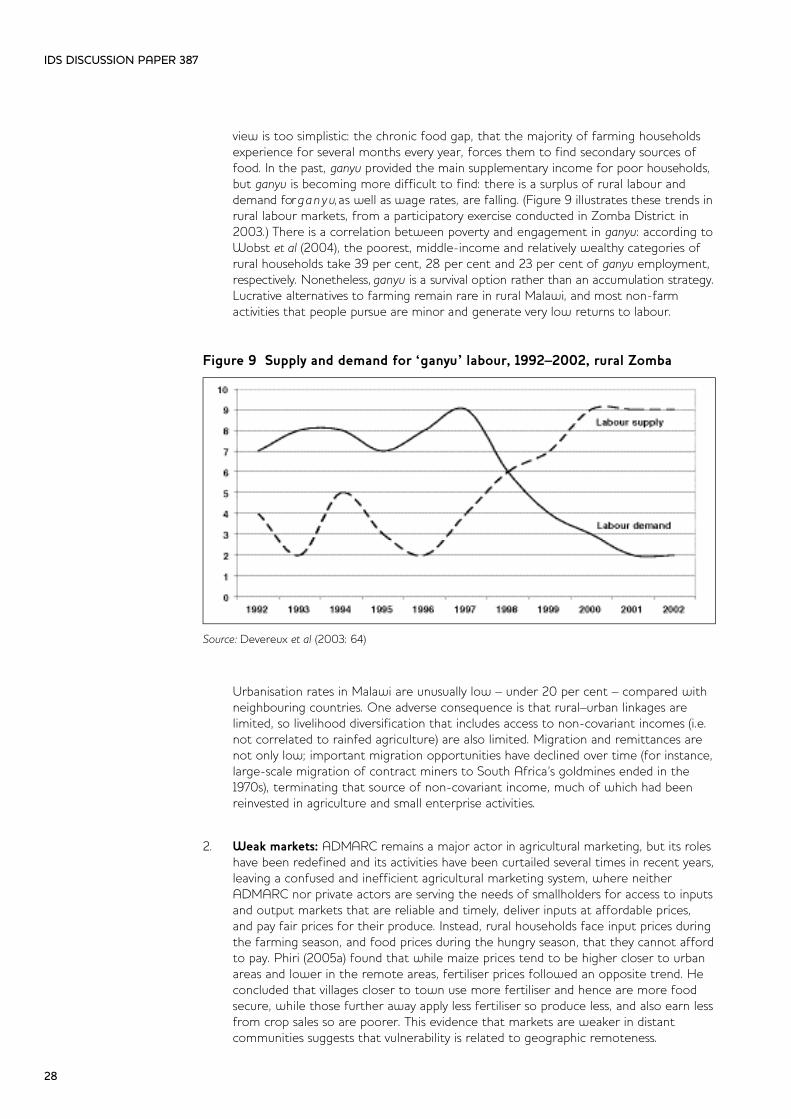
3. Lack of livestock: Uniquely in southern Africa, Malawians own very few livestock, and ‘there is a virtual absence of cattle from asset portfolios of rural households’ (Ellis et al2002). In 2000–2, Malawians owned 8.9 tropical livestock units (TLU) per capita, compared with 24.9 in Zambia, 45.1 in Zambia and 157.5 in Botswana (FAO, undated). In agricultural societies elsewhere in Africa, livestock provide draught power and manure for farming, they serve as pack animals for transporting goods to and from markets, they provide nutritious food (meat and milk), and they are a store of wealth and savings that accumulates in good times and can be drawn down in emergencies. However, in 2004/5, 43 per cent of Malawian households owned no livestock of any kind, with the remaining livestock being distributed very unequally (Figure 7). Most Malawians also own no physical or financial assets that increase in value over time.
Figure 7 Lorenz curves for livestock in Malawi, 2004/5
Cumulative Proportion of Population
Cumulative Proportion of Population

4. Constrained access to fertiliser and input credit: Since the completion of the Fertiliser Subsidy Removal Programme (FSRP) in 1995, and following the collapse of SACA (the Smallholder Agricultural Credit Association) in 1992, Malawian smallholdershave faced higher prices for fertilisers, and severely restricted access to input credit. Many farmers’ clubs that formed in order to access fertiliser and hybrid maize seed havedefaulted on their loans and disbanded (van Donge et al 2001). Costs of agricultural inputs have continued to spiral beyond the reach of most farmers following successive devaluations of the Malawian kwacha during the 1990s (notably by 62 per cent in August 1998), and further depreciations since 2000 (see Figure 8). Households that reported being badly affected by recent fertiliser price increases were found to have average consumption levels 13 per cent lower than other households (Hoddinott 2005).
Figure 8 Fertiliser price trends in Malawi, 1990–2003
Source: Phiri (2005a)
In all the major productive inputs required for sustainable agriculture – water, land, soil,livestock, fertiliser – therefore, Malawian farmers face severely constrained access. Moreover,many of the most vulnerable households are those with severe labour constraints. As aconsequence, per capita food availability declined throughout the 1980s and 1990s, mainlybecause of falling per capita maize production (Wobst et al 2004). The magnitude of thedecline in food supply was disguised in the 1990s by exaggerated cassava production figures,which appeared to offset the decline in maize output until they were exposed as grosslyinflated during the 2001/2 food crisis.
A recent literature on ‘asset thresholds’ argues that rural households need a certain minimumbundle of productive assets to make a viable living from farming. Without this minimumbundle, they will be structurally incapable of meeting their subsistence needs, and they willlack the capacity to cross the threshold from structural poverty to sustainable accumulation(Carter et al 2004). Given the severe asset constraints that many Malawian households face,and the evidence of high levels of chronic undernutrition that persist independently ofshort-term livelihood shocks, we have to conclude that large numbers of Malawian familiesare trapped in this ‘asset trap’. This situation cannot be redressed with food handouts oreven with cash transfer programmes: instead, asset-protecting and asset-building interventions are needed.
3.2.2 Economic shocks and processes
1. Undiversified livelihoods: The belief that rural Malawians derive almost all their food and income from subsistence-oriented maize production pervades the literature. This
IDS DISCUSSION PAPER 387
27
2,000
1,800
1,600
1,400
1,200
1,000
800
600
400
200
0
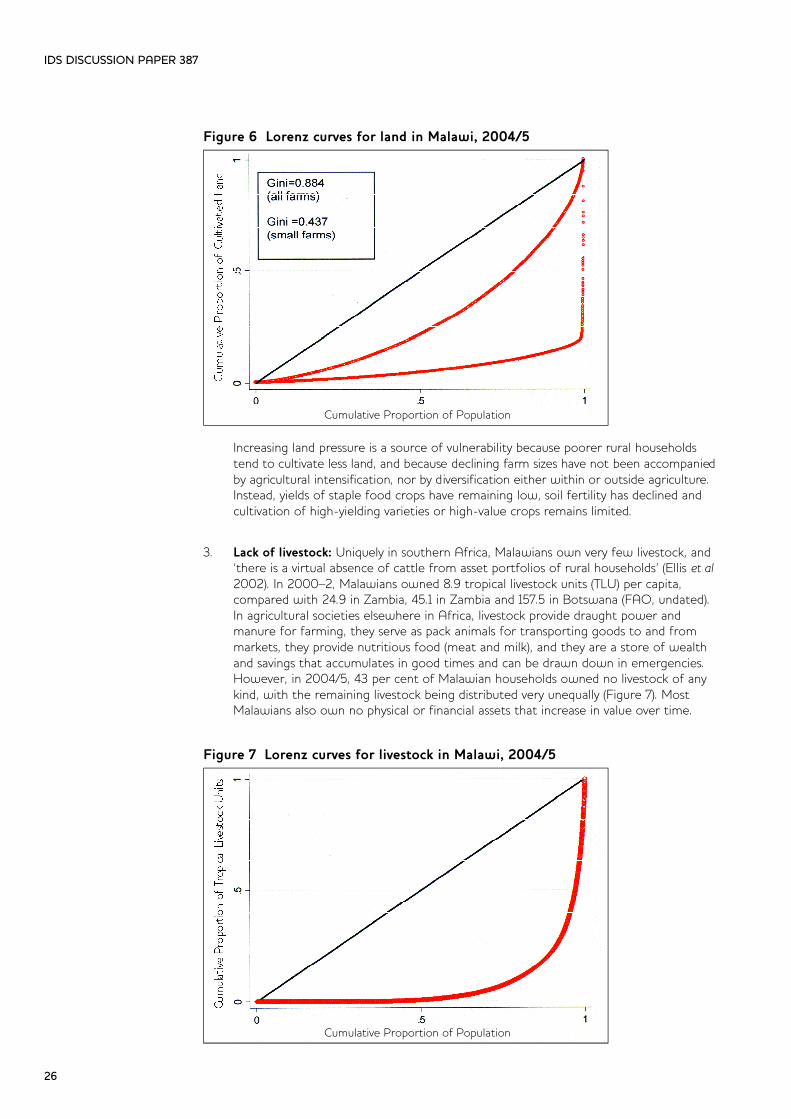
view is too simplistic: the chronic food gap, that the majority of farming households experience for several months every year, forces them to find secondary sources of food. In the past, g a n y u provided the main supplementary income for poor households, but ganyu is becoming more difficult to find: there is a surplus of rural labour and demand for g a n y u, as well as wage rates, are falling. (Figure 9 illustrates these trends inrural labour markets, from a participatory exercise conducted in Zomba District in 2003.) There is a correlation between poverty and engagement in ganyu: according toWobst et al (2004), the poorest, middle-income and relatively wealthy categories of rural households take 39 per cent, 28 per cent and 23 per cent of g a n y u employment, respectively. Nonetheless, g a n y u is a survival option rather than an accumulation strategy.Lucrative alternatives to farming remain rare in rural Malawi, and most non-farm activities that people pursue are minor and generate very low returns to labour.
Figure 9 Supply and demand for ‘ganyu’ labour, 1992–2002, rural Zomba
Source: Devereux et al (2003: 64)
Urbanisation rates in Malawi are unusually low – under 20 per cent – compared withneighbouring countries. One adverse consequence is that rural–urban linkages are limited, so livelihood diversification that includes access to non-covariant incomes (i.e.not correlated to rainfed agriculture) are also limited. Migration and remittances arenot only low; important migration opportunities have declined over time (for instance,large-scale migration of contract miners to South Africa’s goldmines ended in the1970s), terminating that source of non-covariant income, much of which had beenreinvested in agriculture and small enterprise activities.
2. Weak markets: ADMARC remains a major actor in agricultural marketing, but its roles have been redefined and its activities have been curtailed several times in recent years,leaving a confused and inefficient agricultural marketing system, where neither ADMARC nor private actors are serving the needs of smallholders for access to inputsand output markets that are reliable and timely, deliver inputs at affordable prices, and pay fair prices for their produce. Instead, rural households face input prices duringthe farming season, and food prices during the hungry season, that they cannot affordto pay. Phiri (2005a) found that while maize prices tend to be higher closer to urban areas and lower in the remote areas, fertiliser prices followed an opposite trend. He concluded that villages closer to town use more fertiliser and hence are more food secure, while those further away apply less fertiliser so produce less, and also earn lessfrom crop sales so are poorer. This evidence that markets are weaker in distant communities suggests that vulnerability is related to geographic remoteness.
IDS DISCUSSION PAPER 387
28

Dorward and Kydd (2002) explain agricultural marketing failures in Malawi in terms ofhigh transactions costs (due to low trade volumes and poor communications), andcoordination failures (because the high risk premiums and margins needed to maketrade profitable in this context depress demand), which result in ‘a low-level equilibriumtrap and market failure’. High input prices combined with food price seasonality resultin low yields and a food gap that can only be covered – because ganyu is scarce andfood prices are so high in January–March – by coping strategies that erode thehousehold’s asset base. Figure 10 graphs the evolution of food prices in Malawi beforeand during the famine of 2001/2. The failure of private trade and public interventionsto stabilise food supplies and prices is clear, and it was this particular source of vulnerability that transformed a relatively minor food production decline into a majorfood security crisis. Giving evidence to the UK’s inquiry into ‘The Humanitarian Crisis inSouthern Africa’, one expert witness (John Seaman) argued that: ‘if you had stabilizedthe price of maize in 2001 in Malawi, no crisis would have occurred’ (IDC 2003:E V 6 7 ) .
Figure 10 Average maize and cassava prices in Malawi, 2000–2 (MK/kg)
Source: Tiba (2005)
3. Interactions between transitory shocks and chronic poverty: Although the focus of this report is on chronic vulnerability rather than transitory livelihood shocks, there aresignificant interactions between the two that are important to recognise and understand.Households that are chronically poor are more vulnerable to even minor livelihood shocks, while severe or repeated shocks can force households to dispose of key productive assets to meet immediate consumption needs, leaving them incapable of maintaining a sustainable livelihood. Hoddinott (2005) demonstrates that ‘past shocks continue to affect current levels of consumption’ in Malawi – survey data reveal that households that were directly affected by the 2001/2 drought had lower consumptionlevels and lower asset holdings in 2004.
Further evidence on the long-term impacts of the 2001/2 food crisis comes from a survey conducted 1 year later. Figure 11a plots the proportion of households by region running out of own-produced maize, month by month, in the year of the food crisis. By August–October, for instance, 80 per cent of households in Central and Southern regions, but only 50 per cent of households in Northern region, had run out of harvested maize. One response to harvest failure was to sell assets to buy food. Figure 11b measures the average ‘value losses’ from durable assets and livestock sold
IDS DISCUSSION PAPER 387
29
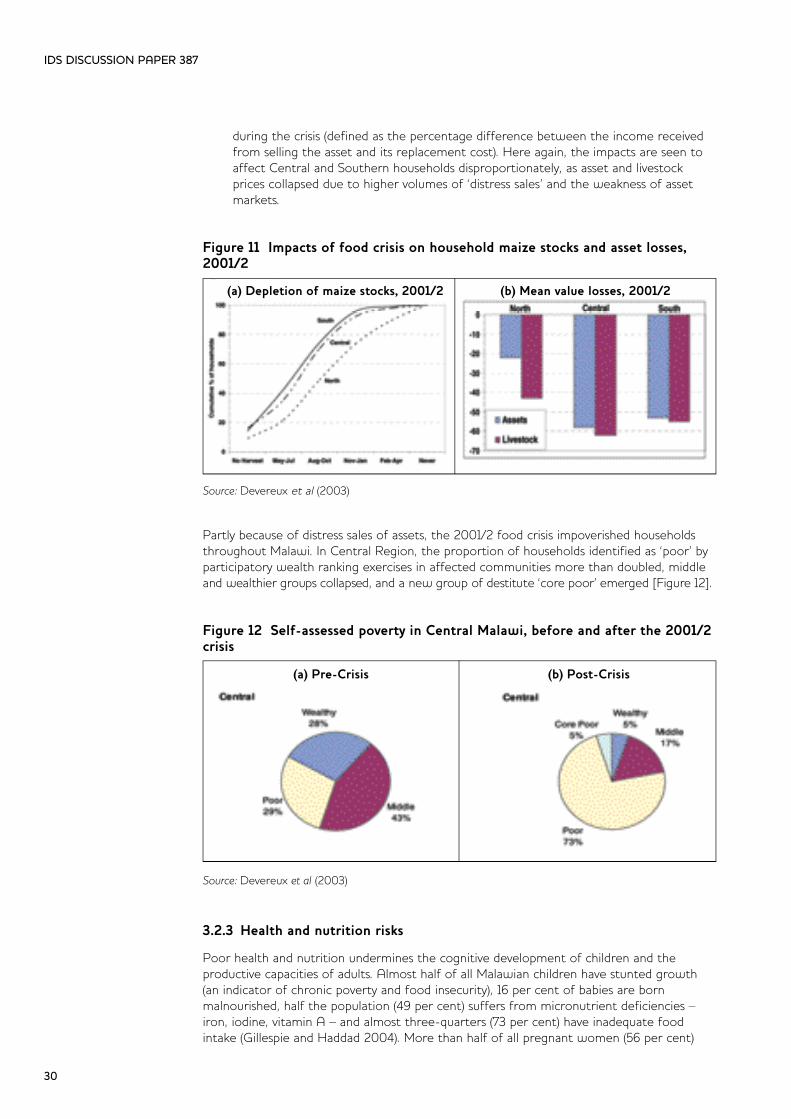
during the crisis (defined as the percentage difference between the income received from selling the asset and its replacement cost). Here again, the impacts are seen to affect Central and Southern households disproportionately, as asset and livestock prices collapsed due to higher volumes of ‘distress sales’ and the weakness of asset markets.
Figure 11 Impacts of food crisis on household maize stocks and asset losses,2001/2
Source: Devereux et al (2003)
Partly because of distress sales of assets, the 2001/2 food crisis impoverished householdsthroughout Malawi. In Central Region, the proportion of households identified as ‘poor’ byparticipatory wealth ranking exercises in affected communities more than doubled, middleand wealthier groups collapsed, and a new group of destitute ‘core poor’ emerged [Figure 12].
Figure 12 Self-assessed poverty in Central Malawi, before and after the 2001/2crisis
Source: Devereux et al (2003)
3.2.3 Health and nutrition risks
Poor health and nutrition undermines the cognitive development of children and the productive capacities of adults. Almost half of all Malawian children have stunted growth(an indicator of chronic poverty and food insecurity), 16 per cent of babies are born malnourished, half the population (49 per cent) suffers from micronutrient deficiencies –iron, iodine, vitamin A – and almost three-quarters (73 per cent) have inadequate foodintake (Gillespie and Haddad 2004). More than half of all pregnant women (56 per cent)
IDS DISCUSSION PAPER 387
30
(a) Depletion of maize stocks, 2001/2
(a) Pre-Crisis (b) Post-Crisis
(b) Mean value losses, 2001/2

are anaemic. ‘Diseases of poverty’ such as diarrhoea, acute respiratory infections, choleraand malaria are endemic in Malawi. Many of these health risks interact with each other:inadequate intake of calories, protein, fat and micronutrients lowers the body’s immunesystem and raises susceptibility to water-borne and other diseases, including HIV. Episodesof illness in turn are associated with appetite loss, vomiting and poor nutrient utilisation,which exacerbates malnutrition and perpetuates the cycle. Poor quality and outreach ofhealth services, limited availability of drugs, under-provision of reproductive healthcare, limited access to potable water, and a virtual absence of public health and sanitation facilitiesin most rural communities amount to a wholly inadequate set of public interventions toaddress these health risks and break these vicious cycles.
Table 2 Access to health services and drinking water in Malawi (% of households)
Source: NSO (2002) Malawi Core Welfare Indicators Survey
According to successive rounds of Demographic and Health Surveys (DHS), there has beenno significant improvement in the nutritional status of Malawian children for at least thelast 15 years. Almost half (47.8 per cent) of 8,520 children measured in the 2004 DHS werestunted (low height-for-age) – ‘virtually identical’ to the level of stunting recorded in 1992and in 2000. Levels of wasting were much lower – just 5 per cent in 2004 – which meansthat chronic malnutrition is much more of a problem among Malawian children than transitory or acute malnutrition [Figure 13a]. Stunting is higher in rural than urban areas,and in Central and Southern Regions than in Northern Malawi. DHS data also find a strongassociation between stunted children and mother’s education level, with the incidence ofstunting falling significantly after 4 years of education – the minimum required to achievebasic literacy [Figure 13b]. This is consistent with findings from elsewhere that maternaleducation is positively associated with improvements in children’s wellbeing.
Figure 13 Child malnutrition in Malawi, 2004
IDS DISCUSSION PAPER 387
31
Indicator North Centre SouthTime to nearest health centre
<15 min 6.5 9.0 8.815–29 min 10.6 10.7 9.330–44 min 11.6 13.4 11.945–59 min 7.2 10.4 11.560+ min 64.1 56.5 58.6
Main source of drinking waterCommunal pipe, borehole 61.7 51.0 67.6Unprotected, rainwater 13.7 35.3 17.7Spring, lake, river, pond 18.4 7.4 8.3Piped water, protected well 6.2 6.2 6.3
(a) Child malnutrition rates (b) Stunted children
Source: Macro-International (2004)

Given the importance of education, not only for child wellbeing but also to diversify livelihood options away from agriculture, there are some encouraging trends. Since theintroduction of free primary education in 1994, the proportion of Malawians who havenever attended school has halved, from 34 per cent in 1992 to 17.5 per cent in 2004.However, this progress is gendered: twice as many women (23 per cent) as men (12 percent) have never attended school [Figure 14a]. Men are also much more likely than womento have reached secondary school (26 per cent against 16 per cent) [Figure 14b].
Figure 14 Education in Malawi, by gender
Source: Macro-International (1992, 2000, 2004)
On many indicators of vulnerability and illbeing, including prevalence of stunting, theNorthern Region appears to be better off than the Central and Southern Regions. TheCentral Region is paradoxical: sometimes better off than other regions but on other indicators worst off. In general, though, several indicators display evidence for a ‘north-to-south gradient’ of falling wellbeing. Figure 15a presents Action Against Hunger’s ‘foodstress index’ for 12 districts, ordered from north to south, from May/June 2004. Figure 15bpresents the proportion of underweight children for 16 districts from Action AgainstHunger’s nutritional surveillance bulletins from January to April 2005, again ordered fromnorth to south. For both indicators, a clear increase in food stress and of underweight children can be seen. Though this pattern is not monotonic – there are anomalous districts– it provides further evidence that vulnerability to food insecurity and malnutrition are higher in Southern than Northern Malawi.
Figure 15 ‘North-to-south gradients’ in food stress and malnutrition in Malawi
Source: Action Against Hunger (2004/5)
Encouragingly, infant mortality rates (IMR) and child mortality rates (under-5s – ‘U5MR’) arefalling in Malawi. Until the 1990s, these declines were gradual, but in the last decade therate of improvement has accelerated, and is projected to continue to do so [Figure 16]. It isnot clear what is driving this rapid improvement, which according to the 2004 MalawiDHS, ‘has also been observed in neighbouring countries’.
IDS DISCUSSION PAPER 387
32
(a) Never attended school (b) Educational attainment
(a) Food stress index (b) Underweight children

Figure 16 Infant and child mortality rates in Malawi, 1955–2015
Source: World Health Chart (WHO 2001) and Macro-International (2000)
In recent years, HIV and AIDS has reached pandemic proportions in Malawi, where an estimated 15 per cent of Malawian adults aged 15–49 are now HIV-positive and mortalitydue to HIV and AIDS increased by 75 per cent during the 1990s. ‘Malawi has already lostmore than 5 per cent of its farm labour force due to HIV/AIDS and is projected to lose anadditional 15 per cent by 2020’ (TANGO 2004a). HIV/AIDS is not only a human tragedy; it isresponsible for widespread impoverishment among affected families. The main mechanismsinclude: loss of household labour and skills; diversion of adult labour time and withdrawal ofchildren from school to care for the sick and dying; depletion of savings and sale of assetsto pay for treatment, care and funeral costs. Households with chronically ill members(especially adults), are more vulnerable because their income-earning potential is lower andtheir costs are higher, than before the illness. One recent study in Malawi estimated ‘anincome loss of approximately 60 per cent among PLWHAs who were running businessesdue to reduced operations, frequent closures and capital diversion’ (Palamuleni et al 2003).
3.2.4 Demographic vulnerability
Increasing numbers of households in Malawi are headed by women, children, or the elderly(who are often left caring for orphaned grandchildren), and most of these households facelabour constraints that undermine their ability to sustain a viable independent livelihood(Kadzandira 2002). It is generally accepted that these households are more vulnerable thanothers, both to chronic poverty and to transitory shocks. These households share a commoncharacteristic, in that they are either structurally labour-constrained, or their labour capacityhas been undermined by chronic health problems, such as HIV/AIDS affecting adult household members. The process of becoming a female-, elderly- or child-headed household is often in itself a ‘poverty ratchet’, as the loss of adult male labour is especiallydetrimental to the household’s capacity to farm and engage in ganyu or manual labour. Arecent study found that the death of a spouse in a Malawian household severely reducesconsumption levels, by as much as 27–45 per cent (Hoddinott 2005).
Total fertility rates (TFR) in Malawi are extremely high: the average rural Malawian womanwill have six children in her lifetime. This produces high dependency ratios, which placesmore stress on income-earners (and more orphans if the adults succumb to AIDS). Urbanfertility rates are lower than rural fertility rates, and urban households are generally betteroff and less vulnerable than rural households. The trend is towards lower TFR over time –down from 7.6 in 1984 to 6.0 in 2004 – which is arguably a positive trend, as smallerhouseholds tend to be better off by various indicators.
IDS DISCUSSION PAPER 387
33

There are a number of reasons why vulnerability in Malawi is significantly gendered innature. A recent review of ‘Gender Exploitation in Malawi’ summarised many of these reasons (Box 1).
Box 1 Gendered vulnerabilities in Malawi
Source: TANGO (2004c)
3.2.5 Political and social vulnerabilities
Poverty is differentially distributed across regions, with the lowest incidence in CentralMalawi (44.2 per cent) and the highest in Southern Malawi (59.7 per cent). Although theCentral Region has the lowest poverty rate, it also has the widest gap between male- andfemale-headed households (42.2 per cent vs. 53.4 per cent), while the Northern Regionshows the narrowest difference (53.8 per cent vs. 55.4 per cent) [Table 3]. One explanationcould be the impact of regionally differentiated marriage systems and settlement patterns.It might be hypothesised that the patrilineal marriage system in the north leads to moreequitable distribution of resources, particularly land.
In the north, even after the death of a husband, the widow is expected to remain in herhusband’s village. Until recently, widows were ‘inherited’ by a brother or cousin of thedeceased, and the dowry that is paid in the north links women strongly to her husband’sfamily. Widows therefore continue to cultivate the same land as when the husband wasalive. Conversely, Southern Malawi is largely matrilineal (Chikamwini). Husbands settle in thewife’s village; land is acquired through the wife; and after divorce or death of the husband;the wife also continues to cultivate the same piece of land. However, population pressureis highest in the South (146 persons per square kilometre in 1998, compared with 46 persons in the North), so partition of land leads to smaller farms and (other things beingequal) to higher poverty levels.
Lastly, the Central Region has a more mixed marriage system. Chikamwini is practised, as inthe South, but Chitengwa is increasingly common. In this system, the husband requests permission from the wife’s parents to take her to his home, after paying a small token.
IDS DISCUSSION PAPER 387
34
1. Women comprise 70 per cent of the agricultural labour force, but they are less likely to engage in cash crop production due to labour and time constraints.
2. The value of assets owned by male-headed households is double that of female-headed households and male-headed households are more likely to own productiveagricultural assets.
3. Women’s rates of pay for ganyu is likely to be only two-thirds the rate paid to men.
4. Women face more difficulties in accessing credit, as they do not possess assets for collateral.
5. In 1998, 44 per cent of women were literate compared with 72 per cent of men.6. Only 43 per cent of births are attended by health workers.7. As household assets are depleted women are more likely to engage in sexual
transactions to meet household subsistence needs.8. Women and girls typically take on the burden of caring for sick family members.9. Young girls are more likely to be withdrawn from school to care for younger
siblings or the sick, and to assist with domestic and agricultural work, following a livelihood shock to the household.
10. Female-headed households are more dependent than male-headed households on external support for their subsistence – gifts of food from relatives, food aid and public works programmes.
11. Women are rarely represented on the council of elders, and so are unable to influence decisions over access to land, inheritance rights, and so on.
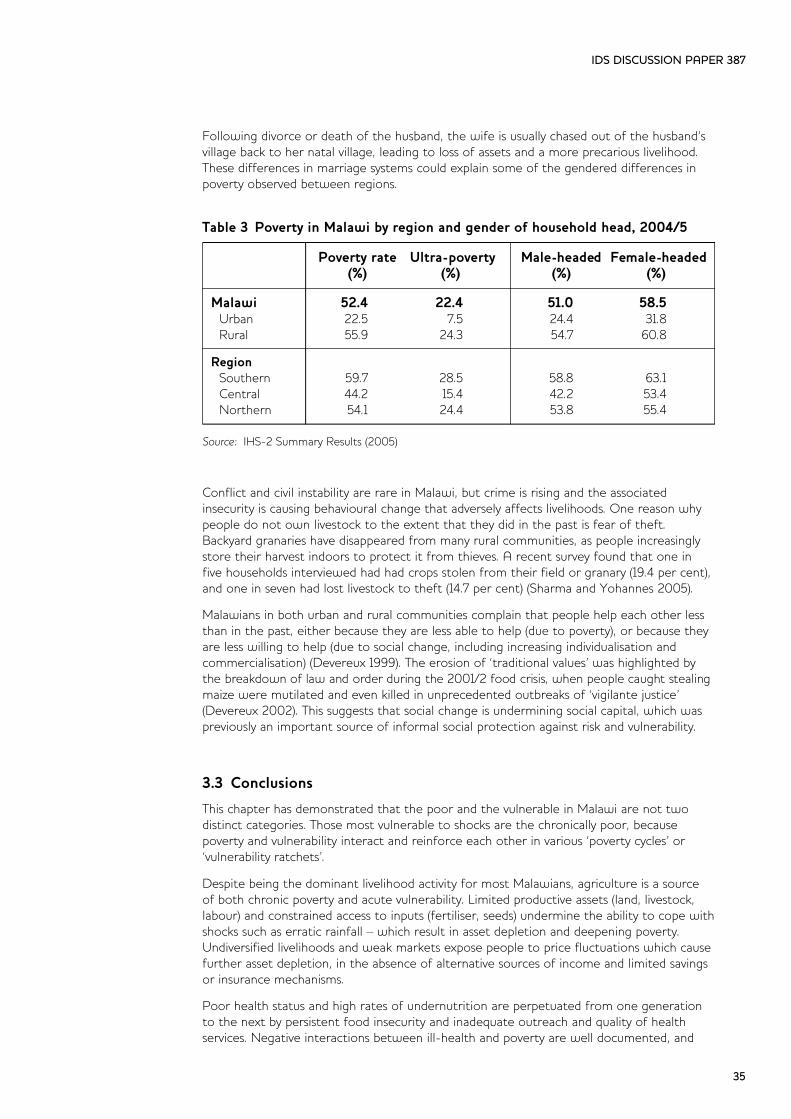
Following divorce or death of the husband, the wife is usually chased out of the husband’svillage back to her natal village, leading to loss of assets and a more precarious livelihood.These differences in marriage systems could explain some of the gendered differences inpoverty observed between regions.
Table 3 Poverty in Malawi by region and gender of household head, 2004/5
Source: IHS-2 Summary Results (2005)
Conflict and civil instability are rare in Malawi, but crime is rising and the associated insecurity is causing behavioural change that adversely affects livelihoods. One reason whypeople do not own livestock to the extent that they did in the past is fear of theft.Backyard granaries have disappeared from many rural communities, as people increasinglystore their harvest indoors to protect it from thieves. A recent survey found that one infive households interviewed had had crops stolen from their field or granary (19.4 per cent),and one in seven had lost livestock to theft (14.7 per cent) (Sharma and Yohannes 2005).
Malawians in both urban and rural communities complain that people help each other lessthan in the past, either because they are less able to help (due to poverty), or because theyare less willing to help (due to social change, including increasing individualisation and commercialisation) (Devereux 1999). The erosion of ‘traditional values’ was highlighted bythe breakdown of law and order during the 2001/2 food crisis, when people caught stealingmaize were mutilated and even killed in unprecedented outbreaks of ‘vigilante justice’(Devereux 2002). This suggests that social change is undermining social capital, which waspreviously an important source of informal social protection against risk and vulnerability.
3.3 Conclusions
This chapter has demonstrated that the poor and the vulnerable in Malawi are not two distinct categories. Those most vulnerable to shocks are the chronically poor, becausepoverty and vulnerability interact and reinforce each other in various ‘poverty cycles’ or ‘vulnerability ratchets’.
Despite being the dominant livelihood activity for most Malawians, agriculture is a sourceof both chronic poverty and acute vulnerability. Limited productive assets (land, livestock,labour) and constrained access to inputs (fertiliser, seeds) undermine the ability to cope withshocks such as erratic rainfall – which result in asset depletion and deepening poverty.Undiversified livelihoods and weak markets expose people to price fluctuations which causefurther asset depletion, in the absence of alternative sources of income and limited savingsor insurance mechanisms.
Poor health status and high rates of undernutrition are perpetuated from one generationto the next by persistent food insecurity and inadequate outreach and quality of healthservices. Negative interactions between ill-health and poverty are well documented, and
IDS DISCUSSION PAPER 387
35
Poverty rate Ultra-poverty Male-headed Female-headed(%) (%) (%) (%)
Malawi 52.4 22.4 51.0 58.5Urban 22.5 7.5 24.4 31.8Rural 55.9 24.3 54.7 60.8
RegionSouthern 59.7 28.5 58.8 63.1Central 44.2 15.4 42.2 53.4Northern 54.1 24.4 53.8 55.4

are apparent from evidence of higher levels of malnutrition, food insecurity and monetarypoverty in Southern Malawi than Northern Malawi. HIV/AIDS is a major vulnerability factorin both senses: raising the burden of illness and the costs of care in affected households,while also undermining household assets and income-earning capacity. The impacts of ill-health and poverty are significantly gendered, with women and female-headed householdsbeing more severely affected.
Finally, rising crime also impacts negatively on both poverty and vulnerability. Fear of theftpartly explains why people now keep fewer livestock, and the breakdown of law and orderduring the food crisis of 2002 may be symptomatic of a longer-term erosion of communitysolidarity, either because of rising (perceived, relative or actual) poverty and inequality, orbecause of changing social values.
IDS DISCUSSION PAPER 387
36

IDS DISCUSSION PAPER 387
37
4 Vulnerability in the Malawi IHS-2data
4.1 Introduction
Economists often view vulnerability as vulnerability to monetary poverty (Pritchett et al 2 0 0 0 ;Chaudhuri et al 2001). Since a large proportion of the population is often ‘just above’ thepoverty line, this implies that many more people are vulnerable to poverty than are currentlypoor. The IHS-2 data can be used to ascertain whether this is also the case for Malawi.
Using the poverty line established by the Central Statistics Office and World Bank ofMK16,165 per person per year, the number of people with per capita expenditure below thepoverty line (the poverty headcount) is estimated to be 52.4 per cent. However, as shown inTable 4 below, if the poverty line was raised by 10 per cent, the poverty headcount wouldrise to 58.4 per cent, while if it were to fall by 10 per cent, poverty would fall to 45.5 percent. Thus approximately one-eighth of the population is living within 10 per cent of thepoverty line. Similarly, if the poverty line were to be increased/decreased by 20 per cent,the poverty headcount would rise/fall to 63.8 per cent and 37.6 per cent. So just over one-quarter of the population would be living within 20 per cent of the poverty line.
Table 4 The poverty headcount with alternative poverty lines
Source: IHS-2, IHS2_pov; SE, standard error
Figure 17 provides a pictorial representation of why such vulnerability to monetary povertyoccurs, using a histogram of expenditures. The bars in Figure 17 show the proportion of thepopulation that falls into each of 50 ranges, while the two vertical lines show the food (orultra-) poverty line and (total-) poverty line of the CSO-WB. As is common with Cost ofBasic Need type poverty lines, the mode of the distribution is very close to the poverty line –in this case the ultra-poverty line.1 Some 22.4 per cent of the population have per capitaexpenditures below the ultra-poverty line, compared with 52.4 per cent for the total povertyline (which also includes a modest allowance for non-food expenditures). The closeness of the poverty line to the mode of the expenditure distribution is both good and bad news. It is good news because it indicates that a relatively small increase in mean per capita expenditures will move large numbers of poor households over the poverty line. But it is alsobad news, since it would only take a relatively small reduction in expenditures for those currently just above the poverty line to fall back into poverty again.
The next section uses the IHS-2 data to examine the type of shocks that might push non-poorindividuals and households back into poverty, while the following section uses the IHS’s currentand retrospective asset data to estimate the changes in welfare that were due to such shocks.
1 The ultra-poverty line established for IHS-2 is MK 10,020 per person per year.
Poverty Estimate SE Design line (%) (%) effect
z-20 37.6 1.0 4.45z-10 45.5 1.0 4.46
z 52.4 1.0 4.48z+10 58.4 1.0 4.37z+20 63.8 0.9 4.34
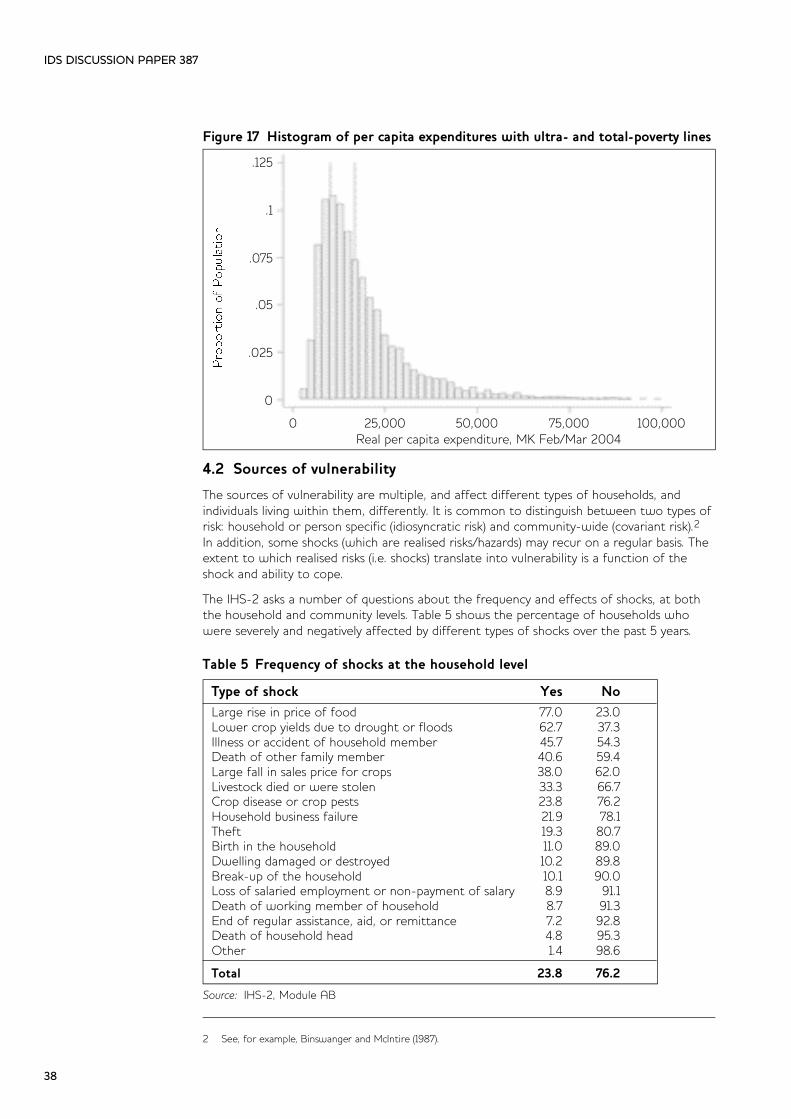
Figure 17 Histogram of per capita expenditures with ultra- and total-poverty lines
4.2 Sources of vulnerability
The sources of vulnerability are multiple, and affect different types of households, and individuals living within them, differently. It is common to distinguish between two types ofrisk: household or person specific (idiosyncratic risk) and community-wide (covariant risk).2In addition, some shocks (which are realised risks/hazards) may recur on a regular basis. Theextent to which realised risks (i.e. shocks) translate into vulnerability is a function of theshock and ability to cope.
The IHS-2 asks a number of questions about the frequency and effects of shocks, at boththe household and community levels. Table 5 shows the percentage of households whowere severely and negatively affected by different types of shocks over the past 5 years.
Table 5 Frequency of shocks at the household level
IDS DISCUSSION PAPER 387
38
.125
.1
.075
.05
.025
0
0 25,000 50,000 75,000 100,000Real per capita expenditure, MK Feb/Mar 2004
2 See, for example, Binswanger and McIntire (1987).
Type of shock Yes NoLarge rise in price of food 77.0 23.0Lower crop yields due to drought or floods 62.7 37.3Illness or accident of household member 45.7 54.3Death of other family member 40.6 59.4Large fall in sales price for crops 38.0 62.0Livestock died or were stolen 33.3 66.7Crop disease or crop pests 23.8 76.2Household business failure 21.9 78.1Theft 19.3 80.7Birth in the household 11.0 89.0Dwelling damaged or destroyed 10.2 89.8Break-up of the household 10.1 90.0Loss of salaried employment or non-payment of salary 8.9 91.1Death of working member of household 8.7 91.3End of regular assistance, aid, or remittance 7.2 92.8Death of household head 4.8 95.3Other 1.4 98.6
Total 23.8 76.2
Source: IHS-2, Module AB

Over three-quarters of all households stated they were affected by large rises in the priceof food. Nearly two-thirds of households experienced lower crop yields due to drought orfloods, while just under two-fifths (38 per cent) experienced large falls in the sales price fortheir crops. Just under a quarter of households experienced crop diseases or crop pests. Asconfirmed in Table 6, these shocks were covariant or community-wide, as they impactedmost or all households in the community.
Table 6 Impact of household-level shocks in Malawi
Source: IHS-2, Module AB
In contrast, negative shocks such as illness, accidents and deaths of family members, thefailure of household business, loss of wage employment, and theft tend to be idiosyncratic,in that they affect either only the household or a few other households too. Of theseshocks, illness, accidents and deaths of family members are most common, affecting 40–45per cent of households. In only 9 per cent of cases, however, is the death of a workinghousehold member involved. A third of households experienced the death or theft of livestock in the last 5 years, but the lack of covariance of these shocks suggests that epidemic livestock disease and cattle rustling are relatively rare. Just under one-fifth of allhouseholds experienced some other type of theft, while over one-fifth experienced a business failure.
Other types of ‘shocks’, such as the birth of a child, destruction of housing, break-up of thehousehold, and loss of regular assistance, affected around 10 per cent of households. It isimportant to note that some of these events, such as the birth of a child or death of thehousehold head, may not strictly be ‘shocks’, as they may be anticipated.
The IHS-2 community questionnaire also asked focus groups (of at least five people each)about their community’s experience of shocks over the last 5 years. Allowing for some differences in coding, a similar ranking of shocks is revealed in Table 7. Sharp increases inprices (whether of inputs or food) affected 25 per cent of communities, followed by drought.Furthermore, drought is shown to occur more frequently (22 per cent) than floods (5 percent). Human epidemic diseases and loss of key social services affected 13 per cent and 7
IDS DISCUSSION PAPER 387
39
Who did the shock affect: (%)
Own Some Most All Type of shock HH other HHs in HHs in
only HHs comm- comm-too unity unity
Large rise in price of food 3.2 9.1 41.4 46.3Lower crop yields due to drought or floods 3.0 18.2 46.5 32.3Rise in farm inputs prices 16.6 14.7 37.4 31.4Crop disease or crop pests 7.9 35.1 37.1 19.9Household business failed 80.0 10.3 4.7 5.1Loss of salaried employment or non-payment of salary 73.2 19.0 5.2 2.6End of regular assistance, aid, or remittances 67.6 19.1 10.8 2.5Livestock died or were stolen 54.6 30.5 13.4 1.5Illness or accident of household member 77.9 19.5 1.3 1.3Theft 77.7 17.8 3.4 1.1Death of working member of household 37.6 60.6 1.4 0.4Dwelling damaged or destroyed 78.9 17.2 3.5 0.4Death of household head 53.2 45.2 1.4 0.2Break-up of the household 89.5 9.2 1.2 0.1Birth in the household 93.8 5.7 0.5 0.0
Total 31.0 22.8 25.0 21.3

per cent of communities, respectively. Where these figures differ from the shocks modulein the household questionnaire is that a much lower percentage of communities thanhouseholds say they experienced shocks, though with relatively higher percentages of thepopulation affected. This suggests that a more stringent criterion for identifying shocks mayhave been applied by the focus groups than by households.
Table 7 Frequency and impact of community-wide shocks
Source: IHS-2, Community Questionnaire
IHS-2 households stated that responses to the occurrence of a shock are fairly uniform. Atotal of 35 per cent of households stated that they ‘did not do anything’ in response to theshocks; 20 per cent worked more; 11 per cent spent their cash savings; 9 per cent reducedtheir food consumption and 6 per cent sold livestock. Other less common responses toshocks included consuming less preferred but cheaper foods, borrowing money from relatives or moneylenders, reducing non-food expenditures, and prayer.
4.3 Estimating changes in welfare over time
Analysing vulnerability using the IHS data is problematic as the IHS-1 and IHS-2 do nottrack the same households over time (i.e. they do not have a panel component).Furthermore, there is a lack of comparability in some of questions included in the IHS-1 andIHS-2 questionnaires (especially the expenditure module). Fortunately, the IHS-2 included anumber of questions that asked about changes in household circumstances in the recentpast, which allows changes in welfare for the same households to be estimated.
In this section, we use the information on durable asset ownership to construct a welfareindex for both 2004 and 2005. After showing that the 2005 asset index is well correlatedwith real household expenditures in that year, we use the asset index to assess changes inhousehold welfare over the last year.
To construct the asset index, we followed the approach used by the Demographic andHealth Surveys (Rutstein and Johnson 2004), which is itself modelled on Filmer andPritchett’s (1998) work in India. The DHS uses 13–15 variables on ownership of durableassets, vehicles, land and housing to construct its wealth index. Unfortunately, the IHS-2does not contain retrospective information on housing or land ownership, so we arerestricted to the variables on durable assets (which includes vehicles). Unlike the DHS, however, the IHS-2 did collect information on the ownership of 19 types of durable assetsin both 2004 and 2005 and during the preceding 5 years.
IDS DISCUSSION PAPER 387
40
Percent ofType of shock Number of Percent of population
communities communities affected
Sharp increase in prices 451 25.0 94.2Drought 392 21.7 92.5Other negative shock 358 19.8 81.6Human epidemic disease 238 13.2 60.9Loss of key social services 124 6.9 83.2Flood 85 4.7 75.4Mass job lay-offs 78 4.3 57.8Livestock disease 43 2.4 69.5Crop disease/pests 38 2.1 85.1
Total 1,807 100.0

For each of these variables, we first created indicator variables for each of the durableassets in Module M of the IHS-2, for which we have information in both 2004/5 and duringthe preceding 5 years. Examination of the recall questions on asset ownership shows that itbecomes relatively unreliable after 1 or 2 years have elapsed, so we restrict our attention tothe changes in asset ownership over the last year.3 As shown in Table 8, mean levels ofasset ownership are very similar – and in some case identical – across the 2 years.
Table 8 Changes in ownership of durable assets
Source: Based on IHS-2, Module M
For each of these durable assets, we first created indicator variables from Module M in theIHS-2, showing whether the household owned one or more of the asset in both 2004/05and 2003/4. Five types of assets (air conditioners, washing machines, motorcycles, mini-buses and lorries) were owned by less than 1 per cent of all households, and so wereexcluded from the subsequent analysis. The data on the remaining 14 durable assets ownership for the 2 years was pooled, and principal components analysis was applied toestimate an index that explains the variance in asset holdings. The first three principal components explain almost half (48.7 per cent), and the first principal component just overa quarter (26.2 per cent), of the total variation in asset holdings.
Accordingly, we constructed a durable asset index using the first principal component asthe weights, as shown in column 4 of Table 8. Multiplying the indicators variables foreach household and durable asset by these weights and scaling produces an asset indexwith a mean close to zero and a standard deviation of one. The asset index has a correlation of 0.747 with real household expenditures for 2005/4, and a similarly (left)skewed distribution.
IDS DISCUSSION PAPER 387
41
3 This is also the same period over which subjective changes in household wellbeing was assessed in IHS-2.
Level of ownership Type of durable asset (% of households) Weight
2004/5 2003/4
Mortar/pestle (mtondo) 48.8 48.7 0.040Bed 30.1 29.9 0.150Table 34.3 34.2 0.141Chair 43.0 42.7 0.130Fan 2.3 2.3 0.188Air conditioner 0.2 0.3 –Radio (wireless) 54.5 54.1 0.045Tape or CD player, HiFi 15.9 15.8 0.146Television and VCR 3.7 3.7 0.197Sewing machine 2.8 2.8 0.091Kerosene/paraffin stove 2.2 2.2 0.104Electric or gas stove 2.5 2.4 0.182Refrigerator 2.0 1.9 0.195Washing machine 0.2 0.2 –Bicycle 36.1 36.1 0.058Motorcycle/ scooter 0.4 0.4 –Car 1.3 1.3 0.141Mini-bus 0.2 0.2 –Lorry 0.2 0.2 –
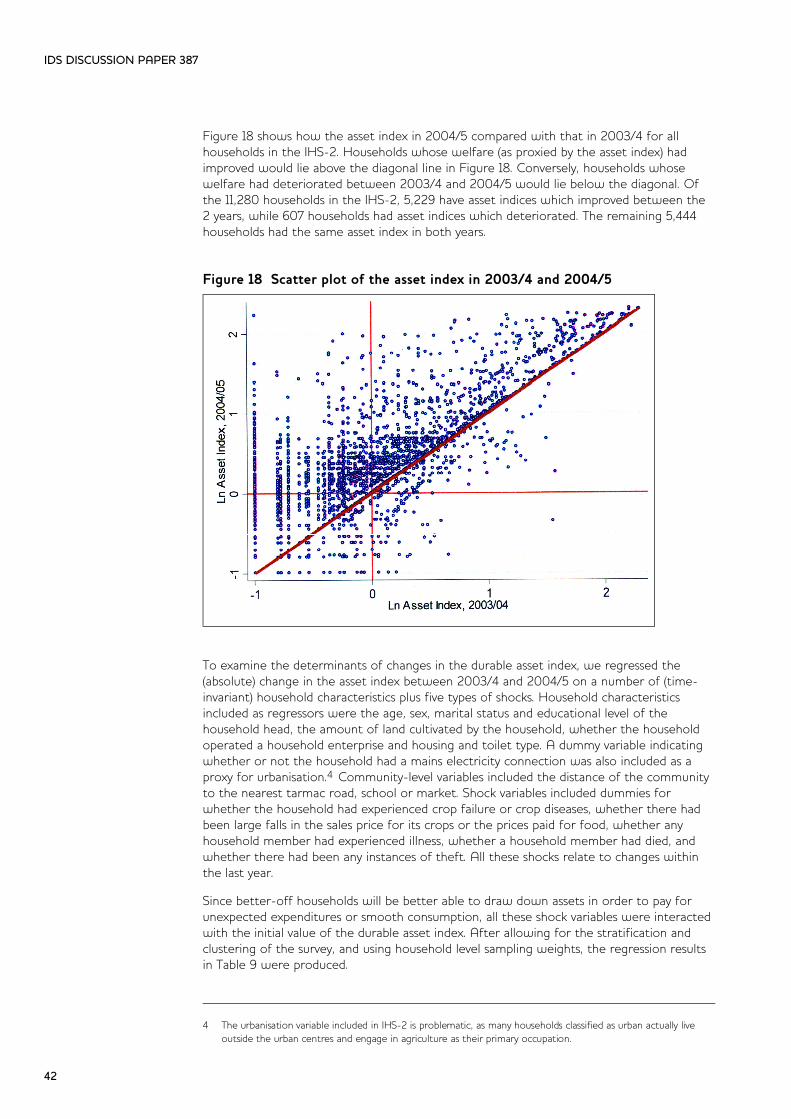
Figure 18 shows how the asset index in 2004/5 compared with that in 2003/4 for allhouseholds in the IHS-2. Households whose welfare (as proxied by the asset index) hadimproved would lie above the diagonal line in Figure 18. Conversely, households whose welfare had deteriorated between 2003/4 and 2004/5 would lie below the diagonal. Ofthe 11,280 households in the IHS-2, 5,229 have asset indices which improved between the2 years, while 607 households had asset indices which deteriorated. The remaining 5,444households had the same asset index in both years.
Figure 18 Scatter plot of the asset index in 2003/4 and 2004/5
To examine the determinants of changes in the durable asset index, we regressed the(absolute) change in the asset index between 2003/4 and 2004/5 on a number of (time-invariant) household characteristics plus five types of shocks. Household characteristicsincluded as regressors were the age, sex, marital status and educational level of the household head, the amount of land cultivated by the household, whether the householdoperated a household enterprise and housing and toilet type. A dummy variable indicatingwhether or not the household had a mains electricity connection was also included as aproxy for urbanisation.4 Community-level variables included the distance of the communityto the nearest tarmac road, school or market. Shock variables included dummies forwhether the household had experienced crop failure or crop diseases, whether there hadbeen large falls in the sales price for its crops or the prices paid for food, whether anyhousehold member had experienced illness, whether a household member had died, andwhether there had been any instances of theft. All these shocks relate to changes withinthe last year.
Since better-off households will be better able to draw down assets in order to pay forunexpected expenditures or smooth consumption, all these shock variables were interactedwith the initial value of the durable asset index. After allowing for the stratification andclustering of the survey, and using household level sampling weights, the regression resultsin Table 9 were produced.
IDS DISCUSSION PAPER 387
42
4 The urbanisation variable included in IHS-2 is problematic, as many households classified as urban actually live outside the urban centres and engage in agriculture as their primary occupation.

Table 9 Determinants of changes in the durable asset index
IDS DISCUSSION PAPER 387
43
Survey linear regressionNumber of obs = 11,026Number of strata = 30Number of PSUs = 447Population size = 2,638,528F(37, 381) = 30.31Prob >F = 0.0000R2 = 0.2987
Dep = change in asset index Coeff. SE t P>|t|Household characteristicsAge of Head of household –0.0071 0.0013 –5.39 0.000Age of Head squared 0.0000 0.0000 4.17 0.000Sex of Head –0.0370 0.0170 –2.18 0.030Marital status of HeadPolygamous marriage –0.0250 0.0111 –2.25 0.025Separated –0.0309 0.0184 –1.68 0.093Divorced –0.0465 0.0170 –2.72 0.007Widowed –0.0324 0.0231 –1.4 0.163Never married –0.0097 0.0352 –0.27 0.784Matrilineal –0.0630 0.0096 –6.54 0.000Education of Household HeadPSLC –0.0038 0.0151 –0.25 0.803JCE 0.0717 0.0257 2.79 0.006MSCE 0.2403 0.0714 3.36 0.001Diploma/Degree 0.5306 0.1302 4.08 0.000Land cultivated by household<1 ha –0.0158 0.0341 –0.46 0.6431–2 ha –0.0394 0.0234 –1.68 0.0942–5 ha –0.0218 0.0221 –0.99 0.3245–10 ha –0.0114 0.0217 –0.53 0.60010–20 ha 0.0128 0.0228 0.56 0.575>20 ha 0.0604 0.0397 1.52 0.129Household enterprise 0.0452 0.0100 4.52 0.000HousingPermanent dwelling 0.0939 0.0209 4.49 0.000Semi-permanent dwelling 0.0715 0.0117 6.1 0.000Latrine 0.2924 0.0967 3.02 0.003Flush toilet 0.0227 0.0065 3.48 0.001Electricity 0.7769 0.0619 12.56 0.000
Community characteristicsln distance to road –0.0059 0.0031 –1.94 0.054ln distance to market –0.0081 0.0042 –1.94 0.053
ShocksCrop failure –0.0038 0.0183 –0.2 0.838Crop failure x asset index 0.0060 0.0354 0.17 0.866Price shock –0.0600 0.0215 –2.79 0.006Price shock x asset index –0.1779 0.0680 –2.62 0.009Illness 0.0203 0.0239 0.85 0.395Illness x asset index 0.0105 0.0572 0.18 0.855Death of HH member –0.0061 0.0195 –0.31 0.757Death x asset index –0.0271 0.0398 –0.68 0.497Theft 0.0078 0.0102 0.77 0.442Theft x asset index –0.0754 0.0216 –3.48 0.001Constant 0.3883 0.0402 9.65 0.000

The regression results generally conform to expectations. After controlling for other factors,households with young, female, or divorced heads are associated with decreases in theasset index. If decreases in the asset index are associated with lower expenditures, as thehigh correlation between the asset index and expenditures reported above indicates, thissuggests that households with young, female or divorced heads are more vulnerable.Polygamous marriages and coming from a language group with a matrilineal inheritancetradition are also associated with dis-accumulation of durable assets and lower materialwellbeing. In contrast, households whose heads have completed the junior certificate ofeducation, high school or college/university are in a position to accumulate assets, as arehouseholds who operate a household enterprise or cultivate more than 20 ha of land. Thisconfirms the usual argument that ownership of human or physical assets is a key bufferguarding against vulnerability. Living in a permanent or semi-permanent house or one witha flush toilet or latrine is also associated with increases in the asset index. Having a mainselectricity connection, which as explained above can be interpreted as a proxy for urbanisation, is also strongly associated with rising asset levels. Turning to the community-level variables, distance from either a tarmac road or primary school is associated withdecreases in the asset index, suggesting that remoteness plays a key role in vulnerability.
Most of the shock variables have the expected negative sign, indicating that shocks in thepast year are associated with decreases in the durable asset index. However, with theexception of price shocks, their coefficients are not statistically significant at the 5 per centlevel. The negative and statistically significant terms on the price shock and theft dummiesinteracted with the asset index in 2003/4 suggests that richer households are more vulnerable to changes in prices and theft. We hypothesise that this is due to richer households being more dependent on the market for their livelihoods, or being moreprone to be targeted by robbers.
4.4 Conclusions
This chapter has examined vulnerability to monetary poverty using data from the 2004/5Malawi Integrated Household Survey. The main findings from this analysis are that:
l∑ Vulnerability to monetary poverty in Malawi is high: one-quarter of people have expenditure within ±20 per cent of the NSOs expenditure poverty line.
∑l Covariant shocks are widespread: over three-quarters of IHS-2 households stated that
they had been negatively affected by the rising price of food over the past 5 years, while nearly two-thirds had experienced lower crop yields due to drought or floods. Idiosyncratic shocks, in particular illness, accidents and the death of family members, are rarer but still common, affecting around two-fifths of IHS-2 households.
∑l Changes in the durable asset index suggest that the living standards of the vast
majority of households have improved (46.3 per cent) or were static (48.3 per cent) between 2003/4 and 2004/5. However, a significant minority (5.4 per cent) of households had deteriorating asset indices.
∑l After controlling for other factors, households living in remote areas or with a young,
female or divorced head, polygamous marriages and matrilineal inheritance traditions, are found to be most likely to have deteriorating asset indices. In contrast, living in an urban area, completing higher or secondary education, cultivating more than 20 hectares of land, or operating a household enterprise are all characteristics that are associated with an improvement in the asset index over the last year.
IDS DISCUSSION PAPER 387
44

5 Subjective poverty and social exclusion in Malawi: an analysis using IHS-2 data
5.1 Introduction
The proliferation of recent poverty analyses, both conceptual and empirical, confirms the need toutilise measurements of poverty that are broader than income or occupation (see, for instance,Ravallion and Bidani 1994; Ravallion 1996; Ravallion and Lokshin 1999). Subjective povertymeasurements – those that rely on relative measurements or self-reported poverty – a r ebecoming widely used as they are able to capture more fully the social and political aspects o fpoverty. Of course, they are sensitive to personality, relative positioning and aspirations, howeverwe believe that understandings of the determinants of subjective poverty and vulnerabilitycomplement monetary measurements of poverty, rather than substituting for them, and togetherprovide a much richer and more comprehensive understanding of poverty and vulnerability. For this reason, we focus here on analysing subjective poverty measurements, comparingthem with monetary measures. We then move on to investigate why the two measures mayyield different results. This is followed by an exploration of the relative vulnerability of different traditionally-labelled vulnerable groups (such as orphans, female-headed households, minoritylanguage groups, widows), in an attempt to understand the extent of exclusion in Malawi.
5.2 Data and data limitations
The IHS-2 dataset includes a special section on subjective wellbeing and changes in wellbeingover the past year. This provides the basis for our analysis here. We construct two variablesfrom this module that we use as dependent variables. The first variable is constructed fromthe following question: ‘In terms of your household economic wellbeing, are you better off,the same as, or worse off than this same time a year ago?’ The respondent had to chooseone of five categories (much better, better, no change, worse off, much worse off). Wegrouped these into three categories: ‘better’, ‘no change’ and ‘worse’. Thus we have athree-category variable indicating changes in wellbeing over the last year.
The second variable is a subjective poverty measurement. Respondents were asked to imagine six steps, the bottom step representing the poorest people and the top step representing the richest people. Each respondent indicated which step they were on wheninterviewed. Again we collapse these steps into two categories (poor and non-poor) so thatwe can compare subjective poverty indicators with the expenditure-based indicator. Afterexamining the data and frequencies of households falling into each poverty category, wedecided to label the two bottom steps as ‘poor’ (n = 9,399) and the top four steps as ‘non-poor’ (n = 1,864). This classification could be disaggregated further.
Other variables utilised below that require brief explanations are shock variables, change variables, an asset index, language groupings and tenurial types. The IHS-2 survey contains acomprehensive module on the type of shocks experienced by households over the past 5 years.We have collapsed these shocks into five categories: price shocks, crop failure, illness, death ofa household member and theft. We also restrict our analysis of shocks to those experiencedin the last year, as some of our other variables are based on the last year and this will allowfor comparability. The asset index is constructed using principal components analysis andaccording to the methodology detailed earlier in Chapter 4 of this report. We included achange in the asset index, which involved subtracting the log of the asset index in 2005 fromthe log of the asset index in 2004. Thus the variable measures the ratio of the asset indexacross years. Other change variables include household perceptions of changing levels of crime in the last year. Based on knowledge of Malawi, we construct two variables that may
IDS DISCUSSION PAPER 387
45

provide evidence of social exclusion. The first variable uses the main language spoken by thehousehold head to construct three language groupings – from the dominant languages to theminority languages. These are taken as a proxy for majority, middle and minority populationgroups (see Annex Tables for a list of these language groupings). The second variable is constructed according to whether the property tenure system is matrilineal, patrilineal ormixed. (Again, the districts corresponding to these types are presented in the Annex Tables.)
5.3 Changes in wellbeing
For those households who feel that they have become worse off over the last year, wemapped the distribution on a map of Malawi (see Figure 19a). What is obvious at firstglance is that the majority of those households feeling worse off are located in the southand centre of the country. Disaggregating further (Figure 19b), the picture is much morenuanced, with the majority of those feeling worse off in the south, but coexisting withpockets of households who feel better off this year than last year. This finding is consistentwith findings presented in earlier chapters, of a broad ‘north-to-south gradient’ in wellbeingindictors, but with certain districts in the Central and Southern Regions being better offthan neighbouring districts.
Figure 19a and b Self-reported declines in wellbeing in Malawi
Source: IHS-2 data
5.3.1 Factors associated with changes in wellbeing
Apart from those geographic and historical factors discussed above, it is also interesting tolook at the determinants of changes in wellbeing at a household level. To do this, we run amultinomial logit regression with a three-category dependent variable that indicateschanges in wellbeing over the last year. After allowing for the stratification and clusteringof the survey, and using household level sampling weights, the regression results in Table 10and Table 11 were produced.
Table 10 presents the results of a regression that uses only information on changes and shocksover the past year as determinants of changes in wellbeing. Households experiencing one ortwo shocks last year are 17 per cent more likely to feel worse off than those households thatexperienced no shocks. Households that experienced three or more shocks are 29 per cent morelikely to feel worse off. An increase in crime over the last year is also a significant determinantof feeling worse off. An increase in durable assets over the last year implies that householdsare 13 per cent less likely to consider themselves worse off. In terms of the shock variables,
IDS DISCUSSION PAPER 387
46

crop failure is positively and significantly related to declines in wellbeing, as compared with thedeath of a household member (in other words, crop failure is seen as more damaging to wellbeing than the death of a household member), whereas theft is not considered as seriousas the shock from the death of a family member. Hospitalisation of a household member inthe last year is also significant and positively related to a decline in wellbeing.
Table 10 Multinomial logit model for estimating perceptions in change in wellbeing over the last year
Note: This model is based only on changes and shocks experienced last year.
Unpacking the above effects in terms of poverty status and gender reveals that poor peoplewho experience shocks are more likely to experience a decline in wellbeing than non-poorpeople who experience the same number of shocks. In other words, the impacts of shocksare exacerbated by poverty. Figure 20 illustrates this graphically and by area.
IDS DISCUSSION PAPER 387
47
Worse off SameShock variables Beta SE Marginal Beta SE Marginal
effects effects
No shock1–2 shocks 1.038 0.188 0.170 0.587 0.161 –0.028>2 shocks 1.593 0.193 0.296 0.528 0.167 –0.075
Crime has decreasedCrime is the same –0.027 0.078 –0.066 0.424 0.078 0.097Crime has increased 0.146 0.079 0.027 0.065 0.084 –0.006Change in durable assets –0.989 0.102 –0.136 –0.780 0.095 –0.033
Death of household memberCrop or food price shock –0.214 0.125 –0.010 –0.334 0.124 –0.042Crop failure 0.439 0.111 0.100 0.066 0.127 –0.048Illness –0.150 0.101 –0.019 –0.131 0.116 –0.008Theft –0.315 0.114 –0.023 –0.437 0.141 –0.051
No hospitalisationHospitalisation 0.456 0.178 0.053 0.404 0.189 0.020constant –0.722 0.196 –0.277 0.165
Figure 20 Are shocks felt equally by the poor and the non-poor?
Source: IHS-2 data

As well as exploring ‘pure change’ factors that may have occurred over the last year causinga change in wellbeing, it is also important to examine whether time-invariant characteristicsof households (such as sex of household head, ethnic or language group, location), as wellas asset variables, explain declines in wellbeing. The results indicate that real per capitaexpenditure is negatively and significantly related to declines in wellbeing. That is, the moreincome a household has, the less likely it is to experience a decline in wellbeing, even if it is
IDS DISCUSSION PAPER 387
48
Worse off SameVariables Beta SE Beta SE
Shock VariablesOne or two shocks 0.933 0.192 0.472 0.166Three or more shocks 1.280 0.201 0.316 0.164Crime is the same –0.019 0.082 0.378 0.080Crime has increased 0.238 0.080 0.137 0.084Change in asset index –0.440 0.107 –0.338 0.100Price shock –0.064 0.131 –0.269 0.127Crop failure shocks 0.180 0.116 –0.120 0.130Illness shock –0.132 0.108 –0.145 0.121Theft –0.122 0.122 –0.262 0.146Hospitalised in last 12 months 0.398 0.184 0.345 0.197
Household and demographic variablesPer capita expenditure –0.537 0.074 –0.656 0.073Log household size –0.129 0.087 –0.357 0.089Dependency ratio –0.230 0.132 –0.299 0.140Sex of household head 0.349 0.129 0.510 0.136Age of household head 0.016 0.002 0.016 0.002Monogamous –0.247 0.166 0.164 0.186Polygamous –0.243 0.182 –0.062 0.199Never married –0.151 0.156 0.131 0.161Widow(er) 0.135 0.231 –0.176 0.242PSLC –0.007 0.100 –0.068 0.100JCE –0.246 0.121 0.002 0.113MSCE or Diploma –0.213 0.165 –0.089 0.139
Exclusion and access variablesOne or more household members has a disability 0.134 0.100 –0.046 0.111Majority language group –0.400 0.259 –0.646 0.216Northern –0.528 0.211 –0.131 0.199Patrilineal 0.977 0.172 0.766 0.169Mixed system 1.216 0.158 0.412 0.170Road 0.096 0.117 0.106 0.117Community access to a primary school –0.145 0.092 –0.113 0.099
Asset variablesHad wage employment last year –0.012 0.084 0.206 0.084Engaged in ganyu last year 0.527 0.072 0.392 0.081Log of land area –0.077 0.056 –0.100 0.064Owns an enterprise –0.222 0.066 –0.165 0.073Permanent dwelling –0.349 0.113 –0.275 0.111Semi-permanent –0.440 0.096 –0.144 0.083
LocationRural North –0.263 0.245 –0.836 0.216Rural Centre 0.147 0.151 0.137669 0.165551Rural South 1.159 0.170 0.24692 0.193859Constant 3.737 0.960 6.312482 0.911196
Table 11 Multinomial logit including change variables plus time-invariant characteristics
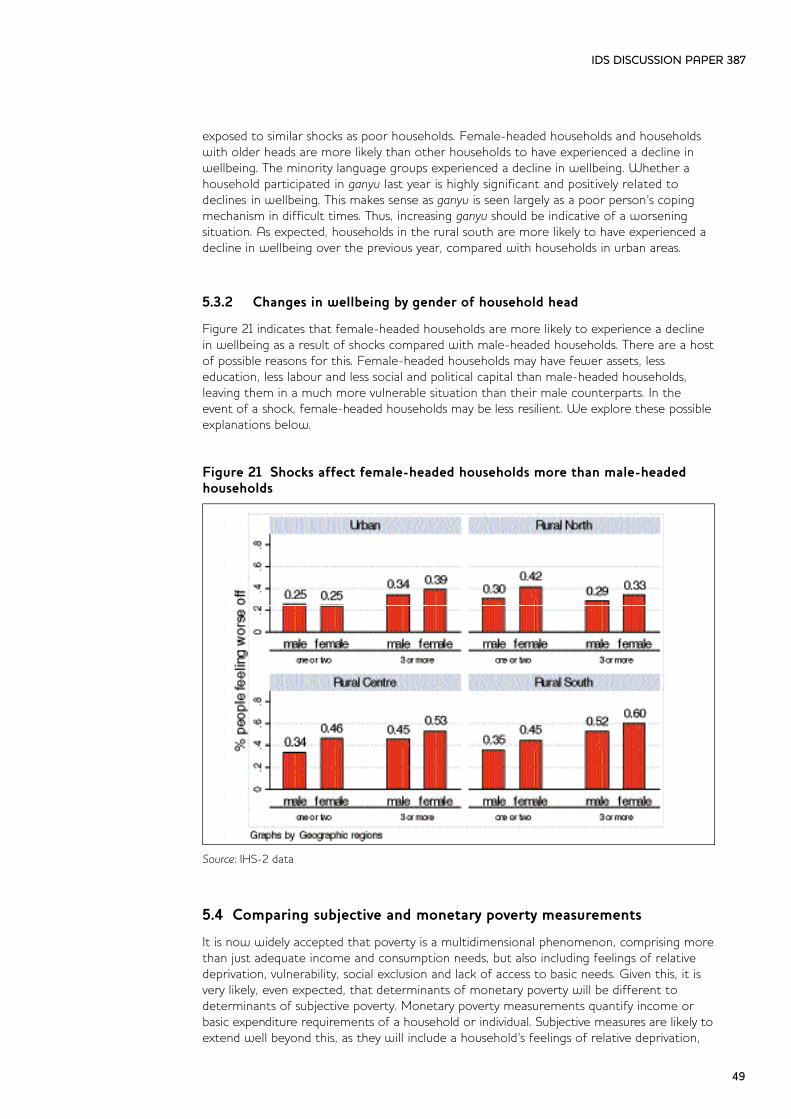
exposed to similar shocks as poor households. Female-headed households and householdswith older heads are more likely than other households to have experienced a decline inwellbeing. The minority language groups experienced a decline in wellbeing. Whether ahousehold participated in g a n y u last year is highly significant and positively related todeclines in wellbeing. This makes sense as ganyu is seen largely as a poor person’s copingmechanism in difficult times. Thus, increasing ganyu should be indicative of a worsening situation. As expected, households in the rural south are more likely to have experienced adecline in wellbeing over the previous year, compared with households in urban areas.
5.3.2 Changes in wellbeing by gender of household head
Figure 21 indicates that female-headed households are more likely to experience a declinein wellbeing as a result of shocks compared with male-headed households. There are a hostof possible reasons for this. Female-headed households may have fewer assets, less education, less labour and less social and political capital than male-headed households,leaving them in a much more vulnerable situation than their male counterparts. In theevent of a shock, female-headed households may be less resilient. We explore these possibleexplanations below.
Figure 21 Shocks affect female-headed households more than male-headedhouseholds
5.4 Comparing subjective and monetary poverty measurements
It is now widely accepted that poverty is a multidimensional phenomenon, comprising morethan just adequate income and consumption needs, but also including feelings of relativedeprivation, vulnerability, social exclusion and lack of access to basic needs. Given this, it isvery likely, even expected, that determinants of monetary poverty will be different todeterminants of subjective poverty. Monetary poverty measurements quantify income orbasic expenditure requirements of a household or individual. Subjective measures are likely toextend well beyond this, as they will include a household’s feelings of relative deprivation,
IDS DISCUSSION PAPER 387
49
Source: IHS-2 data

exclusion from services and institutions, as well as feelings of marginalisation related tohousehold or individual status (such as ethnicity, or marital status). Figure 22 illustrates thepercentage of households classified as poor according to monetary and subjective povertymeasurements (see the description earlier for the way in which the subjective poverty variable was created). The proportion of Malawians classified as poor is very differentdepending on which measurement of poverty is used. A subjective poverty measure produces a much higher incidence of poverty. For instance, in the rural south, 55 per centof households are poor by the monetary measure (16,165 MK), whereas 91 per cent reportthat they feel poor. This large difference indicates that the different measures reflect different dimensions of poverty.
Figure 22 A comparison of monetary and subjective poverty in Malawi, by region
Below we use the IHS-2 dataset to explore the differences in monetary and subjectivepoverty measures, as a way of gaining some insight into determinants of subjective povertyin Malawi. Two probit models were run, using the same explanatory variables.5 The firstmodel uses the monetary poverty line to classify households as poor or non-poor. The second model uses self-reported poverty status. A full set of results for both regressions ispresented as an Annex Table. Figure 23 and Figure 24 report the marginal effects for selectedfindings that are of interest to this report. Figure 23 shows the correlates of poverty thatare significant in both the monetary and subjective poverty equations. As expected, we find that a range of variables predicts both types of poverty, and in the same way. Theseinclude: land cultivated, amount of livestock owned, the level of durable assets owned, theamount of g a n y u performed, type of dwelling and region where a household is located.Specifically, Figure 23 shows that households living in permanent and semi-permanentdwelling structures are less likely to be monetarily poor and to feel poor than householdsliving in traditional dwelling structures. Similarly, households with heads who have obtainedjunior certificate or secondary certificates of education are less likely to be poor and feelpoor compared to those with no schooling. In the rural south, households are 9 per cent
IDS DISCUSSION PAPER 387
50
5 The subjective poverty regression includes one extra variable (log of real per capita expenditure). This could not be included in the monetary regression as the dependent variable (poverty) is constructed using this expenditure.
Source: IHS-2 data

more likely to be poor and feel poor than those in urban areas. The higher the ganyulabour, the more likely that a household will be monetarily and subjectively poor. Withsome variables there is a substantial difference in the strength of the relationship withpoverty across the regressions. For instance, households with more livestock units are 14per cent less likely to be monetarily poor but only 5 per cent less likely to feel poor.
What is particularly interesting about the results presented in Figure 23 is the nature ofdivergence between the impact of the explanatory variables on the dependent (the same istrue for Figure 24). We see that households with disabled members are 6 per cent lesslikely to be monetarily poor but 3 per cent more likely to be subjectively poor. Similarly, thebigger the household size the more likely the household will be monetarily poor but theless likely it will feel poor. There is a clear opposite trend in the results for marital status.Divorced heads, heads who have never married and widows or widowers are less likely to bemonetarily poor but more likely to feel poor. These results give some insights into what maybe driving the difference between alternative poverty measurements. Larger householdsmay provide intangible benefits, such as a sense of belonging, support and care, that feedinto peoples’ sense of wellbeing. Thus, even though on average larger households have lessincome, individuals do not associate households size with poverty. In fact large families maybe positively associated with wellbeing. It also appears that a person’s marital status willaffect their sense of wellbeing in a negative way. This is likely to be related to socioculturalnorms around marriage, with widows, divorcees and people who have never married feelingmore socially vulnerable than people who are married. The same rationale applies to households with members who have disabilities. While they are less likely to be financiallypoor, these households feel that the disability negatively affects their wellbeing.
Figure 23 Correlates of poverty that are significant in monetary and subjectivemeasurements
IDS DISCUSSION PAPER 387
51
Key: D permanent: a permanent dwellingD semi-permanent: a semi-permanent dwellingDisabled member (the household has one or more members with a disability)Educ JCE (Junior Certificate of Education)Educ MSCE (Malawi Secondary Certificate of Education)Ganyu (days of ganyu labour obtained last year)Ln asset (log of asset index)Ln land (log of land size)Ln livestock (log of tropical livestock units).
Source: IHS-2 data

Figure 24 presents results from the same regressions, however these results indicate wheredifferent factors are significantly associated with one poverty measure but not with another.Household heads with a diploma/degree are less likely to feel poor, but there is no difference in their objective poverty status compared with household heads with no education.Other significant factors explaining subjective poverty are polygamy, tenurial type, languagegroup, nature of shocks and female headship. Female household heads report feeling lesspoor than male heads. Polygamous households are less likely to feel poor compared withmonogamous households, as are matrilineal households compared with patrilineal groups.Households from minority language groups feel less poor. Households with double-orphansare 9 per cent less likely to be monetarily poor than households with no orphans (perhapsthis is because of the various social protection mechanisms they are able to access), however,it appears that households with orphans do not feel poorer than other households.
Figure 24 Differences in correlates of poverty according to poverty measurement
The above analysis has drawn attention to the diversity of factors that constitute ‘poverty’ inMalawi. A monetary measure of poverty alone, and the analysis and policy focus that typicallyemerges from this, would not adequately or fairly represent the extent and complexity ofhousehold poverty and vulnerability. Recognising the social and cultural underpinnings of poverty,as well as the obvious financial and asset-based determinants, helps us to move some way totackling the causes of poverty and vulnerability in a more comprehensive and meaningful way.
The following section provides a descriptive analysis of a number of groups that much ofthe current literature on Malawi labels as vulnerable, and attempts to establish whetherthere is some evidence to support these claims.
5.5 Social understandings of poverty: vulnerable groups6
A review of recent literature reveals that poverty and vulnerability in Malawi are oftenreported in terms of vulnerable groups. These include orphans and vulnerable children,
IDS DISCUSSION PAPER 387
52
6 See also Chapter 7 of the PVA for complementary analysis.
Source: IHS-2 data
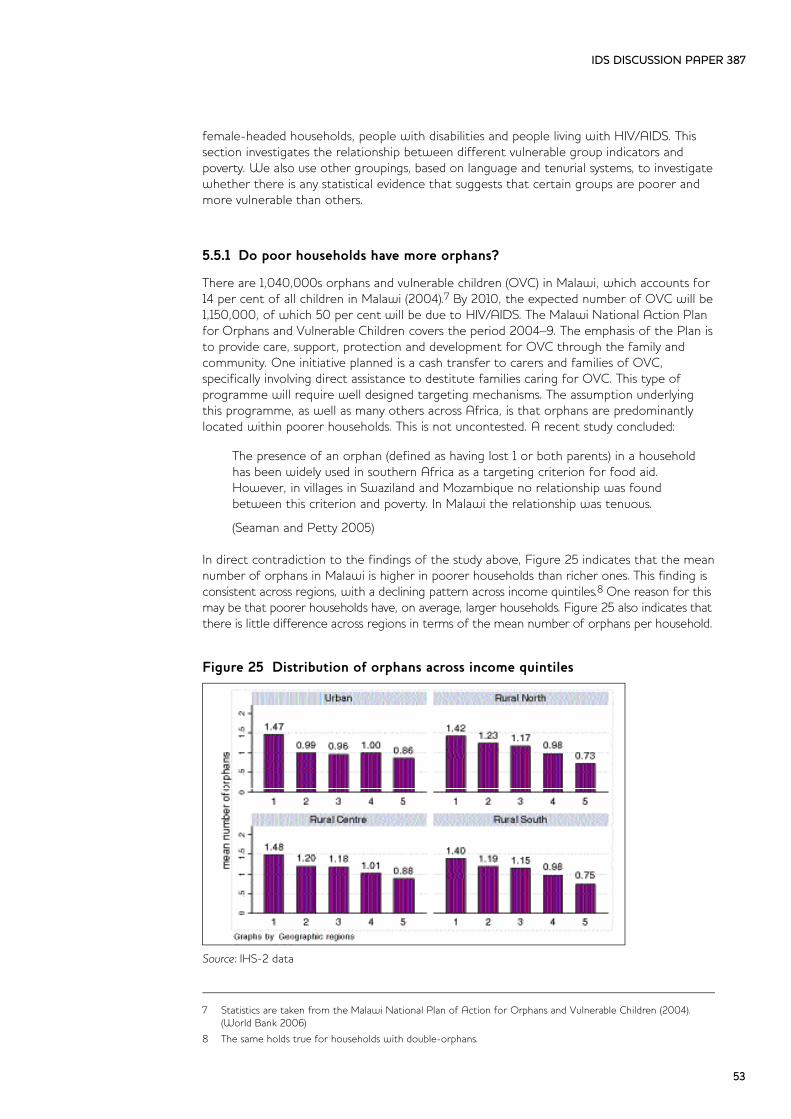
female-headed households, people with disabilities and people living with HIV/AIDS. Thissection investigates the relationship between different vulnerable group indicators andpoverty. We also use other groupings, based on language and tenurial systems, to investigatewhether there is any statistical evidence that suggests that certain groups are poorer andmore vulnerable than others.
5.5.1 Do poor households have more orphans?
There are 1,040,000s orphans and vulnerable children (OVC) in Malawi, which accounts for14 per cent of all children in Malawi (2004).7 By 2010, the expected number of OVC will be1,150,000, of which 50 per cent will be due to HIV/AIDS. The Malawi National Action Planfor Orphans and Vulnerable Children covers the period 2004–9. The emphasis of the Plan isto provide care, support, protection and development for OVC through the family andcommunity. One initiative planned is a cash transfer to carers and families of OVC, specifically involving direct assistance to destitute families caring for OVC. This type of programme will require well designed targeting mechanisms. The assumption underlyingthis programme, as well as many others across Africa, is that orphans are predominantlylocated within poorer households. This is not uncontested. A recent study concluded:
The presence of an orphan (defined as having lost 1 or both parents) in a householdhas been widely used in southern Africa as a targeting criterion for food aid.However, in villages in Swaziland and Mozambique no relationship was foundbetween this criterion and poverty. In Malawi the relationship was tenuous.
(Seaman and Petty 2005)
In direct contradiction to the findings of the study above, Figure 25 indicates that the meannumber of orphans in Malawi is higher in poorer households than richer ones. This finding isconsistent across regions, with a declining pattern across income quintiles.8 One reason for thismay be that poorer households have, on average, larger households. Figure 25 also indicates thatthere is little difference across regions in terms of the mean number of orphans per household.
Figure 25 Distribution of orphans across income quintiles
IDS DISCUSSION PAPER 387
53
7 Statistics are taken from the Malawi National Plan of Action for Orphans and Vulnerable Children (2004). (World Bank 2006)
8 The same holds true for households with double-orphans.
Source: IHS-2 data
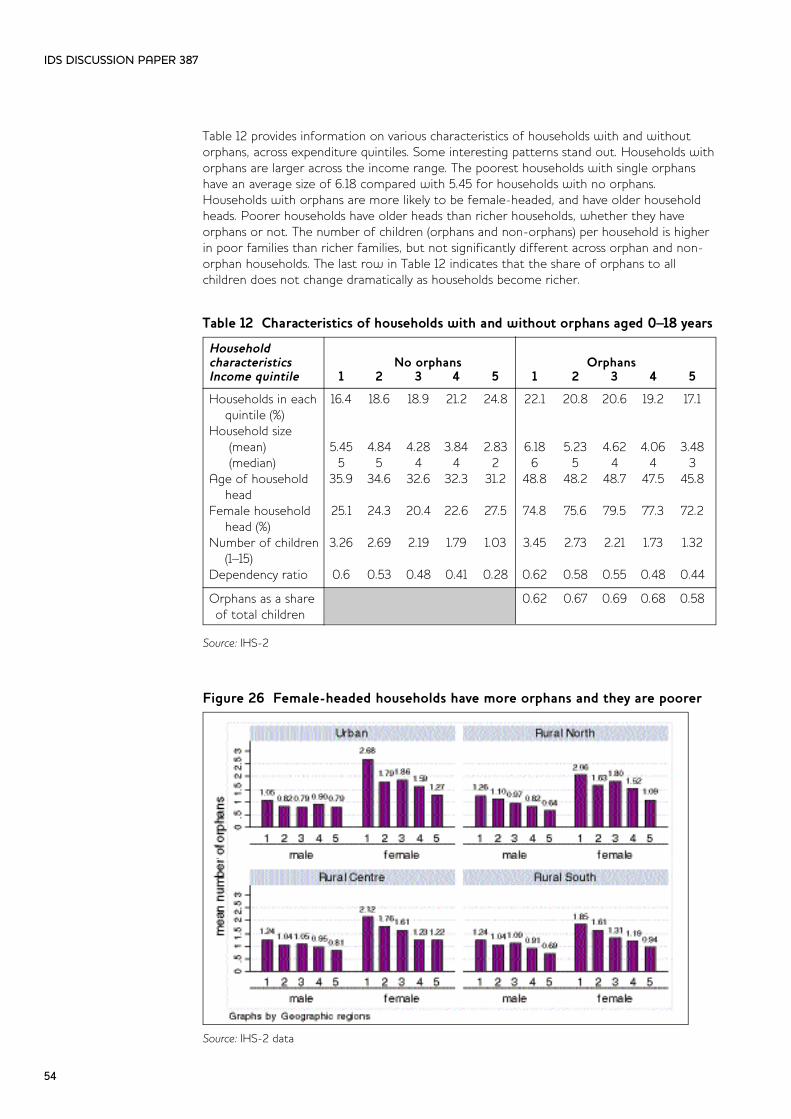
Table 12 provides information on various characteristics of households with and withoutorphans, across expenditure quintiles. Some interesting patterns stand out. Households withorphans are larger across the income range. The poorest households with single orphanshave an average size of 6.18 compared with 5.45 for households with no orphans.Households with orphans are more likely to be female-headed, and have older householdheads. Poorer households have older heads than richer households, whether they haveorphans or not. The number of children (orphans and non-orphans) per household is higherin poor families than richer families, but not significantly different across orphan and non-orphan households. The last row in Table 12 indicates that the share of orphans to all children does not change dramatically as households become richer.
Table 12 Characteristics of households with and without orphans aged 0–18 years
Source: IHS-2
Figure 26 Female-headed households have more orphans and they are poorer
IDS DISCUSSION PAPER 387
54
Householdcharacteristics No orphans OrphansIncome quintile 1 2 3 4 5 1 2 3 4 5
Households in each 16.4 18.6 18.9 21.2 24.8 22.1 20.8 20.6 19.2 17.1quintile (%)
Household size (mean) 5.45 4.84 4.28 3.84 2.83 6.18 5.23 4.62 4.06 3.48(median) 5 5 4 4 2 6 5 4 4 3
Age of household 35.9 34.6 32.6 32.3 31.2 48.8 48.2 48.7 47.5 45.8head
Female household 25.1 24.3 20.4 22.6 27.5 74.8 75.6 79.5 77.3 72.2head (%)
Number of children 3.26 2.69 2.19 1.79 1.03 3.45 2.73 2.21 1.73 1.32(1–15)
Dependency ratio 0.6 0.53 0.48 0.41 0.28 0.62 0.58 0.55 0.48 0.44
Orphans as a share 0.62 0.67 0.69 0.68 0.58of total children
Source: IHS-2 data

Analysing mean number of orphans across income quintiles and by gender of headship,Figure 26 shows that female-headed households have, on average, more orphans acrossthe board, with poorer female-headed households caring for the most orphans (this is alsothe case for double-orphans). Female-headed households located in urban areas, on average,care for more orphans than in any other areas of Malawi.
5.5.2 Are poorer female-headed households caring for orphans more vulnerablethan other poor households?
Analysing the asset-holdings of households with orphans and those with no orphans, wefind no significant difference between the two types of households (see Chapter 7 of thePVA). However, disaggregating the data by sex of the head of household and looking atasset profiles over the income quintiles reveals some interesting results. Figure 27 andFigure 28 show the average land and asset holdings across different types of households. Astriking result is that female-headed households with orphans have significantly less land percapita than other households. Furthermore, female-headed households in general own lessdurable assets than male-headed households.
Figure 27 Land per capita by different household categories
Note: All cases with land per capita over 1,000 hectares have been dropped
Figure 28 Levels of durable assets owned by different household categories
IDS DISCUSSION PAPER 387
55

5.6 Other ‘vulnerable groups’
Much of the literature discussing vulnerability in Malawi refers to various categories of vulnerable groups. For instance, a report on causes and consequences of vulnerability inMalawi states that:
while chronic poverty is widespread among rural households, the rural poor that fallinto this category should not be considered a homogeneous group. Certain demographic sub-sets have been identified as being particularly prone to high rates ofchronic poverty. These include land-constrained smallholder farmers; labour-constrainedfemale-headed households; estate workers or tenants; ganyu (piece-work) and othercasual labourers; destitute or disadvantaged children; persons with disabilities; the elderly; the uneducated; and the unemployed. One chronically vulnerable group thathas grown in size in recent years is people living with HIV/AIDS. The 2001–3 food crisis made a strong case for stepping up social protection interventions to supportPLWHA, AIDS orphans and care givers (Devereux et al 2003). An estimated 80,000people now annually die of AIDS and another 110,000, mostly young people, areinfected. PLWHA face new constraints to food security, with consequences at themicro-, meso-, and macro-levels.
(TANGO 2004a: 18)
Below we provide some information on vulnerable groups, defined by disability and language groupings. The overall conclusions from these two groups is that there is little evidence of significant poverty differences between sub-categories within these groups.
Figure 29 Percent of monetarily poor households according to languagegroupings
IDS DISCUSSION PAPER 387
56
Source: IHS-2 data

Figure 30 Percentage of subjectively poor households according to languagegroupings
Figure 31 Households with disabled members
IDS DISCUSSION PAPER 387
57
Source: IHS-2 data
Source: IHS-2 data

5.7 Conclusions
From the evidence presented in this chapter, the following conclusions can be drawn aboutthe distribution of poverty and vulnerability in Malawi.
l Location: Households in southern and central Malawi are consistently worse off, bothin monetary and in subjective poverty terms. This finding is consistent with evidence from earlier chapters, of a broad ‘north-to-south gradient’ in wellbeing indictors, but with certain districts in the Central and Southern Regions being better off than neighbouring districts.
∑l Changes in wellbeing: Multiple shocks, changes in crime levels, changes in durable
asset wealth and hospitalisation contribute to feelings of illbeing. Poor people who experience shocks are more likely to experience a decline in wellbeing than non-poor people who face the same number of shocks – in other words, the impacts of shocks are exacerbated by poverty. Furthermore, female-headed households and households with older heads are more likely than others to have experienced a decline in wellbeing.
∑l Subjective and monetary poverty measures: Subjective poverty is higher than
objective poverty, indicating the multidimensional nature of poverty and vulnerability. Moreover, factors explaining the different poverty measures indicate interesting divergences. Sociocultural factors related to marital status, and cultural perceptions related to disability and household size, cause subjective and objective poverty linkagesto work in opposite directions. Similarly, land tenure system, language group and sex of household head are important predictors of subjective poverty, but not of monetary poverty.
∑l Orphans and female-headed households: Poorer households care for more orphans
than richer households. Female-headed households have, on average, more orphans across the income range, with poorer female-headed households caring for the most orphans (this is also the case for double-orphans). Female-headed households located in urban areas, on average, care for more orphans than in any other areas of Malawi. A striking result is that female-headed households with orphans have significantly less land per capita than other households. Female-headed households in general also own fewer durable assets.
∑l Social exclusion: There is no hard evidence for identifiable ‘vulnerable groups’ by
personal characteristics – such as language group (a proxy for ethnicity), or disability – suggesting that social exclusion on these grounds is not common and/or is not strongly associated with poverty outcomes.
IDS DISCUSSION PAPER 387
58

6 Implications for policy
6.1 Introduction
Policy responses to address chronic vulnerability in Malawi should pursue two parallel objectives:
1. Social protection: provide social assistance and social insurance to people facing inadequate food consumption and/or erratic incomes.
2. Livelihood promotion: support viable livelihoods through improving access to key productive inputs and to output markets.
6.2 Social protection
It is often asserted (though not empirically proven) that ‘informal safety nets are breakingdown’ (TANGO 2004b) in Malawi,9 and that the poor are therefore increasingly dependenton formal safety nets provided by the government and NGOs. It is certainly true that formalsocial protection is increasing in Malawi – Smith and Subbarao (2003) recorded 15 distinctdonor-funded social protection programmes – but these interventions are generally uncoordinated, poorly targeted and ‘projectised’ rather than institutionalised. As a matterof urgency, social protection policy in Malawi needs to be made coherent by being setwithin a single overarching framework, it needs to be comprehensive but tailored to specificgroups (the labour-constrained and the economically active poor have very different needs),and it needs to be institutionalised within government (though drawing on technical andfinancial support from development partners as required). Specific interventions that shouldbe prioritised by government and donors include the following.
1. Stabilise food prices and attack food price seasonality: For all its problems, ADMARC didhave a mandate to protect household food security, through consumption-smoothing interventions such as food price banding (purchasing maize at a pan-territorial floor price and selling at no higher than a fixed ceiling price), and managing a Strategic Grain Reserve to stabilise inter-seasonal food supplies. ADMARC has steadily withdrawn from these food security functions, but the private sector has not responded to generate the integrated, competitive and efficient markets that would stabilise prices and keep food affordable even during the hungry season. The risks thatfood price variability introduce to market-dependent poor households are not only short term – cumulative food deficits result in stunted child growth, intergenerationaltransmission of undernutrition, and chronic poverty. Policies must be introduced that stabilise food supplies and reduce inter-seasonal food price variability. Innovative approaches – to avoid the risk of making matters worse – include using South Africanfutures and options contracts to establish a floor price for maize; or measures to promote intra-annual grain storage by private traders.
2. Introduce labour-saving technologies for labour-constrained households: Households canbecome labour-constrained if their productive members become chronically ill and/or die, or if a couple separates leaving a female-headed household without adult male labour. Shah (2002) identifies several ways in which female-headed and labour-constrained households can continue to make a viable living from agriculture. These include: ‘introducing labour economizing technologies, introducing crops that require less labour, increased and better utilization of low-lying wetlands and homestead
IDS DISCUSSION PAPER 387
59
9 See also Palamuleni et al (2003): ‘social structures that offer extended and communal support are gradually collapsing ...’.

gardens, and providing opportunities for women to acquire skills to cultivate high value “male” crops like tobacco, so that in the event of their husband’s death, they don’t lose a significant source of their livelihood’.
3. Targeted nutrition programmes for adolescent girls: ‘At an absolute minimum, there is a need for a specific focus on anaemia among adolescents – which is both widespreadand preventable, through the provision of iron/folate supplements as part of the Essential Health Package’ (Gillespie and Haddad 2004).
4. Protect land rights for rural households with no adult males: ‘Land ownership and usufruct rights to be revisited to protect children, divorcees and widows/widowers’ (Kadzandira 2002).
5. Social insurance: Effective social insurance has the potential to protect the gains fromeconomic growth against shocks that, in the absence of insurance, can dissipate thesegains. (For example, a household that builds up its assets over several years can be forced to dispose of these assets to care for a chronically ill family member.) Social insurance mechanisms include: (1) crop or weather insurance to protect farmers against erratic rainfall; (2) community-based health insurance schemes and burial societies to provide funds to draw down in times of illness and death; (3) employment guarantee schemes to stabilise income following a livelihood shock or during periods of under-employment. These three examples also illustrate the range of social insurance providers: (1) is a market-based intervention, sometimes subsidised by donors; (2) is a self-funded informal insurance scheme; (3) is a government-run programme (the Government of India enacted a National Rural Employment Guarantee Programme inAugust 2005, which guarantees 100 days of work at the minimum wage to every household in rural India on demand).
These ‘social protection’ interventions all have the advantage of linking short-term supportto long-term livelihood promotion. For instance, controlling food price seasonality willallow poor households to retain their assets rather than selling them to survive the ‘hungryseason’ and falling into irreversible ‘poverty traps’. Nutrition programmes that allow youngmothers to have healthy babies will break the cycle of intergenerational transmission ofpoverty and undernutrition: low birthweight babies are known to face problems withhuman capital formation in later life. Social insurance mechanisms like weather insurance oremployment guarantee schemes will encourage farmers to take moderate risks (e.g. byinvesting in higher-yielding crop varieties), in the knowledge that if their harvest fails theywill be compensated, or can at least be assured of finding alternative employment.
6.3 Livelihood promotion
Although there are linkages between some form of social protection and livelihood promotion, social protection is never enough on its own to address the underlying causesof chronic poverty and vulnerability, which in rural Malawi are largely a product of lack ofassets at the household level and market failures at the sectoral level, in a context of recurrent natural risks and policy failures at the national level. Apart from social assistancefor those unable to participate in economic activities (i.e. social welfare support for ‘vulnerable groups’ such as orphans, the elderly and the chronically ill), social protection iscompensation for a failure of livelihoods, and it should not substitute for policies, programmes and investments that promote sustainable livelihoods and ultimately reducethe need for social assistance to economically active groups. Priority measures to promoterural livelihoods in Malawi should focus on input and output markets, assets, and employment.
1. Restore access to agricultural inputs, especially fertiliser: Either through free handouts (not desirable or sustainable), subsidies, or input credit – or building fertiliser markets.
IDS DISCUSSION PAPER 387
60

2. Expand markets for high-value crops: In the early 1990s, when Malawian smallholders were first legally allowed to cultivate burley tobacco, this crop was seen as a pathway out of poverty for many rural households. But tobacco failed to live up to this initial promise, due to unpredictable auction prices, inability to compete with tobacco estates on either quality or volume of production, and the fact that smallholders continued to face input constraints which meant that tobacco had to compete with maize for scarce land, labour and fertiliser. In the late 1990s, paprika was promoted asanother high-value cash crop (Peters 1999). To date, all efforts to identify high-value crops that could lead to accelerated income growth for large numbers of Malawian farmers have either petered out or have provided opportunities for only a small cluster of smallholders. Nonetheless, these efforts should continue.
3. Protect and build productive assets: ‘Asset buffers’ protect individuals and households against shocks, so one solution to rising vulnerability in some Malawian communities isto build productive assets of all kinds. This includes: (1) human capital at the individuallevel (improved health services to reduce illness and raise labour productivity, improvededucation to build skills and broaden livelihood opportunities beyond agriculture); (2) physical assets at the household level (e.g. exploring innovative options for building livestock flocks and herds); (3) infrastructure at the community level (e.g. feeder roads to integrate markets, which can be – and are being – constructed and maintained through public works projects).
4. Increase opportunities for rural non-farm employment: In order to diversify rural options,stabilise consumption and raise incomes (Ellis et al 2002).
6.4 Conclusion
The likelihood of achieving successful outcomes from the interventions proposed above, interms of sustainable poverty reduction and reduced vulnerability, is dependent on thebroader context within which individuals and households pursue their livelihoods. There aremany features of the socioeconomic environment in Malawi that are ‘disabling’ rather than‘enabling’, which require policy attention if livelihood promotion and social protectioninterventions are to be fully effective.
Key contextual economic factors that emerge from our analysis as undermining livelihoodsinclude weak markets – which restrict access to productive inputs and expose poor households to excessive price seasonality – and limited non-agricultural employment opportunities. Contextual social factors that exacerbate vulnerability include genderinequities – severe discrimination against women and girls that results in lower wellbeingoutcomes – and an apparent decline in informal social support systems in recent years,accompanied by rising crime and insecurity.
Finally, any targeted intervention that aims to protect the vulnerable and promote thelivelihoods of the poor requires accurate identification of those who need different typesof assistance, to minimise both inclusion and exclusion errors. Targeting is a major challengefacing all antipoverty programmes. The analysis in this report suggests that monetary measurements of poverty do not allow us to capture, and thereby target, certain types ofpoor households – such as households experiencing vulnerability as a result of changingfamily structure (household size and family breakdown), as well as those including memberswith disabilities. On the other hand, a robust proxy for vulnerability and poverty is female-headed households, especially those caring for orphans. Poor female-headed householdsare poorer than others in terms of income as well as land size and assets owned. Thesehouseholds typically have more orphans than other households and are often on a downward spiral over time, in terms of both actual and perceived wellbeing. These trendsare important for policy because they imply that current poverty status under-estimates theextent and severity of future poverty for these (and other) highly vulnerable households. Fortargeting purposes, this also suggests that subjective understandings of poverty are asimportant as objective measurement, when classifying and responding to vulnerability.
IDS DISCUSSION PAPER 387
61

ReferencesAction Against Hunger (AAH) (2004–5) Malawi Integrated Nutrition and Food SecuritySurveillance: Monthly Reports, Lilongwe: Action Against Hunger
Binswanger, H. and McIntire, J. (1987) ‘Behavioural and Material Determinants ofProduction Relations in Land-abundant Tropical Agriculture’, Economic Development andCultural Change 36.1
Carter, M., Little, P., Tewodaj, Mogues and Workneh, Negatu (2004) Shocks, Sensitivity andResilience: Tracking the Economic Impacts of Environmental Disaster on Assets in Ethiopia andHonduras, University of Manchester: Institute for Development Policy and Management
Chaudhuri, P., Jalan, J. and Suryahadi, A. (2001) ‘Assessing Household Vulnerability toPoverty: Methodology and Application to Indonesia’, mimeo, Columbia University
Devereux, S. (2002) State of Disaster: Causes, Consequences and Policy Lessons from Malawi,Lilongwe: ActionAid Malawi
—— (1999) “Making Less Last Longer”: Informal Safety Nets in Malawi, IDS Discussion Paper373, Brighton: IDS
Devereux, S. and Tiba, Z. (2006) ‘Malawi’s First Famine: 2001–2’, in S. Devereux (ed.), TheNew Famines, London: Routledge
Devereux, S., Chilowa, W., Kadzandira, J. Mvula, P. and Tsoka, M. (2003) Malawi Food CrisisImpact Survey: A Research Report on the Impacts, Coping Behaviours and Formal Responses ToThe Food Crisis in Malawi of 2001/02, Brighton, UK and Lilongwe, Malawi: IDS and Centrefor Social Research
Dorward, A. and Kydd, J. (2002) The Malawi 2002 Food Crisis: The Rural DevelopmentChallenge, Imperial College at Wye: Centre for Development and Poverty Reduction
Ellis, F., Kutengule, M. and Nyasula, A. (2002) Livelihoods and Rural Poverty Reduction inMalawi, Ladder Working Paper, Norwich: University of East Anglia
FAO (undated) Global Livestock and Health Production Atlas, Rome: Food and AgriculturalOrganisation, www.fao.org/AG/againfo/resources/en/glipha/using.html
Filmer, D. and Pritchett, L. (1998) Estimating Wealth Effects Without Expenditure Data – OrTears, World Bank Policy Research Working Paper 1994, Washington, DC: World Bank
Gillespie, S. and Haddad, L. (2004) Reducing Chronic Malnutrition in Malawi: What Role forDFID?, Washington, DC: International Food Policy Research Institute (IFPRI)
Government of Malawi (2002) Malawi Poverty Reduction Strategy Paper, Lilongwe: Ministryof Finance and Economic Planning
—— (2000) Profile of Poverty in Malawi: Poverty Analysis of the Integrated Household Survey1998, Lilongwe: National Economic Council
Government of Malawi and International Food Policy Research Institute (2002) Malawi –An Atlas of Social Statistics, Lilongwe: National Statistical Office
Hoddinott, J. (2005) Vulnerability, Shocks, and Impacts in Ethiopia and Malawi: Implications forPublic Action, Washington, DC: International Food Policy Research Institute (IFPRI)
International Development Committee (IDC) (2003) ‘The Humanitarian Crisis in SouthernAfrica’, Third Report of Session 2002–03, London: House of Commons
Kadzandira, J. (2002) Sources of Risks and Vulnerability for Malawian Households andCommunities, University of Malawi: Centre for Social Research
IDS DISCUSSION PAPER 387
62
Macro-International (1992, 2000, 2004) Malawi Demographic and Health Survey Reports,www.measuredhs.com
Malawi National Vulnerability Assessment Committee (2004) Food Security MonitoringReport, Malawi, Lilongwe: MVAC
National Statistical Office (2002) 2002 Malawi Core Welfare Indicators Questionnaire Survey:Report of Survey Results, Zomba: NSO
Palamuleni, M., Kambewa, P. and Kadzandira, J. (2003) HIV/AIDS and Food Security inMalawi, Lilongwe: World Food Program
Peters, P. (1999) Agricultural Commercialization, Rural Economy and Household Livelihoods,1990–1997, Final Report, Harvard: Harvard Institute for International Development
Phiri, A. (2005a) Vulnerability Analysis of Malawi’s Agricultural Sector, Lilongwe: Bunda Collegeof Agriculture
—— (2005b) Regional Vulnerability Analysis for Malawi: Poverty, Agriculture and NutritionSecurity, Lilongwe: Bunda College of Agriculture
Pritchett, L., Suryahadi, S. and Sumarto, S. (2000) Measuring Vulnerability to Poverty: AProposed Measure with Application to Indonesia, SMERU Working Paper
Ravallion, M. (1996) ‘How Well Can Method Substitute for Data? Five Experiments inPoverty Analysis’, World Bank Research Observer 11.2
Ravallion, M. and Bidani, B. (1994) ‘How Robust is the Poverty Profile?’ World BankEconomic Review 8.1: 75–102
Ravallion, M. and Lokshin, M. (1999) Subjective Economic Welfare, Policy Research WorkingPaper 2106, Washington, DC: World Bank
Rutstein, S. and Johnson, K. (2004) The DHS Wealth Index, DHS Comparative Reports 6,Calverton: ORC Macro
Sabates-Wheeler, R. and Haddad, L. (2005), Reconciling Different Concepts of Risk andVulnerability: A Review of Donor Documents, Brighton: IDS
Seaman, J. and Petty, C. (2005), Understanding the Impact of HIV/AIDS on HouseholdEconomy, www.ifpri.org/events/conferences/2005/durban/papers/seamanWP.pdf
Shah (2002) The Impact of HIV/AIDS on Agricultural Production Systems and Rural Livelihoods inthe Central Region of Malawi, Lilongwe: CARE
Sharma, M. and Yohannes, Y. (2005) Vulnerability, Shocks, and their Consequences onHousehold Expenditure and Asset Levels in Malawi, Washington, DC: IFPRI
Sharma, M., Tsoka, M., Payongayong, E. and Benson, T. (2002), Analysis of Poverty Dynamicsin Malawi with an Assessment of the Impact of ADMARC on Household Welfare, Washington,DC: IFPRI
Subbarao, K. and Smith, J. (2003) What Role for Safety Nets in Low-Income Countries?, SocialSafety Net Primer Series No. 1, Washington, DC: World Bank
TANGO International (2004a) Theme Paper I: Underlying Causes of Livelihood Vulnerability andInsecurity in Malawi, Lilongwe: CARE
—— (2004b) Theme Paper II: Social Protection in Malawi, Lilongwe: CARE
—— (2004c) Theme Paper IV: Gender Exploitation in Malawi, Lilongwe: CARE
Tiba, Z. (2005) ‘A New Type of Famine With Traditional Response: The Case of Malawi,2001–2003’, unpublished PhD thesis, London: School of Oriental and African Studies,University of London
IDS DISCUSSION PAPER 387
63

van Donge, J., Chivwaile, M., Kasapila, W., Kapondamgaga, P., Mgemezulu, O., Sangore, N.and Thawani, E. (2001) A Qualitative Study of Markets and Livelihood Security in Rural Malawi,An evaluation study commissioned for the Ministry of Agriculture and Irrigation of theGovernment of Malawi, Lilongwe: DFID Malawi
Wobst, P., Lofgren, H., Tchale, H. and Morrison, J. (2004) Pro-poor Development Strategiesfor Malawi: An Economy-wide Analysis of Alternative Policy Scenarios, London: Imperial CollegeLondon
World Bank (2006) Malawi Poverty and Vulnerability Assessment 2005, Washington, DC:World Bank
World Health Organisation (WHO) (2001) World Health Chart 2001,www.whc.ki.se/files/basicinfo.ph
IDS DISCUSSION PAPER 387
64

Annex tables
Table 13 Language groups in Malawi
Table 14 Property tenure systems in Malawi
IDS DISCUSSION PAPER 387
65
Category Languages Comments
1.
2.
3.
4.
Chewa and Nyanja, Yao, Lomwe,English
Tumbuka, Tonga,Ngoni, English
Lambya, Nyakyusa,Sukwa, Nkhonde,Senga, Sena, other
English
These are the largest groupings in the country, withChewa and Nyanja mainly in Central Region, and Yaoin Balaka, Mangochi, Machinga and part of Zomba,while Lomwe is spoken in Thyolo, Chiradzulu andMulanje. These groupings largely determine the currentpolitical environment in Malawi.
These are all languages in the North, with Tumbuka asthe main grouping (mainly Mzimba and Rumphi districts),with Ngoni part of the minority in Mzimba district.
These are minority groupings (Lambya, Nyakyusa,Sukwa, all in Chitipa district) Nkhonde in Karonga,Senga in Mchinji and Sena in the Lower Shire (Nsanjeand Chikwawa districts).
It is difficult to place this category. But although a minority group, it should not be excluded, as thesebecome influential people in the community.
Category Districts
1. Patrilineal
2. Matrilineal
3. Mixed
Mzimba, Rumphi, Nkhata bay, Chitipa, Karonga, and Likoma are theonly clear patrilineal districts. Ntcheu, Chikwawa, Nsanje and Mchinjiare mixed but they lean more towards patrilineal.
Zomba, Machinga, Balaka, Mangochi, Mulanje, Thyolo, Chiradzulu,Phalombe. These are typical matrilineal districts, where the man movesand follows the wife. Land ownership is through the wife. This isknown as Chikamwini.
Dedza, Nkhotakota, Blantyre, Mulanje, Thyolo, Chiradzulu, Salima,Lilongwe, Dowa, Ntchisi, Kasungu, Mwanza. Most of these districts arematrilineal but men may take their wife to their village through a system known locally as Chitengwa, which means that land is obtainedthrough the man. There are also pockets of Chikamwini; hence theseare mixed districts.
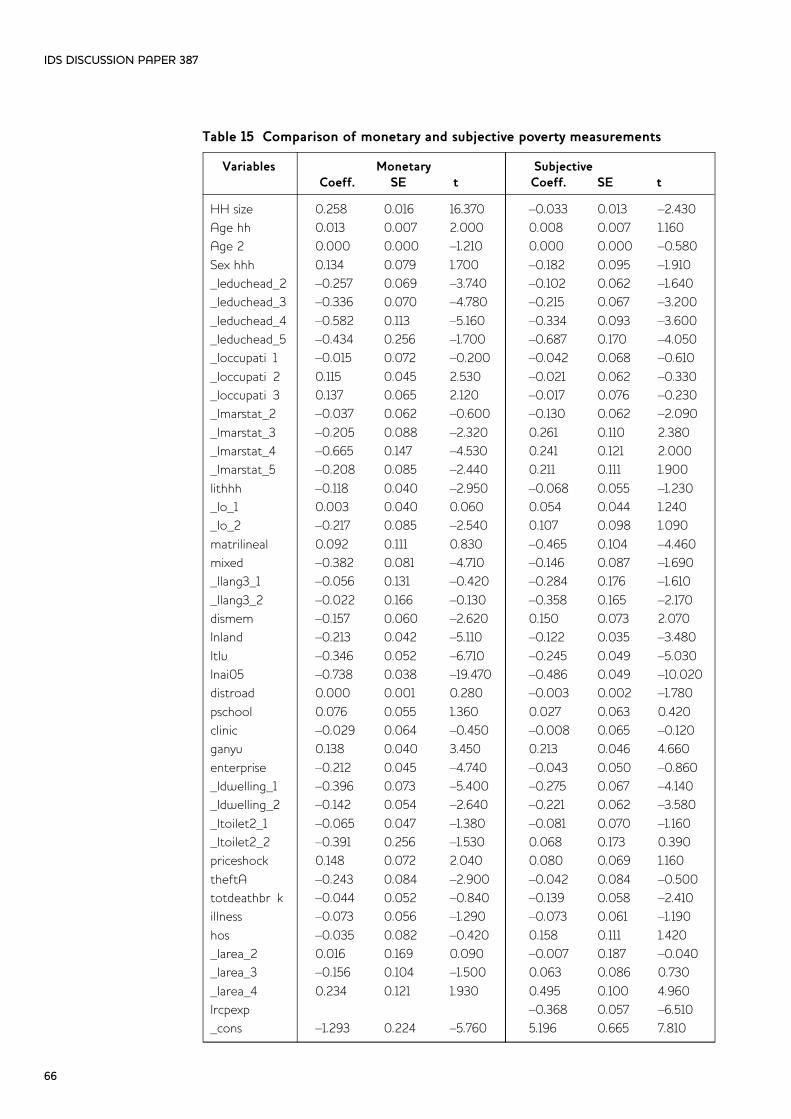
Table 15 Comparison of monetary and subjective poverty measurements
IDS DISCUSSION PAPER 387
66
Variables Monetary SubjectiveCoeff. SE t Coeff. SE t
HH size 0.258 0.016 16.370 –0.033 0.013 –2.430Age hh 0.013 0.007 2.000 0.008 0.007 1.160Age 2 0.000 0.000 –1.210 0.000 0.000 –0.580Sex hhh 0.134 0.079 1.700 –0.182 0.095 –1.910_Ieduchead_2 –0.257 0.069 –3.740 –0.102 0.062 –1.640_Ieduchead_3 –0.336 0.070 –4.780 –0.215 0.067 –3.200_Ieduchead_4 –0.582 0.113 –5.160 –0.334 0.093 –3.600_Ieduchead_5 –0.434 0.256 –1.700 –0.687 0.170 –4.050_Ioccupati~1 –0.015 0.072 –0.200 –0.042 0.068 –0.610_Ioccupati~2 0.115 0.045 2.530 –0.021 0.062 –0.330_Ioccupati~3 0.137 0.065 2.120 –0.017 0.076 –0.230_Imarstat_2 –0.037 0.062 –0.600 –0.130 0.062 –2.090_Imarstat_3 –0.205 0.088 –2.320 0.261 0.110 2.380_Imarstat_4 –0.665 0.147 –4.530 0.241 0.121 2.000_Imarstat_5 –0.208 0.085 –2.440 0.211 0.111 1.900lithhh –0.118 0.040 –2.950 –0.068 0.055 –1.230_Io_1 0.003 0.040 0.060 0.054 0.044 1.240_Io_2 –0.217 0.085 –2.540 0.107 0.098 1.090matrilineal 0.092 0.111 0.830 –0.465 0.104 –4.460mixed –0.382 0.081 –4.710 –0.146 0.087 –1.690_Ilang3_1 –0.056 0.131 –0.420 –0.284 0.176 –1.610_Ilang3_2 –0.022 0.166 –0.130 –0.358 0.165 –2.170dismem –0.157 0.060 –2.620 0.150 0.073 2.070lnland –0.213 0.042 –5.110 –0.122 0.035 –3.480ltlu –0.346 0.052 –6.710 –0.245 0.049 –5.030lnai05 –0.738 0.038 –19.470 –0.486 0.049 –10.020distroad 0.000 0.001 0.280 –0.003 0.002 –1.780pschool 0.076 0.055 1.360 0.027 0.063 0.420clinic –0.029 0.064 –0.450 –0.008 0.065 –0.120ganyu 0.138 0.040 3.450 0.213 0.046 4.660enterprise –0.212 0.045 –4.740 –0.043 0.050 –0.860_Idwelling_1 –0.396 0.073 –5.400 –0.275 0.067 –4.140_Idwelling_2 –0.142 0.054 –2.640 –0.221 0.062 –3.580_Itoilet2_1 –0.065 0.047 –1.380 –0.081 0.070 –1.160_Itoilet2_2 –0.391 0.256 –1.530 0.068 0.173 0.390priceshock 0.148 0.072 2.040 0.080 0.069 1.160theftA –0.243 0.084 –2.900 –0.042 0.084 –0.500totdeathbr~k –0.044 0.052 –0.840 –0.139 0.058 –2.410illness –0.073 0.056 –1.290 –0.073 0.061 –1.190hos –0.035 0.082 –0.420 0.158 0.111 1.420_Iarea_2 0.016 0.169 0.090 –0.007 0.187 –0.040_Iarea_3 –0.156 0.104 –1.500 0.063 0.086 0.730_Iarea_4 0.234 0.121 1.930 0.495 0.100 4.960lrcpexp –0.368 0.057 –6.510_cons –1.293 0.224 –5.760 5.196 0.665 7.810
Section 2
Review of Social ProtectionInstruments in Malawi
IDS DISCUSSION PAPER 387
67

IDS DISCUSSION PAPER 387
68
Contents1 Overview 71
1.1 Scope of this review 71
1.2 Issues arising 72
1.3 Structure of this review 73
2 Productivity-enhancing safety nets 74
2.1 Free inputs distribution 74
2.2 Fertiliser subsidies 76
2.3 Public works programmes 77
2.4 Social funds 79
3 Direct welfare transfers 81
3.1 Food aid 81
3.2 School feeding programmes 82
3.3 Unconditional cash transfers 84
3.4 Conditional cash transfers 85
4 Summary and conclusions 88
4.1 Productivity-enhancing safety nets 88
4.2 Direct welfare transfers 89
References 91
Annex 1 Vulnerabilities and social protection responses 98
IDS DISCUSSION PAPER 387
69

IDS DISCUSSION PAPER 387
70

1 OverviewA striking feature of social protection in Malawi is how many different programmes andpolicies have been implemented in recent years, yet the evidence that vulnerability is risingrather than falling suggests that these interventions are not adding up. The purpose of thisdesk review is to synthesise current thinking and available evidence on the relative effectiveness of various types of social protection interventions, and to examine theachievements of programmes actually implemented in Malawi. This paper combines areview of comparative international experiences and findings from evaluations in Malawi.The objective is to contribute to an informed debate on developing an optimal package ofsocial protection measures for vulnerable Malawians.
1.1 Scope of this review
Although the terms ‘safety nets’ and ‘social protection’ are often used interchangeably,social protection is broader than safety nets, and covers at least three broad areas of intervention. Several types of ‘productivity-enhancing safety nets’ and ‘direct welfare transfers’ are examined in the main sections of this review. Annex 1 shows how theseinterventions address different types of vulnerability, such as idiosyncratic or covariateshocks, chronic poverty, and market failures.
l Productivity-enhancing safety nets: These interventions are targeted at economically active people who face constrained access to assets, inputs and/or markets, due to poverty or market failures. Often these programmes have multiple objectives: to transfer resources to poor or vulnerable individuals or households (a welfarist objective), and simultaneously to build individual, household or community assets. In Malawi, examples include: fertiliser subsidies; free inputs distribution (fertiliser and seeds); public works programmes (food-, cash- or inputs-for-work) and social funds( M A S A F ) .
l Direct welfare transfers: Direct transfers of food or cash range from short-term relief to institutionalised social security systems. The main objective of humanitarian relief interventions is to smooth consumption after a large-scale livelihood shock (such as a drought) that threatens lives and exceeds the ability of affected households and communities to cope. Typically, as in Malawi in 2002/3, humanitarian assistance is dominated by emergency food aid – general food distribution, plus supplementary feeding and therapeutic feeding – followed by rehabilitation programmes. In non-emergency contexts, school feeding programmes are a form of project food aid that could also be described as ‘productivity-enhancing’, since they provide nutritional support to children but also promote access to education. Similarly, conditional cash transfers link the provision of resources to poor households with their utilisation of education and health services. Finally, unconditional cash transfers include social pensions, disability grants, or orphan carer grants.
l Market interventions: A third category of instruments that have social protection aims are open market operations, such as: strategic grain reserve management (buying grain after the harvest and releasing it onto the market, to dampen price rises before the next harvest); and food price banding (stabilising grain prices between a floor price forproducers and a ceiling price for consumers). Both of these instruments have been important in Malawi in the past, but price banding was phased out in the 1990s and the Strategic Grain Reserve now fulfils only a nominal buffer stock role, following itscatastrophic mismanagement during the 2001/2 food crisis. Market interventions might be an important tool in the package of social protection interventions in Malawi in the future, but these instruments are not examined in detail in this r e v i e w .
IDS DISCUSSION PAPER 387
71

1.2 Issues arising
There are a number of unresolved issues in the design and implementation of social protection programmes, most of which also preoccupy policy-makers in Malawi. Some ofthese issues are briefly discussed here.
l Poverty reduction or poverty alleviation?‘Productivity-enhancing safety nets’ aim to contribute to sustainable poverty reduction,both directly through raising incomes but mainly indirectly, through generatingincome (or raising food production), or building productive assets that in turn will generate further income. Sometimes this impact is immediate and measurable, aswith public works projects that build infrastructure (such as roads) that reduces transactions costs and integrates markets. At other times the ‘productive’ impact isvery long-term and indirect, as with school feeding schemes that build on evidence oflifetime returns to education in terms of the learners’ employment prospects andincome-earning potential. Some programmes, e.g. the Productive Safety NetProgramme (PSNP) in Ethiopia, combine two ambitious objectives: to provide incometransfers to several million chronically food insecure Ethiopians in the short-term, andto reduce their dependence on social assistance (either food or cash transfers) in thelong-term. After 5 years, PSNP beneficiaries are expected to ‘graduate’ out of povertyand dependence on external support, except during emergencies.
‘Welfare assistance’ and ‘disaster management’ focus more on poverty alleviation, bybridging a consumption deficit with food or cash transfers. In the case of disasters,this is usually for a short period of time only (e.g. until the next harvest in drought-affected farming communities). Welfare assistance, however, is provided to some vulnerable groups for their entire lifetimes (e.g. people with severe disabilities), or fora life-cycle phase that can last for many years (e.g. social pensions which citizens areentitled to receive from their 60th birthday until their death). In most Western countries, social welfare systems provide institutionalised, regular support of variouskinds to such vulnerable groups as a ‘citizenship entitlement’ – there is no expectationthat this will reduce beneficiaries’ poverty sustainably, avoid dependence, or contributeto economic growth.
l Multiple objectives = multiple success or multiple failure?Sometimes programmes that are initiated with one set of objectives become broadened or diverted to meet other objectives instead of (or as well as) the primaryobjective. In Malawi, for instance, emergency food aid programmes have been motivated as a response to HIV and AIDS. ‘Starter Packs’ were initiated as a droughtrelief intervention, but continued in subsequent years on the basis that agricultural liberalisation had undermined farmers’ access to farm inputs – so a disaster recoveryprogramme became a productivity-enhancing intervention and a compensation formarket failure. Public works programmes in Malawi aim to strengthen householdfood security, but also to build community assets and promote gender equity. The riskwith multiple objectives in a single intervention is that they often contradict eachother in practice, and it might be more advisable to focus on achieving one objectivewell, rather than partially achieving two or three.
l What’s the driver: Instruments or objectives?Too much of the social protection debate at present is driven by interests representingavailable instruments, instead of being grounded in a rigorous, disaggregated, participatory assessment of problems faced by different categories of vulnerable people, and the design of appropriate interventions to address this range of needs.For instance, safety nets in Africa have been dominated for decades by the availabilityof American and European food aid. In the last few years, the appropriateness offood aid in meeting (especially) non-emergency social protection needs has beenquestioned, and recently a bandwagon has been building around unconditional cashtransfers, which is in direct conflict with the food aid lobby. This is unhelpful: a better
IDS DISCUSSION PAPER 387
72

way to design social protection programmes is to identify who needs what type ofassistance, when, where and why, and then to address these needs with interventionstailored to these needs. In the late 1990s, UNDP developed a methodology for linking‘sustainable livelihoods’ thinking to processes of decentralisation in Africa. this wascalled ‘PAPSL’ – Participatory Analysis and Planning for Sustainable Livelihoods’ – andit was piloted in Malawi. This kind of approach, where communities identify whoneeds external support and what type of support is most appropriate, could provide amodel for assessing and prioritising social protection needs, by putting the objectivesahead of the available instruments.
l Projectised or institutionalised?A danger with many safety net interventions is that they are stand-alone ‘flagship’projects, often designed and funded by bilateral or multilateral donors, and run byinternational NGOs, that create islands of social protection in oceans of vulnerability.Even if these projects are successful if evaluated on their own terms, they typicallyhave limited impact beyond their defined target group of beneficiaries, and they areusually time-bound rather than permanent. Social protection must not be ‘projectised’,it must be institutionalised; it must not be donor-driven, it must be government-owned (though donor financing may be required in very poor countries like Malawi);and it must not be seen as ‘charity’ or ‘welfare’, but ultimately as a right of citizenship.
1.3 Structure of this review
This desk review is organised around the two broad categories of social protection interventions identified above. Chapter 2 discusses instruments that aim simultaneously toprotect and promote livelihoods, under the title ‘productivity-enhancing safety nets’.Chapter 3 discusses instruments that aim simply to protect lives and livelihoods, under thetitle ‘direct welfare transfers’. Chapter 4 concludes by drawing lessons on alternative socialprotection instruments, from the experiences reviewed both in Malawi and internationally.
IDS DISCUSSION PAPER 387
73
2 Productivity-enhancing safety nets
This section reviews experiences with free inputs distribution, including Malawi’s ‘StarterPack’ programmes; fertiliser subsidies; public works programmes; and ‘social funds’, specifically the Malawi Social Action Fund (MASAF).
2.1 Free inputs distribution
The distribution of fertiliser and seeds for free is, in effect, a 100 per cent subsidy of agricultural inputs to economically active farmers, designed to enhance household foodsecurity through boosting food production. Fertiliser and seeds have been handed out forfree to Malawian farmers almost every year, since 1993. The first distribution followed thesouthern African drought of 1992, when the Drought Recovery Inputs Programme (‘DRIP’)provided inputs to farmers whose seeds had been lost or consumed during the previousyear. This was followed in 1995/6 by the Supplementary Inputs Programme (‘SIP’), whichattempted to restore access to inputs for farmers who could not afford the high fertiliserprices that followed heavy devaluations of the Kwacha, and the removal of fertiliser subsidies (the Fertiliser Subsidy Removal Programme (FSRP) started in 1987 and was completed in 1995).
The ‘Starter Pack’ programme started in 1998, as a large-scale intervention that aimed tosupport both household and national food security, through subsidising maize production.The rationale was that it is more cost-effective to subsidise food production before theharvest, with free inputs distribution, than food consumption after the harvest, with freefood distribution. The Starter Pack included enough fertiliser, maize seed and legume seedsfor 0.1 hectares, and it was distributed to all smallholders in Malawi. Farmers were able toproduce 100–150kg of additional maize per pack (Levy 2005a) – not enough for nationalself-sufficiency, but enough to close the food gap substantially. Malawi had an annual maizedeficit of 500,000–600,000 tonnes in the early 2000s, and universal distribution ofStarter Packs to 2.8 million beneficiaries produced 280,000–400,000 additional tonnes ofmaize each year (Levy 2005b).
Levy et al (2004) argue that the key issue for food security in Malawi is not self-sufficiency,but the price of maize, which is a key determinant of access to food. Starter Packs not onlyincreased maize production and market supplies, but also reduced the demand for maizefrom smallholders who are market-dependent for part of the year, and kept the price ofmaize relatively low in the hungry season. When the programme was scaled down after2000, it contributed only 3–4 per cent of total smallholder production, compared with 16per cent in 1999/2000. This decline, Levy (2005b) argues, contributed to the sharp rises inthe price of maize, from MK10/kg in October 2001 to MK44/kg in March 2002, that precipitated a major food crisis.
After 2000, the Starter Pack programme was scaled down from an untargeted national foodsecurity programme to a poverty-targeted safety net, but the Targeted Inputs Programme(TIP) faced significant problems with beneficiary identification and selection. Communityselection was the preferred targeting methodology, but Chinsinga et al (2002) found thatbeneficiaries selected were spread across all wealth categories (measured by income andassets), with only a slight preference for the extremely food insecure. Communities proved tobe very resistant to the idea of targeting, showing a reluctance to exclude any communitymembers that has been reported from other African countries (Hoddinott 1999). In manycommunities, Starter Packs were evenly divided among all households, while in other cases‘elite capture’ meant that most of these packs were diverted to the most powerful families.
Critics argue that Starter Packs achieved neither the objective of national food security normore sustainable agriculture in Malawi. Barahona and Cromwell (2005) argue that the latter
IDS DISCUSSION PAPER 387
74
failure is due to: (1) funding being constantly renegotiated, leading to an inability to purchasequality seed in advance; (2) fertiliser and seed that are inappropriate to local cropping patterns; (3) the failure to reach a ‘critical mass’ and (4) the short-term nature of the intervention. Garforth (2005) and Ashley and Maxwell (2001) also highlight problems ofimplementation, particularly in communicating the relevant agricultural extension messages.One further objection to Starter Packs is that they could crowd out private supplies ofinputs and inhibit market development. (For this reason, the World Bank and other agencies consistently resisted free inputs distribution in Malawi.) Nyirongo (2005) arguesthat this is not the case for fertiliser, since similar proportions of Starter Pack beneficiariesand non-beneficiaries bought fertiliser in each year, and is only partially the case for seeds,which were purchased by 15 per cent of beneficiaries but 24 per cent of non-beneficiaries in2003. Though farmers do recognise the need to address declining soil fertility (van Donge2005), few households buy inputs because: (1) the end of subsidies raised the cost of fertiliser to three times that of neighbouring landlocked countries; (2) fertiliser is only available in 50kg bags, which are too large; (3) almost no smallholders have access to creditfor inputs and (4) seeds are often unavailable.
Nevertheless, Levy (2005c) argues that Starter Packs implemented on a universal scale (atan estimated fixed cost of US$20m for 2.8 million households) can have a significantimpact, and compares very favourably in terms of cost and macro-economic effects withother food security measures. Some 80 per cent of the cost of (untargeted) Starter Packsgoes to beneficiaries in the form of inputs. Equivalent imports would cost US$70–100m peryear and create inflationary pressure through exchange rate depreciation (which was 66 percent in the period between August 2001 and August 2003). Targeted food aid would costUS$100m per year; general fertiliser subsidies would cost US$20m but are not guaranteedto benefit the poorest; and safety nets providing MK2,000 per month to 30 per cent ofhouseholds for 5 months would cost US$107m. Levy concludes that the Starter Pack isboth a lower risk and more cost-effective strategy.
There remains the problem, however, that without targeting, Starter Packs benefit onlythose with sufficient land and labour to maximise the potential of the pack. An evaluationof the 1998/9 (universal) scheme found that households that were wealthier, had moreland and more members received more packs, and that these households tended to produce higher outputs and yields (Longley et al 1999). The same evaluation concluded that for those households without sufficient land and labour, an ‘alternative form of safety net’ was needed. Interestingly, only 20 per cent of farmers interviewed reportedthat they would pay the actual cost (MK450) for a Starter Pack (Longley et al 1 9 9 9 ) .Moreover, when 1,000 ‘flexi-vouchers’ were offered that could be redeemed either forthe Starter Pack or for goods worth MK450 (the same cost as a Starter Pack), 56 percent of these vouchers were redeemed for goods. Both these findings suggest thatStarter Packs did not address the priority needs of poor farmers in Malawi (Harnett andCromwell 2000).
Seeds-and-tools programmes are less popular in Malawi than in other African countries. In2003, however, Concern Worldwide ran a seed exchange programme, using a revolvingcredit system, in four districts of Malawi, and also established 4,000 village grain banks(Kambewa 2005). A summary of evaluations of seeds-and-tools programmes concludedthat seed distribution projects ‘have fewer positive impacts than anticipated [and] can actually decrease seed system stability and varietal diversity, while bringing with them a setof unintended negative impacts on the social and political economy of recipient communities’ (Longley and Sperling 2002). For example, a review of ‘seed aid’ programmesby Sperling et al (2004) found evidence that repeated deliveries of free seeds in contexts ofchronic stress distorts farmers’ own seed procurement strategies (including in the case ofMalawi’s Starter Pack programme), undermines the functioning of local seed and grainmarkets (e.g. in Burundi) and compromises the development of commercial seed supply systems (e.g. in Zimbabwe). In contexts where maize is an important commercial crop andcommercial maize is dominant in the seed market, as in Malawi, free seed systemsinevitably interfere with commercial maize and seed markets.
IDS DISCUSSION PAPER 387
75

Several studies reach similar conclusions: (1) that the free distribution of agricultural inputs –seeds, tools, fertiliser – share an assumption that these inputs are unavailable on local markets, which is often not true; (2) that local inputs markets should be supported, notundermined; (3) that seed vouchers and fairs may be more effective in stimulating localmarkets; (4) that if constrained access to inputs is caused by ‘unaffordability’ then the realproblem is poverty, not unavailability of inputs, so poverty is the underlying problem thatshould be addressed (Sperling et al 2004). Vouchers or cash transfers could improve accessto inputs and stimulate the market, which is preferable to undermining the private sectorwith free inputs distribution.
2.2 Fertiliser subsidies
The arguments for subsidising fertiliser are analogous to those for distributing fertilisers forfree. Boosting production enhances household and national food security, in economiesdominated by smallholder agriculture. Where markets are weak and poverty is widespread,subsidising inputs increases their uptake, raising yields and reducing the need for food aid.Under the Banda regime in Malawi, a general fertiliser subsidy was one component in a setof policies designed to ensure maize production self-sufficiency among the smallholder sub-sector, and to maximise foreign exchange earnings from cash crop exports by theestate sub-sector. In the 1980s, however, the fertiliser subsidy was declared fiscally unsustainable by the international financial institutions, and was phased out under structuraladjustment conditionalities by the mid-1990s. Another argument against fertiliser subsidiesin Malawi is that they are regressive, being captured disproportionately by wealthier farmers – even Starter Packs targeted at the poor were sold to the estates or across theborder into Zambia, where prices are higher. This implies that removing fertiliser subsidieshad relatively little impact on the poor, and the reality of Malawi’s ‘porous borders’ meansthat the income transfer effects of any general price subsidy are unlikely to be retainedwithin the country.
Crawford et al (2005) identify three arguments in favour of fertiliser subsidies: (1) increasedagricultural output and incomes; (2) economic benefits by kick-starting innovation or correcting for market failures and (3) non-economic benefits such as food security, socialprotection, and the restoration of soil fertility. This last argument is endorsed by Sachs(2003), who argues that fertiliser subsidies are cheaper than food aid (though this assumesthat subsidies are pro-poor). In the context of Malawi, the first and second arguments aredisputed by Govindan and Babu (2001), whose modelling exercise finds that the removal ofthe 25 per cent fertiliser price subsidy led to only a 1 per cent reduction in aggregate maizeoutput, and a 5 per cent and 7 per cent reduction in demand for labour and fertiliserrespectively. Earlier, Sahn and Arulpragasam (1991) had found that implementation of theFertiliser Subsidy Removal Programme (which commenced in 1987) was associated withincreased fertiliser prices but also an increase in fertiliser uptake by smallholders, suggestingthat the major constraint on fertiliser uptake in Malawi is not its price, but its availability onthe market.
This evidence is disputed by other studies, and by agencies that believe the abolition of fertiliser subsidies and the collapse of smallholder agricultural credit schemes resulted in adecline in fertiliser utilisation, and hence in maize yields, in Malawi’s smallholder sub-sector. Peters (1999) finds that fertiliser price increases resulted in smallholders applying less fertiliser than they used to (and would like to) apply. Together with several devaluations of the Malawi Kwacha – by 62 per cent in 1998 alone – the average price of a bag of Urea increased by over 400 per cent, from MK400 to MK1,700 per bag, between 1997 and 2003. In a PRA survey conducted in 12 villages across Malawi in 1998,constrained access to agricultural inputs, especially chemical fertilisers, was mentioned asone of the gravest problems faced by farmers (Devereux 1999). The Starter Pack was oneresponse to this market failure, but free distribution of inputs was, as noted above, controversial and unpopular with many of the Government of Malawi’s development p a r t n e r s .
IDS DISCUSSION PAPER 387
76

Another non-market method of transferring agricultural inputs to poor farmers is inputs-for-work projects. Instead of distributing inputs for free, inputs-for-work makes access tofertiliser and seeds conditional on meeting a work requirement. In 2001, an NGO(Emmanuel International) implemented a pilot inputs-for-work project in two districts ofMalawi. Rural access roads were constructed by a total of 20,000 participants, who werepaid with inputs (50kg of urea and 10kg of hybrid maize seed) rather than cash wages orfood rations. These inputs were enough to produce an extra 450kg of maize, or 5 monthsstaple food consumption for an average family. Inputs were transferred either directly or inthe form of vouchers redeemable at local stores. To minimise ‘exclusion errors’ due to theinability of labour-constrained individuals (such as the elderly or chronically ill) to provideheavy manual labour, up to 5 per cent of beneficiaries in each community were ‘seriouslydisadvantaged people’, who were identified by community members to receive fertiliserand seed without having to work. According to one evaluation, payment with inputs wasmore popular with project participants than payment in food or cash. The total cost of theproject was US$744,900, while the estimated benefits for the 20,000 beneficiaries included the construction of 250km of roads, and production of 9,000 tonnes of maize,worth US$1.8 million (Carr 2002).
2.3 Public works programmes
Public works programmes refer to ‘activities which entail the payment of a wage in returnfor the provision of labour, in order to (i) enhance employment and (ii) produce an asset,with the overall objective of promoting social protection’ (SALDRU 2005). Public works arepopular with policy-makers because they offer the potential of simultaneously creating useful assets and transferring food or income to the poor, while being self-targeting,avoiding dependency and minimising ‘leakages’ to the non-poor, because of the workrequirement. In Malawi, a wide range of public works programmes – food-for-work, cash-for-work, and inputs-for-work – have been implemented by the government, donors andNGOs since the early 1990s, with the objective of providing an employment-based safetynet for households facing chronic or transitory food shortage. In terms of social protectionobjectives, well-timed public works employment can smooth incomes and consumption incontexts where seasonal under-employment is a severe constraint on livelihoods. Recentpublic works activities in Malawi include (Kambewa 2005):
l Food-for-work: Following the food crises of 2001–3, the Joint Emergency Food Assistance Programme II (JEFAP II) and the Consortium for Southern Africa Food Security Emergency Programme (C-SAFE) implemented road rehabilitation projects, cassava planting for hunger mitigation, reforestation, fishpond construction and manure production, with support from the World Food Programme (WFP) and USAID’s Food for Peace Programme.
l Cash-for-work: Under a European Union-funded Public Works Programme, the Government of Malawi implements labour-intensive food security projects, constructionand rehabilitation of rural feeder roads and transport infrastructure, and planting of community woodlots. Under the Malawi Social Action Fund (MASAF) Public Works Programme, various cash-for-work projects are implemented through Local AuthorityManaged Projects (LAMPs), including: ‘Improvement of Livelihood through Public Works Programmes’ (funded by DFID), the ‘Emergency Drought Relief Programme’, and ‘Relief Cash for Works Programme’ (funded by the Government of Malawi). Mostactivities are in road rehabilitation (80 per cent of projects), followed by afforestation,water (flood control) and agriculture. In 2003/4, almost 95,000 workers – equal numbers of men and women – were employed on MASAF cash-for-work projects.
l Inputs-for-work: Small-scale activities have been initiated in Malawi, most recently a project called ‘Sustaining Productive Livelihoods Through Income for Assets’ (SUPLIFA),funded by DFID, on which workers received 50kg of urea and 10kg of maize seed after 20 days of work.
IDS DISCUSSION PAPER 387
77
Public works often have gender equity objectives. MASAF public works projects operate infood deficit rural areas of Malawi, and target women and female-headed households, ‘sincefemale-headed households make up a disproportionate share of the poorest’ (MASAF 1996:16). On its food-for-work projects, WFP purposely selects projects that either attract alarge proportion of women workers or create assets that benefit women directly – such ascommunity woodlots and water-points that reduce women’s firewood and water collectiontime (Cammack 1996). Critics have questioned the implications for women’s workloads ofrequiring them to undertake heavy manual labour, and note that this also excludes severalhighly vulnerable groups – orphans, the elderly, PLWHA. Other forms of social protectionare needed for the labour-constrained poor.
Expanded public works programmes were advocated by the World Bank – which led thedesign team – as the main platform of Malawi’s National Safety Net Programme (NSNP) in1999: ‘some form of labour-intensive public works program is the most likely solution, perhaps supplemented by limited feeding or cash transfer schemes for those unable towork’ (Smith 1999: 6). However, concerns were raised about whether public works couldbe scaled up to the extent envisaged, especially in terms of the administrative and management capacities required (Gsänger 2000).
Unfortunately, there is little cross-country evidence that public works projects can producehigh quality, useful, pro-poor and durable assets that contribute to sustainable povertyreduction. Few evaluations have attempted to quantify the economic returns to assets created by public works, but McCord (2005) maintains that the value of public works assetsintended to promote economic growth in Malawi ‘is less apparent’ than the value of assetscreated in response to specific environmental threats, as in Bangladesh. It is widely acceptedthat community involvement in project design is crucial to the identification of assets thatare appropriate and need community priorities, but ‘elite capture’ is always a danger, whilegenuine participatory processes raise programme costs and timeframes in situations wheretime is often a constraint.
Moreover, McCord (2005) finds that in the Malawian context of chronic poverty and seasonalunder-employment, public works programmes are ‘a serious mismatch between problemand policy response’. In particular, setting public works wages below the minimum wage –or below the ganyu daily rate, in Malawi’s case – to encourage self-targeting is unlikely tohave a positive impact on poverty (McCord 2004). Because of the time commitment andheavy manual labour involved, public works employment has significant opportunity costs –Lipton (1998) estimates 20–30 per cent in terms of lost income in South Asian programmes,and Maxwell (1993) estimates a direct participation cost of 1,000 calories per day. Thesecosts reduce the net value of income earned on public works programmes. In Botswana,where workers on the rural labour-based roads programme earned just 50 per cent of theminimum wage, this low payment ‘contributed to the marginalisation and social exclusionof those employed’ (Mayer and Kayira 1997). In Malawi, the low wages paid on MASAF’spublic works caused workers to leave the project (MASAF 2004).
The level and mode of payment are problematic issues in the design of public works projects.While low payment levels are stigmatising and have limited impact on poverty and foodinsecurity, higher wages or rations reduce targeting accuracy by attracting the non-poor(Subbarao et al 1996). Where a food surplus is available, payment in cash is preferable tofood because it is cheaper to administer – 40 per cent cheaper on public works in Ethiopia– and has multiplier effects on the local economy (Devereux 2002), but in areas of foodshortage, a combination may be optimal for social protection outcomes (SALDRU 2005). InMalawi, a survey of public works participants found that their payment preferences variedby season, gender and location. Payment was preferred in cash around harvest time, inagricultural inputs (fertiliser and seeds) around planting time, and in maize during the hungryseason (Zgovu et al 1998). Women and households living far from markets generally favouredfood rations, while men and households near urban centres generally preferred cash wages.
In a comparison of the cost-effectiveness of alternative social protection interventions inMalawi, Smith (2001) calculated a unit cost of 13.9 Kwacha to transfer 1 Kwacha to the
IDS DISCUSSION PAPER 387
78

poorest through MASAF public works projects – significantly more than the 1.73 Kwacharequired to transfer 1 Kwacha in the form of cash transfers. On the other hand, Haddadand Adato (2001) found that 4.31 Rands were required to transfer 1 Rand to the poor onpublic works projects in South Africa (including the indirect benefits of assets); comparedwith 6.58 Rand for untargeted cash transfers. Bloom et al (2005) find that 48.6 per cent ofthe US$12.8m disbursed by MASAF between 1996 and 2001 went on unskilled wages.Subbarao et al (1997) concur that a low proportion of public works budgets is typically spenton wages (30–60 per cent), ‘with the rest being consumed in material and managementcosts’, a consideration that leads the World Bank (2001) to conclude that ‘workfare programmes are not necessarily an inexpensive way of delivering benefits to poor people’.SALDRU (2005) makes a similar point, emphasising the high cost of transferring incomethrough public works (40–70 per cent) relative to cash grants (10–40 per cent), arguing thatpublic works may be highly inefficient unless the assets created have a high socioeconomicvalue, and concluding that ‘there is not an evidence base in [southern Africa] which endorses public works as an effective social protection instrument’.
2.4 Social funds
Social Funds are agencies that finance small projects in several sectors, targeted to benefita country’s poor and vulnerable groups. Ideas for projects are generated in a participatorymanner by communities and screened against a set of eligibility criteria (Jorgensen and vanDomelen 1999). Social Funds such as the Malawi Social Action Fund (MASAF) support theoverarching goal of poverty reduction by implementing community projects in three areas:broad-based economic growth, investment in human capital, and social safety nets for vulnerable groups. MASAF was set up in July 1995, as one component of the then recentlyelected UDF government’s ‘Poverty Alleviation Programme’, with financing from the WorldBank (US$56 million in its first 5-year phase). MASAF had four elements – public worksprojects, investment in village-level infrastructure, community empowerment, and povertymonitoring (MASAF 1996).
Although Social Funds are demand-led and participatory in theory, the evidence on this ismixed. Van Domelen (2002) concludes that in general, the activities financed by SocialFunds are usually among the community’s top priorities, and the World Bank (2002a) findsthat people are generally satisfied with projects. However, another review of the literatureconcluded that only a minority of Social Funds are demand-led in practice, that the technicalrequirements of a demand-driven process may create a bias against the most disadvantagedcommunities, and that intermediaries rarely act disinterestedly (de Haan et al 2002). Bloomet al (2005) note that traditional leaders play a very influential role in MASAF activities.Carvalho et al (2002) point out that applications for project funding have to be made by educated persons of social standing in the community, which inevitably biases the selectionof projects and who benefits within the community. White (2002) questions the extent ofparticipation in Social Funds, noting that: ‘typically, almost everyone is involved in making acommunity contribution, but far fewer people are active in identification and fewer still inproject management’, and that some groups, particularly women, may be excluded.
Dulani (2003) finds evidence for these concerns in an assessment of three MASAF projectsin Malawi, noting that communities played very limited roles in needs assessment, projectselection, planning or monitoring and evaluation. Where community members wereinvolved, local elites dominated who did not necessarily represent the interests or prioritiesof the majority. Community members were mostly involved in implementation, but in onecase where the project addressed a non-priority need, ‘participation imposed a significantcost to the poorest of the poor’. Bloom et al (2005) reach similar conclusions in theirbroader assessment of MASAF, which reports that active and participatory communityinvolvement in MASAF projects was limited.
Partly because of the risk of elite capture, Social Funds are often criticised for not targetingthe poor. Van Domelen (2002) argues that criticism of Social Fund targeting is not
IDS DISCUSSION PAPER 387
79

supported by data, and presents evidence from Social Funds in six countries showing thatthey can reach the poor and do often reach the poorest. However, de Haan et al (2002)points out that since targeting methods vary across Social Funds, so does their targetingaccuracy. White (2002) finds that Type II (inclusion) targeting errors are large – rangingfrom 29–45 per cent in poverty-oriented projects – but argues that this is inevitable (andnot undesirable) for infrastructure projects such as school buildings that benefit entire communities. District targeting, however, may be more problematic. In the case of Malawi,Bloom et al (2005) find little evidence of leakage to the better off, but equally little evidence of efforts to target the poorest and most vulnerable in MASAF projects.
The welfare impacts of Social Funds are unclear. While there have been successes in creating and using facilities, and there is some evidence of increased primary enrolment andimmunisation coverage, and decreased mortality as a result of Social Funds, World Bank(2002a, b) data show several cases of insignificant or even negative impact, leading White(2002) to suggest that complementary programmes are essential. Tendler (2000) is moresceptical, arguing that Social Funds have negligible impact on poverty. Bloom et al (2005)find evidence of direct and sustainable benefits of MASAF to the poor. MASAF publicworks projects reportedly improved the quality of life for 71 per cent of their 721,155 workers, and MASAF funded the construction of one-quarter of all classrooms in Malawibetween 1994 and 2001, all of which were still in use by 2005.
Concerns are often raised about the maintenance and sustainability of assets and infrastructure created under Social Funds, especially where recurrent costs must be coveredafter the project is completed (White 2002). In Malawi, Bloom et al (2005) report that, outof 200,000 boreholes constructed by MASAF, only half of those linked to schools andtwo-thirds of stand-alone boreholes still provide a good supply of drinking water. Finally,since Social Funds are usually institutionally separate from government, there are concernsthat their parallel activities might undermine government institutions (de Haan et al 2002).Tensions between MASAF and the Ministry of Health resulted in MASAF ceasing all fundingof health projects (Bloom et al 2005).
IDS DISCUSSION PAPER 387
80

3 Direct welfare transfers
Direct welfare transfers typically take the form of food or cash transfers to poor and vulnerable people. This section considers two types of food transfers (food aid or supplementary feeding, and school feeding or food-for-education) and two types of cashtransfers (conditional and unconditional).
3.1 Food aid
Food aid is most often thought of as a response to humanitarian emergencies, to alleviatehunger and prevent starvation. Apart from relief food aid, however, there is also programmefood aid and project food aid (public works, school feeding, supplementary feeding), whichhave a role in social protection and, arguably, in poverty reduction. Since public works projects have been discussed elsewhere in this report, this section briefly reviews emergency relief and supplementary feeding programmes in Malawi, after a broader discussion of the case for and against food aid.
Several arguments are made in support of food aid. Apart from saving lives during emergencies, food aid can help to address vulnerability. Dercon and Krishnan (2000) andQuisumbing (2003) find that food aid is effective in reducing household vulnerability inEthiopia, and Hoddinott et al (2003) note the importance of food aid in smoothing consumption and protecting assets among households facing food stress. Recently, foodtransfers have been advocated as providing both economic and nutritional support to peopleliving with HIV and AIDS (PLWHA) (WFP 2005). In the Malawi context, linking food aid toHIV/AIDS is motivated by three facts: that HIV is a fundamental cause of the SouthernAfrican food crisis, that malnutrition can increase susceptibility to HIV and AIDS, and thatHIV and AIDS exacerbate food security and malnutrition (Kadiyala and Gillespie 2003; UN2003). One more general point often made in favour of food aid is that it can achieveimproved nutrition better than cash because more food is consumed for equivalent valuesof transfer (Edirisinghe 1998), which may partly be a consequence of women controllingfood in the household (Haddad et al 1997).
Critics of non-emergency food aid argue that it is unlikely to eliminate chronic food insecurity or to reduce poverty without complementary interventions, and that developmental food aid is less effective and less efficient than other transfers (Barrett andMaxwell 2005; ODI 2000; Clay et al 1998a,b; Holt 1998). One limitation of food transfers is their high transaction costs. Barrett and Maxwell (2005) estimate that more than half(53 per cent) the value of US food aid in 2000 was spent on shipping and handling costs.Clay et al (1998b) claim that whenever it is systematically analysed, financial aid is morecost-effective than food aid. Both reviews conclude that food is preferable to cash transfers only where local markets are functioning extremely poorly and inelastic foodsupply means that cash injections would merely inflate commodity prices and harm thep o o r e s t .
Interestingly, popular perceptions that food aid causes disincentives and dependency havebeen challenged by recent empirical studies. A regression analysis of food aid in Ethiopiafinds that disincentive effects are insignificant among the poor but increase with householdwealth, which suggests that most observed disincentives are the result of mis-targetingwealthier households (Dayton-Johnson and Hoddinott 2004). Barrett and Maxwell’s (2005)review of food aid concludes that: (1) food aid rarely induces dependency because theamounts transferred are usually small; (2) the evidence of food crowding out other transfersis mixed; (3) well-targeted and well-timed food aid has minimal negative price effects inlocal markets, because it reaches households who are already priced out of the market;but (4) food aid can affect local production, labour markets and consumption patterns; so(5) food aid should be locally sourced wherever possible.
IDS DISCUSSION PAPER 387
81

Food aid has a long history in Malawi, though until recently project food aid (mainly publicworks and supplementary feeding) was more common than emergency relief. An evaluationof food aid to Malawi in the 1990s concluded that supplementary feeding programmesimplemented by WFP, UNICEF and NGOs had achieved little in over 20 years, either toreduce levels of undernutrition or to address the underlying causes of food insecurity (FSG1994). Although their humanitarian value was clear, widespread chronic and seasonal undernutrition persisted, and household food insecurity appeared to be worsening ratherthan improving from year to year. As a result of this finding, WFP decided to phase out itssupplementary feeding in Malawi, and to restrict its food aid interventions to emergencyand ‘developmental’ interventions. In 1996, however, supplementary feeding continued,reaching 150,000 beneficiaries (pregnant women, malnourished infants, street children,destitutes), through Nutrition Rehabilitation Units, Mother and Child Health Centres andCommunity-Based Supplementary Feeding (Brown et al 1996).
Following the 2001/2 food crisis, the Joint Emergency Food Aid Programme (JEFAP) distributed 240,00 MT of food to over 3 million Malawians between July 2002 and June2003, in the form of general food distribution (2.9 million beneficiaries each month), therapeutic and supplementary feeding and school feeding. Available evidence suggests thatthe general food distribution was weakly targeted on the poorest and most drought-affected households, but fairly well targeted by observable indicators of vulnerability such ashouseholds with orphans or chronically ill members and female-headed households (Sharma2005b). Impacts of food distribution were limited by the low levels of participation (only 38per cent of rural households), infrequent rather than monthly receipt of food, and transfersof less than full rations. In terms of food consumption levels and adoption of coping strategies like selling assets, no statistically significant differences in outcomes were recorded between food aid beneficiaries and non-beneficiaries (Sharma 2005a).
In 2005/6, supplementary feeding programmes are as widespread in Malawi as ever. WFPis implementing a project entitled ‘Support to HIV/AIDS Affected and Infected People’,which aims to maintain minimum nutritional standards of 45,700 households living withHIV/AIDS (PLWHAs), with transfers of maize-meal, pulses, vegetable oil and corn-soyblend. Following the 2001/2 food crisis, several international NGOs, including GOAL andCRS, implemented ‘Targeted Nutrition Programs’ under the Joint Emergency FoodAssistance Programme II (JEFAP). In non-crisis years, instead of a general food distributionfood is distributed to households with chronically ill members, orphans, female-headed andelderly-headed households. In 2003/4 the Ministry of Health’s supplementary and therapeutic feeding programme reached 38,000 beneficiaries – malnourished children,pregnant and lactating mothers, and orphan carers – with food provided by USAID’s C-SAFE3 programme (Kambewa 2005).
3.2 School feeding programmes
School feeding programmes (SFP) provide meals to children at school, as distinct from‘food-for-education’ (FFE), which gives children dry rations (e.g. a bag of wheat or rice) totake home for the family. The primary objective of school feeding is to increase enrolmentand attendance rates, while food-for-education aims to enhance household food security.When school feeding was originally introduced, it had explicit nutritional objectives, but theWorld Food Programme (WFP) no longer argues for school feeding as a nutritional programme, but instead as an intervention to support education.
The reason for this shift in programme objectives is that the evidence for nutritional benefits of school is weak (Caldes and Ahmed 2004). A comprehensive review of food aidby Clay (1998a) found that food-based interventions in non-emergency contexts generallyhave little impact on nutritional status, morbidity, or mortality levels. Some empirical studieshave found an increase in children’s food intake through school feeding and food-for-education (Jacoby et al 1997), either because a school meal is additional food and ‘sticks’ tothe child – Jacoby (1997) labels this the ‘flypaper effect’ – or because take-home rations
IDS DISCUSSION PAPER 387
82

effectively increase real household income (Babu and Hallam 1989). However, in manycases, school meals simply substitute for meals at home, so there is no net increment inchildren’s food consumption. Also, the nutritional impact of food-for-education on vulnerable family members is unclear, because the allocation of food rations is determinedby intra-household decision-making power (Ahmed and del Ninno 2002).
Some studies conclude that the nutritional benefits of school feeding and food-for-educationare greater during food crises or other episodes of vulnerability than in normal times.Grantham-McGregor et al (1991) found that undernourished (stunted and wasted) childrenbenefit more than others from school meals. Several studies conclude that the incometransfer effect of school feeding programmes can act as a substantial safety net for vulnerable groups, particularly during the ‘hungry’ season just prior to the harvest, whenfood insecurity in poor rural households is at its height.
Although the evidence for nutritional benefits of school feeding and food-for-education islimited and ambiguous, the evidence for positive educational impacts is strong. Amongnumerous examples of improved school enrolment and attendance are the following:∑l increased attendance in schools in Jamaica (Powell and Grantham-McGregor 1983)∑l reduced drop-out rates in Uttar Pradesh (Agarwal 1987)∑l increased enrolment, more regular attendance, fewer repeaters and reduced drop-out
rates in disadvantaged provinces of Burkina Faso (Moore and Kunze 1994)∑l in Bangladesh, food-for-education reduced the gender gap in schools – female primary
enrolment increased by 44 per cent and male enrolment by 28 per cent (Ahmed and del Ninno 2002)
∑l the impressive gender effects of school feeding in Côte d’Ivoire elicited government
support to reduce early marriages and teenage pregnancies (Odaga and Heneveld 1995).
School feeding and food-for-education are often introduced with explicit gender equityobjectives, such as narrowing the gender gap in schools, providing incentives for girls topursue secondary education, or retaining girls in school during emergencies. Moussa(2002) presents evidence that gender incentives are very effective during emergencies: aWFP school feeding programme that targeted girls during a drought in Pakistan increasedfemale attendance by 76 per cent. Levinger (1986) argues that gender effects are strong incultures where girls are fed least and last. Kadiyala and Gillespie (2003) argued that food-for-education for AIDS-affected families is an effective incentive to attract children toschool rather than doing domestic chores or foraging. However, Bennett (2003) pointsout that there is often a plateau (usually of income) beyond which school feeding or food-for-education cannot be effective; UNICEF found this level to be 10 per cent inB a n g l a d e s h .
Beyond increased enrolment and attendance, some studies find evidence for positive effectsof school feeding on learners’ performance and cognitive development. Hungry children areless able to concentrate in class, and perform less well in exams. Providing meals at schoolhas been claimed to improve learning outcomes in controlled studies in Jamaica (Powelland Grantham-McGregor 1983; Chandler et al 1995) and Peru (Jacoby et al 1997) and non-controlled studies in Burkina Faso (Moore and Kunze 1994) and Benin (WFP 2001).However, Lopez et al (1993) find no association between school feeding and learners’ performance in Chile. Bennett (2003) concludes that the evidence on improved learningoutcomes is generally weak, and that cheaper options for stimulating demand for education,such as waiving school fees, might be preferable, since school feeding programmes are ‘byfar the most expensive nutrition interventions’. In Malawi and Uganda, fee-free primaryeducation has already been introduced, in both cases substantially boosting school enrolment(from 1.8 to 3.2 million children in the case of Malawi).
IDS DISCUSSION PAPER 387
83
Malawi’s experience with school feeding dates back to the early 1990s. In 1996, a pilotschool feeding project in Malawi, implemented by WFP, led to 5 per cent increases inenrolment and 36 per cent increases in attendance (WFP 1996). Enrolment in one schoolrose by 26 per cent in 1 month – from 1,293 in February to 1,631 in March – following theintroduction of free school meals. Dil (1996) found that not all of this incremental enrolment was new students, but students ‘migrating’ from other schools where no schoolmeals were provided: this migration ‘was significant and led to disorder and disruption ofclasses’. Dil (1996) also concluded that the main problem with school feeding in Malawi wasexclusion errors: the poorest families either do not send their children to school (because ofthe direct and indirect costs of education) or withdraw them during hard times (becausethey are needed to work for food), and many poor households do not have school-agedchildren (such as elderly widows without support). It is of course possible that school mealscould induce some poor families to enrol their children and to retain them in school in difficult times, and this is in fact one of the strongest claims made by proponents of schoolfeeding programmes.
3.3 Unconditional cash transfers
Unconditional cash transfers have been defined as ‘unconditional transfers of cash made bygovernment or non-governmental organisations to individuals or households identified ashighly vulnerable, with the objective of alleviating poverty, providing social protection, orreducing economic vulnerability’ (Devereux et al 2005). Included in this category are socialpensions to the elderly, disability grants, child support grants, and a number of pilot cashtransfer schemes – such as the Kalomo Pilot Social Cash Transfer project (2004) in Zambia– which are currently being considered for potential adoption in Malawi. Unconditionalcash transfers are gaining in popularity, especially in Africa where social security systems areundeveloped. Cash transfers are seen as a preferable alternative to food aid, because theyare cheaper to administer and avoid the risks associated with in-kind transfers (such asdependency and disincentives); they are less paternalistic because they enable individualchoice; and they contribute to pro-poor growth by being invested as well as consumed, andgenerating multiplier effects (Schubert et al 2005).
The poverty impact of unconditional cash transfers depends primarily on the size of thetransfer. Generous transfers can reduce poverty significantly. In the case of social pensionsfor elderly South Africans, Case and Deaton (1998) find that the ‘dollar a day’ poverty headcount has been reduced by 12.5 per cent by the social pension scheme, which transfersUS$3/day to men over 65 and women over 60. Samson et al (2002) reports that althoughmost of the poor in South Africa live in households that do not receive social welfaretransfers, and most of those who do remain poor, social pensions and other unconditionalcash transfers have reduced the average poverty gap by 23 per cent. Barrientos and Lloyd-Sherlock (2002) report similar findings for Brazil and Argentina. In other African countriesthat have non-contributory social pension schemes – Botswana, Lesotho, Mauritius,Namibia – the poverty reduction effect is less because the value of the transfer is less.
Although it is often claimed that Malawi cannot afford a non-contributory social pensionscheme, Lesotho’s decision to introduce a social pension in 2004 (with no donor support)proves that it is feasible even in very poor countries. The case for social pensions is based onevidence that poverty is disproportionately concentrated among the elderly (Barrientos andLloyd-Sherlock 2002; Camarano 2002), but in recent years this has been strengthened byevidence that older people are assuming much of the burden of caring for orphans and vulnerable children (OVC), especially in countries like Malawi and Uganda, where the prevalence of HIV/AIDS is high and numbers of AIDS orphans and elderly-headed households are rising (Ntozi and Nakayiwa 1999).
Malawi’s experience with unconditional cash transfers to date is limited, mainly to a projectcalled the Dedza Safety Net Pilot Project, implemented by Concern Universal in 2001/2.Three types of transfers were distributed to beneficiaries in 54 randomly selected villages:
IDS DISCUSSION PAPER 387
84

(1) Cash (MK550 per household per month); (2) Vouchers (to buy goods at selected retailers,worth MK550 per month); (3) Commodities (a package of goods – blankets, plates, a cookingpot, bucket, and soap – worth MK2,750, followed by maize-flour worth MK550 per month).
An evaluation found that the cash and commodity transfers were relatively simple andcheap to administer, with over 60 per cent of the project budget being transferred directlyto beneficiaries. The main concern with cash transfers was that their value in commodityterms varied from month to month as commodity prices rose and fell. The problem thisintroduces is that the purchasing power of cash is lowest when food prices are highest –between January and March each year – and hunger is at its worst. Also because of priceseasonality, the amount of maize transferred in-kind was cut from 20kg to 15kg during thehungry season months, when maize prices peaked.
Vouchers proved more expensive and complex to administer, and were less effective.Higher overhead costs and commission payments to retailers reduced the proportion ofproject budget transferred to beneficiaries to 56 per cent. Beneficiaries also complainedthat stores did not stock the commodities they wanted to purchase (e.g. orphans could notbuy the school uniforms they needed), or that retailers abused the voucher scheme byinflating their prices. The evaluation team recommended avoiding vouchers, in favour of ‘acombination of in-kind transfers (maize flour only) and cash to provide other foods andbasic needs’ (Levy et al 2002: 63).
3.4 Conditional cash transfers
Conditional cash transfers are very popular in Latin America, but are relatively untested inAfrica. Nonetheless, they are worth considering as a potential social protection instrumentfor Malawi in the future. The thinking behind conditional cash transfers is that more thanone objective can be achieved through a social protection programme that transfersresources to the poor and also provides an incentive to adjust the behaviour of beneficiaries,in a way that is believed to be in their own best interests as well as socially desirable (deJanvry and Sadoulet 2004). The most common form of conditionality is to require beneficiaries to send their children to school or a clinic, in an attempt to improve educationand health outcomes in poor households. Together with the cash transfer itself, theseinterventions aim to achieve both immediate safety net priorities as well as long-termpoverty reduction objectives.
The best-known conditional cash transfer programme is Progresa in Mexico, a model thathas inspired a number of similar programmes elsewhere in Latin America, such as BolsaEscola in Brazil. Progresa (now Oportunidades) aimed to prevent the inter-generational transfer of poverty, through changing incentives for schooling, healthcare, and attention tonutrition. Many conditional cash transfers – including Progresa and Bolsa Escola – have current as well as future poverty reduction as an objective. However, the effects of conditional cash transfers on poverty reduction are unclear. Nigenda and Gonzalez-Robledo(2005) find that Oportunidades had a significant poverty effect in Mexico, reducing thepoverty gap for 30 per cent of beneficiaries and reducing the severity of poverty by 45 percent, and that the Social Protection Network in Nicaragua supplemented per capita annualhousehold expenditure by 18 per cent. On the other hand, Bourguignon et al (2003) estimate that although Bolsa Escola in Brazil is relatively well targeted, the small size of thetransfer – at US$15 per month for each child attending school – means that it will onlyreduce the incidence of poverty by just over 1 per cent, and the Gini coefficient – a measureof income inequality – by just 0.5 per cent. Britto (2005) concludes that the long-termimpact of conditional cash transfers on poverty reduction is not proven, while the short-termimpact varies by programme.
Positive impacts on education and health are much better documented than impacts onpoverty. Coady and Parker (2001) estimate that demand-side interventions for schooling are7.3 times more cost-effective than supply-side measures. Several evaluations find positive
IDS DISCUSSION PAPER 387
85
correlations between conditional cash transfers on the one hand and school enrolment,clinic attendance and nutrition outcomes on the other (Sedlacek et al 2000; Guerrero2001; Morley and Coady 2003; Rawlings and Rubio 2004). Coady (2003) found thatProgresa increased school enrolments by 7–9 per cent. Bourguignon et al (2003) estimatethat Bolsa Escola could lead to 40 per cent of children aged 10–15 (and 60 per cent amongthe poor) who are not in school to enrol, and that the proportion of children outsideschool would fall from 6 per cent to 3.7 per cent. Nigenda and Gonzalez-Robledo (2005)report that Oportunidades helped to reduce the number of rural and urban school dropoutsin Mexico by 17 per cent and 10 per cent, respectively since 1997.
De Janvry and Sadoulet (2004) argue, however, that closer calibration of P r o g r e s a w o u l dhave led to significant efficiency gains, since primary enrolment was already 97 per cent,but 36 per cent of children who complete primary school fail to continue to secondarylevel. Sedlacek et al (2005) argue that since there is a stronger negative correlation ofchild labour with progression through school, and quality of attainment through attendancethan with enrolment, it is correct that conditional cash child labour and schooling is mixed,with indications that they are not mutually exclusive but may instead be complementary(Patrinos and Psacharopoulos 1997; Ravallion and Wodon 2001). Bourguignon et al ( 2 0 0 3 )estimate that one-third of the extra children enrolling as a result of Bolsa Escola in Brazilwould stay in work. Sadoulet et al (2004) find, though, that P r o g r e s a compensates for theuse of children as risk coping mechanisms, thereby having a positive impact on childl a b o u r .
Conditional cash transfers have also had positive impacts on health and nutrition (Coady2003). Summarising several evaluations of Oportunidades, Nigenda and Gonzalez-Robledo(2005) report an increase in demand for health consultations, an 11 per cent reduction inmaternal mortality, and a 20 per cent average reduction in the number of days that 16–49year olds are ill, compared with a control group of non-beneficiaries in the same communities. Other positive collateral effects of conditional cash transfers have been documented, including greater female participation in household decision-making wherethe transfers are given to women (Adato et al 2000; Coady 2003), a multiplier effect onlocal economies, increased civil registration and access of the poor to financial services(Britto 2005), and increased investment (Coady 2004).
Some concerns about conditional cash transfers have been raised. Any cash transfer programme might lead to local price inflation, although Handa et al (2001) found no evidence of this in the case of Progresa. In the Malawi context, much would depend on thescale of the programme, the size of individual transfers, and whether local markets are wellfunctioning or not. It is also argued that public transfers might ‘crowd out’ private transfers,thus undermining informal social support systems (Coady 2004). Scott (1999) found that inProgresa there was a danger of abuse of power by promotoras, especially where they arealso the service providers. Britto (2005) notes the difficulties of monitoring adherence toconditionalities, in cases where both the beneficiaries and the service providers have incentives to report compliance.
In the Latin American conditional cash transfer programmes, Bourguignon et al (2002) caution that improved educational attainment might not necessarily translate into higherearnings in adult life, because this is mediated by various other factors, such as quality ofschooling and conditions in the labour market. In the African context, Nigenda andGonzalez-Robledo (2005) question the connection between health and education statusand future employment potential. In this regard, it must be emphasised that the adequateprovision of good quality health and education services is a crucial complement to successful conditional cash transfers (Barrientos and de Jong 2004; Britto 2005). One reason why conditional cash transfers are less popular in Africa might be that the quality ofeducation and health services is so poor that the benefits of requiring children to attendschools and clinics are limited at best, and negligible at worst. Those who argue that conditional cash transfers are paternalistic point out that there might be good reasons whyparents choose not to make use of education and health services, even if they are providedfree of charge.
IDS DISCUSSION PAPER 387
86

Targeting conditional cash transfers also presents difficulties, with exclusion errors oftenbeing high because of the nature of their conditionalities. Britto (2005) notes that Progresainadvertently excluded those communities without schools and clinics – which tend to beamong the poorest communities in Mexico – and that Bolsa Escola excluded households inBrazil without school-age children, because eligibility for both these programmes requirethe use of education and health services.
In the case of Malawi, the problems with education and health services are more significanton the supply side – in terms of the numbers of schools and clinics in rural communities, aswell as the quality of service provision (too few trained teachers, inadequate drugs, and soon) – than the demand side. The priority sequencing, therefore, should be to invest inimproved service delivery, and only thereafter to boost demand for services throughinducements such as conditional cash transfers. As an intermediate option, Devereux et al(2005) recommend linking the delivery of cash transfers to the delivery of basic services –such as an immunisation drive, HIV and AIDS awareness, adult literacy or nutrition education– but on a voluntary rather than compulsory basis.
IDS DISCUSSION PAPER 387
87

4 Summary and conclusions
Despite implementing an increasingly diverse range of safety net and social protectionmeasures, levels of poverty and vulnerability in rural Malawi remain extremely high, and therisk of another humanitarian emergency on the scale of 2001/2 has scarcely receded,despite the efforts of the government, donors and NGOs. One reason for this is the uncoordinated and patchy nature of the social protection instruments in place in Malawi.The ideal of a comprehensive, effective and responsive social security system that protectsvulnerable Malawians against livelihood shocks and life-cycle stages seems many decadesaway, and the patchwork of relief interventions, ‘productivity-enhancing safety nets’ anddirect welfare transfers currently in place is inadequate to meet the full extent of Malawi’ssocial protection needs. This paper has attempted to review the achievements and limitations of several of the main social protection instruments in Malawi, while also drawing on lessons from international experiences. This concluding section summarises thekey findings.
4.1 Productivity-enhancing safety nets
Malawi’s farmers face severely constrained access to agricultural inputs, especially fertilisers,both because of limited availability on the market and because of prices that are unaffordable for poor smallholders. Improving access to inputs has the potential to boostmaize yields, narrow the food gap, stabilise food prices, and reduce the need for foodimports and food aid distribution. So ‘getting fertiliser to farmers’ can be seen as a productivity-enhancing safety net, a pre-emptive measure that supports production in orderto minimise the need for direct welfare transfers. The crux of the inputs debate is howbest to improve access to inputs. Every conceivable approach has been tried in Malawi:from free handouts to fertiliser subsidies to subsidised input credit.
The economic rationale for both Starter Packs and subsidies is that subsidising food production in Malawi is up to five times more cost-effective than subsidising food consumption through food aid. This is demonstrably true, as is the substantial contributionthat Starter Packs made to the national maize harvest: 16 per cent at its peak in 1999/2000. Conversely, one of the most damaging consequences of scaling down the StarterPack, from universal distribution to the Targeted Inputs Programme, was a rise in marketdependence for food and a tenfold increase in maize prices.
The case against subsidised or free fertiliser and seeds is that this distorts markets, undermines the private sector, and is fiscally unsustainable. Given widespread rural poverty,erratic weather (which raises the risk of investing scarce household resources in farminputs), the weakness of the Kwacha, and the consequent failure of the private sector tomeet farmers’ demand for inputs at affordable prices, these criticisms are questionable.Other concerns with free or subsidised inputs are: (1) universal subsidies are regressive and‘leak’ to wealthier farmers, estates and neighbouring countries; (2) targeted inputs distribution is subject to targeting errors (inclusion and exclusion), politicisation and ‘elitecapture’; (3) a ‘projectised’ approach to inputs delivery is not an institutionalised solution.Nonetheless, unless and until effective ways can be found to support access to inputsthrough the market, there may be no alternative to subsidised access.
Public works programmes in Malawi have delivered food, income and agricultural inputs, aswell as employment opportunities to under-employed households. Apart from transferringresources to the poor, public works projects also build or maintain assets such as physicalinfrastructure. On paper, the achievements of public works in Malawi look impressive: hundreds of thousands of people have been employed, and numerous assets have been created (roads, water-points, woodlots, school buildings). Concerns about public works programmes relate to: (1) whether the assets created have economic value and are
IDS DISCUSSION PAPER 387
88
sustainable; (2) what level of payment is fair and poverty-reducing, while also self-targetingthe poor; (3) whether workers should be paid with cash wages, food rations or agriculturalinputs; (4) evidence suggesting that public works are not a cost-effective measure comparedwith other social protection instruments, such as unconditional cash transfers.
4.2 Direct welfare transfers
The case for food aid as an emergency response to humanitarian crises is less controversialthan the use of food aid in non-emergency contexts, especially as a developmental tool.Malawi has less experience with relief food aid than famine-prone countries elsewhere inAfrica. Evaluations of the humanitarian response to the crisis of 2001/2 suggest that foodaid played a limited role in terms of either saving lives or protecting livelihoods. Food wasdelivered very late (after the crisis had peaked), coverage was incomplete (only 38 per cent ofrural households benefited from the general food distribution), and deliveries were erratic,with most beneficiaries receiving only a few rations, often less than their entitlement.Beneficiaries did not consume more food than non-beneficiaries, nor did they adopt feweror less damaging coping strategies.
Non-emergency uses of food aid have increased in Malawi. This could be interpreted as alogical response to rising vulnerability and social protection needs; but the fact that vulnerability does not seem to be falling raises questions about the roles and objectives ofproject food aid. Despite an evaluation in 1994 concluding that supplementary feeding hadfailed to reduce food insecurity in Malawi, and WFP’s resolution to phase out supplementaryfeeding in favour of ‘developmental’ uses of food aid, there are more supplementary feeding,therapeutic feeding and other targeted nutrition programmes than ever. Recently, food aidhas been introduced as a social protection measure for people living with HIV and AIDS.
Concerns about food aid are wide-ranging. Food aid is more costly to deliver than cashtransfers; transactions costs are high; imported food aid can undermine incentives for farmers and traders and distort markets. On the other hand, poorly targeted distribution ofrelatively small quantities of food aid has very little impact, either on household food securityor on production and markets.
School feeding programmes are no longer advocated as a targeted nutrition intervention,but instead as a way of boosting school enrolment, attendance, and possibly learner performance, though the evidence for the latter is weak. Providing meals at school – ortake-home rations in the case of food-for-education – can also retain children in schoolfollowing livelihood shocks. School feeding in Malawi appears to have increased enrolment,though some of this increase may be due to learners switching to schools where meals areprovided. However, it is debatable whether this is an appropriate and cost-effective way topromote education uptake in Malawi. The abolition of fees had a far bigger impact onenrolment; exclusion errors remain high; and concerns about the quality of education meanthat attention to the supply-side may be more urgently needed.
Similar considerations might explain why conditional cash transfers, though popularthroughout Latin America, are largely unknown in Africa. The principle behind conditionalcash transfers is to link resource transfers to the poor with incentives to increase their utilisation of basic services, especially education and health. However, where the quality ofthese services is sub-standard and provision is inadequate, as in Malawi, the problems clearlylie more on the supply-side than the demand-side. Until these issues are addressed, theargument for introducing conditional cash transfers to Malawi will remain weak. As a compromise option, the delivery of unconditional cash transfers could be linked to thedelivery of specific services: for instance, an immunisation drive might be held on the sameday and in the same location as the delivery of a cash transfer.
Unconditional cash transfers have recently been advocated as a cost-effective mechanismfor transferring resources to the poor in a way that avoids the problems associated withfood aid, and supports markets and pro-poor growth through economic multiplier effects.
IDS DISCUSSION PAPER 387
89

The evidence base on impacts of cash transfer in Africa is limited but generally positive.While endorsing unconditional cash transfers as a social protection instrument for Malawi,three cautions should be mentioned: (1) the value of cash varies with commodity prices, socash transfers protect the poor against food price seasonality less effectively than foodtransfers (or market-stabilising interventions); (2) experience from Malawi suggests thatdelivering cash transfers though a voucher mechanism are problematic; (3) institutionalisationis preferable to projectisation – government-administered child support grants, social pensions, and other formal programmes are more administratively and politically sustainablethan donor-driven resource transfer projects implemented by NGOs.
IDS DISCUSSION PAPER 387
90
ReferencesFree inputs distribution
Ashley, C. and Maxwell, S. (2001) ‘Overview. Rethinking Rural Development’, DevelopmentPolicy Review 19.4
Barahona, C. and Cromwell, E. (2005) ‘Starter Pack and Sustainable Agriculture’, in S. Levy(ed.), Starter Packs: A Strategy to Fight Hunger in Developing Countries? Lessons From the MalawiExperience 1998–2003, Wallingford: CABI Publishing
Chinsinga, B., Dzimadzi, C., Magalasi, M. and Mpekansambo, L. (2002) ‘TIP EvaluationModule 2: TIP Messages: Beneficiary Selection and Community Targeting, AgriculturalExtension and Health (TB and HIV/AIDS)’, in CD: The Monitoring and Evaluation Archive of theStarter Pack and Targeted Inputs Programmes Malawi 1999–2003, University of Reading:Statistical Services Centre
Garforth, C. (2005) The Challenges of Agricultural Extension, in S. Levy (ed.), Starter Packs: AStrategy to Fight Hunger in Developing Countries? Lessons from the Malawi Experience1998–2003, Wallingford: CABI Publishing
Harnett, P. and Cromwell, E. (2000) ‘Malawi Starter Pack Scheme 1999–2000’, Follow-upStudy of Flexivouchers: ‘As Good As Money’, London: DFID
Hoddinott, J. (1999) Targeting: Principles and Practice, Washington, DC: International FoodPolicy Research Institute
Kambewa, P. (2005) A Review of Safety Net Programmes for 2003–04, Lilongwe: Republic ofMalawi
Levy, S. (2005a) ‘Introduction’, in S. Levy (ed.), Starter Packs: A Strategy to Fight Hunger inDeveloping Countries? Lessons From the Malawi Experience 1998–2003, Wallingford: CABI Publishing
—— (2005b) ‘Production, Prices and Food Security: How Starter Pack Works’, in S. Levy(ed.), Starter Packs: A Strategy to Fight Hunger in Developing Countries? Lessons from the MalawiExperience 1998–2003, Wallingford: CABI Publishing
—— (2005c) ‘Financing and Macro-economic Impact: How Does Starter Pack Compare?’,in S. Levy (ed.), Starter Packs: A Strategy to Fight Hunger in Developing Countries? Lessons fromthe Malawi Experience 1998–2003, Wallingford: CABI Publishing
Levy, S., with Barahona, C. and Chinsinga, B. (2004) ‘Food Security, Social Protection,Growth and Poverty Reduction Synergies: The Starter Pack Programme in Malawi’, NaturalResource Perspectives No. 95, London: Overseas Development Institute
Longley, C. and Sperling, L. (2002) ‘Editorial: Beyond Seeds and Tools: Effective Support toFarmers in Emergencies’, Disasters 26.4: 283–7
Longley, C., Coulter, J. and Thompson, R. (1999) Malawi Rural Livelihoods Starter PackScheme, 1998–9: Evaluation Report, London: ODI
Nyirongo, C. (2005) ‘Do Free Inputs Crowd Out the Private Sector in Agricultural InputMarkets?, in S. Levy (ed.), Starter Packs: A Strategy to Fight Hunger in Developing Countries?Lessons from the Malawi Experience 1998–2003, Wallingford: CABI Publishing
Sperling, L., Remington, T., Haugen, J. and Nagoda, S. (eds), (2004) Addressing Seed Securityin Disaster Response: Linking Relief with Development, Overview, Cali, Colombia: InternationalCenter for Tropical Agriculture, www.ciat.cgiar.org/africa/seeds.htm
Van Donge, J. (2005) ‘The Farmer’s Perspective – Values, Incentives and Constraints’, in S.Levy (ed.), Starter Packs: A Strategy to Fight Hunger in Developing Countries? Lessons from theMalawi Experience 1998–2003, Wallingford: CABI Publishing
IDS DISCUSSION PAPER 387
91

Fertiliser subsidies
Carr, S. (2002) ‘An Outline of an Inputs for Rural Infrastructural Development Programme’,mimeo, Zomba
Crawford, E., Jayne, T. and Kelly, V. (2005) Alternative Approaches for Promoting Fertiliser Usein Africa, with Particular Reference to the Role of Fertiliser Subsidies, Michigan State University:Department of Agricultural Economics
Devereux, S. (1999) ‘Making Less Last Longer’: Informal Safety Nets in Malawi, IDS DiscussionPaper 373, Brighton: IDS
Ellis, F. (1990) ‘The Rice Market and Its Management in Indonesia’, IDS Bulletin 21.3,Brighton: IDS
Govindan, K. and Babu, S. (2001) ‘Supply Response Under Market Liberalisation: A CaseStudy of Malawian Agriculture’, Development Southern Africa 18.1: March
Levy, S. (2005) ‘Financing and Macro-economic Impact: How Does Starter Pack Compare?’,in S. Levy (ed.), Starter Packs: A Strategy to Fight Hunger in Developing Countries? Lessons fromthe Malawi Experience 1998–2003, Wallingford: CABI Publishing
Peters, P. (1999) Agricultural Commercialisation, Rural Economy and Household Livelihoods,1990–1997, Cambridge, MA: Harvard Institute for International Development
Sachs, J. (2003) ‘The Case for Fertilizer Subsidies for Subsistence Farmers’, mimeo, 7 December
Sahn, D. and Arulpragasam, J. (1991) ‘The Stagnation of Smallholder Agriculture in Malawi:A Decade of Structural Adjustment’, Food Policy June: 219–34
Public works programmes
Bloom, G., Chilowa, W., Chirwa, E., Lucas, H., Mvula, P., Schou, A. and Tsoka, M. (2005)Poverty Reduction During Democratic Transition: The Malawi Social Action Fund 1996–2001,Research Report 56, Brighton: IDS
Cammack, D. (1996) Food Security and Gender Disparities in Malawi: A Profile Paper for GenderTargeting by WFP-Malawi, Lilongwe: World Food Programme
Devereux, S. (2002) From Workfare to Fair Work: The Contribution of Public Works and OtherLabour-Based Infrastructure Programmes to Poverty Alleviation, Issues in Employment andPoverty Discussion Paper 5, Geneva: ILO
Gsänger, H. (2000) Preliminary Assessment of the Envisaged National Safety Net Strategy forMalawi, Berlin: GDI
Haddad, L. and Adato, M. (2001) How Efficiently Do Public Works Programs Transfer Benefits tothe Poor? Evidence From South Africa, FCND Discussion Paper 108, Washington, DC:International Food Policy Research Institute
Lipton, M. (1998) Successes in Anti-Poverty, Issues in Development Discussion Paper 8,Geneva: Development and Technical Cooperation Dept, International Labour Office
Malawi Social Action Fund (MASAF) (2004) ‘The Evaluation of the Improving LivelihoodsThrough Public Works Programme (ILTPWP)’, September, unpublished
Malawi Social Action Fund (1996) What is MASAF?, Lilongwe: MASAF
Maxwell, S. (1993) ‘Can a Cloudless Sky Have a Silver Lining? The Scope for an Employment-Based Safety Net in Ethiopia’, in H. Thimm, H. Hahn, I. Reinhard and D. Schulz (eds),Regional Food Security and Rural Infrastructure, Hamburg: Verlag Munster 1: 101–19
IDS DISCUSSION PAPER 387
92
Mayer, W. and Kayira, G. (1997) Addressing Unemployment Problems Through ExpandingLabour-Based Public Works Programmes, Botswana: Friedrich Ebert Stiftung
McCord, A. (2005) ‘Win–win or Lose–lose? An Examination of the Use of Public Works asa Social Protection Instrument in Situations of Chronic Poverty’, paper presented at theConference on Social Protection for Chronic Poverty, IPDM University of Manchester,23–24 February
—— (2004) Policy Expectations and Programme Reality: The Poverty Reduction andEmployment Performance of Two Public Works Programmes in South Africa, Economics andStatistics Analysis Unit & Public Works Research Project, SALDRU, School of Economics,University of Cape Town, ESAU Working Paper, London: Overseas DevelopmentI n s t i t u t e
Smith, J. (2001) Spending on Safety Nets for the Poor: How Much, For How Many? The Case ofMalawi, Africa Region Working Paper Series No 11, Washington, DC: World Bank
—— (1999) Safety Nets in Malawi: How Much? For How Many? Lilongwe: World Bank
South African Labour and Development Research Unit (SALDRU) (2005) Public Works in theContext of HIV/AIDS: Innovations in Public Works for Reaching the Most Vulnerable Children andHouseholds in East and Southern Africa, University of Cape Town: SALDRU
Subbarao, K., Bonnerjee, A., Braithwaite, J., Carvalho, S., Ezemenari, K., Graham, C. andThompson, A. (1997) Safety Net Programs and Poverty Reduction, Lessons from Cross CountryExperience. Directions in Development, Washington, DC: The World Bank
Subbarao, K., Ahmed, A., et al (1996) Selected Social Safety Net Programs in the Philippines.Targeting, Cost-Effectiveness, and Options for Reform, Washington, DC: The World Bank
World Bank (2001) World Development Report 2001: Attacking Poverty, Washington, DC:World Bank
Zgovu, E., Mvula, P., Kunkwenzu, E. and Potani, M. (1998) Malawi Social Action Fund: AReview and Evaluation of MASAF Safety Net Programme and Assessment of its Impact, Zomba:Wadonda Consult
Social funds
Bloom, G., Chilowa, W., Chirwa, E., Lucas, H., Mvula, P., Schou, A. and Tsoka, M. (2005)Poverty Reduction During Democratic Transition: The Malawi Social Action Fund 1996–2001,Research Report 56, Brighton: IDS
Carvalho, S., Perkins, G. and White, H. (2002) ‘Social Funds, Sustainability and InstitutionalDevelopment Impacts: Findings From an OED Review’, Journal of International Development14: 611–25
De Haan, A., Holland, J. and Kanji, N. (2002) ‘Social Funds: An Effective Instrument toSupport Local Action for Poverty Reduction’, Journal of International Development 14.5:643–52
Dulani, B. (2003) ‘How Participatory is Participation in Social Funds? An Analysis of ThreeCase Studies From the Malawi Social Action Fund (MASAF)’, paper presented at theParticipation: From Tyranny to Transformation? Exploring New Approaches to Participationin Development, Conference, 27–8 February 2003, University of Manchester
Jorgensen, S. and van Domelen, J. (1999) ‘Helping the Poor Manage Risk Better: The Roleof Social Funds’, in N. Lustig (ed.), Shielding the Poor: Social Protection in the Developing World,Washington, DC: Brookings Institution and Inter-American Development Bank
Malawi Social Action Fund (1996) What is MASAF?, Lilongwe: MASAF
IDS DISCUSSION PAPER 387
93
Tendler, J. (2000) ‘Why are Social Funds so Popular?’, in Y. Shahid, W. Wu and S. Evenett(eds), Local Dynamics in the Era of Globalization, Oxford: Oxford University Press for theWorld Bank: 114–29
Van Domelen, J. (2002) ‘Social Funds: Evidence on Targeting, Impacts, and Sustainability’,Journal of International Development 14.5
White, H. (2002) ‘Social Funds: A Review of the Issues’, Journal of International Development14.5
World Bank (2002a) Social Funds: A Review of Experience, Washington, DC: OED, WorldBank
—— (2002b) Letting Communities Take the Lead. A Cross-country Evaluation of Social FundPerformance, Washington, DC: World Bank
Food aid
Barrett, C. and Maxwell, D. (2005) Food Aid After Fifty Years: Recasting its Role, London:Routledge
Brown, G., Reutlinger, S. and Thomson, A. (1996) Food Security in Malawi: A Market OrientedApproach, Lilongwe: USAID
Clay, E., Pillai, N. and Benson, C. (1998a) Food Aid and Food Security in the 1990s: Performanceand Effectiveness, ODI Working Paper 113, London: Overseas Development Institute
—— (1998b) The Future of Food Aid: A Policy Review, London: Overseas DevelopmentInstitute
Dayton-Johnson, J. and Hoddinott, J. (2004) ‘Examining the Incentive Effects of Food Aidon Household Behavior in Rural Ethiopia’, mimeo
Dercon, S. and Krishnan, P. (2000) ‘Food Aid and Informal Insurance’, in S. Dercon (ed.),Insurance Against Poverty, Oxford: Oxford University Press
Edirisinghe, N. (1998) ‘The Food Factor’, paper presented at Time for Change, Food Aid andDevelopment Conference at Rome, October, Rome: WFP
Food Studies Group (FSG) (1994) Country Strategy Outline: World Food Programme – Malawi,Lilongwe: World Food Programme
Haddad, L., Hoddinot, J. and Alderman, H. (1997) Intrahousehold Resource Allocation inDeveloping Countries, Washington, DC: International Food Policy Research Institute
Hoddinott, J., Cohen, M. and Bos, M. (2003) Redefining the Role of Food Aid, Washington,DC: International Food Policy Research Institute
Holt, J. (1998) ‘Food as Aid: Special Features of Development Assistance in the form ofFood’, paper presented at Time for Change: Food Aid and Development Conference,Rome, October, Rome: WFP
Kadiyala, S. and Gillespie, S. (2003) Rethinking Food Aid to Fight AIDS, FCND DiscussionPaper 159, Washington, DC: IFPRI
ODI (2000) Reforming Food Aid: Time to Grasp the Nettle?, ODI Briefing Paper, January
Quisumbing, A. (2003) ‘Food Aid and Child Nutrition in Rural Ethiopia’, World Development31.7: 1309–24
Sharma, M. (2005a) The Impact of Food aid on Consumption and Assets Levels in RuralM a l a w i, Washington, DC: International Food Policy Research Institute
IDS DISCUSSION PAPER 387
94
—— (2005b) Targeting of Emergency Free Food Distribution Program in Malawi: An Assessment,Washington, DC: International Food Policy Research Institute
United Nations (2003) Report of a mission by UN Special Envoy for Humanitarian Needs inSouthern Africa, James Morris and UN Special Envoy for HIV/AIDS in Africa, StephenLewis to Lesotho, Malawi, Zambia and Zimbabwe, 22–29 January
World Food Program (WFP) (2005) Reducing the Burden of HIV/AIDS. Experience of a FoodAid Intervention in Western Kenya. An Impact Study: ‘Nutrition and Care of People Affected byHIV/AIDS’ Busia District, Kenya, Nairobi: WFP Kenya Country Office
School feeding programmes
Ahmed, U. and del Ninno, C. (2002) Food for Education Program in Bangladesh: An Evaluationof its Impact on Educational Attainment and Food Security, Washington, DC: InternationalFood Policy Research Institute
Agarwal, D., et al (1987) Nutritional Status, Physical Work Capacity and Mental Function inSchool Children, Scientific Report 6, Nutrition Foundation of India
Babu, S. and Hallam, J. (1989) ‘Socioeconomic Impacts of School Feeding Programs. AnEmpirical Evidence from a South Indian Village’, Food Policy 14.1: 58–66
Bennett, J. (2003) Review of School Feeding Programmes, London: DFID
Caldes, N. and Ahmed, A. (2004) ‘Food for Education (Food for Schooling and SchoolFeeding)’, Impact Review Paper, draft, unpublished
Chandler, A., Walker, S., Connolly, K. and Grantham-McGregor, S. (1995) ‘School BreakfastImproves Verbal Fluency in Undernourished Jamaican Children’, Community and InternationalNutrition 125: 894–900
Dil, L. (1996) Rural Appraisal: Primary Schools, Vulnerable Group Feeding, and Food for Work asChannels of Maize Distribution, Lilongwe: World Food Programme
Grantham-McGregor, S., Powell, C.A., Walker, S.P. and Himes, J.H. (1991) ‘NutritionalSupplementation, Psychosocial Stimulation and Mental Development of Stunted Children:The Jamaican Study’, The Lancet 338
Jacoby, H. (1997) Is There an Intra-household Flypaper Effect? Evidence From a School FeedingProgram, Food Consumption Nutrition Division Discussion Paper No 31, Washington, DC: IFPRI
Jacoby, E., Cueto, S. and Pollitt, E. (1997) ‘Benefits of a School Breakfast Program AmongAndean Children in Huaraz, Peru’, Food and Nutrition Bulletin 17: 54–64
Kadiyala, S. and Gillespie, S. (2003) Rethinking Food Aid to Fight AIDS, IFPRI-FCN DiscussionPaper No 159, Washington, DC: IFPRI-FCN
Levinger, B. (1986) School Feeding Programs in Developing Countries: An Analysis of Actual andPotential Impacts, AID Evaluation Special Study No 30, Washington, DC: USAID
Lopez, I., et al (1993) ‘Breakfast Omission and Cognitive Performance of Normal, Wastedand Stunted School Children’, European Journal of Clinical Nutrition 47
Moore, E. and Kunze, L. (1994) ‘Evaluation of the Burkina Faso School Feeding Program.Catholic Relief Services’, consultant report, unpublished
Moussa (2002), ‘Keeping Schools Open: School Feeding in Conflict and Crisis’, HorowitzMemorial Lecture, SCN News 24: July
Odaga and Heneveld (1995) Girls and Schools in Sub-Saharan Africa, From Analysis to Action,World Bank Technical Paper 298, Africa Technical Department Series, Washington, DC:World Bank
IDS DISCUSSION PAPER 387
95

Powell, C. and Grantham-McGregor, S. (1983) ‘An Evaluation of Giving the JamaicanGovernment School Meal to a Class of Children’, Human Nutrition Clinical Nutrition 37C:381–8
World Food Program (WFP Food & Education, Zambia) (2002); WFP’s Role in ImprovingAccess to Education for Orphans and Vulnerable Children in sub-Saharan Africa, Zambia:Strategy and Policy Division World Food
World Food Program (WFP) (2001) ‘School Feeding Works. An Annotated Bibliography’,unpublished
—— (1996) ‘Report on Pilot School Feeding Program Evaluation Report WFP/Malawi’,unpublished
Unconditional cash transfers
Barrientos, A. and de Jong, J. (2004) Child Poverty and Cash Transfers, Childhood PovertyResearch and Policy Centre Report No 4, London: CHIP
Barrientos, A. and Lloyd-Sherlock, P. (2002) ‘Non Contributory Pensions and SocialProtection’, paper for the series Issues in Social Protection, published by the Social ProtectionSector, International Labour Organisation
Camarano, A. (2002) ‘Brazilian Population Ageing: Differences in Well-Being BetweenRural and Urban Areas’, paper presented at UNRISD meeting on Ageing, Development andSocial Protection, Madrid, April
Case, A. and Deaton, A. (1998) ‘Large Cash Transfers to the Elderly in South Africa’, TheEconomic Journal 108.450: 1330–61
Devereux, S., Marshall, J., MacAskill, J. and Pelham, L. (2005) Making Cash Count. Lessonsfrom Cash Transfer Schemes in East and Southern Africa for Supporting Vulnerable Children andHouseholds, London: HelpAge International and Brighton: IDS
Levy, S., Nyasulu, G. and Kuyeli, J. (2002) Dedza Safety Net Pilot Project: Learning Lessons AboutDirect Welfare Transfers for Malawi’s National Safety Nets Strategy, Reading: Calibre Consultants
Ntozi, J. and Nakayiwa, S. (1999) ‘AIDS in Uganda: How Has the Household Coped withthe Epidemic?’, in I. Orubuloye, J. Caldwell and J. Ntozi (eds), The Continuing HIV/AIDSEpidemic in Africa: Response and Coping Strategies, Canberra: Australian National University,Health Transition Centre
Samson, M., Babson, O., Haarmann, C., Haarmann, D., Khathi, G., MacQuene, K. and vanNiekerk, I. (2002) Research Review on Social Security Reform and the Basic Income Grant forSouth Africa, EPRI Policy Report 31, European Policy Research Institute and InternationalLabour Organisation
Schubert, B., Schramm, B., Wiebe, N., Baak, M., Wolter, B. and Wegener, H. (2005) SocialCash Transfer in Development Cooperation: Kalomo District, Zambia, Germany: GTZ
Conditional cash transfers
Adato, M., de la Brière, B., Mindek, D. and Quisumbing, A. (2000) ‘El Impacto de Progresaen la Condición de la Mujer y en las Relaciones al Interior del Hogar’, in SEDESOL (eds),Más Oportunidades para las Famílias Pobres – Impacto en el Trabajo y las Relaciones Familiares,Mexico City, Mexico: SEDESOL: 65–211
Barrientos, A. and de Jong, J. (2004) Chile Poverty and Cash Transfers, Childhood PovertyResearch and Support Centre No 4, London: Save the Children
IDS DISCUSSION PAPER 387
96

Bourguignon, F., Ferreira, F. and Leite, P. (2003) Cash Transfers will Increase SchoolAttendance but are too Small to Reduce Poverty, Brazil: Departamento de Economia,Pontificía Universidade Católica do Rio de Janeiro (PUC-RIO)
—— (2002) Ex-ante Evaluation of Conditional Cash Transfer Programs: The Case of BolsaEscola, Washington, DC: The World Bank
Britto, T. (2005) Recent Trends in the Development Agenda of Latin America: An Analysis ofConditional Cash Transfers, Brazil: Ministry of Social Development
Catholic Relief Services/Ethiopia Program (2003) Evaluation of the ‘Emergency ResponseThrough Increased Access to Seed, Water and Sanitation’ Project, Baltimore: CRS
Coady D. (2004) Designing and Evaluating Social Safety Nets: Theory Evidence and PolicyConclusions, Washington, DC: IFPRI
—— (2003) Alleviating Structural Poverty in Developing Countries: The Approach of Progresa inMexico, background paper for the World Development Report 2004, Washington, DC: TheWorld Bank
Coady, D. and Parker, S. (2001) ‘A Cost-Effectiveness Analysis of Demand- and Supply-SideEducation Interventions: The Case of Progresa in Mexico’, mimeo
de Janvry, A. and Sadoulet, E. (2004) Conditional Cash Transfer Programs: Are They Really MagicB u l l e t s ? University of California at Berkeley: Department of Agricultural and Resource Economics
Guerrero Serdan, A. (2001) ‘School Attendance in Rural Mexico: An Evaluation of the PROGRESA Program’, Master of Arts Research Paper, Institute of Social Studies, TheNetherlands
Handa, S., Huerta, M-C., Perez, R. and Straffon, B. (2001) Poverty, Inequality and Spillover inMexico’s Education, Health and Nutrition Program, FCND Discussion Paper No 101, Washington,DC: International Food Policy Research Institute
Harnett, P. and Cromwell, E. (2000) ‘Malawi Starter Pack Scheme 1999–2000’, Follow upStudy of Flexivouchers: ‘As Good As Money’ , Final Report, London: DFID
Morley, S. and Coady, D. (2003) From Social Assistance to Social Development: Targeted EducationSubsidies in Developing Countries, Washington, DC: International Food Policy Research Institute
Nigenda, G. and Gonzalez-Robledo, L. (2005) Lessons Offered by Latin American Cash TransferProgrammes, Mexico’s Oportunidades and Nicaragua’s SPN. Implications for African Countries,Centre for Economic and Social Analysis, Mexican Health Foundation
Patrinos, H. and Psacharopoulos, G. (1997) ‘Family Size, Schooling and Child Labor in Peru –An Empirical Analysis’, Journal of Population Economics 10 October: 387–405
Ravallion, M. and Wodon, Q. (2001) ‘Does Child Labour Displace Schooling? Evidence onBehavioural Responses to an Enrolment Subsidy’, Economic Journal 110 March: C158–75
Rawlings, L. and Rubio, G. (2004) Evaluating the Impact of Conditional Cash Transfer Programs:Lessons from Latin America, Washington, DC: The World Bank
Sadoulet, E., Vakis, R., de Janvry, A. and Finan, F. (2004) Education, Child Labour and Shocks:Children Benefit from Cash Transfers, Washington, DC: World Bank
Scott, J. (1999) Análisis del Programa de Educación, Salud y Alimentación (PROGRESA):México, Mexico City, Mexico: CIDE
Sedlacek G., Duryea, S, Ilahi, N. and Sasaki, M. (2005) Child Labor, Schooling, and Poverty inLatin America, Washington, DC: World Bank
Sedlacek, G., Ilahi, N. and Gustafsson-Wright, E. (2000) Targeted Conditional TransferPrograms in Latin America: An Early Survey, Washington, DC: World Bank
IDS DISCUSSION PAPER 387
97

Annex 1 Vulnerabilities and social protection responses
Direct welfare transfers
IDS DISCUSSION PAPER 387
98
Sources of vulnerability
Covariant livelihoodshocks (e.g. droughtor erratic rainfall)that cause transitoryvulnerability byreducing access tofood
Idiosyncratic livelihood shock(e.g. serious illness,or death of abreadwinner) orpersonal character-istic (e.g. severe dis-ability) that causeschronic vulnerabilityby undermining household labourcapacity
Chronic or transitory povertythat results in adequate uptake ofessential services,and/or child labour
Affected groups
l Small farming families with undiversified livelihoods
l Rural service providers (e.g. barbers, small traders) whose livelihood dependson farmers
Chronically vulnerablepeople who areunable to work andwho have inadequatefamily support, e.g.:
l Older infirm people living a l o n e
l People with disabilities
l Chronically ill people
l Orphans
Poor and vulnerablehouseholds who cannot afford tosend their childrento school or clinic,and/or withdrawchildren from schoolduring crises, and/orsend their childrento work
Social protectioninterventions
Humanitarian relief:
l General food distribution
l Supplementary feeding
l Emergency cash transfers
l Public works projects
I n s t i t u t i o n a l i s e dsocial welfare orsocial assistance(unconditional transfers of cash, orother goods andservices), including:
l Social pensions
l Disability grants
l Orphan carer grants
l School feeding programmes
l Conditional cash transfers
l Fee waivers
Objectives
Smooth consumptionafter a shock thatthreatens lives andexceeds the ability ofaffected householdsand communities tocope, by delivering freefood, cash to buy food,or employment opportunities
Provide adequateincome, reliably andpredictably, for a minimum subsistence tothe labour-constrainedpoor and their dependents
l Provide nutritional support to poor children and promote access to education
l Provide income support to poor households and ensure their utilisation of education and healths e r v i c e s
l Offer free access to education and healthservices to all (e.g. Free Primary Education) or to targeted poor or marginalised groups

IDS DISCUSSION PAPER 387
99
Productivity–enhancing safety nets
Sources of vulnerability
Constrained accessto agriculturalinputs, due topoverty or marketfailures
Limited access tobasic services(schools, clinics) andmarkets, due toinadequate transportand physical i n f r a s t r u c t u r e
Affected groups
Small farmers
Remote rural communities (whosepoverty and vulnerability arerelated to their isolation) ∑
Social protectioninterventions
l Fertiliser subsidies∑l Free inputs
distribution (‘Starter Packs’)
l Inputs-for-work
l Public works programmes (food- or cash-for-work)∑
l Social funds (e.g. MASAF)
Objectives
Transfer key productiveinputs to asset-constrained farmers,either for free, at subsidised prices, or forwork
∑Build roads and otherphysical assets thatenhance individual andcommunity access toservices and markets
Market interventions
Sources of vulnerability
Weak food markets:
l High food prices∑l Seasonal food
shortages∑l Food supply
shortages∑l Food price
volatility
Harvest failure dueto erratic rainfall
Affected groups
Poor market-dependent net foodpurchasers in ruraland urban areas,including production-deficit farmers whoare forced to sellt h e i r crops immediately afterharvest at excessivelylow food prices andto buy food back atexcessively highprices during thehungry season
∑
l Rainfed-dependent farmers ∑
Social protectioninterventions
l Food price subsidies (universalor untargeted)∑
l Food vouchers (targeted)
l∑ Grain reserve management
l∑ Grain futures markets
l Food price banding
l∑ Pan-seasonal pricing
∑l Pan-territorial
pricing ∑
l Weather-based insurance
Objectives
l Enhance access to food by subsidising prices of staples∑
l Provide an entitlement to a basic food basket in the form of redeemable vouchers∑
l Stabilise food suppliesby buying food afterharvest and releasingit on the market in the hungry season∑
l Ensure access to adequate food imports at guaranteedprices by buying options or futures∑
l Control food price movements by setting a floor price for producers and a ceiling price for consumers, or by fixing prices across the year and in all parts of the country
Insure farmers againstcrop failure by compensating them iferratic rains reducetheir harvests