The Malawi Vulnerability Assessment Committee(MVAC) · The Reserve ank of Malawi (RM) projects...
7
INTEGRATED FOOD SECURITY PHASE CLASSIFICATION AND FORECAST 2018 KEY HIGHLIGHTS The Northern Region received normal to above while the Centre and South receive below normal rainfall. The Centre and South experienced prolonged dry spells averaging 2-4 weeks while the North experienced minimal dry spells in isolated places. Fall army worms infesta- ons were reported in all districts but unlike last year control measures were sponta- neous this season thus minimising impact. Maize producon has dropped from 3.5million MT to 2.7 million MT represenng 28%. Maize prices will conn- ue to rise from December 2018 to March 2019, but trending slightly above the five-year average. The 2018 VAA forecast projected that 3.3 people will require assistance from 2 to 4 months. SMART survey results of February 2018 have shown overall nutrional status of under-five chil- dren was within accepta- ble ranges per WHO global standards (prevalence <5%) 1. Context and Background Malawi’s economic growth outlook for 2018 has been weakened mainly due to the impact of dry spells, Fall Army Worm (FAW) and intermient power supply. Real GDP is projected to be around 4.03 % in 2018; (down from 5.1%in 2017) 4.65 % in 2019; and 4.8 % in 2020. Poverty remains a fundamental issue: 51.54 % below the naonal poverty line and 20.1 % being ultra-poor. The Reserve Bank of Malawi (RBM) projects annual average inflaon for 2018 stood at around 9.0%. Despite the recent reducon in inflaon, the RBM hints that risks to inflaon outlook persist largely due to rising global oil market prices. The recent in- crease in fuel prices is likely to have a significant impact on the pricing of goods and services in general, food prices in parcular. The official exchange rate connues to be stable, trading at around K726 (middle rate) against the United States dollar. Aſter two consecuve bad producon years, last year’s harvest saw a much-needed return to normalcy (3.5 million tones of maize produced). However, the 2018 maize producon is esmated to drop (by 28%) to 2.7 million tones, largely due to pro- longed dry spells and fall army worm infestaon. According to the FEWSNET July18 Outlook Report, naonal maize carryover stocks are esmated at around 200,000 MT (ADMARC, SGR). Naonal average maize prices have remained depressed since 2017 but are likely to start increasing from July to October, 2018 but projected to trend below the five year average. From November 2018, prices will experience significant increases and trend above the five-year aver- age. Seasonal forecast for the 2018/2019 producon season is so far poinng towards an El Nino phenomenon associated with below average rainfall for the Southern Africa Region. However, the forecast remains uncertain up unl the Southern Africa Regional Climate Outlook Forum (SARCOF) meeng in August, 2018 and in-country modelling. 2. Food Security Forecast April 2018 to March 2019 The Malawi Vulnerability Assessment Commiee (MVAC) conducted the 2018 annu- al vulnerability assessment and analysis (VAA) field work between 10th June and 28th July, 2018. Data analysis was done between 2nd and 7th August 2018. The main objecve of the assessment was to assess the impact of hazards on food and nutrion and food security on the rural populaon during the 2018/2019 Consump- on Season. Specific objecves include the following: The Malawi Vulnerability Assessment Committee(MVAC) Government of the Republic of Malawi MALAWI Vulnerability Assessment Committee VAC Bulletin No. 15/18Volume 1
Transcript of The Malawi Vulnerability Assessment Committee(MVAC) · The Reserve ank of Malawi (RM) projects...
INTEGRATED FOOD SECURITY PHASE CLASSIFICATION AND FORECAST 2018
KEY HIGHLIGHTS
The Northern Region
received normal to
above while the Centre
and South receive below
normal rainfall.
The Centre and South
experienced prolonged
dry spells averaging 2-4
weeks while the North
experienced minimal dry
spells in isolated places.
Fall army worms infesta-
tions were reported in
all districts but unlike
last year control
measures were sponta-
neous this season thus
minimising impact.
Maize production has
dropped from 3.5million
MT to 2.7 million MT
representing 28%.
Maize prices will contin-
ue to rise from December
2018 to March 2019, but
trending slightly above
the five-year average.
The 2018 VAA forecast
projected that 3.3 people
will require assistance
from 2 to 4 months.
SMART survey results of
February 2018 have
shown overall nutritional
status of under-five chil-
dren was within accepta-
ble ranges per WHO
global standards
(prevalence <5%)
1. Context and Background
Malawi’s economic growth outlook for 2018 has been weakened mainly due to the
impact of dry spells, Fall Army Worm (FAW) and intermittent power supply. Real
GDP is projected to be around 4.03 % in 2018; (down from 5.1%in 2017) 4.65 % in
2019; and 4.8 % in 2020. Poverty remains a fundamental issue: 51.54 % below the
national poverty line and 20.1 % being ultra-poor.
The Reserve Bank of Malawi (RBM) projects annual average inflation for 2018 stood
at around 9.0%. Despite the recent reduction in inflation, the RBM hints that risks to
inflation outlook persist largely due to rising global oil market prices. The recent in-
crease in fuel prices is likely to have a significant impact on the pricing of goods and
services in general, food prices in particular. The official exchange rate continues to
be stable, trading at around K726 (middle rate) against the United States dollar.
After two consecutive bad production years, last year’s harvest saw a much-needed
return to normalcy (3.5 million tones of maize produced). However, the 2018 maize
production is estimated to drop (by 28%) to 2.7 million tones, largely due to pro-
longed dry spells and fall army worm infestation.
According to the FEWSNET July18 Outlook Report, national maize carryover stocks
are estimated at around 200,000 MT (ADMARC, SGR). National average maize prices
have remained depressed since 2017 but are likely to start increasing from July to
October, 2018 but projected to trend below the five year average. From November
2018, prices will experience significant increases and trend above the five-year aver-
age.
Seasonal forecast for the 2018/2019 production season is so far pointing towards
an El Nino phenomenon associated with below average rainfall for the Southern
Africa Region. However, the forecast remains uncertain up until the Southern Africa
Regional Climate Outlook Forum (SARCOF) meeting in August, 2018 and in-country
modelling.
2. Food Security Forecast April 2018 to March 2019
The Malawi Vulnerability Assessment Committee (MVAC) conducted the 2018 annu-
al vulnerability assessment and analysis (VAA) field work between 10th June and
28th July, 2018. Data analysis was done between 2nd and 7th August 2018. The
main objective of the assessment was to assess the impact of hazards on food and
nutrition and food security on the rural population during the 2018/2019 Consump-
tion Season. Specific objectives include the following:
The Malawi Vulnerability Assessment Committee(MVAC)
Government of the
Republic of Malawi
MALAWI
Vulnerability Assessment Committee
VAC
Bulletin No. 15/18Volume 1

to assess and classify severity and causes of food
insecurity for the affected population.
recommend appropriate interventions to mitigate
impacts of shocks and vulnerability.
3. Methodology
MVAC used both primary and secondary data for its
food security analysis. Data was collected through three
separate assessments viz: a Nutritional SMART survey
conducted by UNICEF through LUANAR; a combined
Household Economy Approach (HEA)/ Market Assess-
ment conducted by MVAC; and a Comprehensive
Household Food Security Survey (CHHFSS) conducted by
MVAC. Secondary data included, but not limited to:
APES third round; Ministry of Agriculture, Irrigation and
Water Development (AMIS) price data, FEWSNET price
data, NSO inflation and population projections, District
Agriculture Office (DAO) reports and many others.
Overall data analysis was done using an Integrated Food
Security Phase Classification (IPC) Analytical Framework.
4. Key Findings
4.1 The 2017/2018 Rainfall Season
After SARCOF forecast was released in August 2017, Ma-
lawi and was expected to receive normal to above nor-
mal rainfall amounts between October, 2017 and March
2018. However, it turned out that the Northern districts
received normal to above normal (with a few districts
reporting dry spells of 1-2 weeks) rainfall while the Cen-
tre and the South received below normal rainfall and
experienced prolonged dry spells between December
2017 and January 2018. The dry spells ranged from 2 to
4 weeks and had varying degrees of impact on district
crop production.
4.2 Fall Army Worms (FAW)
All districts reported infestation of Fall Army Worm with
varying intensities. However, this year farmers were
better prepared and quickly responded by reporting to field agricultural extension staff who in turn provided chemi-
cals to deal with the pest. Despite dealing with the pest under rain-fed crop, FAW still poses a threat to maize that is/
will be under irrigation.
4.3 2017/2018 Production Season
Third Round Agriculture Production Estimates Survey (APES R3) results released in June show that staple maize produc-
tion has dropped from 3,464,139 to 2,697,959, representing a 28.4% drop over last year and 20.3% over five year aver-
age. Other crops that have registered drops are: rice by 7.8%; wheat by 2.2%; millet by 12%; sorghum by 9.1%; pota-
FIG 1. DISTRICT OVERALL IPC PHASE CLASSFICATION
toes by 8.9%; groundnuts by 12.1%; cotton by 23%; pulses by 10.1%; beans by 5.5%;pigeon peas by 8.2 % and soya
beans by 18.9%.
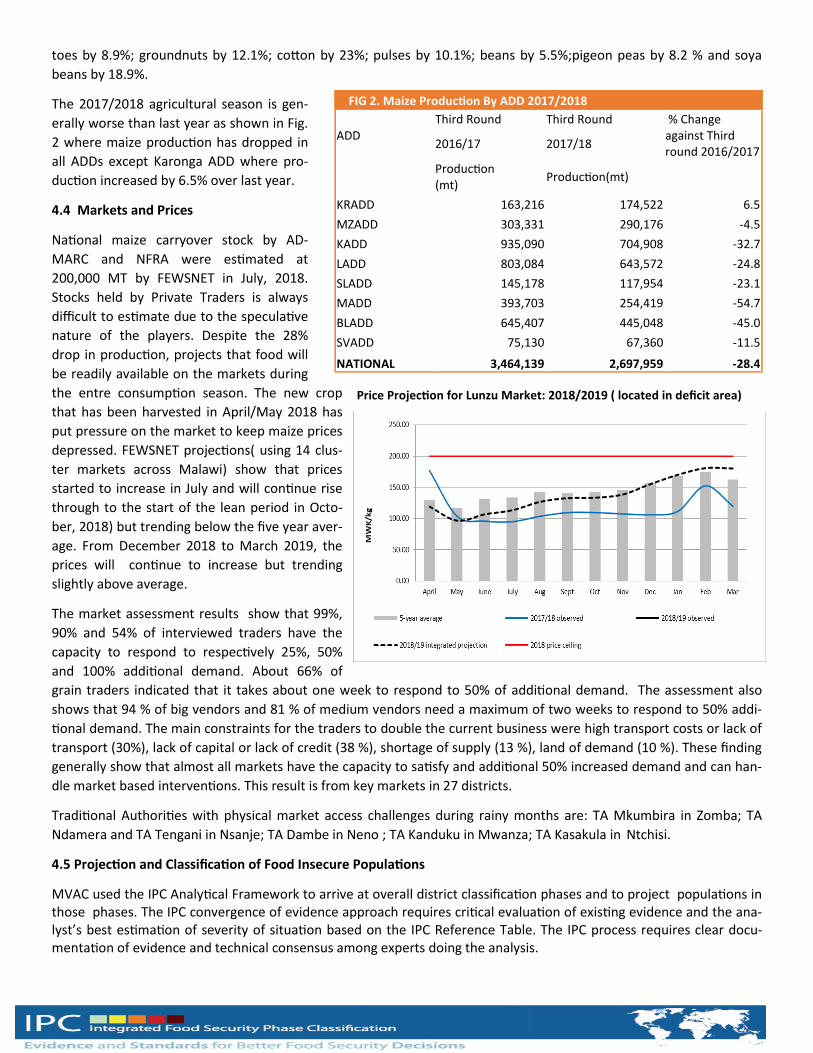
The 2017/2018 agricultural season is gen-
erally worse than last year as shown in Fig.
2 where maize production has dropped in
all ADDs except Karonga ADD where pro-
duction increased by 6.5% over last year.
4.4 Markets and Prices
National maize carryover stock by AD-
MARC and NFRA were estimated at
200,000 MT by FEWSNET in July, 2018.
Stocks held by Private Traders is always
difficult to estimate due to the speculative
nature of the players. Despite the 28%
drop in production, projects that food will
be readily available on the markets during
the entre consumption season. The new crop
that has been harvested in April/May 2018 has
put pressure on the market to keep maize prices
depressed. FEWSNET projections( using 14 clus-
ter markets across Malawi) show that prices
started to increase in July and will continue rise
through to the start of the lean period in Octo-
ber, 2018) but trending below the five year aver-
age. From December 2018 to March 2019, the
prices will continue to increase but trending
slightly above average.
The market assessment results show that 99%,
90% and 54% of interviewed traders have the
capacity to respond to respectively 25%, 50%
and 100% additional demand. About 66% of
grain traders indicated that it takes about one week to respond to 50% of additional demand. The assessment also
shows that 94 % of big vendors and 81 % of medium vendors need a maximum of two weeks to respond to 50% addi-
tional demand. The main constraints for the traders to double the current business were high transport costs or lack of
transport (30%), lack of capital or lack of credit (38 %), shortage of supply (13 %), land of demand (10 %). These finding
generally show that almost all markets have the capacity to satisfy and additional 50% increased demand and can han-
dle market based interventions. This result is from key markets in 27 districts.
Traditional Authorities with physical market access challenges during rainy months are: TA Mkumbira in Zomba; TA
Ndamera and TA Tengani in Nsanje; TA Dambe in Neno ; TA Kanduku in Mwanza; TA Kasakula in Ntchisi.
4.5 Projection and Classification of Food Insecure Populations
MVAC used the IPC Analytical Framework to arrive at overall district classification phases and to project populations in those phases. The IPC convergence of evidence approach requires critical evaluation of existing evidence and the ana-lyst’s best estimation of severity of situation based on the IPC Reference Table. The IPC process requires clear docu-mentation of evidence and technical consensus among experts doing the analysis.
FIG 2. Maize Production By ADD 2017/2018
ADD Third Round Third Round % Change
against Third round 2016/2017
2016/17 2017/18
Production (mt)
Production(mt)
KRADD 163,216 174,522 6.5
MZADD 303,331 290,176 -4.5
KADD 935,090 704,908 -32.7
LADD 803,084 643,572 -24.8
SLADD 145,178 117,954 -23.1
MADD 393,703 254,419 -54.7
BLADD 645,407 445,048 -45.0
SVADD 75,130 67,360 -11.5
NATIONAL 3,464,139 2,697,959 -28.4
Price Projection for Lunzu Market: 2018/2019 ( located in deficit area)

MALAWI 2018 IPC ANALYSIS POPULATION TABLE
MALAWI I2018 PC ACUTE ANALYSIS –POPULATION TABLE

Basically, the IPC analysis converges evidence/
information from food security contributing
factors (vulnerability and acute events/
conditions and how they impact on food securi-
ty dimensions) and food security outcome ele-
ments (food consumption, livelihood change,
mortality and nutritional status. The contrib-
uting factors define the context while the out-
come elements indicators are measured against
global thresholds when doing the classification
of severity and causes of food insecurity in the
district.
Based on the IPC analysis, MVAC projects that 3,306, 405 people are falling in IPC Phase 3 or worse and would
require humanitarian assistance ranging from 2 to 4 months duration during the 2018/2019 consumption year .
The cost of cereal requirement for the ration is estimated at 138,488 metric tones with a cash equivalency of
23.5 MK Billion (based on a projected market price of MK170/kg). The affected population is from all 27 dis-
tricts that were assessed during the 2018 vulnerability assessment. Likoma was not covered because of logistical
and funding challenges. The analysis established that a population of 6,914,285 were classified to be in IPC
Phase 1 (Minimal) and 5,030,032 people are in IPC Phase 2 (Stressed). The populations in phase 1 and 2 are
able to meet essential food requirements hence need livelihood protection and resilience building interventions
and not humanitarian assistance aimed at filling food gaps as those in phase 3 or worse phases.
If we compare our population figure of affected people to our SADC counterparts; Mozambique has reported
531,476; neighbouring Zambia: 954,120 and Zimbabwe 2,423, 568 people. This means Malawi tops among the
Southern Africa Region
District Total Affected Population Deficit months Maize Requirement (MT) Cash Equivalent (MK) '000
Balaka 166,036 6 9,962 1,693,567
Blantyre 131,113 6 7,867 1,337,353
Chikhwawa 210,438 5 10,522 1,788,723
Chiradzulu 92,819 5 4,641 788,962
Chitipa 7,044 2 141 23,950
Dedza 181,285 4 7,251 1,232,738
Dowa 123,499 2 2,470 419,897
Karonga 42,594 2 852 144,820
Kasungu 139,132 5 6,957 1,182,622
Lilongwe 219,679 4 8,787 1,493,817
Machinga 187,105 5 9,355 1,590,393
Mangochi 350,727 5 17,536 2,981,180
Mchinji 81,930 2 1,639 278,562
Mulanje 181,116 4 7,245 1,231,589
Mwanza 33,162 4 1,326 225,502
Mzimba 147,057 5 7,353 1,249,985
Neno 56,260 4 2,250 382,568
Nkhata bay 7,409 2 148 25,191
Nkhotakota 72,988 2 1,460 248,159
Nsanje 108,999 6 6,540 1,111,790
Ntcheu 124,014 3 3,720 632,471
Ntchisi 55,282 2 1,106 187,959
Phalombe 113,107 3 3,393 576,846
Rumphi 5,648 2 113 19,203
Salima 151,258 5 7,563 1,285,693
Thyolo 121,086 2 2,422 411,692
Zomba 195,618 3 5,869 997,652
Total 3,306,405 138,488 23,542,880
FIG 4. Affected Population in Phase 3 or worse
This projection is based on the following assumptions:
maize market prices will trend below the five year average up to October, 2018 and slightly above five-year
average between November, 2018 and March, 2019.
markets will function normally throughout the season without irregular factors getting into play
Humanitarian will be launched in time to assist the affected population
The 2018/2019 production season will be normal
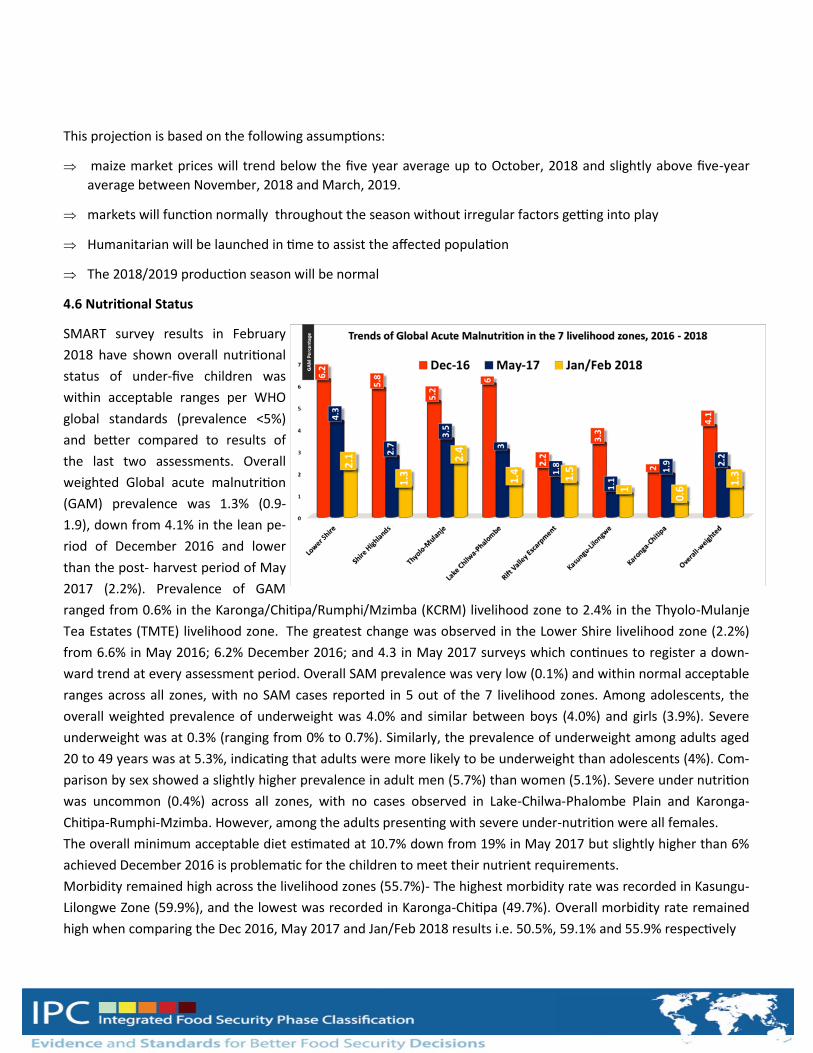
4.6 Nutritional Status
SMART survey results in February
2018 have shown overall nutritional
status of under-five children was
within acceptable ranges per WHO
global standards (prevalence <5%)
and better compared to results of
the last two assessments. Overall
weighted Global acute malnutrition
(GAM) prevalence was 1.3% (0.9-
1.9), down from 4.1% in the lean pe-
riod of December 2016 and lower
than the post- harvest period of May
2017 (2.2%). Prevalence of GAM
ranged from 0.6% in the Karonga/Chitipa/Rumphi/Mzimba (KCRM) livelihood zone to 2.4% in the Thyolo-Mulanje
Tea Estates (TMTE) livelihood zone. The greatest change was observed in the Lower Shire livelihood zone (2.2%)
from 6.6% in May 2016; 6.2% December 2016; and 4.3 in May 2017 surveys which continues to register a down-
ward trend at every assessment period. Overall SAM prevalence was very low (0.1%) and within normal acceptable
ranges across all zones, with no SAM cases reported in 5 out of the 7 livelihood zones. Among adolescents, the
overall weighted prevalence of underweight was 4.0% and similar between boys (4.0%) and girls (3.9%). Severe
underweight was at 0.3% (ranging from 0% to 0.7%). Similarly, the prevalence of underweight among adults aged
20 to 49 years was at 5.3%, indicating that adults were more likely to be underweight than adolescents (4%). Com-
parison by sex showed a slightly higher prevalence in adult men (5.7%) than women (5.1%). Severe under nutrition
was uncommon (0.4%) across all zones, with no cases observed in Lake-Chilwa-Phalombe Plain and Karonga-
Chitipa-Rumphi-Mzimba. However, among the adults presenting with severe under-nutrition were all females.
The overall minimum acceptable diet estimated at 10.7% down from 19% in May 2017 but slightly higher than 6%
achieved December 2016 is problematic for the children to meet their nutrient requirements.
Morbidity remained high across the livelihood zones (55.7%)- The highest morbidity rate was recorded in Kasungu-
Lilongwe Zone (59.9%), and the lowest was recorded in Karonga-Chitipa (49.7%). Overall morbidity rate remained
high when comparing the Dec 2016, May 2017 and Jan/Feb 2018 results i.e. 50.5%, 59.1% and 55.9% respectively

Despite an improvement in Acute Malnutrition rates, the anticipated looming hunger will compromise the nutri-
tion status of vulnerable children, women those living with TB, HIV and AIDS.
5. Key Issues to Monitor
Fall Army Worm (FAW) attack on irrigated crop as well as the next rain-fed crop
Maize prices from September to the end of the 2018/2019 consumption year
Informal cross-border trade of maize and other food crops
GAM rates in areas where the situation is worsening
6. Recommendations
1) The major humanitarian assistance programmes should be implemented for all districts with populations classified in IPC Phase 3 or worse.
2) Populations in Phases 1 and 2 should be targeted with livelihoods protection and resilience building inter-ventions.
3) Nutrition interventions to all children, pregnant and lactating women affected by acute malnutrition should continue despite GAM rates showing improvement.
4) Results from a mini-market survey points towards market-based response interventions, but a fully fledged market assessment update is strongly recommended.