Voronoi Diagrams - Fortune's Algorithm and Applications
15
Voronoi Diagrams Fortune’s Algorithm and Applications Kevin Wittmer Mentor: Rob Maschal DRP Summer 2016 Kevin Wittmer, Mentor: Rob Maschal Voronoi Diagrams DRP Summer 2016 1 / 15
Transcript of Voronoi Diagrams - Fortune's Algorithm and Applications
Voronoi DiagramsFortune’s Algorithm and Applications
Kevin WittmerMentor: Rob Maschal
DRP Summer 2016
Kevin Wittmer, Mentor: Rob Maschal Voronoi Diagrams DRP Summer 2016 1 / 15
Introduction
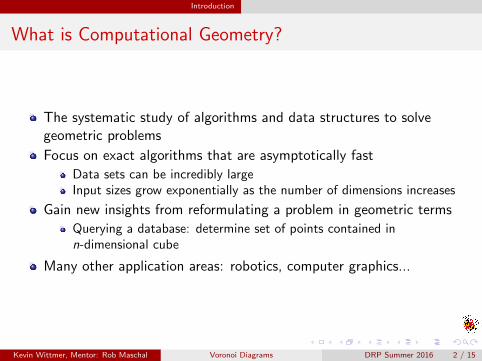
What is Computational Geometry?
The systematic study of algorithms and data structures to solvegeometric problems
Focus on exact algorithms that are asymptotically fast
Data sets can be incredibly largeInput sizes grow exponentially as the number of dimensions increases
Gain new insights from reformulating a problem in geometric terms
Querying a database: determine set of points contained inn-dimensional cube
Many other application areas: robotics, computer graphics...
Kevin Wittmer, Mentor: Rob Maschal Voronoi Diagrams DRP Summer 2016 2 / 15
Introduction
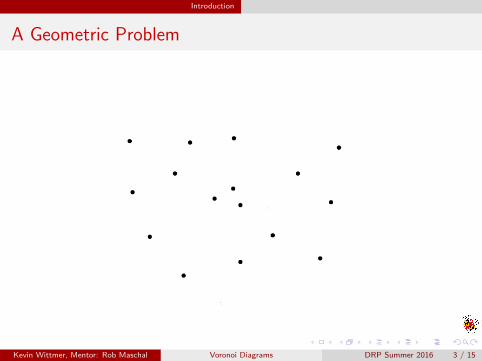
A Geometric Problem
Kevin Wittmer, Mentor: Rob Maschal Voronoi Diagrams DRP Summer 2016 3 / 15
Introduction
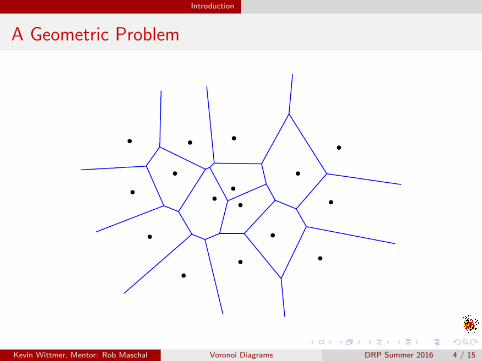
A Geometric Problem
Kevin Wittmer, Mentor: Rob Maschal Voronoi Diagrams DRP Summer 2016 4 / 15
Introduction
Definitions
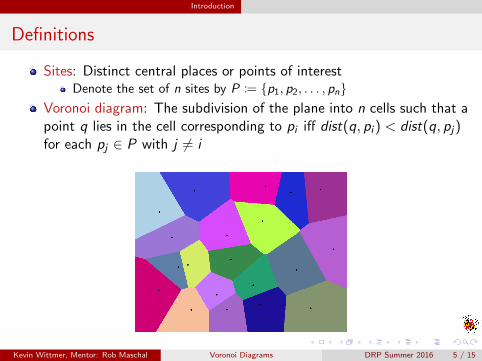
Sites: Distinct central places or points of interestDenote the set of n sites by P := {p1, p2, . . . , pn}
Voronoi diagram: The subdivision of the plane into n cells such that apoint q lies in the cell corresponding to pi iff dist(q, pi ) < dist(q, pj)for each pj ∈ P with j 6= i
Kevin Wittmer, Mentor: Rob Maschal Voronoi Diagrams DRP Summer 2016 5 / 15
Introduction
A Naıve Algorithm
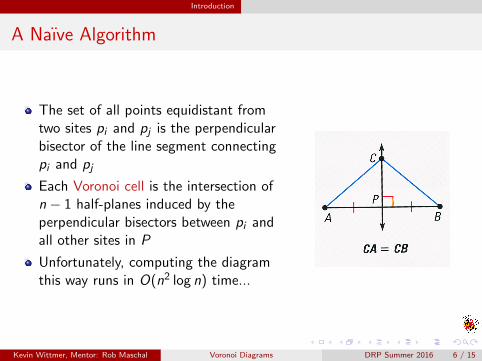
The set of all points equidistant fromtwo sites pi and pj is the perpendicularbisector of the line segment connectingpi and pj
Each Voronoi cell is the intersection ofn − 1 half-planes induced by theperpendicular bisectors between pi andall other sites in P
Unfortunately, computing the diagramthis way runs in O(n2 log n) time...
Kevin Wittmer, Mentor: Rob Maschal Voronoi Diagrams DRP Summer 2016 6 / 15
Fortune’s Algorithm
Plane Sweep Paradigm
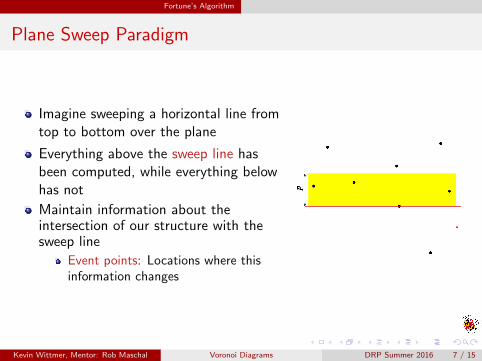
Imagine sweeping a horizontal line fromtop to bottom over the plane
Everything above the sweep line hasbeen computed, while everything belowhas not
Maintain information about theintersection of our structure with thesweep line
Event points: Locations where thisinformation changes
Kevin Wittmer, Mentor: Rob Maschal Voronoi Diagrams DRP Summer 2016 7 / 15
Fortune’s Algorithm
Beach Line
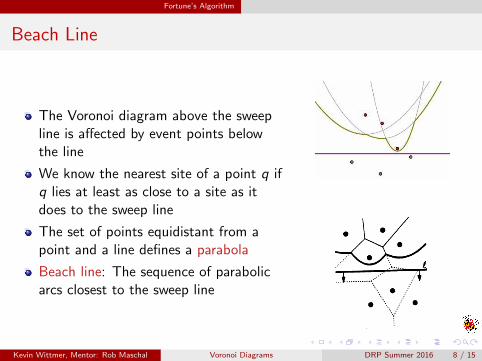
The Voronoi diagram above the sweepline is affected by event points belowthe line
We know the nearest site of a point q ifq lies at least as close to a site as itdoes to the sweep line
The set of points equidistant from apoint and a line defines a parabola
Beach line: The sequence of parabolicarcs closest to the sweep line
Kevin Wittmer, Mentor: Rob Maschal Voronoi Diagrams DRP Summer 2016 8 / 15
Fortune’s Algorithm
Break Points
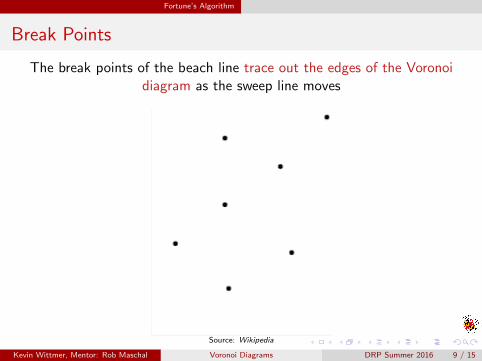
The break points of the beach line trace out the edges of the Voronoidiagram as the sweep line moves
Source: Wikipedia
Kevin Wittmer, Mentor: Rob Maschal Voronoi Diagrams DRP Summer 2016 9 / 15
Fortune’s Algorithm
Event Points
Site event: Correspond to adding a new edge to the diagram
These are our predetermined events
Circle event: Correspond to adding a new vertex to the diagram
Dynamically added as we process site events
Kevin Wittmer, Mentor: Rob Maschal Voronoi Diagrams DRP Summer 2016 10 / 15
Fortune’s Algorithm
Fortune’s Algorithm
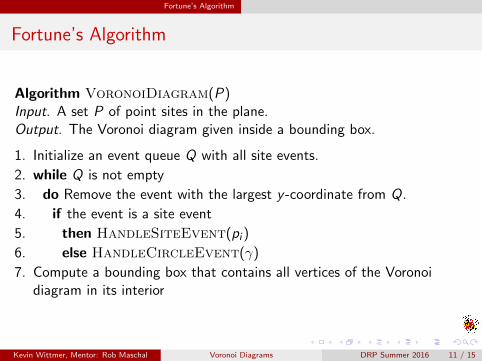
Algorithm VoronoiDiagram(P)Input. A set P of point sites in the plane.Output. The Voronoi diagram given inside a bounding box.
1. Initialize an event queue Q with all site events.
2. while Q is not empty
3. do Remove the event with the largest y -coordinate from Q.
4. if the event is a site event
5. then HandleSiteEvent(pi )
6. else HandleCircleEvent(γ)
7. Compute a bounding box that contains all vertices of the Voronoidiagram in its interior
Kevin Wittmer, Mentor: Rob Maschal Voronoi Diagrams DRP Summer 2016 11 / 15
Fortune’s Algorithm
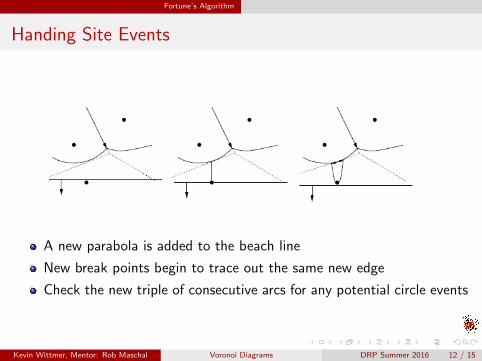
Handing Site Events
A new parabola is added to the beach line
New break points begin to trace out the same new edge
Check the new triple of consecutive arcs for any potential circle events
Kevin Wittmer, Mentor: Rob Maschal Voronoi Diagrams DRP Summer 2016 12 / 15
Fortune’s Algorithm
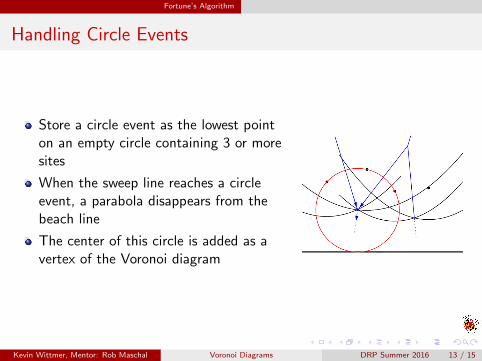
Handling Circle Events
Store a circle event as the lowest pointon an empty circle containing 3 or moresites
When the sweep line reaches a circleevent, a parabola disappears from thebeach line
The center of this circle is added as avertex of the Voronoi diagram
Kevin Wittmer, Mentor: Rob Maschal Voronoi Diagrams DRP Summer 2016 13 / 15
Fortune’s Algorithm
Conclusion
Theorem
The Voronoi diagram of n point sites can be computed in O(n log n) timeusing Fortune’s algorithm
Kevin Wittmer, Mentor: Rob Maschal Voronoi Diagrams DRP Summer 2016 14 / 15
Fortune’s Algorithm
References
de Berg, Cheong, van Kreveld, OvermarsComputational Geometry: Algorithms and ApplicationsSpringer, 2008.
David M. MountCMSC754 Computational Geometry Lecture Notesp. 67 - 74
Kevin Wittmer, Mentor: Rob Maschal Voronoi Diagrams DRP Summer 2016 15 / 15