Vopak Half Year 2018 financial results · Amsterdam 1,216,000 Hainan 1,339,000 cbm Per February Per...
31
Vopak Half Year 2018 financial results Analyst presentation - 17 August 2018
Transcript of Vopak Half Year 2018 financial results · Amsterdam 1,216,000 Hainan 1,339,000 cbm Per February Per...

Vopak Half Year 2018 financial results Analyst presentation - 17 August 2018
2
Forward-looking statementsThis presentation contains ‘forward-looking statements’, based on currently available plans and forecasts. By their nature,
forward-looking statements involve risks and uncertainties because they relate to events and depend on circumstances
that may or may not occur in the future, and Vopak cannot guarantee the accuracy and completeness of forward-looking
statements.
These risks and uncertainties include, but are not limited to, factors affecting the realization of ambitions and financial
expectations, developments regarding the potential capital raising, exceptional income and expense items, operational
developments and trading conditions, economic, political and foreign exchange developments and changes to IFRS
reporting rules.
Vopak’s outlook does not represent a forecast or any expectation of future results or financial performance.
Statements of a forward-looking nature issued by the company must always be assessed in the context of the events,
risks and uncertainties of the markets and environments in which Vopak operates. These factors could lead to actual
results being materially different from those expected, and Vopak does not undertake to publicly update or revise any of
these forward-looking statements.
2HY1 2018 – Analyst presentation

Chairman of the Executive Board
and CEO of Royal VopakEelcoHoekstra

4
Key messages
Satisfactory financial results, given market conditions to date
Execution of our strategy towards 2019 is well on track
• Efficiency program to support margin development has
been delivered and cost target for 2019 is increased
• Global roll out of terminal management system started
• Portfolio shifts in line with 4 strategic terminal types
HY1 2018 – Analyst presentation
Capture
growth
strategic direction
2017-2019
Spend EUR 750m
on sustaining and
service capex
Invest EUR 100m
in technology &
innovation
Drive further
productivity
HY1 2018 key messages

5
Product-market update
Oil products Oil hubs: solid long-term demand
drivers despite short-term weakness
Fuel oil: unsettled market
Fuel import-distribution market:
Solid growth in markets with
structural deficits
Strong underlying demand for
chemicals
Positive investment climate
petrochemical industry
Chemicals
Strong biofuels market despite
volatility due to anticipated
changes in government
subsidies
Incremental vegoil demand
fueled by improved price
competitiveness
Vegoils
& biofuels
Gases Strong growth in LNG imports in
Asia (including China)
Growing demand in LPG for
residential and petrochemical
markets
HY1 2018 – Analyst presentation
Diversified portfolio across different product-market segments

6
Key figures HY1 2018
CFFO (gross)In EUR million
36.0
341
Terminal networkIn million cbm
* Including net result from joint ventures and associates and excluding exceptional items
** Occupancy rate include subsidiaries only 6
EBITDA*In EUR million
371
86
Occupancy rate**In percent
LNG import facility - Engro Elengy Terminal Pakistan
39.2
HY1
2018:
2019:
HY1 2018 – Analyst presentation

7
Execution of strategy on track
HY1 2018 – Analyst presentation
Capture growth in the 2017-2019 period New projects in Malaysia, Indonesia,
Singapore, South Africa, Canada, Brazil
Spend maximum EUR 750 million on
sustaining and service improvement capex
for the period 2017-2019
Sustaining and service improvement capex
budget include investments for our fuel oil
network
Invest EUR 100 million in new technology,
innovation programs and replacing IT
systems
Terminal Management Software operational in
the US, global roll out started
Cybersecurity controls implemented
Drive further productivity and reduce the cost
base with at least EUR 25 million by 2019
Efficiency program increased to
EUR 40 million by 2019
Strategic direction is set towards growth and productivity improvement

8
PT2SB
360,000 cbm
130,000 cbm
1,496,000 cbm138,000 cbm
Industrial
Gas
Distribution
Hub
PITSB
430,000 cbm
106,000 cbm
100,000 cbm
Jakarta
100,000 cbm
Sebarok
67,000 cbm
Panama
Deer Park
Alemoa
Durban
Lesedi
RIPET
96,000 cbm
Portfolio developments
German LNG
Open season completed63,000 cbm
Botlek
EETPL
151,000 cbm
Merak
50,000 cbm
Focus on 4 strategic terminal types
HY1 2018 – Analyst presentation

9
Terminals under strategic reviewHamburg
669,000
Estonia
1,026,000
403,000 cbm
Algeciras
Amsterdam
1,216,000
Hainan
1,339,000 cbm
Per February
Per August
HY1 2018 – Analyst presentation

10
Key messages
Satisfactory financial results, given market conditions to date
Execution of our strategy towards 2019 is well on track
• Efficiency program to support margin development has
been delivered and cost target for 2019 is increased
• Global roll out of terminal management system started
• Portfolio shifts in line with 4 strategic terminal types
Capture
growth
strategic direction
2017-2019
Spend EUR 750m
on sustaining and
service capex
Invest EUR 100m
in technology &
innovation
Drive further
productivity
HY1 2018 key messages
HY1 2018 – Analyst presentation

Member of the Executive Board
and CFO of Royal VopakGerardPaulides

12
Summary financial performance
Capture
growth
strategic direction
2017-2019
Spend EUR 750m
on sustaining and
service capex
Invest EUR 100m
in technology &
innovation
Drive further
productivity
Satisfactory financial performance with solid CFFO
Investment momentum (CFFI) towards 2019
Efficiency program to support margin development has been
delivered and cost target for 2019 is increased
Fuel oil terminals will be fully ready to support new market
requirements in 2020
HY1 2018 key messages
HY1 2018 – Analyst presentation

13
19.5
9.3
5.21.7 6.7
7.8 5.4
Adjusted
HY1 2017
Europe &
Africa
FX-effect
374.6
HY1
2018
HY1
2017
Asia &
Middle East
LNG Americas China &
North Asia
394.1
Others
370.9
HY1 2018 vs HY1 2017 EBITDA
Figures in EUR million, excluding exceptional items including net result from joint ventures and associates
Adjusted for adverse currency translation effects HY1 2018 EBITDA
was comparable to prior year.
HY1 2018 – Analyst presentation

14
Americas
32.4 30.8 30.3 32.2 34.9
89 88 89 90 90
Q3
2017
Q2
2018
Q1
2018
Q2
2017
Q4
2017
LNG
Europe & Africa
China & North Asia
Divisional segmentation
78.8 80.8 85.2 80.8 74.5
90 90 90 86 83
Q4
2017
Q3
2017
Q2
2017
Q1
2018
Q2
2018
6.5 4.5 4.88.9 11.9
70 69 70 77 79
Q3
2017
Q4
2017
Q2
2017
Q1
2018
Q2
2018
Occupancy rate (in percent) for subsidiaries
only, with the exception of LNG
EBITDA (in EUR million) excluding exceptional
items and including net result from JVs &
associates and currency effects
Asia & Middle East
71.7 65.2 66.3 64.0 66.5
91 90 88 89 86
Q4
2017
Q2
2017
Q3
2017
Q2
2018
Q1
2018
8.6 9.1 6.7 8.3 9.6
95 95 95 95 95
Q2
2017
Q4
2017
Q3
2017
Q1
2018
Q2
2018
Europe & Africa and Asia & Middle East oil hub weakness, Americas,
China & North Asia and LNG benefit from strong chemical and gas markets
HY1 2018 – Analyst presentation
15
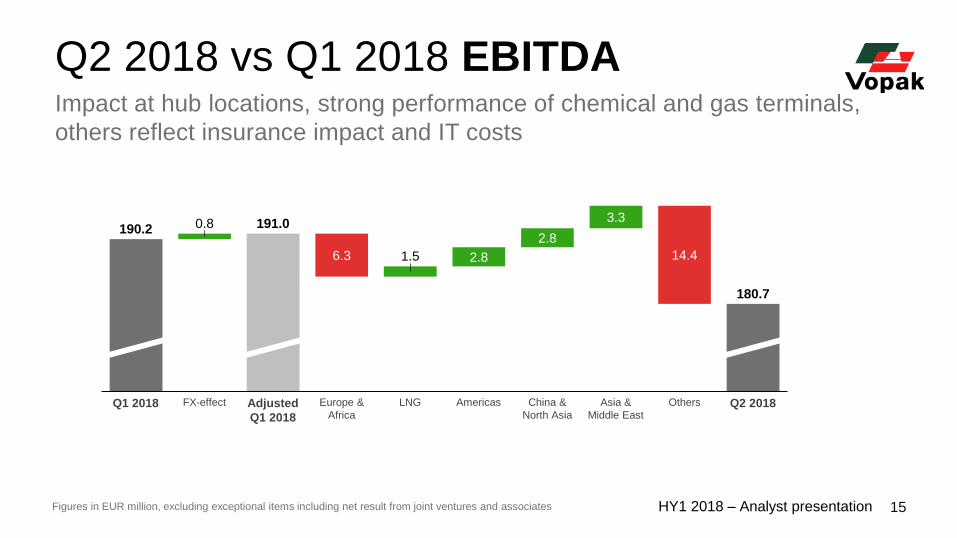
Q2 2018 vs Q1 2018 EBITDA
0.8
6.3 1.5 2.8
2.8
3.3
14.4
190.2
FX-effectQ1 2018 Adjusted
Q1 2018
Europe &
Africa
LNG Americas China &
North Asia
Asia &
Middle East
Others Q2 2018
191.0
180.7
Figures in EUR million, excluding exceptional items including net result from joint ventures and associates
Impact at hub locations, strong performance of chemical and gas terminals,
others reflect insurance impact and IT costs
HY1 2018 – Analyst presentation

16
Cash flow overview
341
313
115
28
108
119
29
Tax & other
operating items
Growth
investments
Other
CFFICFFO
(gross)
CFFO
(net)
Sustaining, service
improvement & IT
investments
Free Cash
Flow before
financing
Figures in EUR million
Investment momentum (CFFI) towards 2019
HY1 2018 – Analyst presentation
Half year 2018

17
Investment phasing
Investments 2008-2019In EUR million
1,8992,012
1,729
850
2008 -
2010
2011 -
2013
2017 -
2019
2014 -
2016
900
Other
investments***
New
projects*
Note: Includes all announcements project to date, subject to currency changes* For illustration purposes only, new announcements might increase future growth investments** Growth capex at subsidiaries and equity injections for JV’s and associates for among others announced growth projects*** Forecasted sustaining, service improvement and IT capex including investments in fuel oil network
Growth
investments**
Investments 2017-2019In EUR million
Additional growth
investments
HY2
2018
~125
~240~110
FY
2019
HY1
2018
2017
~120
~365
~230
~EUR 175 million of
projects with capacity
expansion announced
in 2018:
• Indonesia – Jakarta
• Singapore – Sebarok
• Netherlands – Botlek
• Pakistan – EETPL
• Indonesia – Merak
HY1 2018 – Analyst presentation

18
Fuel Oil and bunkering networkTerminals will be fully ready to support new market requirements in 2020
Fuel oil hub terminal
Fuel oil bunker terminal
Fuel oil export terminal
Algeciras
Panama
Los Angeles
Rotterdam
Conversion
Hamburg
Rail infrastructure
Estonia
Strategic review
Fujairah
Conversion
Singapore
Expansion
Conversion:
Rotterdam
Fujairah
Hamburg
Expansion:
Singapore
HY1 2018 – Analyst presentation

19
Our terminal in Venezuela operates in a
continuously deteriorating economic, social
and political environment
The increase in the speed of the deterioration of
the economic environment triggers Vopak to
monitor its accounting position in HY2 2018
Accumulated unrealized currency translation
losses recognized in Vopak’s Equity amounted to
EUR 47.3 million at year-end 2017
Net equity exposure less than EUR 1 million
In July, Vopak formalized the agreement
regarding a new pension plan that qualifies as a
defined contribution plan under IAS 19
The settlement of the pension liability resulted in
an exceptional gain before tax of EUR 19.1 million
VenezuelaIAS 19 Defined contribution plan
Subsequent & portfolio events
IAS19 pension provision HY1 July FY ‘18
Defined Benefit Provision (opening) 54.2 56.6 54.2
IFRS DB costs recognized in P&L 13.7 2.3 16.0
Employer cash contribution in P&L -9.9 -1.7 -11.6
Change in actuarial assumptions (in OCI) -1.4 -16.3 -17.7
Cash contribution Dutch pension plan -18.0 -18.0
Gain on settlement 22.9 22.9
Defined Benefit Provision (closing) 56.6 - -
Exceptional item per period -3.8 22.9 19.1
HY1 2018 – Analyst presentation

20
No changes in economics,
only changes in accounting
Effects on Vopak’s key metrics*
Applicable as from 1 January 2019
Vopak has a portfolio of long-term land leases
and leases of other non-current assets
Annual Report 2017:
• Operating lease expenses of EUR 66 million
• Off-balance operating lease commitments of
EUR 1,145 million
Significant large land leases that are in the
process of being renewed will be included in
the lease liability per end 2018
IFRS 16 Leases
Impact for VopakIFRS 16 Leases
Metric Effect
Performance:
EBITDA significant
Net profit /
Cash flows:
Operational cash flows significant
Financial cash flows significant
Total cash flows none
Covenants:
Senior Net debt : EBITDA** none
Further details are specified in Note 1.3 of the Half Year Report 2018
* Comparative figures are not required to be restated. Vopak intends to voluntarily disclose comparative figures
** The Senior net debt : EBITDA for ratio calculation purposes is based on Frozen GAAP and not impacted by IFRS 16 Leases
HY1 2018 – Analyst presentation

21
466 441 411
HY1
2016
HY1
2017
HY1
2018
94 91 84
HY1
2016
HY1
2017
HY1
2018
421 394 371
HY1
2016
HY1
2017
HY1
2018
94 91 86
HY1
2018
HY1
2016
HY1
2017
Non-IFRS proportionate informationIF
RS
BA
SE
DN
ON
-IF
RS
PR
OP
OR
TIO
NA
TE
Occupancy rateIn percent
EBITDAIn EUR million
Occupancy rateIn percent
EBITDAIn EUR million
Non-IFRS proportionate
information provides
transparency in Vopak’s
underlying performance
and free cash flow
generating capacity
excluding exceptional items
113 100 115
HY1
2016
HY1
2017
HY1
2018
104 96 108
HY1
2016
HY1
2017
HY1
2018
Maintenance, Service
& IT CapexIn EUR million
Maintenance, Service
& IT CapexIn EUR million
HY1 2018 – Analyst presentation

22
Summary financial performance
Capture
growth
strategic direction
2017-2019
Spend EUR 750m
on sustaining and
service capex
Invest EUR 100m
in technology &
innovation
Drive further
productivity
Satisfactory financial performance with solid CFFO
Investment momentum (CFFI) towards 2019
Efficiency program to support margin development has been
delivered and cost target for 2019 is increased
Fuel oil terminals will be fully ready to support new market
requirements in 2020
HY1 2018 key messages
HY1 2018 – Analyst presentation

23
Looking ahead
• The financial performance in 2018 is expected to be influenced by currency exchange movements
of primarily the USD and SGD, and the currently less favorable oil market structure, impacting
occupancy rates and price levels in the hub locations
• Given the current 3.2 million cbm expansion program for 2019 with high commercial coverage,
in conjunction with the cost efficiency delivery, Vopak has the potential to significantly improve
the 2019 EBITDA, subject to market conditions and currency exchange movements
• Our efficiency program to support margin development and reduce Vopak’s future cost base with
at least EUR 25 million has been delivered and is increased to EUR 40 million. As a result of the
efficiency program the cost base for 2019, at current exchange rates, including EUR 15 million
additional cost from growth projects, is expected to be below the 2017 reported operating cost
of EUR 676 million
23HY1 2018 – Analyst presentation

Questions
& answers
The world’s leading independent
tank storage company building
on an impressive history of more
than 400 years

For more information please contact:
Investor Relations contact:
Laurens de Graaf, Head of Investor Relations
Telephone: +31 (0)10 400 2776
e-mail: [email protected]
Media contact:
Liesbeth Lans, Manager External Communications
Telephone: +31 (0)10 400 2777
e-mail: [email protected]
Royal Vopak
Westerlaan 10
3016 CK Rotterdam
The Netherlands
www.vopak.com
Royal Vopak
17 August 2018
Analyst presentation
HY1 2018 Results
Upcoming events:
Publication of 2018 third-quarter interim update5 November 2018
Capital Markets Days 2018Houston, Texas, US
27-28 November 2018
Publication of 2018 annual results13 February 2019
26
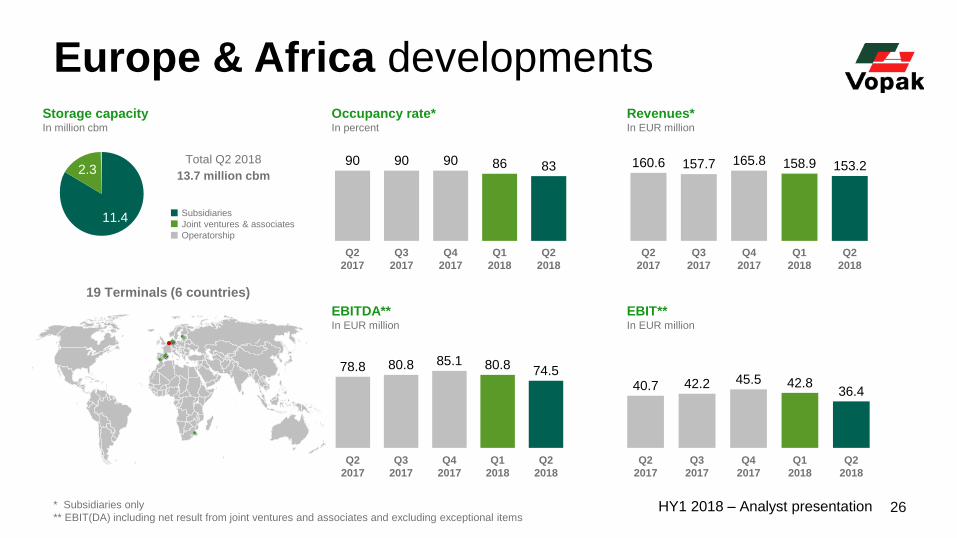
Europe & Africa developmentsOccupancy rate*In percent
160.6 157.7 165.8 158.9 153.2
Q2
2017
Q3
2017
Q4
2017
Q1
2018
Q2
2018
90 90 90 86 83
Q4
2017
Q2
2017
Q3
2017
Q1
2018
Q2
2018
Revenues*In EUR million
EBITDA** In EUR million
78.8 80.8 85.1 80.8 74.5
Q2
2017
Q3
2017
Q1
2018
Q2
2018
Q4
2017
* Subsidiaries only
** EBIT(DA) including net result from joint ventures and associates and excluding exceptional items
EBIT** In EUR million
40.7 42.2 45.5 42.836.4
Q1
2018
Q2
2017
Q3
2017
Q2
2018
Q4
2017
19 Terminals (6 countries)
Storage capacityIn million cbm
11.4
2.3
Subsidiaries
Joint ventures & associates
Operatorship
Total Q2 2018
13.7 million cbm
HY1 2018 – Analyst presentation
27
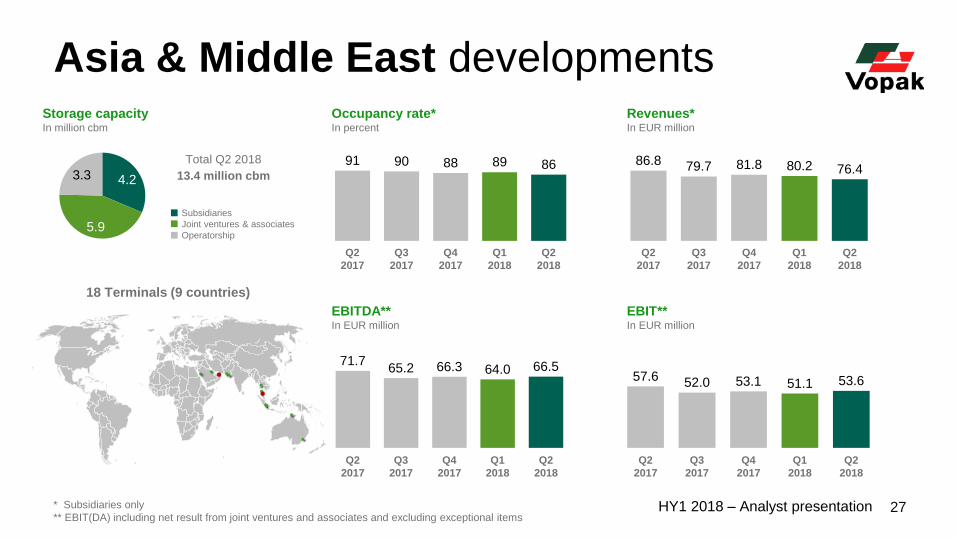
Asia & Middle East developmentsOccupancy rate*In percent
86.8 79.7 81.8 80.2 76.4
Q3
2017
Q4
2017
Q2
2017
Q1
2018
Q2
2018
91 90 88 89 86
Q2
2017
Q3
2017
Q4
2017
Q1
2018
Q2
2018
Revenues*In EUR million
EBITDA** In EUR million
71.765.2 66.3 64.0 66.5
Q2
2017
Q3
2017
Q4
2017
Q1
2018
Q2
2018
* Subsidiaries only
** EBIT(DA) including net result from joint ventures and associates and excluding exceptional items
EBIT** In EUR million
57.6 52.0 53.1 51.1 53.6
Q1
2018
Q3
2017
Q2
2017
Q4
2017
Q2
2018
18 Terminals (9 countries)
Storage capacityIn million cbm
4.2
5.9
3.3
Subsidiaries
Joint ventures & associates
Operatorship
Total Q2 2018
13.4 million cbm
HY1 2018 – Analyst presentation

28
China & North Asia developmentsOccupancy rate*In percent
7.7 7.4 7.28.4 8.6
Q3
2017
Q2
2017
Q4
2017
Q1
2018
Q2
2018
70 69 7077 79
Q1
2018
Q2
2017
Q3
2017
Q2
2018
Q4
2017
Revenues*In EUR million
EBITDA** In EUR million
6.54.5 4.8
8.9
11.9
Q2
2018
Q4
2017
Q2
2017
Q3
2017
Q1
2018
* Subsidiaries only
** EBIT(DA) including net result from joint ventures and associates and excluding exceptional items
EBIT** In EUR million
4.12.3 2.6
6.8
9.6
Q2
2017
Q2
2018
Q3
2017
Q4
2017
Q1
2018
9 Terminals (3 countries)
Storage capacityIn million cbm
0.7
3.5Subsidiaries
Joint ventures & associates
Operatorship
Total Q2 2018
4.2 million cbm
HY1 2018 – Analyst presentation

29
Americas developmentsOccupancy rate*In percent
71.8 66.8 69.3 68.4 71.5
Q3
2017
Q2
2017
Q4
2017
Q2
2018
Q1
2018
89 88 89 90 90
Q2
2017
Q1
2018
Q3
2017
Q4
2017
Q2
2018
Revenues*In EUR million
EBITDA** In EUR million
32.4 30.8 30.3 32.2 34.9
Q2
2017
Q1
2018
Q3
2017
Q4
2017
Q2
2018
* Subsidiaries only
** EBIT(DA) including net result from joint ventures and associates and excluding exceptional items
EBIT** In EUR million
20.6 19.6 19.0 21.024.2
Q3
2017
Q2
2017
Q4
2017
Q2
2018
Q1
2018
18 Terminals (7 countries)
Storage capacityIn million cbm
3.3Subsidiaries
Joint ventures & associates
Operatorship
Total Q2 2018
3.9 million cbm0.50.1
HY1 2018 – Analyst presentation
30
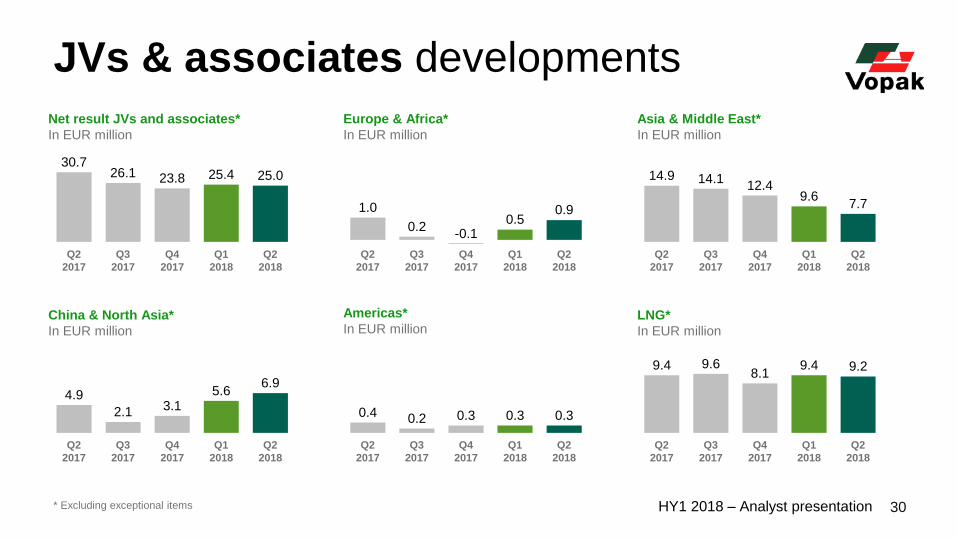
JVs & associates developments
Net result JVs and associates*
In EUR million
* Excluding exceptional items
Europe & Africa*
In EUR million
Asia & Middle East*
In EUR million
China & North Asia*
In EUR million
Americas*
In EUR millionLNG*
In EUR million
30.726.1 23.8 25.4 25.0
Q1
2018
Q4
2017
Q2
2017
Q3
2017
Q2
2018
1.0
0.20.5
0.9
Q2
2017
Q3
2017
Q1
2018
Q4
2017
Q2
2018
14.9 14.112.4
9.67.7
Q2
2018
Q1
2018
Q2
2017
Q3
2017
Q4
2017
4.9
2.1 3.15.6
6.9
Q2
2017
Q3
2017
Q1
2018
Q4
2017
Q2
2018
0.4 0.2 0.3 0.3 0.3
Q2
2018
Q2
2017
Q3
2017
Q4
2017
Q1
2018
9.4 9.68.1
9.4 9.2
Q1
2018
Q2
2017
Q2
2018
Q3
2017
Q4
2017
-0.1
HY1 2018 – Analyst presentation
31
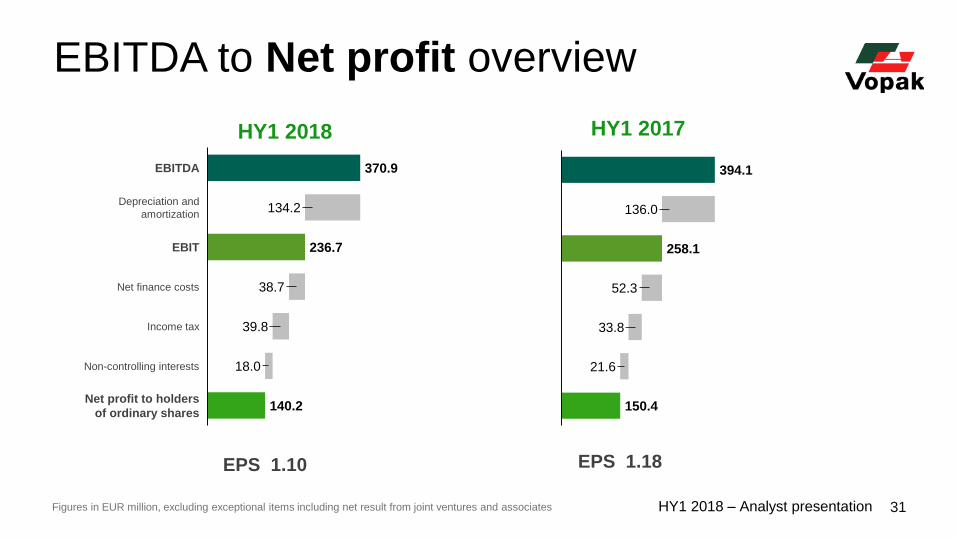
EBITDA to Net profit overview
370.9
236.7
140.2
134.2
38.7
39.8
18.0
EBITDA
Income tax
Net finance costs
Depreciation and
amortization
EBIT
Non-controlling interests
Net profit to holders
of ordinary shares
HY1 2018 HY1 2017
394.1
258.1
150.4
136.0
52.3
33.8
21.6
Figures in EUR million, excluding exceptional items including net result from joint ventures and associates
EPS 1.10 EPS 1.18
HY1 2018 – Analyst presentation