Vopak - Pan European Days
14
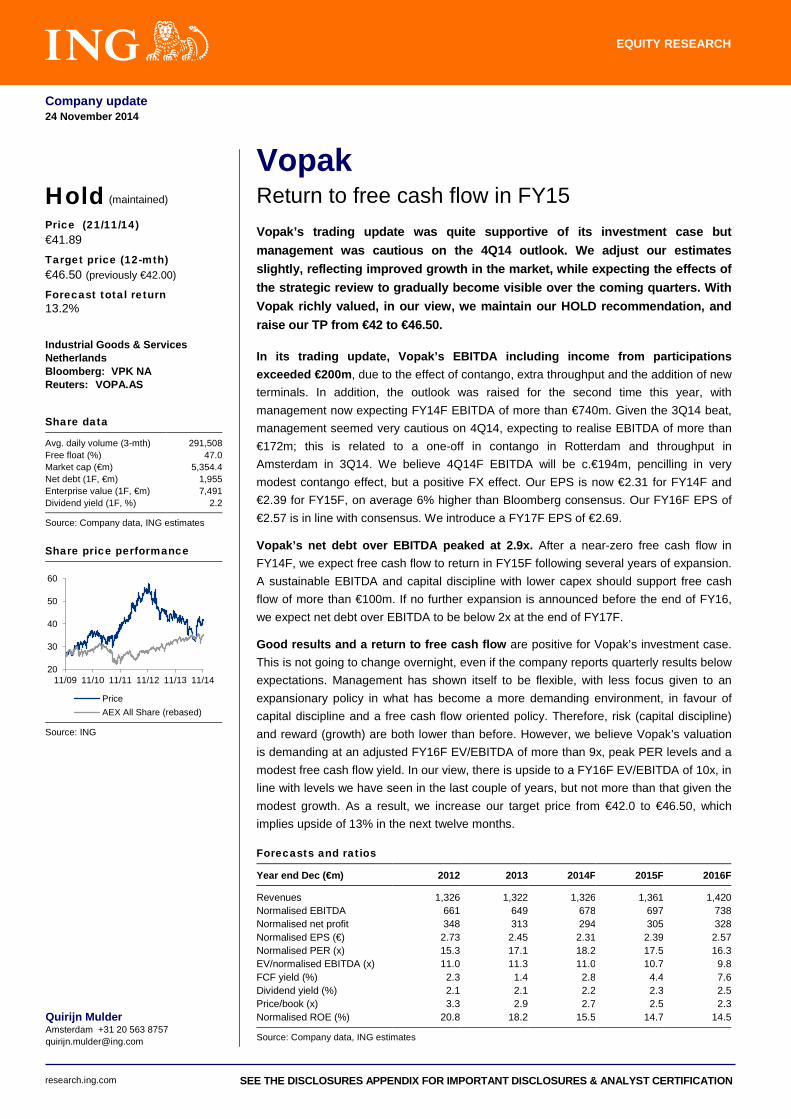
Vopak Return to free cash flow in FY15 Company update 24 November 2014 Vopak’s trading update was quite supportive of its investment case but management was cautious on the 4Q14 outlook. We adjust our estimates slightly, reflecting improved growth in the market, while expecting the effects of the strategic review to gradually become visible over the coming quarters. With Vopak richly valued, in our view, we maintain our HOLD recommendation, and raise our TP from €42 to €46.50. In its trading update, Vopak’s EBITDA including income from participations exceeded €200m, due to the effect of contango, extra throughput and the addition of new terminals. In addition, the outlook was raised for the second time this year, with management now expecting FY14F EBITDA of more than €740m. Given the 3Q14 beat, management seemed very cautious on 4Q14, expecting to realise EBITDA of more than €172m; this is related to a one-off in contango in Rotterdam and throughput in Amsterdam in 3Q14. We believe 4Q14F EBITDA will be c.€194m, pencilling in very modest contango effect, but a positive FX effect. Our EPS is now €2.31 for FY14F and €2.39 for FY15F, on average 6% higher than Bloomberg consensus. Our FY16F EPS of €2.57 is in line with consensus. We introduce a FY17F EPS of €2.69. Vopak’s net debt over EBITDA peaked at 2.9x. After a near-zero free cash flow in FY14F, we expect free cash flow to return in FY15F following several years of expansion. A sustainable EBITDA and capital discipline with lower capex should support free cash flow of more than €100m. If no further expansion is announced before the end of FY16, we expect net debt over EBITDA to be below 2x at the end of FY17F. Good results and a return to free cash flow are positive for Vopak’s investment case. This is not going to change overnight, even if the company reports quarterly results below expectations. Management has shown itself to be flexible, with less focus given to an expansionary policy in what has become a more demanding environment, in favour of capital discipline and a free cash flow oriented policy. Therefore, risk (capital discipline) and reward (growth) are both lower than before. However, we believe Vopak’s valuation is demanding at an adjusted FY16F EV/EBITDA of more than 9x, peak PER levels and a modest free cash flow yield. In our view, there is upside to a FY16F EV/EBITDA of 10x, in line with levels we have seen in the last couple of years, but not more than that given the modest growth. As a result, we increase our target price from €42.0 to €46.50, which implies upside of 13% in the next twelve months. Forecasts and ratios Year end Dec (€m) 2012 2013 2014F 2015F 2016F Revenues 1,326 1,322 1,326 1,361 1,420 Normalised EBITDA 661 649 678 697 738 Normalised net profit 348 313 294 305 328 Normalised EPS (€) 2.73 2.45 2.31 2.39 2.57 Normalised PER (x) 15.3 17.1 18.2 17.5 16.3 EV/normalised EBITDA (x) 11.0 11.3 11.0 10.7 9.8 FCF yield (%) 2.3 1.4 2.8 4.4 7.6 Dividend yield (%) 2.1 2.1 2.2 2.3 2.5 Price/book (x) 3.3 2.9 2.7 2.5 2.3 Normalised ROE (%) 20.8 18.2 15.5 14.7 14.5 Source: Company data, ING estimates Quirijn Mulder Amsterdam +31 20 563 8757 [email protected] Hold (maintained) Price (21/11/14) €41.89 Target price (12-mth) €46.50 (previously €42.00) Forecast total return 13.2% Industrial Goods & Services Netherlands Bloomberg: VPK NA Reuters: VOPA.AS Share data Avg. daily volume (3-mth) 291,508 Free float (%) 47.0 Market cap (€m) 5,354.4 Net debt (1F, €m) 1,955 Enterprise value (1F, €m) 7,491 Dividend yield (1F, %) 2.2 Source: Company data, ING estimates Share price performance 20 30 40 50 60 11/09 11/10 11/11 11/12 11/13 11/14 Price AEX All Share (rebased) Source: ING EQUITY RESEARCH research.ing.com SEE THE DISCLOSURES APPENDIX FOR IMPORTANT DISCLOSURES & ANALYST CERTIFICATION
Transcript of Vopak - Pan European Days
Vopak November 2014
1
Vopak Return to free cash flow in FY15
Company update 24 November 2014
Vopak’s trading update was quite supportive of its investment case but management was cautious on the 4Q14 outlook. We adjust our estimates slightly, reflecting improved growth in the market, while expecting the effects of the strategic review to gradually become visible over the coming quarters. With Vopak richly valued, in our view, we maintain our HOLD recommendation, and raise our TP from €42 to €46.50.
In its trading update, Vopak’s EBITDA including income from participations exceeded €200m, due to the effect of contango, extra throughput and the addition of new terminals. In addition, the outlook was raised for the second time this year, with management now expecting FY14F EBITDA of more than €740m. Given the 3Q14 beat, management seemed very cautious on 4Q14, expecting to realise EBITDA of more than €172m; this is related to a one-off in contango in Rotterdam and throughput in Amsterdam in 3Q14. We believe 4Q14F EBITDA will be c.€194m, pencilling in very modest contango effect, but a positive FX effect. Our EPS is now €2.31 for FY14F and €2.39 for FY15F, on average 6% higher than Bloomberg consensus. Our FY16F EPS of €2.57 is in line with consensus. We introduce a FY17F EPS of €2.69.
Vopak’s net debt over EBITDA peaked at 2.9x. After a near-zero free cash flow in FY14F, we expect free cash flow to return in FY15F following several years of expansion. A sustainable EBITDA and capital discipline with lower capex should support free cash flow of more than €100m. If no further expansion is announced before the end of FY16, we expect net debt over EBITDA to be below 2x at the end of FY17F.
Good results and a return to free cash flow are positive for Vopak’s investment case. This is not going to change overnight, even if the company reports quarterly results below expectations. Management has shown itself to be flexible, with less focus given to an expansionary policy in what has become a more demanding environment, in favour of capital discipline and a free cash flow oriented policy. Therefore, risk (capital discipline) and reward (growth) are both lower than before. However, we believe Vopak’s valuation is demanding at an adjusted FY16F EV/EBITDA of more than 9x, peak PER levels and a modest free cash flow yield. In our view, there is upside to a FY16F EV/EBITDA of 10x, in line with levels we have seen in the last couple of years, but not more than that given the modest growth. As a result, we increase our target price from €42.0 to €46.50, which implies upside of 13% in the next twelve months.
Forecasts and ratios
Year end Dec (€m) 2012 2013 2014F 2015F 2016F
Revenues 1,326 1,322 1,326 1,361 1,420 Normalised EBITDA 661 649 678 697 738 Normalised net profit 348 313 294 305 328 Normalised EPS (€) 2.73 2.45 2.31 2.39 2.57 Normalised PER (x) 15.3 17.1 18.2 17.5 16.3 EV/normalised EBITDA (x) 11.0 11.3 11.0 10.7 9.8 FCF yield (%) 2.3 1.4 2.8 4.4 7.6 Dividend yield (%) 2.1 2.1 2.2 2.3 2.5 Price/book (x) 3.3 2.9 2.7 2.5 2.3 Normalised ROE (%) 20.8 18.2 15.5 14.7 14.5
Source: Company data, ING estimates
Quirijn Mulder Amsterdam +31 20 563 8757 [email protected]
Hold (maintained)
Price (21/11/14)
€41.89
Target price (12-mth)
€46.50 (previously €42.00)
Forecast total return 13.2%
Industrial Goods & Services Netherlands Bloomberg: VPK NA Reuters: VOPA.AS
Share data
Avg. daily volume (3-mth) 291,508 Free float (%) 47.0 Market cap (€m) 5,354.4 Net debt (1F, €m) 1,955 Enterprise value (1F, €m) 7,491 Dividend yield (1F, %) 2.2
Source: Company data, ING estimates
Share price performance
20
30
40
50
60
11/09 11/10 11/11 11/12 11/13 11/14
PriceAEX All Share (rebased)
Source: ING
EQUITY RESEARCH
research.ing.com SEE THE DISCLOSURES APPENDIX FOR IMPORTANT DISCLOSURES & ANALYST CERTIFICATION

Vopak November 2014
2
Strategic review slowly becoming visible Management has in previous years commented that Vopak makes good returns when terminal utilisation is at a rate of 90-95%. It has warned that falling out of that range might put results under pressure. Since 1Q13, utilisation has fallen to a new range of 85-90% for the group. For 3Q14, utilisation was 89%, however, in spite of the ‘out-of-range’ utilisation rate, Vopak has realised an all-time high EBITDA.
This is what we have referred to as the realisation of a silver lining in previous reports: management’s focus on expansion while keeping costs under control, even in a tougher environment with pressure on prices. Together with some contango effects in 3Q14, this has led to favourable results. On the basis of recent measures, we see the next step as a greater focus on free cash flow from a ‘leaner and meaner’ portfolio of around 65 terminals, visibility on which should be realised in the coming years. However, issues have still to be solved as several product/market combinations are far from optimal.
The recent collapse in the oil price is a positive development for Vopak with the return of contango since markets develop an increased appetite to store oil in such an environment. This is not part of Vopak’s policy, but a welcome short-term cash flow effect. Long-term market trends for more storage remain, but demand growth is less exuberant than in the past due to a macroeconomic slowdown and the effects of the energy transition in the US. Given the rapidly changing environment, it remains, for example, difficult to balance an attractive risk/reward for a planned US project even when possessing a strategic location.
3Q14 Vopak’s 3Q14 trading update came in ahead of expectations: EBITDA including income from participations was €202m. With consensus looking for €185m and our forecast of €186m, the beat was 9%. The FY14 EBITDA outlook was raised from >€700m to >€740m; also a clear beat versus our estimate of €740m and consensus at c.€725m.
Fig 1 Key figures for 3Q14 (€m)
3Q14 3Q14F Diff (%) 3Q13 %chYoY Consensus Diff (%)
Revenue 337.6 311.5 8 319.5 6 n/a n/a EBITDA incl. income from part. 201.9 185.7 9 185.6 9 185 9 Group operating income (EBIT) 141.5 125.3 13 131.8 7 125 13 Net income 82.3 n/a n/a 72.6 13 76 8 EPS (€) 0.65 n/a n/a 0.56 16 0.60 8
Source: Company data, ING estimates
The improvement for the group stems mainly from utilisation rates up from 87% in 3Q13 to 89% in 3Q14, while pricing remains subdued, according to Vopak. Further, the acquisition of Canadian Canterm, and expansion at Penjuru (Singapore) and Lanshan (China) contributed to earnings as well. Several segments were not encouraging, such as biofuels which still faces unclear legislation.
Fig 2 Breakdown of group EBIT (€m)
3Q14 3Q14F Diff (%) 3Q13 Diff (%)
Netherlands 46.4 40.9 13 42.2 10 Europe, Middle East & Africa 17.8 14.0 27 21.6 -18 Asia 62.5 58.9 6 57.1 9 Americas 15.5 13.9 12 12.9 20 Other and corporate (0.7) (2.7) -74 (2.0) -65 Total 141.5 125.0 13 131.8 7
Source: Company data, ING estimates
Good returns at 85-90%
First lower costs, then free cash flow
Guidance raised
Utilisation helped, especially in the Netherlands

Vopak November 2014
3
The Netherlands registered the most significant improvement YoY (in absolute terms). Utilisation in the Netherlands was up by 6ppt from 82% to 88%, with both Rotterdam and Amsterdam performing better than expected. Europoort Rotterdam benefited from demand for its crude terminals, as contango returned after three years of backwardation (Figures 3 and 4). Amsterdam benefited from ‘beyond contract’ throughput in gasoline. Some of these annual contracts ended in 3Q14. EBIT was €46m, up €4.2m or 13% YoY, showing contango benefits and higher throughput. However, other terminals like Laurenshaven were not strong.
The Far East was also better than expected, with higher utilisation at 95% compared with 94% last year. The increase in EBIT was 9%. A modest positive FX effect was offset by a negative EBIT from the start-up of Pengerang. Underlying growth was good also thanks to the Penjuru capacity expansion. North America was better thanks to acquisitions and the excellent performance of the Houston terminal. Weakness remains in EMEA: Estonia due to competition from the Russian East Luga terminal; Gothenburg continued to struggle with a low utilisation rate.
Vopak took an impairment charge of €29m and €4m for organisational alignments in 3Q14. The main impairment was for Dongguan (€16m), to reflect a modified outlook for the regional industry and capacity expansion by others. Another €10m impairment was taken for a cancelled business development project in Turkey.
Fig 3 Backwardation/contango of Brent forward curve (US$/bbl)
Fig 4 Backwardation/contango of the Gasoil (QS) forward curve (US$/MT)
-25
-20
-15
-10
-5
0
5
10
15
20
25
Apr 07 Apr 08 Mar 09 Feb 10 Feb 11 Jan 12 Dec 12 Dec 13 Nov 14
-150
-100
-50
0
50
100
150
200
250
Apr 07 Apr 08 Mar 09 Feb 10 Feb 11 Jan 12 Dec 12 Dec 13 Nov 14
Source: Datastream Source: Datastream
4Q14 and FY14 outlook Vopak raised its FY14F outlook for EBITDA including income from participations to more than €740m. Although a significant adjustment from the half-year outlook of >€700m, we find this to be conservative as Vopak has already realised €568m excluding exceptional items in the first nine months. With €202m reported in 3Q14 and an average of €183m in 1Q14 and 2Q14 (Figure 5), the implicit guidance for 4Q14F of >€172m would be materially lower than the average of the other three quarters. Vopak states that favourable 3Q14 EBIT in the Netherlands was of a one-off character as it is unable to expect benefits from contango in 4Q14, while the extra throughput in Amsterdam was particularly significant in 3Q14 and will not return in 4Q14. In addition, some start-up costs might be higher, but FX effects should become material in the last quarter (c.€3m of EBITA). We also believe that even a limited contango-related business could be possible in 4Q14: with any renting of empty tanks, revenues directly impact the bottom line. Although we expect a modest effect, this combined with a positive FX effect, leads us to believe that EBITDA in 4Q14F could be €194m (+6% YoY and -4% QoQ).
Far East also showed higher utilisation
We estimate 4Q14F EBITDA in a range of €185-195m
Europoort benefited from higher crude storage
Two impairments taken
Vopak November 2014
4
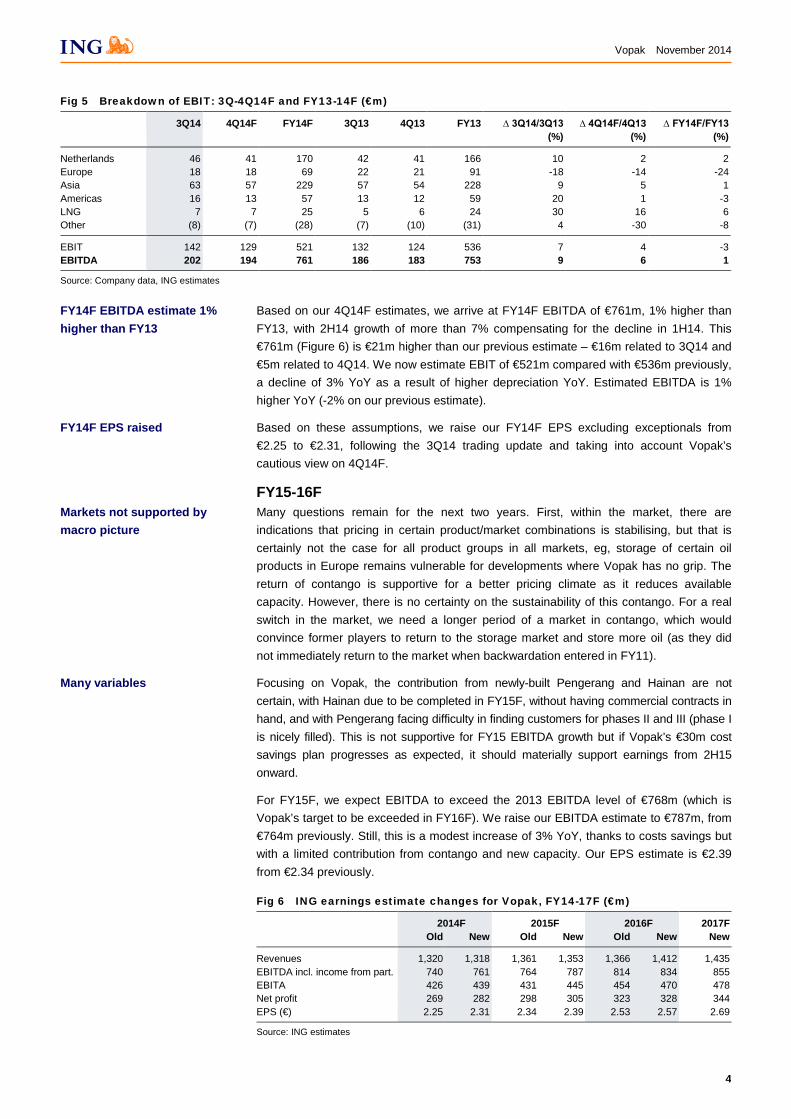
Fig 5 Breakdown of EBIT: 3Q-4Q14F and FY13-14F (€m)
3Q14 4Q14F FY14F 3Q13 4Q13 FY13 ∆ 3Q14/3Q13 (%)
∆ 4Q14F/4Q13 (%)
∆ FY14F/FY13 (%)
Netherlands 46 41 170 42 41 166 10 2 2 Europe 18 18 69 22 21 91 -18 -14 -24 Asia 63 57 229 57 54 228 9 5 1 Americas 16 13 57 13 12 59 20 1 -3 LNG 7 7 25 5 6 24 30 16 6 Other (8) (7) (28) (7) (10) (31) 4 -30 -8
EBIT 142 129 521 132 124 536 7 4 -3 EBITDA 202 194 761 186 183 753 9 6 1
Source: Company data, ING estimates
Based on our 4Q14F estimates, we arrive at FY14F EBITDA of €761m, 1% higher than FY13, with 2H14 growth of more than 7% compensating for the decline in 1H14. This €761m (Figure 6) is €21m higher than our previous estimate – €16m related to 3Q14 and €5m related to 4Q14. We now estimate EBIT of €521m compared with €536m previously, a decline of 3% YoY as a result of higher depreciation YoY. Estimated EBITDA is 1% higher YoY (-2% on our previous estimate).
Based on these assumptions, we raise our FY14F EPS excluding exceptionals from €2.25 to €2.31, following the 3Q14 trading update and taking into account Vopak’s cautious view on 4Q14F.
FY15-16F Many questions remain for the next two years. First, within the market, there are indications that pricing in certain product/market combinations is stabilising, but that is certainly not the case for all product groups in all markets, eg, storage of certain oil products in Europe remains vulnerable for developments where Vopak has no grip. The return of contango is supportive for a better pricing climate as it reduces available capacity. However, there is no certainty on the sustainability of this contango. For a real switch in the market, we need a longer period of a market in contango, which would convince former players to return to the storage market and store more oil (as they did not immediately return to the market when backwardation entered in FY11).
Focusing on Vopak, the contribution from newly-built Pengerang and Hainan are not certain, with Hainan due to be completed in FY15F, without having commercial contracts in hand, and with Pengerang facing difficulty in finding customers for phases II and III (phase I is nicely filled). This is not supportive for FY15 EBITDA growth but if Vopak’s €30m cost savings plan progresses as expected, it should materially support earnings from 2H15 onward.
For FY15F, we expect EBITDA to exceed the 2013 EBITDA level of €768m (which is Vopak’s target to be exceeded in FY16F). We raise our EBITDA estimate to €787m, from €764m previously. Still, this is a modest increase of 3% YoY, thanks to costs savings but with a limited contribution from contango and new capacity. Our EPS estimate is €2.39 from €2.34 previously.
Fig 6 ING earnings estimate changes for Vopak, FY14-17F (€m)
2014F 2015F 2016F 2017F Old New Old New Old New New
Revenues 1,320 1,318 1,361 1,353 1,366 1,412 1,435 EBITDA incl. income from part. 740 761 764 787 814 834 855 EBITA 426 439 431 445 454 470 478 Net profit 269 282 298 305 323 328 344 EPS (€) 2.25 2.31 2.34 2.39 2.53 2.57 2.69
Source: ING estimates
FY14F EBITDA estimate 1% higher than FY13
Markets not supported by macro picture
Many variables
FY14F EPS raised

Vopak November 2014
5
With regards to the divestment of 15 terminals, we believe that it will take one or two years as these terminals are well spread around the world and are not triple-A locations, while investments seem to have been low for a couple of years (as discussed in our previous report, Vopak, Storing more momentum? 3 September 2014). We believe these assets will continue to contribute to EBITDA for another year or two while cost savings filter through in FY15F and especially in FY16F.
For FY16F, we raise our EBITDA estimate from €814m to €834m, a YoY increase of 6%, being cautiously optimistic on the contribution from new projects and the expected effect of a slow disposal programme of terminals. This results in a relatively attractive EPS growth of 8% YoY to €2.57. Our previous EPS estimate was €2.53.
We introduce earnings estimates for FY17F with an EBITDA growth of 5%, EPS of €2.69 (3% growth); this seems modest mainly due to the lack of material expansion (the consequence of Vopak’s strategic shift towards capital discipline), while divestment of the 15 earmarked terminals should have taken place by that time, in our view, with then a miss of around €30m EBITDA.
Overall, we expect earnings growth in FY16F to be clearly higher (+8% YoY) than in FY15F (+4%) or FY17F (+5%), given the timing of certain divestments. The Chinese may also embrace the new distribution model placed in Hainan in FY16F, and not in FY15F.
ING estimates versus consensus How do our estimates compare with consensus? We are slightly ahead of consensus in FY14F and FY15F but do not believe that all analysts have adjusted their 3Q14 numbers as yet. Also, our EPS estimate for FY14F excludes exceptionals of around €0.10. Versus Bloomberg consensus FY14 EBITDA of €737m and Vopak guidance for FY14, we expect a higher FY14F EBITDA of c.€760m, with higher numbers for FY15F as well. For FY16F we expect higher EBITDA, but lower EPS at €2.57 compared with consensus at €2.61 as our depreciation is higher than consensus estimates. Overall, there is a small deviation, which supports our view that the market is well aware that Vopak will operate within a small margin in the years ahead.
Fig 7 ING estimates versus consensus, FY14-16F
FY14F FY15F FY16F ∆FY15F (%) ∆FY16F (%)
EBITDA (€m) Bloomberg 737 769 805 4.3 4.7 INGF 761 787 834 3.4 5.9 Deviation (%) 3 2 4
EPS (€) Bloomberg 2.15 2.27 2.61 5.4 14.8 INGF 2.31 2.39 2.57 3.8 7.5 Deviation (%) 7 5 -1
Source: Bloomberg, ING estimates
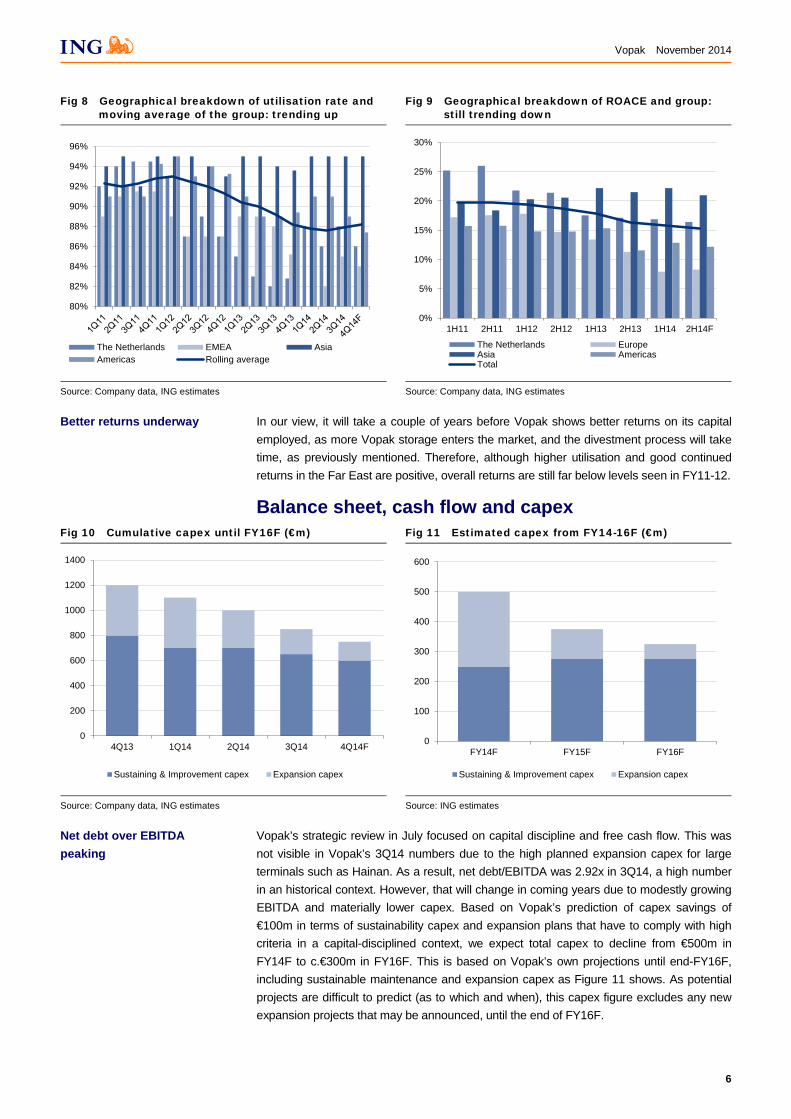
ROACE How does this fit in with the returns of Vopak? The following charts show the trends we expect: Figure 8 shows the utilisation of Vopak’s terminals by division and the trend of the group. The four-quarter moving-average is improving from trough levels in 1Q14, thanks mainly to the recovery in the Netherlands. At the same time (Figure 9), ROACE for the four divisions (excluding LNG) is still declining. So, higher utilisation is good for profitability but returns remain below the level of the last couple of years: currently c.15% versus 20% in FY11. This is related to Vopak’s major investments and, in our view, a pricing level for its terminals below what has been realised over the past couple of years. We believe that the main pricing pressure is felt in the ARA region, while a decline in throughput has hit Estonia in particular, also hurting ROACE.
ROACE down, utilisation up – is pricing the reason?
FY16F EBITDA increases from €814m to €834m
Introducing FY17F EPS estimate at €2.69
Divestment process takes a long time
Adjustments still underway
Vopak November 2014
6
Fig 8 Geographical breakdown of utilisation rate and moving average of the group: trending up
Fig 9 Geographical breakdown of ROACE and group: still trending down
80%
82%
84%
86%
88%
90%
92%
94%
96%
The Netherlands EMEA AsiaAmericas Rolling average
0%
5%
10%
15%
20%
25%
30%
1H11 2H11 1H12 2H12 1H13 2H13 1H14 2H14F
The Netherlands EuropeAsia AmericasTotal
Source: Company data, ING estimates Source: Company data, ING estimates
In our view, it will take a couple of years before Vopak shows better returns on its capital employed, as more Vopak storage enters the market, and the divestment process will take time, as previously mentioned. Therefore, although higher utilisation and good continued returns in the Far East are positive, overall returns are still far below levels seen in FY11-12.
Balance sheet, cash flow and capex Fig 10 Cumulative capex until FY16F (€m)
Fig 11 Estimated capex from FY14-16F (€m)
0
200
400
600
800
1000
1200
1400
4Q13 1Q14 2Q14 3Q14 4Q14F
Sustaining & Improvement capex Expansion capex
0
100
200
300
400
500
600
FY14F FY15F FY16F
Sustaining & Improvement capex Expansion capex
Source: Company data, ING estimates Source: ING estimates
Vopak’s strategic review in July focused on capital discipline and free cash flow. This was not visible in Vopak’s 3Q14 numbers due to the high planned expansion capex for large terminals such as Hainan. As a result, net debt/EBITDA was 2.92x in 3Q14, a high number in an historical context. However, that will change in coming years due to modestly growing EBITDA and materially lower capex. Based on Vopak’s prediction of capex savings of €100m in terms of sustainability capex and expansion plans that have to comply with high criteria in a capital-disciplined context, we expect total capex to decline from €500m in FY14F to c.€300m in FY16F. This is based on Vopak’s own projections until end-FY16F, including sustainable maintenance and expansion capex as Figure 11 shows. As potential projects are difficult to predict (as to which and when), this capex figure excludes any new expansion projects that may be announced, until the end of FY16F.
Better returns underway
Net debt over EBITDA peaking

Vopak November 2014
7
Thanks to lower capex, better-than-expected EBITDA and the estimated dividend stream from income from participations, we expect that Vopak will enter positive net free cash flow territory for the first time in many years (Figure 12). We estimate that FY14F net free cash flow will reach near-zero levels. For FY15F, we expect a free cash flow of over €120m, excluding €50m from divestments of terminals. Free cash flow is €210m in FY16F (excluding €150m estimated from disposal of the remaining terminals up for sale) and €260m in FY17F.
Fig 12 Net operating free cash flow FY08-17F (€m)
Fig 13 Net debt(€m) and net debt/EBITDA (x)
-500
-400
-300
-200
-100
0
100
200
300
2008 2009 2010 2011 2012 2013 2014F2015F2016F2017F
Net operating free cash flow
1.0
1.2
1.4
1.6
1.8
2.0
2.2
2.4
2.6
2.8
3.0
0
500
1,000
1,500
2,000
FY13 FY14F FY15F FY16F FY17F
Net debt (€m, lhs) Net debt/EBITDA (rhs)
Source: Company data, ING estimates Source: Company data, ING estimates
Figure 13 shows the impact of positive free cash flow in coming years on net debt and net debt/EBITDA. We expect net debt/EBITDA in FY17F to go below 2.0x, from an estimated 2.8x at end-FY14F. However, no new expansion has been announced for between now and FY17F; every €100m of expansion capex raises net debt/EBITDA by 12 basis points.
Valuation With FY14F almost at an end, we roll our valuation to FY15F and FY16F. Based on our full-year estimates, Vopak’s FY15F EV/EBITDA is 10.7x unadjusted, and 9.6x when adjusted for a comparable valuation of Vopak’s participation and joint ventures. For FY16F, the numbers are 9.8x and 9.1x, respectively. The PER is 17.4x for FY15F and 16.2x for FY16F. These numbers do not deviate materially from previous multiples.
Fig 14 EV/EBITDA, 2002-14F (x)
Fig 15 PER, 2002-14F (x)
4
5
6
7
8
9
10
11
12
13
14
7/2002 4/2004 1/2006 10/2007 7/2009 04/2011 1/2013 10/2014
EV/EBITDA unadj EV/EBITDA 12m average (unadj)
0
2
4
6
8
10
12
14
16
18
20
7/2002 4/2004 1/2006 10/2007 7/2009 04/2011 1/2013 10/2014
PER 12m moving forward
Source: Company data, ING estimates Source: Bloomberg
Free cash flow in FY16-17F over €200m
Net debt below 2x in FY17F
Multiples recovering after dip
Vopak November 2014
8
Based on the historical 12-month forward average, unadjusted EV/EBITDA multiples recovered, but are 25% off peak levels, as Figure 14 shows. This is in contrast with the PER which reaches all-time-high levels for a third time, as Figure 15 demonstrates. The main reason is that high capex leads to high depreciation and high interest charges, and subsequently low net profit. With Vopak now focusing on lower capex and capital discipline, PER might decline relative to EV/EBITDA.
Net free cash flow yield With Vopak returning to positive free cash flow territory, is it important to state that its FY15F net free cash flow yield over market cap is 2.3%, increasing to 4.0% in FY16F and 4.9% in FY17F; not exciting yet, but a point to watch carefully.
We raise our estimates for Vopak but, at the same time, the share price has recovered from c.€40 to €42, mainly thanks to raised guidance. As a result, the share price remains richly valued. Clearly, the quality of management is strong with a good strategy, and the business model is robust with strong positions worldwide. Importantly, management accepts changed market conditions and acts accordingly as the impact of the strategic update is likely to show over the coming quarters.
Moving forward, we believe it is justified to raise the target price for Vopak. For FY16F, we believe c.10x EV/EBITDA is possible in the next 12 months (from 10x FY15F EV/EBITDA previously). We see the following reasons for this:
a) Momentum of earnings is improving: we see more dynamics in the oil markets.
b) Initial benefits from the strategic review should become visible in FY15/16; this is not a short term strategy and the main impact will be seen beyond FY15.
Based on an EV/EBITDA of 10x, adjusted for income from participations, we arrive at a TP of €46.50, implying upside of 13.2% over the next 12 months. Based on a valuation that reflects a rich valuation on the one hand and slow earnings growth on the other, we believe a HOLD rating is justified.
TP raised from €42 to €46.5
Big difference between PER and EV/EBITDA worth watching
FCF yield of 4% in FY16F
Target 2016F EV/EBITDA of 10x
TP from €42.00 to €46.50

Vopak November 2014
9
Risks A downward risk to our HOLD recommendation is that too much capacity is being built up by Vopak and its rivals, which results in lower utilisation levels and market participants struggling to fill capacity.
A further headwind is that Vopak is unable to expand into some areas, given the scarcity of attractive land on which to build or expand, and absence of geographical areas with good accessible deep water locations and facilities.
Our third downside risk is of lower throughput due to an economic downturn impairing especially low utilisation rates and results of Vopak’s chemicals division. A slow decline in oil prices could impact returns of the company’s oil division, as storage capacity falls out of favour due to backwardation.
An upside risk to our HOLD recommendation is that Vopak continues to announce projects with good visibility that support earnings upgrades, particularly projects that have not been mentioned before. As such, the share price could react positively to this news.
In addition, a material and longer-lasting return of contango could support Vopak’s utilisation rate quite favourably, and given a ‘leaner and meaner’ organisation, a higher demand filters into better earnings.
More earnings-enhancing projects
Slow decline in oil prices
Overcapacity
Land unavailable
Return of contango

Vopak November 2014
10
Financials
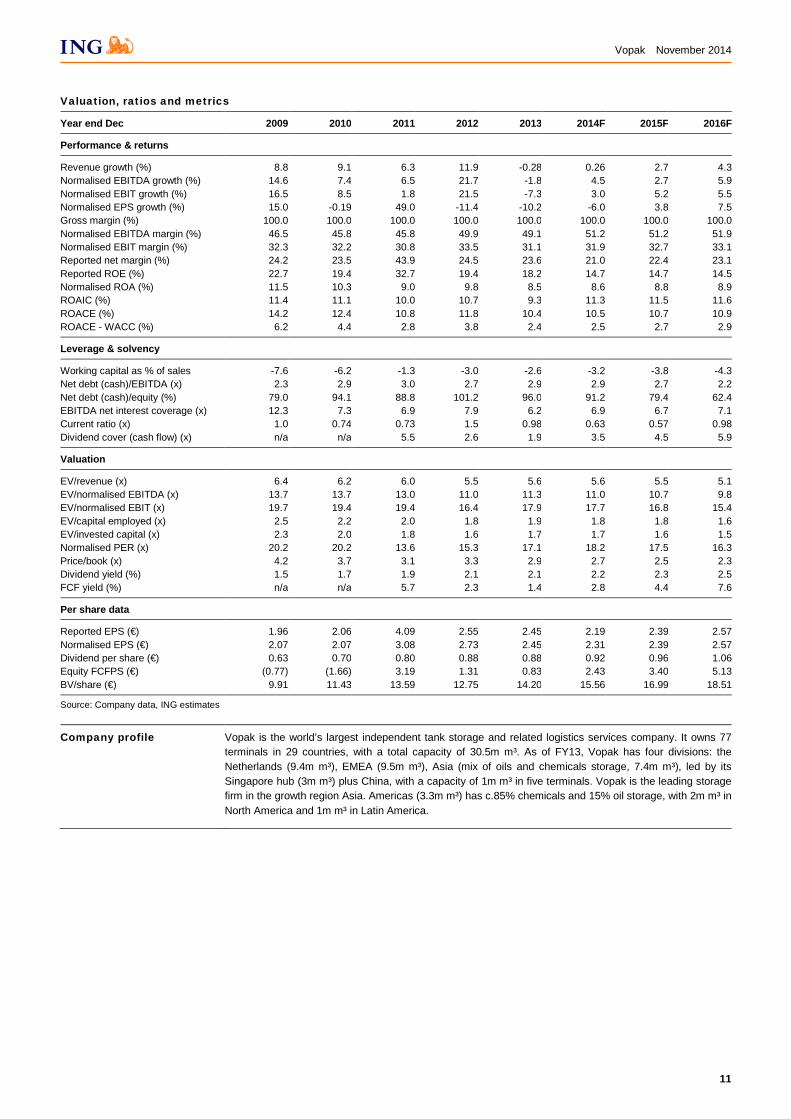
Year end Dec (€m) 2009 2010 2011 2012 2013 2014F 2015F 2016F
Income statement
Revenues 1,022 1,115 1,185 1,326 1,322 1,326 1,361 1,420 Cost of goods sold 0 0 0 0 0 0 0 0 Gross profit 1,022 1,115 1,185 1,326 1,322 1,326 1,361 1,420 Operating costs (560) (605) (642) (665) (673) (647) (665) (682) EBITDA 462 510 543 661 649 678 697 738 Depreciation & amortisation (123) (153) (171) (195) (217) (240) (251) (268) Impairments (9) 1 (7) (23) (21) (15) 0 0 EBIT 331 359 365 444 411 423 445 470 Net interest (37) (70) (79) (84) (105) (99) (104) (104) Associates 61 83 220 97 123 83 91 96 Other pre-tax items (8) 1 0 0 0 0 0 0 Pre-tax profit 345 374 507 457 429 407 432 462 Tax (69) (73) (71) (84) (68) (83) (83) (87) Minorities (25) (31) (35) (40) (42) (42) (44) (47) Other post-tax items (4) (8) 120 (8) (6) (3) 0 0 Net profit 248 262 520 325 313 279 305 328 Normalised EBITDA 475 510 543 661 649 678 697 738 Normalised EBIT 331 359 365 444 411 423 445 470 Normalised net profit 262 263 392 348 313 294 305 328
Balance sheet
Tangible fixed assets 2,547 3,162 3,512 3,886 4,132 4,472 4,645 4,653 Intangible fixed assets 41 54 73 68 68 78 88 98 Other non-current assets 142 155 260 86 62 62 62 62 Cash & equivalents 192 184 91 455 181 (17) (50) 204 Other current assets 214 276 304 344 380 387 393 399 Total assets 3,136 3,831 4,240 4,838 4,823 4,981 5,137 5,416 Short-term debt 60 234 182 125 140 140 140 140 Other current liabilities 331 385 357 407 436 448 461 475 Long-term debt 1,185 1,408 1,541 2,104 1,893 1,799 1,692 1,692 Other long-term liabilities 227 254 322 450 427 450 473 498 Total liabilities 1,803 2,281 2,402 3,085 2,896 2,837 2,766 2,805 Total equity 1,333 1,550 1,838 1,753 1,928 2,144 2,370 2,611 Total liabilities & equity 3,136 3,831 4,240 4,838 4,823 4,981 5,137 5,416 Capital employed 2,578 3,192 3,561 3,981 3,960 4,083 4,202 4,443 Net working capital (78) (69) (15) (40) (35) (43) (52) (61) Net debt (cash) 1,053 1,458 1,632 1,774 1,851 1,955 1,882 1,628
Cash flow
Cash flow EBITDA 414 456 614 591 599 580 600 643 Change in working capital (57) (143) 0.7 0.2 0 9 6 5 Other non-cash items (16) 9 0 0 0 0 0 0 Operating cash flow 341 322 614 591 599 589 606 648 Cash interest paid (39) (66) 0 0 0 99 104 104 Cash taxes paid (42) (11) 0 0 0 83 83 87 Net cash from operating activities 260 245 614 591 599 770 793 839 Capex (461) (468) (490) (458) (553) (460) (410) (335) Net acquisitions (45) (85) (137) (165) (90) (110) (50) (50) Other net investing cash flows 83 4 199 14 44 0 50 150 Cash from investing activities (423) (550) (429) (609) (599) (570) (410) (235) Increase (decrease) in equity 80 (9) 0 4 0 0 0 (144) Increase (decrease) in debt 194 280 (84) 680 (57) (94) (107) 0 Dividends & minority distribution (19) (80) (89) (102) (112) (122) (123) (135) Other financing cash flow (2) (3) (8) (8) (41) (3) 0 0 Cash from financing activities 254 189 (181) 574 (210) (219) (230) (279) Forex & discontinued operations 0.6 6 3 0.5 (5) 0 0 0 Net change in cash & equivalents 91 (110) 7 556 (215) (19) 154 326 FCF (58) (145) 405 167 106 211 329 551
Normalised earnings (e.g., EBITDA, EBIT, net income and other sector-specific line items) are in the opinion of the analyst the best representation of a company's underlying and sustainable earnings derived from its regular operating activities. Source: Company data, ING estimates
Vopak November 2014
11
Valuation, ratios and metrics
Year end Dec 2009 2010 2011 2012 2013 2014F 2015F 2016F
Performance & returns
Revenue growth (%) 8.8 9.1 6.3 11.9 -0.28 0.26 2.7 4.3 Normalised EBITDA growth (%) 14.6 7.4 6.5 21.7 -1.8 4.5 2.7 5.9 Normalised EBIT growth (%) 16.5 8.5 1.8 21.5 -7.3 3.0 5.2 5.5 Normalised EPS growth (%) 15.0 -0.19 49.0 -11.4 -10.2 -6.0 3.8 7.5 Gross margin (%) 100.0 100.0 100.0 100.0 100.0 100.0 100.0 100.0 Normalised EBITDA margin (%) 46.5 45.8 45.8 49.9 49.1 51.2 51.2 51.9 Normalised EBIT margin (%) 32.3 32.2 30.8 33.5 31.1 31.9 32.7 33.1 Reported net margin (%) 24.2 23.5 43.9 24.5 23.6 21.0 22.4 23.1 Reported ROE (%) 22.7 19.4 32.7 19.4 18.2 14.7 14.7 14.5 Normalised ROA (%) 11.5 10.3 9.0 9.8 8.5 8.6 8.8 8.9 ROAIC (%) 11.4 11.1 10.0 10.7 9.3 11.3 11.5 11.6 ROACE (%) 14.2 12.4 10.8 11.8 10.4 10.5 10.7 10.9 ROACE - WACC (%) 6.2 4.4 2.8 3.8 2.4 2.5 2.7 2.9
Leverage & solvency
Working capital as % of sales -7.6 -6.2 -1.3 -3.0 -2.6 -3.2 -3.8 -4.3 Net debt (cash)/EBITDA (x) 2.3 2.9 3.0 2.7 2.9 2.9 2.7 2.2 Net debt (cash)/equity (%) 79.0 94.1 88.8 101.2 96.0 91.2 79.4 62.4 EBITDA net interest coverage (x) 12.3 7.3 6.9 7.9 6.2 6.9 6.7 7.1 Current ratio (x) 1.0 0.74 0.73 1.5 0.98 0.63 0.57 0.98 Dividend cover (cash flow) (x) n/a n/a 5.5 2.6 1.9 3.5 4.5 5.9
Valuation
EV/revenue (x) 6.4 6.2 6.0 5.5 5.6 5.6 5.5 5.1 EV/normalised EBITDA (x) 13.7 13.7 13.0 11.0 11.3 11.0 10.7 9.8 EV/normalised EBIT (x) 19.7 19.4 19.4 16.4 17.9 17.7 16.8 15.4 EV/capital employed (x) 2.5 2.2 2.0 1.8 1.9 1.8 1.8 1.6 EV/invested capital (x) 2.3 2.0 1.8 1.6 1.7 1.7 1.6 1.5 Normalised PER (x) 20.2 20.2 13.6 15.3 17.1 18.2 17.5 16.3 Price/book (x) 4.2 3.7 3.1 3.3 2.9 2.7 2.5 2.3 Dividend yield (%) 1.5 1.7 1.9 2.1 2.1 2.2 2.3 2.5 FCF yield (%) n/a n/a 5.7 2.3 1.4 2.8 4.4 7.6
Per share data
Reported EPS (€) 1.96 2.06 4.09 2.55 2.45 2.19 2.39 2.57 Normalised EPS (€) 2.07 2.07 3.08 2.73 2.45 2.31 2.39 2.57 Dividend per share (€) 0.63 0.70 0.80 0.88 0.88 0.92 0.96 1.06 Equity FCFPS (€) (0.77) (1.66) 3.19 1.31 0.83 2.43 3.40 5.13 BV/share (€) 9.91 11.43 13.59 12.75 14.20 15.56 16.99 18.51
Source: Company data, ING estimates
Company profile Vopak is the world’s largest independent tank storage and related logistics services company. It owns 77 terminals in 29 countries, with a total capacity of 30.5m m³. As of FY13, Vopak has four divisions: the Netherlands (9.4m m³), EMEA (9.5m m³), Asia (mix of oils and chemicals storage, 7.4m m³), led by its Singapore hub (3m m³) plus China, with a capacity of 1m m³ in five terminals. Vopak is the leading storage firm in the growth region Asia. Americas (3.3m m³) has c.85% chemicals and 15% oil storage, with 2m m³ in North America and 1m m³ in Latin America.
Vopak November 2014
12
Disclosures Appendix ANALYST CERTIFICATION The analyst(s) who prepared this report hereby certifies that the views expressed in this report accurately reflect his/her personal views about the subject securities or issuers and no part of his/her compensation was, is, or will be directly or indirectly related to the inclusion of specific recommendations or views in this report.
IMPORTANT DISCLOSURES For disclosures on companies other than the subject companies of this report visit our disclosures page at http://research.ing.com or write to The Compliance Department, ING Financial Markets LLC, 1325 Avenue of the Americas, New York, USA, 10019.
US regulatory disclosures • One or more members of ING Group holds 1% or more of the equity shares (as at the end of the month preceding this
publication) in the following subject company/ies of this report: Koninklijke Vopak NV
• The following subject company/ies of this report are or have been a client of ING Financial Markets LLC or an affiliate within the last 12 months and have received investment banking services: Koninklijke Vopak NV
• One or more members of ING Group has lead managed or co-lead managed a public offering of the shares of the following subject company/ies of this report in the last 12 months: Koninklijke Vopak NV
Valuation & risks: For details of the methodologies used to determine our price targets and risks related to the achievement of these targets refer to main body of report and/or the most recent equity company report at http://research.ing.com. Research analyst(s): The research analyst(s) for this report may not be registered/qualified as a research analyst with the NYSE and/or NASD. The research analyst(s) for this report may not be an associated person of ING Financial Markets LLC and therefore may not be subject to Rule 2711 restrictions on communications with a subject company, public appearances and trading securities held by the research analyst’s account.
European regulatory disclosures • One or more members of ING Group holds 1% or more of the equity shares (as at the end of the month preceding this
publication) in the following subject company/ies of this report: Koninklijke Vopak NV
• One or more members of ING Group has lead managed or co-lead managed a public offering of the securities of the following subject company/ies of this report in the last 12 months: Koninklijke Vopak NV
• The following subject company/ies of this report are or have been party to an investment banking agreement with one or more members of ING Group over the last 12 months: Koninklijke Vopak NV
• One or more members of ING Group is a liquidity provider, or acts as designated sponsor or market maker for the following subject company/ies of this report: Koninklijke Vopak NV
The remuneration of research analysts is not tied to specific investment banking transactions performed by ING Group although it is based in part on overall revenues, to which investment banking contribute. Financial interests: One of more members of ING Group may hold financial interests in the companies covered in this report other than those disclosed above. Securities prices: Prices are taken as of the previous day’s close on the home market unless otherwise stated. Job titles. The functional job title of the person/s responsible for the recommendations contained in this report is equity research analyst unless otherwise stated. Corporate titles may differ from functional job titles. Conflicts of interest policy. ING manages conflicts of interest arising as a result of the preparation and publication of research through its use of internal databases, notifications by the relevant employees and Chinese walls as monitored by ING Compliance. For further details see our research policies page at http://research.ing.com.
Other disclosures Target prices, where included, are based on reasonable assumptions supported by objective data. Unless otherwise stated, neither historic share price performance data nor ING projections on potential share price performance reflect the impact of commissions, fees and charges. Past performance is not indicative of future results. Forecasts are not a reliable indicator of future performance.
FOREIGN AFFILIATES DISCLOSURES Each ING legal entity which produces research is a subsidiary, branch or affiliate of ING Bank N.V. See back page for the addresses and primary securities regulator for each of these entities.
Vopak November 2014
13
RATING DISTRIBUTION (as of end 3Q14) RATING DEFINITIONS
Equity coverage Investment Banking clients* Buy: Forecast 12-mth absolute total return greater than +15%
Hold: Forecast 12-mth absolute total return of +15% to -5%
Sell: Forecast 12-mth absolute total return less than -5%
Total return: forecast share price appreciation to target price plus forecast annual dividend. Price volatility and our preference for not changing recommendations too frequently means forecast returns may fall outside of the above ranges at times.
Buy 46% 55% Hold 48% 64% Sell 6% 36% 100% * Percentage of companies in each rating category that are Investment Banking clients of ING Financial Markets LLC or an affiliate.
PRICE & RATINGS HISTORY TO 05/11/14: VOPAK (VOPA.AS)
H
30
35
40
45
50
55
60
1/11/11 1/2/12 1/5/12 1/8/12 1/11/12 1/2/13 1/5/13 1/8/13 1/11/13 1/2/14 1/5/14 1/8/14 1/11/14
Price Target price
B = Buy; H = Hold; S = Sell; NR = Not Rated; R = Restricted Chart shows ING coverage: current analyst may or may not have covered the stock for the entire period shown Where ING coverage is longer than three years, chart shows recommendation current at start of the share price history Source: ING

Vopak November 2014
14
c
AMSTERDAM BRUSSELS LONDON NEW YORK SINGAPORE Tel: 31 20 563 8758 Tel: 32 2 547 7534 Tel: 44 20 7767 1000 Tel: 1 646 424 6000 Tel: 65 6535 3688
Bratislava Tel: 421 2 5934 6111 Bucharest Tel: 40 21 222 1600 Budapest Tel: 36 1 235 8800 Buenos Aires Tel: 54 11 4310 4700 Dublin Tel: 353 1 638 4000
Frankfurt Tel: 49 69 75936 519 Geneva Tel: 41 22 592 3079 Hong Kong Tel: 852 2848 8488 Istanbul Tel: 90 212 329 0752 Kiev Tel: 380 44 230 3030
Madrid Tel: 34 91 789 8880 Manila Tel: 63 2 479 8888 Mexico City Tel: 52 55 5258 2000 Milan Tel: 39 02 89629 3610 Moscow Tel: 7 495 755 5400
Paris Tel: 33 1 56 39 32 84 Prague Tel: 420 257 474 111 Sao Paulo Tel: 55 11 4504 6000 Seoul Tel: 82 2 317 1800 Shanghai Tel: 86 21 2020 2000
Sofia Tel: 359 2 917 6400 Taipei Tel: 886 2 8729 7600 Tokyo Tel: 81 3 3217 0301 Warsaw Tel: 48 22 820 5018
Research offices: legal entity/address/primary securities regulator Amsterdam ING Bank N.V., Foppingadreef 7, Amsterdam, Netherlands, 1102BD. Netherlands Authority for the Financial Markets Brussels ING Belgium S.A./N.V., Avenue Marnix 24, Brussels, Belgium, B-1000. Financial Services and Market Authority (FSMA) Bucharest ING Bank N.V. Amsterdam - Bucharest Branch, 48 Iancu de Hunedoara Bd., 011745, Bucharest 1, Romania. Financial Supervisory
Authority Budapest ING Bank N.V. Hungary Branch, Dozsa Gyorgy ut 84\B, H - 1068 Budapest, Hungary. National Bank of Hungary Istanbul ING Bank A.S., ING Bank Headquarters, Resitpasa Mahallesi Eski Buyukdere Cad. No: 8, 34467 Sariyer, Istanbul , Turkey. Capital
Markets Board London ING Bank N.V. London Branch, 60 London Wall, London EC2M 5TQ, United Kingdom. Authorised by the Dutch Central Bank Manila ING Bank N.V., Manila Branch, 20/F Tower One, Ayala Triangle, Ayala Avenue, 1226 Makati City, Philippines. Philippine Securities and
Exchange Commission Milan ING Bank N.V. Milano, Via Arbe, 49, Milano, Italy, 20125. Commissione Nazionale per le Società e la Borsa Moscow ING BANK (EURASIA) ZAO, 36, Krasnoproletarskaya ulitsa, 127473 Moscow, Russia. Federal Financial Markets Service Mumbai ING Vysya Bank Limited, Plot C-12, Block-G, 7th Floor, Bandra Kurla Complex, Bandra (E), Mumbai - 400 051, India. Securities and
Exchange Board of India New York ING Financial Markets LLC, 1325 Avenue of the Americas, New York, United States,10019. Securities and Exchange Commission Prague ING Bank N.V., Prague Branch, Plzeňská 345/5, 150 00 Prague 5, Czech Republic. Czech National Bank Singapore ING Bank N.V. Singapore Branch, 19/F Republic Plaza, 9 Raffles Place, #19-02, Singapore, 048619. Monetary Authority of Singapore Warsaw ING Securities S.A, Ul. Pulawska 2, Warsaw, Poland, 02-566. Polish Financial Supervision Authority
Disclaimer This report has been prepared on behalf of ING (being for this purpose the commercial banking business of ING Bank NV and certain of its subsidiary companies) solely for the information of its clients. ING forms part of ING Group (being for this purpose ING Groep NV and its subsidiary and affiliated companies). It is not investment advice or an offer or solicitation for the purchase or sale of any financial instrument. While reasonable care has been taken to ensure that the information contained herein is not untrue or misleading at the time of publication, ING makes no representation that it is accurate or complete. The information contained herein is subject to change without notice. ING Group and any of its officers, employees, related and discretionary accounts may, to the extent not disclosed above and to the extent permitted by law, have long or short positions or may otherwise be interested in any transactions or investments (including derivatives) referred to in this report. In addition, ING Group may provide banking, insurance or asset management services for, or solicit such business from, any company referred to in this report. Neither ING Group nor any of its officers or employees accepts any liability for any direct or consequential loss arising from any use of this report or its contents. Copyright and database rights protection exists in this report and it may not be reproduced, distributed or published by any person for any purpose without the prior express consent of ING. All rights are reserved. Any investments referred to herein may involve significant risk, are not necessarily available in all jurisdictions, may be illiquid and may not be suitable for all investors. The value of, or income from, any investments referred to herein may fluctuate and/or be affected by changes in exchange rates. Past performance is not indicative of future results. Investors should make their own investigations and investment decisions without relying on this report. Only investors with sufficient knowledge and experience in financial matters to evaluate the merits and risks should consider an investment in any issuer or market discussed herein and other persons should not take any action on the basis of this report. Clients should contact analysts at, and execute transactions through, an ING entity in their home jurisdiction unless governing law permits otherwise. Additional information is available on request. Country-specific disclosures: EEA: This report constitutes “investment research” for the purposes of the Markets in Financial Instruments Directive and as such contains an objective or independent explanation of the matters contained herein. Any recommendations contained in this report must not be relied on as investment advice based on the recipient’s personal circumstances. If further clarification is required on words or phrases used in this report, the recipient is recommended to seek independent legal or financial advice. Hong Kong: This report is distributed in Hong Kong by ING Bank N.V., Hong Kong Branch which is licensed by the Securities and Futures Commission of Hong Kong under the Securities and Futures Ordinance (Chapter 571 of the Laws of Hong Kong) (“SFO”). This document does not constitute a solicitation or an offer of securities or an invitation to the public within the meaning of the SFO. This report is to be circulated only to “professional investors” as defined in the SFO. India: Any recipient of this report wanting additional information or to effect any transaction in Indian securities or financial instruments mentioned herein must do so by contacting a representative of ING Vysya Bank Limited (“ING Vysya”) which is responsible for distribution of this report in India. ING Vysya is an affiliated company of ING. ING Vysya does not accept liability for any direct or consequential loss arising from any use of information provided in this report. Italy: This report is issued in Italy only to persons described in Article No. 31 of Consob Regulation No. 11522/98. Singapore: This document is provided in Singapore by or through ING Bank N.V., Singapore Branch and is provided only to accredited investors, expert investors and institutional investors, as defined in Section 4A of the Securities and Futures Act, Cap. 289. If you are an accredited investor or expert investor, please be informed that in ING’s dealings with you, ING is relying on the following exemptions to the Financial Advisers Act, Cap. 110 (“FAA”): (1) the exemption in Regulation 33 of the Financial Advisers Regulations (“FAR”), which exempts ING from complying with Section 25 of the FAA on disclosure of product information to clients; (2) the exemption set out in Regulation 34 of the FAR, which exempts ING from complying with Section 27 of the FAA on recommendations; and (3) the exemption set out in Regulation 35 of the FAR, which exempts ING from complying with Section 36 of the FAA on disclosure of certain interests in securities. United Kingdom: This report is issued in the United Kingdom by ING Bank N.V., London Branch only to persons described in Articles 19, 47 and 49 of the Financial Services and Markets Act 2000 (Financial Promotion) Order 2005 and is not intended to be distributed, directly or indirectly, to any other class of persons (including private investors). United States: Any person wishing to discuss this report or effect transactions in any security discussed herein should contact ING Financial Markets LLC, which is a member of the NYSE, FINRA and SIPC and part of ING, and which has accepted responsibility for the distribution of this report in the United States under applicable requirements. The distribution of this report in other jurisdictions may be restricted by law or regulation and persons into whose possession this document comes should inform themselves about, and observe, any such restrictions. EQ Additional information is available on request