Vontobel Half-Year Report 2018
72
Half-Year Report 2018
Transcript of Vontobel Half-Year Report 2018

Vont
obel
Hal
f-Ye
ar R
epor
t 201
8
Half-Year Report
2018

LEGAL INFORMATIONThis Half-Year Report is intended solely for information purposes and is expressly not addressed to any person who by domicile or nationality is prohibited to receive such information according to the applicable law. The information and views contained in it do not constitute a request, offer or recommendation to use a service, to buy or sell investment instruments or to conduct other transactions. By their very nature, forward-looking statements involve inherent risks and uncertainties, both general and specific, and risks exist that predictions, forecasts, projections and other outcomes described or implied in forward-looking statements will not be achieved.
COMMENTS ON THE FIGURESThe figures shown are rounded. Consequently, the total may differ from the figure calculated when the individual numbers are added together.
This report also appears in German. The German version is prevailing.
Shareholders’ letter
Shareholders’ letter
Key figures
Key figures
Review of business activities
VontobelWealth Management Asset ManagementInvestment BankingCorporate Center
Capital and liquidity
Capital and liquidity
Consolidated financial statements
Consolidated income statement Consolidated statement of comprehensive incomeConsolidated balance sheetStatement of equityShare capitalConsolidated cash flow statement
Notes to the consolidated financial statements
Accounting principlesChanges due to IFRS 9 Details on consolidated income statementRisk related to balance sheetOff-balance sheet and other informationSegment reporting
Additional information
Investors’ informationAward-winning businessesOur locations
4
8
1020222426
28
3031
32343637
394248
5461
64
686970
Contents

Shareholders’ letter4
“At a time when authenticity is becoming more and more crucial to build trust, companies with a clear identity have the advantage. Vontobel has strong roots and the necessary conviction to set us on a successful course for the future. This is articulated by our brand and our clear brand promise that clients can count on each day.”
Herbert J. ScheidtChairman of the Board of Directors
Dr Zeno StaubChief Executive Officer
“Our future course is set”

Shareholders’ letter 5
Dear shareholders and clients
Vontobel performed successfully in the first half of 2018, delivering a good financial result and taking important steps to set the future course of the business. With the acquisition of Notenstein La Roche Privatbank AG, we are ideally complementing the above-average organic growth achieved in Wealth Management. We are strengthening our position as one of the leading private banks in Swit-zerland with the addition of new employees and locations. Clients of Notenstein La Roche will now be able to benefit from the range of opportunities and expertise offered by Vontobel as an internationally active Swiss wealth and asset manager, in the same way as our own clients.
Overall, our focus is still on achieving organic growth. By acquiring Notenstein, we are strengthening the founda-tions of our business and we aim to expand our activities through selected acquisitions where this approach is sen-sible and creates value. This strategy is based on the knowledge that our clients only believe in the quality of our services if we continue to generate growth as a result of our own actions and thus achieve success as a com-pany. In the first six months of 2018, we therefore contin-ued to invest selectively in new talents and technology across all our divisions, as we have done in recent years. In doing so, we are systematically expanding the range of services offered on our existing digital platforms and are continuously targeting new client groups. Our platform strategy has proved effective in our Financial Products business and we now want to replicate this success story in our Wealth Management business.
Our strong brand is another cornerstone of our success. It embodies our Vontobel identity and reflects the way in which we deepen existing client relationships and attract above-average numbers of new clients. We place the needs and interests of our clients at the center of all that we do. At a time when authenticity is becoming more and more crucial to build trust, companies with a clear identity have the advantage. Vontobel has strong roots and the necessary conviction to set us on a successful course for the future. This is articulated by our brand and our clear brand promise that clients can count on each day.
Our clients’ trust in our strengths and performance is also reflected by our good financial result: In the first six months of 2018, Group net profit grew by 31% to CHF 132.7 million (first half of 2017: CHF 101.5 million) and earnings per share rose by 28% to CHF 2.28 (first half of 2017: CHF 1.78).
In a highly competitive operating environment, Asset Management generated a pre-tax profit of CHF 92.5 mil-lion (first half of 2017: CHF 69.5 million) and thus remained Vontobel’s strongest earnings driver. Combined Wealth Management – comprising Wealth Management and the External Asset Managers business – displayed strong profit momentum in the first half of 2018, continuing the positive trend seen in recent years. Pre-tax profit grew by 46% to CHF 56.2 million compared to the first half of 2017 (CHF 38.4 million). Financial Products delivered another very solid pre-tax profit of CHF 51.9 million in the first half of 2018 (first half of 2017: CHF 51.5 million).
Vontobel’s good financial result – with strong profit growth – is supported by a solid net inflow of new money across all divisions. Asset Management was also the strongest contributor in the area of new money. Our Fixed Income products were the main drivers of this high level of growth, demonstrating that Vontobel has success- fully countered the global trend towards more mode- rate demand for fixed income products. Vescore pro-ducts based on quantitative investment strategies and Vontobel’s sustainability and global equity products also contributed to the strong net inflow of new money within Asset Management. Combined Wealth Management also experienced a dynamic net inflow of new money in the first six months of the year, with strong growth in Switzer-land as well as in Latin American markets and in Italy. The total net inflow of new money generated across all divi-sions in the first half of 2018 was CHF 5.1 billion (first half of 2017: CHF 0.3 billion). Client assets reached a new record level of CHF 253.6 billion, compared to CHF 246.5 billion at the end of 2017.
Shareholders’ letter

Shareholders’ letter6
Looking to the future, seizing opportunitiesVontobel’s sustained success is founded on our ongoing commitment to identifying new opportunities at an early stage and seizing them for the benefit of our clients. We see change primarily as a source of opportunity – for our clients and thus also for Vontobel.
We harness new technologies to provide our clients with new and even better services in a digital world – combin-ing user-friendly design with optimal efficiency. In Finan-cial Products, our clients benefit from our cost leadership in the area of structured products. With deritrade®, we have created a digital ecosystem that allows us to bring innovative offerings to new groups of clients. For example, our multi issuer platform “mein-zertifikat” in Germany has now also been rolled out in Austria. The “Investment Scout” app that was launched in Switzerland in 2017 will be introduced to the German market in the course of 2018. The “mein-zertifikat” platform and Investment Scout app both enable private investors to select struc-tured products, tailor them to their specific requirements and issue them.
In spring 2018, we became the first bank in Switzerland to offer “white labelling” products – allowing institutional cli-ents to make use of Vontobel’s product expertise under their own name to create a broader client offering. In 2017, we made our debut as a market participant in Hong Kong – the world’s largest market for leverage products. After just a few months, Vontobel already ranks as one of the fastest-growing and profitable providers, with more than 500 warrants. This was achieved thanks to our globally integrated, efficient and fully digital processes. In the sec-ond half of 2018, Vontobel Financial Products will also launch its products in the Danish market as part of its regional expansion.
Mirroring the success story in Financial Products, Vontobel is this year building a digital platform for Wealth Management. This platform will enable us to create even more customized and interactive processes and to offer new services – all for the benefit of our clients – thus also allowing us to target new groups of clients. Vontobel believes that the power of digitization is a decisive factor that allows us to deliver an even more specific and rele-vant client experience. At the same time, we are expand-ing our teams of relationship managers based on our belief that even in a digital environment, people make all the difference. We have succeeded in hiring a number of experienced relationship managers – especially in Swit-zerland, Germany and the US.
As a high-conviction asset manager, Vontobel Asset Man-agement offers its clients investment solutions that are distinctly different and don’t follow the general trend. Our robust and proven portfolio management processes and our conviction that we can outperform the market over the cycle are factors that clearly set our solutions apart. In Asset Management, we are also actively considering the opportunities created by technology in order to further expand our existing strengths and deepen the client experience. Looking ahead, Vontobel Asset Management will further strengthen its successful internationally diver-sified boutique structure through measures including the expansion of its global sales organization. A series of experienced specialists have already joined our portfolio management and sales teams.
Our capital base remains strongVontobel will continue to have a solid capital position that significantly exceeds regulatory minimum requirements, even after the acquisition of Notenstein La Roche Privat-bank AG. The purchase of Notenstein La Roche Privat-bank AG was funded by Vontobel using own funds and through the successful placement of a CHF 450 million Additional Tier 1 (AT1) bond. By issuing this bond, Vontobel can ensure it has the financial flexibility to fund further growth, while maintaining the stability of our shareholder base in terms of the distribution of voting rights. At June 30, 2018, the BIS common equity tier 1 ratio (CET1 ratio) was 19.1% and the BIS total capital ratio was 26.4%. Since the Notenstein La Roche transaction was completed on July 2, 2018 – i.e. two days after the balance sheet date – we expect a BIS CET1 ratio at around 12% and a total capital ratio at around 18% at the end of 2018.
The return on equity was 15.1% in the first half of 2018, significantly exceeding our cost of capital and our own target return of over 12%.
Shareholders’ letter 7
Targeting a further increase in our already solid profitability We will continue to pursue our current strategy through the remainder of 2018 – seizing new opportunities to serve the interests of our clients and thus also achieve further growth. Vontobel will continue to invest in its employees, in new technologies and, in particular, in expanding its rela-tionship with clients. In the coming months, we will also focus our attention on the integration of Notenstein La Roche Privatbank AG. Following the legal completion of the transaction on July 2, 2018, the merger of Bank Vontobel AG with Notenstein La Roche Privatbank AG and its migration to Vontobel systems is due to be completed by the end of the third quarter of 2018. The integration costs of around CHF 50 million will be divided between the current financial year and 2019 and charged to the Corpo-rate Center. Irrespective of those costs, the acquisition should already make a substantial profit contribution to Vontobel Wealth Management in 2019 since the increased client base will allow us to leverage our successful digital platform even more effectively and to realize synergies.
Against this backdrop, and with growth targets unchanged, we have raised our profitability targets for Wealth Man-agement, increasing the target gross margin to at least 68 basis points (previously: 65 basis points) and adjusting the target cost / income ratio to less than 70% (previously 75%). At the same time, the mid-term profit targets that Vontobel aims to achieve by 2020 have been increased overall in connection with the Notenstein La Roche trans-action. Based on the new targets, we want to generate a cost / income ratio of less than 72% (previously 75%) and a return on equity of more than 14% (previously 12%).
We see our past success as confirmation of the effective-ness of our strategy of focusing and specialization. We want to continue delivering profitable growth. In view of geopolitical risks and global challenges relating to trade policy, as well as the uncertainty prompted by the mone-tary policies of central banks, we expect to be faced with a relatively difficult market environment in the second half of 2018. However, thanks to the prudent and professional approach of our employees, we are convinced that we can continue to successfully address these challenges. For this reason, we aim to further increase our already solid profitability in 2018 against the previous year.
“Vontobel remains on track” was one of the headings in our last Annual Report – and this continues to be the case. On behalf of all our employees, whose great commitment we value, we wish to thank you for your trust in Vontobel and your support.
Herbert J. Scheidt Dr Zeno StaubChairman of the Board Chief Executive Officerof Directors

Key figures
Ratios
(6 MONTHS) 30.06.2018 30.06.2017 31.12.2017Return on shareholders’ equity (ROE) (%) 1 15.1 12.9 13.2Cost 2 / income ratio (%) 72.0 76.1 74.6Equity ratio (%) 7.0 7.2 7.1Basel III leverage ratio (%) 6.7 5.1 4.7
1 Group net profit annualized as a percentage of average equity based on monthly figures, both without minority interests2 Operating expense, excl. provisions and losses
Share data
(6 MONTHS) 30.06.2018 30.06.2017 31.12.2017Basic earnings per share (CHF) 1 2.28 1.78 1.87Diluted earnings per share (CHF) 1 2.24 1.75 1.81Equity per share outstanding at balance sheet date (CHF) 29.95 27.31 29.31Price / book value per share 2.4 2.3 2.1Price / earnings 2 per share 15.8 17.5 16.4Share price at balance sheet date (CHF) 71.95 62.30 61.50High (CHF) 72.95 63.45 66.35Low (CHF) 57.00 53.25 57.25Market capitalization nominal capital (CHF mn) 4,092.2 3,543.3 3,497.8Market capitalization less treasury shares (CHF mn) 4,033.3 3,458.0 3,400.1Undiluted weighted average number of shares 55,919,730 55,357,315 55,376,259
1 Basis: weighted average number of shares2 Annualized
Share information
Stock exchange listing SIX Swiss ExchangeISIN CH001 233 554 0Security number 1 233 554Par value CHF 1.00Bloomberg VONN SWReuters VONTZn.STelekurs VONN
BIS capital ratios
30.06.2018 30.06.2017 31.12.2017CET1 capital ratio (%) 19.1 19.3 18.4CET1 capital (CHF mn) 1,174.7 1,088.4 1,098.6Tier 1 capital ratio (%) 26.4 19.3 18.4Tier 1 capital (CHF mn) 1,622.1 1,088.4 1,098.6Risk weighted positions (CHF mn) 6,148.1 5,636.0 5,955.6
Risk ratio
CHF MN 30.06.2018 30.06.2017 31.12.2017Average Value at Risk market risk 4.6 2.5 2.5
Average Value at Risk 6 months for positions in the Financial Products division of the Investment Banking business unit. Historical simulation of Value at Risk; 99 % confidence level; 1-day holding period; 4-year historical observation period.
Performance of Vontobel Holding AG registered share (indexed)
190
160
130
100
7001.01.16 30.06.16 30.06.17 31.12.1731.12.16 30.06.18
Swiss Performance Index (SPI)Vontobel Holding AG registered share (Total Return)
Source: Bloomberg
8

Key figures
Rating
30.06.2018 30.06.2017 31.12.2017Moody’s Rating Bank Vontobel AG (long-term deposit rating) Aa3 Aa3 Aa3
Consolidated income statement
30.06.2018 30.06.2017 31.12.2017CHANGE IN %
TO(6 MONTHS) CHF MN CHF MN CHF MN 30.06.2017Operating income 583.3 517.5 542.6 13Operating expense 422.4 395.0 405.8 7Group net profit 132.7 101.5 107.5 31of which allocated to minority interests 4.9 2.8 3.8 75of which allocated to the shareholders of Vontobel Holding AG 127.7 98.7 103.7 29
Segment profits before taxes
30.06.2018 30.06.2017 31.12.2017CHANGE IN %
TO(6 MONTHS) CHF MN CHF MN CHF MN 30.06.2017Wealth Management 42.4 27.1 33.4 56Asset Management 92.5 69.5 93.4 33Investment Banking 65.7 62.8 49.3 5Corporate Center –39.8 –36.9 –39.2
Consolidated balance sheet
30.06.2018 30.06.2017 31.12.2017CHANGE IN %
TOCHF MN CHF MN CHF MN 31.12.2017
Total assets 23,981.9 21,166.1 22,903.7 5Shareholders’ equity (excl. minority interests) 1,678.8 1,515.7 1,620.5 4Loans 4,301.9 2,925.2 3,310.5 30Due to customers 9,789.3 9,638.0 9,758.2 0
Client assets
30.06.2018 30.06.2017 31.12.2017CHANGE IN %
TOCHF BN CHF BN CHF BN 31.12.2017
Assets under management 168.6 146.5 165.3 2of which under discretionary management 108.6 95.1 107.1 1of which under non-discretionary management 60.0 51.4 58.2 3Other advised client assets 13.4 11.0 12.8 5Structured products outstanding 9.3 7.2 8.5 9Total advised client assets 191.2 164.7 186.6 2Custody assets 62.3 43.0 59.9 4Total client assets 253.6 207.7 246.5 3
Net new money
CHF BN (6 MONTHS) 30.06.2018 30.06.2017 31.12.2017Net new money 5.1 0.3 5.6
Headcount (full-time equivalents)
CHANGE IN % TO
30.06.2018 30.06.2017 31.12.2017 31.12.2017Number of employees Switzerland 1,370.8 1,315.5 1,353.8 1Number of employees abroad 324.4 327.4 334.4 –3Total number of employees 1,695.2 1,642.9 1,688.2 0
9

Vontobel
Broad-based growth and pleasing net profit in first half of 2018The first few months of 2018 saw the return of volatility – and consequently a return to normality in the global finan-cial markets. Increasing international trade barriers, grow-ing geopolitical tensions and a slight slowdown in the global economy – with a simultaneous rise in inflation expectations – led to greater uncertainty in the markets. The demand for “secure” government bonds grew glob-ally. At the same time, the yields on US Treasuries tempo-rarily exceeded 3 % as a result of a more restrictive US monetary policy and the value of the US dollar rose signif-icantly. The tightening of the monetary reins in the US con-trasts with the continued expansionary monetary policies of central banks in other industrialized nations. The US government’s plans to introduce new trade tariffs and the retaliatory measures announced by affected countries caused significant setbacks for emerging markets invest-ments. Thanks to strong performance in April, however, global equity markets remained generally robust, finishing the first half of 2018 up 1.6 % in local currencies. Large-cap Swiss equities, in particular, fell out of favor with inves-tors (SMI –8 %). Risk premiums on equities remained above the long-term average, demonstrating investor caution – especially among private investors, who continue to hold large cash positions.
The European finance industry is continuing to undergo structural changes and is faced with ever fiercer competi-tion. The prolonged low interest rate environment and the trend towards passive investing are generally putting mar-gins under pressure. In addition, providers operating in the area of wealth and asset management are having to make significant investments in client and compliance processes, in the adjustment of their product offering and in automation in response to the introduction of the global standard for the Automatic Exchange of Information (AEOI) on financial accounts as well as the rules set out in the Markets in Financial Instruments Directive (MiFID) II that have applied within the EU since January 2018.
For Vontobel as a globally active financial expert with Swiss roots that specializes in wealth management, active asset management and investment solutions, our for-ward-looking business model and our focus on our own strengths proved effective once again. In the first six months of 2018, we continued to systematically pursue our growth strategy, successfully expanded our client base in all divisions in our Swiss home market and interna-tionally, and further developed our range of products and services. We also continued to demonstrate our consider-able innovative strength.
In Investment Banking, for example, we launched cosmo-funding, our digital platform serving public sector clients seeking financing as well as institutional investors, and we issued the open-end certificate on bitcoin. Wealth Man-agement further developed its “Vontobel Wealth” plat-form, allowing us to provide digital services that ideally complement our personal advisory offering. We are har-nessing regulatory developments as well as the ongoing digital transformation to further enhance our client ser-vices and to implement a more future-oriented approach. With the acquisition of Notenstein La Roche Privatbank AG that was announced in May 2018, we have created a further pillar for future growth. From the second half of 2018, the acquisition will enable us to ideally supplement our above-average organic growth in the area of Wealth Management, to strengthen our presence in our home market through the addition of further locations, and to reinforce our position as one of the leading private banks in Switzerland.
In the first half of 2018, the high level of trust that clients place in Vontobel and our successful positioning in the market were reflected by the strong net inflow of new money of CHF 5.1 billion, strong organic growth in operat-ing income of 13% to almost CHF 600 million, and pleasing net profit of CHF 132.7 million (earnings per share: CHF 2.28). Compared to the IFRS net profit of CHF 101.5 million in the first half of 2017, the result increased by 31%; taking the adjusted net profit of CHF 106.1 million for the pri-or-year period as the basis, the increase was 25%. The return on equity reached 15.1% on an annualized basis in the first half of 2018, significantly exceeding our present target of 12% and our current cost of capital of around 9%.
Vontobel had a very comfortable capital position as at the end of June 2018. The BIS total capital ratio was strong at 26.4% and the common equity tier 1 ratio (CET1 ratio) was 19.1%. This was achieved as a result of the issuance on June 29, 2018, of a 2.625% Additional Tier 1 (AT1) bond in the amount of CHF 450 million by Vontobel Holding AG, which led to a significant strengthening of the capital base. It also reflects the fact that the acquisition of Noten-stein La Roche Privatbank AG was not completed until July 2, 2018, meaning that it will only be consolidated in Vontobel’s balance sheet and income statement in the second half of 2018. We therefore expect the total capital ratio to be around 18 % and the CET1 ratio to reach a good 12 % at the end of 2018. Both ratios will therefore signifi-cantly exceed the minimum requirements defined by FINMA of a total capital ratio of 12 % and a CET1 ratio for category 3 banks – including Vontobel – of 7.8 %.
10 Review of business activities

Client assets reach new record levelFollowing the successful expansion of the business and the subsequent sustained net inflow of new money – and despite the slightly negative net impact of market and cur-rency effects, as well as the elimination of assets relating to the Liechtenstein operation that was sold – total client assets grew by CHF 7.1 billion in the first six months of 2018, reaching a new record high of CHF 253.6 billion.
Total advised client assets – which consist of assets under management, other advised client assets and structured products – grew by 2 % to CHF 191.2 billion compared to the end of 2017. Advised client assets are an important indicator for Vontobel in view of the significant value they generate; Vontobel provides advisory services and / or has discretionary management agreements in place for these assets. Other advised client assets also comprise assets acquired in the context of the cooperation with the Aus-tralian banking group ANZ; Vontobel provides advice on asset allocation to ANZ in respect of these assets. The vol-ume of structured products outstanding rose by 9 % to CHF 9.3 billion, confirming that Vontobel Financial Prod-ucts has successfully positioned itself in its home market and in European markets. In Hong Kong, where Vontobel has been operating since fall 2017, sales of leverage prod-ucts increased strongly.
In the finance industry, like in other sectors, there is a growing trend towards specialization, with companies sharpening the focus of their activities. Against this back-drop, Vontobel is seeing a growing demand for its global execution and global custody solutions. In February 2018, the 100th bank joined Vontobel’s transaction banking platform and the number of banks it serves had already reached 110 by mid-2018. The pleasing development of this business is reflected by the 4% increase in custody assets to CHF 62.3 billion at the end of June 2018
Client assets
CHF BN 30.06.2018 30.06.2017 31.12.2017Assets under management 168.6 146.5 165.3Other advised client assets 13.4 11.0 12.8Structured products outstanding 9.3 7.2 8.5Total advised client assets 191.2 164.7 186.6Custody assets 62.3 43.0 59.9Total client assets 253.6 207.7 246.5
The volume of assets under management entrusted to Vontobel rose to its highest ever level of CHF 168.6 billion at the end of June 2018. In Combined Wealth Manage-ment (i.e. Wealth Management and the External Asset Managers business), assets grew slightly to CHF 54.9 bil-lion in the first half of 2018, a net increase of 2 % due pri-marily to the sustained inflow of new money and despite the elimination of CHF 1.4 billion of assets under man-agement due to the sale of the Liechtenstein operation to Kaiser Partner Privatbank.
On the institutional side, assets under management also rose by 1% to CHF 115.6 billion, reflecting the positive impact of the good inflow of new money, while the effects of currency shifts and market movements somewhat dampened the growth in assets under management – despite satisfactory relative performance.
Development of assets under management
CHF BN 30.06.2018 30.06.2017 31.12.2017Combined Wealth Management 54.9 48.5 54.0Wealth Management 44.3 39.8 44.0External Asset Managers 10.5 8.7 10.0Institutional clients 115.6 100.9 114.1Asset Management 1 112.3 97.2 110.3Investment Banking 2 3.3 3.7 3.8Corporate Center 3 –1.9 –2.9 –2.8Total assets under management 168.6 146.5 165.3
1 Including intermediaries2 Excluding External Asset Managers3 Assets under management that are managed on behalf of other
segments.
Growth in new money slightly above 4–6 % target rangeThe needs of all our clients are at the center of our business philosophy and actions, as evidenced by our employees consistent focus on delivering service and performance. Our efforts to put this philosophy into practice and our continued investments in growth and in an efficient sales structure at a global and product-oriented level are bear-ing fruit. As a result, Vontobel once again delivered very respectable growth in new money of 6.2 % on an annual-ized basis in the first half of 2018, exceeding our target range of 4–6 %.
11Review of business activities

Building on its existing activities, Combined Wealth Man-agement (Wealth Management and the External Asset Managers business) acquired CHF 1.7 billion of net new money. This corresponds to annualized growth in net new money of 6.4% and is therefore above the target range of 4–6 %. The net inflow of new money in Wealth Manage-ment totaled CHF 1.3 billion – corresponding to growth in net new money of 5.7 %. The External Asset Managers business delivered annualized growth in net new money of 9.3 %, acquiring net assets of CHF 0.5 billion.
Asset Management generated net new money of CHF 3.8 billion, corresponding to an annualized growth rate of 7.2 %, which was also above our target range of 4–6 % and exceeded market growth. Significant inflows were gener-ated in particular by fixed income products – especially the successful products of TwentyFour Asset Manage-ment, which are continuing to experience strong growth, as well as by the Vescore and Sustainable & Thematic Investing boutiques. The investment business with Raiffei-sen also made a positive contribution to new money.
Development of net new money
CHF BN (6 MONTHS) 30.06.2018 30.06.2017 31.12.2017Combined Wealth Management 1.7 1.6 0.6Wealth Management 1.3 1.0 0.0External Asset Managers 0.5 0.6 0.6Institutional clients 3.3 –1.3 5.1Asset Management 1 3.8 –1.7 5.3Investment Banking 2 –0.5 0.4 –0.2Corporate Center 3 0.1 0.0 –0.1Total net new money 5.1 0.3 5.6
1 Including intermediaries2 Excluding External Asset Managers3 Net new money from assets that are managed on behalf of other
segments.
The changes in the structure of assets by investment cat-egory observed in recent years reflect the systematic diversification of the boutiques within Asset Management, among other factors. The successful international expan-sion of the Fixed Income business is demonstrated by the growing proportion of fixed income securities, which increased by a further percentage point during the period under review, while the weighting of foreign equities declined slightly. Liquid assets and fiduciary investments continued to account for 10 % of assets under manage-ment.
Assets under management by investment category
IN % 30.06.2018 30.06.2017 31.12.2017Swiss equities 13 14 13Foreign equities 36 37 37Bonds 34 31 33Alternative investments 2 3 2Liquid assets, fiduciary investments 10 11 10Other 1 5 4 5
1 Including structured products
Our investment expertise is geared towards our interna-tional client base – as reflected by our broadly diversified allocation of assets under management in terms of curren-cies. In the first half of 2018, the proportion of investments in Swiss francs declined slightly to 24%, while the propor-tion of investments in euro, US dollars and British pounds remained stable. In contrast, the proportion of investments in other currencies (mainly the Indian rupee and the Hong Kong dollar) grew slightly.
Assets under management by currency
IN % 30.06.2018 30.06.2017 31.12.2017CHF 24 26 25EUR 24 22 24USD 29 30 29GBP 8 8 8Other 15 14 14
High level of investment in technology – improved profitability In the first half of 2018, Vontobel once again made signifi-cant investments in new markets, talent, technologies and its brand presence and delivered a pleasing result despite these growth measures. IFRS net profit totaled CHF 132.7 million in the first half of 2018, an increase of 31% com-pared to the IFRS result and of 25% compared to the adjusted result for the first half of 2017. Net profit for the first half of 2017 of CHF 101.5 million included Vescore integration costs of CHF 4.6 million after taxes. Adjusted for this exceptional impact, the result for the prior-year period totaled CHF 106.1 million.
In recent years, Vontobel has successfully transformed itself from a financial institution that focused predomi-nantly on the Swiss market into an established and glob-ally active wealth and asset manager.
12 Review of business activities

This is demonstrated not only by our international client base and the balanced structure of assets under manage-ment in terms of currencies but also by the significant contribution from fee and commission income, which accounted for almost two-thirds of Vontobel’s growing operating income that rose to CHF 583.3 million (+13 %) in the period under review. Commission income increased by 13 % to CHF 378.5 million due to higher average assets under management in the period under review. Advisory and management fees rose by 21% to CHF 323.7 million, and custody fees also rose by 21% to CHF 93.8 million.
The continued wait-and-see attitude of many investors, as well as the impact of MiFID II, were reflected by lower bro-kerage fees – also part of net commission income – which declined 12 % to CHF 52.4 million.
The 16 % increase in trading income to CHF 166.3 million was attributable to generally very strong demand for structured products – especially in the first quarter of 2018, a further improvement in market positioning in Swit-zerland and internationally, and the growing shift to the platform business. Vontobel’s trading income mainly com-prises income from the issuing, hedging and market mak-ing of structured products and warrants – represented by the total of “Securities” and “Other financial instruments at fair value”. The first-time application of IFRS 9 (Financial Instruments) had no impact on the recognition of trading income, since Vontobel is continuing to recognize the impact of the change in own credit risk due to an account-ing mismatch through profit or loss.
In the first half of 2018, activities related to the structured products and derivatives business contributed CHF 147.4 million (+11%) to trading income. Income from forex and precious metals trading increased by 82 % to CHF 18.9 million compared to the first half of 2017.
Managing the bank’s balance sheet while maintaining a conservative risk profile is especially challenging in a pro-longed period of low interest rates. As a result of active and systematic treasury management as well as increased loans to clients, net interest income increased slightly (+8 %) to CHF 37.4 million. Other income declined by 77 % to CHF 1.3 million due to the non-recurrence of income from the sale of financial instruments.
Operating expense grew at a lower rate than income (+7 %) to CHF 422.4 million. Personnel expense – the largest cost component – rose by 6 % to CHF 276.6 million. At the end of June 2018, Vontobel employed 1,695 full-time equiva-lents, an increase of 7 from the end of 2017.
As a result of various digitization initiatives and the expan-sion of the business, general expense rose by 9 % to CHF 111.3 million. This increase mainly reflects higher expenses for travel and representation, public relations and market-ing, consulting and audit fees, and other general expense.
Reflecting the accelerated pace of capital expenditure, depreciation of property, equipment and intangible assets rose by 8 % to CHF 32.1 million, as planned. During the period under review, Vontobel’s capital expenditure on property, equipment and intangible assets totaled CHF 23.0 million, an increase of 6 % compared to the first half of 2017 but significantly less than in the second half of 2017. Various digitization projects across all divisions, including initiatives relating to the implementation of MiFID II, were the main areas of capital expenditure.
Capital expenditure and depreciation
CHF MN (6 MONTHS) 30.06.2018 30.06.2017 31.12.2017Capital expenditure 23.0 21.8 53.5Depreciation 32.1 29.7 31.3
13Review of business activities
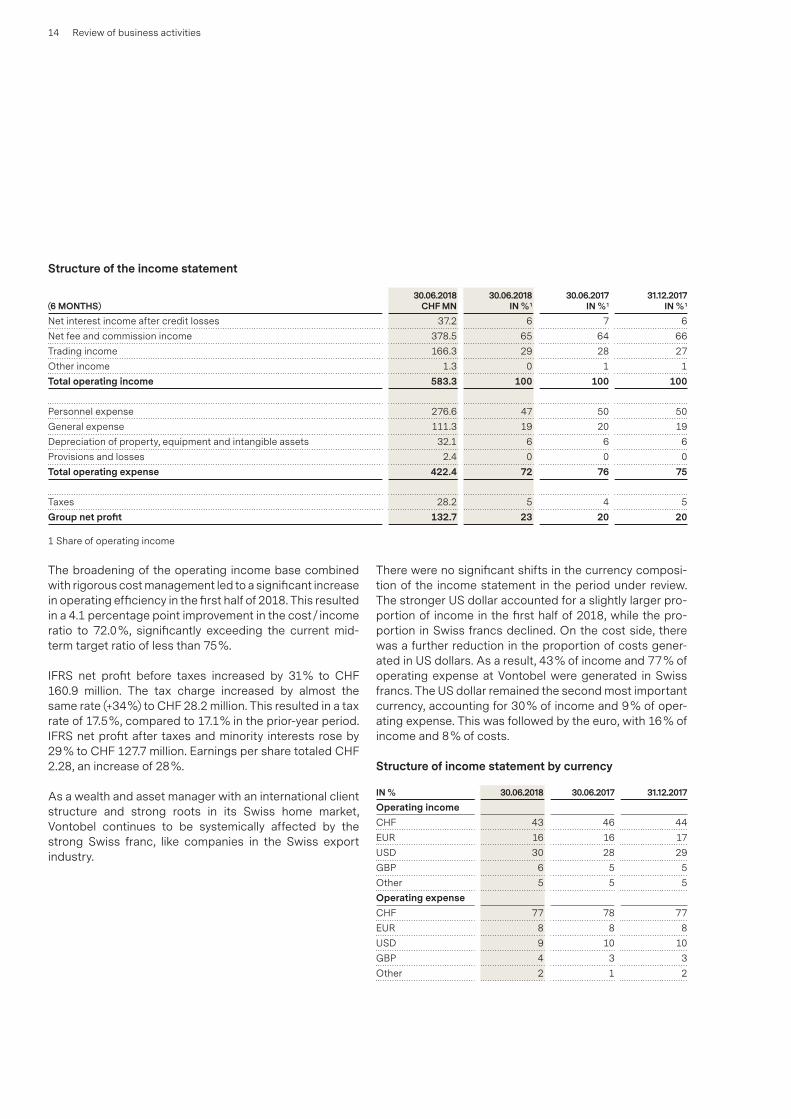
Structure of the income statement
30.06.2018 30.06.2018 30.06.2017 31.12.2017(6 MONTHS) CHF MN IN % 1 IN % 1 IN % 1
Net interest income after credit losses 37.2 6 7 6Net fee and commission income 378.5 65 64 66Trading income 166.3 29 28 27Other income 1.3 0 1 1Total operating income 583.3 100 100 100
Personnel expense 276.6 47 50 50General expense 111.3 19 20 19Depreciation of property, equipment and intangible assets 32.1 6 6 6Provisions and losses 2.4 0 0 0Total operating expense 422.4 72 76 75
Taxes 28.2 5 4 5Group net profit 132.7 23 20 20
1 Share of operating income
The broadening of the operating income base combined with rigorous cost management led to a significant increase in operating efficiency in the first half of 2018. This resulted in a 4.1 percentage point improvement in the cost / income ratio to 72.0 %, significantly exceeding the current mid-term target ratio of less than 75%.
IFRS net profit before taxes increased by 31% to CHF 160.9 million. The tax charge increased by almost the same rate (+34%) to CHF 28.2 million. This resulted in a tax rate of 17.5%, compared to 17.1% in the prior-year period. IFRS net profit after taxes and minority interests rose by 29 % to CHF 127.7 million. Earnings per share totaled CHF 2.28, an increase of 28 %.
As a wealth and asset manager with an international client structure and strong roots in its Swiss home market, Vontobel continues to be systemically affected by the strong Swiss franc, like companies in the Swiss export industry.
There were no significant shifts in the currency composi-tion of the income statement in the period under review. The stronger US dollar accounted for a slightly larger pro-portion of income in the first half of 2018, while the pro-portion in Swiss francs declined. On the cost side, there was a further reduction in the proportion of costs gener-ated in US dollars. As a result, 43 % of income and 77 % of operating expense at Vontobel were generated in Swiss francs. The US dollar remained the second most important currency, accounting for 30 % of income and 9 % of oper-ating expense. This was followed by the euro, with 16 % of income and 8 % of costs.
Structure of income statement by currency
IN % 30.06.2018 30.06.2017 31.12.2017Operating incomeCHF 43 46 44EUR 16 16 17USD 30 28 29GBP 6 5 5Other 5 5 5Operating expenseCHF 77 78 77EUR 8 8 8USD 9 10 10GBP 4 3 3Other 2 1 2
14 Review of business activities

Strong growth in profit in Combined Wealth Management and Asset Management – Financial Products delivers stable profit contribution
Segment profits before taxes
CHF MN (6 MONTHS) 30.06.2018 30.06.2017 31.12.2017Wealth Management 42.4 27.1 33.4Asset Management 92.5 69.5 93.4Investment Banking 65.7 62.8 49.3of which External Asset Managers 13.8 11.3 11.7Corporate Center –39.8 –36.9 –39.2Total 160.9 122.5 136.8
In Wealth Management, the business model has been selectively expanded in recent years – primarily through organic growth but also through acquisitions – and its focus has been sharpened. In the second half of 2017, the Eastern European client portfolio of Notenstein La Roche was acquired with a volume of around CHF 2 billion of assets and a contractual agreement was reached for the transfer of our Liechtenstein operation, together with CHF 1.4 billion of clients assets, to Kaiser Partner Privatbank – with the transaction only being booked in the first half of 2018. The systematic client focus and ongoing enhance-ment of the advisory process in Vontobel Wealth Manage-ment are reflected by the continued growth in advised client assets. In addition, in the first half of 2018, operating income rose by 17 % and pre-tax profit increased by 56 %. The integration of Notenstein La Roche Privatbank AG in the second half of 2018 is expected to generate significant positive momentum from 2019 at the latest.
The positioning of Asset Management as a high-convic-tion manager and the diversification strategy introduced some time ago are continuing to prove successful. The achievement of impressive investment performance shows that we are on the right path. In the first half of 2018, renowned rating agencies presented us with more than 30 awards. The Asset Management division was once again the main earnings driver at Vontobel, with its pre-tax profit contribution growing by 33 % compared to the prior-year period to CHF 92.5 million.
The Financial Products business in Investment Banking has, for years, displayed a high level of innovation while maintaining its close proximity to clients. It has success-fully established itself as one of the leading providers of structured products and derivatives in Europe. Its activi-ties have also developed very successfully in Hong Kong – the world’s largest market for leverage products, where Vontobel has been operating since fall 2017. In the first half of 2018, Investment Banking delivered a 5% increase in pre-tax profit to CHF 65.7 million, reflecting the successful positioning of Financial Products and the harnessing of economies of scale, as well as the expansion of the Exter-nal Asset Managers and Transaction Banking businesses. Corporate Finance advised on some importants transac-tions in the Swiss capital market but saw volumes decline significantly from the exceptionally high level in the previ-ous year. Vontobel Brokerage also experienced a decline in income due to the implementation of MiFID II.
Wealth & Asset Management (Wealth Management, Asset Management, External Asset Managers business) ac- counted for 74% of the pre-tax profit generated by the divisions. This large proportion reflects Vontobel’s clear positioning as a wealth and asset manager. Financial Prod-ucts (Investment Banking excluding the External Asset Managers business) contributed 26 % of pre-tax profit (excluding the Corporate Center) in the period under review.
The result for the Corporate Center decreased by 8 % to CHF –39.8 million compared to the prior-year period, mainly due to reduced gains from the sale of financial instruments. In the second half of 2018 and in the financial year 2019, the result will be further impacted by costs related to the integration of Notenstein La Roche Privat-bank AG.
15Review of business activities
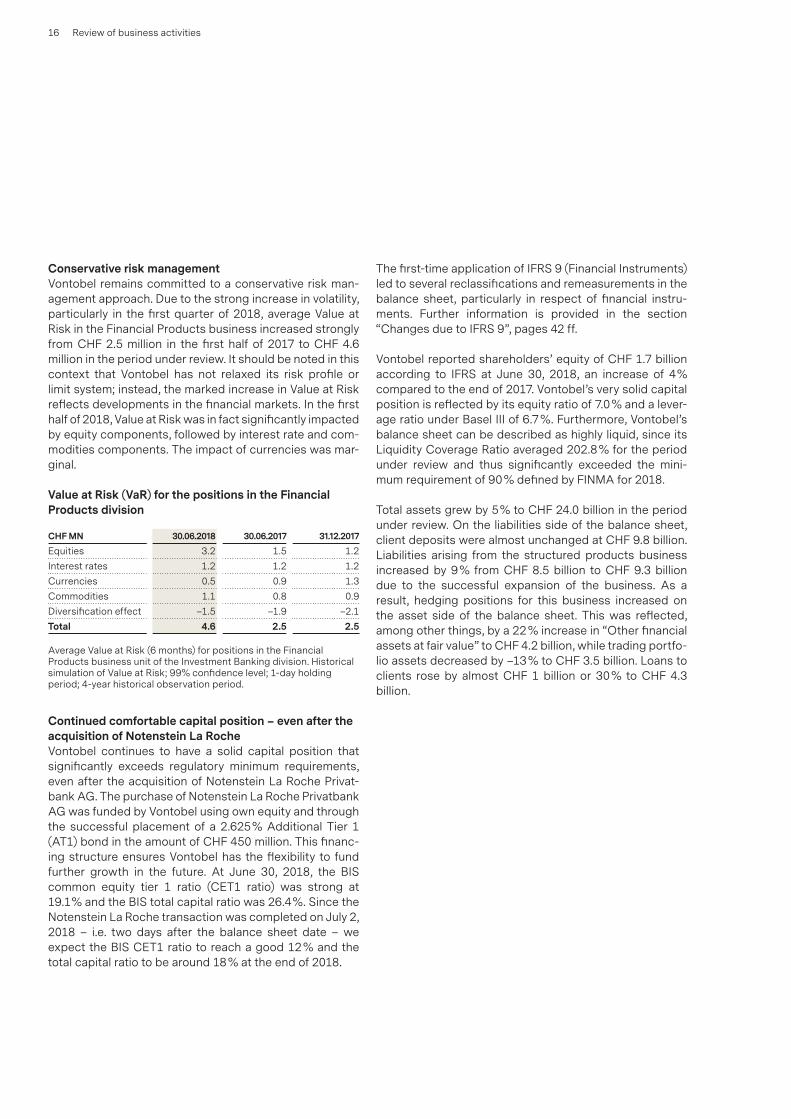
Conservative risk management Vontobel remains committed to a conservative risk man-agement approach. Due to the strong increase in volatility, particularly in the first quarter of 2018, average Value at Risk in the Financial Products business increased strongly from CHF 2.5 million in the first half of 2017 to CHF 4.6 million in the period under review. It should be noted in this context that Vontobel has not relaxed its risk profile or limit system; instead, the marked increase in Value at Risk reflects developments in the financial markets. In the first half of 2018, Value at Risk was in fact significantly impacted by equity components, followed by interest rate and com-modities components. The impact of currencies was mar-ginal.
Value at Risk (VaR) for the positions in the Financial Products division
CHF MN 30.06.2018 30.06.2017 31.12.2017Equities 3.2 1.5 1.2Interest rates 1.2 1.2 1.2Currencies 0.5 0.9 1.3Commodities 1.1 0.8 0.9Diversification effect –1.5 –1.9 –2.1Total 4.6 2.5 2.5
Average Value at Risk (6 months) for positions in the Financial Products business unit of the Investment Banking division. Historical simulation of Value at Risk; 99% confidence level; 1-day holding period; 4-year historical observation period.
Continued comfortable capital position – even after the acquisition of Notenstein La RocheVontobel continues to have a solid capital position that significantly exceeds regulatory minimum requirements, even after the acquisition of Notenstein La Roche Privat-bank AG. The purchase of Notenstein La Roche Privatbank AG was funded by Vontobel using own equity and through the successful placement of a 2.625% Additional Tier 1 (AT1) bond in the amount of CHF 450 million. This financ-ing structure ensures Vontobel has the flexibility to fund further growth in the future. At June 30, 2018, the BIS common equity tier 1 ratio (CET1 ratio) was strong at 19.1% and the BIS total capital ratio was 26.4%. Since the Notenstein La Roche transaction was completed on July 2, 2018 – i.e. two days after the balance sheet date – we expect the BIS CET1 ratio to reach a good 12 % and the total capital ratio to be around 18 % at the end of 2018.
The first-time application of IFRS 9 (Financial Instruments) led to several reclassifications and remeasurements in the balance sheet, particularly in respect of financial instru-ments. Further information is provided in the section “Changes due to IFRS 9”, pages 42 ff.
Vontobel reported shareholders’ equity of CHF 1.7 billion according to IFRS at June 30, 2018, an increase of 4% compared to the end of 2017. Vontobel’s very solid capital position is reflected by its equity ratio of 7.0 % and a lever-age ratio under Basel III of 6.7 %. Furthermore, Vontobel’s balance sheet can be described as highly liquid, since its Liquidity Coverage Ratio averaged 202.8 % for the period under review and thus significantly exceeded the mini-mum requirement of 90 % defined by FINMA for 2018.
Total assets grew by 5% to CHF 24.0 billion in the period under review. On the liabilities side of the balance sheet, client deposits were almost unchanged at CHF 9.8 billion. Liabilities arising from the structured products business increased by 9 % from CHF 8.5 billion to CHF 9.3 billion due to the successful expansion of the business. As a result, hedging positions for this business increased on the asset side of the balance sheet. This was reflected, among other things, by a 22 % increase in “Other financial assets at fair value” to CHF 4.2 billion, while trading portfo-lio assets decreased by –13 % to CHF 3.5 billion. Loans to clients rose by almost CHF 1 billion or 30 % to CHF 4.3 billion.
16 Review of business activities

Allocation of regulatory capital required (BIS) as of 30 June 2018
CHF MN CREDIT RISKS MARKET RISKSOPERATIONAL
RISKS GOODWILL ETC. TOTALWealth Management 43.3 0.0 37.4 89.8 170.5Asset Management 10.2 0.0 65.1 194.7 270.0Investment Banking 38.8 155.5 42.7 5.7 242.7Corporate Center 32.4 61.2 5.1 0.0 98.7Total 124.7 216.7 150.3 290.2 781.9
Of the total regulatory capital of CHF 781.9 million (Decem-ber 31, 2017: CHF 766.9 million) required under BIS rules, i.e. on the basis of 8 % of risk weighted assets and after the
required deductions from core capital, 35% was allocated to Asset Management, 31% to Investment Banking and 22 % to Wealth Management.
95% of client assets come from Swiss home market and international focus marketsClient assets by client domicile as of 30 June 2018
CHF BNASSETS UNDER MANAGEMENT
OTHER ADVISED
CLIENT ASSETS
STRUCTURED PRODUCTS
OUTSTANDINGTOTAL ADVISED CLIENT ASSETS
CUSTODY ASSETS
TOTAL CLIENT ASSETS
Home market 69.4 0.4 7.4 77.2 61.9 139.1Switzerland 1 69.4 0.4 7.4 77.2 61.9 139.1Focus markets 86.6 12.8 1.9 101.3 0.1 101.3Germany 16.1 5.5 1.9 23.5 0.0 23.5Italy 10.4 0.0 0.0 10.4 0.0 10.4UK 18.4 0.0 0.0 18.4 0.0 18.4US 20.8 0.0 0.0 20.8 0.0 20.8Emerging Markets 2 20.9 7.3 0.0 28.2 0.1 28.2Other markets 12.6 0.2 0.0 12.7 0.4 13.1Total client assets 168.6 13.4 9.3 191.2 62.3 253.6
1 Including Liechtenstein2 Asia Pacific region, CEE, LATAM, Middle East, Africa
Vontobel’s successful business expansion is also reflected by the growth of its asset base over the last five years. Since mid-2014, total client assets have increased by 47 %, mainly driven by organic growth with the acquisition of sig-nificant new money and above-average investment per-formance. In this context, the international client base expanded somewhat more rapidly than the client base in Vontobel’s home market of Switzerland. As at mid-2018, 55% of client assets comprise the assets of clients domi-ciled in Switzerland, underscoring the high level of confi-dence that clients in our home market have in Vontobel’s expertise and financial solidity.
The integration of Notenstein La Roche Privatbank AG in the second half of 2018 will further strengthen our position in Switzerland. Today, 95% of client assets come from the Swiss market and Vontobel’s focus markets.
17Review of business activities

Strategic priorities
Based on Vontobel’s client-driven and long-term oriented strategy as an internationally active specialist in wealth and asset management that is dedicated to growth and innovation, the Board of Directors and Executive Board of Vontobel defined five strategic priorities in 2017 for the next three years:
– A great client experience has become essential to meet the expectations of clients. The first strategic priority is therefore to deliver the unique Vontobel experience. In this way, we will generate superior value for clients and create a stronger emotional connection to the brand.
– Empower people is the second strategic priority that has been defined. An ownership mindset forms the backbone of Vontobel’s culture. Through various initi-atives, we want to empower and foster entrepreneur-ship among our employees.
– Our third strategic priority is to create brand excite-ment among our clients. We have sharpened our cor-porate profile and we introduced a new corporate design in September 2017 to strengthen our posi-tioning and further increase the attractiveness of the Vontobel brand.
– Our fourth strategic priority is to boost growth and market share. We are thus remaining true to the prin-ciple of pursuing an organic growth strategy, driving growth initiatives across all business units in Switzer-land and internationally. At the same time, a disci-plined M&A approach will complement our targeted organic growth.
– Driving efficiency is the fifth strategic priority. We want to transform top-line growth into superior bot-tom-line growth through tight cost management and by streamlining processes to achieve economies of scale. Vontobel operates in international markets, where we are subject to increasing regulations and where products are growing more complex in response to rising client expectations. Our global platform strategy is the key to efficiently managing this complexity: With our state-of-the-art infrastruc-ture, we create high-quality products and services centrally in Switzerland and distribute them globally. Vontobel’s efficient IT infrastructure allows for a high degree of automation that exceeds 99%. Since we completely renewed our core banking platform system in the last decade, our resources can now be
allocated to digital innovation in order to deliver greater benefits for clients as well as further efficiency gains.
Increased profitability targets for 2020 take account of positive impacts of acquisition of Notenstein La Roche Privatbank AG
Building on these strategic priorities, the Board of Direc-tors and Executive Board have defined ambitious targets for growth, profitability, capital and dividends for 2020. In summer 2018, the profitability targets for Vontobel and Combined Wealth Management were increased to take account of the positive impacts that the acquisition of Notenstein La Roche Privatbank is expected to have on profitability.
In specific terms, this means Vontobel wants to:
– Outgrow the market in all core activities with top-line growth and net new money growth of 4–6 % , exclud-ing market performance effects
– Generate a higher return on equity of more than 14%, (original target: more than 12 %), clearly exceeding the cost of capital; achieve a cost / income ratio of less than 72 % (original target: less than 75%)
– Maintain a very strong capital position with a CET1 capital ratio of more than 12 % and a total capital ratio of more than 16 %
– Distribute profits not used for organic growth and M&A to shareholders, with a target payout ratio of more than 50 % for shareholders
18 Review of business activities
– Combined Wealth Management: Capture high-growth markets, drive innovation through technology and further enhance the client experience with i nvestment-led content and client-specific solutions 2020 targets: Outgrow the market with net new money growth of 4–6 %; protect a gross margin of more than 68 basis points (previously 65 basis points); ensure profitable growth with a cost / income ratio of less than 70 % (previously 75%)
– Asset Management: High-conviction asset manage-ment translates into an outstanding product offering. Leverage market trends such as innovative invest-ment solutions and digitization as well as our own global distribution network to reach all relevant client segments 2020 targets: Continue to outgrow the market with 4–6 % net new money growth, protect a gross margin of more than 40 basis points; ensure profitable growth with a cost / income ratio of less than 65%
– Financial Products: Drive future growth through inter-national expansion, with entry into new markets in APAC and growth of existing market share in Europe, and continue state-of-the-art digital innovation to become a leading provider of structured products and derivatives globally 2020 targets: Grow operating income to more than CHF 300 million; ensure profitable growth with a cost / income ratio of less than 65%
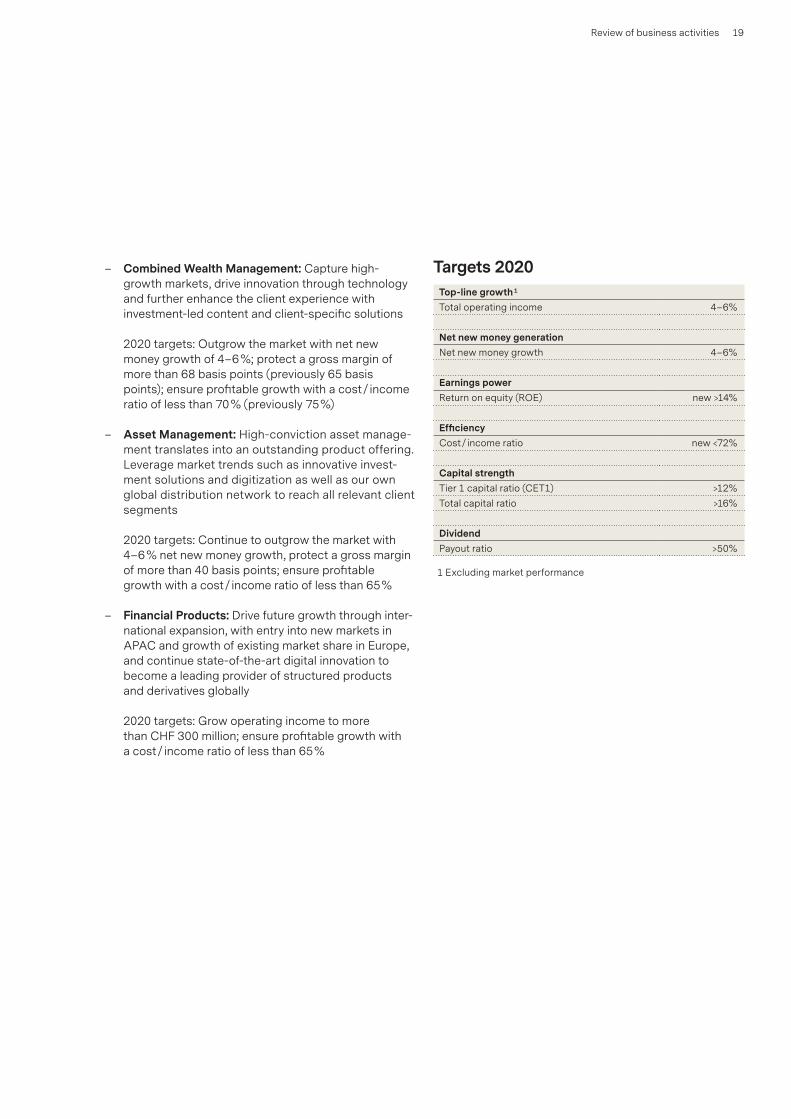
Targets 2020Top-line growth 1
Total operating income 4–6%
Net new money generationNet new money growth 4–6%
Earnings powerReturn on equity (ROE) new >14%
EfficiencyCost / income ratio new <72%
Capital strengthTier 1 capital ratio (CET1) >12%Total capital ratio >16%
DividendPayout ratio >50%
1 Excluding market performance
19Review of business activities

Wealth Management
Vontobel has actively shaped Wealth Management in recent years with a focus on achieving organic growth. At the same time, it was always ready to consider acquisi-tions, such as the takeover of Finter Bank in 2015 or the acquisition of the Eastern European portfolio of Noten-stein La Roche with around CHF 2 billion of assets in 2017. All of these efforts always centered on the interests of cli-ents. This strategy has proved effective, resulting in record client assets and strong profit growth in the first half of 2018.
In May 2018, Vontobel was also able to announce the acquisition of Notenstein La Roche Privatbank AG and the transaction was successfully completed in July 2018. The client portfolio of Notenstein La Roche comprises around CHF 16.5 billion of client assets, of which around 90 % will be managed in Wealth Management. The remaining assets will be managed by External Asset Managers (EAM). By acquiring Notenstein La Roche, Vontobel is expanding its portfolio of wealthy clients that is already experiencing good organic growth. It is also strengthening its presence in its home market with the additional locations served by Notenstein La Roche and is underscoring its position as one of the leading private banks in Switzerland. Notenstein La Roche was consolidated with effect from July 2018.
Managed client assets grew 1% in the first half of 2018, even though CHF 1.4 billion of managed client assets in Liechtenstein were sold as part of the focusing of the busi-ness. The increase in assets was driven by strong annual-ized growth in net new money of 5.7 %. As a result of the record client assets, we succeeded in increasing our oper-ating income to CHF 154.9 million (+17 %). Reflecting strict cost discipline and ongoing digitization – and despite sig-nificant capital expenditure – operating expense grew by only 7 %. As a result, Wealth Management delivered a sig-nificant increase in pre-tax profit to CHF 42.4 million (+56 %) in the first half of 2018. This result is also reflected by the cost / income ratio, which improved from 79.3 % in the first half of 2017 to 72.5% in the first half of 2018.
We measure the quality of our services from various per-spectives – with the clearest indicators being the achieve-ment of a high level of client satisfaction and the genera-tion of above-average inflows of assets in recent years relative to our peers. Our strong investment expertise is shown by the impressive performance of our advisory and discretionary management mandates, as well as our extensive knowledge in the area of Swiss equities, supple-mented by the targeted launch of thematic investments. Investments in family-run companies have proved to be a particularly strong driver of performance, combined with investments in disruptive e-commerce and e-sports
stocks. Our digital solution “Vontobel Wealth” is today a pioneering offering in a peer group comparison. We want to defend this competitive advantage and will therefore continuously develop our digital channel in the future.
At Vontobel, we see changes as a source of opportunity and harness them for the benefit of our clients wherever possible. We have therefore implemented wide-ranging regulatory requirements such as MiFID II and the Auto-matic Exchange of Information fully on schedule. We have used these regulatory developments as well as the ongo-ing digital transformation as a means of further enhancing our client services and of implementing a more future-ori-ented approach. These efforts center on an advisory pro-cess that is based more strongly on a personal dialogue with clients and allows us to address their individual needs and specific goals even more effectively. To support this approach, we also completely revised our product and service offering. The development of our innovative and proprietary Vontobel 3-alpha-Investment Philosophy® in the area of Wealth Management is one of the core compo-nents of these measures. The focus here is on delivering greater client benefits, on streamlining and making more flexible use of the product range, and on further improving transparency – especially with regard to fees. With these new products, we are of course meeting current and emerging regulatory requirements. As part of our digitiza-tion strategy, we also further developed our “Vontobel Wealth” platform with the aim of providing digital services to ideally complement the personal advice offered to cli-ents by our relationship managers.
Vontobel Wealth Management has been actively managing client assets with foresight for decades and aspires to be the leading Swiss wealth manager. We pursue a holistic approach that centers on our clients and their assets. We consider it important to ensure continuity in our advisory services. This forms the foun-dations for a long-term business relationship with our clients. Our offering encompasses a wide variety of services – from portfolio management and active investment advisory to integrated finan-cial advice, financial planning and financing solutions. Vontobel’s business model also allows our private clients to access the proven expertise of our Asset Management and Investment Banking divisions. Vontobel Wealth Management has a presence in Zurich, Basel, Berne, Chur, Geneva, Lausanne, Locarno, Lugano, Lucerne, Olten, Schaffhausen, St. Gallen, Winterthur, Munich, Hamburg und Hong Kong. It is also present in New York through its SEC-registered company Vontobel Swiss Wealth Advisors AG.
20 Review of business activities

Segment results
30.06.2018 30.06.2017 31.12.2017 CHANGE TO 30.06.2017(6 MONTHS) CHF MN CHF MN CHF MN CHF MN IN %Net interest income after credit losses 25.6 15.9 22.6 9.7 61Net fee and commission income 119.3 106.6 108.6 12.7 12Trading income and other operating income 10.0 9.4 9.3 0.6 6Total operating income 154.9 131.9 140.5 23.0 17Personnel expense 61.3 55.4 57.7 5.9 11General expense 7.7 7.7 9.4 0.0 0Services from / to other segment(s) 40.8 40.0 37.9 0.8 2Depreciation of property, equipment and intangible assets 2.4 1.5 1.7 0.9 60Provisions and losses 0.3 0.2 0.4 0.1 50Total operating expense 112.5 104.8 107.1 7.7 7Segment profit before taxes 42.4 27.1 33.4 15.3 56
Key figures
IN % 30.06.2018 30.06.2017 31.12.2017Cost 1 / income ratio 72.5 79.3 75.9Change of assets under management 0.8 2.1 10.6of which net new money 2.9 2.6 0.0of which change in market value 1.1 0.8 5.6of which other effects 2 –3.2 –1.3 5.0Operating income / average assets under management (bp) 3,4 70 67 67Profit before taxes / average assets under management (bp) 3,4 19 14 16
Client assets
30.06.2018 30.06.2017 31.12.2017 CHANGE TO 31.12.2017CHF BN CHF BN CHF BN CHF BN IN %
Assets under management 44.3 39.8 44.0 0.3 1Other advised client assets 1.5 1.4 1.8 –0.3 –17Total advised client assets 45.9 41.2 45.8 0.1 0Average assets under management 4 44.1 39.4 41.7 2.4 6
Net new money
CHF BN (6 MONTHS) 30.06.2018 30.06.2017 31.12.2017Net new money 1.3 1.0 0.0
Personnel
CHANGE TO 31.12.201730.06.2018 30.06.2017 31.12.2017 IN %
Employees (full-time equivalents) 397.0 390.3 408.2 –11.2 –3of which relationship managers 196.5 186.4 202.4 –5.9 –3
1 Operating expense excl. provisions and losses2 As of 30.06.2018: Sale of the Liechtenstein operation in February 2018
As of 30.06.2017: The decrease in assets under management reflects the reclassification of certain assets (CHF 0.5 bn) that are not held for investment purposes. As of 31.12.2017: Acquisition of the Eastern European client portfolio of Notenstein La Roche in December 2017
3 Annualized4 Calculation based on average values for individual months
21Review of business activities

Asset Management
The combination of Vontobel’s positioning as a high-con-viction asset manager and its targeted diversification strat-egy is continuing to prove successful. In the first half of 2018, advised client assets grew compared to the prior-year period, reaching a new record level of CHF 124.2 billion. At 7.2%, the annualized growth in net new money exceeded our target range of 4–6% and was also above the market average. Inflows were broadly diversified across Equities, Fixed Income and Multi Asset strategies. A proportion of inflows originated from our investment business with Raif-feisen. The impressive quality of our products also contrib-uted to the growth in assets. Our range of sustainable investments is one area of focus of our growth strategy. Advised client assets totaled CHF 15 billion and these strat-egies attracted more than CHF 1 billion of new money dur-ing the second quarter.
In the first half of 2018, the impressive investment perfor-mance and quality of our products were recognized by renowned rating agencies, which presented us with more than 30 awards. Reflecting our active management approach, many of our investment funds have a 4- or 5-star rating from Morningstar. This is especially important for future growth, since experience has shown that funds with 4 or 5 stars attract the most new money. Alongside Morn-ingstar, other rating agencies also recognized our invest-ment funds, with Lipper naming Vontobel the leading provider in the categories “Emerging Markets Equity”, “Commodities” and “Mixed Asset CHF Balanced” in four European countries. In addition, our expertise was recog-nized at the UK Pension Awards ceremony in London, where Vontobel was named “Emerging Markets Manager of the Year” in view of the performance of our mtx Sustainable Leaders and Emerging Markets Debt strategies. Our Twen-tyFour Asset Management boutique in London was named “Specialist Fixed Income Group of the Year” for the third time in succession and it received a Performance Award for its Unconstrained Fixed Income and UK Fixed Income strat-egies. In the Capital Fonds-Kompass 2018 awards, Vontobel Asset Management was named as one of the top fund pro-viders in Germany.
The gross margin in Asset Management stabilized after declining in recent years due, in particular, to the more diversified business model and the resulting changes in the composition of assets. Its good margin reflects the broad diversification of our products across Equities, Fixed Income, Multi Asset and quantitative strategies for institu-tional and fund clients.
As a result of the systematic execution of our growth strat-egy, we delivered a significant increase in operating income to CHF 234.8 million in the first half of 2018, up 16% from CHF 201.7 million in the first half of 2017. Despite capital expenditure, operating expense grew at a much lower rate (+8%) than income. This resulted in a higher segment result of CHF 92.5 million or a 33% increase in profit compared to the prior-year period. With its substantial profit contribution, Asset Management was once again the main earnings driver at Vontobel.
We want to pursue our successful growth strategy as a high-conviction asset manager in the future. Consequently, we retain our portfolio managers through our long-term compensation system, under which employees receive part of their bonus in the form of blocked shares. To further strengthen their loyalty to their own products and to ensure an even closer alignment with the interests of our clients, some portfolio managers are subject to variable compensa-tion agreements. Under the terms of those agreements, a proportion of compensation is linked to the investment per-formance of the funds managed by the portfolio managers and is only paid out after a period of three years.
As an active asset manager, the division creates financial value for clients. To achieve this, it develops first-class solutions to opti-mize returns and manage risk. Asset Management is positioned as a multi-boutique provider that focuses on the following areas: Quality Growth Equities, Sustainable and Thematic Investing, Fixed Income, TwentyFour Asset Management, Multi Asset and Vescore. Each boutique is run as an independent center of exper-tise. The Asset Management division has a presence in Zurich, Basel, Berne, Geneva, St. Gallen, New York, Frankfurt, London, Luxembourg, Madrid, Milan, Munich, Hong Kong and Sydney.
22 Review of business activities

Segment results
30.06.2018 30.06.2017 31.12.2017 CHANGE TO 30.06.2017(6 MONTHS) CHF MN CHF MN CHF MN CHF MN IN %Net interest income after credit losses 0.2 0.1 0.0 0.1 100Net fee and commission income 234.9 200.2 231.6 34.7 17Trading income and other operating income –0.4 1.4 1.6 –1.8Total operating income 234.8 201.7 233.2 33.1 16Personnel expense 88.7 82.3 89.9 6.4 8General expense 26.3 21.9 21.7 4.4 20Services from / to other segment(s) 22.5 25.4 24.1 –2.9 –11Depreciation of property, equipment and intangible assets 4.1 2.5 4.0 1.6 64Provisions and losses 0.7 0.1 0.1 0.6 600Total operating expense 142.3 132.2 139.8 10.1 8Segment profit before taxes 92.5 69.5 93.4 23.0 33
Key figures
IN % 30.06.2018 30.06.2017 31.12.2017Cost 1 / income ratio 60.3 65.5 59.9Change of assets under management 2 2.8 6.4 13.8of which net new money 3.6 –1.9 5.5of which change in market value –1.3 8.3 8.3of which other effects 3 0.5 0.0 0.0Operating income / average assets under management (bp) 4,5 42 43 45Profit before taxes / average assets under management (bp) 4,5 16 15 18
Client assets
30.06.2018 30.06.2017 31.12.2017 CHANGE TO 31.12.2017CHF BN CHF BN CHF BN CHF BN IN %
Assets under management 112.3 97.2 110.3 2.0 2of which Vontobel funds 29.7 22.7 28.7 1.0 3of which managed on behalf of other segments 1.9 2.9 2.8 –0.9 –32Other advised client assets 11.9 9.6 11.0 0.9 8Total advised client assets 124.2 106.8 121.3 2.9 2Average assets under management 5 112.2 94.8 104.7 7.5 7
Net new money
CHF BN (6 MONTHS) 30.06.2018 30.06.2017 31.12.2017Net new money 3.8 –1.7 5.3
Personnel
CHANGE TO 31.12.201730.06.2018 30.06.2017 31.12.2017 IN %
Employees (full-time equivalents) 406.4 398.5 404.9 1.5 0
1 Operating expense excl. provisions and losses2 Adjusted for assets that are managed on behalf of other segments3 Reclassification due to the sale of Bank Vontobel (Liechtenstein) AG4 Annualized5 Calculation based on average values for individual months
23Review of business activities
Investment Banking
Vontobel is one of the world’s leading providers of struc-tured investment products and leverage products, with a market share of over 11% in Europe and 31% in our Swiss home market, measured in terms of the exchange-traded volume in the target segment. As a forward-looking issuer that is close to its clients, Vontobel offers investors a broad investment universe with more than 290,000 issued prod-ucts spanning many geographical regions and risk classes. The international expansion of Financial Products is advancing rapidly. We have been operating successfully in Germany and the Nordic market for a number of years. We entered the Italian market in 2016 and made our market debut in the Netherlands and France and on the Hong Kong stock exchange – one of the world’s largest markets in terms of trading volumes – in 2017. Our entry into the Danish market is planned for 2018. In addition to several new markets, we are mainly focused on expanding our activities in our existing markets.
In the first six months of 2018, clients around the world traded a total of CHF 24.0 billion of Vontobel products. Growth was driven mainly by Asia, where the volume increased to CHF 11.1 billion. Our performance in Hong Kong thus continued to exceed our expectations in the first half of 2018. Growth excluding Asia was 7 %, reflect-ing improved market share across the majority of our mar-kets in Europe. We also further strengthened our position in our Swiss home market.
This success is attributable to our client proximity and our state-of-the-art digital ecosystem, which allows us to rap-idly enter new markets and serve new target groups. Vontobel Investment Banking has 16 different platforms and web-based offerings. With our unique and leading multi issuer platform Vontobel deritrade® MIP, we enable asset managers and banks to independently compare, create and manage structured products from different issuers for their clients. In the first half of 2018, a total of CHF 3.2 billion of products was purchased on this plat-form – a significant increase of 45% compared to the pre-vious year and more than the turnover on the SIX Swiss Exchange in the segment for yield enhancement products. We are now also offering our multi issuer capabilities to our clients in Germany through the issuing platform “mein-zertifikat.de”. In Switzerland, private investors have been able to use a new type of app, “Vontobel Investment Scout”, since 2017 in order to select a structured product tailored to their individual preferences and have it issued immediately via their iPhone or iPad. Financial Products also unveiled innovative new products, including the launch in July of “cosmofunding”, a platform for private placements and loans that enables municipalities and SMEs to gain direct access to investors.
Vontobel’s External Asset Managers (EAM) business pro-vides support and advice to external asset managers. As a globally active financial specialist, we also give our EAMs access to our investment expertise. During the period under review, we further expanded our investment advi-sory offering and generated value for the end-clients served by EAMs through our investment recommenda-tions, thus contributing to the growth of their assets. In addition, we now provide discretionary mandates as well as comprehensive regulatory knowhow for our clients. We are continuing to develop our Vontobel EAMNet digital platform – a pioneering solution compared to the offerings of our peers with a very user-friendly design. Overall, our efforts were rewarded by our clients with impressive growth in net new money of 9.3 %. As a result, assets under management reached a new record level of CHF 10.5 billion.
Vontobel Corporate Finance advised a total of 17 compa-nies on capital market or M&A transactions in the first six months of 2018 and was thus able to further expand its leading position in the Swiss equity capital market and in the area of public takeover bids, among others. However, income declined somewhat from the exceptionally high level seen in the first half of 2017. Brokerage also experi-enced a reduction in income due to regulatory changes under MiFID II.
In the first half of 2018, Investment Banking grew its oper-ating income by 11% to CHF 187.9 million, driven by fur-ther gains in market share in Financial Products as well as the achievement of good growth in the External Asset Managers business. Pre-tax profit rose by 5% to CHF 65.7 million.
Investment Banking creates customized investment solutions for our clients. Vontobel is today one of the leading issuers of struc-tured products and derivatives in Europe and is established in Asia. Investment Banking also provides comprehensive services for external asset managers. In addition to its award-winning Broker-age function, Vontobel is active in the field of corporate finance. Securities and foreign exchange trading, as well as the securities services supplied by Transaction Banking, complete its range of offerings. Prudent risk management is assigned the utmost impor-tance in all of these activities. Vontobel Investment Banking is a global leader in the digitization of investment solutions. Investment Banking has operations in Zurich, Basel, Geneva, Lugano, Cologne, Frankfurt, Dubai, London, New York, Hong Kong and Singapore.
24 Review of business activities

Segment results
30.06.2018 30.06.2017 31.12.2017 CHANGE TO 30.06.2017(6 MONTHS) CHF MN CHF MN CHF MN CHF MN IN %Net interest income after credit losses 5.6 4.7 5.3 0.9 19Net fee and commission income 41.8 42.5 33.5 –0.7 –2Trading income and other operating income 140.5 121.6 121.2 18.9 16Total operating income 187.9 168.8 160.0 19.1 11Personnel expense 63.1 59.4 55.9 3.7 6General expense 31.6 24.7 29.4 6.9 28Services from / to other segment(s) 23.0 19.2 22.4 3.8 20Depreciation of property, equipment and intangible assets 3.2 2.7 2.8 0.5 19Provisions and losses 1.2 0.0 0.2 1.2Total operating expense 122.2 106.0 110.7 16.2 15Segment profit before taxes 65.7 62.8 49.3 2.9 5
Key figures
IN % 30.06.2018 30.06.2017 31.12.2017Cost 1 / income ratio 64.4 62.8 69.1Change of assets under management 0.1 13.8 11.3of which net new money 0.1 9.2 3.2of which change in market value 0.0 4.6 8.1
Client assets
30.06.2018 30.06.2017 31.12.2017 CHANGE TO 31.12.2017CHF BN CHF BN CHF BN CHF BN IN %
Assets under management 13.8 12.4 13.8 0.0 0Structured products outstanding 9.3 7.2 8.5 0.8 9Total advised client assets 23.1 19.6 22.3 0.8 4Custody assets 62.3 43.0 59.9 2.4 4Total client assets 85.3 62.6 82.2 3.1 4
Net new money
CHF BN (6 MONTHS) 30.06.2018 30.06.2017 31.12.2017Net new money 0.0 1.0 0.4
Personnel
CHANGE TO 31.12.201730.06.2018 30.06.2017 31.12.2017 IN %
Employees (full-time equivalents) 393.4 376.9 383.1 10.3 3
Of which External Asset Managers
CHANGE TO 30.06.2017(6 MONTHS) 30.06.2018 30.06.2017 31.12.2017 IN %Operating income (CHF mn) 29.2 25.9 26.7 3.3 13Profit before taxes (CHF mn) 13.8 11.3 11.7 2.5 22Cost 1 / income ratio (%) 51.2 56.0 56.1Assets under management (CHF bn) 10.5 8.7 10.0Net new money (CHF bn) 0.5 0.6 0.6Operating income / average assets under management (bp) 2,3 57 62 57
1 Operating expense excl. provisions and losses2 Annualized3 Calculation based on average values for individual months
25Review of business activities

Corporate Center
Vontobel has a long tradition of corporate responsibility and sustainability, which are part of our corporate culture. We strive to take greater account of sustainability aspects across every area of our business and we view this as a permanent and pressing commitment. Since the 1990s, Vontobel has continuously expanded its sustainable investing activities and is seeking to play a leading role in this area. The volume of sustainable investments at Vontobel rose from CHF 13.9 billion at December 31, 2017 to almost CHF 15.6 billion at June 30, 2018, corresponding to growth of over 10 %. All three divisions contributed to this increase. Structured products focusing on sustainable investment themes more than doubled, and in Wealth Management, mandates managed according to sustaina-bility criteria experienced significant growth. In addition, Vontobel now incorporates ESG criteria into the invest-ment process of several funds. Examples include the investment strategy focusing on emerging markets bonds denominated in local currencies. More than CHF 1 billion of the sustainable new money generated comprises inflows into investment funds in the “mtx” strategy group that invest in emerging markets equities, among others. ISS-oekom rated Vontobel’s sustainability performance this year for the first time and awarded it “Prime” status. This means that Vontobel ranks among the top 6 % in its peer group of 44 asset managers worldwide.
With the rollout of Avaloq in 2009 and the subsequent upgrading of peripheral systems, Vontobel laid the foun-dations for the current digital transformation of the busi-ness. This reflects the vital importance today of having a modern back- and middle-office landscape in order to successfully implement innovative front-office applica-tions. To drive forward the digital transformation process in a coordinated and targeted manner, a dedicated pro-gram was launched that encompasses more than 20 digi-tization projects. In March 2017, for example, Financial Products introduced “Vontobel Investment Scout” – the world’s first app that allows private investors to use their iPhone or iPad to create structured products, tailor them to their specific requirements and monitor them. At the same time, the range of products offered on the “Vontobel Wealth” and “Vontobel EAMNet” platforms is being con-tinuously refined and expanded. A substantial proportion of IT investment is now being channeled into the digitiza-tion of the business; with these future-oriented invest-ments, we are securing a strong and competitive market position for Vontobel.
Vontobel has long adopted a future-oriented approach to business – especially with German clients. Some time ago, it therefore carried out a systematic review of the tax sta-tus of all German clients and actively supported their
efforts to regularize their tax status where applicable. Irre-spective of this, the German tax authorities launched an investigation into Vontobel and a large number of other Swiss financial institutions in 2014. At the start of 2018, Vontobel agreed a mutual settlement with the authorities in the German state of North Rhine-Westphalia and paid a one-off sum of approximately EUR 13.3 million. Provisions covering the full amount were already recorded in prior years.
The negative interest rates that apply to certain sight deposits held by banks at the Swiss National Bank (SNB), as well as the negative key interest rate in the Eurozone, adversely affected our result once again. They primarily had an impact in Wealth Management and in the External Asset Managers business, as well as in Treasury. This effect was partly offset by an increase in lending to clients in the form of secured loans (“lombard loans”) and mort-gages, as well as by the active management of excess liquidity. In addition, in Treasury, it was not possible to rein-vest the capital from maturing bonds at the same attrac-tive conditions and this also had a negative impact on interest income.
In June 2018, Vontobel successfully placed a CHF 450 mil-lion Additional Tier 1 (AT1) bond with a coupon of 2.625%. The proceeds of this capital market transaction are being used primarily to finance the acquisition of the private bank Notenstein La Roche and to strengthen the total cap-ital ratio following the integration.
Operating income decreased slightly in the first half of 2018 compared to the prior-year period. This was reflected by a lower pre-tax result of CHF –39.8 million.
The Corporate Center provides central services for the divisions and comprises the units Operations, Finance & Risk and Corporate Services, as well as the Board of Directors support unit. Operations consists of the central IT unit and Facility Management, as well as Legal, Compliance & Tax. Finance & Risk combines the areas of Finance, Controlling, Treasury, Risk Control and Investor Relations. Corporate Services is divided into the areas Corporate Human Resources, Corporate Marketing & Communications, and Corpo-rate Business Development. The Board of Directors support unit assists the Board of Directors with all administrative and legal mat-ters and includes Internal Audit.
26 Review of business activities

Segment results
30.06.2018 30.06.2017 31.12.2017 CHANGE TO 30.06.2017(6 MONTHS) CHF MN CHF MN CHF MN CHF MN IN %Net interest income after credit losses 5.7 13.9 6.0 –8.2 –59Net fee and commission income –17.6 –15.7 –14.4 –1.9Trading income and other operating income 17.4 16.8 17.4 0.6 4Total operating income 5.6 15.0 9.0 –9.4 –63Personnel expense 63.4 65.0 67.0 –1.6 –2General expense 45.7 47.5 42.7 –1.8 –4Services from / to other segment(s) –86.3 –84.6 –84.4 –1.7Depreciation of property, equipment and intangible assets 22.4 23.0 22.8 –0.6 –3Provisions and losses 0.2 1.0 0.1 –0.8 –80Total operating expense 45.4 51.9 48.2 –6.5 –13Segment profit before taxes –39.8 –36.9 –39.2 –2.9
Personnel
CHANGE TO 31.12.201730.06.2018 30.06.2017 31.12.2017 IN %
Employees (full-time equivalents) 498.4 477.2 492.0 6.4 1
27Review of business activities

Capital and liquidity
Eligible and required capital
CHF MN 30.06.2018 31.12.2017Eligible capitalEquity according to balance sheet 1,678.8 1,620.5Paid-in capital 56.9 56.9Disclosed reserves 1,542.9 1,440.8Net profit for the current financial year 127.7 202.4Deduction for treasury shares –48.7 –79.6Deduction for minority interests 0.0 0.0Deduction for dividends (current estimate) –59.8 –119.4Deduction for goodwill –226.5 –226.8Deduction for intangible assets –58.0 –64.3Deduction for deferred tax assets –17.5 –20.0Addition (deduction) for losses (gains) due to changes in own credit risk –5.7 0.6Deduction for unrealised gains related to financial investments –48.8 –4.1Deduction for defined benefit pension fund assets (IAS 19) –35.8 –29.9Other adjustments –52.0 –58.0Net eligible BIS common equity tier 1 capital (CET1) 1,174.7 1,098.6Additional tier 1 capital (AT1) 447.4 0.0Net eligible BIS tier 1 capital 1,622.1 1,098.6Supplementary capital (tier 2) 0.0 0.0Other deductions from total capital 0.0 0.0Net eligible regulatory capital (BIS tier 1 + 2) 1,622.1 1,098.6
Risk-weighted positionsCredit risks 1,968.2 1,892.6Receivables 1,857.3 1,812.1Price risk relating to equity instruments in the banking book 110.9 80.5Non-counterparty related risks 155.7 158.6Market risks 2,145.2 2,079.3Interest rates 1,248.5 1,187.3Equities 349.5 328.9Currencies 220.6 242.8Gold 39.7 69.8Commodities 286.9 250.5Operational risk 1,879.0 1,825.1Total risk-weighted positions 6,148.1 5,955.6
The disclosures for capital adequacy, leverage ratio and liquidity coverage ratio are in accordance with the requirements set out in FINMA Circular 16/01. The values used to calculate the liquidity coverage ratio are simple monthly averages for the relevant quarter or halfyear. The average is calculated based on the values shown in the monthly liquidity status reports submitted to FINMA and the SNB. This results in three data points per quarter.
For 2018, the liquidity coverage ratio has to exceed 90 %. The main factors influencing Vontobel’s liquidity cover-age ratio are cash holdings as high-quality liquid assets, customer cash accounts as weighted cash outflows, and reverse-repurchase agreements maturing within 30 cal-endar days as cash inflows.
28 Capital and liquidity
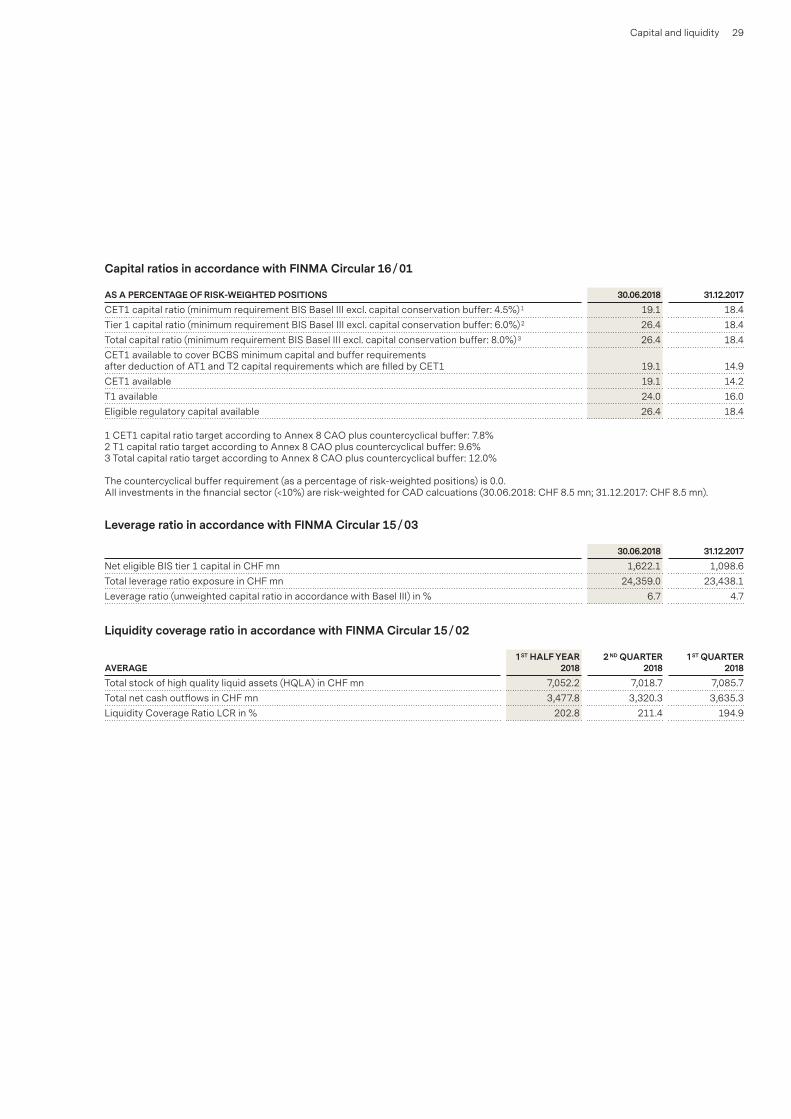
Capital ratios in accordance with FINMA Circular 16 / 01
AS A PERCENTAGE OF RISK-WEIGHTED POSITIONS 30.06.2018 31.12.2017CET1 capital ratio (minimum requirement BIS Basel III excl. capital conservation buffer: 4.5%) 1 19.1 18.4Tier 1 capital ratio (minimum requirement BIS Basel III excl. capital conservation buffer: 6.0%) 2 26.4 18.4Total capital ratio (minimum requirement BIS Basel III excl. capital conservation buffer: 8.0%) 3 26.4 18.4CET1 available to cover BCBS minimum capital and buffer requirements after deduction of AT1 and T2 capital requirements which are filled by CET1 19.1 14.9CET1 available 19.1 14.2T1 available 24.0 16.0Eligible regulatory capital available 26.4 18.4
1 CET1 capital ratio target according to Annex 8 CAO plus countercyclical buffer: 7.8%2 T1 capital ratio target according to Annex 8 CAO plus countercyclical buffer: 9.6%3 Total capital ratio target according to Annex 8 CAO plus countercyclical buffer: 12.0%
The countercyclical buffer requirement (as a percentage of risk-weighted positions) is 0.0.All investments in the financial sector (<10%) are risk-weighted for CAD calcuations (30.06.2018: CHF 8.5 mn; 31.12.2017: CHF 8.5 mn).
Leverage ratio in accordance with FINMA Circular 15 / 03
30.06.2018 31.12.2017Net eligible BIS tier 1 capital in CHF mn 1,622.1 1,098.6Total leverage ratio exposure in CHF mn 24,359.0 23,438.1Leverage ratio (unweighted capital ratio in accordance with Basel III) in % 6.7 4.7
Liquidity coverage ratio in accordance with FINMA Circular 15 / 02
AVERAGE 1 ST HALF YEAR
20182 ND QUARTER
20181 ST QUARTER
2018Total stock of high quality liquid assets (HQLA) in CHF mn 7,052.2 7,018.7 7,085.7Total net cash outflows in CHF mn 3,477.8 3,320.3 3,635.3Liquidity Coverage Ratio LCR in % 202.8 211.4 194.9
29Capital and liquidity

30 Consolidated financial statements
Consolidated income statement
30.06.2018 30.06.2017 31.12.2017 CHANGE TO 30.06.2017(6 MONTHS) NOTE CHF MN CHF MN CHF MN CHF MN IN %Interest income 45.5 41.0 41.9 4.5 11Interest expense 8.1 6.3 7.9 1.8 29Net interest income 37.4 34.7 34.0 2.7 8Credit loss (expense) / recovery –0.2 0.0 –0.2 –0.2Net interest income after credit losses 1 37.2 34.7 33.8 2.5 7Fee and commission income 501.7 433.2 469.3 68.5 16Fee and commission expense 123.2 99.6 110.0 23.6 24Net fee and commission income 2 378.5 333.6 359.3 44.9 13Trading income 3 166.3 143.5 145.3 22.8 16Other income 4 1.3 5.7 4.2 –4.4 –77Total operating income 583.3 517.5 542.6 65.8 13Personnel expense 5 276.6 262.1 270.5 14.5 6General expense 6 111.3 101.8 103.2 9.5 9Depreciation of property, equipment and intangible assets 7 32.1 29.7 31.3 2.4 8Provisions and losses 8 2.4 1.4 0.8 1.0 71Total operating expense 422.4 395.0 405.8 27.4 7
Profit before taxes 160.9 122.5 136.8 38.4 31Taxes 9 28.2 21.0 29.3 7.2 34Group net profit 132.7 101.5 107.5 31.2 31of which allocated to minority interests 4.9 2.8 3.8 2.1 75of which allocated to shareholders of Vontobel Holding AG 127.7 98.7 103.7 29.0 29
Share information (CHF)
Basic earnings per share 1 2.28 1.78 1.87 0.50 28Diluted earnings per share 1 2.24 1.75 1.81 0.49 28
1 Basis: weighted average number of sharesThe reporting of interest income has changed. The figures for the previous year were adapted accordingly.
Consolidated income statement

31Consolidated financial statements
Consolidated statement of comprehensive income
30.06.2018 30.06.2017 31.12.2017 CHANGE TO 30.06.2017(6 MONTHS) NOTE CHF MN CHF MN CHF MN CHF MN IN %Group net profit according to the income statement 132.7 101.5 107.5 31.2 31
Other comprehensive income, net of tax 10
Other comprehensive income that will be reclassified to the income statementCurrency translation adjustments:Income during the reporting period 1.4 –7.6 9.2 9.0Gains and losses transferred to the income statement 0.0 0.0 0.0 0.0Total currency translation adjustments 1.4 –7.6 9.2 9.0Debt instruments in financial investments 1:Income during the reporting period –8.1 2.4 –5.1 –10.5Gains and losses transferred to the income statement 0.2 –2.3 –1.2 2.5Total debt instruments in financial investments –7.9 0.1 –6.3 –8.0Cash flow hedges:Income during the reporting period –0.9 0.2 –0.7 –1.1Gains and losses transferred to the income statement 0.0 0.0 0.0 0.0Total cash flow hedges –0.9 0.2 –0.7 –1.1Total other comprehensive income that will be reclassified to the income statement –7.4 –7.3 2.2 –0.1
Other comprehensive income that will not be reclassified to the income statementIncome from equity instruments in financial investments –0.8Income from defined benefit pension plans 0.8 11.8 –2.2 –11.0 –93Total other comprehensive income that will not be reclassified to the income statement 0.0 11.8 –2.2 –11.8 –100
Total other comprehensive income, net of tax –7.4 4.5 0.0 –11.9
Comprehensive income 125.3 106.0 107.5 19.3 18of which allocated to minority interests 4.9 2.7 4.3 2.2 81of which allocated to shareholders of Vontobel Holding AG 120.4 103.3 103.2 17.1 17
1 In the financial year 2017, this item also included other comprehensive income from those equity securities and units in investment funds that were classified as “available-for-sale” under IAS 39.
Consolidated statement of comprehensive income

32 Consolidated financial statements
Assets
30.06.2018 31.12.2017 CHANGE TO 31.12.2017CHF MN CHF MN CHF MN IN %
Cash 6,441.3 6,287.9 153.4 2Due from banks 984.5 1,658.7 –674.2 –41Cash collateral for securities borrowing agreements 6.7 8.5 –1.8 –21Cash collateral for reverse-repurchase agreements 989.2 1,007.2 –18.0 –2Trading portfolio assets 3,479.2 3,991.2 –512.0 –13Positive replacement values 198.2 243.9 –45.7 –19Other financial assets at fair value 4,248.5 3,490.9 757.6 22Loans 4,301.9 3,310.5 991.4 30Financial investments 1,909.7 1,788.9 120.8 7Investments in associates 0.5 0.9 –0.4 –44Property and equipment 156.9 159.7 –2.8 –2Goodwill and other intangible assets 284.5 291.1 –6.6 –2Other assets 980.8 664.3 316.5 48Total assets 23,981.9 22,903.7 1,078.2 5
Consolidated balance sheet

33Consolidated financial statements
Liabilities and equity
30.06.2018 31.12.2017 CHANGE TO 31.12.2017CHF MN CHF MN CHF MN IN %
Due to banks 583.6 1,221.3 –637.7 –52Cash collateral from repurchase agreements 74.5 0.0 74.5Trading portfolio liabilities 147.7 158.2 –10.5 –7Negative replacement values 817.5 725.6 91.9 13Other financial liabilities at fair value 9,170.7 8,451.3 719.4 9Due to customers 9,789.3 9,758.2 31.1 0Debt issued 447.4 0.0 447.4Provisions 26.3 40.6 –14.3 –35Other liabilities 1,246.1 928.0 318.1 34Total liabilities 22,303.1 21,283.2 1,019.9 5
Share capital 56.9 56.9 0.0 0Treasury shares –48.7 –79.6 30.9Capital reserve –178.7 –160.3 –18.4Retained earnings 1,909.0 1,854.7 54.3 3Other components of shareholders' equity –59.6 –51.2 –8.4Shareholders’ equity 1,678.8 1,620.5 58.3 4Minority interests 0.0 0.0 0.0Total equity 1,678.8 1,620.5 58.3 4
Total liabilities and equity 23,981.9 22,903.7 1,078.2 5

34 Consolidated financial statements
Statement of equity
Statement of equity
CHF MN SHARE CAPITAL TREASURY SHARES CAPITAL RESERVERETAINED
EARNINGS
UNREALIZED INCOME
FROM DEBT INSTRUMENTS IN FINANCIAL
INVESTMENTS 1,2
CURRENCY TRANSLATION
ADJUSTMENTS 1 CASH FLOW
HEDGES 1 SHAREHOLDERS’
EQUITYMINORITY
INTERESTS TOTAL EQUITYBalance as of 01.01.2017 56.9 –93.8 –157.8 1,754.5 4.6 –49.6 –0.7 1,514.1 0.0 1,514.1
Group net profit 98.7 98.7 2.8 101.5Other comprehensive income that will be reclassified to the income statement 0.1 –7.5 0.2 –7.2 –0.1 –7.3Other comprehensive income that will not be reclassified to the income statement 11.8 11.8 0.0 11.8Comprehensive income 0.0 0.0 0.0 110.5 0.1 –7.5 0.2 103.3 2.7 106.0
Dividend payment 2 –111.8 –111.8 –4.3 –116.1Purchase of treasury shares –38.3 –38.3 0.0 –38.3Sale of treasury shares 7.2 1.0 8.2 0.0 8.2Share-based compensation expense 18.9 18.9 0.0 18.9Allocations from share-based compensation 59.2 –33.8 25.4 0.0 25.4Change in minority interests 0.0 0.0 0.0 0.0 0.0 0.0Change in liability to purchase minority interests –4.1 –4.1 1.6 –2.5Other effects 0.0 0.0 0.0 0.0 0.0 0.0 0.0 0.0Ownership-related changes 0.0 28.1 –18.0 –111.8 0.0 0.0 0.0 –101.7 –2.7 –104.4Balance as of 30.06.2017 56.9 –65.7 –175.8 1,753.2 4.7 –57.1 –0.5 1,515.7 0.0 1,515.7
Balance as of 01.01.2018 56.9 –79.6 –160.3 1,854.7 –1.6 –48.4 –1.2 1,620.5 0.0 1,620.5Impact of changes to the accounting principles 44.8 –1.1 43.7 43.7Balance as of 01.01.2018 after adjustments 56.9 –79.6 –160.3 1,899.5 –2.7 –48.4 –1.2 1,664.2 0.0 1,664.2
Group net profit 127.7 127.7 4.9 132.7Other comprehensive income that will be reclassified to the income statement –7.9 1.4 –0.9 –7.4 –0.0 –7.4Other comprehensive income that will not be reclassified to the income statement 0.0 0.0 0.0 0.0Comprehensive income 0.0 0.0 0.0 127.7 –7.9 1.4 –0.9 120.4 4.9 125.3
Dividend payment 3 –118.3 –118.3 –5.1 –123.4Purchase of treasury shares –34.8 –34.8 0.0 –34.8Sale of treasury shares 6.4 0.8 7.2 0.0 7.2Share-based compensation expense 20.0 20.0 0.0 20.0Allocations from share-based compensation 59.3 –33.5 25.8 0.0 25.8Change in minority interests 0.0 0.0 0.0 0.0 0.0 0.0Change in liability to purchase minority interests –5.7 –5.7 0.2 –5.5Other effects 0.0 0.0 0.0 0.0 0.0 0.0 0.0 0.0Ownership-related changes 0.0 30.9 –18.4 –118.3 0.0 0.0 0.0 –105.8 –4.9 –110.7Balance as of 30.06.2018 56.9 –48.7 –178.7 1,909.0 –10.6 –46.9 –2.1 1,678.8 0.0 1,678.8
1 “Unrealized income from debt instruments in financial investments”, “Currency translation adjustments” and “Cash flow hedges” are reported in the balance sheet item “Other components of shareholders' equity”.
2 In the financial year 2017, this item also included other comprehensive income from those equity securities and units in investment funds that were classified as “available-for-sale” under IAS 39.
3 Vontobel Holding AG paid a dividend (gross) of CHF 2.10 per registered share with a par value of CHF 1.00 in April 2018 (previous year CHF 2.00 consisting of an ordinary dividend of CHF 1.90 and a special dividend of CHF 0.10).

35Consolidated financial statements
Statement of equity
CHF MN SHARE CAPITAL TREASURY SHARES CAPITAL RESERVERETAINED
EARNINGS
UNREALIZED INCOME
FROM DEBT INSTRUMENTS IN FINANCIAL
INVESTMENTS 1,2
CURRENCY TRANSLATION
ADJUSTMENTS 1 CASH FLOW
HEDGES 1 SHAREHOLDERS’
EQUITYMINORITY
INTERESTS TOTAL EQUITYBalance as of 01.01.2017 56.9 –93.8 –157.8 1,754.5 4.6 –49.6 –0.7 1,514.1 0.0 1,514.1
Group net profit 98.7 98.7 2.8 101.5Other comprehensive income that will be reclassified to the income statement 0.1 –7.5 0.2 –7.2 –0.1 –7.3Other comprehensive income that will not be reclassified to the income statement 11.8 11.8 0.0 11.8Comprehensive income 0.0 0.0 0.0 110.5 0.1 –7.5 0.2 103.3 2.7 106.0
Dividend payment 2 –111.8 –111.8 –4.3 –116.1Purchase of treasury shares –38.3 –38.3 0.0 –38.3Sale of treasury shares 7.2 1.0 8.2 0.0 8.2Share-based compensation expense 18.9 18.9 0.0 18.9Allocations from share-based compensation 59.2 –33.8 25.4 0.0 25.4Change in minority interests 0.0 0.0 0.0 0.0 0.0 0.0Change in liability to purchase minority interests –4.1 –4.1 1.6 –2.5Other effects 0.0 0.0 0.0 0.0 0.0 0.0 0.0 0.0Ownership-related changes 0.0 28.1 –18.0 –111.8 0.0 0.0 0.0 –101.7 –2.7 –104.4Balance as of 30.06.2017 56.9 –65.7 –175.8 1,753.2 4.7 –57.1 –0.5 1,515.7 0.0 1,515.7
Balance as of 01.01.2018 56.9 –79.6 –160.3 1,854.7 –1.6 –48.4 –1.2 1,620.5 0.0 1,620.5Impact of changes to the accounting principles 44.8 –1.1 43.7 43.7Balance as of 01.01.2018 after adjustments 56.9 –79.6 –160.3 1,899.5 –2.7 –48.4 –1.2 1,664.2 0.0 1,664.2
Group net profit 127.7 127.7 4.9 132.7Other comprehensive income that will be reclassified to the income statement –7.9 1.4 –0.9 –7.4 –0.0 –7.4Other comprehensive income that will not be reclassified to the income statement 0.0 0.0 0.0 0.0Comprehensive income 0.0 0.0 0.0 127.7 –7.9 1.4 –0.9 120.4 4.9 125.3
Dividend payment 3 –118.3 –118.3 –5.1 –123.4Purchase of treasury shares –34.8 –34.8 0.0 –34.8Sale of treasury shares 6.4 0.8 7.2 0.0 7.2Share-based compensation expense 20.0 20.0 0.0 20.0Allocations from share-based compensation 59.3 –33.5 25.8 0.0 25.8Change in minority interests 0.0 0.0 0.0 0.0 0.0 0.0Change in liability to purchase minority interests –5.7 –5.7 0.2 –5.5Other effects 0.0 0.0 0.0 0.0 0.0 0.0 0.0 0.0Ownership-related changes 0.0 30.9 –18.4 –118.3 0.0 0.0 0.0 –105.8 –4.9 –110.7Balance as of 30.06.2018 56.9 –48.7 –178.7 1,909.0 –10.6 –46.9 –2.1 1,678.8 0.0 1,678.8
1 “Unrealized income from debt instruments in financial investments”, “Currency translation adjustments” and “Cash flow hedges” are reported in the balance sheet item “Other components of shareholders' equity”.
2 In the financial year 2017, this item also included other comprehensive income from those equity securities and units in investment funds that were classified as “available-for-sale” under IAS 39.
3 Vontobel Holding AG paid a dividend (gross) of CHF 2.10 per registered share with a par value of CHF 1.00 in April 2018 (previous year CHF 2.00 consisting of an ordinary dividend of CHF 1.90 and a special dividend of CHF 0.10).
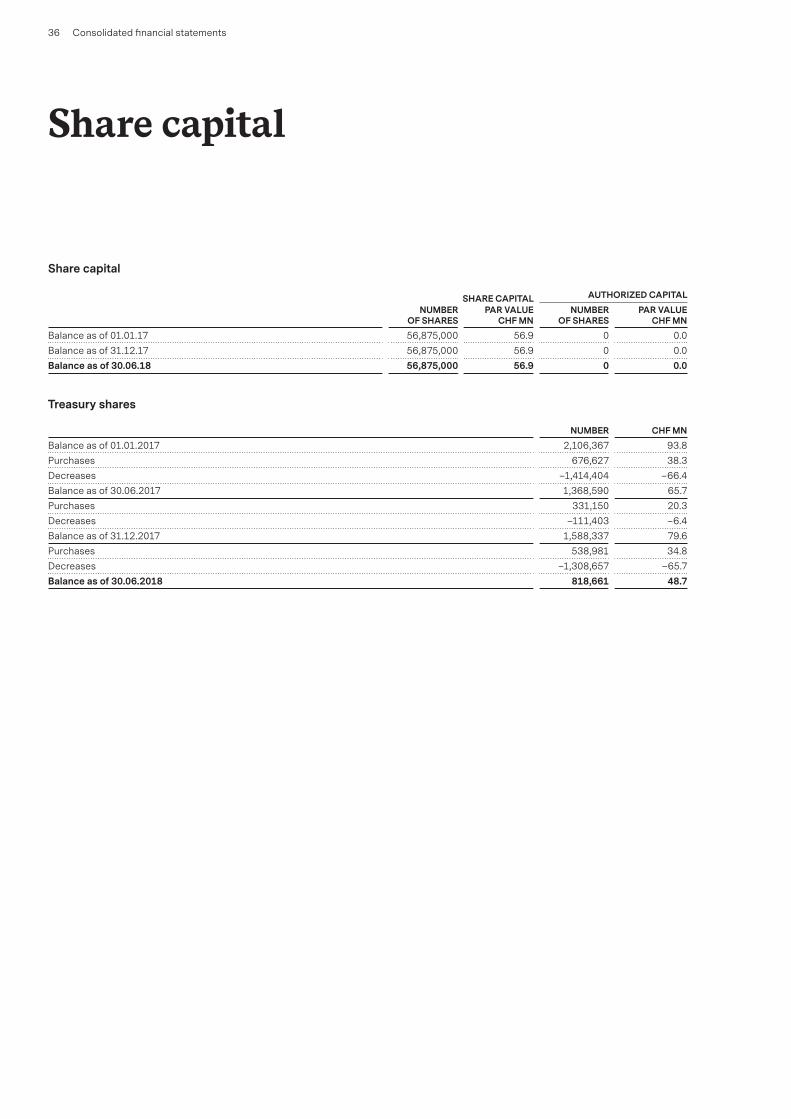
36 Consolidated financial statements
Share capital
SHARE CAPITAL AUTHORIZED CAPITALNUMBER PAR VALUE NUMBER PAR VALUE
OF SHARES CHF MN OF SHARES CHF MNBalance as of 01.01.17 56,875,000 56.9 0 0.0Balance as of 31.12.17 56,875,000 56.9 0 0.0Balance as of 30.06.18 56,875,000 56.9 0 0.0
Treasury shares
NUMBER CHF MNBalance as of 01.01.2017 2,106,367 93.8Purchases 676,627 38.3Decreases –1,414,404 –66.4Balance as of 30.06.2017 1,368,590 65.7Purchases 331,150 20.3Decreases –111,403 –6.4Balance as of 31.12.2017 1,588,337 79.6Purchases 538,981 34.8Decreases –1,308,657 –65.7Balance as of 30.06.2018 818,661 48.7
Share capital

37Consolidated financial statements
Consolidated cash flow statement
CHF MN (6 MONTHS) 30.06.2018 30.06.2017Cash flow from operating activitiesGroup net profit (incl. minorities) 132.7 101.5Reconciliation to net cash flow from operating activitiesNon-cash positions in Group results:Depreciation and valuation adjustments of property, equipment and intangible assets 32.1 29.7Credit loss expense / (recovery) 0.2 0.0Income from investments in associates 0.4 0.1Deferred income taxes 6.1 2.5Change in provisions –14.1 0.9Net income from investing activities 3.5 0.4Other non-cash income 12.4 18.3Net (increase) / decrease in assets relating to banking activities:Due from / to banks, net –622.4 –295.5Cash collateral for securities borrowing and reverse-repurchase agreements 19.8 –110.3Trading positions and replacement values, net 619.5 –376.3Other financial assets / liabilities at fair value, net –35.1 172.0Loans / due to customers, net –960.6 256.2Other assets –486.3 –482.3Net increase / (decrease) in liabilities relating to banking activities:Cash collateral from securities lending and repurchase agreements 74.5 0.0Other liabilities 502.7 590.0Taxes paid –22.0 –30.8Cash flow from operating activities –736.8 –123.6
Cash flow from investing activitiesInvestments in subsidiaries and associates 0.0 –28.7Disposal of subsidiaries and associates 21.9 0.0Purchase of property, equipment and intangible assets –23.0 –21.8Disposal of property, equipment and intangible assets 0.0 0.0Investment in financial instruments –342.7 –234.5Divestment of financial instruments 280.9 352.7Cash flow from investing activities –62.9 67.7
Cash flow from financing activitiesNet movements in treasury shares –27.6 –30.1Dividends paid –123.4 –116.1Issued debt instruments 447.4 0.0Cash flow from financing activities 296.3 –146.2
Effects of exchange rate differences –1.8 –0.1Net increase / (decrease) in cash and cash equivalents –505.1 –202.2Cash and cash equivalents, beginning of the year 7,918.9 7,787.0Impact of changes to the accounting principles –0.4Cash and cash equivalents at the balance sheet date 7,413.4 7,584.8
Consolidated cash flow statement

38 Consolidated financial statements
Consolidated cash flow statement
CHF MN (6 MONTHS) 30.06.2018 30.06.2017Cash and cash equivalents comprise at the balance sheet dateCash 6,441.3 6,536.3Due from banks on demand 972.1 1,048.5Total 7,413.4 7,584.8
Further information:Dividends received 38.0 44.6Interest received 70.7 73.7Interest paid 7.7 8.4

39Notes to the consolidated financial statements
1. Basis of presentation
Vontobel’s consolidated financial statements have been prepared in accordance with the International Financial Reporting Standards (IFRS), which are published by the International Accounting Standards Board (IASB). This half-year report meets the requirements set out in IAS 34 – Interim Financial Reporting. Since it does not contain all of the information and disclosures required in the Annual Report, this interim report should be read in conjunction with the audited consolidated financial statements in the Annual Report 2017. With the exception of the following changes, the accounting principles applied in this report are the same as in the consolidated financial statements dated December 31, 2017.
2. Changes in financial reporting
2.1 Changes in accounting principles2.1.1 Standards and interpretations that have been implemented The following new or revised standards and interpreta-tions were applied by Vontobel for the first time in the financial year 2018:
IFRS 9 – Financial InstrumentsThe IASB published IFRS 9 in July 2014. The new standard replaces IAS 39 and contains guidelines on the classifica-tion and measurement of financial assets and financial lia-bilities, the identification of impairment of financial assets, and hedge accounting. It is to be applied for the first time from January 1, 2018. In October 2017, the IASB published an amendment to IFRS 9 regarding prepayment features with negative compensation, which is to be applied for the first time from January 1, 2019. Early adoption is permit-ted.
The classification and measurement of financial assets is based on the contractual cash flows from financial instru-ments and on the business model in which the instruments are held. In the case of debt instruments, the following cat-egories exist:
– Recognition at amortized cost using the effective interest method;
– Recognition at fair value, with changes in fair value being recognized in other comprehensive income and transferred to profit or loss when the instrument is sold;
– Recognition at fair value, with changes in fair value being recognized in profit or loss.
In the event of an accounting mismatch, the fair value option can be applied for a debt instrument that would fall within one of the first two categories.
All equity instruments are measured at fair value. This also applies to unquoted equity instruments that were usually recognized at cost less impairment under IAS 39. Changes in fair value are generally recognized through profit or loss. If an equity instrument is not held for trading purposes, it can be irrevocably classified at initial recognition as an instrument that is measured at fair value. However, with the exception of dividends, all of its income components are recognized in other comprehensive income and are not transferred to profit or loss under any circumstances.
IFRS 9 incorporates the rules on the classification and measurement of financial liabilities set out in IAS 39. A new feature in IFRS 9 is, however, that the impact of the change in own credit risk of financial liabilities, for which the fair value option is applied, is now recorded in other compre-hensive income. If this treatment would create or enlarge an accounting mismatch in profit or loss, the impact of the change in own credit risk should, however, continue to be recorded in profit or loss.
It is primarily financial assets that are measured at amor-tized cost or whose changes in fair value are recognized in other comprehensive income that fall within the scope of application of the new impairment model. At initial recog-nition of these instruments, the present value of expected credit losses resulting from possible default events within the next 12 months are recognized through profit or loss. If there has been a significant increase in credit risk since the initial recognition of the financial asset, the present value of lifetime expected credit losses is recorded through profit or loss.
The new general model for hedge accounting enables companies to better reflect their risk management activi-ties in their financial statements since it provides more options to apply hedge accounting and allows flexibility in how an economic relationship between the hedged item and the hedging instrument is shown.
Accounting principles

40 Notes to the consolidated financial statements
When applying IFRS 9 for the first time (including the amendment regarding prepayment features with negative compensation), Vontobel did not adjust the figures for the prior year and recognized the cumulative impact of the first-time application of IFRS 9 in the opening balance sheet as of January 1, 2018, in accordance with the transi-tional provisions. The impacts on the consolidated finan-cial statements are shown on pages 42 to 47.
IFRS 15 – Revenue from Contracts with CustomersThe new standard provides a five-step model for the rec-ognition of revenue that should, in principle, be applied to all customer contracts. The model comprises the following steps:
– Identify the contract with the customer; – Identify distinct performance obligations in the
contract; – Determine the transaction price; – Allocate the transaction price to the performance
obligations in the contract; – Recognize revenue when the performance obligations
are satisfied.
IFRS 15 contains new guidelines on whether revenue should be recognized at a certain point in time or over time. For cases involving variable consideration, a new rec-ognition threshold was introduced, according to which variable amounts are only included in revenue if it is highly probable that a significant revenue reversal will not occur in the future as a result of re-estimation.
The new standard provides detailed guidance on various issues, such as identifying distinct performance obliga-tions and accounting for contract modifications. The standard also introduces new guidance on the costs of fulfilling and obtaining a contract, as well as specifying the circumstances in which such costs should be capitalized. The new standard includes significantly increased require-ments for the disclosure of revenue in the financial state-ments.
The application of IFRS 15 did not have any impact on Vontobel’s balance sheet and income statement as of Jan-uary 1, 2018, or in the first half of 2018. In the segment reporting, net fee and commission income is now reported separately for the individual segments to enable reconcili-ation with the corresponding item in the income state-ment. Figures for the previous year have been adapted in line with this increased disclosure. The disclosure relating to commission and fee income is provided in note 2.
IAS 19 – Plan Amendment, Curtailment or SettlementIn February 2018, the IASB published amendments to IAS 19, which concern the recognition of plan amendments, curtailments or settlements during the reporting period. The amendments state that if this type of event occurs, companies must determine the current service cost and net interest for the remainder of the reporting period using current actuarial assumptions. In addition, the amend-ments clarify the effect of a plan amendment, curtailment or settlement on the requirements regarding the asset ceiling. The amendments apply prospectively to plan amendments, curtailments or settlements occurring on or after January 1, 2019. Early application is permitted. At Vontobel, the new IAS 19 provisions have been applied early to changes in the regulations of pension funds in Switzerland (see note 5 “Personnel expense”). In the first half of 2018, this resulted in a reduction in personnel expense and in the income from defined benefit pension plans recognized in other comprehensive income, each in the amount of CHF 0.2 mn (before taxes). The early appli-cation of the new provisions had no impact on consoli-dated shareholders’ equity as of June 30, 2018.

41Notes to the consolidated financial statements
Other new standards and interpretationsThe following new or revised standards and interpreta-tions did not have any significant impacts on Vontobel when applied for the first time or were not relevant for Vontobel:
– IAS 40 – Transfers of Investment Properties; – IFRS 2 – Classification and Measurement of Share-
based Payment Transactions; – IFRS 4 – Applying IFRS 9 “Financial Instruments” with
IFRS 4 “Insurance Contracts”; – IFRIC 22 – Foreign Currency Transactions and
Advance Consideration; – Annual Improvements 2014–2016 (with first-time
application from January 1, 2018).
2.1.2 Other changesImpairment losses on financial investments and loans, and reversals of impairment losses, were previously recog-nized in the income statement in the items “Other income” or “Valuation adjustments, provisions and losses” (now “Provisions and losses”). Due to the adoption of IFRS 9, all changes in expected credit losses under the impairment model are now recognized in the item “credit loss (ex–pense) / recovery” as a component of net interest income.
For the purpose of comparisons: In the income statement and segment reporting for the financial year 2017, CHF 0.2 mn (1H17: CHF 0.0 mn, 2H17: CHF 0.2 mn) was reclassified from the income statement item “Provisions and losses” to the item “credit loss (expense) / recovery”. This reclassifi-cation has no impact on net profit and consolidated share-holders’ equity for the prior year.
2.2 Changes in estimatesNo material changes in estimates.
42 Notes to the consolidated financial statements
IFRS 9 accounting principles
Initial recognitionPurchases and disposals of financial assets are recog-nized in the balance sheet at the trade date. At the time of initial recognition, financial assets or financial liabilities are classified according to IFRS 9 criteria, assigned to the rel-evant category and measured at the fair value of the con-sideration paid or received, including directly attributable transaction costs. In the case of trading portfolio assets and liabilities and other financial instruments at fair value (“Fair value through profit and loss”), the transaction costs are immediately recognized through profit or loss.
Measuring fair value, fair value hierarchy and recognition of “day 1 profit” For information on the measurement of fair value of finan-cial instruments, the valuation techniques used, the fair value hierarchy and day 1 profit, please refer to note 11 “Fair value of financial instruments”.
Trading portfolio assets and trading portfolio liabilities (“fair value through profit or loss”) Financial assets or financial liabilities held for trading pur-poses are recognized at fair value in “Trading portfolio assets” or “Trading portfolio liabilities”. All income compo-nents are recognized in “Trading income”.
Derivative financial instruments (“fair value through profit or loss”) and hedge accountingDerivative instruments are recognized as positive and negative replacement values at fair value. Provided no hedge accounting is applied for the relevant derivatives, all income components are recognized in “Trading income”.
Other financial assets at fair value (“fair value through profit or loss”)This balance sheet item contains financial assets that are not held for trading purposes but fall within the category “fair value through profit or loss” due to IFRS 9 criteria. An exception are those equity securities that Vontobel assigned to the category “financial investments” at initial recognition. They are treated the same way in the income statement as trading portfolio assets.
Other financial liabilities at fair value (“fair value through profit or loss”)This balance sheet item contains issued structured prod-ucts for which the fair value option is applied. They are managed, measured and reported to the Board of Direc-tors and the Executive Board on a fair value basis accord-ing to a documented strategy. They are treated the same way in the income statement as trading portfolio liabilities
(information on the treatment of the impact of changes in own credit risk is provided in Note 3 “Trading income”). Income from issued structured products is therefore treated in the same way as income from the corresponding hedging positions.
Financial investments (“fair value through other comprehensive income”)This balance sheet item contains long-term equity invest-ments (e.g. investments in infrastructure companies) on the one hand, and on the other hand debt instruments held within a business model whose objective is both selling debt instruments and collecting contractual cash flows that are solely payments of principal and interest on the principal amount outstanding. The financial investments are recognized at fair value.
In the case of equity investements, dividends are recog-nized in net interest income and all other income compo-nents are recognized in other comprehensive income. Realized income is not transferred to profit or loss.
In the case of debt instruments, changes in fair value are recognized in other comprehensive income. The change in expected credit losses is shown in “Net interest income”, and the reverse entry is recognized in other comprehen-sive income. If a debt instrument is sold, expected credit losses and cumulative changes in fair value are transferred from other comprehensive income to the items “Net inter-est income” and “Other income”. Interest is accrued in the period in which it is earned using the effective interest method and recognized in “Net interest income”. For fur-ther information on expected credit losses, see the sec-tion “Impairment model”.
Cash, due from banks, cash collateral for securities borrowing agreements, cash collateral for reverse-repurchase agreements and loans (“amortized cost”)These positions are held to collect contractual cash flows, that are solely payments of principal and interest on the principal amount outstanding. The cash holdings in the balance sheet item “Cash” are recognized at nominal value and other positions are recognized at amortized cost less expected credit losses. Securities received in the context of securities borrowing agreements or reverse-repurchase agreements are not recognized in the balance sheet, since the risks and rewards of ownership are not transferred to Vontobel.
The change in expected credit losses is shown in “Net interest income”. Interest on positions that are not past due is accrued in the period in which it is earned using the
Changes due to IFRS 9

43Notes to the consolidated financial statements
effective interest method and recognized in “Net interest income”. Negative interest is shown as interest expense.
For further information on expected credit losses, see the section “Impairment model”.
Due to banks, cash collateral from securities lending agreements, cash collateral from repurchase agreements, due to customers and debt issued (“amortized cost”)These positions are recognized at amortized cost. Interest is accrued in the period in which it is incurred using the effective interest method and recognized in “Net interest income”. Negative interest is shown as interest income. Securities that are transferred in the context of securities lending and repurchase agreements are not derecognized since the risks and rewards resulting from ownership are not transferred. Additional Tier 1 bond positions held due to market making activities are classed as repaid and are offset in the balance sheet item “Debt issued”.
Impairment modelAt Vontobel, it is mainly financial assets recognized at amortized cost, debt instruments in financial investments and credit risks from off-balance-sheet items that are sub-ject to the IFRS 9 impairment model. Vontobel applies the impairment model individually for all relevant financial instruments.
At Vontobel, a financial instrument is assigned to stage 1 of the impairment model at the time of initial recognition. Vontobel has elected under IFRS 9 to continue to allocate all financial instruments with an internal or external rating of at least “investment grade” to stage 1 after initial recog-nition. At Vontobel, this applies to the vast majority of financial instruments. If a financial instrument displays a significantly increased credit risk (risk of default) com-pared to the time of initial recognition and if any (internal or external) rating no longer corresponds to at least “invest-ment grade”, it is transferred to stage 2. The main indica-tors of a significant increase in credit risk are: a missed payment and a material deterioration in the rating, credit risk-related market data (e.g. increase in the risk premium) or borrower-related (idiosyncratic) factors. If a payment is more than 30 days past due, a financial instrument is, in principle, always transferred to stage 2. If there is objective evidence of impairment, the financial instrument is trans-ferred to stage 3. Objective evidence of impairment includes missed payments, substantial financial difficul-ties on the part of the borrower, a material reduction in the market price of a debt instrument due to borrower-spe-cific factors, and a material reduction in the value of the collateral received.
The financial investments held by Vontobel generally con-sist solely of liquid debt instruments from high-quality bor-rowers that have been assigned an external rating in the high “investment grade” range by a recognized rating agency. The creditworthiness of the borrowers is moni-tored continuously based on changes in external ratings, market factors as well as internal assessments. If a debt instrument no longer meets the internal rules governing creditworthiness, it is generally sold within a very short period of time. In exceptional cases where the instrument is not sold, checks are carried out at the next balance sheet date to determine whether there has been a signifi-cant increase in the credit risk or whether there is objec-tive evidence of impairment. Since the debt instruments are highly liquid, the market price is a reliable indicator of the financial position of a borrower. In the event of a signif-icant decrease in market price due to company-specific factors, the debt instrument is classed as impaired.
The secured loans provided to investment clients (“lom-bard lending”) and exposures to professional counterpar-ties – with the exception of the financial investments described above – are generally only entered into on a secured basis, with securities serving as easily realizable collateral. Further information about the daily procedures to ensure that adequate collateral is in place and the meth-ods and processes used to carefully manage counterparty risks resulting from unsecured exposures is provided in the Annual Report 2017 in chapter 5 of the notes on risk management and risk control. The daily management and control of counterparty risks minimizes the probability that a stage 1 exposure will have to be transferred to stages 2 or 3.
The expected credit losses in stage 1 of the impairment model correspond to the present value of expected credit losses resulting from possible default events within 12 months of the balance sheet date (“12-month losses”). The expected credit losses in stages 2 and 3 correspond to the present value of all expected credit losses over the remaining lifetime of the financial instrument (“lifetime expected credit losses”). The change in expected credit losses is recognized in “Net interest income”.
The expected credit losses on financial instruments with an external or comparable internal rating in stages 1 and 2 are calculated by multiplying the exposure at default (EAD) with the probability of default (PD) and the loss given default (LGD). The interest rate effect is considered if material. The probabilities of default are generally deter-mined using the rating transition matrixes of rating agen-cies or internal ratings, and the loss given default is deter-mined based on market observations. The forecasts of
44 Notes to the consolidated financial statements
future events that are incorporated into the calculation of expected credit losses are based, among other things, on market observations and market estimates, early warning signals, and industry and segment analysis. The value of collateral is taken into account when calculating expected credit losses. For this reason, lombard loans in particular – which account for by far the largest proportion of the balance sheet item “Loans” – and cash collateral for reverse-repurchase agreements in stages 1 and 2 gener-ally only entail minimal expected credit losses.
The expected credit losses of financial instruments in stage 3 are calculated after taking account of collateral valued at the liquidation value using an individual assess-ment of the unsecured portion of the loan. They are gener-ally derecognized at the point in time when a legal title confirms the conclusion of the realization proceedings.
Balance sheet adjustments
Following the adoption of IFRS 9, the following changes were made to the opening balance sheet as of January 1, 2018, compared to the balance sheet as of December 31, 2017, under IAS 39:

45Notes to the consolidated financial statements
Assets
IFRS 9 IAS 39 ADJUSTMENTS DUE TO IFRS 9 IFRS 9AND IAS 39
MEASUREMENT 31.12.2017RECLASSIFI-
CATIONSREMEASURE-
MENTSCREDIT LOSSES 01.01.2018
CATEGORY CHF MN CHF MN CHF MN CHF MN CHF MNCash 1 6,287.9 6,287.9Due from banks 1 1,658.7 –0.4 1,658.3Cash collateral for securities borrowing agreements 1 8.5 8.5Cash collateral for reverse-repurchase agreements 1 1,007.2 1,007.2Trading portfolio assets 2 3,991.2 3,991.2Positive replacement values 2 243.9 243.9Other financial assets at fair value 2 3,490.9 3.1 3,494.0Debt instruments 3,419.7 3,419.7Equity instruments 0.0 2.2 2.2Units in investment funds 47.5 0.9 48.4Structured products 23.7 23.7Loans 1 3,310.5 –0.3 3,310.2Financial investments 3 1,788.9 –3.1 56.8 0.0 1,842.6Debt instruments 1,773.0 1,773.0Equity instruments 15.0 –2.2 56.8 69.6Units in investment funds 0.9 –0.9 0.0Investments in associates n / a 0.9 0.9Property and equipment n / a 159.7 159.7Goodwill and other intangible assets n / a 291.1 291.1Other assets 1, 2 664.3 0.2 664.5Total assets 22,903.7 0.0 56.8 –0.5 22,960.0
1 = amortized cost2 = fair value through profit or loss3 = fair value through other comprehensive income

46 Notes to the consolidated financial statements
Liabilities and equity
IFRS 9 IAS 39 ADJUSTMENTS DUE TO IFRS 9 IFRS 9AND IAS 39
MEASUREMENT 31.12.2017RECLASSIFI-
CATIONSREMEASURE-
MENTS CREDIT LOSSES 01.01.2018CATEGORY CHF MN CHF MN CHF MN CHF MN CHF MN
Due to banks 1 1,221.3 1,221.3Trading portfolio liabilities 2 158.2 158.2Negative replacement values 2 725.6 725.6Other financial liabilities at fair value 2 8,451.3 8,451.3Due to customers 1 9,758.2 9,758.2Provisions n / a 40.6 0.1 40.7Other liabilities 1, 2 928.0 12.5 940.5Total liabilities 21,283.2 0.0 12.5 0.1 21,295.8
Share capital n / a 56.9 56.9Treasury shares n / a –79.6 –79.6Capital reserve n / a –160.3 –160.3Retained earnings n / a 1,854.7 1.4 44.3 –0.9 1,899.5Unrealized income on financial investments* n / a –1.6 –1.4 0.3 –2.7Currency translation adjustments n / a –48.4 –48.4Cash flow hedges n / a –1.2 –1.2Minority interests n / a 0.0 0.0Total equity 1,620.5 0.0 44.3 –0.6 1,664.2
Total liabilities and equity 22,903.7 0.0 56.8 –0.5 22,960.0
* Under IFRS 9: “Unrealized income from debt instruments in financial investments”1 = amortized cost2 = fair value through profit or loss
Reclassifications due to IFRS 9
With the adoption of IFRS 9, essentially all of the equity securities and units in investment funds that were recog-nized in the balance sheet item “Financial investments” under IAS 39 now fall within the category “Fair value through profit or loss”, which is why they are now shown in the balance sheet item “Other financial assets at fair value”. For long-term equity investments (e.g. in infrastruc-ture companies), Vontobel has elected to recognize them in the category “Fair value through other comprehensive income”, which is why they continue to be shown in the balance sheet item “Financial investments” under IFRS 9. When financial assets are sold, only the unrealized income from debt instruments is transferred to profit or loss under IFRS 9. They therefore remain in the equity component “Unrealized income from debt instruments in financial investments”, while unrealized income from equity securi-ties and investment funds is transferred to “retained earn-ings”.
Under IAS 39, the fair value option was applied to financial instruments in the balance sheet item “Other financial assets at fair value”. Under IFRS 9, the applicable require-ments are no longer met. Based on categorization criteria, however, the relevant financial instruments continue to fall within the category “Fair value through profit or loss” under IFRS 9. This means there are no changes to the rec-ognition, measurement and disclosure of these financial instruments.
Vontobel will continue to record the impact of the change in own credit risk in profit or loss (see note 3, “Trading income”) due to an accounting mismatch. Consequently, there are no changes relating to this point.

47Notes to the consolidated financial statements
Remeasurements due to IFRS 9
Under IAS 39, unquoted equity securities were generally recognized at cost less impairment. With the adoption of IFRS 9, this special provision no longer applies. As a result, the fair value of the corresponding items is now estimated based on a proportionate share of the net asset value, tak-ing account of further measurement-relevant factors. The increase in deferred tax liabilities due to remeasurements is recognized in other liabilities.
Expected credit losses due to IFRS 9
With the adoption of IFRS 9, expected credit losses for financial instruments that fall under the new impairment model were calculated. The following table shows the expected credit losses for balance sheet items recognized at amortized cost, financial investments and off-balance-sheet items as of January 1, 2018.
STAGE 1 STAGE 2 STAGE 3 TOTALCHF MN CHF MN CHF MN CHF MN
Cash 0.0 0.0 0.0 0.0Due from banks 0.2 0.2 0.0 0.4Cash collateral for securities borrowing agreements 0.0 0.0 0.0 0.0Cash collateral for reverse-repurchase agreements 0.0 0.0 0.0 0.0Loans 0.3 0.0 18.5 18.8Financial investments (debt instruments) 0.4 0.0 0.0 0.4Other assets 0.0 0.0 0.0 0.0Off-balance sheet positions 0.1 0.0 0.0 0.1Total 1.0 0.2 18.5 19.7
Expected credit losses as of January 1, 2018, in stage 3 correspond to specific allowances for credit losses as of December 31, 2017, which is why no corresponding adjustment was necessary. Expected credit losses as of January 1, 2018, in stages 1 and 2 were charged to retained earnings, since there were no corresponding allowances for credit losses or provisions as of December 31, 2017. They led to a reduction in the carrying amount of the rele-vant balance sheet items. Debt instruments in financial investments, for which the expected credit losses as of
January 1, 2018, led to an increase in the equity compo-nent “Unrealized income from debt instruments in finan-cial investments”, are an exception. The expected credit losses on off-balance-sheet items were recognized in provisions. The increase in deferred tax assets due to expected credit losses is recognized in other assets. The deferred tax effect on expected credit losses of financial investments was recognized in the equity component “Unrealized income from debt instruments in financial investments.”

48 Notes to the consolidated financial statements
1 Net interest income
30.06.2018 30.06.2017 31.12.2017 CHANGE TO 30.06.2017(6 MONTHS) CHF MN CHF MN CHF MN CHF MN IN %Interest income from banks and customers 23.9 17.8 21.3 6.1 34Interest income from securities borrowing and reverse-repurchase agreements 1.4 3.1 4.0 –1.7 –55Interest income from financial liabilities 2.7 2.3 2.2 0.4 17Total interest income from financial instruments at amortized cost 28.0 23.2 27.5 4.8 21Dividend income from equity instruments in financial investments 3.4 3.4 0.2 0.0 0Interest income from debt instruments in financial investments 14.1 14.4 14.2 –0.3 –2Total interest and dividend income from financial assets at fair value 17.5 17.8 14.4 –0.3 –2Total interest income 45.5 41.0 41.9 4.5 11Interest expense from securities lending and repurchase agreements 1.3 1.0 1.0 0.3 30Interest expense from other financial liabilities at amortized cost 2.7 2.0 3.3 0.7 35Interest expense from financial assets 4.1 3.3 3.6 0.8 24Total interest expense from financial instruments at amortized cost 8.1 6.3 7.9 1.8 29Credit loss (expense) / recovery on debt instruments in financial investments 0.0 0.0 0.0 0.0Other credit loss (expense) / recovery –0.2 0.0 –0.2 –0.2Total credit loss (expense) / recovery –0.2 0.0 –0.2 –0.2Total 37.2 34.7 33.8 2.5 7
Details on consolidated income statement

49Notes to the consolidated financial statements
2 Net fee and commission income
30.06.2018 30.06.2017 31.12.2017 CHANGE TO 30.06.2017(6 MONTHS) CHF MN CHF MN CHF MN CHF MN IN %Brokerage fees 52.4 59.4 52.4 –7.0 –12Custody fees 93.8 77.5 87.3 16.3 21Advisory and management fees 323.7 268.1 307.0 55.6 21Corporate finance 8.4 9.9 3.6 –1.5 –15Other commission income from securities and investment transactions 19.1 15.4 15.8 3.7 24Total fee and commission income from securities and investment trans-actions 497.4 430.3 466.1 67.1 16Other fee and commission income 4.3 2.9 3.2 1.4 48Brokerage fees 14.0 9.8 9.4 4.2 43Other commission expense 109.2 89.8 100.6 19.4 22Total commission expense 123.2 99.6 110.0 23.6 24Total 378.5 333.6 359.3 44.9 13
Vontobel offers its clients a broad range of services that represent its main earnings stream. Fee and commission income can be divided into two categories: Fees for ser-vices provided over time (e.g. portfolio management and investment advisory in the fund business and Wealth Man-agement), which constitute by far the largest portion of Vontobel’s fee and commission income, and fees for ser-vices provided at a point in time (e.g. brokerage fees).
Fees for services provided over time are generally recorded as a percentage of the average amount of relevant assets under management during the period when the service is rendered and recognized in profit or loss on a proportion-ate basis over the relevant period. They are invoiced to the client (e.g. private clients or investment funds) at least quarterly and charged to the relevant client assets. In the case of some services, additional performance-based fees may be incurred (e.g. performance fees in the funds business). They are recognized in profit or loss when it is highly probable that they will be collected, which is gener-ally only the case once all performance criteria have been met. The measurement period for performance fees is usually a maximum of one year.
Fees for services provided at a point in time are generally determined as a percentage of the corresponding trans-action volume. They are invoiced to the client after the ser-vice has been rendered and charged to the corresponding client assets. At the same time, they are recognized in profit or loss.
Based on the nature of Vontobel’s commission business, as described above, the related claims, accruals and deferrals at the balance sheet date, and the corresponding impairment loss, are generally immaterial. The deferred commission income as at the balance sheet date is generally recognized in profit or loss in the following period. Subsequent changes to income are immaterial in Vontobel’s fee and commission business.

50 Notes to the consolidated financial statements
3 Trading income
30.06.2018 30.06.2017 31.12.2017 CHANGE TO 30.06.2017(6 MONTHS) CHF MN CHF MN CHF MN CHF MN IN %Securities –293.3 353.9 535.3 –647.2Other financial instruments at fair value 440.7 –220.8 –406.5 661.5Forex and precious metals 18.9 10.4 16.5 8.5 82Total 166.3 143.5 145.3 22.8 16
Trading income as of 30.06.2018 includes income of CHF 6.2 mn (6 months ending 30.06.2017: CHF 1.9 mn; 6 months ending 31.12.2017: CHF 0.6 mn), which is attributable to changes in fair value due to a change in Vontobel’s own credit risk. Of the total impact, CHF –0.1 mn was realized as of 30.06.2018 (6 months ending 30.06.2017: CHF –0.6 mn; 6 months ending 31.12.2017: CHF –0.2 mn), while the remaining CHF 6.3 mn (6 months ending 30.06.2017: CHF 2.5 mn; 6 months ending 31.12.2017: CHF 0.8 mn) comprises unrealized income. The changes in own credit risk resulted in cumulative income of CHF 9.5 mn, of which CHF 3.8 mn was realized and CHF 5.7 mn was unrealized. Cumulative unrealized income is shown in the balance sheet item “Other financial liabilities at fair value” and will be completely reversed over the term of the relevant instruments provided they are not redeemed or repurchased prior to their contractual maturity.
To determine unrealized income due to a change in own credit risk, the first step is the calculation of the risk pre-mium of the instrument at the balance sheet date. This is the difference between the fair value of the instrument at the balance sheet date and the value that would result without taking account of own credit risk at the balance sheet date. In a second step, the risk premium of the instrument at the time of issue is determined and reduced in relation to the period between the balance sheet date and the time of issue on the one hand, and the total lifetime of the instrument on the other hand (“adjusted risk pre-mium at the time of issue”). In a third step, cumulative unrealized income is calculated as the difference between the risk premium at the balance sheet date and the adjusted risk premium at the time of issue. The unrealized income for the period is the result of the change in cumu-lative unrealized income during the corresponding period. The realized income due to the change in own credit risk is essentially calculated in the same way and is the result of the difference between the risk premium at the time of redemption of the product and the adjusted risk premium at the time of issue.
Under IFRS 9, the impact of the change in own credit risk of financial liabilities, for which the fair value option is applied, is generally recorded in other comprehensive income. However, if this treatment would create or enlarge an accounting mismatch in profit or loss, the correspond-ing impact should be recorded in profit or loss. At Vontobel, the fair value option is applied exclusively to issued struc-tured products. They essentially consist of an interest component and an option component. The risks from the interest component are hedged with a portfolio of bonds, interest rate swaps and credit default swaps. The risks
from the option component are hedged with a portfolio of derivatives and the corresponding underlyings. The struc-tured products in the balance sheet item “Other liabilities at fair value” and the corresponding hedging transactions are managed at portfolio level to achieve the highest pos-sible hedge and consequently the lowest possible fluctua-tions in value at portfolio level. Market risks in the form of general interest rate risks, currency risks and option risks are subject to low sensitivity and volume limits, resulting in low Value-at-Risk and stress exposure figures. In terms of fluctuations in value due to changes in credit risk premi-ums, there is a close economic relationship between the assets and liabilities sides in two respects. On the one hand, the Vontobel credit risk premiums included in the structured products (liabilities side) and the issuer’s credit risk premiums contained in the hedging positions (assets side) are subject to general market movements (increase or decrease in credit risk premiums). On the other hand, in view of the significant importance of the issuing business for Vontobel, the credit risk premiums on hedging posi-tions observable in the market have an impact on Vontobel’s credit risk premium. As of June 30, 2018, the balance sheet item “Other financial liabilities at fair value” corresponded to 38 % of the Vontobel Group’s total assets and 546 % of shareholders’ equity. To assess whether the impact of the change in own credit risk (“impact on the liabilities side”) should be recognized in profit or loss or in other comprehensive income, Vontobel has, for the period 2008 to 2017, compared the income from changes in credit risk premiums on the assets side (“impact on the assets side”) with the income from changes in credit risk premiums from the entire issuing business (“net impact” as the total from the impact on the assets side and the impact on the liabilities side). The (absolute) net impact

51Notes to the consolidated financial statements
over this period – particularly in times of increased volatil-ity of the credit risk premiums – is significantly lower than the (absolute) impact on the assets side. This means that the impact on the liabilities side has a compensating effect on the impact on the assets side. In addition, the net impact is significantly less volatile than the impact on the assets side. If the impact of a change in own credit risk was recognized in other comprehensive income, net profit over this period would also have been much more volatile.
For this reason, Vontobel has concluded that it is appropri-ate to recognize the impact of the change in own credit risk in profit or loss. As a result, income from structured products is recognized fully in profit or loss and is thus treated in the same way as the corresponding hedging positions. The treatment of the impact of the change in own credit risk of these liabilities reflects a material judge-ment.
4 Other income 30.06.2018 30.06.2017 31.12.2017 CHANGE TO 30.06.2017
(6 MONTHS) CHF MN CHF MN CHF MN CHF MN IN %Real estate income 0.0 0.0 0.0 0.0Income from the sale of property and equipment 0.0 0.0 0.0 0.0Income from the sale of debt instruments in financial investments 1 –0.1 3.5 2.5 –3.6Impairments of financial investments 2 0.0 –0.1 0.0Income from investments in associates 0.4 0.2 0.5 0.2 100Other income 1.0 2.0 1.3 –1.0 –50Total 1.3 5.7 4.2 –4.4 –77
1 In the financial year 2017, this item included income from the sale of equity securities and units in investment funds that were classified as “available-for-sale” under IAS 39.
2 In the financial year 2017, this item included impairment losses and reversals on equity securities and units in investment funds that were classified as “available-for-sale” under IAS 39.
5 Personnel expense30.06.2018 30.06.2017 31.12.2017 CHANGE TO 30.06.2017
(6 MONTHS) CHF MN CHF MN CHF MN CHF MN IN %Salaries and bonuses 235.7 217.4 228.0 18.3 8Pension and other employee benefit plans 1 12.4 17.8 18.0 –5.4 –30Other social contributions 19.9 19.0 17.8 0.9 5Other personnel expense 8.6 7.9 6.7 0.7 9Total 276.6 262.1 270.5 14.5 6
Personnel expense includes the expense for share-based compensation of CHF 17.4 mn (6 months ending 30.06.2017: CHF 15.9 mn; 6 months ending 31.12.2017: CHF 16.7 mn), of which CHF 13.6 mn (6 months ending 30.06.2017: CHF 12.7 mn; 6 months ending 31.12.2017: CHF 12.9 mn) relates to performance shares and CHF 3.8 mn (6 months ending 30.06.2017: CHF 3.2 mn; 6 months ending 31.12.2017: CHF 3.8 mn) to the awarding of bonus shares at preferential terms as well as deferred compensation in cash of CHF 1.6 mn (6 months ending 30.06.2017: CHF 1.3 mn; 6 months ending 31.12.2017: CHF 1.1 mn).
1 As of 30.06.2018: Expense from pension and other employee benefit plans includes the impacts of changes to Swiss pension fund regulations in the amount of CHF 7.4 mn (primarily the reduction of conversion rates).

52 Notes to the consolidated financial statements
6 General expense30.06.2018 30.06.2017 31.12.2017 CHANGE TO 30.06.2017
(6 MONTHS) CHF MN CHF MN CHF MN CHF MN IN %Occupancy expense 16.0 16.7 16.3 –0.7 –4IT, telecommunications and other equipment 39.2 38.9 32.8 0.3 1Travel and representation, public relations, marketing 20.7 18.8 24.3 1.9 10Consulting and audit fees 14.9 12.9 13.9 2.0 16Other general expense 20.5 14.5 15.9 6.0 41Total 111.3 101.8 103.2 9.5 9
7 Depreciation of property, equipment and intangible assets30.06.2018 30.06.2017 31.12.2017 CHANGE TO 30.06.2017
(6 MONTHS) CHF MN CHF MN CHF MN CHF MN IN %Depreciation of property and equipment 25.9 25.9 25.2 0.0 0Amortization of other intangible assets 6.2 3.8 5.5 2.4 63Impairments of property and equipment 0.0 0.0 0.6 0.0Total 32.1 29.7 31.3 2.4 8
8 Provisions and losses30.06.2018 30.06.2017 31.12.2017 CHANGE TO 30.06.2017
(6 MONTHS) CHF MN CHF MN CHF MN CHF MN IN %Increase in provisions 1.8 1.3 5.3 0.5 38Release of provisions –0.1 –0.2 0.0 0.1Recoveries 0.1 0.0 0.0 0.1Other 0.6 0.3 –4.5 0.3 100Total 2.4 1.4 0.8 1.0 71
9 Taxes30.06.2018 30.06.2017 31.12.2017 CHANGE TO 30.06.2017
(6 MONTHS) CHF MN CHF MN CHF MN CHF MN IN %Current income taxes 22.1 18.5 24.8 3.6 19Deferred income taxes 6.1 2.5 4.5 3.6 144Total 28.2 21.0 29.3 7.2 34

53Notes to the consolidated financial statements
10 Tax effects to other comprehensive income30.06.2018
CHF MN (6 MONTHS)AMOUNT
BEFORE TAXTAX INCOME /
(EXPENSE)AMOUNT
NET OF TAXTranslation differences during the reporting period 1.4 0.0 1.4Translation differences transferred to the income statement 0.0 0.0 0.0Income from debt instruments in financial investments during the reporting period –10.2 2.1 –8.1Income from debt instruments in financial investments transferred to the income statement 0.3 –0.1 0.2Income from cash flow hedges during the reporting period –0.9 0.0 –0.9Income from cash flow hedges transferred to the income statement 0.0 0.0 0.0Income from equity instruments in financial investments –1.0 0.2 –0.8Income from defined benefit pension plans 1.0 –0.2 0.8Total other comprehensive income –9.4 2.0 –7.4
30.06.2017
CHF MN (6 MONTHS)AMOUNT
BEFORE TAXTAX INCOME /
(EXPENSE)AMOUNT
NET OF TAXTranslation differences during the reporting period –7.6 0.0 –7.6Translation differences transferred to the income statement 0.0 0.0 0.0Income from debt instruments in financial investments during the reporting period 3.3 –0.9 2.4Income from debt instruments in financial investments transferred to the income statement –3.1 0.8 –2.3Income from cash flow hedges during the reporting period 0.2 0.0 0.2Income from cash flow hedges transferred to the income statement 0.0 0.0 0.0Income from equity instruments in financial investmentsIncome from defined benefit pension plans 15.1 –3.3 11.8Total other comprehensive income 7.9 –3.4 4.5
31.12.2017
CHF MN (6 MONTHS)AMOUNT
BEFORE TAXTAX INCOME /
(EXPENSE)AMOUNT
NET OF TAXTranslation differences during the reporting period 9.2 0.0 9.2Translation differences transferred to the income statement 0.0 0.0 0.0Income from debt instruments in financial investments during the reporting period –6.6 1.5 –5.1Income from debt instruments in financial investments transferred to the income statement –1.4 0.2 –1.2Income from cash flow hedges during the reporting period –0.8 0.1 –0.7Income from cash flow hedges transferred to the income statement 0.0 0.0 0.0Income from equity instruments in financial investmentsIncome from defined benefit pension plans –2.9 0.7 –2.2Total other comprehensive income –2.5 2.5 0.0

54 Notes to the consolidated financial statements
11 Fair value of financial instruments
11a Financial instruments measured at fair valueThe following table shows the fair value hierarchy of those financial instruments that are measured at fair value. Fair
value is defined as the price that would be received to sell an asset or paid to transfer a liability in an orderly transac tion between market participants at the measurement date.
Financial instruments measured at fair value
CHF MN LEVEL 1 LEVEL 2 LEVEL 330.06.2018
TOTALAssetsTrading portfolio assets 3,426.0 53.2 0.1 3,479.3Debt instruments 267.4 53.2 - 320.6Equity instruments 2,374.5 - 0.0 2,374.5Units in investment funds 155.5 0.0 0.1 155.6Precious metals and cryptocurrencies 628.6 - - 628.6Positive replacement values 50.5 147.7 0.0 198.2Other financial assets at fair value 2,933.9 1,309.0 5.6 4,248.5Debt instruments 1 2,873.0 1,271.6 - 4,144.6Equity instruments 0.0 - 1.9 1.9Units in investment funds 60.9 0.3 3.7 64.9Structured products - 37.1 - 37.1Financial investments 1,817.3 23.7 68.7 1,909.7Debt instruments 1,817.3 23.7 - 1,841.0Equity instruments 0.0 - 68.7 68.7Other assets 0.0 0.0 1.1 1.1Total financial assets at fair value 8,227.7 1,533.6 75.5 9,836.8
LiabilitiesTrading portfolio liabilities 143.0 4.7 0.0 147.7Debt instruments 101.1 4.7 - 105.8Equity instruments 41.9 - 0.0 41.9Units in investment funds 0.0 0.0 0.0 0.0Negative replacement values 173.2 644.3 - 817.5Other financial liabilities at fair value 2 - 9,170.7 - 9,170.7Other liabilities 0.0 0.0 76.1 76.1Total financial liabilities at fair value 316.2 9,819.7 76.1 10,212.0
1 In the case of debt instruments measured at fair value through profit and loss, the difference between the book value (fair value) and the contractually agreed redemption amount at maturity was CHF 27.3 mn.
2 Level 2 of the balance sheet item “Other financial liabilities at fair value” contains listed issued products with a fair value of CHF 4'830.6 mn.
Risk related to balance sheet

55Notes to the consolidated financial statements
Financial instruments measured at fair value
CHF MN LEVEL 1 LEVEL 2 LEVEL 331.12.2017
TOTALAssetsTrading portfolio assets 3,936.9 54.0 0.3 3,991.2Debt instruments 277.6 53.9 - 331.5Equity instruments 2,651.9 - 0.0 2,651.9Units in investment funds 166.8 0.1 0.3 167.2Precious metals and cryptocurrencies 840.6 - - 840.6Positive replacement values 33.3 210.6 0.0 243.9Other financial assets at fair value 2,623.5 861.9 5.5 3,490.9Debt instruments 1 2,590.7 829.0 - 3,419.7Units in investment funds 32.8 9.2 5.5 47.5Structured products - 23.7 - 23.7Financial investments 1,749.5 24.6 14.8 1,788.9Debt instruments 1,748.6 24.4 - 1,773.0Equity instruments 0.2 - 14.8 15.0Units in investment funds 0.7 0.2 0.0 0.9Other assets 8.3 0.0 0.0 8.3Total financial assets at fair value 8,351.5 1,151.1 20.6 9,523.2
LiabilitiesTrading portfolio liabilities 153.0 5.2 0.0 158.2Debt instruments 100.8 5.2 - 106.0Equity instruments 52.2 - 0.0 52.2Units in investment funds 0.0 0.0 0.0 0.0Negative replacement values 47.9 677.7 - 725.6Other financial liabilities at fair value 2 - 8,451.3 - 8,451.3Other liabilities 0.6 0.0 74.4 75.0Total financial liabilities at fair value 201.5 9,134.2 74.4 9,410.1
1 In the case of debt instruments measured at fair value through profit and loss, the difference between the book value (fair value) and the contractually agreed redemption amount at maturity was CHF 37.3 mn.
2 Level 2 of the balance sheet item “Other financial liabilities at fair value” contains listed issued products with a fair value of CHF 4,951.8 mn.
Level-1-InstrumenteIn the fair value hierarchy defined in IFRS 13, level 1 in- struments are those financial instruments whose fair value is based on quoted prices in active markets. This category essentially comprises almost all equity instruments and government bonds, liquid debt instruments issued by pub-lic sector entities and companies, investment funds for which a binding net asset value is published at least daily, exchange-traded derivatives, precious metals and crypto-currencies.
Mid-market prices are used for the valuation of debt instru-ments in the trading book provided the market price risks from these positions are offset fully or to a significant extent by other positions in the trading book. For the valu-ation of other debt instruments, bid prices are used in the case of long positions and ask prices are used in the case
of short positions. For equity instruments, listed invest-ment funds and exchange-traded derivatives, the closing or settlement prices of the relevant markets are used. Pub-lished net asset values are used in the case of unlisted investment funds. In the case of foreign currencies, pre-cious metals and cryptocurrencies, generally accepted prices are applied.
No valuation adjustments are made in the case of level 1 instruments.
Level-2-InstrumenteLevel 2 instruments are financial instruments whose fair value is based on quoted prices in markets that are not active or on a valuation method where significant input parameters can be observed directly or indirectly. They mainly comprise products issued by Vontobel, debt instru-
56 Notes to the consolidated financial statements
ments issued by public sector entities and companies with reduced market liquidity and OTC derivatives, as well as investment funds for which a binding net asset value is published at least quarterly.
Since there is no active market pursuant to the definition of IFRS 13 for the products issued by Vontobel, their fair value is determined using valuation methods. In the case of issued options (warrants) and option components of structured products, generally recognized option pricing models and quoted prices in markets that are not active are used to determine their fair value, while the present value method is used to determine the fair value of the in- terest rate components of structured products. To meas- ure the fair value of debt instruments where quoted prices are available but the low trading volume means there is no active market, the same rules apply to the use of mid-mar-ket prices and bid or ask prices as for the corresponding level 1 instruments. The valuation of debt instruments for which no quoted prices are available is carried out using generally recognized methods. For the valuation of OTC derivatives, generally recognized valuation models and quoted prices in markets that are not active are used. Pub-lished net asset values are used in the case of investment funds.
The valuation models take account of the relevant param- eters such as contract specifications, the market price of the underlying asset, foreign exchange rates, market interest rates or funding rates, default risks and volatility. Vontobel’s credit risk is only taken into account when determining the fair value of financial liabilities if market participants would consider it when calculating prices. OTC derivatives are traded only on a collateralized basis, which is why own credit risk (as well as third-party credit risk in the case of receivables) is not included in the valuation.
Level-3-InstrumenteLevel 3 instruments are financial instruments whose fair value is based on a valuation method that uses at least one significant input parameter that cannot be observed di- rectly or indirectly in the market. They include primarily the liability to acquire the minority interests in TwentyFour Asset Management LLP, the liability from an earn-out agreement relating to the acquisition of the Eastern Euro-pean client portfolio of Notenstein La Roche, investment funds for which a binding net asset value is not published at least quarterly, and several unlisted equity instruments. An asset from an earn-out agreement related to the acqui-sition of Finter Bank Zurich AG was settled in the financial year 2017.
The fair value of the liability to acquire minority interests in TwentyFour Asset Management LLP is calculated using a discounted cash flow analysis in which expected future cash flows based on internal business plans are dis-counted. This involves various input parameters that can-not be observed such as the future development of assets under management, their profitability, the cost / income ratio and long-term growth.
The fair value of the liability from the earn-out agreement relating to the acquisition of the Eastern European client portfolio of Notenstein La Roche depends on individual contractually agreed Key Performance Indicators for the acquired activities. The value of this liability is determined on the basis of internal business plans.
The fair value of investment funds is generally calculated using estimates from external experts regarding the level of future payouts from fund units. The measurement of unquoted equity securities is based on the proportionate share of the net asset value, taking account of any further measurement-relevant factors.
The following table shows the change in level 3 financial instruments in Vontobel’s balance sheet and the income on the positions as of the balance sheet date.

57Notes to the consolidated financial statements
Level 3 financial instruments
CHF MN (6 MONTHS)
FINANCIAL INSTRUMENTS AT
FAIR VALUE THROUGH PROFIT
OR LOSSFINANCIAL
INVESTMENTSOTHER
ASSETS
30.06.2018 TOTAL
FIANCIAL ASSETS
OTHER LIABILITIES 1
30.06.2018 TOTAL
FINANCIAL LIABILITIES
Balance sheetHoldings at the beginning of the year 5.8 14.8 0.0 20.6 –74.4 –74.4Impact of changes to the accounting principles 2.2 54.9 0.0 57.1 0.0 0.0Additions in scope of consolidations 0.0 0.0 0.0 0.0 0.0 0.0Disposals from scope of consolidation 0.0 0.0 1.1 1.1 0.0 0.0Investments 0.0 0.0 0.0 0.0 0.0 0.0Disposals –0.6 0.0 0.0 –0.6 0.0 0.0Redemptions 0.0 0.0 0.0 0.0 2.3 2.3Expense recognized in the income statement –2.1 0.0 0.0 –2.1 –0.4 –0.4Expense recognized in other comprehensive income 0.0 –1.0 0.0 –1.0 0.0 0.0Income recognized in the income statement 0.4 0.0 0.0 0.4 0.0 0.0Income recognized in other comprehensive income 0.0 0.0 0.0 0.0 0.0 0.0Change recognized in shareholders’ equity 0.0 0.0 0.0 0.0 –5.3 –5.3Reclassifications to level 3 0.0 0.0 0.0 0.0 0.0 0.0Reclassifications from level 3 0.0 0.0 0.0 0.0 1.7 1.7Translation differences 0.0 0.0 0.0 0.0 0.0 0.0Total book value at balance sheet date 5.7 68.7 1.1 75.5 –76.1 –76.1
Income in the financial year on holdings on balance sheet dateUnrealized losses recognized in the trading income –2.2 0.0 0.0 –2.2 0.0 0.0Unrealized losses recognized in other income –0.0 0.0 0.0 0.0 0.0 0.0Expense recognized in operating expense 0.0 0.0 0.0 0.0 –0.4 –0.4Unrealized losses recognized as other comprehensive income 0.0 –1.0 0.0 –1.0 0.0 0.0Unrealized gains recognized in the trading income 0.0 0.0 0.0 0.0 0.0 0.0Unrealized gains recognized in other income 0.0 0.0 0.0 0.0 0.0 0.0Unrealized gains recognized as other comprehensive income 0.0 0.0 0.0 0.0 0.0 0.0
Of the gains and losses recognized in the income statement, CHF –1.7 mn were included in trading income, CHF 0.0 mn in other income and CHF –0.4 mn in operating expense.
1 This item contains the liability to acquire the minority interests in TwentyFour Asset Management LLP (30.06.2018: CHF 63.1 Mio.; 31.12.2017: CHF 57.4 Mio.) and the liability from an earn-out-agreement relating to the acquisition of the Eastern client portfolio of Notenstein La Roche (30.06.2018: CHF 13.0 Mio.; 31.12.2017: CHF 17.0 Mio.).
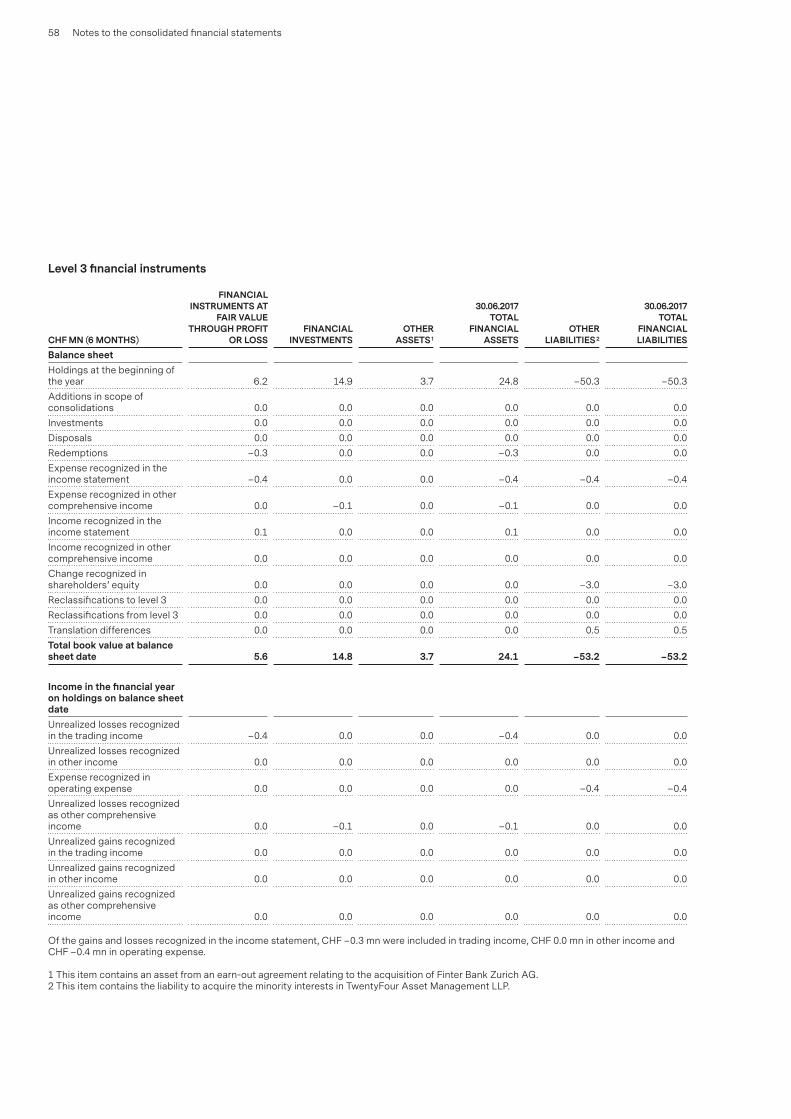
58 Notes to the consolidated financial statements
Level 3 financial instruments
CHF MN (6 MONTHS)
FINANCIAL INSTRUMENTS AT
FAIR VALUE THROUGH PROFIT
OR LOSSFINANCIAL
INVESTMENTSOTHER
ASSETS 1
30.06.2017 TOTAL
FINANCIAL ASSETS
OTHER LIABILITIES 2
30.06.2017 TOTAL
FINANCIAL LIABILITIES
Balance sheetHoldings at the beginning of the year 6.2 14.9 3.7 24.8 –50.3 –50.3Additions in scope of consolidations 0.0 0.0 0.0 0.0 0.0 0.0Investments 0.0 0.0 0.0 0.0 0.0 0.0Disposals 0.0 0.0 0.0 0.0 0.0 0.0Redemptions –0.3 0.0 0.0 –0.3 0.0 0.0Expense recognized in the income statement –0.4 0.0 0.0 –0.4 –0.4 –0.4Expense recognized in other comprehensive income 0.0 –0.1 0.0 –0.1 0.0 0.0Income recognized in the income statement 0.1 0.0 0.0 0.1 0.0 0.0Income recognized in other comprehensive income 0.0 0.0 0.0 0.0 0.0 0.0Change recognized in shareholders’ equity 0.0 0.0 0.0 0.0 –3.0 –3.0Reclassifications to level 3 0.0 0.0 0.0 0.0 0.0 0.0Reclassifications from level 3 0.0 0.0 0.0 0.0 0.0 0.0Translation differences 0.0 0.0 0.0 0.0 0.5 0.5Total book value at balance sheet date 5.6 14.8 3.7 24.1 –53.2 –53.2
Income in the financial year on holdings on balance sheet dateUnrealized losses recognized in the trading income –0.4 0.0 0.0 –0.4 0.0 0.0Unrealized losses recognized in other income 0.0 0.0 0.0 0.0 0.0 0.0Expense recognized in operating expense 0.0 0.0 0.0 0.0 –0.4 –0.4Unrealized losses recognized as other comprehensive income 0.0 –0.1 0.0 –0.1 0.0 0.0Unrealized gains recognized in the trading income 0.0 0.0 0.0 0.0 0.0 0.0Unrealized gains recognized in other income 0.0 0.0 0.0 0.0 0.0 0.0Unrealized gains recognized as other comprehensive income 0.0 0.0 0.0 0.0 0.0 0.0
Of the gains and losses recognized in the income statement, CHF –0.3 mn were included in trading income, CHF 0.0 mn in other income and CHF –0.4 mn in operating expense.
1 This item contains an asset from an earn-out agreement relating to the acquisition of Finter Bank Zurich AG.2 This item contains the liability to acquire the minority interests in TwentyFour Asset Management LLP.

59Notes to the consolidated financial statements
Valuation adjustmentsThe fair value of level 2 and level 3 instruments is always an estimate or an approximation of a value that cannot be determined with absolute certainty. Furthermore, the valu-ation methods used do not always reflect all of the factors that are relevant when determining fair value. To ensure that the valuations are appropriate, additional factors are considered in the case of products issued by Vontobel. These factors include uncertainties relating to models and parameters, as well as liquidity risks and the risk of the early redemption of the products issued. The adjustments due to uncertainties relating to the models and parame-ters reflect the uncertainties in the model assumptions and input parameters associated with the valuation meth-ods used. The adjustments due to liquidity risks take account of the expected costs of hedging open net risk positions. Management believes it is necessary and appro-priate to take these factors into account in order to cor-rectly determine the fair value.
The appropriateness of the valuation of financial instru- ments that are not traded in an active market is ensured
through the application of clearly defined methods and processes as well as independent controls. The control processes comprise the analysis and approval of new instruments, the regular analysis of risks as well as gains and losses, the verification of prices and the examination of the models on which the estimates of the fair value of financial instruments are based. These controls are con-ducted by units that possess the relevant specialist knowl-edge and operate independently from the trading and investment functions.
Sensitivity of fair values of level 3 instrumentsKey assumptions for the measurement of the liability to acquire minority interests in TwentyFour Asset Manage-ment LLP are the discount rate (30.06.18: 12.0 %; 31.12.17: 12.0 %) that will be used to discount future cash flows, as well as the long-term growth of these cash flows (30.06.18: 1.0 %; 31.12.17: 1.0 %). The following table shows how the measurement is affected by changes in these two assump-tions.
Key assumptions
VARIATION OF THE CHANGE IN THE FAIR VALUE CHANGE IN THE FAIR VALUEKEY ASSUMPTION AS OF 30.06.2018 AS OF 31.12.2017
IN CHF MN IN CHF MNDiscount rate +1 percentage point –4.6 –4.4Discount rate –1 percentage point 5.5 5.1Long-term growth +1 percentage point 2.8 2.5Long-term growth –1 percentage point –2.4 –2.1
In the case of the liability from the earn-out agreement relating to the acquisition of the Eastern European client portfolio of Notenstein La Roche, a reasonably realistic change in input parameters has no significant impact on Vontobel's consolidated financial satements.
A change in the net asset value of investment funds or unquoted equity securities leads to a proportional change in fair value of these financial instruments. A reasonably realistic change in input parameters has no significant impact on Vontobel’s consolidated financial statements.
Day 1 profitWhen a financial instrument is recognized for the first time, the transaction price provides the best indication of the fair value unless the fair value of this financial instru-ment can be evidenced by comparison with other observ-able current market transactions involving the same instrument (level 1 instrument) or is based on a valuation method that uses market data (level 2 instrument). If this is
the case, the difference between the transaction price and the fair value – referred to as “day 1 profit” – is recorded in “Trading income” in the case of trading portfolio assets and liabilities, other financial instruments at fair value and derivative financial instruments and is recorded in “Other comprehensive income” in the case of financial invest-ments.
In the case of level 3 instruments, the “day 1 profit” is deferred and only recognized in “Trading income” or “Other comprehensive income” when the prices of equiv-alent financial instruments or the underlying inputs become observable or when day 1 profit is realized. During the financial year and the previous year, no positions with deferred day 1 profit were recorded.
Reclassifications within the fair value hierarchyIn the first half 2018 (first respectively second half-year of 2017), positions with a fair value of CHF 17.1 mn (6 months ending 30.06.17: CHF 55.3 mn; 6 months ending 31.12.17:

60 Notes to the consolidated financial statements
CHF 40.4 mn) were reclassified from level 1 to level 2 and positions with a fair value of CHF 36.1 mn (6 months end-ing 30.06.17: CHF 21.5 mn; 6 months ending 31.12.17: CHF 31.4 mn) were reclassified from level 2 to level 1. In the event of changes in the availability of market prices (mar-ket liquidity) or of binding net asset values of investment
funds, reclassifications are made at the end of the period under review.
11b Financial instruments measured at amortized costThe following table shows the book value, the estimated fair value and the fair value hierarchy of those financial instruments that are measured at amortized cost
Financial instruments measured at amortized cost
30.06.2018 31.12.2017FAIR VALUE BOOK VALUE FAIR VALUE BOOK VALUE
CHF MN LEVEL 1 LEVEL 2 LEVEL 3 TOTAL TOTAL TOTAL TOTALAssetsCash 6,441.3 0.0 - 6,441.3 6,441.3 6,287.9 6,287.9Due from banks - 984.5 - 984.5 984.5 1,658.7 1,658.7Cash collateral for securities borrowing agreements - 6.7 - 6.7 6.7 8.5 8.5Cash collateral for reverse- repurchase agreements - 989.2 - 989.2 989.2 1,007.2 1,007.2Loans - 4,373.5 - 4,373.5 4,301.9 3,351.4 3,310.5Other assets 1 32.9 651.4 - 684.3 684.3 436.2 436.2Total 6,474.2 7,005.3 0.0 13,479.5 13,407.9 12,749.9 12,709.0
LiabilitiesDue to banks - 583.6 - 583.6 583.6 1,221.3 1,221.3Cash collateral from repurchase agreements - 74.5 - 74.5 74.5 0.0 0.0Due to customers - 9,789.3 - 9,789.3 9,789.3 9,758.2 9,758.2Debt issued 455.2 0.0 - 455.2 447.4 0.0 0.0Other liabilities 1 0.6 797.8 - 798.4 798.4 792.6 792.6Total 455.8 11,245.2 0.0 11,701.0 11,693.2 11,772.1 11,772.1
1 The position mainly includes the accrued interest as well as open settlement positions.
Short-term financial instruments at amortized cost or par valueIncluded here are accounts due from / to banks, loans and accounts due to customers as well as cash collateral from repurchase and for reverse-repurchase and as well for securities-borrowing agreements that have a maturity or a refinancing profile of at most one year, the balance sheet item “cash”, as well as financial instruments included in other assets / liabilities. In the case of short-term financial instruments, it is assumed that the book value is close enough to the fair value.
Long-term financial instruments at amortized cost Included here are accounts due from / to banks, loans and accounts due to customers, cash collateral from repur-chase and for reverse-repurchase and as well for securi-ties-borrowing agreements that have a maturity or a refi-nancing profile of over one year as well as debt issued. Fair value is determined using the present value method. For the valuation of debt issued the bid price is used.

61Notes to the consolidated financial statements
12 Off-balance sheet information30.06.2018 31.12.2017 CHANGE TO 31.12.2017
CHF MN CHF MN CHF MN IN %Contingent liabilities 352.1 608.1 –256.0 –42Irrevocable commitments 115.9 90.2 25.7 28Commitments for capital increases and capital contributions 0.2 0.2 0.0 0Fiduciary transactions 2,021.3 1,608.3 413.0 26Contract volumes of derivatives 28,061.1 27,550.4 510.7 2
13 Litigation
Vontobel agreed a mutual settlement with the authorities in the German state of North Rhine-Westphalia in connec-tion with untaxed assets held by German clients and paid a one-off sum of approximately EUR 13.3 million in the first half of the year 2018 for which appropriate provisions for litigation risks and process risks were available.
In connection with the fraud committed by Bernard Mad-off, the liquidators of investment vehicles that invested directly or indirectly in Madoff funds have filed lawsuits with various courts against more than 100 banks and custodians. The litigation is targeted at investors who redeemed their investments in these vehicles between 2004 and 2008. The liquidators are demanding that the
investors repay the sums involved because they consider them to have been obtained unjustly as a result of the redemptions. Since the liquidators often only know the names of the investors’ custodian banks, they have filed the lawsuits against them. Several legal entities of Vontobel are or may be affected by the litigation in their capacity as a bank or custodian. The claims filed against Vontobel since 2010 concern the redemption of investments worth around USD 43.1 mn. However, based on the information currently available to it, Vontobel believes the probability of a lawsuit resulting in an outflow of funds is low and has therefore decided not to set aside any provisions for such a lawsuit, but rather to disclose the amount under contin- gent liabilities.
14 Client assets30.06.2018 31.12.2017 CHANGE TO 31.12.2017
CHF BN CHF BN CHF BN IN %Assets under management 168.6 165.3 3.3 2Other advised client assets 13.4 12.8 0.6 5Structured products outstanding 9.3 8.5 0.8 9Total advised client assets 191.2 186.6 4.6 2Custody assets 62.3 59.9 2.4 4Total client assets 253.6 246.5 7.1 3
Client assetsClient assets is a broader term than assets under manage- ment and comprises all bankable assets that are managed by or deposited with Vontobel, including assets that are held solely for transaction or custody purposes and for which further services are provided, as well as investment products offered by Financial Products to give private and institutional clients access to all asset classes and markets.
Off-balance sheet and other information
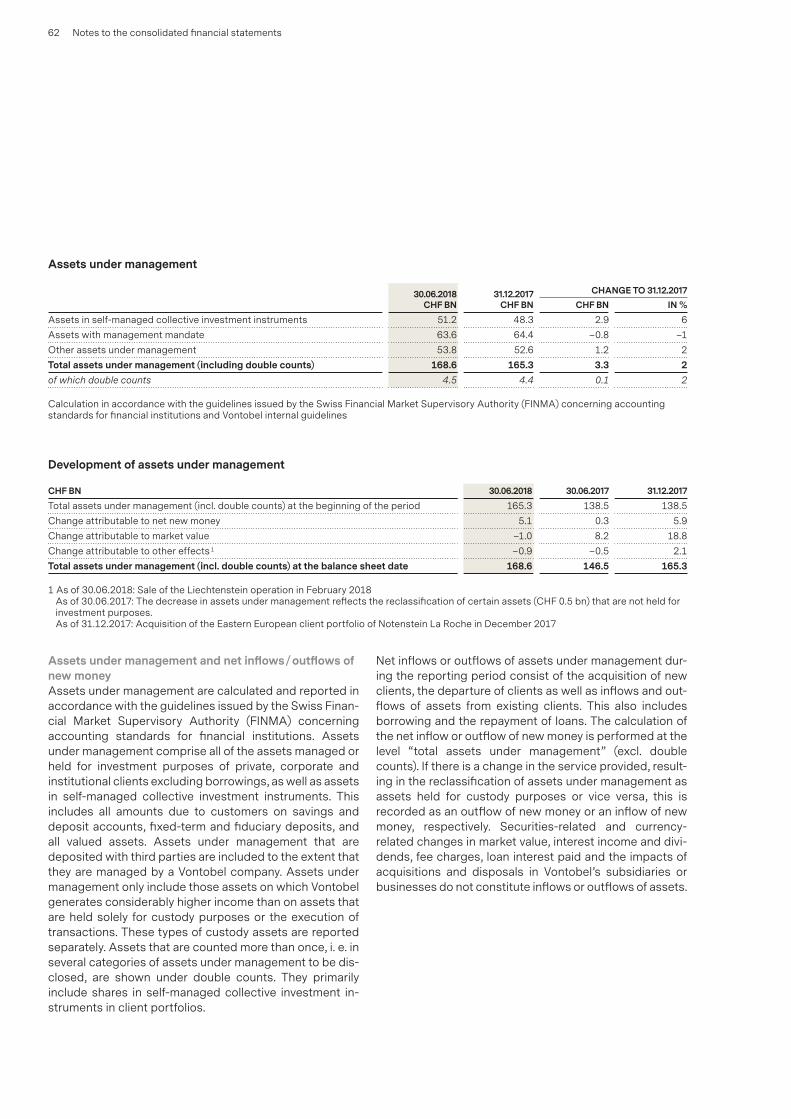
62 Notes to the consolidated financial statements
Assets under management
30.06.2018 31.12.2017 CHANGE TO 31.12.2017CHF BN CHF BN CHF BN IN %
Assets in self-managed collective investment instruments 51.2 48.3 2.9 6Assets with management mandate 63.6 64.4 –0.8 –1Other assets under management 53.8 52.6 1.2 2Total assets under management (including double counts) 168.6 165.3 3.3 2of which double counts 4.5 4.4 0.1 2
Calculation in accordance with the guidelines issued by the Swiss Financial Market Supervisory Authority (FINMA) concerning accounting standards for financial institutions and Vontobel internal guidelines
Development of assets under management
CHF BN 30.06.2018 30.06.2017 31.12.2017Total assets under management (incl. double counts) at the beginning of the period 165.3 138.5 138.5Change attributable to net new money 5.1 0.3 5.9Change attributable to market value –1.0 8.2 18.8Change attributable to other effects 1 –0.9 –0.5 2.1Total assets under management (incl. double counts) at the balance sheet date 168.6 146.5 165.3
1 As of 30.06.2018: Sale of the Liechtenstein operation in February 2018 As of 30.06.2017: The decrease in assets under management reflects the reclassification of certain assets (CHF 0.5 bn) that are not held for investment purposes. As of 31.12.2017: Acquisition of the Eastern European client portfolio of Notenstein La Roche in December 2017
Assets under management and net inflows / outflows of new moneyAssets under management are calculated and reported in accordance with the guidelines issued by the Swiss Finan- cial Market Supervisory Authority (FINMA) concerning accounting standards for financial institutions. Assets under management comprise all of the assets managed or held for investment purposes of private, corporate and institutional clients excluding borrowings, as well as assets in self-managed collective investment instruments. This includes all amounts due to customers on savings and deposit accounts, fixed-term and fiduciary deposits, and all valued assets. Assets under management that are deposited with third parties are included to the extent that they are managed by a Vontobel company. Assets under management only include those assets on which Vontobel generates considerably higher income than on assets that are held solely for custody purposes or the execution of transactions. These types of custody assets are reported separately. Assets that are counted more than once, i. e. in several categories of assets under management to be dis-closed, are shown under double counts. They primarily include shares in self-managed collective investment in- struments in client portfolios.
Net inflows or outflows of assets under management dur-ing the reporting period consist of the acquisition of new clients, the departure of clients as well as inflows and out-flows of assets from existing clients. This also includes borrowing and the repayment of loans. The calculation of the net inflow or outflow of new money is performed at the level “total assets under management” (excl. double counts). If there is a change in the service provided, result- ing in the reclassification of assets under management as assets held for custody purposes or vice versa, this is recorded as an outflow of new money or an inflow of new money, respectively. Securities-related and currency- related changes in market value, interest income and divi-dends, fee charges, loan interest paid and the impacts of acquisitions and disposals in Vontobel’s subsidiaries or businesses do not constitute inflows or outflows of assets.

63Notes to the consolidated financial statements
15 Events after the balance sheet date
Vontobel acquired 100 % of Notenstein La Roche Privat-bank AG from Raiffeisen Switzerland on July 2, 2018. This acquisition complements Vontobel’s organic growth in wealth management and in business with External Asset Managers (EAM). Beyond that Vontobel strengthens its presence in its Swiss home market through the addition of 13 locations where Notenstein La Roche operates. Noten-stein La Roche will be integrated into Vontobel, with the realization of existing synergies.
The contractually agreed purchase price is estimated to be around CHF 700 million and will be paid in cash in two tranches. The purchase price consists of the capital of Notenstein La Roche as of the acquisition date plus 1.78 % of assets under management at signing in the amount of CHF 16.4 billion. Due to the short period of time between the acquisition date and the approval of the Half-Year Report 2018, the definitive purchase price, purchase price allocation and other disclosures required under IFRS 3 can only be provided in the Annual Report 2018.
Vontobel financed the acquisition through available capital and a CHF 450 million Additional Tier 1 (AT1) bond with a coupon of 2.625%, which was placed in the market at an issue price of 100 % in June 2018. The AT1 bond was rec-ognized in the balance sheet item “Debt issued” at issu-ance. Further information on the treatment of the AT1 bond in the consolidated financial statements is provided in “IFRS 9 accounting principles”.
Apart from that no events have occurred since the balance sheet date that affect the relevance of the information pro-vided in the half-year 2018 financial statements and would therefore need to be disclosed.

64 Notes to the consolidated financial statements
Segment reporting
16 Segment reporting principles
External segment reporting reflects the organizational structure of Vontobel as well as internal management reporting, which forms the basis for the assessment of the financial performance of the segments and the allocation of resources to the segments.
Vontobel comprises the following divisions, which repre-sent the operating and reportable segments according to IFRS 8. They provide the following services to clients:
Wealth ManagementWealth Management enompasses portfolio management services for private clients, investment advisory, custodian services, financial advisory services relating to legal, inher-itance and tax matters, lending against collateral, mort-gage loans, pension advice and wealth consolidation ser-vices.
Asset ManagementAsset Management specializes in active asset manage-ment, and is positioned as a multi-boutique provider. Its products are distributed to institutional clients, indirectly through wholesale channels, and also by cooperation partners.
Investment BankingInvestment Banking focuses on the structured products and derivatives business, services for external asset man- agers, brokerage, corporate finance, securities and foreign exchange trading, and securities services supplied by Transaction Banking.
Corporate CenterThe Corporate Center provides core services for the divi-sions, and comprises the support units Operations, Finance & Risk, and Corporate Services as well as the Board of Directors support units.
Income, expenses, assets and liabilities are allocated to the divisions on the basis of client responsibility or accord- ing to the principle of origination. Items that cannot be allocated directly to the divisions are reported in the Cor-porate Center accounts. The Corporate Center also includes consolidating entries.
The costs of the services supplied internally are reported in the item “Services from / to other segment(s)” as a re- duction in costs for the service provider and as an increase in costs for the recipient, based on agreements that are renegotiated periodically according to the same principle as if they were concluded between independent third par-ties (“at arm’s length”).
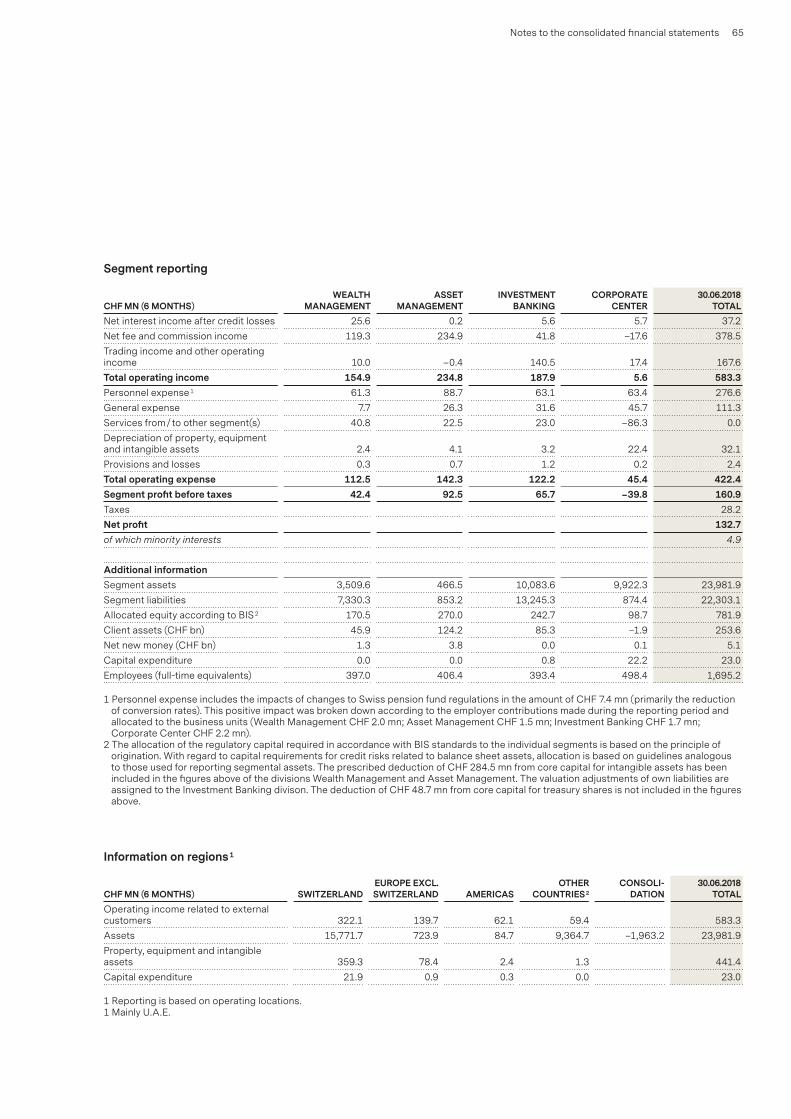
65Notes to the consolidated financial statements
Segment reporting
CHF MN (6 MONTHS)WEALTH
MANAGEMENTASSET
MANAGEMENTINVESTMENT
BANKINGCORPORATE
CENTER 30.06.2018
TOTALNet interest income after credit losses 25.6 0.2 5.6 5.7 37.2Net fee and commission income 119.3 234.9 41.8 –17.6 378.5Trading income and other operating income 10.0 –0.4 140.5 17.4 167.6Total operating income 154.9 234.8 187.9 5.6 583.3Personnel expense 1 61.3 88.7 63.1 63.4 276.6General expense 7.7 26.3 31.6 45.7 111.3Services from / to other segment(s) 40.8 22.5 23.0 –86.3 0.0Depreciation of property, equipment and intangible assets 2.4 4.1 3.2 22.4 32.1Provisions and losses 0.3 0.7 1.2 0.2 2.4Total operating expense 112.5 142.3 122.2 45.4 422.4Segment profit before taxes 42.4 92.5 65.7 –39.8 160.9Taxes 28.2Net profit 132.7of which minority interests 4.9
Additional informationSegment assets 3,509.6 466.5 10,083.6 9,922.3 23,981.9Segment liabilities 7,330.3 853.2 13,245.3 874.4 22,303.1Allocated equity according to BIS 2 170.5 270.0 242.7 98.7 781.9Client assets (CHF bn) 45.9 124.2 85.3 –1.9 253.6Net new money (CHF bn) 1.3 3.8 0.0 0.1 5.1Capital expenditure 0.0 0.0 0.8 22.2 23.0Employees (full-time equivalents) 397.0 406.4 393.4 498.4 1,695.2
1 Personnel expense includes the impacts of changes to Swiss pension fund regulations in the amount of CHF 7.4 mn (primarily the reduction of conversion rates). This positive impact was broken down according to the employer contributions made during the reporting period and allocated to the business units (Wealth Management CHF 2.0 mn; Asset Management CHF 1.5 mn; Investment Banking CHF 1.7 mn; Corporate Center CHF 2.2 mn).
2 The allocation of the regulatory capital required in accordance with BIS standards to the individual segments is based on the principle of origination. With regard to capital requirements for credit risks related to balance sheet assets, allocation is based on guidelines analogous to those used for reporting segmental assets. The prescribed deduction of CHF 284.5 mn from core capital for intangible assets has been included in the figures above of the divisions Wealth Management and Asset Management. The valuation adjustments of own liabilities are assigned to the Investment Banking divison. The deduction of CHF 48.7 mn from core capital for treasury shares is not included in the figures above.
Information on regions 1
CHF MN (6 MONTHS) SWITZERLANDEUROPE EXCL. SWITZERLAND AMERICAS
OTHER COUNTRIES 2
CONSOLI-DATION
30.06.2018 TOTAL
Operating income related to external customers 322.1 139.7 62.1 59.4 583.3Assets 15,771.7 723.9 84.7 9,364.7 –1,963.2 23,981.9Property, equipment and intangible assets 359.3 78.4 2.4 1.3 441.4Capital expenditure 21.9 0.9 0.3 0.0 23.0
1 Reporting is based on operating locations.1 Mainly U.A.E.

66 Notes to the consolidated financial statements
Segment reporting
CHF MN (6 MONTHS)WEALTH
MANAGEMENTASSET
MANAGEMENTINVESTMENT
BANKINGCORPORATE
CENTER 30.06.2017
TOTALNet interest income after credit losses 15.9 0.1 4.7 13.9 34.7Net fee and commission income 106.6 200.2 42.5 –15.7 333.6Trading income and other operating income 9.4 1.4 121.6 16.8 149.2Total operating income 131.9 201.7 168.8 15.0 517.5Personnel expense 55.4 82.3 59.4 65.0 262.1General expense 7.7 21.9 24.7 47.5 101.8Services from / to other segment(s) 40.0 25.4 19.2 –84.6 0.0Depreciation of property, equipment and intangible assets 1.5 2.5 2.7 23.0 29.7Provisions and losses 0.2 0.1 0.0 1.0 1.4Total operating expense 104.8 132.2 106.0 51.9 395.0Segment profit before taxes 27.1 69.5 62.8 –36.9 122.5Taxes 21.0Net profit 101.5of which minority interests 2.8
Additional informationSegment assets 2,559.9 477.0 6,895.2 11,234.0 21,166.1Segment liabilities 7,002.8 743.7 10,070.6 1,833.3 19,650.4Allocated equity according to BIS 1 145.2 270.0 209.9 98.8 723.9Client assets (CHF bn) 41.2 106.8 62.6 –2.9 207.7Net new money (CHF bn) 1.0 –1.7 1.0 0.0 0.3Capital expenditure 0.0 0.0 0.0 21.8 21.8Employees (full-time equivalents) 390.3 398.5 376.9 477.2 1,642.9
1 The allocation of the regulatory capital required in accordance with BIS standards to the individual segments is based on the principle of origination. With regard to capital requirements for credit risks related to balance sheet assets, allocation is based on guidelines analogous to those used for reporting segmental assets. The prescribed deduction of CHF 274.4 mn from core capital for intangible assets has been included in the figures above of the divisions Wealth Management and Asset Management. The valuation adjustments of own liabilities are assigned to the Investment Banking division. The deduction of CHF 65.7 mn from core capital for treasury shares is not included in the figures above.
The reporting of interest income has changed. The figures were adapted accordingly.
Information on regions 1
CHF MN (6 MONTHS) SWITZERLANDEUROPE EXCL. SWITZERLAND AMERICAS
OTHER COUNTRIES 2
CONSOLI-DATION
30.06.2017 TOTAL
Operating income related to external customers 260.4 112.4 63.3 81.4 517.5Assets 14,806.0 606.2 142.3 7,114.8 –1,503.2 21,166.1Property, equipment and intangible assets 342.4 77.3 2.9 1.5 424.1Capital expenditure 21.2 0.1 0.2 0.3 21.8
1 Reporting is based on operating locations.2 Mainly U.A.E.

67Notes to the consolidated financial statements
Segment reporting
CHF MN (6 MONTHS)WEALTH
MANAGEMENTASSET
MANAGEMENTINVESTMENT
BANKINGCORPORATE
CENTER 31.12.2017
TOTALNet interest income after credit losses 22.6 0.0 5.3 6.0 33.8Net fee and commission income 108.6 231.6 33.5 –14.4 359.3Trading income and other operating income 9.3 1.6 121.2 17.4 149.5Total operating income 140.5 233.2 160.0 9.0 542.6Personnel expense 57.7 89.9 55.9 67.0 270.5General expense 9.4 21.7 29.4 42.7 103.2Services from / to other segment(s) 37.9 24.1 22.4 –84.4 0.0Depreciation of property, equipment and intangible assets 1.7 4.0 2.8 22.8 31.3Provisions and losses 0.4 0.1 0.2 0.1 0.8Total operating expense 107.1 139.8 110.7 48.2 405.8Segment profit before taxes 33.4 93.4 49.3 –39.2 136.8Taxes 29.3Net profit 107.5of which minority interests 3.8
Additional informationSegment assets 3,051.0 374.4 9,694.5 9,783.8 22,903.7Segment liabilities 7,570.5 801.7 12,528.6 382.4 21,283.2Allocated equity according to BIS 1 172.7 272.6 227.8 93.8 766.9Client assets (CHF bn) 45.8 121.3 82.2 –2.8 246.5Net new money (CHF bn) 0.0 5.3 0.4 –0.1 5.6Capital expenditure 0.5 0.0 1.5 51.5 53.5Employees (full-time equivalents) 408.2 404.9 383.1 492.0 1,688.2
1 The allocation of the regulatory capital required in accordance with BIS standards to the individual segments is based on the principle of origination. With regard to capital requirements for credit risks related to balance sheet assets, allocation is based on guidelines analogous to those used for reporting segmental assets. The prescribed deduction of CHF 291.1 mn from core capital for intangible assets has been included in the figures above of the divisions Wealth Management and Asset Management. The valuation adjustments of own liabilities are assigned to the Investment Banking division. The deduction of CHF 79.6 mn from core capital for treasury shares is not included in the figures above.
The reporting of interest income has changed. The figures were adapted accordingly.
Information on regions 1
CHF MN (6 MONTHS) SWITZERLANDEUROPE EXCL. SWITZERLAND AMERICAS
OTHER COUNTRIES 2
CONSOLI-DATION
31.12.2017 TOTAL
Operating income related to external customers 272.8 138.1 63.6 68.1 542.6Assets 15,398.1 734.7 131.8 7,949.7 –1,310.6 22,903.7Property, equipment and intangible assets 366.5 80.2 2.6 1.5 450.8Capital expenditure 52.4 0.5 0.3 0.3 53.5
1 Reporting is based on operating locations.2 Mainly U.A.E.

68 Additional information
Financial calendar
November 1, 2018Business update third quarter 2018
February 12, 2019Publication annual results 2018
April 2, 2019Annual General Meeting 2019
Contacts
Investor RelationsMichèle Schnyder Investor Relations T +41 58 283 76 97
Susanne Borer Investor Relations T +41 58 283 73 29 [email protected]
Media RelationsPeter Dietlmaier Corporate Communications T +41 58 283 59 30
Rebeca Garcia Corporate Communications T +41 58 283 76 69 [email protected]
Corporate Responsibility & SustainabilityChristian Schilz Corporate Responsibility & Sponsoring T +41 58 283 71 83
Natalie Ernst Corporate Sustainability Manager T +41 58 283 62 18 [email protected]
Vontobel Holding AG registered sharesStock exchange listing SIX Swiss ExchangeISIN CH001 233 554 0Security number 1 233 554Par value CHF 1.00
Ticker symbolsBloomberg VONN SWReuters VONTZn.STelekurs VONN
Vontobel Holding AG Additional Tier 1 (AT1) bondSize CHF 450 mnISIN CH041 904 256 6Coupon 2.625%
Moody’s Ratings
Bank Vontobel AGLong-term deposit rating Aa3Short-term deposit rating Prime-1Long-term counterparty risk assessment A2 (cr)Short-term counterparty risk assessment Prime-1 (cr)
Vontobel Holding AGLong-term rating (issuer rating) A3Additional Tier 1 (AT1) bond Baa3(hyb)
Investors’ information

69
Award
CORPORATEDESIGN PREIS
2018
Asia Asset Management named Vontobel Asset Manage-ment “Best Manager” in the categories, Emerging Markets Debt, Emerging Markets Equity and Global Infrastructure.
Investment BankingAt the Swiss Derivative Awards 2018, Vontobel ranked as first in the category “Top Service” for the eighth time in succession.
In the Extel Survey 2018, Vontobel’s Brokerage team took first place in the segment “Swiss Equities” for the eighth consecutive time.
Award-winning businesses
In recent months, we once again received a number ofindustry awards in recognition of our expertise acrossdifferent businesses, which enables us to generatesustained value for our clients.
VontobelThe German Brand Award recognizes successful brands, consistent brand management and sustainable brand communication. In the elite category “Excellence in Branding” that is presented in recognition of outstanding brand management and spans different industries, Vontobel was named “Winner – Corporate Brand of the Year” in 2018. Vontobel also took first place in the “Excellence in Brand Strategy Management and Crea-tion” class within the “Brand Design” category and won the “Industry Excellence in Branding” class within the category “Banking & Financial Services”.
In 2018, Vontobel received an award from the jury of the renowned “Corporate Design Prize” in the “Corporate Design / Redesign” category.
ISS-oekom has rated Vontobel’s sustainability perfor-mance this year for the first time and has awarded it “Prime” status. This means that Vontobel ranks among the top 6 % in its peer group of 44 asset managers worldwide.
Asset ManagementLipper named Vontobel Asset Management, in four Euro-pean countries, the leading provider in the categories Emerging Markets Equity, Commodities and mixed Asset CHF Balanced. Our mtx Sustainable Leaders strategies, including Asia ex-Japan, Emerging Markets and Chinese equities, received several accolades in Europe.
Vontobel Asset Management was named “Emerging Mar-kets Manager of the Year” at the UK Pension Awards ceremony in London, for the performance of our mtx Sus-tainable Leaders and Emerging Markets Debt strategies.
TwentyFour Asset Management received platinum and gold awards from Portfolio Adviser Fund Awards in the Unconstrained Fixed Income and the UK Fixed Income categories.
Vontobel Asset Management has been selected by Capi-tal Fonds-Kompass as one of the best fund providers in Germany.
Additional information

70 Additional information
26
7
10 113
11
12
4
98
6
19
21
1517
22 23
25
2420
5
3
2
1618 14
Our locations
At Vontobel, we actively shape the future. We master what we do – and we only do what we master.
From Zurich, Frankfurt am Main and London over New York and Dubai to Hong Kong – throughout 26 offices, we service our clients.
Find an overview of all our offices on vontobel.com
1
2
3
4
5
6
7
8
9
10
11
12
13
14
15
16
17
18
19
20
21
22
23
24
25
26
Zurich
Basel
Bern
Chur
Geneva
Lausanne
Lucerne
Lugano
Locarno
Olten
Schaffhausen
St. Gallen
Winterthur
Frankfurt am Main
Hamburg
Cologne
London
Luxembourg
Madrid
Milan
Munich
Dubai
Hong Kong
New York
Singapore
Sydney

Vontobel uses only recycled paper for printing. It takes about 1.5 times less energy and 2.5 times less water to produce recycled paper than it does to produce paper from fresh fiber. Recycled paper also cuts greenhouse gas emissions by more than 20 %. We offset the remaining emissions with various CO2 projects around the world.
Further information: vontobel.com/sustainability
Imprint
Publishing byVontobel Holding AGGotthardstrasse 43 8022 Zurich
ConceptMetaDesign AG
Layout & implementationVontobel and NeidhartSchön AG
Printing company Neidhart + Schön Print AG

Vont
obel
Hal
f-Ye
ar R
epor
t 201
8
Vontobel Gotthardstrasse 43 8022 Zurich
vontobel.com