voluntary-greenhouse-gas-reporting-2015-year-final downloa… · Web view38Guidance for voluntary...
65
Guidance for Voluntary Greenhouse Gas Reporting – 2016 Using Data and Methods from the 2014 Calendar Year
Transcript of voluntary-greenhouse-gas-reporting-2015-year-final downloa… · Web view38Guidance for voluntary...

Guidance for Voluntary Greenhouse Gas Reporting – 2016
Using Data and Methods from the 2014 Calendar Year

This report may be cited as:Ministry for the Environment. Guidance for Voluntary Greenhouse Gas Reporting – 2016: Using Data and Methods from the 2014 Calendar Year. Wellington: Ministry for the Environment.
Published in December 2016 by theMinistry for the EnvironmentManatū Mō Te TaiaoPO Box 10362, Wellington 6143, New Zealand
ISSN: 1174-8281Publication number: ME 1281
© Crown copyright New Zealand 2016
This document is available on the Ministry for the Environment’s website:www.mfe.govt.nz.

This is the ninth version of an annual publication. Each year the Ministry for the Environment will update this guide and associated tables with the latest emission factors for the given calendar year.
Changes to data and methodology for the 2016 guidanceGeneral update: We recommend businesses and organisations use emissions factors that correlate to the year they are reporting. For example, emissions factors published in this guidance should be applied to activities in the 2016 calendar year or the 2016/2017 financial year.
Scope 1 emissions1
Stationary combustion – emission factors for stationary combustion have been updated based on new figures for the 2014 calendar year.
Transport fuels – emission factors for transport fuels have been updated based on new figures for the 2014 calendar year.
No estimates are available for marine diesel for the 2014 calendar year as the refinery has stopped making the marine diesel blend. If an organisation was using marine diesel, it is now likely to be using light fuel oil; so the corresponding emission factor for light fuel oil should be used instead.
Transport by distance – emissions factors by engine size are now given in greater detail. In addition, emissions factors for petrol hybrids are now available.
Taxis/rental cars have now been classed as scope 1. Emission factors for travel in taxis/rental cars have been updated based on new figures for the 2014 calendar year.
Scope 2Purchased electricity – The electricity emission factor has been updated based on new figures for the 2014 calendar year.
A time series of electricity emission factors for the period 1990–2014 are provided for 1990 to 2014 in the Microsoft Excel workbook.
Scope 3Transmission and distribution losses – emission factors for transmission and distribution losses from purchased electricity and natural gas have been updated based on new figures for the 2014 calendar year.
Air travel – To calculate air travel emissions it is now recommended that organisations use the International Civil Aviation Organization (ICAO) calculator. The latest emission factors for air travel from Department for Business, Energy & Industrial Strategy in the United Kingdom are still published if an organisation wishes to use these.
Waste – emission factors for waste to landfill with methane capture have been updated based on the latest data on landfill gas collection rates for the 2014 calendar year. The mixed waste factor has been updated based on national average composition data from New Zealand’s Greenhouse Gas Inventory 1990-2014 (published in May 2016).
Note: this guide is solely for use in voluntary greenhouse gas reporting, and should not be used for reporting under the New Zealand Emissions Trading Scheme.
1 An explanation of scope 1, 2 and 3 emissions are provided in section 2.2 of this guidance.
Guidance for Voluntary, Corporate Greenhouse Gas Reporting iii

Contents
1 Guidance on reporting 11.1 Introduction 11.2 Who is this guide intended for? 11.3 Why is this information not for use in an emissions trading scheme? 21.4 What standards should I follow to report emissions? 2
1.4.1 What do the GHG Protocol and ISO 14064-1 cover? 21.4.2 What is the difference between these standards? 3
1.5 What information do I need? 31.6 Verification 3
1.6.1 Should I have my emissions inventory verified? 31.6.2 Who should verify my inventory? 4
2 Emission factors and methods – context 52.1 Timing of emission factors and annual reporting 62.2 The concept of ‘scope’ 6
3 Emission factors and methods 83.1 Scope 1: Direct emissions 8
3.1.1 Stationary combustion of fuels 83.1.2 Transport fuels where fuel use data is available 103.1.3 Transport where no fuel data is available (based on distance travelled) 113.1.4 Taxis and rental cars 133.1.5 Refrigerants 14
3.2 Scope 2: Electricity indirect emissions 153.2.1 Purchased electricity 15
3.3 Scope 3: Other indirect emissions 163.3.1 Transmission and distribution line losses for purchased electricity 163.3.2 Transmission and distribution losses for distributed natural gas 173.3.4 Air travel 183.3.5 Waste to landfill 19
4 References 22
Appendix A: Derivation of fuel emission factors 23
Appendix B: Methods for calculating emissions from refrigeration 26
Appendix C: Derivation of emission factors for waste to landfill 35
Appendix D: Landfills with gas collection systems 37
iv Guidance for voluntary, corporate greenhouse gas reporting

TablesTable 1: Fuel combustion emission factors (fuels used for stationary combustion) 8Table 2: Fuel combustion emission factors (transport fuels) 10Table 3: Transport emission factors (based on distance travelled) 12Table 4: Emission factors for travel in taxis and rental cars 13Table 5: Emission factor for the consumption of purchased electricity 15Table 6: Transmission and distribution line losses for purchased electricity 16Table 7: Transmission and distribution losses for distributed natural gas 17Table 9: Emission factors for air travel (based on distance travelled) – 2014 18Table 10: Emission factors for waste to landfill 21Table 11: Underlying data used to derive the fuel combustion emission factors – 2014 24Table 12: Global warming potentials for CO2, CH4 and N2O (100-year time horizon) 25Table 13: Default refrigerant charges and emission factors for refrigeration and air
conditioning equipment 29Table 14: Detailed 100-year global warming potentials for various refrigerant mixtures 30Table 15: Derivation of emission factors for waste deposited to landfill 36Table 16: Landfills with gas collection systems 37
Guidance for Voluntary, Corporate Greenhouse Gas Reporting v

1 Guidance on reporting
1.1 IntroductionThis guide has been prepared for voluntary greenhouse gas (GHG) reporting, including emission factors.
The guide encourages best practice in GHG reporting and supports voluntary GHG reporting initiatives. It endorses the referenced reporting frameworks such as The GHG Protocol and provides information (emission factors and methods) to enable organisations to apply them.
This guide will be regularly updated to maintain consistency with international best practice and the New Zealand Government’s national GHG inventory reporting.
1.2 Who is this guide intended for?This guide is for organisations that wish to voluntarily report GHG emissions on an organisational basis (sometimes called ‘corporate’ or ‘entity’ level) for their New Zealand operations.
This guide does not represent, or form part of, any mandatory reporting framework or scheme.
The emission factors and methods contained in this guide are for common emission sources for commercial organisations. This guide, however, also applies to industrial organisations that wish to voluntarily report on the same emission sources.
These emission factors and methods are not appropriate for a full life-cycle assessment; or for the purposes of complying with the British Standards Institution PAS 2050 product carbon footprinting standard; or with the draft International Organization of Standardization (ISO) 14067 standard on the carbon footprint of products. These factors are not appropriate for life-cycle assessment as they only include direct emissions from activities, and do not include all sources of emissions required for a full life-cycle analysis.
The United Kingdom Department for Business, Energy & Industrial Strategy publish emission factors for a number of emission sources that take into account the life cycle of those activities.2 In addition, The GHG Protocol Initiative has published standards for the calculation of life-cycle emissions.3
2 https://www.gov.uk/government/collections/government-conversion-factors-for-company-reporting. 3 http://www.ghgprotocol.org/standards/product-standard.
Guidance for voluntary greenhouse gas reporting 1

1.3 Why is this information not for use in an emissions trading scheme?
The information in this guide is intended to help organisations that want to report GHG emissions on a voluntary basis. Organisations that are required to participate in a mandatory emissions trading scheme (ETS) will need to comply with the reporting requirements specific to that scheme. The rules and regulations of those schemes will determine which emission factors and methods must be used to calculate and report emissions.
Organisations with obligations to report greenhouse gases under mandatory schemes (including emissions trading), or who choose to participate in voluntary GHG emission reporting schemes, should check the rules and requirements of those schemes.
The information in this guide may, however, be useful to organisations that have a reporting obligation under an emissions trading scheme for a particular activity but still wish to publish comprehensive emission reports for their organisation on a voluntary basis. Although this reporting would not constitute compliance with an emissions trading scheme, it may help organisations prepare for, or understand how, an emissions trading scheme might impact on their business.
1.4 What standards should I follow to report emissions?
The Ministry for the Environment (the Ministry) recommends organisations use the Greenhouse Gas Protocol: A Corporate Accounting and Reporting Standard (The GHG Protocol) or ISO 14064-1:2006 Greenhouse gases – Part 1 Specification with guidance at the organisation level for quantification and reporting of greenhouse gas emissions and removals (ISO 14064-1).
The GHG Protocol is a standard developed jointly by the World Resources Institute (WRI) and the World Business Council for Sustainable Development (WBCSD). It is available at http://www.ghgprotocol.org/standards/corporate-standard.
The ISO 14064-1 standard is published by the International Standards Organisation. This standard is closely based on The GHG Protocol.
The Ministry for the Environment endorses both The GHG Protocol and ISO 14064-1 for voluntary corporate GHG reporting.
1.4.1 What do the GHG Protocol and ISO 14064-1 cover?These standards provide comprehensive guidance on the core issues of GHG monitoring and reporting at an organisational level, including: principles underlying monitoring and reporting setting organisational boundaries
2 Guidance for voluntary greenhouse gas reporting
setting operational boundaries establishing a base year managing the quality of a GHG inventory content of GHG reports.
1.4.2 What is the difference between these standards?ISO 14064-1 is a shorter, more direct document than The GHG Protocol, which is more descriptive and discusses, for example, motivational reasons for reporting GHG emissions. ISO 14064-1 refers users to The GHG Protocol for further detail on some issues.
In general, those choosing to report against the ISO standard would find The GHG Protocol useful for providing context.
1.5 What information do I need?To report emissions, organisations require a method of converting data they gather about activities (eg, vehicle travel) in their organisation into information about their emissions (measured in tonnes of carbon dioxide (CO2) equivalent). These methods involve using ‘emission factors’. An emission factor allows GHG emissions to be estimated from a unit of available activity data (eg, litres of fuel consumed).
Emission factors are available from a number of sources (including from the GHG Protocol Initiative website). However, there has been demand for the Ministry to publish a consistent list of emission factors and methods (how the emission factors should be applied) specifically for common corporate emission sources in New Zealand.
This guide draws on technical information provided by New Zealand government agencies, and presents it in a form suitable for voluntary, corporate GHG reporting. It also uses some international data where New Zealand-specific information is not available.
This guide provides emission factors and methods for common emission sources, for the 2016 calendar year. The Ministry will update the information on emission factors annually.
This guide also details how these emission factors were derived and assumptions surrounding their use.
1.6 Verification
1.6.1 Should I have my emissions inventory verified?The term ‘verification’ is generally used to refer to scrutiny by a suitably qualified, independent body or person to confirm the extent to which an emissions inventory is a fair representation of the actual situation.
Guidance for voluntary greenhouse gas reporting 3

Verification provides you and your stakeholders with confidence about the accuracy of an emissions inventory. If an emissions inventory is intended for public release, then the Ministry for the Environment recommends that organisations obtain independent verification of the inventory to confirm that calculations are accurate, and the correct methodology has been followed.
1.6.2 Who should verify my inventory?An accreditation framework has been developed by the Joint Accreditation System of Australia and New Zealand (JAS-ANZ) which accredits verifiers to the ISO 14065 standard. This confirms that these verifiers are suitably qualified and enables them to certify an inventory as being prepared in accordance with ISO 14064-1.4
The Ministry recommends that organisations use verifiers who: are independent are members of a suitable professional organisation can demonstrate they have experience with emissions inventories understand ISO 14064 and The GHG Protocol have effective internal peer review and quality control procedures.
Organisations that have achieved the status of designated operational entity (DOE) and/or accredited independent entity (AIE) under the Kyoto Protocol framework will have experience in verifying GHG emission reductions on a project basis.5 While verification of GHG emission reductions from projects is a different task than verification of organisation-level GHG emissions inventories, there are many similarities. Providers who have achieved DOE or AIE status will have many of the competencies required to verify emissions inventories.
Verification should be undertaken by independent organisations who can demonstrate they have experience with emissions inventories, ISO 14064 - 1 and The GHG Protocol.
4 Accredited bodies under the JAS-ANZ Register may be found at: www.jas-anz.org/index.php?option=com_content&task=blogcategory&id=44&Itemid=1.
5 A list of DOEs can be found at http://cdm.unfccc.int/DOE/list/index.html.
4 Guidance for voluntary greenhouse gas reporting

2 Emission factors and methods – context
The emission factors reported in this guide are intended to be default factors (ie, to be used in the absence of better company or industry-specific information). They are designed to be consistent with the reporting requirements of ISO 14064-1 and The GHG Protocol. The emission factors are also designed to be aligned with the emission factors used for the Ministry’s national GHG inventory reporting.
The purpose of providing these emission factors is to:
collate an official set of annually updated emission factors for voluntary corporate reporting
present emission factors in an easy-to-use form which will facilitate reporting by organisations
provide guidance on a consistent approach to choosing emission factors for financial-year and calendar-year reporting.
These emission factors are largely derived from technical information published by New Zealand government agencies. For example, the Ministry of Business, Innovation and Employment is the main source of information for the stationary combustion and electricity emission factors. Each section provides the source for each emission factor and how the factors are derived.
This guidance covers the six direct Kyoto gases (CO2, CH4, N2O, HFCs, PFCs and SF6) covered by ISO 14064-1 and The GHG Protocol. This is also consistent with the reporting requirements for New Zealand’s national GHG inventory.
Greenhouse gases (GHGs) vary in their radiative activity and atmospheric residence time. This means that different GHGs have different global warming potentials (GWPs). To enable a meaningful comparison between gases, GHG emissions are commonly expressed as carbon dioxide equivalent or CO2-e. The emission factors in this guide therefore convert activity data into the equivalent estimate of CO2-e per unit of activity data (eg, kg CO2-e/litre of petrol).
Under the reporting requirements of ISO 14064-1 and The GHG Protocol, GHG emissions should be reported in tonnes CO2-e. However, many emission factors are too small to be reported meaningfully in tonnes, therefore guidance presents emission factors in kg CO2-e per unit. Division by 1000 converts kg to tonnes (see example calculations on the following pages).
The emission factors contained in the main body of this guidance have been calculated using GWPs sourced from the IPCC’s Fourth Assessment Report (IPCC AR4), published in 2007. This is to achieve consistency of the data with New Zealand’s Greenhouse Gas Inventory 1990 – 2014 that follows the UNFCCC reporting guidelines for international climate change reporting, which are mandatory for the Annex I Parties.
In line with the reporting requirements of ISO 14064-1, the emission factors allow calculation of CO2, CH4 and N2O separately, as well as the total CO2 equivalent for Scope 1 emission sources (discussed in Section 2.2).
Guidance for voluntary greenhouse gas reporting 5

Carbon dioxide emission factors are based on the carbon and energy content of a fuel therefore the CO2 emissions remain constant regardless of the way in which a fuel is combusted. However, CH4 and N2O (ie, non-CO2) emissions depend on the manner in which the fuel is being combusted. The emission factors for CH4 and N2O therefore vary depending on the combustion process.6 To reflect this variability, the guidance provides uncertainty estimates for Scope 1 emission factors. Separate CO2-e emission factors for residential, commercial and industrial users are presented in table 1. The relevant Ministry of Business, Innovation and Employment publication describes assumptions made.
As well as providing common emission factors, the Ministry considers it useful to illustrate how these emission factors have been derived. Appendix A discusses and provides an example of how the emission factors have been calculated. The accompanying Microsoft Excel workbook also provides further details on how the emission factors were calculated.
2.1 Timing of emission factors and annual reporting
Many emission factors will rely on a review of historical data. The 2014 calendar year’s emission factors are used in this guide, following the release of the Energy Greenhouse Gas Emissions, Energy in New Zealand and New Zealand’s Greenhouse Gas Inventory publications.
Organisations can choose to report on a calendar- or financial-year basis.
Calendar year: If you are reporting on a calendar-year basis, then the latest published emission factors should be used. For example if you are reporting emissions for the 2016 calendar year then you should use the 2016 guidance.
Financial year: If you are reporting on a financial-year basis, then you should use the guidance which the greatest portion of your data falls in. For example if you are reporting for the 2016/2017 financial year you should use the 2016 guidance.
2.2 The concept of ‘scope’The GHG Protocol categorises emission sources into Scope 1, Scope 2 and Scope 3 activities as follows:
Scope 1: Direct GHG emissions occurring from sources that are owned or controlled by the company (ie, sources within the organisational boundary). For example, emissions from combustion of fuel in owned or controlled vehicles. The GHG Protocol and ISO 14064-1 require Scope 1 emissions to be reported.
Scope 2: Indirect GHG emissions occurring from the generation of purchased electricity consumed by the company. The GHG Protocol and ISO 14064-1 require Scope 2 emissions to be reported.
Scope 3: Other indirect GHG emissions occurring as a consequence of the activities of the company, but generated from sources not owned or controlled by the company (eg,
6 For example, the CH4 and N2O emission factors for diesel used for industrial heating are different to the CH4 and N2O emission factors for diesel used in vehicles.
6 Guidance for voluntary greenhouse gas reporting
emissions from air travel). Under the reporting framework of The GHG Protocol and ISO 14064-1, Scope 3 is an optional reporting category that allows for the treatment of all other indirect emissions. The GHG Protocol states that Scope 3 emissions should be reported if they are 1) significant in the context of the whole inventory, 2) material to stakeholders, and 3) easy to deduce.
Section 3 of this guide presents emission factors according to each category of activity.
Guidance for voluntary greenhouse gas reporting 7

3 Emission factors and methods
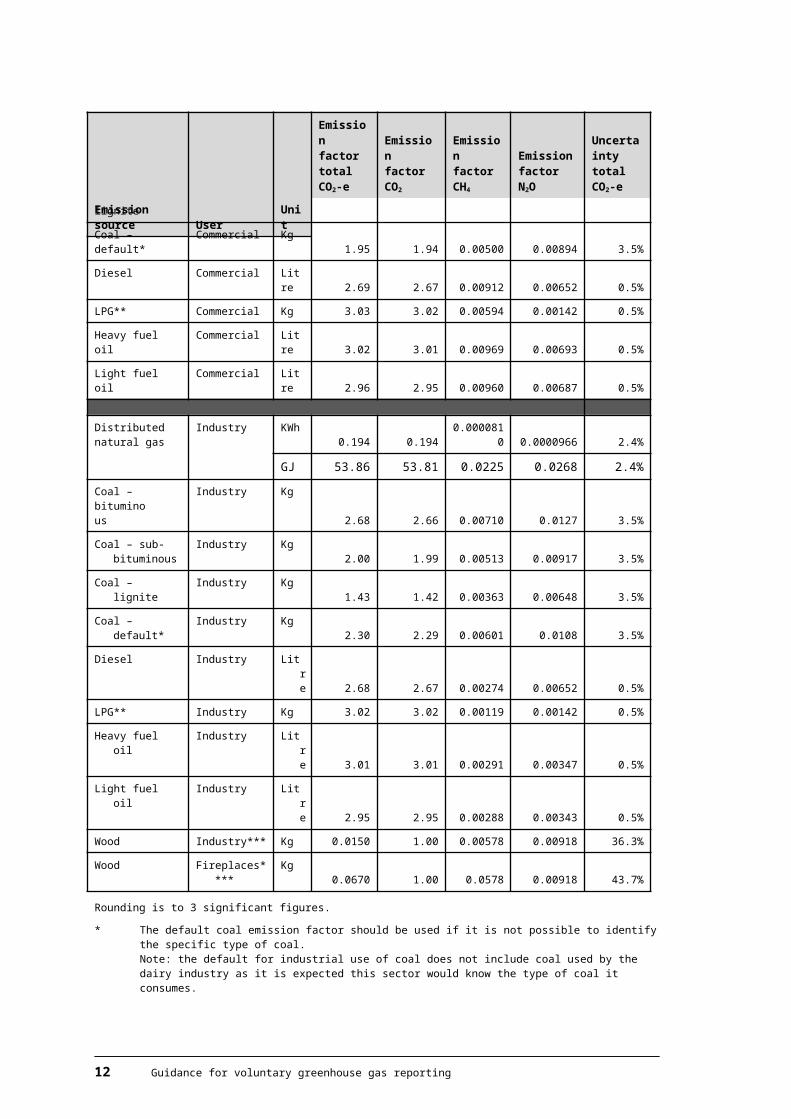
3.1 Scope 1: Direct emissions3.1.1 Stationary combustion of fuelsScope 1 emissions occur from the combustion of fuels from sources owned or controlled by the reporting organisation. Table 1 contains emission factors for common fuels used for stationary combustion.
In line with the reporting requirements of ISO 14064-1 and The GHG Protocol, emission factors are provided to allow calculation of CO2, CH4 and N2O separately.
Table 1: Fuel combustion emission factors (fuels used for stationary combustion)
Emission source User Unit
Emission factor total CO2-e
Emission factor CO2
Emission factor CH4
Emission factor N2O
Uncertainty total CO2-e
(kg CO2-e/unit)
(kg CO2/unit)
(kg CO2-e/unit)
(kg CO2-e/unit) (%)
Stationary combustion
Coal – bituminous Residential Kg 2.89 2.66 0.213 0.0127 4.9%
Coal – sub-bituminous
Residential Kg2.15 1.99 0.154 0.00917 4.8%
Coal – lignite Residential Kg 1.54 1.42 0.109 0.00648 4.8%
Coal – default* Residential Kg 1.91 1.77 0.136 0.00813 4.8%
Distributed natural gas
Commercial KWh 0.194 0.194 0.000405 0.0000966 2.4%
GJ 53.9 53.8 0.113 0.0268 2.4%
Coal – bituminous Commercial Kg 2.68 2.66 0.00710 0.0127 3.5%
Coal – sub-bituminous
Commercial Kg2.00 1.99 0.00513 0.00917 3.5%
Coal – lignite Commercial Kg 1.43 1.42 0.00363 0.00648 3.5%
Coal – default* Commercial Kg 1.95 1.94 0.00500 0.00894 3.5%
Diesel Commercial Litre 2.69 2.67 0.00912 0.00652 0.5%
LPG** Commercial Kg 3.03 3.02 0.00594 0.00142 0.5%
Heavy fuel oil Commercial Litre 3.02 3.01 0.00969 0.00693 0.5%
Light fuel oil Commercial Litre 2.96 2.95 0.00960 0.00687 0.5%
Distributed natural gas
Industry KWh 0.194 0.194 0.0000810 0.0000966 2.4%
GJ 53.86 53.81 0.0225 0.0268 2.4%
Coal – bituminous
Industry Kg2.68 2.66 0.00710 0.0127 3.5%
Coal – sub-bituminous
Industry Kg2.00 1.99 0.00513 0.00917 3.5%
8 Guidance for voluntary greenhouse gas reporting
Emission source User Unit
Emission factor total CO2-e
Emission factor CO2
Emission factor CH4
Emission factor N2O
Uncertainty total CO2-e
Coal – lignite Industry Kg 1.43 1.42 0.00363 0.00648 3.5%
Coal – default* Industry Kg 2.30 2.29 0.00601 0.0108 3.5%
Diesel Industry Litre 2.68 2.67 0.00274 0.00652 0.5%
LPG** Industry Kg 3.02 3.02 0.00119 0.00142 0.5%
Heavy fuel oil Industry Litre 3.01 3.01 0.00291 0.00347 0.5%
Light fuel oil Industry Litre 2.95 2.95 0.00288 0.00343 0.5%
Wood Industry*** Kg 0.0150 1.00 0.00578 0.00918 36.3%
Wood Fireplaces**** Kg 0.0670 1.00 0.0578 0.00918 43.7%
Rounding is to 3 significant figures.
* The default coal emission factor should be used if it is not possible to identify the specific type of coal. Note: the default for industrial use of coal does not include coal used by the dairy industry as it is expected this sector would know the type of coal it consumes.
** LPG-use data in litres can be converted to kilograms by multiplying by the specific gravity of 0.536 kg/l.
*** It is not expected that many commercial or industrial users will burn wood in fireplaces but this emission factor has been provided for completeness. It is the default residential emission factor.
**** The total CO2-e emission factor for wood only includes CH4 and N2O emissions. This is based on ISO 14064-1 and The GHG Protocol reporting requirements for combustion of biomass as Scope 1 emissions. CO2 emissions from the combustion of biologically sequestered carbon are reported separately.
Participants in the New Zealand Emissions Trading Scheme (NZ ETS) are required to use emission factors provided in the emissions trading regulations covering their particular sector, or in some cases may apply for Unique Emissions Factors. Emission factors used in the NZ ETS may differ from the factors provided in this guide. For example, emission factors for coal in this guide are given in terms of kilograms of coal used, because this is the most accessible information for most coal users. In the NZ ETS, coal is measured in terms of its energy content, and participants carry out analysis to ensure they know the heating value of the coal they use.
AssumptionsThe kg CO2-e per activity unit emission factors supplied in table 1 are derived by the Ministry of Business, Innovation and Employment using calorific values. The calorific values used can be found in appendix A.
All emission factors include the effect of relevant oxidation factors. Oxidation factors allow for the small proportion of carbon that remains unoxidised due to incomplete combustion, and remains as soot and ash.The emission factors provided above account for the Scope 1 emissions resulting from fuel combustion. They are not full fuel cycle emission factors and do not incorporate Scope 3 emissions associated with the extraction, production and transport of the fuel.
The default coal emission factor is calculated by weighting the emission factors for the different ranks of coal (bituminous, sub-bituminous and lignite) by the amount of coal used for each sector (commercial, residential, industrial). Emission factors for residential coal have been included for completeness.
Guidance for voluntary greenhouse gas reporting 9
Example calculation*A commercial organisation uses 1400 kg of LPG to heat one of its office buildings in 2016.
CO2 emissions = 1400 x 3.02 = 4228 kg CO2
CH4 emissions = 1400 x 0.00594= 8.316 kg CO2-eN2O emissions = 1400 x 0.00142 = 1.988 kg CO2-eTotal CO2-e emissions = 1400 x3.03 = 4242 kg CO2-e
* note numbers may not add due to rounding
3.1.2 Transport fuels where fuel use data is availableScope 1 emissions from transport occur from vehicles which are owned or controlled by the reporting organisation. The most accurate way to quantify the emissions associated with transport is by using information on the quantity of fuel used.
Emission factors for combustion of transport fuels are reported in table 2. The emission factors are provided by the Ministry of Business, Innovation and Employment.
Table 2: Fuel combustion emission factors (transport fuels)
Fuel Unit
Emission factor
Emission factor Emission factor
Emission factor
Uncertainty total CO2-e
total CO2-e CO2 CH4 N2O (%)
(kg CO2-e/unit)
(kg CO2/unit) (kg CO2-e/unit)
(kg CO2-e/unit)
Regular petrol litre 2.44 2.33 0.0246 0.0793 1.8
Premium petrol
litre2.43 2.33 0.0247 0.0797 1.8
Petrol – default*
litre2.43 2.33 0.0246 0.0794 1.8
Diesel litre 2.72 2.67 0.00356 0.0424 0.9
LPG litre 1.64 1.60 0.0391 0.0015 1.3
Heavy fuel oil litre 3.04 3.01 0.00678 0.0231 0.6
Light fuel oil litre 2.98 2.95 0.00672 0.0229 0.6
* The default petrol emission factor should be used if it is not possible to distinguish between regular and premium petrol use.
AssumptionsThe kg CO2-e per activity unit emission factors supplied in table 2 are derived by the Ministry of Business, Innovation and Employment using calorific values. All emission factors incorporate relevant oxidation factors which are sourced from The IPCC Guidelines for National Greenhouse Gas Inventories (IPCC, 2006).
The default petrol factor is a weighted average of regular and premium petrol based on 2014 sales volume data from the Energy in New Zealand 2016 publication (MBIE, 2016). It should be used when petrol use data does not distinguish between regular and premium petrol.
10 Guidance for voluntary greenhouse gas reporting

No estimates have been included for marine diesel for the 2014 year as the refinery has stopped making the marine diesel blend. If an organisation was using marine diesel it is now likely to be using light fuel oil instead so the emission factor for light fuel oil should be used.
As with the fuels for stationary combustion these emission factors are not full fuel cycle emission factors and do not incorporate the Scope 3 emissions associated with the extraction, production and transport of the fuel.
Example calculation*An organisation has 15 petrol vehicles. They used 40,000 litres of regular petrol in 2016.
CO2 emissions = 40,000 x 2.33 = 93,200 kg CO2
CH4 emissions = 40,000 x 0.0246= 984 kg CO2-eN2O emissions = 40,000 x 0.0793= 3,172 kg CO2-eTotal CO2-e emissions = 40,000 x 2.44 = 97,600kg CO2-e
* note numbers may not add due to rounding
3.1.3 Transport where no fuel data is available (based on distance travelled)
If your records only provide information on kilometres travelled, and you do not have information on fuel-use, the emission factors based on distance travelled shown in table 3 can be used to calculate emissions from transport. However, factors such as individual vehicle fuel efficiency and driving efficiency mean that kilometre-based estimates of CO2-e emissions are less accurate than calculating emissions based on fuel-use data. The emission factors in table 3, based on distance travelled, should therefore only be used if information on fuel use is not available.
Guidance for voluntary greenhouse gas reporting 11

Table 3: Transport emission factors (based on distance travelled)
Vehicle Class Size * Unit
Emission factor Total CO2-e(kg CO2-e/unit)
Emission factor CO2
(kg CO2/unit)
Emission factor CH4
(kg CO2-e/unit)
Emission factor N2O(kg CO2-e/unit)
Car - (<1350 cc) Km 0.198 0.190 0.00200 0.00647
Car - (1350 - <1600 cc) Km 0.190 0.182 0.00192 0.00620
Car - (1600 - <2000 cc) Km 0.209 0.200 0.00211 0.00681
Car - (2000 - <3000 cc) Km 0.237 0.227 0.00239 0.00772
Car - (3000 - <4000 cc) Km 0.278 0.266 0.00280 0.00905
Petrol hybrids (<2000 cc)** Km 0.102 0.098 0.00103 0.00334
Petrol hybrids (2000 - <4000cc)** Km 0.146 0.140 0.00148 0.00478
Car - Default *** Km 0.209 0.200 0.00211 0.00681
* Example (representative) vehicle models for each of the size classes are: Small = Toyota Echo, Medium = Honda Accord, Large = Holden Commodore.
** Energy Efficiency and Conservation Authority (EECA) data
*** The default emission factor should be used if vehicle size class cannot be determined.
AssumptionsThe above emission factors in table 3 assume that all representative vehicles use petrol. The emission factors are derived by multiplying the default petrol emission factor from table 2 by ‘real world’ fuel consumption rates7 for the petrol light vehicle fleet (based on vehicle fleet statistics from the Ministry of Transport). ‘Real world’ fuel consumption rates take into account ‘real world’ effects such as driver behaviour. Due to lack of data, it is not currently possible to derive ‘real world’ fuel consumption rates for vehicles which use other fuels (eg, diesel, LPG). The above CO2-e emission factors should therefore be applied to all vehicles (for which only kilometre travelled information is available), regardless of the type of fuel used.
The above emission factors are averages and therefore do not reflect the variability in fuel consumption rates between individual vehicles.
The default emission factor (for vehicles of unknown size) is the same as that for a 2000 - <3000cc vehicle.8
7 Real world fuel consumption rates for non-hybrids are based off Wang et al, Real-world fuel efficiency of light vehicles in New Zealand. Hybrid vehicles are based off fuel consumption values provided by the Energy Efficiency and Conservation Authority (EECA).
8 In 2014, 38 per cent of new light petrol vehicles sold in New Zealand were in the 2000 – 3000 cc category. (Source: Ministry of Transport 2016 NZ vehicle fleet annual statistics).
12 Guidance for voluntary greenhouse gas reporting

Example calculation*An organisation has three vehicles which it owns. They are all between 1600 and 2000 cc and travelled a total of 37,800 km in 2016.
CO2 emissions = 37,800 x 0.200 = 7,560 kg CO2
CH4 emissions = 37,800 x 0.00211= 79.76 kg CO2-eN2O emissions = 37,800 x 0.00681= 257.4 kg CO2-eTotal CO2-e emissions = 37,800 x 0.209 = 7,900 kg CO2-e
* note numbers may not add due to rounding
3.1.4 Taxis and rental carsBusiness travel in taxis and rental cars is likely to be a common source of Scope 3 emissions for most businesses. As with Scope 1 emissions from transport, the most accurate way to calculate emissions is based on fuel consumption data. However, this information may not be easily available, particularly for business travel in taxis. Table 4 provides emission factors for rental car and taxi travel, based on kilometres travelled, as well as an emission factor for taxi travel based on dollars spent.
At this point of time there are no emissions factors available for electric vehicles by distance travelled.
Table 4: Emission factors for travel in taxis and rental cars
Emission Source UnitEmission factor Total CO2-e(kg CO2-e/unit)
Rental car - (<1350 cc) Km 0.198Rental car - (1350 - <1600 cc) Km 0.190Rental car - (1600 - <2000 cc) Km 0.209Rental Car - (2000 - <3000 cc) Km 0.237Rental car - (3000 - <4000 cc) Km 0.278Rental car - Petrol hybrid (<2000cc) Km 0.102Rental car - Petrol hybrid (2000- <4000cc) Km 0.146Rental car - Default * Km 0.209Taxi travel - Distance travelled Km 0.200Taxi travel - Dollars spent (GST inclusive) $ 0.067
* The default emission factor should be used if the vehicle size class of rental cars cannot be determined.
AssumptionsThe emission factors and underlying assumptions for taxis and rental cars are the same as those found in table 3 (emission factors based on distance travelled).
The default emission factor for rental cars is the same as that for vehicles in the 1600 - <2000 cc category. Data from the Motor Industry Association New Vehicle Sales database showed that for the calendar year period 2013–2015, an average of 43 per cent of rental vehicles purchased were in this category.
Guidance for voluntary greenhouse gas reporting 13

The default emission factor for taxis is the average of the 1350 - < 1600 and the 1600 - <2000 categories from table 3. Data from the Motor Industry Association New Vehicle Sales database showed that for the calendar year period 2013–2015, an average of 65 per cent of petrol taxis purchased were in this engine size class.
The dollars spent emission factor is based on a national average figure of $3 per kilometre travelled. This figure is sourced from Taxicharge New Zealand and includes GST.
Example calculationAn organisation uses rental cars to travel 12,000 km in 2014. It also spends $18,000 on taxi travel.
Total CO2-e emissions from rental cars = 12,000 x 0.209 = 2508 kg CO2-eTotal CO2-e emissions from taxi travel = $18,000 x0.067 = 1206 kg CO2-e
3.1.5 RefrigerantsGreenhouse Gas (GHG) emissions from hydrofluorocarbons (HFCs) are associated with unintentional leaks and spills from refrigeration units, air conditioners and heat pumps. While quantities of HFCs reported in a business emissions inventory may be small, HFCs have very high global warming potentials (commonly 1300 to 3300 times more potent than CO2) and emissions from this source may therefore be material. In addition, emissions associated with this sector are growing significantly as they replace chlorofluorocarbons (CFCs) and hydrochlorofluorocarbons (HCFCs).
Scope 1 emissions from refrigeration occur from refrigeration units which are owned or controlled by the reporting organisation. If the unit is leased, associated emissions should be reported under Scope 3 emissions.
Emissions of HFCs are not calculated using emission factors; rather they are determined by estimating leakage from refrigerant equipment. Maintenance engineers can be asked to provide the actual amounts that are used to top up equipment (ie, to replace what has leaked). The Ministry recommends three alternative methods for estimating leakage, depending on the equipment and available information. Details of these three methods are available in Appendix B.
If you consider it likely your emissions from refrigerant equipment and leakage is a significant proportion of your total emissions (ie, greater than 5 per cent), then you should include them in your emissions inventory. You may need to carry out a preliminary screening test to determine materiality.
CFCs and HCFCs can have very high global warming potentials (up to 14,400 times as potent as CO2 over 100 years). However, they are not included in GHG inventories as they are already being phased out through the Montreal Protocol on Substances that Deplete the Ozone Layer. The GHG Protocol includes direct emissions of CFCs and HCFCs as optional reporting categories under Scope 3 emissions. Global warming potentials for CFCs and HCFCs can be found on page 212 of the IPCC’s publication, Contribution of Working Group I to the Fourth Assessment Report of the Intergovernmental Panel on Climate Change, 2007.9 HCFC R22 is the
9 Available at www.ipcc.ch/pdf/assessment-report/ar4/wg1/ar4-wg1-chapter2.pdf.
14 Guidance for voluntary greenhouse gas reporting
predominant HCFC used in New Zealand and its global warming potential is included in the tables in Appendix B for convenience.
3.2 Scope 2: Electricity indirect emissions3.2.1 Purchased electricityAn emission factor for the consumption of purchased electricity (by end users) is calculated on a calendar-year basis, and accounts for the emissions from fuel combustion at thermal power stations. It also includes a relatively small proportion of fugitive emissions from geothermal generation.
The emission factor for the consumption of purchased electricity and the emission factor for transmission and distribution line losses have been aligned with the definitions used in The GHG Protocol.
The electricity emission factor covers purchased electricity which has been bought from an electricity supplier who sources its electricity from the national grid.10
Table 5: Emission factor for the consumption of purchased electricity
Emission source UnitEmission factor total CO2-e(kg CO2-e/unit)
Purchased electricity kWh 0.119
AssumptionsAs with the fuels for stationary combustion emission factors, this emission factor does not incorporate emissions associated with the extraction, production and transport of the fuels burnt to produce electricity.
This emission factor does not account for the emissions associated with the electricity lost in transmission and distribution on the way to the end user. Under the reporting framework of The GHG Protocol the emissions associated with transmission and distribution line losses are Scope 3 emissions. Table 6 contains an emission factor for transmission and distribution line losses.
The emission factor in table 5 for purchased electricity is derived from the net electricity generation data (as opposed to consumption data) in Energy in New Zealand (MBIE, 2016). This is explained in more detail in the section below covering transmission and distribution line losses.
Notes on the use of electricity emission factorsThe emission factor provided in table 5 for purchased electricity is an average over the calendar year to which the emission factor relates. It is used for reporting the annual emissions associated with the consumption of purchased electricity.
10 It does not cover on-site, self-generation of electricity.
Guidance for voluntary greenhouse gas reporting 15

A grid-average emission factor best reflects the CO2-e emissions associated with the generation of a unit of electricity, purchased from the national grid, in New Zealand in 2014. Retailer specific electricity factors for grid electricity are out of scope for this guidance.
The grid-average emission factor cannot be used for calculating abatement by intervention or reducing the use of thermal generation (eg, for an offset project). A marginal emission factor is more appropriate in these circumstances, because it is designed to take into account the change in electricity generation at the margin.
Example calculationAn organisation uses 800,000 kWh of electricity in 2016. Its Scope 2 emissions from electricity are:
Total CO2-e emissions = 800,000 x 0.119 = 95,200 kg CO2-e
3.3 Scope 3: Other indirect emissions
3.3.1 Transmission and distribution line losses for purchased electricity
This emission factor accounts for emissions from the additional generation required to make up for electricity lost in the transmission and distribution network due to inefficiencies in the grid. Under The GHG Protocol reporting framework, emissions from the generation of electricity that is consumed in a transmission and distribution system should be reported as a Scope 3 emission by end users.
The emission factor for transmission and distribution line losses is the difference between the generation and consumption emission factors. The emission factor for the 2014 calendar year is shown in table 6.
Table 6: Transmission and distribution line losses for purchased electricity
Emission source Unit
Emission factor total CO2-e
(kg CO2-e/unit)
Transmission and distribution losses for purchased electricity kWh 0.0097
AssumptionsThis emission factor covers grid-purchased electricity, bought by an end user. It is an average figure and therefore makes no allowance for distance from off-take point, or other factors that may vary between individual consumers.11
This emission factor does not incorporate the emissions associated with the extraction, production and transport of the fuels burnt to produce the electricity.As with all emissions factors for purchased electricity emissions factors for transmission and distribution line losses are calculated as a national average.11 Major electricity users need to be aware that a losses allowance may already be included in their
electricity invoices.
16 Guidance for voluntary greenhouse gas reporting

Example calculationAn organisation uses 800,000 kWh of electricity in 2016. Its Scope 3 emissions from transmission and distribution line losses for purchased electricity are:
Total CO2-e emissions = 800,000 x 0.0097 = 7,760 kg CO2-e
3.3.2 Transmission and distribution losses for distributed12 natural gas
The transmission and distribution losses emission factor for distributed natural gas, accounts for fugitive emissions from the transmission and distribution system. These emissions occur during the delivery of the gas to the end user.
The emission factor for transmission and distribution losses for distributed natural gas is derived from information from the Ministry of Business, Innovation, and Employment in the Energy Greenhouse Gas Emissions 2016 and Energy in New Zealand 2016 publications.
Table 7: Transmission and distribution losses for distributed natural gas
Emission source Unit13Emission factor total CO2-e(kg CO2-e/unit)
Transmission and distribution losses for distributed natural gaskWh 0.0229
GJ 6.36
AssumptionsThese emission factors represent an estimate of the average amount of CO2-e emitted from losses associated with the delivery (transmission and distribution) of each unit of gas consumed through local distribution networks in 2014. They are average figures and therefore make no allowance for distance from off-take point, or other factors that may vary between individual consumers.
The figures assume that all losses are attributable to gas consumed via local distribution networks. A small amount (<1 per cent) of emissions is attributable to losses occurring from delivery of gas to consumers who are directly connected to a high-pressure transmission pipeline. These emission factors are therefore appropriate for use by customers who receive their gas through a local distribution network. They are not intended for customers who receive gas directly from the transmission system, or directly from a gas producer via high-pressure transmission lines.
These emission factors do not cover the emissions associated with the extraction and production of the gas.
12 ‘Distributed’ refers to natural gas distributed via low pressure, local distribution networks.13 Emission factors are presented based on gas used in both kWh and GJ. Use whichever one matches
the unit used in your natural gas consumption data.
Guidance for voluntary greenhouse gas reporting 17

Example calculationAn organisation uses 800 gigajoules of distributed natural gas in 2016. Its Scope 3 emissions from transmission and distribution losses are:
Total CO2-e emissions = 800 x 6.36 = 5088 kg CO2-e
3.3.4 Air travelOrganisations wishing to report their air travel emissions, based on distance travelled per passenger should use the International Civil Aviation Organization (ICAO) calculator. This calculator takes into account factors such as aircraft types and load factors for specific airline routes. This calculator is available at: http://www.icao.int/ENVIRONMENTAL-PROTECTION/CarbonOffset/Pages/default.aspx If organisations wish to not use the ICAO calculator we recommend that organisation use the emission factors provided in Table 9. The emission factors provided follow those published online by the UK Department for Business, Energy & Industrial Strategy in its 2016 UK Government Conversion Factors for Company Reporting.14 These are deemed to be the most suitable emission factors currently available. The UK Department for Business, Energy & Industrial Strategy’s publication discusses the emission factor methodology in more detail, including changes in the methodology over time.
Table 9: Emission factors for air travel (based on distance travelled) – 2014
Emission Source Unit
Emission factor Total CO2-e
Cabin Class (kg CO2-e/unit)
Domestic Average pkm* 0.147
Short Haul International (<3700 km) Average pkm 0.0891
Economy class pkm 0.0873
Business class pkm 0.131
Long Haul International (>3700 km) Average pkm 0.0946
Economy class pkm 0.0725
Premium economy class pkm 0.116
Business class pkm 0.210
First class pkm 0.290
* person kilometres
AssumptionsThe emission factors contained in table 8 are based on UK and European data. The domestic emission factor should be applied to all domestic flights within New Zealand; the short haul emission factor to international flights less than 3700 km; and the long haul emission factor should be applied to any flights greater in length than 3700 km.
14 https://www.gov.uk/government/publications/greenhouse-gas-reporting-conversion-factors-2016
18 Guidance for voluntary greenhouse gas reporting

The specified emission factors for different cabin classes should be used where information is available. The average emission factors can be applied where the cabin classes taken are unknown.
The UK Department for Business, Energy & Industrial Strategy endorses a great circle distance uplift factor to take into account non-direct (ie, not along the straight-line/great-circle between destinations) routes and delays/circling. The eight per cent uplift factor applied by UK Department for Business, Energy & Industrial Strategy is based on the analysis of flights arriving and departing from the UK. This figure is likely to be overstated in New Zealand (initial estimates from Airways New Zealand is that this figure is likely to be less than five per cent). However, in the absence of a New Zealand-specific figure it is recommended those wishing to take a conservative approach apply a nine per cent uplift factor. The value of nine per cent comes from an Intergovernmental Panel on Climate Change (IPCC) publication Aviation and the Global Atmosphere (refer to section 8.2.2.3), and is based on studies on penalties to air traffic associated with the European ATS Route Network. The nine percent uplift factor can be applied by multiplying the factors in table 8 by 1.09.
The emission factors refer to aviation’s direct carbon dioxide (CO2), methane (CH4), and nitrous oxide (N2O) emissions only. There is currently uncertainty over the other non-CO2 climate change effects of aviation (including water vapour, contrails and NOx) which have been estimated by the IPCC to be up to two to four times those of CO2 alone. However, the science in this area is currently uncertain and a multiplier is not used for New Zealand’s national GHG inventory reporting. As the emission factors contained in this guide are intended to be consistent with New Zealand’s national GHG inventory reporting, it is not currently deemed appropriate to apply a multiplier to account for other aviation gases and effects.
Air travel factors are calculated on the basis of the area of the plane each passenger takes up. If a plane is comprised totally of business-class seats, as opposed to more closely packed economy class seats, fewer passengers can fly. Therefore, each passenger takes a larger share of the emissions.
Example calculationAn organisation makes five flights from Auckland to Shanghai (9308 km each way). On the first occasion two people flew return to Shanghai on the same flight in economy class. On the second occasion three people flew return to Shanghai and the cabin classes were not recorded. The total person kilometres travelled was 93,080 km.
For the two people who travel economy class:Person kilometres travelled = 2 × 9308 × 2 = 37,232 pkmTheir CO2-e emissions from air travel = 37,232 x 0.0725 = 2,699 kg CO2-e
For the three people whose travel classes are unknown:Person kilometres travelled = 3 × 9308 × 2 = 55,848 pkm
Their CO2-e emissions from air travel = 55,848 x 0.0946 = 5,283 kg CO2-e
Total CO2-e emissions from air travel = 2,699 + 5,283 = 7,982 kg CO2-e
3.3.5 Waste to landfillThe emission factors and methodologies provided in this section will help organisations in estimating their emissions from waste disposed of at a landfill. Emission factors are based on
Guidance for voluntary greenhouse gas reporting 19

figures from New Zealand’s Greenhouse Gas Inventory 1990–2014 (published in May 2016) and methodologies are derived from the IPCC good practice guidance. The base methodology used is termed ‘tier 1’ under the IPCC 2006 guidelines and allows all the potential emissions in a tonne of waste to be accounted for in the year of disposal.
Methodologies to determine emissions from wastewater treatment and solid waste incineration are not covered by this guide, as emissions are assumed to be negligible at the individual organisation level (with some exceptions for large industrial wastewater producers).
The anaerobic decomposition of organic waste in landfills generates methane (CH4). Inventories should be adjusted to account for the landfill gas that is collected and destroyed.15 The methodologies outlined below provide for such adjustment depending on whether an organisation’s waste is sent to a landfill with (or without) a landfill gas collection system. A list of landfills with landfill gas systems is provided in appendix D which includes whether or not the collected gas is flared. If the gas is flared then the organisation should use the without gas recovery emission factor.
MethodologiesTwo methodologies for determining a solid waste emission factor are provided. Choice of methodology depends on organisational knowledge of waste composition. It is preferable to know the composition of waste as it allows emissions to be more accurately quantified.16
Table 10 provides methodologies for four scenarios where composition of an organisation’s waste is / is not known, and is sent to a landfill that has / does not have a landfill gas collection system.
If the organisation has data on individual waste streams, but doesn’t know if the waste is going to a landfill with a gas collection system, then the default should be the factors for ‘without landfill gas recovery’ (ie, overestimate rather than potentially underestimate emissions).
If the organisation does not know the composition of its waste but knows it is going to a landfill with a gas recovery system, then it should use the default ‘mixed waste’ emission factor found in table 10 unless it is an office-based organisation. Note that this will be an inaccurate emission factor at the organisation level, as it assumes the organisation’s waste matches the national average mixed municipal waste composition. If an organisation has an advanced diversion system (to recycling and composting) then this methodology will overestimate emissions. If an organisation has no diversion system, then it could underestimate emissions.
Default emission factors for ‘office waste’ are provided in table 9. These should be used by office-based organisations that do not have information on the composition of their waste. The higher emission factors reflect the higher proportion of organic matter (eg, paper and food) found in office waste. The default office waste emission factors assume no diversion has occurred so if an organisation has an advanced diversion system then this methodology will overestimate emissions.
15 Where CH4 is recovered and flared or combusted for energy, the CO2 emitted from the combustion process is regarded as part of the natural carbon cycle.
16 It also allows you to take into account reductions in emissions from altering the composition of your waste (as opposed to just reducing your waste). For example, reducing the amount of paper going to landfill will result in a significantly lower emission factor for waste.
20 Guidance for voluntary greenhouse gas reporting

Table 10: Emission factors for waste to landfill
Emission source Unit
Emission factor total CO2-e
(Kg CO2-e/unit)
Landfilled waste of known composition (without landfill gas recovery)
Paper and textiles kg 3.00
Garden and food kg 1.13
Wood kg 3.23
Landfilled waste of known composition (with landfill gas recovery)
Paper and textiles kg 1.183
Garden and food kg 0.444
Wood kg 1.272
Landfilled waste – default values (without landfill gas recovery)
Mixed waste (national average) kg 1.13
Office waste kg 1.84
Landfilled waste – default values (with landfill gas recovery)
Mixed waste (national average) kg 0.444
Office waste kg 0.726
Emission factors for plastics, metals and glass are not presented here because their decomposition does not directly produce GHG emissions. Only organic waste produces methane as it breaks down.
AssumptionsThe default emission factor for mixed waste is based on national average composition data from New Zealand’s annual GHG inventory.
The emission factors for office waste represent an assumed default composition (paper 54 per cent, garden and food 21 per cent, and wood 0 per cent) for office waste, based on waste data from government buildings.
The derivations of all the emission factors in table 10 are set out in Appendix C.
Example calculationAn organisation disposes of 30 tonnes of garden waste to a landfill with a gas recovery system in 2016.
Total CO2-e emissions from waste to landfill = 30,000 x 0.444 = 13,320 kg CO2-e = 13.32 tonnes CO2-e.
Guidance for voluntary greenhouse gas reporting 21

4 ReferencesDepartment for Environment Food and Rural Affairs. 2013. UK Government Conversion Factors for Company Reporting. Retrieved from http://www.ukconversionfactorscarbonsmart.co.uk/
Hennessy, W. 2008. Assessment of HFC Emission Factors for GHG Reporting Guidelines. Prepared for the Ministry for the Environment by CRL Energy Ltd. Wellington: Ministry for the Environment.
Intergovernmental Panel on Climate Change. 2006. IPCC Guidelines for National Greenhouse Gas Inventories. Retrieved from http://www.ipcc-nggip.iges.or.jp/public/2006gl/index.html
Intergovernmental Panel on Climate Change. 2007. Contribution of Working Group I to the Fourth Assessment Report of the Intergovernmental Panel on Climate Change, 2007. Retrieved from http://www.ipcc.ch/publications_and_data/ar4/wg1/en/contents.html (November 2011)
International Organization for Standardization. 2006. ISO 14064-1:2006. Greenhouse gases – Part 1 Specification with guidance at the organization level for quantification and reporting of greenhouse gas emissions and removals. Retrieved from http://www.iso.org/iso/catalogue_detail?csnumber=38381(November 2011)
Ministry of Business, Innovation, and Employment. 2016. Energy Greenhouse Gas Emissions 2015. Wellington: Ministry of Business, Innovation and Employment. Retrieved from http://www.mbie.govt.nz/info-services/sectors-industries/energy/energy-data-modelling/publications/energy-greenhouse-gas-emissions/?searchterm=greenhouse%20gases%2A
Ministry of Business, Innovation and Employment. 2016. Energy in New Zealand 2016. Wellington: Ministry of Business, Innovation and Employment. Retrieved from http://www.mbie.govt.nz/info-services/sectors-industries/energy/energy-data-modelling/publications/energy-in-new-zealand
Real-world fuel efficiency of light vehicles in New Zealand. 2015. Wang H, McGlinchy I, Badger S, Wheaton S. Ministry of Transport. Retrieved from http://atrf.info/papers/2015/files/ATRF2015_Resubmission_9.pdf
World Business Council for Sustainable Development/World Resources Institute. 2004. Greenhouse Gas Protocol: A Corporate Accounting and Reporting Standard. Retrieved from http://www.ghgprotocol.org/standards
World Resources Institute and World Business Council for Sustainable Development. 2005. Greenhouse Gas Protocol HFC Tool: Calculating HFC and PFC Emissions from the Manufacturing, Installation, Operation and Disposal of Refrigeration and Air-conditioning Equipment (version 1.0) Workbook and Guide. Retrieved from http://www.ghgprotocol.org/calculation-tools/all-tools
22 Guidance for voluntary greenhouse gas reporting

Appendix A: Derivation of fuel emission factors
Importance of calorific valueBecause the energy content of fuels may vary within and between fuel types, emission factors are commonly expressed in terms of energy units (eg, tonnes CO2/TJ). This generally provides more accurate emissions estimates than if emission factors are expressed in terms of mass or volume. Converting to emission factors expressed in terms of mass or volume (eg, kg CO2-e/litre) requires an assumption around which default calorific value should be used.
It is therefore useful to show how the per-activity unit (eg, kg CO2-e/litre) emission factors have been derived, and which calorific values have been used. It is important to note that if you are able to obtain fuel use information in energy units, or know the specific calorific value of the fuel which you are using, then you can calculate your emissions more accurately. All calorific values have been provided by the Ministry of Business, Innovation, and Employment. Calorific values are provided in the Energy in New Zealand 2016 publication, but some calorific values used here have been updated since that publication.
Note that gross calorific values have been used.
CH4 and N2O emission factors used in this guideAlthough CO2 emissions remain constant regardless of the way in which a fuel is combusted, CH4 and N2O emissions depend on the precise nature of the activity in which the fuel is being combusted. The emission factors for CH4 and N2O therefore vary depending on the combustion process. Table 10 shows the default CH4 and N2O emission factors (expressed in terms of energy units) which have been used in this guide. The calculations below show how these have been converted to per activity unit (eg, kg CO2-e/kg) emission factors. All emission factors contained in table 10 have been provided by the Ministry of Business, Innovation, and Employment.
Note that gross emission factors have been used.
Oxidation factors used in this guideAll oxidation factors used are sourced from the IPCC Guidelines for National Greenhouse Gas Inventories (2006). Oxidation factors have only been applied to the CO2 emission factors (and therefore by default to the CO2-e emission factors) and have not been applied to the CH4 and N2O emission factors. This approach is consistent to that adopted by New Zealand’s national GHG inventory.
Guidance for voluntary greenhouse gas reporting 23
Reference dataTable 11: Underlying data used to derive the fuel combustion emission factors – 2014
Emission source User Unit
Calorific value T CO2/TJ
T CH4/TJ T N2O/TJ(MJ/unit) (after oxidation)Stationary combustionCoal – bituminous
Residential Kg29.87 89.13 0.285 0.00143
Coal – sub-bituminous
Residential Kg21.59 91.99 0.285 0.00143
Coal – lignite Residential Kg 15.27 93.11 0.285 0.00143Distributed natural gas
Commercial
KWh NA 0.19 0.0000162 0.000000324GJ NA 53.81 0.0045 0.0000900
Coal – bituminous
Commercial
Kg29.87 89.13 0.0095 0.00143
Coal – sub-bituminous
Commercial
Kg21.59 91.99 0.0095 0.00143
Coal – lignite Commercial
Kg15.27 93.11 0.0095 0.00143
Diesel Commercial
Litre38.40 69.58 0.0095 0.00057
LPG Commercial
Kg50.00 60.43 0.00475 0.000095
Heavy fuel oil Commercial
Litre40.81 73.72 0.0095 0.00057
Light fuel oil Commercial
Litre40.44 72.84 0.0095 0.00057
Distributed natural gas
Industry KWh NA 0.19 0.00000324 0.000000324GJ NA 53.81 0.0009 0.00009
Coal – bituminous
Industry Kg29.87 89.13 0.0095 0.00143
Coal – sub-bituminous
Industry Kg21.59 91.99 0.0095 0.00143
Coal – lignite Industry Kg 15.27 93.11 0.0095 0.00143Diesel Industry Litre 38.40 69.58 0.00285 0.00057LPG Industry Kg 50.00 60.43 0.00095 0.000095Heavy fuel oil Industry Litre 40.81 73.72 0.00285 0.000285Light fuel oil Industry Litre 40.44 72.84 0.00285 0.000285Wood Industry Kg 9.63 104.15 0.024 0.0032Wood Fireplaces* Kg 9.63 104.15 0.24 0.0032Transport fuelsRegular petrol Mobile use Litre 35.01 66.61 0.0281 0.0076Premium petrol Mobile use Litre 35.18 66.12 0.0281 0.0076Diesel Mobile use Litre 38.40 69.58 0.00371 0.00371LPG Mobile use Litre 26.54 60.43 0.0589 0.00019Marine diesel Mobile use Litre - - - -Heavy fuel oil Mobile use Litre 40.81 73.72 0.00665 0.0019Light fuel oil Mobile use Litre 40.44 72.84 0.00665 0.0019
Table 11 contains the GWPs for CO2, CH4 and N2O that have been used in converting to CO2 equivalent emission factors, based on the IPCC’s Forth Assessment Report (2007).
24 Guidance for voluntary greenhouse gas reporting
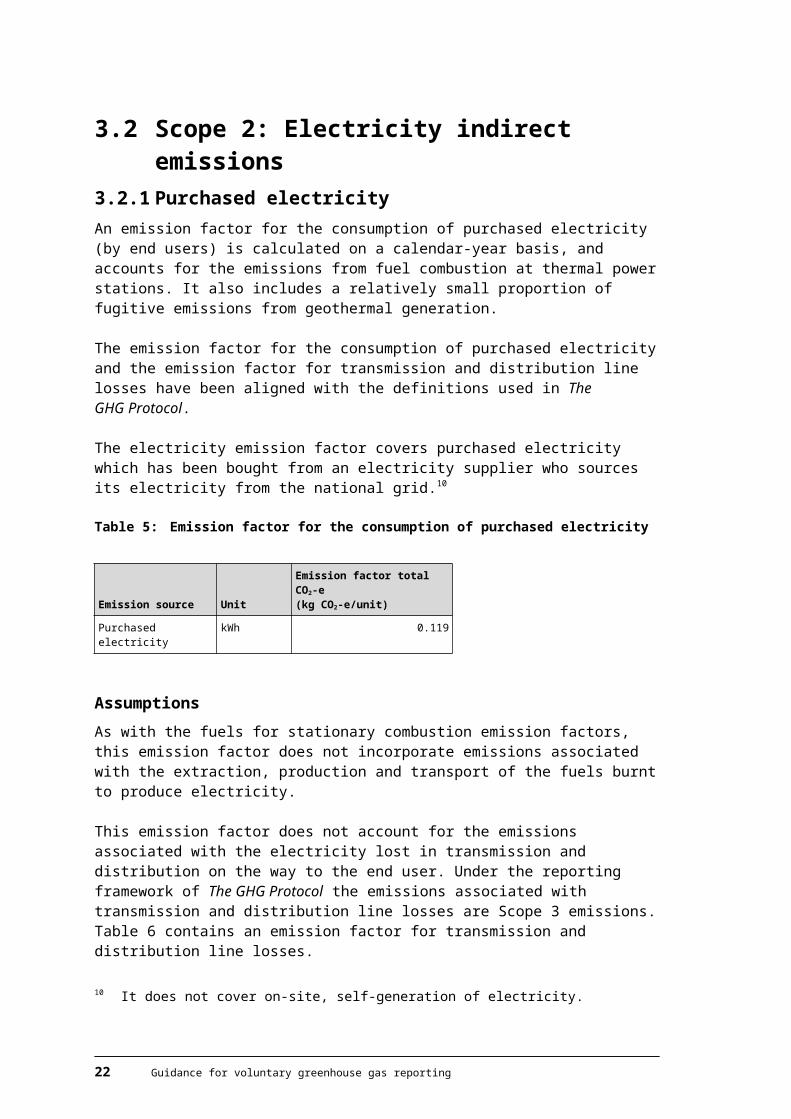
Table 12: Global warming potentials for CO2, CH4 and N2O (100-year time horizon)
Example derivation of emission factorsThe sub-bituminous coal emission factors for commercial use are derived as follows:17
CO2 emission factor (kg CO2/kg)18 = (Calorific value xTCO2 per TJ emission factor)/1000
= (21.59x91.99)/1000= 1.99 kg CO2/kg coal
CH4 emission factor (kg CO2-e/kg) = [(Calorific value x TCH4 per TJ emission factor) x GWP of CH4]/1000
= [(21.59 x 0.0095) x 25]/1000= 0.00513 kg CO2-e/kg
N2O emission factor (kg CO2-e/kg) = [(Calorific value*TN2O per TJ emission factor)*GWP of N2O]/1000
= [(21.59 x 0.00143) x 298]/1000= 0.00920 kg CO2-e/kg
Total CO2-e emission factor (kg CO2-e/kg) = Sum of CO2, CH4 and N2O emission factors= 2.00 CO2-e/kg
Note that if you know the calorific value of your coal, you could substitute your specific calorific value and obtain a more accurate (specific) emission factor.
17 Note that some values may not multiply or add exactly as they have been rounded.18 Tonnes CO2/TJ = kg CO2/GJ. Division by 1000 converts this to kg CO2/MJ, consistent with the
calorific value (MJ/unit of activity).
Guidance for voluntary greenhouse gas reporting 25
CO2 CH4 N2O
Global warming potential 1 25 298

Appendix B: Methods for calculating emissions from refrigeration
Greenhouse Gas (GHG) emissions from hydrofluorocarbons (HFCs) are associated with unintentional leaks and spills from refrigeration units, air conditioners and heat pumps. While quantities of HFCs reported in a business emissions inventory may be small, HFCs have very high global warming potentials (commonly 1300 to 3300 times more potent than CO2) and emissions from this source may therefore be material. In addition, emissions associated with this sector are growing significantly as they replace CFCs and HCFCs.
Scope 1 emissions from refrigeration occur from refrigeration units which are owned or controlled by the reporting organisation. If the unit is leased, associated emissions should be reported under Scope 3 emissions.
MethodologiesThree approaches can be taken to assess HFC leakage from refrigeration equipment. The approach taken is dependent upon the type of equipment you are performing the calculation for and the level of information available to you (see the section “Choosing a Method” below).
Method A – Life-cycle stage approach
E = (IE + S + DE) x GWP
Where:E = emissions from the piece of equipment in kg CO2-e (per year)IE = installation emissions (refrigerant used to charge new equipment less the total full
charge19 of new equipment. This is omitted if the equipment has been pre-charged by the manufacturer)
S = recorded quantity of refrigerant used to service equipment, also referred to as a ‘top-up’
DE = disposal emissions (total full charge of retiring equipment less the refrigerant recovered from retiring equipment)
GWP = the 100-year global warming potential of the refrigerant used in equipment (table 24).
This approach is detailed in The GHG Protocol HFC tool (WRI/WBCSD, 2005). This method requires service agents’ advice being sought for the following information on each piece of equipment, truck or bus operated by the organisation:1. refrigerant type2. full refrigerant charge3. quantity used in installation of new equipment4. quantity used in servicing5. quantity recovered from retired equipment.
The equations for installation, operation and disposal emissions are explained in more detail in The GHG Protocol HFC tool guide.19 ‘Total full charge’ refers to the full, original charge of the equipment rather than to the actual charge,
which may reflect leakage.
26 Guidance for voluntary greenhouse gas reporting

Method B – Default annual leakage rate
E = (IE + OE + DE) x GWP
Where:E = emissions from equipment in kg CO2-eIE = installation emissions (as applicable – see above)OE = operation emissionsDE = disposal emissions (as applicable – see above)GWP = the 100-year global warming potential of the refrigerant used in equipment (table 24).
IE = C x AEFC = original full refrigerant charge in equipment (kg)AEF = the default installation leakage for new equipment (%). This is omitted if the
equipment has been pre-charged by the manufacturer
OE = C x ALRC = original full refrigerant charge in equipment (kg)ALR = the default annual leakage emission factor for equipment (%).
DE = (C x (1 – (ALR x S)) x (1 – R) – D)C = original full refrigerant charge in equipment (kg)ALR = the default leakage for equipment (%)S = time since last recharge of equipment (years)R = amount of charge recycled from equipment (%)D = amount of refrigerant destroyed from equipment (kg)
Default leakage rates for calculation of installation (IE) and operating emissions (OE) are contained in table 12. When calculating disposal emissions (DE), a value of zero (ie, no recycling or destruction) must be assumed if the amount of recycled (R) or destroyed (D) refrigerant is unknown.
The type and quantity of HFC contained in the equipment will often be shown on the equipment compliance plate. If not, then this method requires service agents’ advice being sought for refrigerant type and full refrigerant charge of each piece of equipment operated by the organisation.
Method C – Default annual leakage rate and default refrigerant charge
E = (IE +(C x ALR) +DE) x GWP
Where:E = emissions from equipment in kg CO2-eIE = installation emissions (as per method B)C = default refrigerant charge in each piece of equipment (kg)ALR = default annual leakage emission factor for equipment (%)DE = disposal emissions (as per method B)GWP = the 100-year global warming potential of the refrigerant used in equipment (table 24)
Guidance for voluntary greenhouse gas reporting 27

Method C is the same as Method B except that it allows default refrigerant quantities to be used as well as default leakage rates. Table 12 contains default refrigerant amounts for the New Zealand refrigeration and air-conditioning equipment stock.
Choosing a methodThe most accurate methodology is Method A – the life-cycle stage approach. The information required can be collected with the help of service agents, vehicle fleet managers or building managers. Currently however, these quantities are seldom recorded but it would be good practice to encourage service agents to record these amounts for future reporting. If an organisation determines that emissions from equipment are significant then it should endeavour to move to a Method A approach to estimate HFC emissions.
In some circumstances, gathering the information required for Method A may not be possible or, due to the resource intensive nature of collecting detailed information for a particular type of equipment, may not be justifiable. If so, then Method B and C can be used in some circumstances (refer to guidance in table 12) to measure leakage rates with the default factors also provided in table 12. Method B and C are based on the ‘screening’ method approach contained in The GHG Protocol HFC tool (WRI/WBCSD, 2005).
In some cases, Method C is only suitable for investigating the approximate quantity of emissions when the refrigerant charge amount is unavailable. Screening provides a way of determining if the equipment should/should not be excluded based on significance of emissions from refrigerants. However, sometimes, depending on the equipment in question, Methods B and C would be so unreliable that they would be unacceptable even for a screening method.
Apart from office refrigerators, water coolers and car/van air conditioning, Method A should be considered the recommended method (see table 12). For most equipment, Method B would be acceptable, especially for factory and office situations where refrigeration and air-conditioning equipment is incidental rather than central to an organisation’s operations.
For supermarket refrigeration, commercial air conditioning (above 20kW), dairy farming, industrial, commercial and laboratory cool stores, the size ranges and configurations are so varied there will be no meaningful default refrigerant charge amounts or emission factors. In these cases, there would be no reasonable alternative to Method A, relying on the leakage information available from service agents.
It is stressed that for all equipment for all methods, the type of refrigerant must be individually identified because the global warming potential of various refrigerant mixes are widely variable (see table 13).
Organisations should also provide information on the approach used to quantify direct HFC emissions in their inventories to reflect the different levels of associated accuracy and uncertainty with each method.
28 Guidance for voluntary greenhouse gas reporting

Table 13: Default refrigerant charges and emission factors for refrigeration and air conditioning equipment
Refrigerationunit type
Default refrigerant
charge (kg)
Default leakage
rate (operating –
ALR)
Default leakage rate (installation
– AEF)20
Guidance on method choice
Method A Method B Method C
Small refrigerator or freezer(up to 150 litres21)
0.07 3% Not applicable
Unnecessary Recommended Acceptable
Medium refrigerator or freezer(up to 300 litres)
0.11 3% Not applicable
Unnecessary Recommended Acceptable
Large refrigerator or freezer(more than 300 litres)
0.15 3% Not applicable
Unnecessary Recommended Acceptable
Small commercial stand-alone chiller (up to 300 litres)
0.25 8% Not applicable
Recommended Acceptable Screening method only
Medium commercial stand-alone chiller (up to 500 litres)
0.45 8% Not applicable
Recommended Acceptable Screening method only
Large commercial stand-alone chiller (more than 500 litres)
0.65 8% Not applicable
Recommended Acceptable Screening method only
Small commercial stand-alone freezer (up to 300 litres)
0.2 8% Not applicable
Recommended Acceptable Screening method only
Medium commercial stand-alone freezer (up to 500 litres)
0.3 8% Not applicable
Recommended Acceptable Screening method only
Large commercial stand-alone freezer (more than 500 litres)
0.45 8% Not applicable
Recommended Acceptable Screening method only
Water coolers 0.04 3% Not applicable
Unnecessary Recommended Acceptable
Dehumidifiers 0.17 3% Not applicable
Unnecessary Recommended Acceptable
Small self-contained air conditioners (window mounted or through-the-wall)
0.2kg per kW cooling
capacity
1% 0.5% Recommended Acceptable Screening method only
Non-ducted and ducted split commercial air conditioners(up to 20kW)
0.25kg per kW cooling
capacity
3% 0.5% Recommended Acceptable Screening method only
Commercial air conditioning(above 20kW)
wide range Wide range Wide range Recommended Unacceptable Unacceptable
Cars/vans 0.7 10% Not applicable
Unnecessary Recommended Acceptable
20 In the absence of consistent information for New Zealand, the default assumption for the assembly (installation) emissions rate is the rounded-off IPCC 2006 mid-range value. It is not applicable (relevant) for many pre-charged units.
21 Internal dimensions up to 100x50x30cm for 150 litres; 150x50x40cm for 300 litres; 200x50x50cm for 500 litres.
Guidance for voluntary greenhouse gas reporting 29

Refrigerationunit type
Default refrigerant
charge (kg)
Default leakage
rate (operating –
Default leakage rate (installation
– AEF)
Guidance on method choice
Method A Method B Method C
Trucks 1.2 10% Not applicable
Recommended Acceptable Screening method only
Buses 2.5 (but up to 10)
10% Not applicable
Recommended Acceptable Screening method only
Refrigerated truck trailer units
10 25% 0.5% Recommended Acceptable Unacceptable
Self-powered or ‘cab-over’ refrigerated trucks
6 25% 0.5% Recommended Acceptable Unacceptable
‘Off-engine’ or ‘direct drive’ refrigerated vans and trucks
2.5 25% 0.5% Recommended Acceptable Unacceptable
Three-phase refrigerated containers
5.5 25% 0.5% Recommended Acceptable Unacceptable
Single-phase refrigerated containers
3 25% 0.5% Recommended Acceptable Unacceptable
Centralised commercial refrigeration eg, supermarkets
Wide range Wide range Wide range Recommended Unacceptable Unacceptable
Industrial and commercial cool stores
Wide range Wide range Wide range Recommended Unacceptable Unacceptable
Table 14: Detailed 100-year global warming potentials for various refrigerant mixtures22
Refrigerant type (trade name)HFC-23
HFC-32
HFC-125
HFC-134a
HFC-143a
HFC-152a
PFC-218 Other*
Total GWP
GWP 100yr (IPCC, 2007) 14800 675 3500 1430 4470 124 8830 0
R22 (HCFC-22) 100% 1810
R23 100% 14800
R134a 100% 1430
R403B: 5% R290, 56% R22, 39% R218 39% 61% 3444
R404A: 44% R125, 52% R143a, 4% R134a
44% 4% 52% 3922
R407C: 23% R32, 25% R125, 52% R134a
23% 25% 52% 1774
R408A: 7% R125, 46% 143a, 47% R22 7% 46% 47% 2301
R410A: 50% R32, 50% R125 50% 50% 2088
R413A: 9% R218, 88% R134a, 3% R600a
88% 9% 3% 2053
R416A: 59% R134a, 39.5% R124,1.5% R600
59% 41% 844
R417A: 46.6% R125 50% R134a 3.4% R600
46.6% 50% 3.4% 2346
R422A: 85.1% R125, 11.5% R134a, 3.4% R600a
85.1% 11.5% 3.4% 3143
R507A: 50% R125, 50% R143a 50% 50% 3985
22 Global warming potentials are set according to the 2006 IPCC Guidelines for National Greenhouse Gas Inventories, Intergovernmental Panel on Climate Change http://www.ipcc.ch/.
30 Guidance for voluntary greenhouse gas reporting

AssumptionsThe default factors for installation, operation and disposal of refrigerant equipment supplied in table 12. They are derived from a report from CRL Energy Limited to the Ministry for the Environment on the Assessment of HFC Emission Factors for GHG Reporting Guidelines (2008). These are based on data for New Zealand refrigeration and air-conditioning equipment stock.
In the absence of consistent information for New Zealand, the default assumption for the assembly emissions rate is the rounded-off IPCC 2006 mid-range value. This will not be applicable (relevant) for many pre-charged units.
For simplicity, the default operating emission factor does not take account of the variability associated with equipment age.
The greatest potential for significant emissions from refrigeration and air-conditioning equipment is in the disposal stage of the life cycle. Recycling efficiency is likely to be high (around 90 per cent) for reputable service agents. However, in the absence of consistent information for New Zealand, the default assumption is 0 per cent recycling/destruction of the remaining charge in all sectors. There is no current justification for applying a lower default emission factor to any sector to reflect refrigerant gas collection for destruction. Refrigerants are often recycled within various sectors but the quantity currently shipped to Australia for destruction is relatively small.
Example calculationsA detailed example has been provided below.
Company A performs a stocktake of refrigeration-related equipment and identifies the following units:
two office refrigerators
one large commercial-sized refrigerator
one air conditioning unit (which is retired in the reporting year and replaced by a new model)
two mobile air-conditioning (MAC) units in the company-owned car and delivery truck
one delivery truck owned by the company
two external delivery trucks operated by another company, but included in Scope 3 emissions.
To assess its emissions, the company takes the following approach for each type of equipment.
Two office refrigeratorsMethod B is the recommended approach and is relatively easy for newer equipment in this sector because compliance plates for refrigerators and freezers are nearly always accessible inside the fridge. (Alternatively, a Method C approach is acceptable, though less accurate, for refrigerant charges based on table 1.)
Compliance plates inside the two large refrigerators confirm the refrigerant is R134A and the refrigerant amounts are 0.17 kg each.
Guidance for voluntary greenhouse gas reporting 31
Using Method B approach:
E = (IE + OE + DE) x GWP
E = 2(0 + (0.17 x 3/100) + 0) x 1430
E = 2(0+0.0051+0) x 1430
E = 15 kg CO2-e
One large commercial-sized refrigeratorMethod A is the recommended approach to capture the significant leakage rates for commercial-sized refrigerators. The company’s service agents have maintained refrigerant top-up records for each piece of equipment at the company’s request.
The large commercial refrigerator unit uses R404A refrigerant and the compliance plates show the refrigerant amount is 1.7 kg. Maintenance records for the refrigeration unit show it has been topped up by the service agent during the year with 0.32 kg.
Using Method A:
E = (IE + S + DE) x GWP
E= (0 + 0.32 + 0) x 3922
E= 1255 kg CO2-e
One commercial air-conditioning unitMethod A is recommended for all commercial air-conditioning units with the cooperation of service agents. Method B would be acceptable for all systems up to 20 kW but above that rating, refrigerant amounts and leakage rates are so site-specific there is no acceptable alternative to a Method A approach. Method C could be used as a screening test (table 1) where the HFC refrigerant amount is not specified and the cooling capacity (up to 20 kW) is known.
The old air-conditioning system for the company’s building (using R407C HFC refrigerant [GWP 1774]) was retired and replaced in August of the 2007 reporting (calendar) year. The service agent did the annual servicing in January 2007, topping up the old system with 1.1 kg R407C to return it to the full charge of 8.5 kg (a high annual leakage rate of 13 per cent). This represents the leakage for the current accounting year even though most of it would have occurred in the previous year. The service agent records show that 6.8 kg (80 per cent) of the original charge in the old equipment was collected for destruction (because its quality was too degraded for recycling).23
The service agent records show that 7.1 kg of R410A was used to fill the new air-conditioning system. The full charge of the system is 7.0 kg of R410A (GWP 2088). Therefore 0.1 kg of R401A was lost during installation. No top-up was required in the reporting year for the new system. Any leakage from August to December would not be accounted for until the following year if it is not topped up until the following January.
23 This example is unlikely to happen for a few years until the relatively recent R407C and R410A equipment are being retired. R22 is more likely to be the retired refrigerant currently and this is omitted from the accounting because it is not a HFC.
32 Guidance for voluntary greenhouse gas reporting
Using Method A approach:
E = (IE +S+DE) x GWP24
Installation emissions (IE) = refrigerant used to charge new equipment – total full charge of new equipment
= (7.1 – 7.0) x 2088= 209 kg CO2-e
Servicing emissions (S) = quantity of refrigerant used to service old equipment= 1.1 x 1774= 1951 kg CO2-e
Disposal emissions (DE) = total full charge of retiring equipment – refrigerant recovered from retiring equipment
= (8.5 – 6.8) x 1774= 3016 kg CO2-e
E = 209 + 1951 + 3016= 5176 kg CO2-e
Mobile air conditioning (MAC)Method A is recommended for trucks and buses with the cooperation of service agents. Method B is recommended for cars and vans (and acceptable for trucks and buses) because information on refrigerant amounts should be relatively straightforward for service agents to gather during maintenance. Method C (see table 1) is acceptable for cars and vans and can be used as a screening test for trucks and buses until a regular fleet monitoring scheme is established. This is the case for the company at this stage.
The company owns one delivery truck and one car that are fitted with MAC units. It uses R134A refrigerant (GWP 1430).
Using Method C:Operation emissions (truck) = (1.2 x 10/100 x 1430) = 172(car) = 0.7 x 10/100 x 1300) = 91
172 +100 = 263 kg CO2-e
Refrigerated transportMethod A is recommended due to the high potential for leakage from this sector. Where this is not practical (high turnover of a large number of refrigerated trucks or containers), a Method B approach is acceptable.
The company owns one refrigerated truck. It is a larger, self-powered unit (6 litres) and the compliance plates show R404A refrigerant (GWP 3922). Service agents have topped up the refrigerant twice over the year to a total of 1.32 kg. The organisation also accounts for two large, three-phase refrigerated containers it operates that are owned by a contractor – one uses
24 As global warming potentials are different for the air-conditioning units they are calculated separately here.
Guidance for voluntary greenhouse gas reporting 33

R22 and one R404A. The R22 refrigerated container is not included in the inventory. It is unable to collect service data and therefore uses Method B to estimate emissions.
Using Method A for Scope 1:
Operation emissions = S x GWP= 1.32 x 3922= 5177 kg CO2-e
Using Method B for Scope 3:
Operation emissions = (C x ALR) x GWP= (5.5 x 25/100) x 3922= 5393 kg CO2-e
Therefore, total emissions for the company for refrigeration are:
Scope 1 kg CO2-e
Office refrigeration 15
Large commercial sized refrigerator 1255
Commercial air-conditioning unit 5176
Mobile air conditioning (MAC) 263
Refrigerated transport 5177
SCOPE 1 TOTAL 11886
Scope 3
Refrigerated transport 5393
SCOPE 3 TOTAL 5393
34 Guidance for voluntary greenhouse gas reporting

Appendix C: Derivation of emission factors for waste to landfill
Base equationThe base equation used in deriving the waste emission factors, as taken from the 2006 IPCC Guidelines for National Greenhouse Gas Inventories (IPCC, 2006), is as follows:
CO2-e emissions (kg) =
((MSWT x DOC x DOCF x F x 16/12) x (1– R) x (1-OX)) x 25
Where: MSWT = total Municipal Solid Waste (MSW) generated (kg); DOC = degradable organic carbon; DOCF = fraction of DOC dissimilated; F = fraction of CH4 in landfill gas; R = fraction recovered CH4; OX = oxidation factor; 25 = GWP of methane (CH4).
MSWT = Activity dataDOC = 0.40 for paper and textiles, 0.15 for garden and food waste, and 0.43 for woodDOCF = 0.5F = 0.516/12 – convert carbon to CO2
R = 0.606 where landfill gas systems are in place, 0 otherwiseOX = 0.1
Table 14 shows how this equation has been applied to derive the emission factors for waste deposited to landfill.
Guidance for voluntary greenhouse gas reporting 35

Table 15: Derivation of emission factors for waste deposited to landfill
Emission sourceUnit
Emission factor total CO2-e(Kg CO2-e/unit) Equation
Landfilled waste of known composition (without landfill gas recovery)
Paper and textiles kg 3.00 (0.40 * 0.5 * 0.5 * 16/12) * (1-0.1) * 25
Garden and food kg 1.13 (0.15 * 0.5 * 0.5 * 16/12) * (1-0.1) * 25
Wood kg 3.23 (0.43 * 0.5 * 0.5 * 16/12) * (1-0.1) * 25
Landfilled waste of known composition (with landfill gas recovery)
Paper and textiles kg 1.183 (0.40 * 0.5 * 0.5 * 16/12) * (1-0.606) * (1-0.1) * 25
Garden and food kg 0.444 (0.15 * 0.5 * 0.5 * 16/12) * (1-0.606) * (1-0.1) * 25
Wood kg 1.272 (0.43 * 0.5 * 0.5 * 16/12) * (1-0.606) *(1-0.1) * 25
Landfilled waste – default values (without landfill gas recovery)
Mixed waste (national average)25
kg1.13
0.05 * (1-0.1) * 25
Office waste kg1.84
((0.536 * 0.4) + (0.208 * 0.15) + (0 * 0.3)) * 0.5 * 0.5 * 16/12) * (1-0.1) * 25
Landfilled waste – default values (with landfill gas recovery)
Mixed waste (national average)
kg0.444
0.05 * (1-0.606) * (1-0.1) * 25
Office waste26 kg0.726
((0.536 * 0.4) + (0.208 * 0.15) + (0 * 0.3)) * 0.5 * 0.5 * (16/12) * (1-0.606) * (1-0.1) * 25
25 0.05 is published within the national greenhouse gas inventory as the average methane generation potential of solid waste.
26 These figures represent an assumed default composition (paper: 53.6 per cent, garden and food: 20.8 per cent and wood: 0 per cent) for office waste, based on waste data from government buildings.
36 Guidance for voluntary greenhouse gas reporting

Appendix D: Landfills with gas collection systems
Guidance for voluntary greenhouse gas reporting 37

Table 16: Landfills with gas collection systems
38 Guidance for voluntary greenhouse gas reporting

Guidance for voluntary greenhouse gas reporting 39
Site name Location Gas collection and flare
Gas collection and Generate
Eves Valley landfill Waimea West, Nelson
No
Marlborough Regional Landfill (Bluegums)
Blenheim Yes
York Valley Landfill Nelson Yes
Redruth Landfill Timaru Yes
Kate Valley Amberley Yes
AB Lime Limited Winton Yes
Northland Regional Landfill
Puwera, Whangarei
Yes
Whitford Landfill Whitford Yes
Redvale Landfill Auckland Yes
Hampton Downs Landfill
Te Kauwhata, Auckland
Yes
Tirohia Landfill Paeroa Yes
Omarunui Landfill Hastings Yes
Waitomo District Landfill
Te Kuiti No
Colson Road Landfill
New Plymouth No
Tokoroa Landfill Tokoroa No
Broadlands Road Landfill
Taupo No
Rotorua District Sanitary Landfill
Rotorua Yes
Central Hawkes Bay District Landfill
Waipukurau No
Site name Location Gas collection and flare
Gas collection and Generate
Bonny Glen Marton Yes
Levin Landfill Levin No
Silverstream Landfill
Lower Hutt Wellington
Yes
Southern Landfill Happy Valley, Wellington
Yes
Spicer Landfill Porirua Yes