VOLUMETRIC SURVEY OF LAKE MONTICELLO · design information/field survey estimates the original...
29
VOLUMETRIC SURVEY OF LAKE MONTICELLO Prepared for: Titus County Fresh Water Supply District No. 1 In cooperation with Texas Utilities Electric Company Prepared by: The Texas Water Development Board March 10, 2003
Transcript of VOLUMETRIC SURVEY OF LAKE MONTICELLO · design information/field survey estimates the original...

VOLUMETRIC SURVEYOF
LAKE MONTICELLO
Prepared for:
Titus County Fresh Water Supply District No. 1In cooperation with
Texas Utilities Electric Company
Prepared by:
The Texas Water Development Board
March 10, 2003

Texas Water Development Board
Craig D. Pedersen, Executive Administrator
Texas Water Development Board
William B. Madden, Chairman Noe Fernandez, Vice-Chairman Elaine M. Barrón, M.D Jack Hunt
Charles L. Geren Wales H. Madden Jr.
Authorization for use or reproduction of any original material contained in this publication, i.e.not obtained from other sources, is freely granted. The Board would appreciate acknowledgment.
This report was prepared by the Hydrographic Survey group:
Scot Sullivan, P.E.Duane ThomasWayne ElliottPriscilla Hays
For more information, please call (512) 936-0848
Published and Distributedby the
Texas Water Development BoardP.O. Box 13231
Austin, Texas 78711-3231

iii
TABLE OF CONTENTS
INTRODUCTION ............................................................................................................................1
HISTORY AND GENERAL INFORMATION OF THE RESERVOIR ...........................................1
HYDROGRAPHIC SURVEYING TECHNOLOGY ........................................................................2
GPS Information...................................................................................................................2Equipment and Methodology ................................................................................................4Previous Survey Procedures.................................................................................................5
PRE-SURVEY PROCEDURES .......................................................................................................6
SURVEY PROCEDURES................................................................................................................7
Equipment Calibration and Operation..................................................................................7Field Survey.........................................................................................................................8Data Processing....................................................................................................................9
RESULTS.......................................................................................................................................11
SUMMARY....................................................................................................................................11
APPENDICES
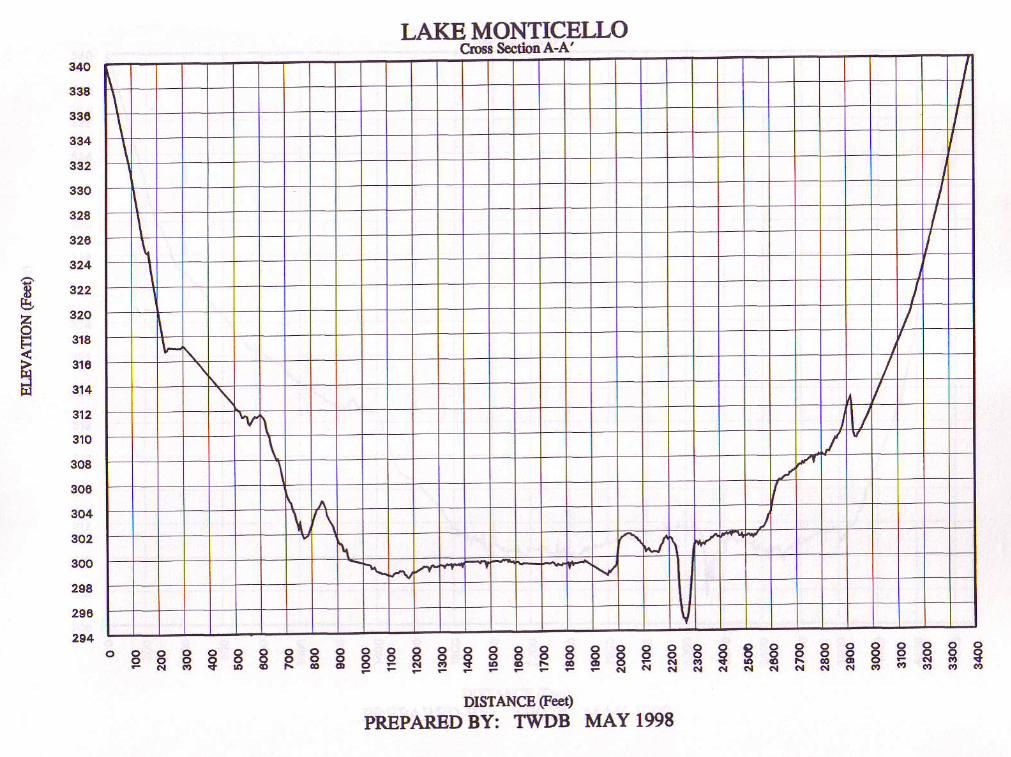
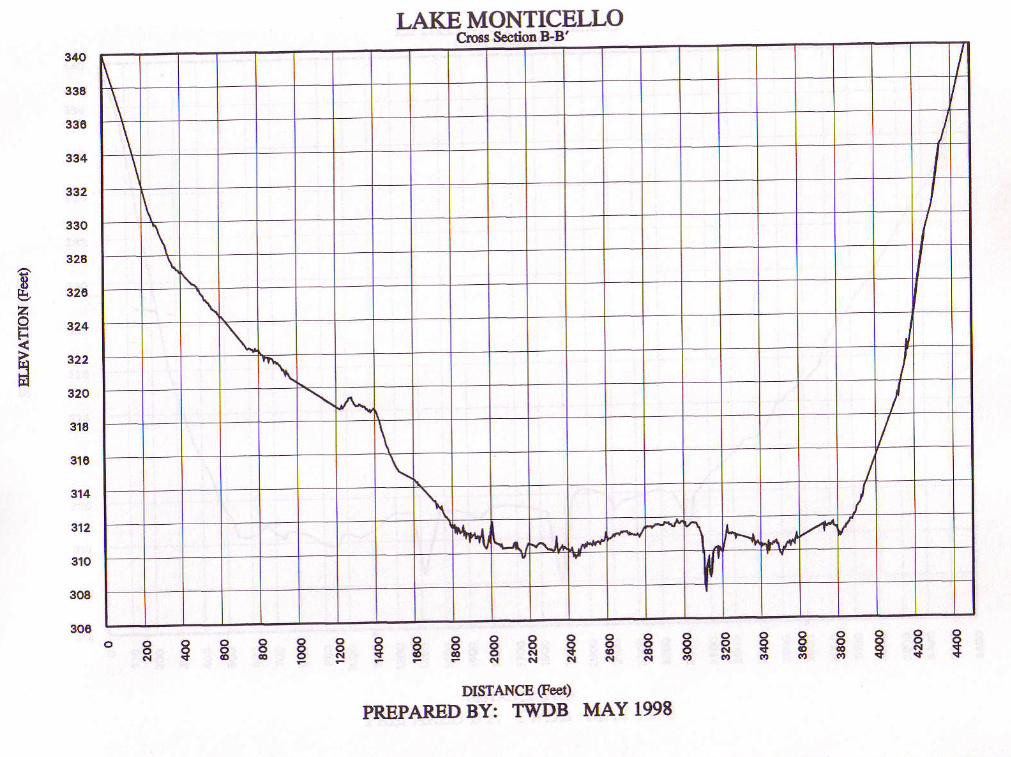
APPENDIX A - DEPTH SOUNDER ACCURACYAPPENDIX B - LAKE MONTICELLO VOLUME TABLEAPPENDIX C - LAKE MONTICELLO AREA TABLEAPPENDIX D - LAKE MONTICELLO AREA-ELEVATION-CAPACITY GRAPHAPPENDIX E - CROSS-SECTION PLOTS
LIST OF FIGURES
FIGURE 1 - LOCATION MAPFIGURE 2 - LOCATION OF SURVEY DATAFIGURE 3 - SHADED RELIEFFIGURE 4 - DEPTH CONTOURSFIGURE 5 - 2-D CONTOUR MAP

1
LAKE MONTICELLOHYDROGRAPHIC SURVEY REPORT
INTRODUCTION
Staff of the Hydrographic Survey Unit of the Texas Water Development Board (TWDB)
conducted a hydrographic survey of Lake Monticello during the periods of February 19 and 24, 1998.
The purpose of the survey was to determine the capacity of the lake at the conservation pool elevation.
From this information, future surveys will be able to determine the location and rates of sediment
deposition in the conservation pool over time. Survey results are presented in the following pages
in both graphical and tabular form. All elevations presented in this report will be reported in feet
above mean sea level based on the National Geodetic Vertical Datum of 1929 (NGVD '29) unless the
elevation is noted otherwise. The conservation pool elevation for Lake Monticello is 340.0 feet. The
design information/field survey estimates the original surface area at this elevation to be 2,000 acres
and the storage volume to be 40,100 acre-feet of water.
HISTORY AND GENERAL INFORMATION OF THE RESERVOIR
Lake Monticello and Monticello Dam are owned and operated by Texas Utilities Electric
Company. The reservoir is located on Blundell Creek in Titus County, two and one-half miles east
of Monticello, Texas (see Figure 1). Records indicate the drainage area is approximately 36 square
miles. At the conservation pool elevation, the lake has approximately 23.2 miles of shoreline and is
5.3 miles long. The widest point of the reservoir is approximately 1.1 miles (located 1.3 miles
upstream of the dam).
The Texas Water Commission issued Permit No. 2591 on July 24, 1970 to Texas Utilities
Electric Company. This original permit authorized the construction of a dam and to impound 40,100
acre-feet of water. The permit authorized consumptive use not to exceed 16,300 acre-feet per annum
for the development of thermal electric power. This original permit was amended and later granted
on July 6, 1973. Permit No. 2591A authorizes consumptive use not to exceed 15,300 acre-feet of

2
water per annum and 1,000 acre-feet of water per annum for industrial purposes associated with dust
suppression and plant use at the Monticello mining site seven miles north of the reservoir. A
certificate of Adjudication was issued to Texas Utilities Electric Company on October 13, 1986.
Certificate of Adjudication No. 04-4563 authorized Texas Utilities Electric Company the
impoundment capacities and water uses as stated in Permit No. 2591A.
Records indicate the construction for Lake Monticello and Monticello Dam began April 16,
1971 and deliberate impoundment began August 9, 1972. The project was officially completed in the
spring of 1973. The design engineer was Forrest and Cotton Inc. and the general contractor was List
and Clark Construction Company. The estimated cost of the dam was $4,500,000.
Monticello Dam and appurtenant structures consist of a rolled earth fill embankment,
approximately 3,200 feet in length. The embankment rises 54 feet above the natural streambed to an
elevation of 352.0 feet. The service spillway is located at the left (east) abutment and is a concrete
chute with an ogee crest. The crest is 160 feet in net length at elevation 328.0 feet. Four tainter gates,
each 14 feet tall and 40 feet wide, control the service spillway. The emergency spillway, located to
the right (west) of the dam, is an earth trench cut through the natural ground. The uncontrolled broad-
crested weir is 1,000 feet in length at elevation 343.5 feet.
HYDROGRAPHIC SURVEYING TECHNOLOGY
The following sections will describe the theory behind Global Positioning System (GPS)
technology and its accuracy. Equipment and methodology used to conduct the subject survey and
previous hydrographic surveys are also addressed.
GPS Information
The following is a brief and simple description of Global Positioning System (GPS)
technology. GPS is a relatively new technology that uses a network of satellites, maintained in precise
3
orbits around the earth, to determine locations on the surface of the earth. GPS receivers continuously
monitor the broadcasts from the satellites to determine the position of the receiver. With only one
satellite being monitored, the point in question could be located anywhere on a sphere surrounding the
satellite with a radius of the distance measured. The observation of two satellites decreases the
possible location to a finite number of points on a circle where the two spheres intersect. With a third
satellite observation, the unknown location is reduced to two points where all three spheres intersect.
One of these points is obviously in error because its location is in space, and it is ignored. Although
three satellite measurements can fairly accurately locate a point on the earth, the minimum number of
satellites required to determine a three dimensional position within the required accuracy is four. The
fourth measurement compensates for any time discrepancies between the clock on board the satellites
and the clock within the GPS receiver.
The United States Air Force and the defense establishment developed GPS technology in the
1960’s. After program funding in the early 1970's, the initial satellite was launched on February 22,
1978. A four-year delay in the launching program occurred after the Challenger space shuttle disaster.
In 1989, the launch schedule was resumed. Full operational capability was reached on April 27, 1995
when the NAVSTAR (NAVigation System with Time And Ranging) satellite constellation was
composed of 24 Block II satellites. Initial operational capability, a full constellation of 24 satellites,
in a combination of Block I (prototype) and Block II satellites, was achieved December 8, 1993. The
NAVSTAR satellites provide data based on the World Geodetic System (WGS '84) spherical datum.
WGS '84 is essentially identical to the 1983 North American Datum (NAD '83).
The United States Department of Defense (DOD) is currently responsible for implementing
and maintaining the satellite constellation. In an attempt to discourage the use of these survey units
as a guidance tool by hostile forces, the DOD has implemented means of false signal projection called
Selective Availability (S/A). Positions determined by a single receiver when S/A is active result in
errors to the actual position of up to 100 meters. These errors can be reduced to centimeters by
performing a static survey with two GPS receivers, one of, which is set over a point with known
coordinates. The errors induced by S/A are time-constant. By monitoring the movements of the
satellites over time (one to three hours), the errors can be minimized during post processing of the
collected data and the unknown position computed accurately.

4
Differential GPS (DGPS) is an advance mode of satellite surveying in which positions of
moving objects can be determine in real-time or "on-the-fly." This technological breakthrough was
the backbone of the development of the TWDB’s Hydrographic Survey Program. In the early stages
of the program, one GPS receiver was set up over a benchmark with known coordinates established
by the hydrographic survey crew. This receiver remained stationary during the survey and monitored
the movements of the satellites overhead. Position corrections were determined and transmitted via
a radio link once per second to another GPS receiver located on the moving boat. The boat receiver
used these corrections, or differences, in combination with the satellite information it received to
determine its differential location. This type of operation can obtain a horizontal positional accuracy
of within one meter. In addition, the large positional errors experienced by a single receiver when
S/A is active are negated. Since a greater accuracy is needed in the vertical direction, the depth
sounder supplies vertical data during a survey. The lake surface during the survey serves as the
vertical datum for the readings from the depth sounder.
The need for setting up a stationary shore receiver for current surveys has been eliminated by
registration with a fee-based satellite reference position network (OmniSTAR). This service works
in a differential mode basically the same way as the shore station, except on a worldwide basis. For
a given area in the world, a network of several monitoring sites (with known positions) collect GPS
signals from the NAVSTAR network. GPS corrections are computed at each of these sites to correct
the GPS signal received to the known coordinates of the site. The corrections from each of the sites
within the network are automatically sent via a leased line to a “Network Control Center” where the
data corrections are checked and repackaged for up-link to a “Geostationary” L-band satellite. The
“real-time” corrections for the entire given area in the world are then broadcast by the satellite to
users of the system in the area covered by the satellite. The OmniSTAR receiver translates the
information and supplies it to the on-board Trimble receiver for correction of the boat’s GPS
positions. The accuracy of this system in a real-time mode is normally one meter or less.
Equipment and Methodology
The equipment used in the performance of the hydrographic survey consisted of a 23-foot

5
aluminum tri-hull SeaArk craft with cabin, equipped with twin 90-Horsepower Johnson outboard
motors. Installed within the enclosed cabin are an Innerspace Helmsman Display (for navigation), an
Innerspace Technology Model 449 Depth Sounder and Model 443 Velocity Profiler, a Trimble
Navigation, Inc. 4000SE GPS receiver, an OmniSTAR receiver, and an on-board 486 computer. A
water-cooled generator through an in-line uninterruptible power supply provided electric power.
Reference to brand names does not imply endorsement by the TWDB.
The GPS equipment, survey vessel, and depth sounder combine together to provide an efficient
hydrographic survey system. As the boat travels across the lake surface, the depth sounder gathers
approximately ten readings of the lake bottom each second. The depth readings are stored on the
survey vessel's on-board computer along with the corrected positional data generated by the boat's
GPS receiver. The daily data files collected are downloaded from the computer and brought to the
office for editing after the survey is completed. During editing, bad data is removed or corrected,
multiple data points are averaged to get one data point per second, and average depths are converted
to elevation readings based on the daily-recorded lake elevation on the day the survey was performed.
Accurate estimates of the lake volume can be quickly determined by building a 3-D model of the
reservoir from the collected data. The level of accuracy is equivalent to or better than previous
methods used to determine lake volumes, some of which are discussed below.
Previous Survey Procedures
Originally, reservoir surveys were conducted with a rope stretched across the reservoir along
pre-determined range lines. A small boat would manually pole the depth at selected intervals along
the rope. Over time, aircraft cable replaced the rope and electronic depth sounders replaced the pole.
The boat was hooked to the cable, and depths were again recorded at selected intervals. This method,
used mainly by the Soil Conservation Service, worked well for small reservoirs.
Larger bodies of water required more involved means to accomplish the survey, mainly due
to increased size. Cables could not be stretched across the body of water, so surveying instruments
were utilized to determine the path of the boat. Monumentation was set for the end points of each line
so the same lines could be used on subsequent surveys. Prior to a survey, each end point had to be

6
located (and sometimes reestablished) in the field and vegetation cleared so that line of sight could
be maintained. One surveyor monitored the path of the boat and issued commands via radio to insure
that it remained on line while a second surveyor determined depth measurement locations by turning
angles. Since it took a major effort to determine each of the points along the line, the depth readings
were spaced quite a distance apart. Another major cost was the land surveying required prior to the
reservoir survey to locate the range line monuments and clear vegetation.
Electronic positioning systems were the next improvement. If triangulation could determine
the boat location by electronic means, then the boat could take continuous depth soundings. A set of
microwave transmitters positioned around the lake at known coordinates would allow the boat to
receive data and calculate its position. Line of site was required, and the configuration of the
transmitters had to be such that the boat remained within the angles of 30 and 150 degrees with respect
to the shore stations. The maximum range of most of these systems was about 20 miles. Each shore
station had to be accurately located by survey, and the location monumented for future use. Any errors
in the land surveying resulted in significant errors that were difficult to detect. Large reservoirs
required multiple shore stations and a crew to move the shore stations to the next location as the
survey progressed. Land surveying remained a major cost with this method.
More recently, aerial photography has been used prior to construction, to generate elevation
contours from which to calculate the volume of the reservoir. Fairly accurate results could be
obtained, although the vertical accuracy of the aerial topography was generally one-half of the contour
interval or + five feet for a ten-foot contour interval. This method could be quite costly and was only
applicable in areas that were not inundated.
PRE-SURVEY PROCEDURES
The reservoir's surface area was determined prior to the survey by digitizing with AutoCad
software the 740-foot contour. The boundary file was created from the 7.5-minute USGS quadrangle
maps, WINFIELD, TX. 1965; and MONTICELLO, TX. 1965. The graphic boundary file created
was then transformed into the proper datum, from NAD '27 datum to NAD '83, using Environmental
7
Systems Research Institute’s (ESRI) Arc/Info project command with the NADCOM parameters. The
area of the lake boundary was checked to verify that the area was the same in both datums.
The survey layout was designed by placing survey track lines at 500-foot intervals across the
lake. The survey design for this lake required approximately 57 survey lines to be placed along the
length of the lake. Survey setup files were created using Coastal Oceangraphics, Inc. Hypack software
for each group of track lines that represented a specific section of the lake. The setup files were
copied onto diskettes for use during the field survey.
SURVEY PROCEDURES
The following procedures were followed during the hydrographic survey of Lake Monticello
performed by the TWDB. Information regarding equipment calibration and operation, the field survey,
and data processing is presented.
Equipment Calibration and Operation
At the beginning of each surveying day, the depth sounder was calibrated with the Innerspace
Velocity Profiler. The Velocity Profiler calculates an average speed of sound through the water
column of interest for a designated draft value of the boat (draft is the vertical distance that the boat
penetrates the water surface). The draft of the boat was previously determined to average 1.2 ft. The
velocity profiler probe is placed in the water to moisten and acclimate the probe. The probe is then
raised to the water surface where the depth is zeroed. The probe is lowered on a cable to just below
the maximum depth set for the water column, and then raised to the surface. The unit displays an
average speed of sound for a given water depth and draft, which is entered into the depth sounder. The
depth value on the depth sounder was then checked manually with a measuring tape to ensure that the
depth sounder was properly calibrated and operating correctly. During the survey of Lake Monticello,
the speed of sound in the water column was determined to be 4,865 feet per second. Based on the
measured speed of sound for various depths, and the average speed of sound calculated for the entire
water column, the depth sounder is accurate to within +0.2 feet, plus an estimated error of +0.3 feet
8
due to the plane of the boat for a total accuracy of +0.5 feet for any instantaneous reading. These
errors tend to be minimized over the entire survey, since some are positive and some are negative
readings. Further information on these calculations is presented in Appendix A.
During the survey, the onboard GPS receiver was set to a horizontal mask of 10° and a PDOP
(Position Dilution of Precision) limit of 7 to maximize the accuracy of horizontal positions. An
internal alarm sounds if the PDOP rises above seven to advise the field crew that the horizontal
position has degraded to an unacceptable level. The lake’s initialization file used by the Hypack data
collection program was setup to convert the collected DGPS positions on the fly to state plane
coordinates. Both sets of coordinates were then stored in the survey data file.
Field Survey
Data were collected at Lake Monticello on February 19, 1998 and February 24, 1998.
Approximately 108,526 data points were collected over the 28 miles traveled along the 35 survey
lines run (pre-planned, random, and parallel). These points were stored digitally on the boat’s
computer in 35 data files. Data were not collected in areas of shallow water (depths less than 3.0
feet) or with significant obstructions unless these areas represented a large amount of water. Random
data lines were also collected parallel to the original streambed in the main body of the lake. Figure
2 shows the actual location of all data collection points. In addition, on February 24, eleven lines of
data were collected above the Highway 127 bridge on Blundell, Outlet, and Smith Bays using a small
boat outfitted with a recording depth sounder.
TWDB staff observed the land around the lake to be vary between flat and rolling hills and
that development was limited to the area of the power plant. On the depth sounder, a steep slope was
noted near both shorelines with a wide fairly level bottom channel in the middle. From the survey
vessel, the crew could see that the water was fairly clear with minimal underwater vegetation and that
the lake was mostly free of any navigational hazards such as standing trees or stumps. There was a
large, marked sandbar located on the west side of the lake near the mouth of County Park Cove about
2.0 feet below the surface that the bottom of the boat plowed over. Another hazard was noted around
the Texas Utilities Power Plant intake on the northeast shore about 2000 feet upstream of the dam,

9
there were cables extending into the lake about 100 feet, protecting the intakes from boat traffic. Staff
could not collect data in that area. The TWDB survey vessel could also not go under the bridge at
Highway 127 due to a vertical clearance limitation. In addition, the boat could not be moved by land
to other side of side of the bridge because there were no access areas. Staff therefore collected data
above this bridge on February 24 using a small boat outfitted with a recording depth sounder.
All of the collected data were stored in individual data files for each pre-plotted range line
or random collection event. Each of these files is tagged with a unique file tag, representative of the
lake being surveyed. At the end of each day, the data files were copied to diskettes, for future
processing in the office.
Data Processing
The collected data were downloaded from diskettes onto the TWDB's computer network. Tape
backups were made for future reference as needed. To process the data, the EDIT routine in the
Hypack Program was run on each raw data file. Data points such as depth spikes or data with missing
depth or positional information were deleted from the file. The depth information collected every 0.1
seconds was averaged to get one reading for each second of data collection. A correction for the lake
elevation at the time of data collection was also applied to each file during the EDIT routine. During
the survey, the water surface held steady at 340.3 feet. After all changes had been made to the raw
data file, the edited file was saved with a different extension. The edited files were combined into
a single X,Y,Z data file, representative of the lake, to be used with the GIS software to develop a
model of the lake's bottom surface. In addition, the eleven lines collected using the recording depth
sounder only, were digitized and converted to data points by incrementing each cross-section in 1 foot
increments along both the X, Y and Z axes. This procedure was accomplished by running an Arc/Info
script file developed by TWDB staff. The eleven lines converted into 20,929 data points.
The resulting data file was imported into the UNIX operating system used to run
Environmental System Research Institute’s (ESRI) Arc/Info GIS software and converted to a MASS
points file. The MASS points and the boundary file were then used to create a Digital Terrain Model
(DTM) of the reservoir's bottom surface using Arc/Info's TIN software module. The module builds

10
an irregular triangulated network from the data points and the boundary file. This software uses a
method known as Delauney's criteria for triangulation. A triangle is formed between three non-
uniformly spaced points, including all points along the boundary. If there is another point within the
triangle, additional triangles are created until all points lie on the vertex of a triangle. All of the data
points are preserved for use in determining the solution of the model by using this method. The
generated network of three-dimensional triangular planes represents the actual bottom surface. Once
the triangulated irregular network (TIN) is formed, the software then calculates elevations along the
triangle surface plane by solving the equations for elevation along each leg of the triangle. Information
for the entire reservoir area can be determined from the triangulated irregular network created using
this method of interpolation.
If data points were collected outside the boundary file, the boundary was modified to include
the data points. The boundary file in areas of significant sedimentation was also downsized as
deemed necessary based on the data points and the observations of the field crew. The resulting
boundary shape was used to develop each of the map presentations of the lake in this report.
There were some areas where volume and area values could not be calculated by interpolation
because of a lack of information within the reservoir. "Flat triangles" were drawn at these locations.
Arc/Info does not use flat triangle areas in the volume or contouring features of the model.
Approximately 8,153 additional points were required for interpolation and contouring of the entire
lake surface at elevation 340.0. Volumes and areas were calculated from the TIN for the entire
reservoir at one-tenth of a foot intervals. From elevation 336.0 to elevation 340.0, the surface areas
and volumes of the lake were mathematically estimated. This was done first by distributing uniformly
across each elevation increment; the surface areas digitized from USGS topographic maps. Volumes
were then calculated in a 0.1 foot step method by adding to the existing volume, 0.1 of the existing
area, and 0.5 of the difference between the existing area the area for the value being calculated. The
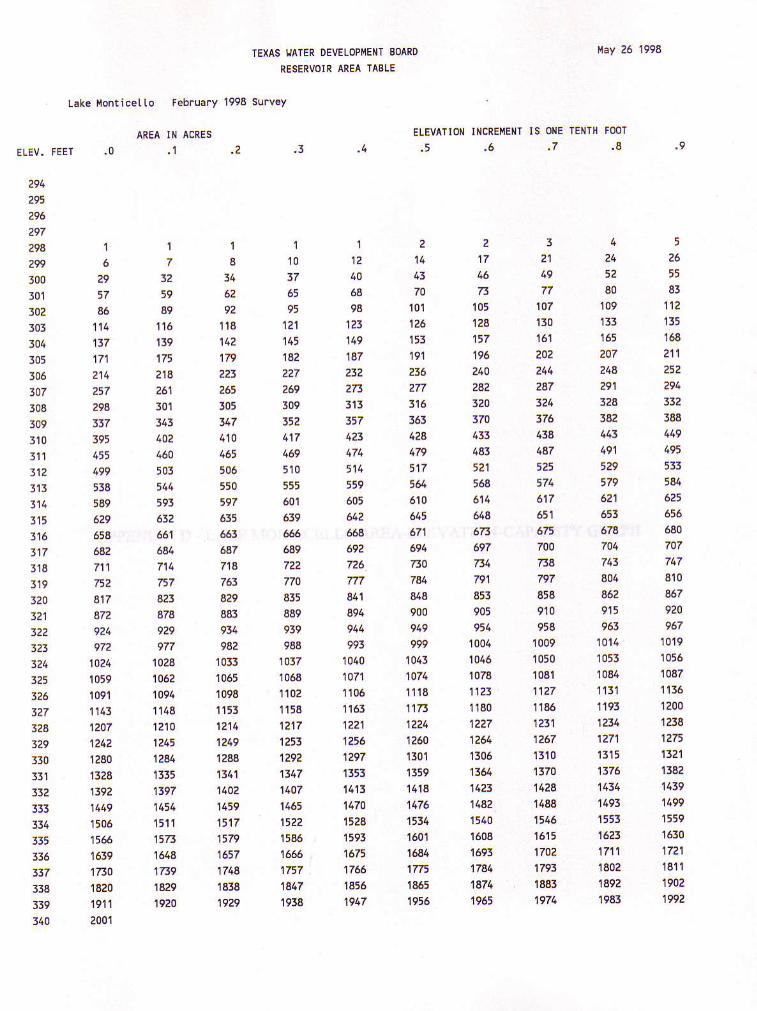
computed area of lake at elevation 340.0 was 2,001 surface acres. The computed area was 1 surface
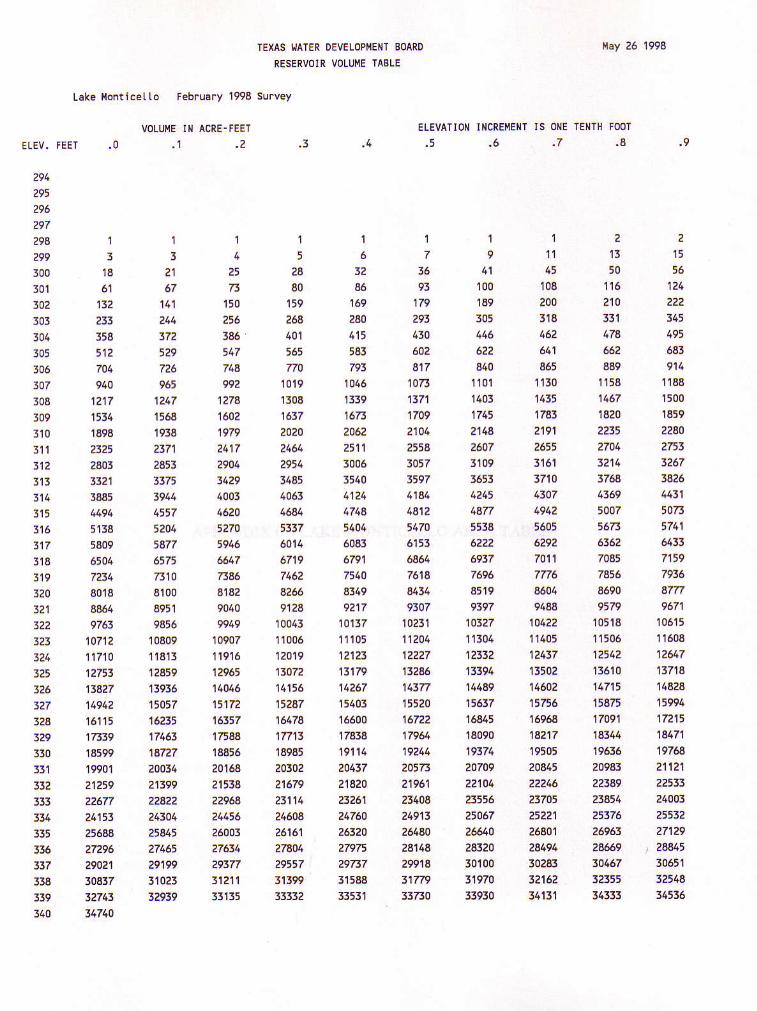
acres more than originally calculated. The computed reservoir volume table is presented in Appendix
B and the area table in Appendix C. An elevation-area-volume graph is presented in Appendix D.
Other presentations developed from the model include a shaded relief map and a shaded depth
11
range map. To develop these maps, the TIN was converted to a lattice using the TINLATTICE
command and then to a polygon coverage using the LATTICEPOLY command. Using the
POLYSHADE command, colors were assigned to the range of elevations represented by the polygons
that varied from navy to yellow. The lower elevation was assigned the color of navy, and the 340.0
lake elevation was assigned the color of yellow. Different color shades were assigned to the
intermediate depths. Figure 3 presents the resulting depth shaded representation of the lake. Figure
4 presents a similar version of the same map, using bands of color for selected depth intervals. The
color increases in intensity from the shallow contour bands to the deep-water bands.
Linear filtration algorithms were then applied to the DTM smooth cartographic contours
versus using the sharp-engineered contours. The resulting contour map of the bottom surface at two-
foot intervals is presented in Figure 5.
RESULTS
Results from the 1998 TWDB survey indicate Lake Monticello encompasses 2,001 surface
acres and contains a volume of 34,740 acre-feet at the conservation pool elevation of 340.0 feet. The
shoreline at this elevation was calculated to be 23.2 miles. The deepest point of the lake, elevation
293.7 or 46.3 feet of depth was located approximately 520 feet northwest from the center of the dam.
Since this is a cooling reservoir, there is no real dead storage level in the reservoir. Therefore the
capacity calculated above is the official volume of the lake.
SUMMARY
Lake Monticello was formed in 1972. Initial storage calculations estimated the volume at the
conservation pool elevation of 340.0 feet to be 40,100 acre-feet with a surface area of 2,000 acres.
On February 19 and 24, 1998, a hydrographic survey of Lake Monticello was performed by
the Texas Water Development Board's Hydrographic Survey Program. The 1998 survey used

12
technological advances such as differential global positioning system and geographical information
system technology to build a model of the reservoir's bathemetry. These advances allowed a survey
to be performed quickly and to collect significantly more data of the bathemetry of Lake Monticello
than previous survey methods. Results indicate that the lake's capacity at the conservation pool
elevation of 340.0 feet was 34,740 acre-feet and the area was 2,001 acres.
The estimated reduction in storage capacity at the conservation pool elevation of 340.0 feet
since 1972 is 5,360 acre-feet or 206 acre-feet per year. The average annual deposition rate of
sediment in the conservation pool of the reservoir can be estimated at 5.726 acre-feet per square mile
of drainage area. (Please note that this is just a mathematical estimate based on the difference
between the original survey and the current survey. In reality, the calculated value is
unreasonable and should not be used. An error in the original volume is more likely the reason
there is such a large difference in storage over the 26 years of operation.)
It is difficult to compare the original design information and the TWDB performed survey
because little is know about the original design method, the amount of data collected, and the method
used to process the collected data. However, the TWDB considers the 1998 survey to be a significant
improvement over previous survey procedures and recommends that the same methodology be used
in five to ten years or after major flood events to monitor changes to the lake's storage capacity.

A-1
CALCULATION OF DEPTH SOUNDER ACCURACY
This methodology was extracted from the Innerspace Technology, Inc. Operation Manual for the
Model 443 Velocity Profiler.
For the following examples, t = (D - d)/V
where: tD = travel time of the sound pulse, in seconds (at depth = D)D = depth, in feetd = draft = 1.2 feetV = speed of sound, in feet per second
To calculate the error of a measurement based on differences in the actual versus averagespeed of sound, the same equation is used, in this format:
D = [t(V)]+d
For the water column from 2 to 30 feet: V = 4832 fps
t30 = (30-1.2)/4832 = 0.00596 sec.
For the water column from 2 to 45 feet: V = 4808 fps
t45 =(45-1.2)/4808 =0.00911 sec.
For a measurement at 20 feet (within the 2 to 30 foot column with V = 4832 fps):
D20 = [((20-1.2)/4832)(4808)]+1.2 = 19.9' (-0.1')
For a measurement at 30 feet (within the 2 to 30 foot column with V = 4832 fps):
D30 = [((30-1.2)/4832)(4808)]+1.2 = 29.9' (-0.1')
For a measurement at 50 feet (within the 2 to 60 foot column with V = 4799 fps):

A-2
D50 = [((50-1.2)/4799)(4808)]+1.2 = 50.1' (+0.1')
For the water column from 2 to 60 feet: V = 4799 fps Assumed V80 = 4785 fps
t60 =(60-1.2)/4799 =0.01225 sec.
For a measurement at 10 feet (within the 2 to 30 foot column with V = 4832 fps):
D10 = [((10-1.2)/4832)(4799)]+1.2 = 9.9' (-0.1')
For a measurement at 30 feet (within the 2 to 30 foot column with V = 4832 fps):
D30 = [((30-1.2)/4832)(4799)]+1.2 = 29.8' (-0.2')
For a measurement at 45 feet (within the 2 to 45 foot column with V = 4808 fps):
D45 = [((45-1.2)/4808)(4799)]+1.2 = 44.9' (-0.1')
For a measurement at 80 feet (outside the 2 to 60 foot column, assumed V = 4785 fps):
D80 = [((80-1.2)/4785)(4799)]+1.2 = 80.2' (+0.2')
TEXAS I,JATER
RESERVOIR
Lske on t iceLLo FebfGry 1998 Su.vey
DEVEIOPI,IENT BOARD
VOLUI.IE TASLE
r4ay 26 1998
VOI.U E IN ACRE-FEET €LEVATION INCREIIEIII IS O'{E TENTH FOOT
. 4 . 5 . 6 . 7 . 8
29129'296297?95299300301a0210310430t306307308109J 1 03 1 1
314r15! 1 63173 1 8319
321322
321
3263273ZA329l5o151332353331
336337338339140
1
1 a6 l
z3t358512
9401217153418982t2'280333213885
5158580965047234801888649763
1071?1 1 7 1 01275313427149421611517339185991990121259226n?4153?56882729629021304373274331710
13
67141244
529726965
1247'1568
19382371?853
3911
5204,8n
n1081008951
1080911611tza591393615057162351716314727zoo3l21399?zazz243042544527465291995102532939
1
1 5 0216386547714992
12741602197924172904
40034620
594666477346818290409949
109071 1 9 1 612965
15172161571-i58418856201642153822964
2600327631293n31211t3135
15
?880
159264101
7701 0 1 9130816372020246129143445406!1i44
60116719716282669126
1004!11006120191307211156152471617817713189852030221679231142160426161278012955731399
1
169240415583n3
1046133916n20622 5 1 13006154041244744540460836791754081499217
101371 1 1 0 51212313179142671540516600178381911420137214202326124760263202797529737t158433531
17
36
179?93430602s17
10731371'1709
21042558305735971144$ 1 251706l5t6864761884t49307
1023111204'12227
1328614n15520'16722
1796419244?057321961231I�A219132644024144299183177\)33730
19
100189305
622840
1 1 0 114031715214526071109365342454gn55186?226937769685199397
10327113011233211394144491563716€451809019371207092210423556250672661028320301003197033930
l
l l45
106
200318462611665
11301435't783
21912655316137101307
629270117n6E60494&a
'10422
1 1 4 0 5
135021460215n616964142171950520415?224623705z52Zl?640128494502853215231131
2
501 1 6210531474662889
1 1 5 81467182022352m4a?14376443695007
636270857456869095n
1051811506'12542
13610117151t87517091143441961620985223492f,4512537626963266693046732f5531333
2
121222
495685914
118815001859228027533257
443'l5073574'l
71597934am9671
1061511608126471371814424159941721518471197ca21121
24003255322712928845306t132t1434536
. 2 .3 . 9
III
tII
TEXAS IJATER DEVELOPiJENT BOARO
RESERVOIR AREA TASLE
Mont ice t to February 1998
AREA IN ACRES
. o . 1 , ?
Itay ?6 1994
295296?97?94299300J013A?30330130510630730810931031'�I3123 1 33143153163173 1 83 1 9320321322323324325326327324329330:31332333331335336437518359340
. 3ELEVATIOII INCREI,IENTIS ONE TENTH FOOT
- 7 . 8
II
IIttIIttIII
16
295 786
137171
257294337395455
5185896296586A?7117r2817a72
9721021105910911 1 4 112471?12120013281392
1506156616391i301a201 9 1 1zaal
l
325989
11613917'2 1 8261301343402460501,145936t?661644
7r74238789?9977
1028106210941 1 4 8121012451?8413351397145415111r731$A1ZJ914291920
l
a346292
1 1 81421792232653053474 1 046550655059763t663647714763429883931982
1033106510981 1 5 312141?19128813111402145915171r791657171518381929
l
1 0376595
'l?l
14'18?22726930935?
5 1 0555601639
649722774835889939984
10t7106811021 1 5 81 ? 1 71253129213471407116'11221586
175714471958
l
1 240689A
173
14723?273313317424
514559605642668692726
841894
99310401A7111061 1 6 312211256129713t314131170152415931675176618561947
2
4370
1011?61511912362n316163424
517,646 1 0
671
7ia784848900
999104310711 1 1 8117312241264130113591 4 1 4
1531r1601164417n186519r6
21 7
7Z1 0 5124157196240242a2a!70433483521564
648671
734791853905951
1004
10781 1 2 11 1 8 0122712611306136411?t1$2154016041691174414711965
3
1071301 6 t?022442873243764384475?5,746176516757007347978t89 1 0958
10091050104111271 1 8 6123112671 3 1 013741124r18815461615170217931883
?45 280
1 0 9113165207244?91t28182
,2957962165t678704
804a62915963
1014105310441 1 3 11 1 9 5123112711 3 1 5117611341193155316231711180218921983
5?65503
11?115168211
332la8
49555558462'616580707
8 1 0867920
1 0 1 9105610871 1 1 61zaA1234127i132111821139
1559163017211 8 1 119021992

\,
qs
d
\
. . . . . . . ' . l
tm,ooo x
I
m
15,ooo frJ
35,000
30,0@
25,000
10,000
5,0@
300
1,8@
2,1@
6@
4 eoo
m
5# 1,200I
1,5@
IIttIIIIIIII
2W 285 290 295 300 305 310 315 s2o 325 330 335 340 345
LAKE MONTICELLOFebruary 1998 Survey
Pr€par€d by: TWDB May 1996
'I\(
IIl
I
oo
o+
*
rr
a P
P :
s I
I I
3 S
3 3
3 s
- -
- n'
ar ar
ir nr
6 6
6 ;
6 .i
ai . 00t8
o0
8e
002€
@ls
ooo€
oo
€z
oo
Sz
@L
Z
oo9z
o9
z00tz
ooez
oozz 6o\
oolz o\
oooz
00
al
00
8t
6
-
oo
rl BE
oo
e!
9 F
E>
oort o r..
oofl E
l
@z!
eo
olr
trlO
OO
L
A
oo3
oos
004
oo9
oo9
@t
o06
ooz
o0
t
o
IF:q
I3
TH
TE
TE
tl
tIITIII
&n6
(FerD
Nor.rv^rnrr
oot&
oozt
ooot
008€
oo
ee
00t€
oo
z€
000e€
cr�az 6i
00
92
*t a
eo
oo
zz J BO
ri
z-
aroz S
"
E>
oo
sr n&
00€!
00fl u
@zl
00
0t
oo8
oo9
oot
ooz
Ilq
tf
fu
IF
r
)3
I>
T9
lsItt|'IIT
ta1fl-atI1j1
F
I
I
gg
$$
$g
$B
$$
8s
s;
s3
gg
OO
E$ NO
IJVA
flII

ooCA
o\
gE
EF
2t-.
E>
X|qx&
ooe€0
09
€
ootS
00€8
00le
ooo€@
62
ooSz
oolzooez0
09
2
ogtz
@8
2
oo
zz00tz
o@z
0061
00
81
I oo
rlIlo
oe
rI o
ocl
I o''I
oo
€r
I.l o0
zr
1'*u
I o
0o
!
I oo€1
0
o8
I*,I
oo,
l*'J
OO
t
l*t
IJ ooz
I o
or
Jo
IOX
FE
ZE
ot
>.q
Mt
$$
$n
$
(l€dNoIJV
AH
-E
$$
8s
*;
3$
$

@o\)n
aa
;F9F
E>
E|a&
oogz
@L
Z
00
gz
0092
wtz
oo€z
oozz
00tz
0002
oo
Bt
oo
St
OO
LL
0001
00
91
00tt
ooSt
oo
zt
oo
ll
I ooot
I| 0o€
Ilm
BIl-'I o
ot
II oos
II oot
l*t
I|*
"I-{ oorIJ
O
xTt-r BZ
Eo
r>
.8Vrl
3$
$g
$$
$g
$s
fi
$f
i$
$
\
\
r
(Fed) NoII.vA
a-E
\
\
\
\
'
tt-r-{
\
{tc
s3
$$
E3
Ei
Nf
i
S g
ss
SH
HH
H
gR
.n
at
oo
6o\o\
-E
XH
EE
FE
:a
Hx&
-lFlu
F5
|',8
A8
=I
tx
!1
ooo9z
00
09
2
000t2
oooez
ooo?z
oootz
o0002
oo
o€
t
om
Sl
00011
0m
9l
00
09
t
o00tt
oo
08
r
oo
ozl
000rt
o0o0t
ooo6
0008
000L
ooo9
0009
ooot
000e
oooz
00
01
(teeD Nollv
irtrI
(,. - -.. l1 1) ?
I 'L,ii
,.-t
,./ \
I llt
j '- '
,I, /'- \
\.-._
il 'L_/\

FIGURE 2
I-AKEMONTICELLOLocation of Survey Data
A)N
$1"= 2800'
PREPARED BY: TEXAS WATER DEVELOPMEI\IT BOARD MAY 1998
FIGURE 3
LAKEMONTICELLOShaded Relief
A)5t
$1"= 2800'
EIjV
IIITIT
II
ATION IN FEET
293.7 - 299.5
299.5 - 304
304 - 308.5
308.5 " 313
313- 317.5
317.5 - 322
322 - 326.5
326.5 - 331
331 - 335.5
335.5 - 340
PREPARED BY: TEXAS WATER DEVELOPMENT BOARD MAY 1998
{J'{
i280
III
FIIITITFIIFFTT
FIGURE 4
LAKEMONTICELLODepth Ranges
EXPII.NATION0-12 '
12-24
24 - 36'
36 - 46.3'
III
PREPARED BY: TEXAS WATER DE\ELOPMENT BOARD NIAY 1998