Fractal Antennae and Coherence 1 Fractal Antennae and Coherence

Research Article
Biology, Engineering and Medicine
Biol Eng Med, 2019 doi: 10.15761/BEM.1000175 Volume 4: 1-9
ISSN: 2399-9632
Volumetric heat capacity and capillary pressure fractal dimensions for characterizing shajara reservoirs of the permo-carboniferous shajara formation, Saudi ArabiaKhalid Elyas Mohamed Elameen Alkhidir*Department of Petroleum and Natural Gas Engineering, College of Engineering, King Saud University, Saudi Arabia
AbstractThe quality and assessment of a reservoir can be documented in detail by the application of volumetric heat capacity. This research aims to calculate fractal dimension from the relationship among volumetric heat capacity, maximum volumetric heat capacity and wetting phase saturation and to approve it by the fractal dimension derived from the relationship among capillary pressure and wetting phase saturation. Two equations for calculating the fractal dimensions have been employed. The first one describes the functional relationship between wetting phase saturation, volumetric heat capacity, maximum volumetric heat capacity and fractal dimension. The second equation implies to the wetting phase saturation as a function of capillary pressure and the fractal dimension. Two procedures for obtaining the fractal dimension have been utilized. The first procedure was done by plotting the logarithm of the ratio between volumetric heat capacity and maximum volumetric heat capacity versus logarithm wetting phase saturation. The slope of the first procedure = 3-Df (fractal dimension). The second procedure for obtaining the fractal dimension was determined by plotting the logarithm of capillary pressure versus the logarithm of wetting phase saturation. The slope of the second procedure = Df -3. On the basis of the obtained results of the fabricated stratigraphic column and the attained values of the fractal dimension, the sandstones of the Shajara reservoirs of the Shajara Formation were divided here into three units.
*Correspondence to: Khalid Elyas Mohamed Elameen Alkhidir, Department of Petroleum and Natural Gas Engineering, College of Engineering, King Saud University, Saudi Arabia, E-mail: [email protected]
Key words: shajara reservoirs, shajara formation, volumetric heat capacity fractal dimension, capillary pressure fractal dimension
Received: July 17, 2019; Accepted: July 22, 2019; Published: July 29, 2019
IntroductionSeismo electric effects related to electro kinetic potential, dielectric
permitivity, pressure gradient, fluid viscosity, and electric conductivity was first reported by [1]. Capillary pressure follows the scaling law at low wetting phase saturation was reported by [2]. Seismo electric phenomenon by considering electro kinetic coupling coefficient as a function of effective charge density, permeability, fluid viscosity and electric conductivity was reported by [3]. The magnitude of seismo electric current depends on porosity, pore size, zeta potential of the pore surfaces, and elastic properties of the matrix was investigated by [4]. The tangent of the ratio of converted electic field to pressure is approximately in inverse proportion to permeability was studied by [5]. Permeability inversion from seismoelectric log at low frequency was studied by [6]. They reported that, the tangent of the ratio among electric excitation intensity and pressure field is a function of porosity, fluid viscosity, frequency, tortuosity, fluid density and Dracy permeability. A decrease of seismo electric frequencies with increasing water content was reported by [7]. An increase of seismo electric transfer function with increasing water saturation was studied by [8]. An increase of dynamic seismo electric transfer function with decreasing fluid conductivity was described by [9]. The amplitude of seismo electric signal increases with increasing permeability which means that the seismo electric effects are directly related to the permeability and can be used to study the permeability of the reservoir was illustrated by [10]. Seismo electric coupling is frequency dependent and decreases exponentially when frequency increases was demonstrated by [11]. An increase of permeability with increasing pressure head and bubble pressure fractal dimension was reported by [12,13]. An increase of geometric relaxation time of induced polarization fractal dimension with permeability increasing and grain size was described by [14,15].
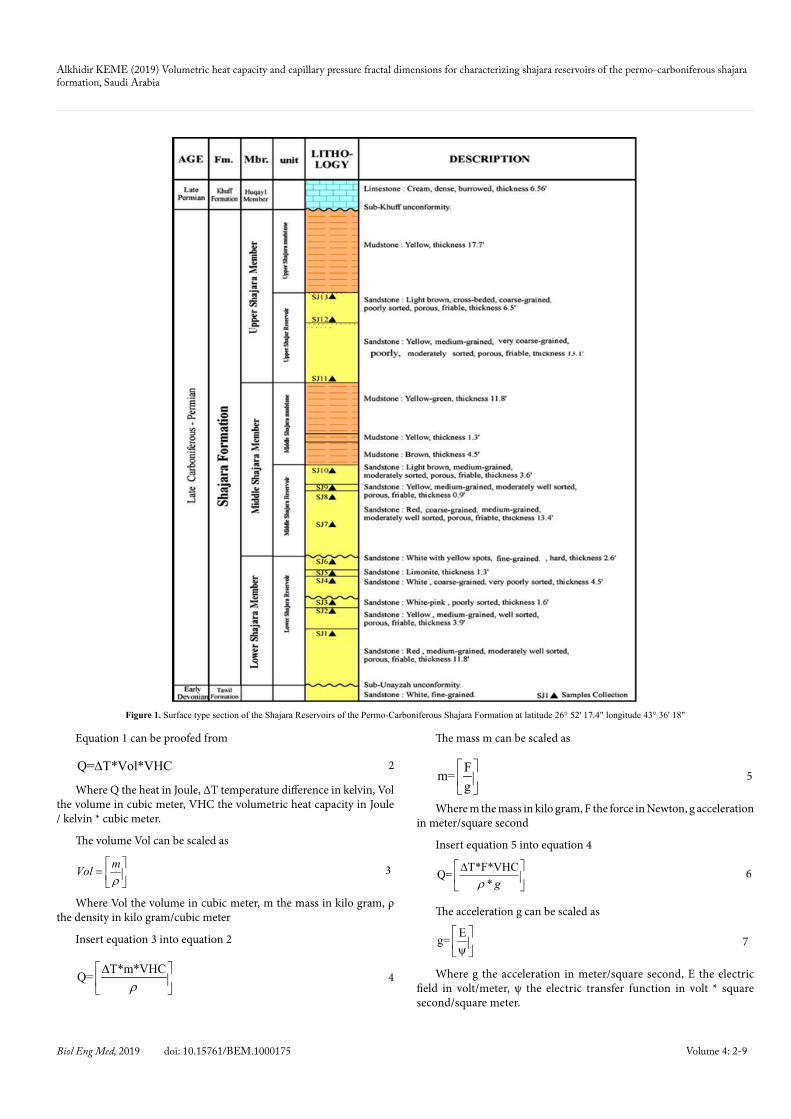
Materials and methodsSandstone samples were collected from the surface type section
of the Permo-Carboniferous Shajara Formation, latitude 26° 52’ 17.4”, longitude 43° 36’ 18” (Figure 1). Porosity was measured on collected samples using mercury intrusion Porosimetry and permeability was derived from capillary pressure data. The purpose of this paper is to obtain volumetric heat capacity fractal dimension and to confirm it by capillary pressure fractal dimension. The fractal dimension of the first procedure is determined from the positive slope of the plot of logarithm of the ratio of volumetric heat capacity to maximum volumetric heat capacity log (VHC1/2/VHC1/2
max) versus log wetting phase saturation (logSw). Whereas the fractal dimension of the second procedure is determined from the negative slope of the plot of logarithm of capillary pressure (log Pc) versus logarithm of wetting phase saturation (log Sw).
The volumetric heat capacity can be scaled as,[ ]
max
3-Df½
½
VHCSVHC
w
=
1
Where Sw the water saturation, VHC the volumetric heat capacity in Joule / kelvin * cubic meter, VHCmax the maximum volumetric heat capacity in Joule / kelvin * cubic meter, and Df the fractal dimension.
Alkhidir KEME (2019) Volumetric heat capacity and capillary pressure fractal dimensions for characterizing shajara reservoirs of the permo-carboniferous shajara formation, Saudi Arabia
Biol Eng Med, 2019 doi: 10.15761/BEM.1000175 Volume 4: 2-9
The mass m can be scaled as
Fm=g
5
Where m the mass in kilo gram, F the force in Newton, g acceleration in meter/square second
Insert equation 5 into equation 4
T*F*VHCQ=* gρ
∆
6
The acceleration g can be scaled as
Eg= ψ
7
Where g the acceleration in meter/square second, E the electric field in volt/meter, ψ the electric transfer function in volt * square second/square meter.
Equation 1 can be proofed from
Q= T*Vol*VHC∆ 2
Where Q the heat in Joule, ΔT temperature difference in kelvin, Vol the volume in cubic meter, VHC the volumetric heat capacity in Joule / kelvin * cubic meter.
The volume Vol can be scaled as
mVolρ
=
3
Where Vol the volume in cubic meter, m the mass in kilo gram, ρ the density in kilo gram/cubic meter
Insert equation 3 into equation 2
T*m*VHCQ=ρ
∆
4
Figure 1. Surface type section of the Shajara Reservoirs of the Permo-Carboniferous Shajara Formation at latitude 26° 52' 17.4" longitude 43° 36' 18"

Alkhidir KEME (2019) Volumetric heat capacity and capillary pressure fractal dimensions for characterizing shajara reservoirs of the permo-carboniferous shajara formation, Saudi Arabia
Biol Eng Med, 2019 doi: 10.15761/BEM.1000175 Volume 4: 3-9
Insert equation 7 into equation 6
T*F*VHC*Q=*Eρ
∆ ψ
8
The electric field E can be scaled as
VE=CEK
9
Where E the electric field in volt / meter, V the velocity in meter/second, CEK the electro kinetic coefficient in ampere / pascal * meter
Insert equation 9 into equation 8
T*F*VHC* *CEKQ=*Vρ
∆ ψ
10
The velocity V can be scaled as
QV=A
′
11
Where V the velocity in meter / second, Q’ the flow rate in cubic meter / second, A the area in square meter
Insert equation 11 into equation 10
T*F*VHC* *CEK*AQ=*Qρ ′
∆ ψ
12
Equation 12 after rearrange will become
T*F*VHC* *CEK*AQ*Q =ρ
∆ ψ′
13
The flow rate Q’ can be scaled as
k*A* PQ =*Lµ
∆′
14
Where Q’ the flow rate in cubic meter / second, k the permeability in square meter, A the area in square meter, ΔP the differential pressure in pascal, μ the fluid viscosity in pascal second, L the capillary length in meter.
Insert equation 14 into equation 13
T*F*VHC* *CEK*A* *LQ*K*A* P= µρ
∆ ψ∆
15
The maximum permeability kmax can be scaled as
maxmax
T*F*VHC * *CEK*A* *LQ*K *A* P= µρ
∆ ψ ∆
16
Divide equation 15 by equation 16
max max
T*F*VHC* *CEK*A* *LQ*K*A* P
Q*K *A* P T*F*VHC * *CEK*A* *L
µρ
µρ
∆ ψ ∆ = ∆ ∆ ψ
17
Equation 17 after simplification will become
max max
K VHCK VHC
= 18
Take the square root of equation 18
max max
K VHCK VHC
=
19
Equation 19 after simplification will become 1 12 2
1 12 2max max
K VHC
K VHC
=
20
But;
1 12 2
1 1max2 2
max max
K VHC rrK VHC
= =
21
Where r the pore radius in meter, rmax the maximum pore radius in meter
Take the logarithm of equation 21
1 12 2
1 1max2 2
max max
K VHC rlog log logrK VHC
= =
22
But; w
max
logSrlogr 3 Df = −
23
Insert equation 23 into equation 2212
w12max
logS VHClog3 Df VHC
= −
24
Equation 24 after log removal will become3 Df1
2
w 12max
VHCSVHC
− =
25
Equation 25 the proof of equation 1 which relates the water saturation, volumetric heat capacity, maximum volumetric heat capacity and the fractal dimension.
The capillary pressure can be scaled as
[ ]wlogS Df-3 *log Pc+constant= 26
Where Sw the water saturation, Pc the capillary pressure and Df the fractal dimension.
Results and discussionBased on field observation the Shajara Reservoirs of the Permo-
Carboniferous Shajara Formation were divided here into three units as described in Figure1.These units from bottom to top are: Lower Shajara Reservoir, Middle Shajara reservoir, and Upper Shajara Reservoir. Their attained results of the volumetric heat capacity fractal dimension and capillary pressure fractal dimension are shown in Table 1. Based on the achieved results it was found that the volumetric heat capacity fractal dimension is equal to the capillary pressure fractal dimension. The maximum value of the fractal dimension was found to be 2.7872 allocated to sample SJ13 from the Upper Shajara Reservoir as verified in Table 1. Whereas the minimum value of the fractal dimension 2.4379 was reported from sample SJ3 from the Lower Shajara reservoir as

Alkhidir KEME (2019) Volumetric heat capacity and capillary pressure fractal dimensions for characterizing shajara reservoirs of the permo-carboniferous shajara formation, Saudi Arabia
Biol Eng Med, 2019 doi: 10.15761/BEM.1000175 Volume 4: 4-9
shown in Table1. The Volumetric heat capacity fractal dimension and capillary pressure fractal dimension were detected to increase with increasing permeability as proofed in Table1 owing to the possibility of having interconnected channels.
The Lower Shajara reservoir was symbolized by six sandstone samples (Figure 1), four of which label as SJ1, SJ2, SJ3 and SJ4 were carefully chosen for capillary pressure measurement as proven in Table1. Their positive slopes of the first procedure log of the Volumetric heat capacity to maximum Volumetric heat capacity versus log wetting phase saturation (Sw) and negative slopes of the second procedure log capillary pressure (Pc) versus log wetting phase saturation (Sw) are clarified in Figures 2-5 and Table 1. Their Volumetric heat capacity fractal dimension and capillary pressure fractal dimension values are revealed in Table 1. As we proceed from sample SJ2 to SJ3 a pronounced reduction in permeability due to compaction was described from 1955 md to 56 md which reflects decrease in Volumetric heat capacity fractal dimension from 2.7748 to 2.4379 as quantified in Table 1. Again, an increase in grain size and permeability was proved from sample SJ4 whose volumetric heat capacity fractal dimension and capillary pressure fractal dimension was found to be 2.6843 as described in Table 1.
In contrast, the Middle Shajara reservoir which is separated from the Lower Shajara reservoir by an unconformity surface as revealed in Figure 1. It was nominated by four samples (Figure 1), three of which named as SJ7, SJ8, and SJ9 as illuminated in Table1 were chosen for capillary measurements as described in Table 1. Their positive slopes
of the first procedure and negative slopes of the second procedure are shown in Figures 6-8 and Table 1. Furthermore, their Volumetric heat capacity fractal dimensions and capillary pressure fractal dimensions show similarities as defined in Table 1. Their fractal dimensions are higher than those of samples SJ3 and SJ4 from the Lower Shajara Reservoir due to an increase in their permeability as explained in Table 1.
On the other hand, the Upper Shajara reservoir was separated from the Middle Shajara reservoir by yellow green mudstone as shown in Figure 1. It is defined by three samples so called SJ11, SJ12, SJ13 as explained in Table 1. Their positive slopes of the first procedure and negative slopes of the second procedure are displayed in Figures 9-11 and Table 1. Moreover, their volumetric heat capacity fractal dimension and capillary pressure fractal dimension are also higher than those of sample SJ3 and SJ4 from the Lower Shajara Reservoir due to an increase in their permeability as simplified in Table 1.
Overall a plot of positive slope of the first procedure versus negative slope of the second procedure as described in Figure 12 reveals three permeable zones of varying Petrophysical properties. These reservoir zones were also confirmed by plotting volumetric heat capacity fractal dimension versus capillary pressure fractal dimension as described in Figure 13. Such variation in fractal dimension can account for heterogeneity which is a key parameter in reservoir quality assessment.
Formation Reservoir Sample Porosity % k(md)
Positive slope of the first procedure
Slope=3-Df
Negative slope of the second
procedureSlope=Df-3
Volumetric heat capacity fractal
dimension
Capillary pressure fractal dimension
Permo-C
arboniferous Shajara Form
ation
Upper Shajara Reservoir
SJ13 25 973 0.2128 -0.2128 2.7872 2.7872SJ12 28 1440 0.2141 -0.2141 2.7859 2.7859SJ11 36 1197 0.2414 -0.2414 2.7586 2.7586
Middle Shajara Reservoir
SJ9 31 1394 0.2214 -0.2214 2.7786 2.7786SJ8 32 1344 0.2248 -0.2248 2.7752 2.7752SJ7 35 1472 0.2317 -0.2317 2.7683 2.7683
Lower Shajara Reservoir
SJ4 30 176 0.3157 -0.3157 2.6843 2.6843SJ3 34 56 0.5621 -0.5621 2.4379 2.4379SJ2 35 1955 0.2252 -0.2252 2.7748 2.7748SJ1 29 1680 0.2141 -0.2141 2.7859 2.7859
Table 1. Petrophysical model showing the three Shajara Reservoir Units with their corresponding values of Volumetric heat capacity fractal dimension and capillary pressure fractal dimension
Figure 2. Log (VHC1/2/VHC1/2max) & log pc versus log Sw for sample SJ1

Alkhidir KEME (2019) Volumetric heat capacity and capillary pressure fractal dimensions for characterizing shajara reservoirs of the permo-carboniferous shajara formation, Saudi Arabia
Biol Eng Med, 2019 doi: 10.15761/BEM.1000175 Volume 4: 5-9
Figure 3. Log (VHC1/2/VHC1/2max) & log pc versus log Sw for sample SJ2
Figure 4. Log (VHC1/2/VHC1/2max) & log pc versus log Sw for sample SJ3
Figure 5. Log (VHC1/2/VHC1/2max) & log pc versus log Sw for sample SJ4

Alkhidir KEME (2019) Volumetric heat capacity and capillary pressure fractal dimensions for characterizing shajara reservoirs of the permo-carboniferous shajara formation, Saudi Arabia
Biol Eng Med, 2019 doi: 10.15761/BEM.1000175 Volume 4: 6-9
Figure 6. Log (VHC1/2/VHC1/2max) & log pc versus log Sw for sample SJ7
Figure 7. Log (VHC1/2/VHC1/2max) & log pc versus log Sw for sample SJ8
Figure 8. Log (VHC1/2/VHC1/2max) & log pc versus log Sw for sample SJ9

Alkhidir KEME (2019) Volumetric heat capacity and capillary pressure fractal dimensions for characterizing shajara reservoirs of the permo-carboniferous shajara formation, Saudi Arabia
Biol Eng Med, 2019 doi: 10.15761/BEM.1000175 Volume 4: 7-9
Figure 9. Log (VHC1/2/VHC1/2max) & log pc versus log Sw for sample SJ11
Figure 10. Log (VHC1/2/VHC1/2max) & log pc versus log Sw for sample SJ12
Figure 11. Log (VHC1/2/VHC1/2max) & log pc versus log Sw for sample SJ13

Alkhidir KEME (2019) Volumetric heat capacity and capillary pressure fractal dimensions for characterizing shajara reservoirs of the permo-carboniferous shajara formation, Saudi Arabia
Biol Eng Med, 2019 doi: 10.15761/BEM.1000175 Volume 4: 8-9
Figure 12. Slope of the first procedure versus slope of the second procedure
Figure 13. Volumetric heat capacity fractal dimension versus capillary pressure fractal dimension
ConclusionThe sandstones of the Shajara Reservoirs of the permo-
Carboniferous Shajara Formation were divided here into three units based on volumetric heat capacity fractal dimension. The Units from base to top are: Lower Shajara Volumetric Heat Capacity Fractal Dimension Unit, Middle Shajara Volumetric Heat Capacity Fractal Dimension Unit, and Upper Shajara Volumetric Heat Capacity Fractal Dimension Unit. These units were also proved by capillary pressure fractal dimension. The fractal dimension was found to increase with increasing grain size and permeability owing to possibility of having interconnected channels.
AcknowledgementThe author would to thank King Saud University, College of
Engineering, Department of Petroleum and Natural Gas Engineering, Department of Chemical Engineering, Research Centre at College
of Engineering, College of Science, Department of Geology and Geophysics, and King Abdullah Institute for research and Consulting Studies for their supports.
References1. Frenkel J (1944) On the theory of seismic and seismoelectric phenomena in a moist
soil. J phys 3: 230-241.
2. Li K, Williams W (2007) Determination of capillary pressure function from resistivity data. Trans Porous Media 67: 1-15.
3. Revil A, Jardani A (2010) Seismoelectric response of heavy oil reservoirs: theory and numerical modelling. Geophys J Int 180: 781-797.
4. Dukhin A, Goetz P, Thommes M (2010) Seismoelectric effect: a non-isochoric streaming current.1 Experiment. J Colloid Interface Sci 345: 547-553. [Crossref]
5. Guan W, Hu H, Wang Z (2012) Permeability inversion from low-frequency seismoelectric logs in fluid- saturated porous formations. Geophys Prospect 61: 120-133.
6. Hu H, Guan W, Zhao W (2012) Theoretical studies of permeability inversion from seismoelectric logs. Geophys Res Abs 14: EGU2012-6725-1.
Alkhidir KEME (2019) Volumetric heat capacity and capillary pressure fractal dimensions for characterizing shajara reservoirs of the permo-carboniferous shajara formation, Saudi Arabia
Biol Eng Med, 2019 doi: 10.15761/BEM.1000175 Volume 4: 9-9
7. Borde C, Senechal P, Barriere J, Brito D, Normandin et al. (2015) Impact of water saturation on seismoelectric transfer functions: a laboratory study of co-seismic phenomenon. Geophys J Int 200: 1317-1335.
8. Jardani A, Revil A (2015) Seismoelectric couplings in a poroelastic material containing two immiscible fluid phases. Geophys J Int 202: 850-870.
9. Holzhauer J, Brito D, Bordes C, Brun Y, Guatarbes B, et al. (2016) Experimental quantification of the seismoelectric transfer function and its dependence on conductivity and saturation in loose sand. Geophys Prospect 65: 1097-1120.
10. Ping R, Wei JX, Di BR, Ding PB, Liu ZC, et al. (2016) Experimental research on seismoelectric effects in sandstone. Appl Geophys 13: 425-436.
11. Djuraev U, Jufar SR, Vasant P (2017) Numerical Study of frequency-dependent seismo electric coupling in partially-saturated porous media. MATEC Web of Conferences.
12. Al-khidir KEME (2017) Pressure head fractal dimension for characterizing Shajara Reservoirs of the Shajara Formation of the Permo-Carboniferous Unayzah Group, Saudi Arabia. Arch Pet Environ Biotechnol 2: 1-7.
13. Al-Khidir KE (2018) On Similarity of Pressure Head and Bubble Pressure Fractal Dimensions for Characterizing Permo-Carboniferous Shajara Formation, Saudi Arabia. J Indust Pollut oxic 1: 1-10.
14. Al-khidir KEME (2018) Geometric relaxation time of induced polarization fractal dimension for characterizing Shajara Reservoirs of the Shajara Formation of the Permo-Carboniferous Unayzah Group, Saudi Arabia. SF J Petrol 2: 1-6.
15. Alkhidir KEME (2018) Geometric relaxation time of induced polarization fractal dimension for characterizing Shajara Reservoirs of the Shajara formation of the Permo-Carboniferous Unayzah Group-Permo. Int J Pet Res 2: 105-108.
Copyright: ©2019 Alkhidir KEME. This is an open-access article distributed under the terms of the Creative Commons Attribution License, which permits unrestricted use, distribution, and reproduction in any medium, provided the original author and source are credited.


![Capillary thermostatting in capillary electrophoresis · Capillary thermostatting in capillary electrophoresis ... 75 µm BF 3 Injection: ... 25-µm id BF 5 capillary. Voltage [kV]](https://static.fdocuments.in/doc/165x107/5c176ff509d3f27a578bf33a/capillary-thermostatting-in-capillary-electrophoresis-capillary-thermostatting.jpg)