Volume1:MainReport - water footprintwaterfootprint.org/media/downloads/Report50-NationalWater... ·...
50
Value of Water Research Report Series No. 50 National water footprint accounts: The green, blue and grey water footprint of production and consumption Volume 1: Main Report Value of Water M.M. Mekonnen A.Y. Hoekstra May 2011
Transcript of Volume1:MainReport - water footprintwaterfootprint.org/media/downloads/Report50-NationalWater... ·...

Value of Water Research Report Series No. 50
National water
footprint accounts:
The green, blue and grey
water footprint of
production and consumption
Volume 1: Main Report
Value of Water
M.M. Mekonnen
A.Y. Hoekstra
May 2011


NATIONAL WATER FOOTPRINT ACCOUNTS:
THE GREEN, BLUE AND GREY WATER FOOTPRINT
OF PRODUCTION AND CONSUMPTION
VOLUME 1: MAIN REPORT
M.M. MEKONNEN1
A.Y. HOEKSTRA1,2
MAY 2011
VALUE OF WATER RESEARCH REPORT SERIES NO. 50
1 Twente Water Centre, University of Twente, Enschede, The Netherlands
2 Contact author: Arjen Y. Hoekstra, [email protected]

© 2011 M.M. Mekonnen and A.Y. Hoekstra.
Published by:
UNESCO-IHE Institute for Water Education
P.O. Box 3015
2601 DA Delft
The Netherlands
The Value of Water Research Report Series is published by UNESCO-IHE Institute for Water Education, in
collaboration with University of Twente, Enschede, and Delft University of Technology, Delft.
All rights reserved. No part of this publication may be reproduced, stored in a retrieval system, or transmitted, in
any form or by any means, electronic, mechanical, photocopying, recording or otherwise, without the prior
permission of the authors. Printing the electronic version for personal use is allowed.
Please cite this publication as follows:
Mekonnen, M.M. and Hoekstra, A.Y. (2011) National water footprint accounts: the green, blue and grey water
footprint of production and consumption, Value of Water Research Report Series No. 50, UNESCO-IHE, Delft,
the Netherlands.

Contents
Summary ................................................................................................................................................................. 5
1. Introduction ........................................................................................................................................................ 7
2. Method and data ............................................................................................................................................... 11
2.1. Accounting framework ............................................................................................................................ 11
2.2. Water footprints of national production ................................................................................................... 12
2.3. International virtual water flows .............................................................................................................. 12
2.4. National and global water savings related to international trade ............................................................. 13
2.5. Water footprints of national consumption ............................................................................................... 13
3. Results .............................................................................................................................................................. 17
3.1. The water footprint of national production .............................................................................................. 17
3.2. International virtual water flows related to trade in agricultural and industrial products ........................ 20
3.3. National water saving per country as a result of trade ............................................................................. 22
3.4. Global water saving related to trade in agricultural and industrial products ............................................ 23
3.5. The water footprint of national consumption ........................................................................................... 25
3.6. External water dependency of countries .................................................................................................. 28
3.7. Mapping the global water footprint of national consumption: an example from the US ......................... 32
4. Discussion ........................................................................................................................................................ 37
5. Conclusion ........................................................................................................................................................ 39
References ............................................................................................................................................................. 41
Appendices……..…………………………………………………………………………………………Volume 2


Summary
This study quantifies and maps the water footprints of nations from both a production and consumption
perspective and estimates international virtual water flows and national and global water savings as a result of
trade. The entire estimate includes a breakdown of water footprints, virtual water flows and water savings into
their green, blue and grey components. The main finding of the study can be summarized as:
The global water footprint in the period 1996-2005 was 9087 Gm3/yr (74% green, 11% blue, 15% grey).
Agricultural production contributes 92% to this total footprint.
About one fifth of the global water footprint relates to production for export.
The total volume of international virtual water flows related to trade in agricultural and industrial products
was 2320 Gm3/yr (68% green, 13% blue, 19% grey). Trade in crop products contributes 76% to the total
volume of international virtual water flows; trade in animal and industrial products contribute 12% each. As
a global average, the blue and grey shares in the total water footprint of internationally traded products are
slightly larger than in the case of domestically consumed products.
Mexico and Spain are the two countries with the largest national blue water savings as a result of trade.
The global water saving as a result of trade in agricultural products in the period 1996-2005 was 369 Gm3/yr
(59% green, 27% blue, 15% grey), which is equivalent to 4% of the global water footprint related to
agricultural production. The global blue water saving is equivalent to 10% of the global blue water footprint
related to agricultural production, which indicates that virtual water importing countries generally depend
more strongly on blue water for crop production than the virtual water exporting countries. The largest global
water saving (53%) is due to trade in cereal crops, followed by oil crops (22%) and animal products (15%).
International trade in industrial products can be associated with an increased global water footprint that is
equivalent to 4% of the global water footprint related to industrial production.
The water footprint of the global average consumer in the period 1996-2005 was 1385 m3/yr. About 92% of
the water footprint is related to the consumption of agricultural products, 5% to the consumption of
industrial goods, and 4% to domestic water use.
The average consumer in the US has a water footprint of 2842 m3/yr, while the average citizens in China
and India have water footprints of 1071 m3/yr and 1089 m3/yr respectively.
Consumption of cereal products gives the largest contribution to the water footprint of the average consumer
(27%), followed by meat (22%) and milk products (7%). The contribution of different consumption
categories to the total water footprint varies across countries.
The volume and pattern of consumption and the water footprint per ton of product of the products consumed
are the main factors determining the water footprint of a consumer.
The study illustrates the global dimension of water consumption and pollution by showing that several countries
heavily rely on water resources elsewhere (for example Mexico depending on virtual water imports from the US)
and that many countries have significant impacts on water consumption and pollution elsewhere (for example
Japan and many European countries due to their large external water footprints).


1. Introduction
The earth’s freshwater resources are subject to increasing pressure in the form of consumptive water use and
pollution (Postel, 2000; WWAP, 2003, 2006, 2009). Until recently, issues of freshwater availability, use and
management have been addressed at a local, national and river basin scale. The recognition that freshwater
resources are subject to global changes and globalization have led a number of researchers to argue for the
importance of putting freshwater issues in a global context (Postel et al., 1996; Vörösmarty et al., 2000; Hoekstra
and Hung, 2005; Hoekstra and Chapagain, 2008; Hoff, 2009). Appreciating the global dimension of freshwater
resources can be regarded as a key to solving some of today’s most urgent water problems (Hoekstra, 2011).
In formulating national water plans, governments have traditionally taken a purely national perspective, aiming
at matching national water supplies to national water demands. Governments have looked for ways to satisfy
water users without questioning the total amount of water demands. Even though governments nowadays
consider options to reduce water demands, in addition to options to increase supplies, they generally do not
consider the global dimension of water demand patterns. Since production processes in a global economy can
shift from one place to another, water demands can be met outside the boundaries of a nation through the import
of commodities. All countries trade water-intensive commodities, but few governments explicitly consider
options to save water through import of water-intensive products or to make use of relative water abundance to
produce water-intensive commodities for export. In addition, by looking at water use within only their own
country, governments do not have a comprehensive view of the sustainability of national consumption. Many
countries have significantly externalized their water footprint without looking at whether the imported products
are related to water depletion or pollution in the producing countries. Knowledge of the dependency on water
resources elsewhere is relevant for a national government, not only when evaluating its environmental policy but
also when assessing national food security.
Understanding the water footprint of a nation is highly relevant for developing well-informed national policy.
Conventional national water use accounts are restricted to statistics on water withdrawals within their own
territory (Van der Leeden et al., 1990; Gleick, 1993; FAO, 2010b). National water footprint accounts extend
these statistics by including data on green water use and volumes of water use for waste assimilation and by
adding data on water use in other countries for producing imported products as well as data on water use within
the country for making export products (Hoekstra et al., 2011).
Quantifying and mapping ‘national water footprints’ is an evolving field of study since the introduction of the
water footprint concept in the beginning of this century (Hoekstra, 2003). The first global study on the water
footprints of nations was carried out by Hoekstra and Hung (2002); a second, much more comprehensive study,
was done by Hoekstra and Chapagain and reported in a number of subsequent publications: Chapagain and
Hoekstra (2004, 2008), Chapagain et al. (2006) and Hoekstra and Chapagain (2007a, 2008). The current study is
the third global assessment of national water footprints, which improves upon the previous assessments in a
number of respects as will be elaborated below.

8 / National water footprint accounts
The objective of this study is to estimate the water footprints of nations from both a production and consumption
perspective. First, we quantify and map at a high spatial resolution the green, blue and grey water footprints
within countries associated with agricultural production, industrial production and domestic water supply.
Second, we estimate international virtual water flows related to trade in agricultural and industrial commodities.
Based on these flows, we estimate national and global water savings that can be associated with these trade
flows. Finally, we quantify and map the water footprint of consumption for all countries of the world
distinguishing for each country between the internal and the external water footprint of national consumption.
Throughout the study we explicitly distinguish between green, blue and grey water footprints.
The current study is more comprehensive and detailed than the earlier two global water footprint studies
(Hoekstra and Hung, 2002; Hoekstra and Chapagain, 2008). It is also more comprehensive than the
contemporary study by Fader et al. (2011), who estimate the global green and blue water footprint of
consumption showing the internal and external water footprint per country. This study excludes the grey water
footprint component and is restricted to an analysis of the water footprint of consuming crop products, leaving
out the water footprints of farm animal products, industrial products and domestic water supply.
Apart from the global water footprint studies mentioned, several water footprint studies with a focus on a
specific country were published in the past few years: Vincent et al. (2011) for Belgium; Ma et al. (2006), Liu
and Savenije (2008), Hubacek et al. (2009) and Zhao et al. (2009) for China; Sonnenberg et al. (2009) for
Germany; Kampman et al. (2008) for India; Bulsink et al. (2009) for Indonesia; Hoekstra and Chapagain (2007b)
for Morocco; Hoekstra and Chapagain (2007b) and Van Oel et al. (2009) for the Netherlands; Aldaya et al.
(2010) and Garrido et al. (2010) for Spain; Sonnenberg et al. (2010) for Switzerland; Chahed et al. (2008) for
Tunisia; and Chapagain and Orr (2008), Yu et al. (2010) and Feng et al. (2011) for the UK. The scope,
assumptions and data sources in these country studies vary widely, so these studies cannot be used to make
comparisons between countries.
The current study is a global study that allows a comparison of the water footprints of different countries,
because the same method, assumptions and databases are applied for all countries. The study improves upon the
previous global water footprint study – Hoekstra and Chapagain (2008) – in a number of respects:
We apply a high spatial resolution in estimating the water footprint in crop production, industrial production
and domestic water supply.
In the case of crop production, we make an explicit distinction between the green and blue water footprint. In
addition, we include the grey water footprint in the estimation of the water footprint in agricultural
production.
We account for actual irrigation, so we do not take irrigation requirements as a proxy for blue water
consumption.
We make use of better estimates of the feed composition of farm animals (which is relevant for the
estimation of the water footprint of farm animal products).

National water footprint accounts / 9
We distinguish three different animal production systems (grazing, mixed and industrial) in each country,
accounting for the relative presence of those three systems.
We explicitly distinguish between the blue and grey water footprint in industrial production and domestic
water supply and account for wastewater treatment coverage per country.
We apply the bottom-up approach in estimating the water footprint of national consumption of agricultural
products, which is less sensitive to trade data than the top-down approach.
We add calculations of national and global water savings related to trade in industrial products.
We consider a ten-year period (1996-2005), while the earlier study analysed a five-year period (1997-2001).
The current report builds on two earlier studies by the same authors. In Mekonnen and Hoekstra (2010b, 2011)
we have reported the green, blue and grey water footprints of crops and derived crop products. In Mekonnen and
Hoekstra (2010c) we documented the green, blue and grey water footprints of farm animals and animal products.


2. Method and data
2.1. Accounting framework
In this study we adopt the terminology and calculation methodology as set out in The Water Footprint
Assessment Manual, which contains the global standard for water footprint assessment developed by the Water
Footprint Network (Hoekstra et al., 2011). The ‘water footprint’ is a measure of human’s appropriation of
freshwater resources. Freshwater appropriation is measured in terms of water volumes consumed (evaporated or
incorporated into a product) or polluted per unit of time. A water footprint has three components: green, blue and
grey. The blue water footprint refers to consumption of blue water resources (surface and ground water). The
green water footprint is the volume of green water (rainwater) consumed, which is particularly relevant in crop
production. The grey water footprint is an indicator of the degree of freshwater pollution and is defined as the
volume of freshwater that is required to assimilate the load of pollutants based on existing ambient water quality
standards. The water footprint is a geographically explicit indicator, showing not only volumes of water
consumption and pollution, but also the locations.
Figure 1. The national water footprint accounting scheme. Source: Hoekstra et al. (2011).
The framework for national water footprint accounting is shown in Figure 1. One can see that ‘the water
footprint of national consumption’ is different from ‘the water footprint within the area of the nation’. The latter
is the water footprint of national production, defined as the total freshwater volume consumed or polluted within
the territory of the nation as a result of activities within the different sectors of the economy. It can be calculated
by summing the water footprints of all water consuming or polluting processes taking place in the nation.
Generally, one can distinguish three main water using sectors: the agricultural sector, the industrial sector and
the domestic water supply sector. On the other hand, the water footprint of national consumption is defined as
the total volume of freshwater that is used to produce the goods and services consumed by the inhabitant of the
nation. It consists of two components: the internal and external water footprint of national consumption. The
internal water footprint is defined as the use of domestic water resources to produce goods and services
Internal water footprint of
national consumption
External water footprint of
national consumption
+ Water footprint
of national consumption
=
Virtual water export related to domestically made products
Virtual water re-export
+ Virtual water export
=
+ + +
Water footprint within the area of the nation
Virtual water import +
Virtual water budget =
= = =

12 / National water footprint accounts
consumed by the nation’s population. It is the sum of the water footprint within the nation minus the volume of
virtual-water export to other nations related to the export of products produced with domestic water resources.
The external water footprint is defined as the volume of water resources used in other nations to produce goods
and services consumed by the population in the nation under consideration. It is equal to the virtual-water import
into the nation minus the volume of virtual-water export to other nations as a result of re-export of imported
products. The virtual-water export from a nation consists of exported water of domestic origin and re-exported
water of foreign origin. The virtual-water import into a nation will partly be consumed, thus constituting the
external water footprint of national consumption, and may partly be re-exported. The sum of the virtual water
import into a country and the water footprint within the area of the nation is equal to the sum of the virtual water
export from the nation and the water footprint of national consumption. This sum is called the virtual-water
budget of a nation.
2.2. Water footprints of national production
The water footprints within nations related to crop production were obtained from Mekonnen and Hoekstra
(2010a, 2010b, 2011), who estimated the global water footprint of crop production with a crop water use model
at a 5 by 5 arc minute spatial resolution. The water footprints within nations related to water use in livestock
farming, were obtained from Mekonnen and Hoekstra (2010c). The water footprints within nations related to
industrial production and domestic water supply were estimated in this study using water withdrawal data from
the AQUASTAT database (FAO, 2010b). For some countries, water withdrawal data were taken from
EUROSTAT (2011). We have assumed that 5% of the water withdrawn for industrial purposes is actual
consumption (blue water footprint) and that the remaining fraction is return flow; for the domestic water supply
sector we assumed a consumptive portion of 10% (FAO, 2010b). The part of the return flow which is disposed
into the environment without prior treatment has been taken as a measure of the grey water footprint, thus
assuming a dilution factor of 1. Data on the wastewater treatment coverage per country were obtained from the
United Nations Statistical Division database (UNSD, 2010a). For countries for which we could not find data, we
assumed zero wastewater treatment coverage. Domestic wastewater treatment coverage data are generally
specified for urban areas only; we used data on urban populations per country from FAO (2010a) to estimate the
grey water footprint from domestic water supply in urban areas. For rural areas we assumed zero treatment. For
treatment coverage in the industrial sector per country we used data on municipal treatment coverage in urban
areas as an indicator. Water footprints related to industrial production and domestic water supply were mapped
using the global population density map from CIESIN and CIAT (2005).
2.3. International virtual water flows
International virtual-water flows are calculated by multiplying, per trade commodity, the volume of trade by the
respective average water footprint per ton of product in the exporting nation. When a product is exported from a
country that does not produce the product we have assumed the global average product water footprint for that
trade flow.

National water footprint accounts / 13
Data on international trade in agricultural and industrial products have been taken from the SITA database
(Statistics for International Trade Analysis) available from the International Trade Centre (ITC, 2007). This
database covers trade data over ten years (1996-2005) from 230 reporting countries disaggregated by product
and partner countries. Country-specific estimates on the green, blue and grey water footprints of 146 crops and
more than two hundred derived crop products per ton of product were taken from Mekonnen and Hoekstra
(2010b). Estimates on the water footprints of farm animals (beef cattle, dairy cattle, pig, sheep, goat, broiler
chicken, layer chicken and horses) and animal products per ton of product were taken from Mekonnen and
Hoekstra (2010c). The national average water footprint per dollar of industrial product was calculated per
country by dividing the total national water footprint in the industrial sector by the value added in industrial
sector. The latter was obtained from the United Nations Statistical Division database (UNSD, 2010b).
2.4. National and global water savings related to international trade
The national water saving of a country as a result of trade in a certain commodity is calculated as the net import
volume of this commodity times the water footprint of the commodity per commodity unit in the country
considered. Obviously, the calculated saving can have a negative sign, which means a net national water loss
instead of a saving. The global water saving through trade in a commodity between two countries is calculated as
the trade volume times the difference between the water footprints of the commodity per unit of the commodity
in the importing and the exporting country. The total global water saving is obtained by summing up the global
savings of all international trade flows. By definition, the total global water saving is equal to the sum of the
national savings of all nations.
2.5. Water footprints of national consumption
The water footprint of national consumption (in m3/yr) is calculated by adding the direct water footprint of
consumers and two indirect water footprint components:
, , ,( ) ( )cons cons dir cons indir cons indirWF WF WF agricultural commodities WF industrial commodities (1)
The direct water footprint of consumers within the nation (WFcons,dir) refers to consumption and pollution of
water related to domestic water supply. The indirect water footprint of consumers (WFcons,indir) refers to the water
use by others to make the commodities consumed, whereby we distinguish between agricultural and industrial
commodities.
The water footprint of national consumption of agricultural and industrial commodities can be calculated through
either the top-down or the bottom-up approach (Hoekstra et al., 2011). In the top-down approach, the water
footprint of national consumption is calculated as the water footprint within the nation plus the virtual-water
import minus the virtual-water export. The gross virtual-water import is calculated by multiplying import
volumes of various products by their respective product water footprint in the nation of origin. The gross virtual-
water export is found by multiplying the export volumes of the various export products by their respective

14 / National water footprint accounts
product water footprint. In the bottom-up approach, the water footprint of national consumption is calculated by
adding the direct and indirect water footprints of consumers within the nation.
For agricultural commodities, the water footprint of national consumption is calculated in this study based on the
bottom-up approach. It is calculated by multiplying all agricultural products consumed by the inhabitants of the
nation by their respective product water footprint:
, ( ) ( [ ] [ ])cons indir prodp
WF agricultural commodities C p WF p (2)
C[p] is consumption of agricultural product p by consumers within the nation (ton/yr) and WF*prod[p] the water
footprint of this product (m3/ton). We consider the full range of final agricultural goods. Data on national
consumption of agricultural products per country for the period 1996-2005 were taken from the Supply and
Utilization Accounts (SUA) of the Food and Agriculture Organization of the United Nations (FAO, 2010a). For
edible products, we have taken the “food” column multiplied by a certain factor representing seed and waste. For
fibre, hide and skin products, we took the “other utilization” column, again multiplied by a certain factor
representing seed and waste. The multiplication factor was calculated per product as the global production
divided by the difference between the global production and volume of seed and waste.
The volume of agricultural product p consumed in a nation will generally originate in part from the nation itself
and in part from other nations. The average water footprint of a product p consumed in a nation is:
e
e
nei
neprodeiprod
prodp,nTpP
p,nWFp,nTpWFpP
pWF][][
][][][][
][ (3)
in which P[p] represents the production quantity of product p in the nation, Ti[ne,p] the imported quantity of
product p from exporting nation ne, WFprod[p] the water footprint of product p when produced in the nation
considered and WFprod[ne,p] the water footprint of product p as in the exporting nation ne. The assumption made
here is that the total consumption volume originates from domestic production and imports according to their
relative volumes. The water footprints of agricultural products were taken from Mekonnen and Hoekstra (2010b,
2010c).
For industrial commodities, the water footprint of national consumption is calculated based on the top-down
approach as the water footprint of industrial processes taking place within the nation plus the virtual-water
import related to import of industrial commodities minus the virtual-water export.
The external water footprint of national consumption (WFcons,ext) is estimated based on the relative share of the
virtual water import to the total water budget:

National water footprint accounts / 15
,i
cons ext consarea i
VWF WF
WF V
(4)
in which WFarea is the water footprint within a nation and Vi the virtual water import. We apply this formula
separately for the category of agricultural products (crop and animal products) and for the category of the
industrial products. The internal water footprint of national consumption (WFcons,int) is calculated as:
,area
cons int consarea i
WFWF WF
WF V
(5)
For mapping the global water footprint of the consumption of a certain country at a high spatial resolution, we
distinguish between mapping the internal and the external water footprint. The internal water footprint is mapped
by taking the shares of the water footprints within the different grid cells in the country that contribute to the
water footprint of national consumption. Mapping the external water footprint is done in two steps. First, we
quantify the external water footprint per product category per trade partner country based on the relative import
from different trade partners. Second, within each trade partner country we map the external water footprint by
taking the shares of the water footprints within the different grid cells in the trade partner country that contribute
to the water footprint of consumption in our country under consideration. We could not trace the external water
footprint of imported animal products at grid level because of data limitations.
In a case study for the US, we applied the above approach but took a more refined, though laborious, approach
by applying the whole procedure separately for each crop type and animal type. For (domestically produced and
consumed) animal products we identify the feed volumes from the country itself and from abroad, and for each
feed crop we map the internal and external water footprints using the same approach as for food crops. The
category of the industrial products was still treated as one category. The mapping of the external water footprint
is slightly improved this way, but more importantly, it enabled us to trace the external water footprint not only by
location but also by crop.


3. Results
3.1. The water footprint of national production
Figure 2 shows world maps with the green, blue and grey water footprints within nations in the period 1996-
2005. China, India and the US are the countries with the largest total water footprints within their territory, with
total water footprints of 1207, 1182 and 1053 Mm3/yr, respectively. About 38% of the water footprint of global
production lies within these three countries. The next country in the ranking is Brazil, with a total water footprint
within its territory of 482 Mm3/yr. India is the country with the largest blue water footprint within its territory:
243 Mm3/yr, which is 24% of the global blue water footprint. Irrigation of wheat is the process that takes the
largest share (33%) in India’s blue water footprint, followed by irrigation of rice (24%) and irrigation of
sugarcane (16%). China is the country with the largest grey water footprint within its borders: 360 Mm3/yr,
which is 26% of the global grey water footprint.
Figure 3 shows world maps with the water footprints of agricultural production, industrial production and related
to domestic water supply. In all countries of the world, the water footprint related to agricultural production takes
the largest share in the total water footprint within the country. China and the US have the largest water
footprints in their territory related to industrial production; 22% of the global water footprint related to industrial
production lies in China and 18% in the US. Belgium is the country in which industrial production takes the
largest share in the total water footprint in the country. The water footprint of industries in Belgium contributes
41% to the total water footprint in the country; agricultural production still contributes 53% here. Full statistics
on the green, blue and grey water footprints related to agricultural and industrial production and domestic water
supply per country are provided in Appendix I.
The global water footprint related to agricultural and industrial production and domestic water supply for the
period 1996-2005 was 9087 Gm3/yr (74% green, 11% blue, 15% grey; see Table 1). Agricultural production
takes the largest share, accounting for 92% of the global water footprint. Industrial production contributes 4.4%
to the total water footprint and domestic water supply 3.6%.
The global water footprint related to producing goods for export is 1762 Gm3/yr. In the agricultural sector, 19%
of the total water footprint relates to production for export; in the industrial sector this is 41%. The water
footprint related to domestic water supply does not relate to export at all. Taken as an average over the three
water-using sectors, we find that 19% of the global water footprint is not for domestic consumption but for
export.

18 / National water footprint accounts
Figure 2. The green, blue and grey water footprints within nations in the period 1996-2005. The data are shown in mm/yr on a 5 by 5 arc minute grid. Data per grid cell have been calculated as the water footprint within a grid cell (in m3/yr) divided by the area of the grid cell (in 103 m2).

National water footprint accounts / 19
Figure 3. The water footprint within nations in the period 1996-2005, shown by sector: the total water footprint of agricultural production (above), the total water footprint of industrial production (middle) and the total water footprint related to domestic water supply (below). The data are shown in mm/yr on a 5 by 5 arc minute grid. Data per grid cell have been calculated as the water footprint within a grid cell (in m3/yr) divided by the area of the grid cell (in 103 m2).

20 / National water footprint accounts
Table 1. Global water footprint of production (1996-2005).
Agricultural production
Industrial production
Domestic water supply
Total Crop
production Pasture
Water supply in animal raising
Global water footprint of production (Gm3/yr)
- Green 5771* 913** - - - 6684
- Blue 899* - 46** 38 42 1025
- Grey 733* - - 363 282 1378
- Total 7404 913 46 400 324 9087
Water footprint for export (Gm3/yr)
- - - - - - - - - - - - - - - - 1597 - - - - - - - - - - - - - - - - 165 0 1762
Water footprint for export compared to total (%)
- - - - - - - - - - - - - - - - - - 19 - - - - - - - - - - - - - - - - - 41 0 19
* Source: Mekonnen and Hoekstra (2010b; 2011).
** Source: Mekonnen and Hoekstra (2010c).
3.2. International virtual water flows related to trade in agricultural and industrial products
The global sum of international virtual water flows for the period 1996-2005 was 2320 Gm3/yr (68% green, 13%
blue and 19% grey). The largest share (76%) of the virtual water flows between countries is related to
international trade in crops and derived crop products. Trade in animal products and industrial products
contributed 12% each to the global virtual water flows. The volume of global virtual water flows related to
domestically produced products was 1762 Gm3/yr. The gross international virtual water flows are presented in
Table 2. Appendix II tabulates the virtual water flows per country.
Table 2. Gross international virtual water flows (Gm3/yr). Period 1996-2005.
Related to trade in
agricultural products Related to trade in industrial products
Total
Related to export of domestically produced goods 1597 165 1762
Related to re-export of imported goods 441 117 558
Total 2038 282 2320
As a global average, the blue and grey shares in the total water footprint of internationally traded products are
slightly larger than in the case of domestically consumed products. This means that export goods are more
strongly related to water consumption from and pollution of surface and groundwater than non-export goods.
The green component in the total water footprint of internationally traded products is 68%, while it is 74% for
total global production.
The major gross virtual water exporters, which together account for more than half of the global virtual water
export, are the US (314 Gm3/yr), China (143 Gm3/yr), India (125 Gm3/yr), Brazil (112 Gm3/yr), Argentina (98
Gm3/yr), Canada (91 Gm3/yr), Australia (89 Gm3/yr), Indonesia (72 Gm3/yr), France (65 Gm3/yr) and Germany

National water footprint accounts / 21
(64 Gm3/yr). The US, Pakistan, India, Australia, Uzbekistan, China and Turkey are the largest blue virtual water
exporters, accounting for 49% of the global blue virtual water export. All of these countries are partially under
water stress (Alcamo and Henrichs, 2002; Alcamo et al. 2003; Smakhtin et al., 2004). This raises the question
whether the implicit or explicit choice to consume the limited national blue water resources for export products
is sustainable and most efficient. Closely related to this is the question to what extent the scarcity is reflected in
the price of water in these countries. Given the fact that all the externalities and a scarcity rent are seldom
included in the price of water, most particular in agriculture, one cannot expect that production and trade patterns
automatically account for regional water scarcity patterns.
The major gross virtual water importers are the US (234 Gm3/yr), Japan (127 Gm3/yr), Germany (125 Gm3/yr),
China (121 Gm3/yr), Italy (101 Gm3/yr), Mexico (92 Gm3/yr), France (78 Gm3/yr), the UK (77 Gm3/yr) and the
Netherlands (71 Gm3/yr).
Figure 4 shows the virtual water balance per country and the largest international gross virtual water flows. The
countries shown in green colour have a negative balance, which means that they have net virtual water export.
The countries shown in yellow to red have net virtual water import. The biggest net exporters of virtual water are
found in North and South America (the US, Canada, Brazil and Argentina), Southern Asia (India, Pakistan,
Indonesia, Thailand) and Australia. The biggest net virtual water importers are North Africa and the Middle East,
Mexico, Europe, Japan and South Korea.
Figure 4. Virtual water balance per country and direction of gross virtual water flows related to trade in agricultural and industrial products over the period 1996-2005. Only the biggest gross flows (> 15 Gm3/yr) are shown; the fatter the arrow, the bigger the virtual water flow.
The largest share of the international virtual water flows relates to trade in oil crops (including cotton, soybean,
oil palm, sunflower, rapeseed and others) and derived products. This category accounts for 43% of the total sum
of international virtual water flows. More than half of this amount relates to trade in cotton products; about one
fifth relates to trade in soybean. The other products with a large share in the global virtual water flows are cereals
(17%), industrial products (12.2%), stimulants (7.9%) and beef cattle products (6.7%). Figure 5 shows the
contribution of different product categories to the global sum of international virtual water flows. Virtual water
flows per product category are presented in Appendix III.

22 / National water footprint accounts
Oilcrops42.7%
Cereals17.0%
Industrial products12.2%
Stimulants7.9%
Bovine products6.7%
Sugarcrops3.5%
Fruits2.0%
Milk products1.6%
Swine products1.5%
Pulses0.8%
Poultry0.8%
Spices0.7%
Horse0.5%
Nuts0.5% Sheep
0.5%
Roots and Tubers0.3%
Tobacco0.2%
Other0.5%
Other6.4%
Figure 5. Contribution of different product categories to the global virtual water flows
3.3. National water saving per country as a result of trade
A number of countries reduce the use of their national water resources through the import of agricultural
products. Japan saves 134 Gm3/yr (80% green, 9% blue, 12% grey) of its domestic water resources, Mexico 83
Gm3/yr (69% green, 26% blue, 6% grey), Italy 54 Gm3/yr (83% green, 10% blue, 7% grey), the UK 53 Gm3/yr
(75% green, 15% blue, 9% grey) and Germany 50 Gm3/yr (83% green, 14% blue, 3% grey). In terms of blue
water saved, Mexico, Spain, Japan, the UK and a number of countries in the Middle East come on top of the list.
Appendix IV presents green, blue and grey water savings per country as a result of trade in crop, animal and
industrial products. The figures on ‘national water saving’ presented here should be merely understood as
‘volumes of domestic water resources not necessary to be used for production because the commodities are
imported’. The term ‘saving’ is used in a physical, not economic sense. Besides, the ‘water saving’ does not
necessarily imply that the water saved is allocated to other beneficial uses (De Fraiture et al. 2004). In water-
scarce countries, however, ‘water saving’ is likely to have positive environmental, social and economic
implications.
From a water resources point of view, one would expect that countries facing water stress adopt a trade strategy
that alleviates their water scarcity problem. However, international trade in agricultural goods is driven largely
by factors other than water. Therefore, import of virtual water is often unrelated to relative water scarcity in a
country (Yang et al., 2003; De Fraiture et al., 2004; Oki and Kanae, 2004; Chapagain and Hoekstra, 2008; Yang
and Zehnder, 2008). As shown by Yang et al. (2003), only below a certain threshold in water availability can a
relationship be established between the country’s per capita water availability and its cereal import. For most
relatively water-scarce countries – like in North Africa, Middle East, Southern Europe and Mexico – we find
indeed net virtual water imports and related national water savings. The national water savings found for
Northern European countries, however, cannot be understood from a water scarcity perspective.
National water footprint accounts / 23
3.4. Global water saving related to trade in agricultural and industrial products
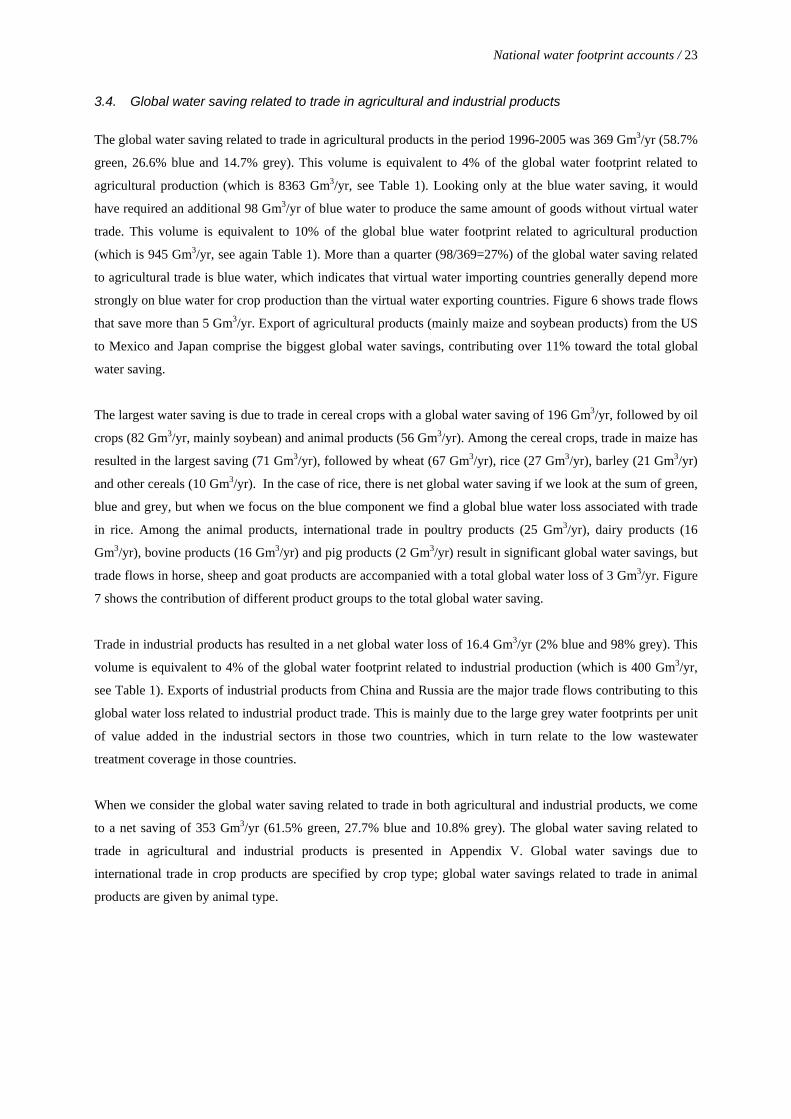
The global water saving related to trade in agricultural products in the period 1996-2005 was 369 Gm3/yr (58.7%
green, 26.6% blue and 14.7% grey). This volume is equivalent to 4% of the global water footprint related to
agricultural production (which is 8363 Gm3/yr, see Table 1). Looking only at the blue water saving, it would
have required an additional 98 Gm3/yr of blue water to produce the same amount of goods without virtual water
trade. This volume is equivalent to 10% of the global blue water footprint related to agricultural production
(which is 945 Gm3/yr, see again Table 1). More than a quarter (98/369=27%) of the global water saving related
to agricultural trade is blue water, which indicates that virtual water importing countries generally depend more
strongly on blue water for crop production than the virtual water exporting countries. Figure 6 shows trade flows
that save more than 5 Gm3/yr. Export of agricultural products (mainly maize and soybean products) from the US
to Mexico and Japan comprise the biggest global water savings, contributing over 11% toward the total global
water saving.
The largest water saving is due to trade in cereal crops with a global water saving of 196 Gm3/yr, followed by oil
crops (82 Gm3/yr, mainly soybean) and animal products (56 Gm3/yr). Among the cereal crops, trade in maize has
resulted in the largest saving (71 Gm3/yr), followed by wheat (67 Gm3/yr), rice (27 Gm3/yr), barley (21 Gm3/yr)
and other cereals (10 Gm3/yr). In the case of rice, there is net global water saving if we look at the sum of green,
blue and grey, but when we focus on the blue component we find a global blue water loss associated with trade
in rice. Among the animal products, international trade in poultry products (25 Gm3/yr), dairy products (16
Gm3/yr), bovine products (16 Gm3/yr) and pig products (2 Gm3/yr) result in significant global water savings, but
trade flows in horse, sheep and goat products are accompanied with a total global water loss of 3 Gm3/yr. Figure
7 shows the contribution of different product groups to the total global water saving.
Trade in industrial products has resulted in a net global water loss of 16.4 Gm3/yr (2% blue and 98% grey). This
volume is equivalent to 4% of the global water footprint related to industrial production (which is 400 Gm3/yr,
see Table 1). Exports of industrial products from China and Russia are the major trade flows contributing to this
global water loss related to industrial product trade. This is mainly due to the large grey water footprints per unit
of value added in the industrial sectors in those two countries, which in turn relate to the low wastewater
treatment coverage in those countries.
When we consider the global water saving related to trade in both agricultural and industrial products, we come
to a net saving of 353 Gm3/yr (61.5% green, 27.7% blue and 10.8% grey). The global water saving related to
trade in agricultural and industrial products is presented in Appendix V. Global water savings due to
international trade in crop products are specified by crop type; global water savings related to trade in animal
products are given by animal type.

7.4 Gm3/yr
7.8 Gm3/yr9.3
Gm3/yr
25 Gm3/yr
5.6 Gm3/yr
5.4 Gm3/yr
12 Gm3/yr
5.0 Gm3/yr
5.7 Gm3/yr
5.1 Gm3/yr
16 Gm3/yr
5.0 Gm3/yr
89%
5%6%
85%
14%-1%
54%
45%
1%60%
37%
-3%
77%
17%6%
40%
50%
-10%
85%
13%-2%
38%32%
-30%
21%
73%
-6%
Green
Blue
Grey
85%
- 3%-12%
71%-5%
24%
83%
8%-9%
Figure 6.Global water savings associated with international trade in agricultural products (1996-2005). Only the biggest water savings (> 5 Gm3/yr) are shown.

National water footprint accounts / 25
-50
0
50
100
150
200
250
Cereals Oilcrops Animals products Fruits Other crops
Glo
ba
l wa
ter s
avi
ng
(Gm
3 /yr
)
Green Blue Grey
196
82
56
13 22Industrial
-16
-10
0
10
20
30 Poultry 25
Dairy 16
Bovine 16
Others -1
-20
0
20
40
60
80Maize
71 Wheat 67
Rice 27 Barley
21Others
10
-40
-20
0
20
40
60
80 Soybeans 60
Others 21
Figure 7. Contribution of different product categories to the total global water saving (1996-2005).
The calculated trade-related water savings are based on the crop yields and corresponding water footprints as
they currently exist in the exporting and importing countries. One should therefore be careful in extrapolating
water savings when trade flows would intensify. Water scarcity will stimulate countries to improve their water
productivities, particularly in countries with low yields (Appelgren and Klohn, 1999; Keller et al., 1998; Molle,
2003; Ohlsson, 2000). Current global water savings resulting from trade in water-intensive products from
countries with high water productivity to countries with low water productivity will diminish once the latter
countries have increased their water productivity.
The presented global water saving related to international trade may seem significant: the global water footprint
of agricultural and industrial production would be 4% higher if countries would produce all commodities within
their own territory based on existing domestic productivities instead of partially import them from other
countries. The potential of optimising international trade for further global water savings is probably small once
the most important importing countries with low water productivities increase their productivity. The global
water footprint can be reduced more significantly by achieving high water productivities across the globe than by
optimising trade from high to low productivity regions. Supported by the assessment by Falkenmark et al.
(2009), we estimate that the potential global water saving by increasing water productivities in regions that
currently still have low productivities will be of an order of magnitude larger than the current global water
saving achieved by trade. Therefore, for water scarce countries the first priority should be to raise their water
productivity as much as possible before turning to virtual water import as an option to address their water
scarcity problem.
3.5. The water footprint of national consumption
The global average water footprint related to consumption is 1385 m3/yr per capita over the period 1996-2005.
Consumption of agricultural products largely determines the global water footprint related to consumption,

26 / National water footprint accounts
contributing 92% to the total water footprint. Consumption of industrial products and domestic water use
contribute 4.7% and 3.8% respectively. When we look at the level of product categories, cereals consumption
contribute the largest share to the global water footprint (27%), followed by meat (22%) and milk products (7%).
The contribution of different product categories to the global average water footprint of consumption is
presented in Figure 8.
Cereals372
Meat305
Milk93
Industrial production65
Fruits 65
Sugar & Sweeteners 64
Vegetable Oils58
Domestic water supply53 Vegetables
38
Stimulants34
fibres33
Pulses31
Eggs29Starchy Roots
29
Oilcrops21
Hides & skins17
Animal Fats17
Rubber16 Offals
14
Nuts12
Alcholic beverages9
Spices 7
Tobacco4
Sugarcrops1
Other174
Figure 8. Contribution of different product categories to the global water footprint of consumption (in m3/yr/cap).
The water footprint of consumption in a country depends on two factors: what and how much do consumers
consume and what are the water footprints of the commodities consumed. The latter depends on the production
circumstances in the places of origin of the various commodities. A certain product as available on the shelves
within a country generally comes from different places, with different production circumstances and thus a
different water footprint in each place. To calculate the average water footprint of a product in a country, the
water footprints for all locations the product originates from are multiplied by the proportional share of the
product coming from those locations. Appendix VI provides the average water footprint per ton of commodity
per country weighted based on origin. As an example, consider the water footprint of tomatoes as consumed by
German consumers. In the period 1996-2005, German tomato production was 47,000 ton/yr with an average total
water footprint of 36 m3/ton. Germany imported 667,000 ton/yr in the same period, amongst which 252,000
ton/yr was from the Netherlands with a water footprint of 10 m3/ton, 244,000 ton/yr from Spain with a water
footprint of 83 m3/ton and 72,000 ton/yr from Italy with a water footprint of 109 m3/ton. Weighting the water
footprints of the different tomatoes on the German consumer market gives an average water footprint of
tomatoes in Germany of 57 m3/ton.
The relative contribution of different countries to the total water footprint of consumption is given in Figure 9.
The green, blue, grey and total water footprint per capita for all countries are mapped in Figure 10. The water
footprint of national consumption by product category for countries with a population size above 5 million is
shown in Figure 11. Full details of the water footprint of national consumption per country are tabulated in

National water footprint accounts / 27
Appendices VII-IX. Appendix VII shows the water footprint of the average consumer per country by
commodity. Appendix VIII summarizes the water footprint of the average consumer per country by consumption
category and also specifies the water footprint by its internal and external components. Appendix IX, finally,
shows the total water footprint of national consumption summed over all inhabitants of the country.
Other51%
China16%
India13%
USA10%
Brazil4%
Russia3%
Indonesia3% Pakistan
2%
Mexico2%
Japan2%
Nigeria2%
Italy2%
Other41%
Figure 9. Contribution of different countries to the global water footprint of consumption.
In total terms, China is the country with the largest water footprint of consumption in the world, with a total
footprint of 1368 Gm3/yr, followed by India and the US with 1145 Gm3/yr and 821 Gm3/yr respectively.
Obviously, countries with large populations have a large water footprint. Therefore it is more interesting to look
at the water footprint per capita.
The ranking of countries in Figure 11 shows that industrialised countries have water footprints per capita in the
range of 1250-2850 m3/yr. The UK, with a water footprint of 1258 m3/yr, is at the low end of this range, while
the USA, with a footprint of 2842 m3/yr, is at the high end. The differences can be partially explained by
differences in consumption pattern. In the USA, for example, average consumption of bovine meat – one of the
highly water-intensive commodities – was 43 kg/yr per capita, about 4.5 times the global average, while in the
UK this was 18 kg/yr per capita, about two times the global average. Another factor behind the differences in the
water footprints is the water consumption and pollution per unit of product per country. In the USA, the average
water footprint of one kg of consumed bovine meat is 14500 m3/ton, while in the UK this is 9900 m3/ton.
The water footprint per capita for developing countries varies much more than for industrialised countries. We
find values in a range 550-3800 m3/yr per capita. At the low end is the Democratic Republic of Congo, with 552
m3/yr per capita. At the high end we find Bolivia (3468 m3/yr/cap), Niger (3519 m3/yr/cap) and Mongolia (3775
m3/yr/cap). With the disclaimer that the extreme values can also partially relate to weak basic data on
consumption and water productivity in those countries, the differences can be traced back to differences in
consumptions patterns on the one hand and differences in the water footprints of the products consumed on the

28 / National water footprint accounts
other hand. What the ranking in Figure 11 shows is that in the range of relatively large water footprints per capita
we find both industrialised and developing countries. The latter are in that range generally not because of their
relative large consumption – although a relative large meat consumption can play a role – but because of their
low water productivities, i.e. large water footprints per ton of product consumed. In Bolivia, for example,
consumption of meat is 1.3 times the global average, but the water footprint per ton of meat is five times the
global average. For Niger, the consumption of cereals per capita is 1.4 times the global average, but the water
footprint of cereals per ton is six times the world average.
When we look at the blue water footprint per capita, countries in Central and Southwest Asia and North Africa
appear on top. Consumers in Turkmenistan have the largest blue water footprint of all countries, namely 740
m3/yr per capita on average. Other countries with a large blue water footprint are (in descending order): Iran (589
m3/yr/cap), the United Arab Emirates (571), Egypt (527), Libya (511), Tajikistan (474), Saudi Arabia (447) and
Pakistan (422). The global average blue water footprint of consumption is 153 m3/yr per capita, which is 11% of
the total water footprint. As can be seen in Figure 12, the variation in blue water footprint per capita across
countries is huge, much larger than the variation in total water footprint per capita (Figure 11). Whereas the
largest total water footprint per capita (Mongolia) is about seven times the smallest total water footprint per
capita (DR Congo), the difference in case of the blue water footprint is more than a factor hundred.
3.6. External water dependency of countries
All external water footprints of nations together constitute 22% of the total global water footprint (Figure 13).
The share of external water footprint, however, varies from country to country. Some European countries, such
as Italy, Germany, the UK and the Netherlands have external water footprints contributing 60% to 95% to the
total water footprint. On the other hand, some countries such as Chad, Ethiopia, India, Niger, DR Congo, Mali,
Argentina and Sudan have very small external water footprints, smaller than 4% of the total footprint.
Countries with a large external water footprint apparently depend upon freshwater resources in other countries.
Highly water-scarce countries that have a large external water dependency are for example: Malta (dependency
92%), Kuwait (90%), Jordan (86%), Israel (82%), United Arab Emirates (76%), Yemen (76%), Mauritius (74%),
Lebanon (73%) and Cyprus (71%). Not all countries that have a large external water footprint, however, are
water scarce. In this category are many Northern European countries like the Netherlands and the UK. They
depend upon freshwater resources elsewhere, but the high dependence is not by necessity, since these countries
have ample room for expanding agricultural production and thus reduce their external water dependency.

Figure 10. The green, blue, grey and total water footprint of consumption per country in the period 1996-2005 (m3/yr per capita). In the map showing the total water footprint of consumption per country (bottom-right), countries shown in green have a water footprint that is smaller than the global average; countries shown in yellow-red have a water footprint larger than the global average.

0
500
1000
1500
2000
2500
3000
3500
Co
ng
o, D
R
Bu
run
di
Ba
ng
lad
esh
Rw
an
da
Ko
rea
, DP
R
Ye
me
n
Nica
rag
ua
Za
mb
ia
Ma
law
i
An
go
la
Gu
ate
ma
la
To
go
Ta
nza
nia
Ha
iti
El S
alva
do
r
La
os
Vie
t Na
m
Ch
ina
Ca
mb
od
ia
Ug
an
da
Pe
ru
Ind
ia
Ke
nya
Mo
zam
biq
ue
Ind
on
esia
Be
nin
Se
ne
ga
l
Ch
ile
Eth
iop
ia
Ho
nd
ura
s
Ne
pa
l
Gh
an
a
Zim
ba
bw
e
Mya
nm
ar
Nig
eria
Aze
rba
ijan
Ca
me
roo
n
So
uth
Africa
Sri L
an
ka
UK
Uzb
ekista
n
Cô
te d
'Ivoire
Pa
kistan
Slo
vakia
Eg
ypt
Co
lom
bia
Ph
ilipp
ine
s
Jap
an
Do
min
ican
Re
p
Po
lan
d
Th
aila
nd
Fin
lan
d
Ge
rma
ny
Sw
ed
en
Ch
ad
Ne
the
rlan
ds
Sw
itzerla
nd
Ukra
ine
Ma
da
ga
scar
Alg
eria
Au
stria
Gu
ine
a
Arg
en
tina
Ko
rea
, Re
p
De
nm
ark
Tu
rkey
Cze
ch R
ep
ub
lic
Cu
ba
Ro
ma
nia
Bu
rkina
Fa
so
Ve
ne
zue
la
Be
laru
s
Mo
rocco
Su
da
n
Fra
nce
Sa
ud
i Ara
bia
Ru
ssia
Iran
Be
lgiu
m
Pa
rag
ua
y
Me
xico
Ecu
ad
or
Bra
zil
Lib
ya
Ma
li
Ma
laysia
Syria
Tu
nisia
Bu
lga
ria
Israe
l
Italy
Au
stralia
Ca
na
da
Gre
ece
Ka
zakh
stan
Hu
ng
ary
Ta
jikistan
Se
rbia
& M
on
ten
eg
ro
Sp
ain
Po
rtug
al
US
A
Bo
livia
Nig
er
Wo
rld a
vera
ge
Cereals Starchy Roots Sugarcrops Sugar & Sweeteners Pulses Nuts Oilcrops Vegetable Oils
Vegetables Fruits Stimulants Spices Wine & beer fibres Tobacco Rubber
Meat Offals Animal Fats Milk Eggs Hides & skins Industrial products Domestic water supply
Figure 11. Water footprint of national consumption for countries with a population larger than 5 million, shown by product category (m3/yr/cap) (1996-2005).

0
100
200
300
400
500
600
Co
ng
o, D
R
Rw
an
da
Ug
an
da
Bu
run
di
Ma
law
i
Mo
zam
biq
ue
To
go
Be
nin
Ch
ad
Nig
eria
Gh
an
a
Eth
iop
ia
An
go
la
Bu
rkina
Fa
so
Ca
me
roo
n
Gu
ine
a
Gu
ate
ma
la
Ke
nya
Ta
nza
nia
Za
mb
ia
Mya
nm
ar
Cô
te d
'Ivoire
Ho
nd
ura
s
Nica
rag
ua
El S
alva
do
r
Pa
rag
ua
y
Ukra
ine
Po
lan
d
Ca
mb
od
ia
Bo
livia
Be
laru
s
Hu
ng
ary
Co
lom
bia
Zim
ba
bw
e
Bra
zil
La
os
Ind
on
esia
Slo
vakia
Ha
iti
Ro
ma
nia
Ph
ilipp
ine
s
Fin
lan
d
Cze
ch R
ep
ub
lic
Ba
ng
lad
esh
Sw
ed
en
Bu
lga
ria
Ge
rma
ny
Se
rbia
& M
on
ten
eg
ro
Ko
rea
, DP
R
Se
ne
ga
l
Nig
er
Ve
ne
zue
la
Vie
t Na
m
Jap
an
UK
Ru
ssia
De
nm
ark
So
uth
Africa
Au
stria
Cu
ba
Arg
en
tina
Ko
rea
, Re
p
Sw
itzerla
nd
Ch
ina
Ne
pa
l
Ne
the
rlan
ds
Do
min
ican
Re
p
Fra
nce
Be
lgiu
m
Alg
eria
Ecu
ad
or
Pe
ru
Ma
laysia
Ca
na
da
Ma
li
Sri L
an
ka
Ma
da
ga
scar
Th
aila
nd
Ch
ile
Me
xico
Italy
Aze
rba
ijan
Su
da
n
Mo
rocco
Au
stralia
Ye
me
n
Ind
ia
US
A
Tu
rkey
Israe
l
Tu
nisia
Sp
ain
Gre
ece
Po
rtug
al
Uzb
ekista
n
Ka
zakh
stan
Syria
Pa
kistan
Sa
ud
i Ara
bia
Ta
jikistan
Lib
ya
Eg
ypt
Iran
Wo
rld a
vera
ge
Internal External
Figure 12. Blue water footprint of national consumption for countries with a population larger than 5 million, shown by internal and external component (m3/yr/cap) (1996-2005).

32 / National water footprint accounts
Agricultural products72%
Industrial products3% Domestic water
consumption4%
Agricultural products 20%
Industrial products2%
External water footprint 22%
Internal water footprint 78%
Figure 13. Contribution of different consumption categories to the global water footprint, split into internal and external water footprint.
3.7. Mapping the global water footprint of national consumption: an example from the US
The water footprint statistics presented in the previous section hide the fact that water footprints have a spatial
dimension. In this section we illustrate this spatial dimension with an example from the US.
The global water footprint of US citizens related to the consumption of agricultural products is mapped at a fine
scale resolution (5 by 5 arc minute grid) in Figure 14. The map shows the water footprint of crops consumed
directly by US consumers and the water footprint of animal feed crops (domestic and imported) used to produce
the animal products that are both produced and consumed within the US. It excludes the water footprint of
imported animal products consumed within the US because tracing the origin of the feed of imported animal
products on grid level would require a very laborious additional step of analysis.
The global water footprint of US consumption of industrial products is mapped in Figure 15. The water footprint
of US domestic water consumption is fully within the US itself and shown in Figure 16. We ignore here the
water footprint of imported bottled water, but in terms of volumes this is very small compared to the water
volumes consumed in households from domestic water supply (Gleick, 2010).
Most of the US water footprint lies within the US, mainly in the Mississippi basin (more than 50%). About 20%
of the water footprint of US citizens lies outside the US. The largest water footprint outside the US is in the
Yangtze basin (China). In Appendix X we tabulate the water footprint of US consumption per river basin for the
250 basins where the water footprint is largest.
Appendix XI provides maps of the global water footprint of consumption for eight selected countries other than
the US: Australia, Canada, Germany, Italy, Japan, Mexico, the Netherlands, Spain and the UK.

National water footprint accounts / 33
Figure 14. The global water footprint of US citizens related to the consumption of crop and animal products (1996-2005).

34 / National water footprint accounts
Figure 15. The global water footprint of US citizens related to the consumption of industrial products (1996-2005).

National water footprint accounts / 35
Figure 16. The water footprint of US citizens related to domestic water supply (1996-2005). The boundaries shown are river basin boundaries.


4. Discussion
The global water footprint related to agricultural and industrial production and domestic water supply for the
period 1996-2005 was found to be 9087 Gm3/yr (Section 3.1). If we calculate the global sum of estimated
national water footprints of consumption (Section 3.5), we arrive at a 6% lower figure, namely 8525 Gm3/yr. An
explanation is that the latter figure is conservative, because in the estimation of the water footprint of national
consumption of agricultural products based on the bottom-up approach we only partially accounted for the water
footprint of waste and seeds. We multiplied all consumption figures by a certain factor to account for waste and
seeds where applicable (see method and data section) for all crop and animal products consumed but we could
not account for the water footprint of waste and seeds in the production of animal feed. Another reason for the
difference between the two global water footprint estimates is that in the water footprint of global production we
could account for all countries, while in the estimation of the water footprint of national consumption we had to
exclude a few countries due to the absence of consumption data (most notably Iraq and Afghanistan). Another
explanation of the difference is that in the estimation of the national water footprint related to consumption we
could not include all consumer categories (like for example some alcoholic beverages). When it was not clear
which crops underlie certain products, we could not calculate the water footprint per ton of those products. A
final explanation for differences between the two global water footprint figures could be that stock changes
reported in the Supply and Utilization Accounts of the Food and Agriculture Organization (FAO, 2010a) create a
difference between ‘production plus imports’ and ‘utilization’ in a certain period.
This study is the first to use the bottom-up approach to estimate the water footprint of national consumption of
agricultural commodities at a global scale. As shown by Van Oel et al. (2009), the advantage of using the
bottom-up approach is that it is more stable. The bottom-up approach depends on the quality of consumption
data, while the top-down-approach relies on the quality of production and trade data. The outcome of the top-
down approach can be vulnerable to relatively small errors in the trade data when the import and export of a
country are large relative to its domestic production. Relatively small errors in the estimates of virtual-water
import and export can then translate into a relatively large error in the water footprint estimate. In such a case,
the bottom-up approach yields a more reliable estimate than the top-down approach. Another advantage of the
bottom-up approach is that it allows for showing the composition of the water footprint by commodity or product
category in a very straightforward manner (because this is the way the overall estimate is built up), which in the
top-down approach is difficult to achieve.
A limitation in the study is that the origin of products has been traced only by one step. If a product is imported
from another country, we assume that the product has been produced in that country and we take the water
footprint of the imported product accordingly. If the trade partner country does not produce that commodity, we
do not trace further back but assume a global average water footprint. But even if the country produces the
product, it could have been the case that the product was in part imported from somewhere else and re-exported.
Tracing of products by more than one step has been done for example by Chapagain and Orr (2008) for the UK
but this was too laborious for this global study. Besides, such continued tracing effort is necessarily based on
assumptions because export data in trade statistics are not connected to import data, therefore the added value of

38 / National water footprint accounts
tracing can be questioned. Finally, in a global study, tracing back more than one step would create the problem
of circularity in the calculations. Common products are traded in all directions between all countries, so that a
strategy of tracing products will soon lead to the situation in which a small fraction of a product imported to a
country X is estimated to originate, through a detour, from the same country X. This leads to a mathematical
circularity in the calculation of the average water footprint of the product in country X – see equation (3).
The grey water footprint estimates in this study are to be considered as conservative. In the case of agricultural
production, the grey water footprint estimates are based on leaching and runoff of nitrogen fertilisers, excluding
the potential effect of other fertiliser components and pesticides (Mekonnen and Hoekstra, 2010b, 2011). In the
cases of industrial production and domestic water supply, a very conservative dilution factor of 1 has been
applied for all untreated return flows.
While in the estimation of the water footprint of consumer products we considered a huge amount of different
agricultural commodities separately, industrial commodities were treated as one whole category. Although in this
way the study shows no detail within the estimation of the water footprint of production and consumption of
industrial products, we justify the choice in this global study based on the fact that most of the water footprint of
humanity is within the agricultural sector.
We have analysed a ten-year period, but we do not show annual variations or trends in time. The reason is that
the data do not allow for that. Many of the databases that we used show data for every individual year within our
ten-year period (e.g. production, consumption, trade, rainfall and yield data), but not all global databases show
year-specific data (e.g. reference evapotranspiration, crop growing area and irrigation data). The estimated water
footprints of agricultural products are necessarily ten-year averages, because they have been based on climate
data, which are by definition multi-year averages (Mekonnen and Hoekstra, 2010b, 2011). Even if we would
have been able to estimate water footprints by year, a trend analysis over a ten-year period would have been
difficult due to the natural inter-annual variability of rainfall and temperature.
The data presented in this report are derived on the basis of a great number of underlying statistics, maps and
assumptions. Since all basic sources include uncertainties and possible errors, the presented water footprint data
should be taken and interpreted with extreme caution, particularly when zooming in on specific locations on a
map or when focussing on specific products. Basic sources of uncertainties are for example the global
precipitation, temperature, crop and irrigation maps that we have used and the yield, production, consumption,
trade and wastewater treatment statistics that we had to rely on. Underlying assumptions refer, for example, to
planting and harvesting dates per crop per region and feed composition per farm animal type per country and
production system. Another assumption has been that water footprints of industrial production and domestic
water supply are geographically spread according to population densities. Despite the plethora of uncertainties,
we think that the current study forms a good basis for rough comparisons and to guide further analysis.

5. Conclusion
The study shows that about one fifth of the global water footprint in the period 1996-2005 was not related to
production for domestic consumption but for export. The global volume of water saving from international trade
in agricultural products was equivalent to 4% of the global water footprint for agricultural production. The
relatively large volume of international virtual water flows and the associated national water savings and external
water dependencies strengthen the argument to consider issues of local water scarcity in a global context
(Hoekstra and Chapagain, 2008; Hoekstra, 2011).
Two factors determine the magnitude of the water footprint of national consumption: (1) the volume and pattern
of consumption and (2) the water footprint per ton of consumed products. The latter, in the case of agricultural
products, depends on climate, irrigation and fertilization practice and crop yield. The global average water
footprint related to consumption is 1385 m3/yr per capita over the period 1996-2005. Industrialised countries
have water footprints in the range of 1250-2850 m3/yr/cap, while developing countries show a much larger range
of 550-3800 m3/yr/cap. The low values for developing countries relate to low consumption volumes; the large
values refer to very large water footprints per unit of consumption.
The study provides important information on the water footprints of nations, disaggregated into the type of water
footprint (green, blue or grey) and mapped at a high spatial resolution. The report shows how different products
and national communities contribute to water consumption and pollution in different places. The figures can thus
form an important basis for further assessment of how products and consumers contribute to the global problem
of increasing freshwater appropriation against the background of limited supplies and to local problems of
overexploitation and deterioration of freshwater bodies or conflict over water. Once one starts overlaying
localised water footprints of products or consumers with maps that show environmental or social water conflict,
a link has been established between final products and consumers on the one hand and local water problems on
the other hand. Establishing such links can help the dialogue between consumers, producers, intermediates (like
food processors and retailers) and governments about how to share responsibility for reducing water footprints
where most necessary.


References
Alcamo, J., and Henrichs, T. (2002) Critical regions: A model-based estimation of world water resources
sensitive to global changes, Aquatic Sciences 64(4): 352-362.
Alcamo, J., Döll, P., Henrichs, T., Kaspar, F., Lehner, B., Rösch, T. and Siebert, S. (2003) Global estimates of
water withdrawals and availability under current and future “business-as-usual” conditions, Hydrological
Sciences Journal, 48(3): 339 - 348.
Aldaya, M.M., Garrido, A., Llamas, M.R., Varelo-Ortega, C., Novo, P., and Casado, R.R. (2010b) Water
footprint and virtual water trade in Spain, In: A. Garrido and M.R. Llamas (eds.), Water policy in Spain,
CRC Press, Leiden, The Netherlands, pp. 49-59.
Appelgren, B. and Klohn, W. (1999) Management of water scarcity: a focus on social capacities and options,
Physics and Chemistry of the Earth (B), 24(4): 361-373.
Bulsink, F., Hoekstra, A.Y. and Booij, M.J. (2010) The water footprint of Indonesian provinces related to the
consumption of crop products, Hydrology and Earth System Sciences, 14(1): 119–128.
Chahed, J., Hamdane, A. and Besbes, M. (2008) A comprehensive water balance of Tunisia: blue water, green
water and virtual water, Water International, 33(4): 415-424.
Chapagain, A. K. and S. Orr (2008) UK Water Footprint: The impact of the UK's food and fibre consumption on
global water resources, Volume 1, WWF-UK, Godalming, UK.
Chapagain, A.K. and Hoekstra, A.Y. (2004) Water footprints of nations, Value of Water Research Report Series
No. 16, UNESCO-IHE, Delft, The Netherlands, www.waterfootprint.org/Reports/Report16Vol1.pdf.
Chapagain, A.K. and Hoekstra, A.Y. (2008) The global component of freshwater demand and supply: An
assessment of virtual water flows between nations as a result of trade in agricultural and industrial products,
Water International 33(1): 19-32.
Chapagain, A.K., Hoekstra, A.Y., and Savenije, H.H.G. (2006) Water saving through international trade of
agricultural products, Hydrology and Earth System Sciences 10(3): 455-468.
CIESIN and CIAT (2005) Gridded population of the world version 3 (GPWv3): Population density grids,
Socioeconomic Data and Applications Center (SEDAC), Center for International Earth Science Information
Network (CIESIN), Columbia University; and International Center for Tropical Agriculture (CIAT),
available at http://sedac.ciesin.columbia.edu/gpw.
De Fraiture, C., X. M. Cai, U. Amarasinghe, M. Rosegrant, and D. Molden (2003) Does international cereal
trade save water? The impact of virtual water trade on global water use, Comprehensive Assessment
Research Report 4, International Water Management Institute, Colombo, Sri Lanka.
EUROSTAT (2011) EUROSTAT online database, European Commission, Luxembourg,
http://epp.eurostat.ec.europa.eu/portal/page/portal/statistics/search_database , (retrieved 14 January 2011).
Fader, M., Gerten, D., Thammer, M., Heinke, J., Lotze-Campen, H., Lucht, W. and Cramer, W. (2011)
Internal and external green-blue agricultural water footprints of nations, and related water and land savings
through trade, Hydrology and Earth System Sciences Discussions, 8: 483-527.
Falkenmark, M., Rockström, J. and Karlberg, L. (2009) Present and future water requirements for feeding
humanity, Food Security, 1(1): 59-69.

42 / National water footprint accounts
FAO (2010a) FAOSTAT on-line database, Food and Agriculture Organization, Rome, http://faostat.fao.org
(retrieved 10 Dec 2010).
FAO (2010b) AQUASTAT on-line database, Food and Agriculture Organization, Rome, http://faostat.fao.org
(retrieved 12 Dec 2010).
Feng, K., Hubacek, K., Minx, J., Siu, Y.L., Chapagain, A., Yu, Y., Guan, D. and Barrett, J. (2011) Spatially
explicit analysis of water footprints in the UK, Water, 3(1): 47-63
Garrido, A., Llamas, M.R., Varela-Ortega, C., Novo, P., Rodríguez-Casado, R. and Aldaya, M.M. (2010) Water
footprint and virtual water trade in Spain, Springer, New York, US.
Gleick, P.H. (ed.) (1993) Water in crisis: A guide to the world’s fresh water resources, Oxford University Press,
Oxford, UK.
Gleick, P.H. (2010) Bottled and sold: The story behind our obsession with bottled water, Island Press,
Washington, DC, US.
GRDC (2007) Major river basins of the world, Global Runoff Data Centre, Koblenz, Federal Institute of
Hydrology (BfG), Germany.
Hoekstra, A.Y. (ed.) (2003) Virtual water trade: Proceedings of the International Expert Meeting on Virtual
Water Trade, Delft, The Netherlands, 12-13 December 2002, Value of Water Research Report Series
No.12, UNESCO-IHE, Delft, The Netherlands, www.waterfootprint.org/Reports/Report12.pdf.
Hoekstra, A.Y. (2011) The global dimension of water governance: Why the river basin approach is no longer
sufficient and why cooperative action at global level is needed, Water 3(1): 21-46.
Hoekstra, A.Y. and Chapagain, A.K. (2007a) Water footprints of nations: water use by people as a function of
their consumption pattern, Water Resources Management 21(1): 35–48.
Hoekstra, A.Y. and Chapagain, A.K. (2007b) The water footprints of Morocco and the Netherlands: Global
water use as a result of domestic consumption of agricultural commodities, Ecological Economics 64(1):
143-151.
Hoekstra, A.Y. and Chapagain, A.K. (2008) Globalization of water: Sharing the planet’s freshwater resources,
Blackwell Publishing, Oxford, UK.
Hoekstra, A.Y. and Hung, P.Q. (2002) Virtual water trade: A quantification of virtual water flows between
nations in relation to international crop trade, Value of Water Research Report Series No.11, UNESCO-
IHE, Delft, The Netherlands, www.waterfootprint.org/Reports/Report11.pdf.
Hoekstra, A.Y. and Hung, P.Q. (2005) Globalisation of water resources: international virtual water flows in
relation to crop trade, Global Environmental Change 15(1): 45-56.
Hoekstra, A.Y., Chapagain, A.K., Aldaya, M.M. and Mekonnen, M.M. (2011) The water footprint assessment
manual: Setting the global standard, Earthscan, London, UK.
Hoff (2009) Global water resources and their management, Current Opinion in Environmental Sustainability,
1:141–147
Hubacek, K., Guan, D.B., Barrett, J. and Wiedmann, T. (2009) Environmental implications of urbanization and
lifestyle change in China: Ecological and water footprints, Journal of Cleaner Production, 17(14): 1241-
1248.
ITC (2007) SITA version 1996–2005 in SITC, [DVD-ROM], International Trade Centre, Geneva.

National water footprint accounts / 43
Kampman, D.A., Hoekstra, A.Y. and Krol, M.S. (2008) The water footprint of India, Value of Water Research
Report Series No.32, UNESCO-IHE, Delft, the Netherlands.
Keller, J., Keller, A. and Davids, G. (1998) River basin development phases and implications of closure, Journal
of Applied Irrigation Science, 33: 145–164.
Liu, J. and Savenije, H.H.G. (2008) Food consumption patterns and their effect on water requirement in China,
Hydrology and Earth System Sciences 12(3): 887-898.
Ma, J., Hoekstra, A.Y., Wang, H., Chapagain, A.K. and Wang, D. (2006) Virtual versus real water transfers
within China, Phil. Trans. R. Soc. Lond. B. 361 (1469): 835-842.
Mekonnen, M.M. and Hoekstra, A.Y. (2010a) A global and high-resolution assessment of the green, blue and
grey water footprint of wheat, Hydrology and Earth System Sciences, 14(7): 1259-1276.
Mekonnen, M.M. and Hoekstra, A.Y. (2010b) The green, blue and grey water footprint of crops and derived
crop products, Value of Water Research Report Series No. 47, UNESCO-IHE, Delft, The Netherlands,
www.waterfootprint.org/Reports/Report47-WaterFootprintCrops-Vol1.pdf.
Mekonnen, M.M. and Hoekstra, A.Y. (2010c) The green, blue and grey water footprint of farm animals and
derived animal products, Value of Water Research Report Series No. 48, UNESCO-IHE, Delft, The
Netherlands, www.waterfootprint.org/Reports/Report-48-WaterFootprint-AnimalProducts-Vol1.pdf
Mekonnen, M. M. and Hoekstra, A. Y. (2011) The green, blue and grey water footprint of crops and derived
crop products, Hydrology and Earth System Sciences Discussions, 8: 763-809.
Molle, F. (2003) Development trajectories of river basins: a conceptual framework, IWMI Research Report 72,
IWMI, Colombo, Sri Lanka.
Nazer, D.W., Siebel, M.A., Van der Zaag, P., Mimi, Z. and Gijzen, H.J. (2008) Water footprint of the
Palestinians in the West Bank, Journal of the American Water Resources Association 44(2): 449-458.
Ohlsson, L. (2000) Water conflicts and social resource scarcity, Physics and Chemistry of the Earth (B), 25(3):
213-220.
Postel, S.L., Daily, G.C., and Ehrlich, P.R. (1996) Human appropriation of renewable fresh water, Science 271:
785-788.
Postel, S.L. (2000) Entering an era of water scarcity: The challenges ahead, Ecological Applications 10(4): 941–
948.
Oki, T. and Kanae, S., (2004) Virtual water trade and world water resources, Water Science and Technology 49
(7), 203–209.
Smakhtin, V., Revenga, C. and Döll, P. (2004) A pilot global assessment of environmental water requirements
and scarcity, Water International 29(3): 307-317.
Sonnenberg, A., Chapagain, A., Geiger, M. and August, D. (2009) Der Wasser-Fußabdruck Deutschlands:
Woher stammt das Wasser, das in unseren Lebensmitteln steckt? WWF Deutschland, Frankfurt.
Sonnenberg, A., Chapagain, A., Geiger, M., August, D. and Wagner, W. (2010). Der Wasser-Fußabdruck der
Schweiz: Woher stammt das Wasser, das in unseren Landwirtschaftsprodukten steckt? WWF Schweiz,
Zürich.
UNSD (2010a) UNSD environmental indicators: inland waters resources, UN Statistic Division,
http://unstats.un.org/unsd/ENVIRONMENT/wastewater.htm (last access 20 January 2011)

44 / National water footprint accounts
UNSD (2010b) Nationals accounts main aggregates database, UN Statistic Division,
http://unstats.un.org/unsd/snaama/selectionbasicFast.asp (3 October 2010)
Van der Leeden, F., Troise, F.L. and Todd, D.K. (1990) The water encyclopedia, Second edition, CRC Press,
Boca Raton, Florida, USA.
Van Oel, P.R., Mekonnen M.M. and Hoekstra, A.Y. (2009) The external water footprint of the Netherlands:
Geographically-explicit quantification and impact assessment, Ecological Economics 69(1): 82-92.
Vincent, D., De Caritat, A.K., Stijn Bruers, S., Chapagain, A., Weiler, P. and Laurent, A. (2011) Belgium and its
water footprint, WWF-Belgium, Brussels.
Vörösmarty, C.J., Green, P., Salisbury, J., and Lammers, R.B. (2000) Global water resources: vulnerability from
climate change and population growth, Science 289: 284–288.
WWAP (2003) The United Nations World Water Development Report 1: Water for people, water for life, World
Water Assessment Programme, UNESCO Publishing, Paris / Berghahn Books, New York.
WWAP (2006) The United Nations World Water Development Report 2: Water a shared responsibility, World
Water Assessment Programme, UNESCO Publishing, Paris / Berghahn Books, New York.
WWAP (2009) The United Nations World Water Development Report 3: Water in a changing world, World
Water Assessment Programme, UNESCO Publishing, Paris / Earthscan, London.
Yang, H., Reichert, P., Abbaspour, K.C. and Zehnder, A. J. B. (2003) A water resources threshold and its
implications for food security, Environmental Science and Technology, 37(14), 3048–3054.
Yang, H. and Zehnder, A.J.B. (2008) Globalization of water resources through virtual water trade, Rosemberg
International Forum on Water Policy, available from: http://rosenberg.ucanr.org/documents/II%20Yang.pdf
Yu, Y., Hubacek, K., Feng, K. and Guan, D. (2010) Assessing regional and global water footprints for the UK,
Ecological Economics, 69(5): 1140-1147.
Zhao, X., Chen, B., Yang, Z.F. (2009) National water footprint in an input-output framework - A case study of
China 2002, Ecological Modelling 220(2): 245-253.

Value of Water Research Report Series
Editorial board: Arjen Y. Hoekstra – University of Twente, [email protected] Hubert H.G. Savenije – Delft University of Technology, [email protected] Pieter van der Zaag – UNESCO-IHE Institute for Water Education, [email protected] 1. Exploring methods to assess the value of water: A case study on the Zambezi basin. A.K. Chapagain February 2000 2. Water value flows: A case study on the Zambezi basin. A.Y. Hoekstra, H.H.G. Savenije and A.K. Chapagain March 2000 3. The water value-flow concept. I.M. Seyam and A.Y. Hoekstra December 2000 4. The value of irrigation water in Nyanyadzi smallholder irrigation scheme, Zimbabwe. G.T. Pazvakawambwa and P. van der Zaag – January 2001 5. The economic valuation of water: Principles and methods J.I. Agudelo – August 2001 6. The economic valuation of water for agriculture: A simple method applied to the eight Zambezi basin countries J.I. Agudelo and A.Y. Hoekstra – August 2001 7. The value of freshwater wetlands in the Zambezi basin I.M. Seyam, A.Y. Hoekstra, G.S. Ngabirano and H.H.G. Savenije – August 2001 8. ‘Demand management’ and ‘Water as an economic good’: Paradigms with pitfalls H.H.G. Savenije and P. van der Zaag – October 2001 9. Why water is not an ordinary economic good H.H.G. Savenije – October 2001 10. Calculation methods to assess the value of upstream water flows and storage as a function of downstream benefits I.M. Seyam, A.Y. Hoekstra and H.H.G. Savenije – October 2001 11. Virtual water trade: A quantification of virtual water flows between nations in relation to international crop trade A.Y. Hoekstra and P.Q. Hung – September 2002 12. Virtual water trade: Proceedings of the international expert meeting on virtual water trade
A.Y. Hoekstra (ed.) – February 2003 13. Virtual water flows between nations in relation to trade in livestock and livestock products A.K. Chapagain and A.Y. Hoekstra – July 2003 14. The water needed to have the Dutch drink coffee A.K. Chapagain and A.Y. Hoekstra – August 2003 15. The water needed to have the Dutch drink tea A.K. Chapagain and A.Y. Hoekstra – August 2003 16. Water footprints of nations, Volume 1: Main Report, Volume 2: Appendices A.K. Chapagain and A.Y. Hoekstra – November 2004 17. Saving water through global trade A.K. Chapagain, A.Y. Hoekstra and H.H.G. Savenije – September 2005 18. The water footprint of cotton consumption A.K. Chapagain, A.Y. Hoekstra, H.H.G. Savenije and R. Gautam – September 2005 19. Water as an economic good: the value of pricing and the failure of markets P. van der Zaag and H.H.G. Savenije – July 2006 20. The global dimension of water governance: Nine reasons for global arrangements in order to cope with local water problems A.Y. Hoekstra – July 2006 21. The water footprints of Morocco and the Netherlands A.Y. Hoekstra and A.K. Chapagain – July 2006 22. Water’s vulnerable value in Africa P. van der Zaag – July 2006 23. Human appropriation of natural capital: Comparing ecological footprint and water footprint analysis A.Y. Hoekstra – July 2007 24. A river basin as a common-pool resource: A case study for the Jaguaribe basin in Brazil P.R. van Oel, M.S. Krol and A.Y. Hoekstra – July 2007 25. Strategic importance of green water in international crop trade M.M. Aldaya, A.Y. Hoekstra and J.A. Allan – March 2008

26. Global water governance: Conceptual design of global institutional arrangements M.P. Verkerk, A.Y. Hoekstra and P.W. Gerbens-Leenes – March 2008 27. Business water footprint accounting: A tool to assess how production of goods and services impact on freshwater
resources worldwide P.W. Gerbens-Leenes and A.Y. Hoekstra – March 2008 28. Water neutral: reducing and offsetting the impacts of water footprints A.Y. Hoekstra – March 2008 29. Water footprint of bio-energy and other primary energy carriers P.W. Gerbens-Leenes, A.Y. Hoekstra and Th.H. van der Meer – March 2008 30. Food consumption patterns and their effect on water requirement in China J. Liu and H.H.G. Savenije – March 2008 31. Going against the flow: A critical analysis of virtual water trade in the context of India’s National River Linking
Programme S. Verma, D.A. Kampman, P. van der Zaag and A.Y. Hoekstra – March 2008 32. The water footprint of India D.A. Kampman, A.Y. Hoekstra and M.S. Krol – May 2008 33. The external water footprint of the Netherlands: Quantification and impact assessment P.R. van Oel, M.M. Mekonnen and A.Y. Hoekstra – May 2008 34. The water footprint of bio-energy: Global water use for bio-ethanol, bio-diesel, heat and electricity P.W. Gerbens-Leenes, A.Y. Hoekstra and Th.H. van der Meer – August 2008 35. Water footprint analysis for the Guadiana river basin M.M. Aldaya and M.R. Llamas – November 2008 36. The water needed to have Italians eat pasta and pizza M.M. Aldaya and A.Y. Hoekstra – May 2009 37. The water footprint of Indonesian provinces related to the consumption of crop products F. Bulsink, A.Y. Hoekstra and M.J. Booij – May 2009 38. The water footprint of sweeteners and bio-ethanol from sugar cane, sugar beet and maize P.W. Gerbens-Leenes and A.Y. Hoekstra – November 2009 39. A pilot in corporate water footprint accounting and impact assessment: The water footprint of a sugar-containing
carbonated beverage A.E. Ercin, M.M. Aldaya and A.Y. Hoekstra – November 2009 40. The blue, green and grey water footprint of rice from both a production and consumption perspective A.K. Chapagain and A.Y. Hoekstra – March 2010 41. Water footprint of cotton, wheat and rice production in Central Asia M.M. Aldaya, G. Muñoz and A.Y. Hoekstra – March 2010 42. A global and high-resolution assessment of the green, blue and grey water footprint of wheat M.M. Mekonnen and A.Y. Hoekstra – April 2010 43. Biofuel scenarios in a water perspective: The global blue and green water footprint of road transport in 2030 A.R. van Lienden, P.W. Gerbens-Leenes, A.Y. Hoekstra and Th.H. van der Meer – April 2010 44. Burning water: The water footprint of biofuel-based transport P.W. Gerbens-Leenes and A.Y. Hoekstra – June 2010 45. Mitigating the water footprint of export cut flowers from the Lake Naivasha Basin, Kenya M.M. Mekonnen and A.Y. Hoekstra – June 2010 46. The green and blue water footprint of paper products: methodological considerations and quantification P.R. van Oel and A.Y. Hoekstra – July 2010 47. The green, blue and grey water footprint of crops and derived crop products M.M. Mekonnen and A.Y. Hoekstra – December 2010 48. The green, blue and grey water footprint of animals and derived animal products M.M. Mekonnen and A.Y. Hoekstra – December 2010 49. The water footprint of soy milk and soy burger and equivalent animal products A.E. Ercin, M.M. Aldaya and A.Y. Hoekstra – February 2011 50. National water footprint accounts: The green, blue and grey water footprint of production and consumption M.M. Mekonnen and A.Y. Hoekstra – May 2011 Reports can be downloaded from: www.waterfootprint.org www.unesco-ihe.org/value-of-water-research-report-series


UNESCO-IHEP.O. Box 30152601 DA DelftThe Netherlands
Website www.unesco-ihe.orgPhone +31 15 2151715
University of Twente
Delft University of Technology