Voltammetric investigation of the complexation equilibria ...

This document is downloaded from DR‑NTU (https://dr.ntu.edu.sg)Nanyang Technological University, Singapore.
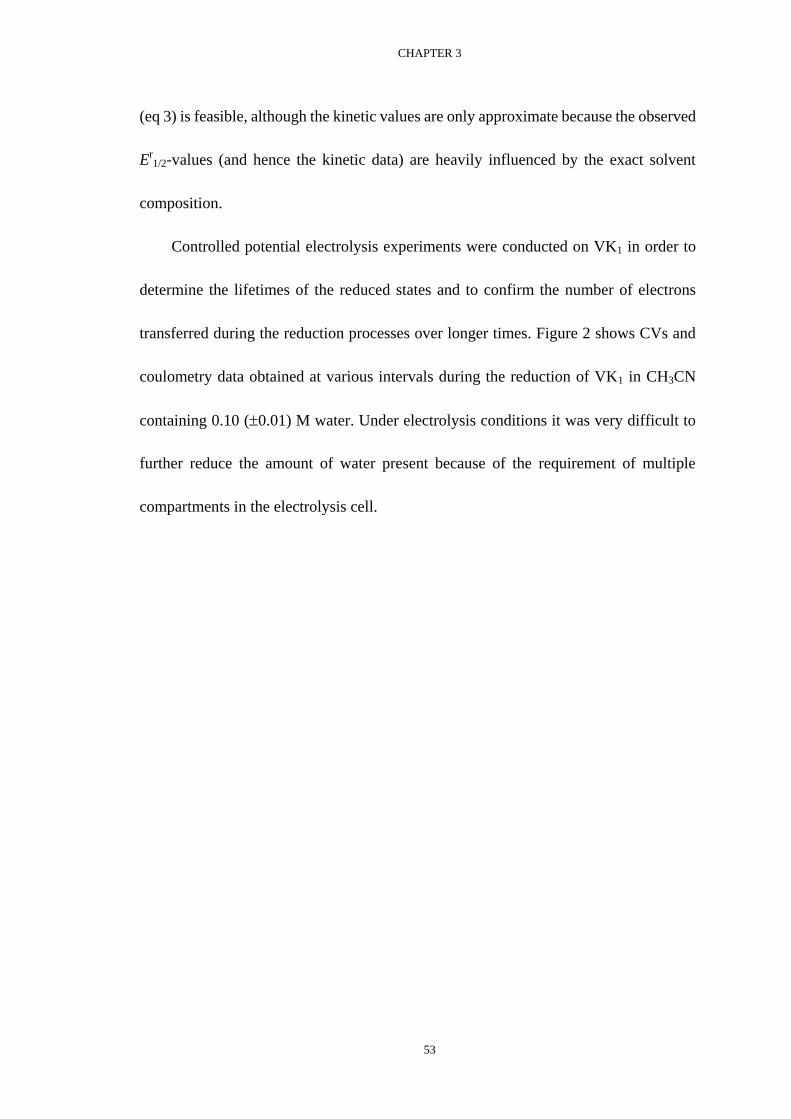
Voltammetric studies on vitamin K1 in organicsolvents
Hui, Yan Lan
2011
Hui, Y. L. (2011). Voltammetric studies on vitamin K1 in organic solvents. Doctoral thesis,Nanyang Technological University, Singapore.
https://hdl.handle.net/10356/46480
https://doi.org/10.32657/10356/46480
Downloaded on 12 Dec 2021 19:33:30 SGT

VOLTAMMETRIC STUDIES ON VITAMIN K1 IN
ORGANIC SOLVENTS
HUI YAN LAN
BSc
School of Physical and Mathematical Sciences
A thesis submitted to the Nanyang Technological University in fulfillment of the
requirement for the degree of Doctor of Philosophy of Chemistry
2011


I
Contents
Acknowledgements .................................................................................................... VII
Chapter 1 Introduction ................................................................................................... 1
1.1 Voltammetry of Quinones ................................................................................ 1
1.1.1 General Introduction ............................................................................. 1
1.1.2 Hydrogen Bonding between One- and Two-electron Reduced Forms of
Quinones ................................................................................................ 4
1.2 Vitamin K ......................................................................................................... 7
1.2.1 General Introduction of Vitamin K ....................................................... 7
1.2.2 Properties of Vitamin K ........................................................................ 9
1.3 Aim of Present Project ................................................................................... 11
References .................................................................................................................... 12
Chapter 2 Experimental Section .................................................................................. 21
2.1 Introduction to Voltammetry .......................................................................... 21
2.1.1 Theory of Cyclic Voltammetry: Reversible and Irreversible Kinetics ....
.............................................................................................................. 21
2.1.2 Electrochemical Cell for Cyclic Voltammetry .................................... 22
2.1.3 Theory of Square-wave Voltammetry ................................................. 24
2.2 Introduction to Karl Fischer Titration ............................................................ 26

II
2.3 Introduction to Spectrochemical Methods ..................................................... 28
2.3.1 Theory of Ultraviolet-visible Spectroscopy ........................................ 29
2.3.2 Theory of Fourier Transform Infrared Spectroscopy .......................... 32
2.4 Humidity Controlled Chamber ...................................................................... 36
2.5 General Experimental Section ....................................................................... 37
2.5.1 Chemicals ............................................................................................ 37
2.5.2 Voltammetry ....................................................................................... 37
2.5.3 Method for Drying Solutions for Electrochemistry ............................ 38
2.5.4 Controlled Potential Electrolysis ........................................................ 39
2.5.5 In-situ UV-Vis Spectroscopy .............................................................. 40
2.5.6 Theoretical Calculations ..................................................................... 40
References .................................................................................................................... 41
Chapter 3 Voltammetry of Vitamin K1 in CH3CN Containing Varying Concentrations of
Water .................................................................................................................... 45
3.1 Introduction .................................................................................................... 45
3.2 Results and Discussion .................................................................................. 49
3.2.1 Electrochemistry at Intermediate (0.05 M) to High (10 M) Water
Concentrations ................................................................................... 49
3.2.2 In-situ UV-Vis Spectroscopy at Intermediate (0.05 M) to High (10 M)
Water Concentrations ......................................................................... 59

III
3.2.3 Electrochemistry at Low (0.001 – 0.05 M) Water Concentrations ... 73
3.3 Conclusions .................................................................................................... 79
References .................................................................................................................... 81
Chapter 4 Voltammetric Method for Determining the Trace Moisture Content of
Organic Solvents Based on Hydrogen Bonding Interactions between Reduced
Vitamin K1 and H2O ............................................................................................. 87
4.1 Introduction .................................................................................................... 87
4.2 Results and Discussion .................................................................................. 89
4.2.1 The Effect of Water on Reduction Processes of Vitamin K1 .............. 89
4.2.2 Reduction Mechanism ........................................................................ 98
4.2.3 Effect of Water on Reduction Processes of
7,7,8,8-Tetracyanoquinodimethane (TCNQ) ..................................... 100
4.2.4 Method for Coating Gold Electrode and Voltammetry of Vitamin K-SH
............................................................................................................ 102
4.3 Conclusions .................................................................................................. 109
References .................................................................................................................. 111
Chapter 5 The Absorption of Water into Organic Solvents used for Electrochemistry
under Conventional Operating Conditions ........................................................ 115
5.1 Introduction .................................................................................................. 115
IV
5.2 Results and Discussion ................................................................................ 117
5.3 Conclusions .................................................................................................. 126
References .................................................................................................................. 128
Chapter 6 In-situ Infra-red Spectroscopy of Reduced Forms of Vitamin K1 ............. 131
6.1 Introduction .................................................................................................. 131
6.2 Results and Discussion ................................................................................ 132
6.2.1 IR Spectroscopy for Vitamin K1 in Non-dried CH3CN .................... 132
6.2.2 IR Spectroscopy of Vitamin K1 in Ultra-dry CH3CN ....................... 139
6.2.3 IR Spectroscopy of Vitamin K1 in CH3CN with the Addition of Large
Amounts of water ............................................................................... 141
6.2.4 Effect of Water on the Apparent Absorbance Intensity of Vitamin K1 ...
............................................................................................................ 146
6.3 Conclusions .................................................................................................. 154
References .................................................................................................................. 156
Chapter 7 An Electrode-Supported Biomembrane for Examining Electron Transfer and
Ion Transfer Reactions of Vitamin K1 ................................................................ 157
7.1 Introduction .................................................................................................. 157
7.2 Results and Discussion ................................................................................ 161
7.2.1 Preparation of Electrode Surfaces ..................................................... 161

V
7.2.2 Preparation of Membranes and Electrodes for Electrochemistry ..... 163
7.2.3 Voltammetry of Vitamin K1 .............................................................. 165
7.2.4 Voltammetry of Membranes Containing Vitamin K1 ........................ 169
7.3 Conclusions .................................................................................................. 177
References .................................................................................................................. 179
Chapter 8 Summary ................................................................................................... 187
Publications ................................................................................................................ 191

VI
VII
Acknowledgements
I would like to give my sincerely gratitude to my supervisor, Associate Professor
Richard Webster, for his constant guidance and invaluable inspiration during my Ph.D
studies.
I want to acknowledge all the lab mates that I work with in our lab, Hongmei,
Weiwei, Shanshan, Bahareh, Yingshan, Gwen, Serena, Hwee Ling and Elaine for their
support and collaboration.
I want to thank Nanyang Technological University for offering me a research
scholarship to proceed with my doctorate degree.
I would also like to thank all the friends and colleagues at NTU for the support
and encouragement, both at work and out of it.
Last but not least, I want to thank my husband, Dongyun and my parents for their
constant encouragement, love and support throughout these years.

VIII

CHAPTER 1
1
Chapter 1
Introduction
1.1 Voltammetry of Quinones
1.1.1 General Introduction
Quinone/hydroquinone (Q/QH2) compounds are one of the most important and
widely-studied examples of organic redox systems, because they often play very
important roles in biological reactions.1-5
In addition, Q/QH2 couples have been
extensively studied because they display fundamentally interesting chemically
reversible redox properties in solution.1,3,6-13
According to the findings of many
researchers, Bailey and colleagues constructed pH-E1/2 diagrams for Q/QH2
systems.1,14-17
The redox reaction of Q/QH2 system occurs via complex electron- and
proton-transfer processes. Eggins and Chambers‟ investigations showed that the species
which participated in the redox reaction of Q/QH2 in acetonitrile (CH3CN) were
strongly influenced by the concentration of protons.3,7-12
Parker investigated the role of
protons in the redox behavior of Q/QH2 in CH3CN by using various concentrations of
HClO4 and 2,6-lutidine.18
Robertson and Pendley also performed research on the redox
behavior of Q/QH2 in H2SO4 solution by varying the concentration of both the quinone
and H2SO4.19
Laviron constructed the nine-member square scheme to theoretically treat
the kinetics of the electrochemical redox reaction of the Q/QH2 couple in aqueous
CHAPTER 1
2
media.20
The applications of quinones are extensive; for example, quinones can be used as
dyes and redox agents in chemical synthesis. Furthermore, medicinal properties, such as
antibiotic, antimicrobial, and anticancer activity have been found from a few
quinones.21-23
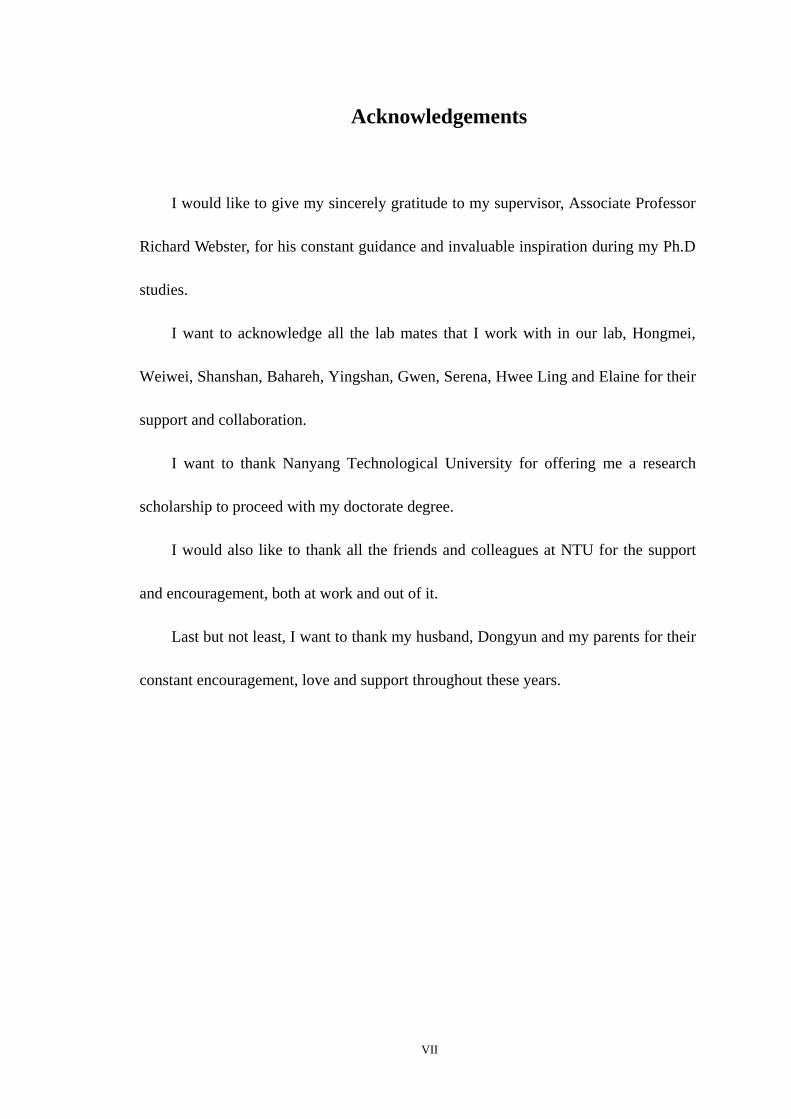
Scheme 1. Quinone redox reactions.
Studies of the Q/QH2 system over the past 100 years have deduced that the
electrochemical behavior can be divided into two major categories: behavior in aqueous
(buffered and unbuffered) solutions and in aprotic non-aqueous solvents. The
differences between the different media have been rationalized on the basis of
proton-transfer and hydrogen-bonding mechanisms.24
The redox chemistry of quinones
in buffered aqueous solutions at pH < ~7 can be described as shown in Scheme 1a,

CHAPTER 1
3
where quinones are reduced in a +2e–/+2H
+ chemically reversible process to form the
hydroquinones.1,25
The observed potential (Eobs) of the process varies according to the
pH because protons are involved in the reduction reaction. Hence, the measured Eobs
shifts from the formal potential (E0
f) according to the Nernst equation;26
𝐸obs = 𝐸fo +
2.303RT
nF× log
Q H+ 2
QH2 (1)
Where n is the number of electrons transferred (2), R is the gas constant (8.3143 J
K–1
mol–1
), T is the temperature (in kelvin), and F is the Faraday constant (96485 C
mol–1
). When [Q] = [QH2], then Eobs = E1/2r (the reversible half-wave potential).
According to eq 1, at 25 °C the E1/2r optimally shifts by –59.2 mV per one unit increase
in pH (providing the E0f does not significantly vary with the change in pH). Although
the reaction is written as 2e–/2H
+ in one step (concertedly), it is probable that the
electron transfer and proton transfer steps occur consecutively or by a mixed
concerted/consecutive mechanism.
In buffered solutions, as the pH increases above ~7, the semiquinone (Q–•
) and
dianion (Q2–
) have increased lifetimes, meaning that the acid dissociation constants of
their associated protonated forms need to be taken into account in the Nernst equation.24
Thus, the relationship between the Eobs of the quinone and the proton concentration can
be given by eq 2, where Ka1 and Ka2 are the acid dissociation constants of QH2 and QH–,
respectively.

CHAPTER 1
4
In unbuffered aqueous solutions, the initial reaction occurs via 2e– to form the
hydrogen-bonded dianion.1,24-37
Due to its basicity and depending on the exact solution
pH, the dianion will exist in solution as a mixture of Q2–
, QH–, QH2 and Q
2–(H2O)n.
𝐸obs = 𝐸fo +
2.303RT
nF× log 1 +
H+
Ka 2
+ H+ 2
Ka 1 Ka 2
(2)
In non-aqueous solvents in the absence of added acids, the quinone undergoes two
one-electron reductions to form the semiquinone and the dianion (Scheme
1c).1-3,24-28,38-56
The first one-electron reduction is generally electrochemically reversible
(fast electron transfer) and the second one-electron reduction is at least quasi-reversible.
The solvents, supporting electrolyte, protonation equilibria and the presence of acids
can affect the potentials of the reductions.1-3,38,41,43,45,46,57
For example, by reducing
anthraquinone (AQ) in dimethylformamide (DMF) in the presence of increasing
concentrations of a weak acid, which react only with the dianion, leads to a positive shift
of the second reduction peak potential, due to the protonation of the Q2–
, until the second
wave merges with the first reduction peak.2,3,12,58
1.1.2 Hydrogen Bonding between One- and Two-electron Reduced Forms of
Quinones
Hydrogen bonding is the attractive interaction that occurs between the hydrogen
atoms and electronegative atoms, such as nitrogen, oxygen or fluorine. Because of the
strength and directionality of hydrogen bonds, they are the most important
non-covalent interactions existing in nature which can occur intermolecularly or

CHAPTER 1
5
intramolecularly.59
The hydrogen bond occurs in both inorganic molecules and organic
molecules, which is stronger than a van der Waals interaction, but weaker than covalent
or ionic bonds.
Hydrogen-bonding interactions in aprotic solvents with the one- and two-electron
reduced products of quinones has been demonstrated by changes in the reduction
potentials and by changes in their optical spectra.60
Wilford and Archer observed
smooth shifts in the redox waves of p-benzoquinone as small increments of water were
added to aprotic solvents.45
Peover pointed out that the one-electron reduction potentials
of quinones in aqueous solutions are much more positive than in aprotic solvents and
this discrepancy increases with the basicity of the semiquinone.3
There is much experimental evidence that indicates that hydrogen bonding alone,
without proton transfer, can have a greater effect on the Q–/Q
2– redox potential. By
consideration of the appropriate pKa values of the protonated radical anions and the
continuous shift in potential with no change of peak height and reversibility (without the
appearance of any new waves), indicates that hydrogen-bonding occurs between the
reduction products of quinones and the hydroxylic additives.40,42,45,48,51-54
In reports on
the electrochemistry of quinones in aprotic solvents, hydrogen-bonding between
additives and quinone species have been found to occur in the presence of low
concentrations of hydroxylic additives. The degree of hydrogen-bonding interactions is
caused by the different effects of the agents.48
The cyclic voltammograms shown in Figure 1 show that the potentials of the two

CHAPTER 1
6
one-electron reduction reactions of quinones are both heavily influenced by water in an
aprotic solvent. The potential of the second reduction process (E2/V of Q–/Q
2–) in
particular shifts positively with the addition of water to the solutions of
quinones.30,42,45,58,61-63
The potential of the first reduction process (E1/V of Q/Q–) also
moves positively, but not as much as E2 (∆E2 > ∆E1). Eventually, the two waves merge
together at high water concentrations, corresponding to the reversible transfer of two
electrons per molecule.41,42,48
Figure 1. CVs of quinone in 0.1 M Bu4NPF6/DMF after addition of water: (a) 0%
H2O, (b) 0.5% H2O, (c) 1% H2O, (d) 2% H2O, (e) 4% H2O, (f) 8% H2O. ν = 100 mV/s
with Au working electrode. Excerpt from J. Am. Chem. Soc. 2007, 129, 12847–12856.
Hydrogen-bonding interactions are occurring between the anionic quinones and
water molecules to cause the shift in E1 and E2.1-3,24,25,27,28,38-54
UV-Vis and EPR
spectroscopic experiments support that the hydrogen-bonding occurring between the

CHAPTER 1
7
water and the semiquinone and dianion of quinones.60,64,65
The maximum potential shift
is related to the ratio of binding constants in the oxidized ([Ox]) and reduced states
([Red]) as given in eq 3 (at 25 oC).
66
∆𝐸maxo =
59mV
n× log
𝐾Red
𝐾Ox (3)
1.2 Vitamin K
1.2.1 General Introduction of Vitamin K
Vitamin K comprises a series of fat-soluble compounds which are based on
2-methyl-1,4-naphthoquinone derivatives with different side chains at the 3-position.67
They are synthesized by plants and bacteria, which contain two kinds: vitamin K1 and
vitamin K2. Vitamin K1 (VK1) is the only important molecular form in plants, also
called phylloquinone, which has a phytyl side chain (Scheme 2a). Vitamin K2 (VK2) is
a family of compounds which are synthesized by bacteria, also named as menaquinone
with a side chain based on variable numbers of unsaturated prenyl units (Scheme 2b).
VK1 and VK2 are from nature and are not toxic, but there is a synthetic type of vitamin
K: vitamin K3 (also known as menadione), without the phytyl chain which is very
toxic (Scheme 2c).

CHAPTER 1
8
Scheme 2. Different forms of vitamin K.
Vitamin K is an essential fat-soluble micronutrient which is needed for the post
translational modification of vitamin K-dependent proteins and required for blood
coagulation. It was also discovered that vitamin K plays a role in bone growth and the
maintenance of bone density, and also displays anticancer effects. The vitamin
K-dependent coagulation proteins are synthesized in the liver and comprise factors II,
VII, IX, and X, which have a haemostatic role, and proteins C and S, which have an
anticoagulant role.70-72
Several other vitamin K-dependent proteins have been isolated
from bone, cartilage, kidney, lungs, and other tissues as well, for example, osteocalcin
and matrix Gla protein (MGP), which is to prevent over calcification of the bone and
cartilage.73-78

CHAPTER 1
9
VK1 is the main source of dietary vitamin K which is absorbed from the
intestine.79
Then the VK1 is incorporated into chylomicrons within the intestinal
mucosa into the lymph, and enters the blood via the lacteals.80,81
Vitamin K is mostly
stored in the liver and comprises about 90% VK2 and 10% VK1.82,83
But the major
circulating form is invariably VK1. Vitamin K deficiency will cause bleeding; named
as vitamin K deficiency bleeding (VKDB), which represents a significant public health
problem in infants up to around age 6 months compared to adults, although rare.84-86
Therefore, vitamin K supplements is given to the infants in the immediate perinatal
period to protect them because VKDB is hard to test.
1.2.2 Properties of Vitamin K
The important biological properties of vitamin K involve proton and electron
transfers which are controlled by the quinone structure
(2-methyl-1,4-naphthoquinone).87
The function of vitamin K in the cell is to convert
glutamate (Glu) in proteins to gamma-carboxyglutamate (Gla). Within the cell,
vitamin K undergoes reduction reactions to form the vitamin K hydroquinone by the
enzyme. Then the vitamin K hydroquinone is oxidized by another enzyme to allow the
carboxylation of Glu to Gla (Scheme 3). Consequently, the mechanism of blood
clotting of vitamin K is believed to involve the reversible formation of the
hydroquinone in a two-electron, two-proton process which is analogous to the
electrochemical mechanism that occurs for most Q/QH2 systems.1,25

CHAPTER 1
10
Scheme 3. The cyclic metabolism of vitamin K in relation to the conversion of
glutamate (Glu) to γ-carboxyglutamate (Gla) residues.
VK1 is a water-immiscible yellow oil, which is found mostly in green leafy
vegetables and acts as an electron-transfer agent to form the semiquinone radical anion
in the photosynthetic membrane in photosystem I.88-94
Therefore, electrochemical
investigations concerning the electron- and proton-transfer properties of VK1 have
been conducted in aqueous and non-aqueous media for a better understanding of its
behavior in a biological environment.95-105
The electrochemical properties of vitamin
K in biomimetic membrane systems have been investigated because vitamin K and its
reduced forms exist inside cell membranes. For such purposes, a lipophilic

CHAPTER 1
11
environment is used to interrogate the voltammetry of vitamin K because it can reflect
the biological environment more realistically.101-103,105,106
Micro-droplets or a
self-assembled monolayer of vitamin K has been immobilised on the surface of the
working electrode with the presence of aqueous electrolytes.105,107-111
1.3 Aim of Present Project
The electrochemical properties of vitamin K in aqueous and non-aqueous
solutions have been studied because of its importance in biological processes. In this
thesis, the investigations of VK1‟s electrochemical properties were conducted in a low
water content environment (aprotic organic solvents) because VK1 exists inside
hydrophobic cell membranes in the human body. Adsorbed phospholipids or supported
lipid bilayers were also chosen and immobilized on the top of the working electrodes
in an attempt to study the electrochemistry of VK1 in a membrane-like environment.
Even when the VK1 is immobilized inside a membrane, it will be demonstrated that
electron- and proton-transfer reactions are still able to occur.

CHAPTER 1
12
References
1. Chambers, J. Q. In The Chemistry of the Quinonoid Compounds; Patai, S.,
Rappoport, Z., Eds.; Wiley: New York, 1988; Vol. II, Chapter 12, pp 719-757; 1974,
Vol. I, Chapter 14, pp 737-791.
2. Peover, M. E. In Electroanalytical Chemistry; Bard, A. J. Ed.; Marcel Dekker:
New York, 1967, Vol. II, pp 1–51.
3. Peover, M. E. J. Chem. Soc. 1962, 4540–4549.
4. Kolthoff, I. M.; Lingane, J. J. Polarography, 2nd ed.; Interscience: New York,
1952, Vol. I: Chapter XIV and XV, Vol. II: Chapter XL.
5. Evans, D. H. In Encyclopedia of Electrochemistry of the Elements; Bard, A. J.;
Lund, H. Editors; Marcel Dekker, New York, 1978, 12, pp. 1–259.
6. Garrett, R. H.; Grisham, C. M. Biochemistry, 3rd ed.; Thomson Brooks/Cole:
Belmont, CA, 2005; pp 681–685.
7. Eggins, B. R.; Chambers, J. Q. Chem. Commun. 1969, 232–233.
8. Eggins, B. R.; Chambers, J. Q. J. Electrochem. Soc. 1970, 117, 186–192.
9. Vetter, K. J. Z. Elektrochemie. 1952, 56, 797.
10. Vetter, K. J. Electrochemical Kinetics, Academic Press, New York, 1967,
p483.
11. Hale, J. M.; Parsons, R. Trans. Faraday Soc. 1963, 59, 1429–1437.
12. Given, P. E.; Peover, M. E. J. Chem. Soc. 1960, 385–393.
13. Bauscher, M.; Mäntele, W. J. Phys. Chem. 1992, 96, 11101–11108.

CHAPTER 1
13
14. Flaig, W.; Beutelspacher, H.; Riemer, H.; Kälke, E. Liebigs Ann. Chem. 1968,
719, 96–111.
15. Bishop, C. A.; Tong, L. K. J. J. Am. Chem. Soc. 1965, 87, 501–505.
16. Ilan, Y. A.; Czapski, G.; Meisel, D. Biochim. Biophys. Acta 1976, 430,
209–224.
17. Bailey, S. I.; Ritchie, I. M.; Hewgill, F. R. J. Chem. Soc., Perkin Trans. II 1983,
645–652.
18. Parker, V. D. Chem. Commun. 1969, 716–717.
19. Robertson, R. T.; Pendley, B. D. J. Electroanal. Chem. 1994, 374, 173–177.
20. Laviron, E. J. Electroanal. Chem. 1984, 164, 213–227.
21. Hattori, M. In Kirk-Othmer Encyclopedia of Chemical Technology, 5th ed.;
Seidel, A., Ed.; John Wiley & Sons: Hoboken, NJ, 2004; Vol. 9, pp 300–349.
22. Finley, K. T. In Kirk-Othmer Encyclopedia of Chemical Technology, 5th ed.;
Seidel, A., Ed.; John Wiley & Sons: Hoboken, NJ, 2004; Vol. 21, pp 238–270.
23. Bautista-Martínez, J. A.; González, I.; Aguilar-Martínez, M. J. Electroanal.
Chem. 2004, 573, 289–298.
24. Quan, M.; Sanchez, D.; Wasylkiw, M. F.; Smith, D. K. J. Am. Chem. Soc. 2007,
129, 12847–12856.
25. Hammerich, O.; Svensmark, B. In Organic Electrochemistry, 3rd ed.; Lund, H.,
Baizer, M. M., Eds.; Marcel Dekker: New York, 1991; Chapter 16.

CHAPTER 1
14
26. Bard, A. J.; Faulkner, L. R. Electrochemical Methods: Fundamentals and
Applications, 2nd ed.; Wiley: New York, 2001.
27. Ge, Y.; Miller, L.; Ouimet, T.; Smith, D. K. J. Org. Chem. 2000, 65, 8831–
8838.
28. Ge, Y.; Lilienthal, R. R.; Smith, D. K. J. Am. Chem. Soc. 1996, 118,
3976–3977.
29. Müller, O. H. J. Am. Chem. Soc. 1940, 62, 2434–2441.
30. Kolthoff, I. M.; Orlemann, E. F. J. Am. Chem. Soc. 1941, 63, 664–667.
31. Abbott, J. C.; Collat, J. W. Anal. Chem. 1963, 35, 859–863.
32. Bailey, S. I.; Ritchie, I. M. Electrochim. Acta 1985, 30, 3–12.
33. Sato, Y.; Fujita, M.; Mizutani, F.; Uosaki, K. J. Electroanal. Chem. 1996, 409,
145–154.
34. Shim, Y.-B.; Park, S.-M. J. Electroanal. Chem. 1997, 425, 201–207.
35. Park, H.; Won, M.-S.; Cheong, C.; Smith, Y.-B. Electroanalysis 2002, 14,
1501–1507.
36. Tang, Y. H.; Wu, Y. R.; Wang, Z. H. J. Electrochem. Soc. 2001, 148(4),
E133–E138.
37. Forster, R. J.; O'Kelly, J. P. J. Electroanal. Chem. 2001, 498, 127–135.
38. Peover, M. E.; Davies, J. D. J. Electroanal. Chem. 1963, 6, 46–53.
39. Peover, M. E.; Davies, J. D. Trans. Faraday Soc. 1964, 60, 476–478.
40. Umemoto, K. Bull. Chem. Soc. Jpn. 1967, 40, 1058–1065.

CHAPTER 1
15
41. Eggins, B. R. Chem. Commun. 1969, 1267–1268.
42. Hayano, S.; Fujihira, M. Bull. Chem. Soc. Jpn. 1971, 44, 2051–2055.
43. Nagaoka, T.; Okazaki, S.; Fujinaga, T. J. Electroanal. Chem. 1982, 133,
89–99.
44. Ashnagar, A.; Bruce, J. M.; Dutton, P. L.; Prince, R. C. Biochim. Biophys. Acta
1984, 801, 351–359.
45. Wilford, J. H.; Archer, M. D.; J. Electroanal. Chem. 1985, 190, 271–277.
46. Rüssel, C.; Jaenicke, W. J. Electroanal. Chem. 1986, 199, 139–151.
47. Laviron, E. J. Electroanal. Chem. 1986, 208, 357–372.
48. Gupta, N.; Linschitz, H. J. Am. Chem. Soc. 1997, 119, 6384–6391.
49. González, F. J. Electroanalysis 1998, 10, 638–642.
50. Gómez, M.; González, F. J.; González, I. Electroanalysis 2003, 15, 635–645.
51. Gómez, M.; González, F. J.; González, I. J. Electrochem. Soc. 2003, 150,
E527–E534.
52. Gómez, M.; Gómez-Castro, C. Z.; Padilla-Martínez, I. I.; Martínez-Martínez, F.
J.; González, F. J. J. Electroanal. Chem. 2004, 567, 269–276.
53. Macías-Ruvalcaba, N. A.; González, I.; Aguilar-Martínez, M. J. Electrochem.
Soc. 2004, 151, E110–E118.
54. Gómez, M.; González, F. J.; González, I. J. Electroanal. Chem. 2005 578,
193–202.
55. Lehmann, M. W.; Evans, D. H. J. Electroanal. Chem. 2001, 500, 12–20.

CHAPTER 1
16
56. Lehmann, M. W.; Evans, D. H. J. Phys. Chem. B 2001, 105, 8877–8884.
57. Jaworski, J. S.; Lesniewska, E.; Kalinowski, M. K. J. Electroanal. Chem. 1979,
105, 329–334.
58. Wawzonek, S.; Berkey, R.; Blaha, E. W.; Runner, M. E. J. Electrochem. Soc.
1956, 103, 456–459.
59. McNaught, A. D.; Wilkinson, A. Compendium of Chemical Terminology (“The
Gold Book”), 2nd ed. Blackwell Scientific Publications, Oxford, 1997.
60. Fujihira, M.; Hayano, S. Bull. Chem. Soc. Jpn. 1972, 45, 644–645.
61. Cauquis, G.; Marbach, G. Bull. Soc. Chim. Fr. 1971, 5, 1908–1916.
62. Bessard, J.; Cauquis, G.; Serve, D. Electrochim. Acta 1980, 25, 1187–1197.
63. Hanzlik, J.; Samec, Z. Collect. Czech. Chem. Commun. 1985, 50, 2821–2816.
64. Stone, E. W.; Maki, A. H. J. Chem. Phys. 1962, 36, 1944–1945.
65. Gendell, J.; Freed, J. H.; Fraenkel, G. K. J. Chem. Phys. 1962, 37, 2832–2841.
66. Miller, S. R.; Gustowski, D. A.; Chen, Z. H.; Gokel, G. W.; Echegoyen, L.;
Kaifer, A. E. Anal. Chem. 1988, 60, 2021–2024.
67. Vitamin K and Vitamin K-Dependent Proteins: Analytical, Physiological and
Clinical Aspects; CRC Press: Boca Raton, FL, 1993.
68. Saxena, S. P.; Israels, E. D.; Israels, L. G. Apoptosis 2001, 6 (1–2), 57–68.
69. Nimptsch, K.; Rohrmann, S.; Linseisen, J. Am. J. Clin. Nutr. 2008, 87(4),
985–992.

CHAPTER 1
17
70. Suttie, J. W.; Vitamin K. In: Diplock, A. D.; ed. Fat-soluble vitamins: their
biochemistry and applications. London, Heinemann, 1985, 225–311.
71. Furie, B.; Furie, B. C. Blood 1990, 75(9), 1753–1762.
72. Davie, E. W. Thrombosis and Haemostasis 1995, 74, 1–6.
73. Vermeer, C. Biochemical Journal 1990, 266, 625–636.
74. Ferland, G. Nutrition Reviews 1998, 56, 223–230.
75. Luo, G. B.; Ducy, P.; Makee, M. D.; Pinero, G. J.; Loyer, E.; Behringer, R. R.;
Karsenty, G. Nature 1997, 386, 78–81.
76. Vermeer, C.; Jie, K. –S. G.; Knapen, M. H. J. Annual Review of Nutrition
1995, 15, 1–22.
77. Binkley, N. C.; Suttie, J. W. Journal of Nutrition 1995, 125, 1812–1821.
78. Shearer, M. J. Proceedings of the Nutrition Society 1997, 56, 915–937.
79. Shearer, M. J.; McBurney, A.; Barkhan, P. Vitamins and Hormones 1974, 32,
513–542.
80. Shearer, M. J.; Barkhan, P.; Webster, G. R. British Journal of Haematology
1970, 18, 297–308.
81. Blomstrand, R.; Forsgren, L. Internationale Zeitschrift für Vitaminsforschung
1968, 38, 45–64.
82. Shearer, M. J. et al. The assessment of human vitamin K status from tissue
measurements. In: Suttie, J. W.; ed. Current advances in vitamin K research. New
York, NY, Elsevier, 1988, 437–452.

CHAPTER 1
18
83. Usui, Y.; Tanimura, H.; Nishimura, N.; Kobayashi, N.; Okanoue, T.; Ozawa,
K. Am. J. Clin. Nutr. 1990, 51, 846–852.
84. Shearer, M. J. Blood Reviews 1992, 6, 92–104.
85. Lane, P. A.; Hathaway, W. E. J. Pediatrics 1985, 106, 351–359.
86. Shearer, M. J. Lancet 1995, 345, 229–234.
87. Thayer, S. A.; Binkley, S. B.; MacCorquodale, D. W.; Doisy, E. A.; Emmett,
A. D.; Brown, R. A.; Bird, O. D. J. Am. Chem. Soc. 1939, 61, 2563.
88. Blankenship, R. E. Molecular Mechanisms of Photosynthesis, 1st ed.;
Blackwell Science: Oxford, 2002.
89. Trumpower, B. L. Function of Quinones in Energy Conserving Systems;
Academic Press: New York, 1982.
90. Voet, D.; Voet, J. G. Biochemistry, 3rd ed.; Wiley: New York, 2004.
91. Thurnauer, M. C.; Brown, J. W.; Gast, P.; Feezel, L. L. Radiat. Phys. Chem.
1989, 34 (4), 647–651.
92. van der Est, A. Biochim. Biophys. Acta 2001, 1507 (1–3), 212–225.
93. Rigby, S. E. J.; Evans, M. C. W.; Heathcote, P. Biochim. Biophys. Acta 2001,
1507 (1–3), 247–259.
94. Epel, B.; Niklas, J.; Sinnecker, S.; Zimmermann, H.; Lubitz, W. J. Phys. Chem.
B 2006, 110, 11549–11560.
95. Hart, J. P. Electroanalysis of biologically important compounds, Ellis Horwood,
New York, 1990, p. 137ff.
CHAPTER 1
19
96. Riegel, B.; Smith, P. G.; Schweitzer, C. E. J. Am. Chem. Soc. 1940, 62, 992.
97. Milazzo, G.; Fiordiponti, P.; Menichini, F.; Piccioli, A.; Tosato, M. L.;
Vatteroni, R. Experientia Suppl. 1971, 18, 463.
98. Ksenzhek, O. S.; Petrova, S. A.; Kolodyazhny, M. V.; Oleinik, S. V.
Bioelectrochem. Bioenerg. 1977, 4, 335–345.
99. Hart, J. P.; Shearer, M. J.; McCarthy, P. T.; Rahim, S. Analyst 1984, 109,
477–481.
100. Hart, J. P.; Wring, S. A.; Morgan, I. C. Analyst 1989, 114, 933–937.
101. Takehara, K.; Takemura, H.; Ide, Y.; Okayama, S. J. Electroanal. Chem. 1991,
308, 345–350.
102. Bilewicz, R.; Majda, M. Langmuir 1991, 7, 2794–2802.
103. Caboi, F.; Nylander, T.; Razumas, V.; Talaikyté, Z.; Monduzzi, M.; Larsson,
K. Langmuir 1997, 13, 5476–5483.
104. Alarnes-Varela, G.; Suárez-Fernández, A. L.; Costa-García, A. Electrochim.
Acta 1998, 44, 763–772.
105. Herrero, R.; Buoninsegni, F. T.; Becucci, L.; Moncelli, M. R. J. Electroanal.
Chem. 1998, 445, 71–80.
106. Cannes, C.; Kanoufi, F.; Bard, A. J. Langmuir 2002, 18, 8134–8141.
107. Marken, F.; Webster, R. D.; Bull, S. D.; Davies, S. G. J. Electroanal. Chem.
1997, 437, 209–218.
108. Schröder, U.; Wadhawan, J. D.; Evans, R. G.; Compton, R. G.; Wood, B.;

CHAPTER 1
20
Walton, D. J.; France, R. R.; Marken, F.; Page, P. C. B.; Hayman, C. M. J. Phys. Chem.
B 2002, 106, 8697–8704.
109. Wain, A. J.; Wadhawan, J. D.; Compton, R. G. Chemphyschem 2003, 4,
974–982
110. Marchal, D.; Boireau, W.; Laval, J. M.; Bourdillon, C.; Moiroux, J. J.
Electroanal. Chem. 1998, 451, 139–144.
111. Moncelli, M. R.; Becucci, L.; Nelson, A.; Guidelli, R. Biophys. J. 1996, 70,
2716–2726.

CHAPTER 2
21
Chapter 2
Experimental Section
2.1 Introduction to Voltammetry
Voltammetry is based on the measurement of the current in an electrochemical cell
under conditions of polarization in which the rate of oxidation and reduction of the
analyte are limited by the rate of mass transfer of the analyte to the electrode surface.1
Cyclic voltammetry and square-wave voltammetry are two types of voltammetric
methods.
2.1.1 Theory of Cyclic Voltammetry: Reversible and Irreversible Kinetics
Cyclic voltammetry is an important and widely used electrochemical technique for
studying redox processes at an electrode surface by the application of a triangular
potential sweep, allowing one to sweep back through the potential region just
covered.2-4
Cyclic voltammetry is carried out under stationary conditions, therefore, the
mode of mass transfer to the electrode is diffusion only.
The different values of the standard electrochemical rate constant, k0, lead to
different limiting behavior of the heterogeneous electron transfer processes. The „fast‟
and „slow‟ electrode kinetics are characterized by the labels „electrochemically

CHAPTER 2
22
reversible‟ and „electrochemically irreversible‟ respectively. Figure 1 shows the
voltammograms with different heterogeneous rate constants.
Figure 1. Cyclic voltammograms for electrochemically reversible reaction (Blue
line), electrochemically quasi-reversible reaction (Red line) and electrochemically
irreversible reaction (Green line) with different rate constants.
2.1.2 Electrochemical Cell for Cyclic Voltammetry
The experimental facility for recording cyclic voltammograms consists of an
electrochemical cell (Figure 2) that has three electrodes: reference electrode (RE),
working electrode (WE), and auxiliary or counter electrode (CE), all immersed in a
solution and connected to a potentiostat. The potentiostat5 allows the potential
difference between the reference and working electrode to be controlled by adjusting the
potential between the working and auxiliary electrodes with minimal interference from
IR (ohmic) drop.

CHAPTER 2
23
Figure 2. Electrochemical cell for cyclic voltammetry with three electrodes.
The purpose of positioning the reference electrode close to the working electrode is
to reduce the IR drop between the reference and working electrode due to the resistivity
of the solution phase. The electrodes commonly used for cyclic voltammetric
experiments are:
(1) Reference electrode: to provide a constant potential with which to monitor the
working electrode. Aqueous Ag/AgCl or calomel half-cells6,7
are commonly used
reference electrodes, which can be obtained commercially or easily prepared in the
laboratory. However, the common reference electrode is not suitable for some
conditions, e.g. for some dry organic solvents or room temperature ionic liquids, or
when they introduce problems with salt leakage or junction potentials, then

CHAPTER 2
24
pseudo-reference electrodes, such as a simple silver or platinum wire, can be used in
conjunction with an internal potential reference provided by ferrocene.8,9
Experimentally, ferrocene is added into the cell at the end of a series of measurements,
and the reversible voltammetric response for the Fc+/0
couple is taken as the reference
point on the potential scale.
(2) Working electrode: where the electrochemical reaction of interest occurs. Inlaid
disc electrodes (Pt, Au, glassy carbon (GC)) of well-defined area are most commonly
used as working electrodes.
(3) Auxiliary electrode: where the opposite reaction occurs to the reaction
occurring at the working electrode. Platinum wire or mesh is most commonly used as
the auxiliary electrode, which is a non-reactive high surface area electrode.
2.1.3 Theory of Square-wave Voltammetry
Square-wave voltammetry (SWV) is a powerful electrochemical technique that can
be applied in both electrokinetic and analytic measurements.10-14
Because of the
widespread use of computer controlled instruments, a well-developed theory and most
importantly, its high sensitivity to surface-confined electrode reactions, the application
of SWV has boomed in the last decade.
SWV was developed by combining the high-amplitude, high-frequency square
wave with the fast staircase waveform and by using computer-controlled instruments.
Figure 3 shows the potential-time waveform of modern SWV. Each square wave period

CHAPTER 2
25
occurs during one staircase period τ. Hence, the frequency of the excitation signal is f =
τ–1
, and the pulse time is tp = τ/2. The square-wave amplitude, Esw, is one-half of the
peak-to-peak amplitude, and the potential increment ∆E is the step height of the
staircase waveform. The currents are measured at position 1 and 2.
Figure 3. Waveform for square-wave voltammetry. Excerpt from Fundamentals
of Analytical Chemistry (8th Edition), 2004, Chapter 23, p692.
A single SWV potential scan generates three voltammograms showing i1, i2 and
∆i as a function of the staircase potential, as sketched in Figure 4.15
Here i1 is the
forward current, i2 is the reverse current, and the current difference, ∆i is directly
proportional to concentration.

CHAPTER 2
26
Figure 4. Schematic voltammetric profiles of the current measured during the
forward and reverse pulses and resultant difference, ∆i, plotted against the staircase
potential E. Excerpt from Fundamentals of Analytical Chemistry (8th Edition), 2004,
Chapter 23, p693.
2.2 Introduction to Karl Fischer Titration
Karl Fischer (KF) titration is a classic titration method in analytical chemistry that
uses coulometric or volumetric titration to determine the trace amounts of water in a
sample.
The KF titration is the standard method for obtaining the water content of various
substances.16
It is based on the solution-phase reactions given in eqs 1 and 2 and can be
performed in coulometric or volumetric mode. ROH in eq 1 is an alcohol, usually
methanol or ethanol, and RN in eq 1 is an amine such as imidazole.

CHAPTER 2
27
ROH + SO2 + RN → (RNH) • SO3R (1)
(RNH) • SO3R + 2 RN + I2 + H2O→ (RNH) • SO4R + 2(RNH)I (2)
Equation 2 shows that there is a 1:1 reaction between I2 and H2O; thus, if the
amount of I2 is accurately known, then the amount of water can be determined. In KF
coulometric titrations (as performed in this study), the I2 is generated electrochemically
by the oxidation of iodide (eq 3).
2 I– → I2 + 2 e
– (3)
According to eqs 2 and 3, 2 mol of electrons is produced for every mole of water
that reacts with iodine. Therefore, 2 × 96485 coulombs (C) are produced for 1 mol of
water present, or stated another way: 1 μg of water corresponds to 0.01072 C passed.
The end point of the titration is measured by a change in voltage across two indicator
electrodes due to the presence of free iodine.
The great advantage of the KF titration is that it does not need calibration, since the
charge can be directly correlated with the amount of water present. However, some
limitations exist; in particular, there is a minimum charge that can be accurately
measured by the coulometer, meaning that low concentrations of water require higher
masses of the analyte to achieve the greatest accuracy. With care the KF titration can
accurately give measurements down to 1 ppm water. In this study, most measurements
were conducted between 200 and 2000 ppm water, a range over which reliable readings
can be easily obtained. In certain situations, the charge measured during the oxidation of
iodine is not necessarily selective for water because other oxidizable species are present,

CHAPTER 2
28
or the reaction in eq 2 between I2 and H2O does not occur in a 1:1 ratio.16
Nevertheless,
the solvents/electrolytes used in this thesis work represent straightforward media within
which to calculate the water content without any known special difficulties.
KF titrations were conducted with a Mettler Toledo DL32 coulometer using
(Riedel-deHaën) HYDRANAL®
–coulomat CG for the cathode compartment and
HYDRANAL®
–coulomat AG for the anode compartment. The instrument was first
allowed to stabilize until the drift was 0 μg min–1
H2O which usually required 30
minutes of operation. The samples were injected into the coulometer using plastic
disposable syringes though a silicon/Teflon septum. Each measurement took less than 1
minute, meaning that the drift from atmospheric water entering the coulometer was
negligible.
2.3 Introduction to Spectrochemical Methods
Spectroscopy is a technique that uses the interaction of radiation with matter to
obtain a spectrum, which is a plot of the intensity of energy detected versus the
wavelength or frequency. Information about atomic and molecular energy levels,
molecular geometries, chemical bonds, interactions of molecules, and related
processes can be obtained from a spectrum. Spectra can be used to qualitatively
analyse the components of a sample or quantitatively measure the amount of material
in a sample. Ultraviolet-visible (UV-Vis) spectroscopy and Fourier transform infrared
(FTIR) spectroscopy are two kinds of spectrochemical methods, which are widely used

CHAPTER 2
29
in chemistry, biology, engineering and many other fields.
The spectroscopic instruments of UV-Vis and FTIR spectroscopy contain five
components: (1) a stable source of radiant energy; (2) a wavelength selector; (3) one or
more sample containers; (4) a radiation detector; and (5) a computer to process and
readout the signal.
2.3.1 Theory of Ultraviolet-visible Spectroscopy
Ultraviolet-visible (UV-Vis) spectroscopy refers to absorption spectroscopy or
reflectance spectroscopy in the UV-Vis spectral region, which is the measurement of
the attenuation of a beam of light after it passes through a sample or after reflection
from a sample surface. This means it uses light in the visible and adjacent (near-UV
and near-infrared (NIR)) ranges. The absorption or reflectance in the visible range
directly affects the perceived color of the chemicals involved. In this region of the
electromagnetic spectrum, molecules undergo electronic transitions. UV-Vis
spectroscopy is useful to characterize the absorption, transmission, and reflectivity of a
variety of technologically important materials.
The Beer-Lambert law (eq 4) is used to quantitatively determine the concentrations
of the absorbing molecules in solution.
𝐴 = log 𝐼0 𝐼 = ε 𝑏𝑐 (4)
where A is the measured absorbance, I0 is the intensity of the incident light at a
given wavelength, I is the transmitted intensity, b the path length of the absorbing

CHAPTER 2
30
medium, and c the concentration of the absorbing species, ε is a proportionality
constant called the molar absorptivity. The molar absorptivity is a fundamental
molecular property in a given solvent at a particular temperature and pressure, and has
units of L mol–1
cm–1
.
A deuterium discharge lamp and a tungsten-halogen lamp are usually used as the
light source for UV and visible measurements in UV-Vis spectroscopy, respectively.
The instruments automatically swap lamps when scanning between the UV and visible
regions. Holographic gratings17
are used to disperse the wavelengths of these
continuous light sources in a monochromator or spectrograph. The wavelength band is
then determined by the monochromator slit width. UV-Vis spectrometers utilize a
combination of a photomultiplier tube (PMT) and a Peltier-cooled PbS IR detector.
The light from the lamp is dispersed before reaching the sample cell. Figure 5 shows
the light pathways of single-beam and double-beam instruments used for UV-Vis
spectroscopy.

CHAPTER 2
31
Fig
ure 5
. The lig
ht p
athw
ays o
f (a) sin
gle-b
eam in
strum
ents an
d (b
) double-b
eam in
strum
ents.

CHAPTER 2
32
For both the single-beam and double-beam instruments, the radiation from the
lamps passes through an entrance slit into the monochromator. A holographic grating
diffracts the radiation, and the selected wavelength band passes through the exit slit
into the sample compartment. A detector converts the light intensity into a related
electrical signal which is enlarged and displayed on a computer.
2.3.2 Theory of Fourier Transform Infrared Spectroscopy
Infrared (IR) spectroscopy is a vibrational spectroscopy technique which is a
powerful tool for identifying molecules‟ structural information in terms of their
functional groups, the orientation of those groups and information on isomers which can
be termed a molecular “fingerprint”. Most molecular species absorb IR radiation, and
each molecule has a unique IR absorption spectrum, except chiral molecules in the
crystalline state.18
IR radiation is insufficient in energy to excite electronic transitions,
but it can excite vibrational and rotational transitions of the molecules. The molecules
can undergo a number of vibrations and rotations.
There are two types of IR instruments used to obtain complete spectra for
qualitative identification: dispersive spectrometers and Fourier transform infrared
(FTIR)19
spectrometers. The latter is the commonly used type now. FTIR instruments
use an ingenious device called Michelson interferometer (Figure 6) to obtain precise
measurements.20

CHAPTER 2
33
Figure 6. Diagram of a Michelson interferometer.
A beam from the light source is split into two beams by the beam splitter. One of
the two beams, A’ is reflected to the stationary mirror and the other beam, B is
transmitted to the movable mirror. The mirrors then reflect the beams back to the beam
splitter, and A’ and B converge in the same region of space and form an interference
pattern. The movable mirror is moved to generate different interference patterns to
modulate the optical signal. The resulting interferogram of the wavelength in the beam
is recorded and used for measurement. A sample is then inserted into the beam, and the
sample interferogram is then recorded. The two interferograms are used to obtain the

CHAPTER 2
34
spectrum of the sample. The beam is transmitted through or reflected off the surface of
the sample in IR analysis, depending on the type of analysis being performed.
There are many different ways for sample preparation. For liquids, cells of sodium
chloride (NaCl) or potassium bromide (KBr) are used for non-aqueous media, and
calcium fluoride (CaF2) for aqueous media which are all free of interferences. For solids,
some can be dissolved in suitable solvents or cast onto films with a transmitting medium.
Other solids can be ground into a mineral oil. For small samples, a microscope
attachment can be used to obtain reflectance or transmittance spectra on particles as
small as 20 microns. In addition, while preparing the sample for transmission mode it is
sometimes difficult to get the correct sample-to-matrix ratios as well as ensuring the
homogeneity of the sample, and these factors affect the reproducibility of the IR data. A
special sampling technique, attenuated total reflectance (ATR), is used to address the
concerns regarding sample preparation and reproducibility of spectra. ATR functions by
measuring the changes that occur in a totally internally reflected IR beam when the
beam comes into contact with a sample (Figure 7).
Figure 7. Diagram of an attenuated total reflectance (ATR) cell.
In ATR the sample is brought into close contact with the surface of the prism which

CHAPTER 2
35
is made of a crystal with a high refractive index. An IR beam is directed at a certain
angle onto the crystal resulting in total internal reflectance, thereby creating an
evanescent wave that extends beyond the crystal surface and into the sample. If the
sample absorbs IR radiation, an IR spectrum can be obtained.
It is to be noted that there are conditions to fulfill in order for the ATR technique to
be successful. The first condition is that the ATR crystal needs to be in direct contact
with the sample since the evanescent wave protrudes only a few microns (0.5 μm – 5 μm)
beyond the crystal surface; the second condition is the refractive index of the crystal
must be considerably larger than that of the sample otherwise the IR beam will be
transmitted instead of being internally reflected within the crystal.
A Mettler Toledo ReactIR™ iC10 (Figure 8(a)) is used in the ATR experiments in
this thesis, which is a real-time in-situ reaction analysis and reaction monitoring
system. Measurements are carried out using the iC IR™ software which permits the
measurement of a range of frequencies over time. Hence changes in the character or
quantity of a specific bond can be clearly observed while simultaneous coulometric
measurements are being taken. Diamond is used for the ATR crystal because it has the
best durability, robustness and chemical inertness. The probe consists of a flexible IR
transmission fiber which is composed of silver chloride/silver bromide. The flexible
nature of the probe facilitates its use and easy integration with various experimental
setups (Figure 8(b)).

CHAPTER 2
36
Figure 8. Photograph of (a) Mettler Toledo ReactIR™ iC10 instrument and (b)
ATR probe with diamond as the crystal.
2.4 Humidity Controlled Chamber
A humidity controlled chamber is used to control interior humidity levels above
or below ambient conditions. The chamber is equipped with a humidity sensor
technology and ultrasonic humidifier and a dry gas purge system. The automatic
controller provides monitoring and controlling of the relative humidity. It activates the
necessary system (dehumidification or humidification) when the moisture level
deviates from the adjustable set point. Since this is a closed loop circulation system, an
inert gas environment can be maintained in the glove box while controlling the
humidity.
The ultrasonic humidifier vibrates the water in the reservoir to provide a cloud of
mist that is pushed into the glove box from the pump system. At the same time air is
pulled out of the glove box and circulated through the water reservoir, completing the
humidification system's closed loop circuit. The water reservoir is equipped with a
self-sealing quick disconnect inlet for refilling under sealed conditions. The chamber
is equipped with gloveless sleeves to allow handling of interior samples.

CHAPTER 2
37
2.5 General Experimental Section
2.5.1 Chemicals
Vitamin K1 (VK1) (98%) (Sigma-Aldrich) was obtained from Sigma-Aldrich and
stored in refrigerator. Bu4NPF6 was prepared by reacting equal molar amounts of
aqueous solutions of Bu4NOH (40%, Alfa Aesar) and HPF6 (65%, Fluka), washing the
precipitate with hot water, recrystalizing 3 times from hot ethanol followed by drying
under vacuum at 160 oC for 24 hours and storing under vacuum.
21 All solvents were
HPLC or analytical grade and used directly from the bottles, after drying over 3 Å
molecular sieves. Lecithin (refined) was obtained from Alfa Aesar, and Nafion® (5 wt. %
in a mixture of lower aliphatic alcohols and containing 15 – 20% water) was obtained
from Sigma-Aldrich. Water, with a resistivity ≥ 18 MΩ cm from an ELGA Purelab
Option-Q was used for experiments at different pH-values. Britton–Robinson buffer
solutions (pH 3, 5, 7, 9, 11, and 13) were prepared using 0.04 M acetic, phosphoric,
and boric acids (Merck), and adjusted to the required pH using NaOH (Merck).
2.5.2 Voltammetry
Cyclic voltammetry (CV) and square-wave voltammetry (SWV) experiments were
conducted with a computer controlled Eco Chemie μAutolab III potentiostat. In
non-aqueous solutions, working electrodes were 1 mm diameter planar Pt and glassy
carbon (GC) disks (Cypress Systems), used in conjunction with a Pt auxiliary electrode
(Metrohm) and an Ag wire miniature reference electrode (Cypress Systems) connected
CHAPTER 2
38
to the test solution via a salt bridge containing 0.5 M Bu4NPF6 in CH3CN. Accurate
potentials were obtained using ferrocene as an internal standard. A pseudo reference
electrode consisting of a Pt wire was used for experiments at water concentrations < 0.1
M. Coulometry experiments were performed in a divided controlled potential
electrolysis cell separated with a porosity no. 5 (1.0 – 1.7 μm) sintered glass frit.22
In
aqueous solutions, working electrodes were 3 mm diameter Au, GC and Pt disks
(Metrohm), or a 1 mm diameter GC disk (Cypress Systems) used in conjunction with a
Pt auxiliary electrode and an Ag/AgCl (3 M KCl) reference electrode. All
voltammetric experiments were conducted at 22 ± 2 oC.
2.5.3 Method for Drying Solutions for Electrochemistry
The solvent containing 1 mM VK1 and a variable concentration of supporting
electrolyte were placed inside a 25 mL vacuum syringe (SGE Analytical Science)
containing 3Å molecular sieves (that were dried under vacuum at 513 K for 12 hours)
and the syringe was stored under a nitrogen atmosphere for at least 48 hours. The VK1
was stable under these conditions in each of the solvents tested, even after several days
directly in contact with the molecular sieves, since the peak currents measured by
voltammetry were the same before and after drying. The syringe was wrapped in
aluminum foil during the drying process to prevent photochemical reactions of VK1.
The contents of the syringe were then injected into a glass electrochemical cell that had
been dried at 100 oC in an oven and then allowed to cool under an argon atmosphere.

CHAPTER 2
39
After deoxygenating the solution for 10 minutes with argon gas, the voltammetric scans
were commenced, with an aliquot of solvent being simultaneously tested by KF titration.
For experiments at the lowest water concentrations (< 0.1 M), the trace water level was
allowed to increase from the lowest value under natural humidity conditions (the mean
relative humidity in Singapore is 84%, typically ranging from > 90% in the early
morning to 60% in the late afternoon). For concentrations of water > 0.1 M, the water
content was calculated based on the accurately known volume of added water.
2.5.4 Controlled Potential Electrolysis
Experiments were performed in a divided controlled potential electrolysis (CPE)
cell separated with a porosity no. 5 (1.0 – 1.7 μm) sintered glass frit.22
The working
and auxiliary electrodes were identically sized Pt mesh plates symmetrically arranged
with respect to each other with an Ag wire reference electrode (isolated by a salt
bridge) positioned to within 2 mm of the surface of the working electrode. The
volumes of both the working and auxiliary electrode compartments were
approximately 10 mL each. The solution in the working electrode compartment was
simultaneously deoxygenated and stirred using bubbles of argon gas. The number of
electrons transferred during the bulk oxidation process was calculated from
N = Q/nF (6)
where N = no. of moles of starting compound and Q = charge (coulombs).

CHAPTER 2
40
2.5.5 In-situ UV-Vis Spectroscopy
A Perkin-Elmer Lambda 750 spectrophotometer was used in conjunction with an
optically semi-transparent thin layer electrochemical (OSTLE) cell (pathlength = 0.05
cm) using a Pt mesh working electrode.23,24
Variable temperature (253 – 293 K)
experiments were controlled with a Thermo Electron Neslab RTE 740 circulating bath
containing propan-2-ol. The temperature of the OSTLE cell was controlled using a
PerkinElmer flow cell connected to the circulating bath. The temperature difference
between the circulating bath and the cell was calibrated using a thermocouple inside the
OSTLE cell. The cavity of the spectrometer was purged from the atmosphere with a
high volume flow of nitrogen gas.
2.5.6 Theoretical Calculations
Digital simulations of the CV data were performed using the DigiElch software
package.25-30

CHAPTER 2
41
References
1. Skoog, D. A.; West, D. M.; Holler, F. J.; Crouch, S. R. Fundamentals of
Analytical Chemistry (8th Edition), Thomson Brooke/Cole, 2004, Chapter 23.
2. Bard, A. J.; Faulkner, L. R. Electrochemical Methods: Fundamentals and
Applications, 2nd Ed. Wiley: New York, 2001.
3. Nicholson, R. S.; Shain, I. Anal. Chem. 1964, 36 (4), 706–723.
4. Heinze, J. Angew. Chem. Int. Ed. Engl. 1984, 23 (11), 831–847.
5. Kissinger, P. T.; Heinemann, W. R. Laboratory Techniques in Electroanalytical
Chemistry, Marcel Dekker: New York, 1984, Chapter 6.
6. Janz, G. J.; Ives, D. J. G. Reference electrodes: Theory and Practice Academic
Press, New York, 1961.
7. Greef, R.; Peat, R.; Peter, L. M.; Pletcher, D.; Robinson, J. Instrumental methods
in electrochemistry, Ellis Horwood, Chichester, 1985, Chapter 11.
8. Bond, A. M.; Oldham, K. B.; Snook, G. A. Anal. Chem. 2000, 72 (15),
3492–3496.
9. Pavlishchuk, V. V.; Addison, A. W. Inorg. Chim. Acta 2000, 298, 97–102
10. Osteryoung J.; O‟Dea J. J. Square-wave voltammetry In: Bard, A. J. Editor,
Electroanalytical Chemistry, Vol 14, Marcel Dekker, New York, 1986, p 209.
11. Eccles, G. N. Crit. Rev. Anal. Chem. 1991, 22 (5), 345–380.
12. Lovrić, M. Square-wave voltammetry. In: Scholz F. (ed) Electroanalytical
methods, Springer, Berlin Heidelberg, New York, 2002, pp 111–133.

CHAPTER 2
42
13. De Souza, D.; Machado, S. A. S.; Avaca, L. A. Quím Nova 2003, 26, 81–89.
14. De Souza, D.; Codognoto, L.; Malagutti, A. R.; Toledo, R. A.; Pedrosa, V. A.;
Oliveira, R. T. S.; Mazo, L. H.; Avaca, L. A.; Machado, S. A. S. Quím Nova 2004, 27,
790–797.
15. O‟Dea, J. J.; Osteryoung, J.; Osteryoung, R. A. Anal. Chem. 1981, 53 (4),
695–701.
16. Scholz, E. In Karl Fischer Titration: Determination of Water; Springer-Verlag,
Berlin, 1984.
17. Flamand, J.; Grillo, A.; Hayat, G. Amer. Lab. 1975, 7(5), 47; Lerner, J. M., et al.
Proc Soc Photo Opt Instrum Eng 1980, 280, 72–82.
18. Colthup, N. B.; Daly, L. H.; Wiberley, S. E. Introduction to Infrared and Raman
Spectroscopy, 3rd ed. New York: Academic Press, 1990.
19. Griffiths, P. R.; de Haseth, J. A. Fourier Transform Infrared Spectrometry, 2nd
ed. Wiley-Interscience, 2007.
20. Skoog, D. A.; Holler, F. J.; Crouch, S. R. Principles of Instrumental Analysis,
6th ed. Brooks Cole. 2007.
21. Fry, A. J.; Britton, W. E. In Laboratory Techniques in Electroanalytical
Chemistry; Kissinger, P. T., Heinemann, W. R. Eds.; Marcel Dekker: New York, 1984,
Chapter 13.
22. Webster, R. D.; Bond, A. M.; Schmidt, T. J. Chem. Soc., Perkin Trans. 2 1995,
1365–1374.

CHAPTER 2
43
23. Webster, R. D.; Heath, G. A.; Bond, A. M. J. Chem. Soc., Dalton Trans. 2001,
3189–3195.
24. Webster, R. D.; Heath, G. A. Phys. Chem. Chem. Phys. 2001, 3, 2588–2594.
25. Rudolph M. J. Electroanal. Chem. 2003, 543, 23–39.
26. Rudolph M. J. Electroanal. Chem. 2004, 571, 289–307.
27. Rudolph M. J. Electroanal. Chem. 2003, 558, 171–176.
28. Rudolph M. J. Comput. Chem. 2005, 26, 619–632.
29. Rudolph M. J. Comput. Chem. 2005, 26, 633–641.
30. Rudolph M. J. Comput. Chem. 2005, 26, 1193–1204.

44

CHAPTER 3
45
Chapter 3
Voltammetry of Vitamin K1 in CH3CN Containing
Varying Concentrations of Water
3.1 Introduction
Vitamin K is a series of natural compounds that are based on
2-methyl-1,4-naphthaquinone derivatives, with an aliphatic side chain in the
3-position.1 Vitamin K1 (VK1; also known as phylloquinone) contains four isoprenoid
groups in its side chain, one of which is unsaturated (Scheme 1a). Vitamin K2 (also
called menaquinone) has a side chain with a variable number of unsaturated isoprenoid
groups. The important biological properties of vitamin K involve proton and electron
transfers and are controlled by the naphthaquinone functional group, while the side
chain provides compatibility with the hydrophobic membrane, similar to the function of
the phytyl chain in vitamin E and other lipid soluble compounds.2
Vitamin K and its reduced forms exist inside hydrophobic cell membranes, so it is
beneficial to study its electrochemical properties in a low water content environment,
such as aprotic organic solvents, where the electrochemistry differs from that observed
in aqueous systems.3 It is also important to examine the interactions between reduced
forms of vitamin K and potential hydrogen-bonding donors (including trace water)
which may significantly influence its biological redox properties.

CHAPTER 3
46
O
O
R
O
O
3
O
O
n
H
Vitamin K1 (phylloquinone)
Vitamin K2 (menaquinone)
(a)
(b) O
O
R
OH
OH
R+ 2e- / + 2H+
O
O
R + 1e-
hydroquinone (QH2)
semiquinone (Q )
(c)
R
O
O
+ 1e-
O
O
R
dianion (Q2 )
(Q)
Scheme 1. Different forms of vitamin K and their electrochemical reduction
mechanism.
The differences in the electrochemical behavior of quinones in aqueous (buffered
and unbuffered) and non-aqueous solvents have been rationalized on the basis of proton

CHAPTER 3
47
transfer and hydrogen-bonding mechanisms.4a
In buffered aqueous solutions at pH < ~7,
quinones (Q) are reduced in a 2e–/2H
+ process to reversibly form the hydroquinones
(QH2) (Scheme 1b).3 Although the reaction is written as 2e
–/2H
+ in one step
(concertedly), it is probable that the electron transfer and proton transfer steps occur
consecutively or by a mixed concerted/consecutive mechanism. As the pH increases
above ~7, the semiquinone (Q–•
) and dianion (Q2–
) have increased lifetimes, meaning
that the acid dissociation constants of their associated protonated forms need to be taken
into account in the Nernst equation.4a
In aprotic organic solvents containing no added acid, the quinone undergoes
one-electron reduction to the semiquinone, which can be further reduced by
one-electron at more negative potentials to form the dianion (Q2–
) (Scheme 1c).3,4,6-17
The voltammetry has been shown to be heavily influenced by water in the solvent as the
potential of both the first reduction process (E1/V) and especially the second reduction
process (E2/V) shift to more positive potentials with increasing water concentration
(ΔE2 > ΔE1). Eventually at high water concentrations the second process merges with
the first process, corresponding to the reversible transfer of two-electrons per molecule.
It is believed that the shift in potential of the two processes is too great to be caused by
protonation effects (because the pH of the solution does not significantly change).
Instead it has been proposed that the shift in E1 and E2 with increasing water is due to an
equilibrium that exists between the anionic quinones (Q–•
and Q2–
) and their hydrogen

CHAPTER 3
48
bonded forms.3,4,6-17
UV-Vis and EPR spectroscopic experiments support the hydrogen
bonding mechanism during the reduction of quinones.18
Although hydrogen bonding is known to occur between water and quinone
anions/dianions in non-aqueous solvents,3,4,6-17
we are not aware of any studies that
accurately report the residual water content of the organic solvents. While it is
commonly known that the water content of a "dry" solvent is not negligible, it is often
assumed that the voltammetric responses are unaffected by very low levels of water.
This is because it could be expected that the solvent-substrate interactions would be
more significant than trace water-substrate interactions, which is true in situations
where the non-aqueous solvents undergo strong hydrogen bonding with the substrate.
However, it will be demonstrated in this study that differences of a few millimolar H2O
in the solvent CH3CN are surprisingly sufficient to change the appearance and potential
of the reduction processes of VK1, and the differences are most pronounced at the
lowest water concentrations (0 – 0.01 M).
Unless scrupulous care is taken in preparing the cells for electrochemical
experiments, it is likely that the water content of the solvent will be much greater than
that of the substrate,19
especially in high humidity environments.20
Solvents that are
taken from distillation apparatus or from above molecular sieves will rapidly begin
adsorbing water from the atmosphere as soon as they are added to the cells. This is due
to limitations in the design of electrochemical cells that require numerous ports for
electrodes and purging devices, and require the working electrode to be easily removed
CHAPTER 3
49
for polishing.21
Aqueous reference electrodes will immediately add moisture to the
analyte solution and even non-aqueous reference electrodes are a significant source of
water. The supporting electrolytes used for non-aqueous electrochemistry are often
hygroscopic and should be dried by heating under vacuum immediately prior to use.21
In the present study the water concentration in the solvent in the electrochemical
cell was accurately measured by performing Karl Fischer (KF) titrations.
Voltammograms of VK1 were recorded and the water content simultaneously adjusted
over relatively small concentration changes (~0.005 M). It was determined that at water
concentrations < 0.1 M, the peak separation between E1 and E2 was sensitive to a 0.001
M change in (water) concentration. The electrochemical results were complemented
with results from in-situ UV-Vis spectroscopy over a range of water concentrations in
order to identify the hydrogen bonded anions.
3.2 Results and Discussion
3.2.1 Electrochemistry at Intermediate (0.05 M) to High (10 M) Water Concentrations
Figure 1 shows CVs of VK1 in CH3CN obtained at GC and Pt electrode surfaces at
variable scan rates in the presence of 0.05 (0.01) M H2O. On GC, two one-electron
reduction processes were detected corresponding to the chemically reversible
transformation of VK1 to the monoanion (VK1–•
) (eq 1) and dianion (VK12–
) (eq 2).
VK1 VK1+ e-
E0
f(1) / V (1)
VK12VK1 + e-
E0
f(2) / V (2)
CHAPTER 3
50
E0
f(1) and E0
f(2) refer to the formal electrode potentials, which for quinones are
strongly dependant on the water content of the solvent; thus absolute values can only be
reported if the water content is accurately known. The E0
f-values can be approximated
from the Er1/2-values obtained during CV experiments, which for electrochemically
reversible processes can be measured from the mid-point of the cathodic (Epred
) to
anodic (Epox
) peak potentials in situations where the cathodic (ipred
) and anodic (ipox
)
peak current ratios are equal to unity.22
On GC surfaces at a scan rate (ν) of 100 mV s–1
, the anodic to cathodic
peak-to-peak separation (Epp) for both processes was 75 mV, similar to the value
obtained for ferrocene under identical conditions. However, as the scan rate was
increased, the Epp-values for the two processes diverged, so that at ν = 50 V s–1
, the
Epp-values for the first and second processes were 115 mV and 150 mV respectively.
The increase in Epp-value for the first process at faster scan rates can be accounted for
by the effects of uncompensated solution resistance, and was similar to that observed for
ferrocene at an identical scan rate (which is known to undergo fast heterogeneous
electron transfer23
).

CHAPTER 3
51
Figure 1. Variable scan rate CVs recorded at 293 K at 1 mm diameter planar GC
and Pt working electrodes in CH3CN containing 1 mM VK1, 0.2 M Bu4NPF6 and 0.05
(0.01) M H2O. The current data were normalized by multiplying by ν–0.5
(ν = scan rate).
Data at 10 V s–1
and 50 V s–1
are offset by –20 and –40 μA respectively. (…..
)
Simulations recorded with the following parameters (see equations 1 – 4): E1 = –1.23 V
(ks(1) = 1 cm s–1
), E2 = –1.80 V (ks(2) = 0.1 cm s–1
), D = 2.0 x 10⁻⁵
cm2 s
–1, R = 320 , Cd
= 1 x 10⁻⁷
F cm–2
, kf(1) = 1 x 10⁷ L mol
–1 s
–1, kb(1) = 1 x 10
3 s
–1, Keq(1) = 1000 L mol
–1, kf(2)
= 1 x 10⁻³
s–1
, kb(1) = 1.6 x 10⁻⁹
L mol–1
s–1
, Keq(1) = 6.4 x 10⁵ mol L
–1.
The large Epp-value observed for the second process at ν = 50 V s–1
is greater than
can be accounted for by the effects of solution resistance (which was not experimentally
compensated for, but was incorporated into the digital simulations), and is instead likely
to be caused by a relatively slow rate of electron transfer. The effects of slow
heterogeneous electron transfer are even more pronounced on Pt surfaces where the

CHAPTER 3
52
second process is difficult to detect even at slow scan rates, while the Epp-value for the
first process at ν = 50 V s–1
was much greater than observed on GC at the same scan rate.
The second process is also difficult to detect on Pt surfaces at intermediate to high water
concentrations because of the kinetic ease of reduction of water on Pt electrodes (hence
the large background current shown in Figure 1 on Pt at potentials more negative than
–2 V). Because simpler voltammetric behavior was obtained on GC compared to Pt
surfaces, the remaining discussion in this chapter is restricted to the GC electrode.
The CVs on GC in Figure 1 illustrate that the current observed for the second
process becomes smaller in relation to the first process as the scan rate is increased. It
has previously been observed in quinone electrochemistry that the height of the second
peak is often less than the first and it has been explained based on a complexation
reaction between the dianion and the starting material (eq 3).15
kf(1)
kb(1)
(VK1)22+VK1
2 VK1
(3)
kf(2)
kb(2)
(VK1)22 VK1 + VK1
(4)
For eq 3 to be observable voltammetrically, it requires that the thermodynamically
favorable monomerization reaction to form the anion radicals (eq 4, kf(2)) to be relatively
slow compared to the complexation reaction (eq 3, kf(1)). Furthermore, the dimerization
reaction of the anion radicals (eq 4, kb(2)) (which is a mechanism known to occur for the
anion radicals of 9-substituted anthracenes24
and aromatic esters25
) must be slower than
the monomerization reaction. The simulations indicate that the complexation reaction
CHAPTER 3
53
(eq 3) is feasible, although the kinetic values are only approximate because the observed
Er1/2-values (and hence the kinetic data) are heavily influenced by the exact solvent
composition.
Controlled potential electrolysis experiments were conducted on VK1 in order to
determine the lifetimes of the reduced states and to confirm the number of electrons
transferred during the reduction processes over longer times. Figure 2 shows CVs and
coulometry data obtained at various intervals during the reduction of VK1 in CH3CN
containing 0.10 (0.01) M water. Under electrolysis conditions it was very difficult to
further reduce the amount of water present because of the requirement of multiple
compartments in the electrolysis cell.

CHAPTER 3
54
Figure 2. Voltammetric and coulometric data obtained at 293 K during the
controlled potential electrolysis of 5 mM VK1 in CH3CN with 0.2 M Bu4NPF6 and 0.10
(0.01) M H2O (a) CVs recorded at a scan rate of 0.1 V s–1
with a 1 mm diameter GC
electrode. (Black line) Prior to the bulk reduction of VK1. (Red line) After the
exhaustive reduction of VK1 at an applied potential of –1.4 V vs. Fc/Fc+. (Blue line)
After the reduction of VK1–•
at an applied potential of –1.8 V vs. Fc/Fc+. (b)
Current/coulometry vs. time data obtained during the exhaustive reduction of VK1 at
–1.4 V vs. Fc/Fc+. (c) Current/coulometry vs. time data obtained during the exhaustive
reduction of VK1–•
at –1.8 V vs. Fc/Fc+. N is the number of moles of VK1.

CHAPTER 3
55
Figure 2a shows CVs obtained before (black line) and after the one-electron (red
line) and two-electron (blue line) reduction of VK1. For both processes (E1 and E2) the
total current measured between the ipred
and ipox
-values remained constant indicating that
the reduced forms were stable on the time-scale of the electrolysis experiments. The
current values observed during CV experiments were offset in the positive current
direction after the electrolysis experiments were commenced due to the change in
oxidation state of the VK1 species present in the bulk solution. Figures 2b and 2c show
the corresponding current and coulometry data obtained during the electrolysis of VK1
and VK1–•
respectively, confirming that one-electron per molecule was transferred in
each electrochemical step.
It was found that the electrochemistry of VK1 was affected by low levels of
dissolved molecular oxygen. Oxygen can be electrochemically reduced by one-electron
to superoxide at –1.25 V (0.2) vs. Fc/Fc+ in CH3CN, with a half-life of around 1 hour at
20 oC.
26 Figures 3a(i) and 3b(i) show a SWV and CV respectively of the reduction of
dissolved molecular oxygen present in atmospheric concentrations (2 – 3 mM). When
0.5 mM of VK1 was added to solutions containing atmospheric concentrations of O2,
SWV experiments indicated that the first cathodic peak shifted to more positive
potentials by ~ +30 mV and the peak current increased (Figure 3a(ii)). Thus, the SWV
results indicate that the first reduction process (E1) for VK1 in CH3CN (containing
relatively low levels of H2O) is sufficiently close to the formal reduction potential of O2

CHAPTER 3
56
to render their reduction processes indistinguishable from each other in CH3CN
containing both species (VK1 and O2).
It was also observed that the second reduction process of VK1 (E2) appeared
chemically irreversible when CVs were performed in solutions of VK1 in the presence
of O2 (Figure 3b(iii) and (iv)). It was only when the solution had been extensively
deoxygenated that the first and second reduction processes both appeared fully
chemically reversible during CV experiments (Figure 3b(v)). The amount of time
needed for deoxygenating depended on the concentration of VK1, the rate of purging of
the argon gas and the solution volume. The higher the concentration of VK1 the less
purging time was required because the amount of dissolved oxygen was relatively lower
compared to the VK1 concentration. Under our conditions it was found that 10 minutes
purging was required to remove molecular oxygen.
At very low concentrations of VK1 (< 0.1 mM) it was found that the second process
appeared much smaller than the first process (ratio < 0.2 : 1), which is possibly caused
by residual O2 (or O2–•
) reacting with VK1
–• (or VK1), which could not be satisfactorily
removed with purging. Furthermore, during SWV experiments at VK1 concentrations >
0.5 mM, the second reduction process always appeared smaller than the first (ratio of
0.8 : 1), which is likely to be caused by the slower heterogeneous electron transfer rate
for the second process (ks(2) 0.1 cm s–1
) and the complexation reaction of the dianion
with the quinone (eq 4) affecting the peak height of the SWV.

CHAPTER 3
57
Figure 3. Voltammograms recorded at a 1 mm diameter planar GC electrode in
CH3CN containing 0.2 M Bu4NPF6 and 0.05 (0.01) M H2O at 293 K showing the effect
of dissolved molecular oxygen on the voltammetry of 0.5 mM VK1. (a) SWVs recorded
with a pulse period (τ) = 25 Hz, a potential step = 2 mV and a pulse amplitude = 20 mV.
(b) CVs recorded at a scan rate of 100 mV s–1
.
Figure 4 shows CVs obtained for VK1 in carefully deoxygenated solutions of
CH3CN in the presence of varying H2O concentrations. It can be observed that both the

CHAPTER 3
58
first and second processes shift to more positive potentials with increasing water
concentrations, but the second process shifts by a greater amount (E2 > E1) so that the
processes eventually merge into one at a H2O concentration of approximately 7.2 M
(corresponding to a two-electron reduction where the two one-electron transfers occur
in rapid succession at similar potentials).
Figure 4. CVs recorded of VK1 (initial concentration = 1.0 mM, final
concentration = 0.83 mM) at a scan rate of 0.1 V s–1
at a 1 mm diameter planar GC
electrode in CH3CN containing 0.2 M Bu4NPF6 at 293 K, with varying concentrations
of water.

CHAPTER 3
59
Based on the CV results it can be concluded that both the monoanion and dianion
undergo hydrogen bonding with water in the solvent, but the very large shift observed
for the second process would suggest that the dianion undergoes much stronger
hydrogen bonding. It would be expected that the more negatively charged oxygen atoms
in the dianion are more likely to interact with water molecules than the less negatively
charged oxygen atoms in the monoanion. Theoretical calculations27
on quinone anion
radicals and dianions have indicated that the oxygen atoms do have an increasing
negative charge density in moving from the neutral molecule to the semiquinone and
then dianion.27c
Due to the relatively large shift in potential of E2 with small additions of
water, it is questionable whether the dianion actually exist in "non-aqueous" solvents in
a non-hydrogen bonded form, since the water content of the solvent is usually much
greater than that of the analyte.21
3.2.2 In-situ UV-Vis Spectroscopy at Intermediate (0.05 M) to High (10 M) Water
Concentrations
In order to further investigate the degree of hydrogen bonding in the monoanion
radical and dianion, in-situ electrochemical-UV-Vis spectroscopy experiments were
conducted on VK1 in CH3CN in the presence of varying concentrations of water (0.05,
0.55, 2.14, 5.05 and 9.26 M H2O). Figure 5 shows the spectra obtained (a) prior to
reduction, after the (b) first and (c) second reduction steps and (d) after the reduced
compounds had been oxidized back to the starting material. Irrespective of the

CHAPTER 3
60
concentration of water, it was found that the UV-Vis spectrum of the starting material
could be obtained after the reoxidation of the anion/dianion, indicating that the reduced
forms were stable on the time-scale of the experiments (~30 minutes).
The cyclic voltammograms shown in Figure 4 illustrate that there is a relatively
small change in E1 for water concentrations between 0.05 – 0.5 M. Therefore, it would
be expected that with a H2O concentration of 0.05 M, the anion radical would exist in a
predominantly non-hydrogen bonded form. Thus, the spectrum of the one-electron
reduced form of VK1 with 0.05 M water is likely to be the non-hydrogen bonded
semiquinone radical (Figure 5b, red line). As the concentration of water was increased
to 0.55 M, a relatively small change in the UV-Vis spectrum of the singly reduced
species was observed (Figure 5b, green line). As the concentration of water was
increased > 0.55 M, the spectra began to change substantially, due to increased
hydrogen bonding of the semiquinone. It was observed that the band at 485 nm
decreased in intensity faster than the band at 400 nm as the water concentration
increased, while the sharp band at 300 nm (that appeared characteristic of the
non-hydrogen bonded semiquinone) decreased in intensity with increasing water
concentration. The UV-Vis results in Figure 5b are consistent with equilibrium between
the hydrogen bonded and non-hydrogen bonded semiquinone.
The UV-Vis spectra obtained after the second one-electron reduction step
(two-electrons overall) are given in Figure 5c. Three bands were detected which all
moved to lower wavelength with increasing concentration of water, with the greatest

CHAPTER 3
61
shift observed for the band at the highest wavelength. The position of the bands
remained close to constant as the water content increased above 5 M H2O. Based on the
large shifts in potential observed with increasing water concentrations (Figure 4), it is
likely that under the present experimental conditions the dianion only exists in the bulk
solution in a hydrogen bonded form (unlike the situation observed for the semiquinone
radical). The UV-Vis spectra did not display any substantial differences in appearance
when the temperature was varied between 293 – 253 K, indicating that any equilibria
between the hydrogen bonded species responsible for the absorbances in Figure 5 were
not strongly sensitive to changes in temperature.
It is interesting that even at very high water concentrations (9.26 M), when only
one voltammetric wave was observed, small amounts of the non-hydrogen bonded
semiquinone can still be detected in the UV-Vis spectrum, via the band at 300 nm.
Because only one voltammetric process was detected in the presence of 9.26 M water,
the UV-Vis spectra of the species responsible for the first and second electron transfer
steps could not be controlled by adjusting the applied potential. Instead the spectra were
assigned based on the observation that the band at 300 nm initially increased in intensity
during the first electron transfer, and then diminished in intensity during the second
electron transfer. Thus the spectrum in Figure 5b obtained in the presence of 9.26 M
water (black line) was assigned by observing the intensity of the absorbance at 300 nm
during the in-situ electrolysis.

CHAPTER 3
62
Figure 5. In-situ UV-Vis spectra obtained in an OTTLE cell during the reduction
(and reoxidation) of 1 mM VK1 at 293 K in CH3CN with 0.2 M Bu4NPF6 and varying
concentrations of water.

CHAPTER 3
63
Based on the electrochemical and spectroscopic results in Figures 4 and 5, a
mechanism can be proposed for the fates of the reduced species in CH3CN containing
varying concentrations of water, which is essentially a "square scheme" mechanism3
where the normal proton transfers are replaced with hydrogen bonding interactions
(Scheme 2). The initial one-electron reduction of VK1 produces VK1–•
which undergoes
little hydrogen bonding at water concentrations < 0.5 M. As the water concentration
increases above 0.5 M, VK1–•
reacts to form the hydrogen bonded species,
VK1–•
(H2O)a,b. The number of water molecules undergoing hydrogen bonding to the
oxygen atoms increases with increasing water concentrations, according to the
equilibrium between the hydrogen and non-hydrogen bonded forms. Since the two
oxygen atoms in VK1 are non-equivalent, it is possible that the oxygen atoms undergo
differing degrees of interaction with H2O (hence the existence two hydrogen bonded
forms; VK1–•
(H2O)a and VK1–•
(H2O)b).
VK1–•
(or VK1–•
(H2O)a,b) can be further reduced by one-electron to form VK12–
which immediately undergoes hydrogen bonding, even at intermediate water
concentrations (0.05 M). The electron transfer step could occur consecutively
(horizontal lines) with the hydrogen bonding (Scheme 2).28
The spectroscopic
experiments indicate that the amount of hydrogen bonding is influenced by the
concentration of water, thus the UV-Vis spectra display different extremes. At low
water concentrations (≤ 0.05 M) VK12–
(H2O)n,m exists, while VK12–
(H2O)x,y exists at
high water concentrations (≥ 5 M) with the H2O coefficients n,m < x,y (Scheme 2). An

CHAPTER 3
64
equilibrium exists between the hydrogen bonded forms at intermediate water
concentrations. A summary of the spectra of the different species are given in Figure 6,
which were obtained under conditions that most favored their formation. A pure
spectrum of VK1–•
(H2O)a,b was not obtained since it always existed in equilibrium with
VK1–•
. The hydrogen bonding between water and the VK1 anions is likely to involve a
fluctuating network of flickering (not static) hydrogen bonds. Therefore, it is difficult to
determine the exact number of water molecules involved in the interactions, but the
numbers certainly vary depending on the water concentration as shown by how the
voltammetry and UV-Vis spectra vary as the water content is changed.

CHAPTER 3
65
Scheme 2. Electrochemical reduction and hydrogen bonding mechanism for VK1
in aprotic organic solvents containing water. The counter ion for the charged species is
the supporting electrolyte cation, Bu4N+.

CHAPTER 3
66
Figure 6. In-situ UV-Vis spectra obtained in an OSTLE cell during the reduction
of 1 mM VK1 in CH3CN with 0.2 M Bu4NPF6 and varying concentrations of water. The
UV-Vis spectra of VK1–•
and VK12–
(H2O)n,m were obtained via the one- and
two-electron respective reductions of VK1 in the presence of 0.05 (0.01) M H2O. The
UV-Vis spectrum of VK12–
(H2O)x,y was obtained via the two-electron reduction of VK1
in the presence of 9.26 M H2O.
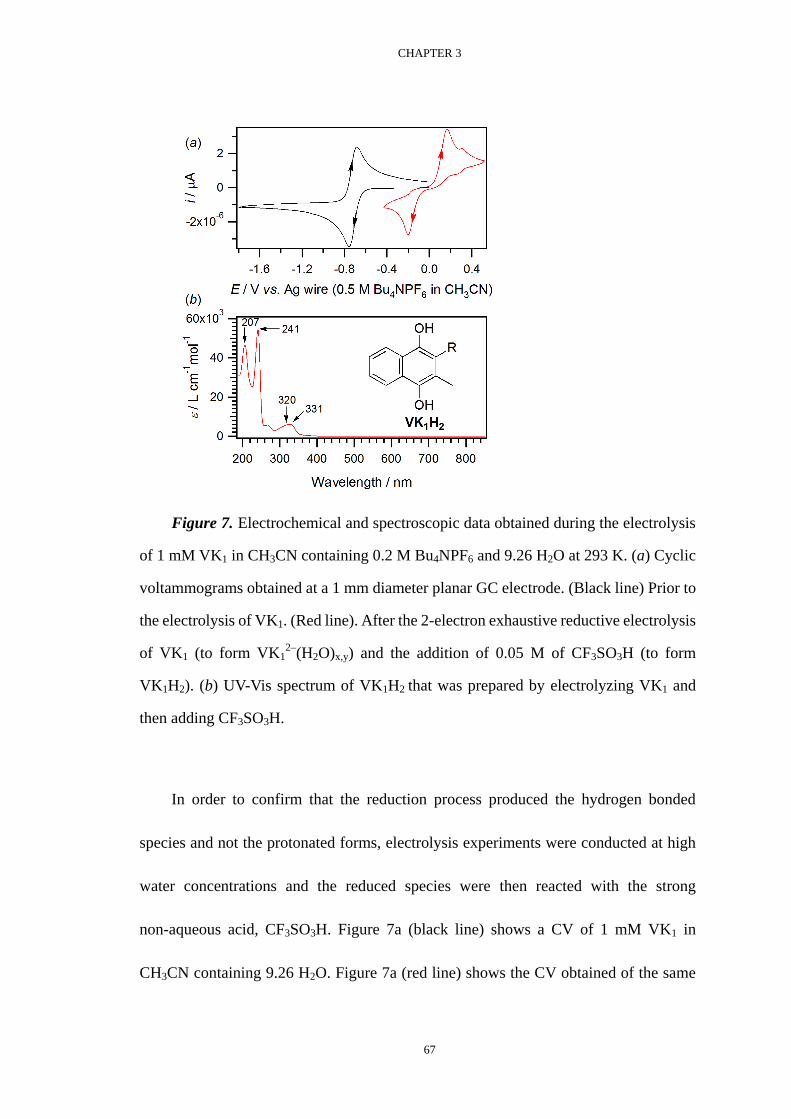
CHAPTER 3
67
Figure 7. Electrochemical and spectroscopic data obtained during the electrolysis
of 1 mM VK1 in CH3CN containing 0.2 M Bu4NPF6 and 9.26 H2O at 293 K. (a) Cyclic
voltammograms obtained at a 1 mm diameter planar GC electrode. (Black line) Prior to
the electrolysis of VK1. (Red line). After the 2-electron exhaustive reductive electrolysis
of VK1 (to form VK12–
(H2O)x,y) and the addition of 0.05 M of CF3SO3H (to form
VK1H2). (b) UV-Vis spectrum of VK1H2 that was prepared by electrolyzing VK1 and
then adding CF3SO3H.
In order to confirm that the reduction process produced the hydrogen bonded
species and not the protonated forms, electrolysis experiments were conducted at high
water concentrations and the reduced species were then reacted with the strong
non-aqueous acid, CF3SO3H. Figure 7a (black line) shows a CV of 1 mM VK1 in
CH3CN containing 9.26 H2O. Figure 7a (red line) shows the CV obtained of the same

CHAPTER 3
68
solution after the VK1 had been reduced by two electrons per molecule under bulk
controlled potential electrolysis conditions and the resulting dianion was reacted with
CF3SO3H to form the hydroquinone (VK1H2) (eq 5).
VK12 (H2O)x,y + 2H+ VK1H2 + x,y H2O
(5)
The two voltammograms in Figure 7a differ in that the CV for VK1 (black line) was
initially scanned in the negative potential direction (reduction), while the CV for VK1H2
was initially scanned in the positive potential direction (oxidation). The voltammetry
observed for VK1H2 is similar to that observed for other hydroquinones (such as
dopamine) in acidic conditions; that is, they can be reversibly oxidized in a two-electron
two-proton process with a wide separation between the forward and reverse peaks.3a,29
The minor additional processes detected at 0.2 – 0.3 V in the CV of VK1H2 are possibly
associated with a small amount of an additional reaction product formed during the
electrolysis/protonation reaction.
The UV-Vis spectrum of VK1H2 is given in Figure 7b, which displays relatively
strong and sharp bands at 207 nm and 241 nm and broader weaker bands at 320 and 331
nm. The spectrum is similar to that observed for the closely related
1,4-dihydroxynaphthalene.30
The complete mechanism for the interaction of VK1 and reduced forms (VK1–•
and
VK12–
) (and any other quinone) with H2O molecules can also be given in the form of
Scheme 3. The reaction is an example of an electrochemical square-scheme
mechanism,31
with electron transfer steps occurring vertically and homogeneous

CHAPTER 3
69
interactions with H2O occurring horizontally, each with a corresponding equilibrium
constant (Keq,H2O). In theory, additional reactions can be added to the right of Scheme 3
if more H2O molecules are incorporated into the mechanism, since the number of H2O
molecules bonding to VK1–•
and VK12–
is not limited to two.
Scheme 3. Electrochemical “square-scheme” mechanism showing hydrogen
bonding interactions between VK1 and its reduced forms with H2O. “A”, “B” and “C”
can represent any quinone, and are not limited to just VK1.
The electrochemical mechanism was examined in detail by modeling the
experimental data according to the reactions in Scheme 3, using digital simulation
software.32
Figure 8 (black lines) shows the experimental cyclic voltammograms of VK1

CHAPTER 3
70
in MeCN that could be obtained over a wide water content range and the corresponding
digital simulations (red lines). The parameters used in the simulations are provided in
Table 2, with the electron transfer and homogeneous chemical reactions given in
Scheme 3. Each electron transfer reaction in Scheme 3 has an associated E0
f-value and
each homogeneous reaction a corresponding equilibrium constant.
The parameters given in Table 1 represent the best average fits over the entire
water concentration range. However, it can be observed from the CVs in Figure 8 that
there is substantial deviation between the experimental and simulated voltammograms
as the water concentration is decreased or increased either side of the 1.0 M water
concentration. It was found that adding additional electron transfer and chemical steps,
such as to the right of Scheme 3, did not result in a substantial improvement to the match
between the experimental and simulated voltammograms. It was possible to more
accurately fit the simulated voltammograms to the experimental data over narrow water
concentrations ranges using a particular set of simulation parameters. However, no
unique set of simulation parameters fit over the whole water concentration range shown
in Figure 8.

CHAPTER 3
71
Figure 8. CVs of 1 × 10⁻³
M VK1 in CH3CN with 0.2 M Bu4NPF6 at 22 ± 2 oC, at a
scan rate of 100 mV s–1
, at a 1 mm diameter GC electrode and in the presence of varying
amounts of H2O. Digitally simulated voltammograms are based on the mechanism in
Scheme 3 and the parameters given in Table 1.

CHAPTER 3
72
Table 1. Parameters used for digital simulations of voltammetric data.a,b
aThe experimental data and simulations are given in Figure 8 and reaction
mechanism in Scheme 3. bThe diffusion coefficients of all species were set to 2.0 × 10
–5
cm2 s
–1 and the heterogeneous electron transfer rate (ks) set to 1 cm s
–1.
cPotential versus
silver wire separated from the test solution with a salt bridge containing 0.5 M Bu4NPF6
in MeCN.
The reason for the divergence between the experimental data and simulated
voltammograms is because of the complexity of the hydrogen bonding mechanism. The
reactions in Scheme 3 represent the hydrogen bonding interactions with VK1 and its
reduced forms in MeCN, while other equilibria are also likely to be important. For
example, (i) interactions between the solvent and water, (ii) ion-pairing interactions
between the VK1 anions and the supporting electrolyte cations, (iii) ion-pairing
interactions that occur between the electrolyte ions themselves, which are likely to be
more important in low-dielectric constant solvents,33,34
(iv) solvation effects of the
Heterogeneous electron transfer
reactions
Homogeneous chemical reactions
Reaction E / Vc Reaction Keq kf / L mol
–1 s
–1
A1 + e– ⇌ B1 –0.84 A1 + H2O ⇌ A2 1.0 × 10
–5 1
B1 + e– ⇌ C1 –1.44 A2 + H2O ⇌ A3 1.0 × 10
–6 1
A2 + e– ⇌ B2 –0.66 B1 + H2O ⇌ B2 1.0 × 10
–2 1 × 10⁷
B2 + e– ⇌ C2 –1.12 B2 + H2O ⇌ B3 1.0 × 10
–3 1 × 10⁷
A3 + e– ⇌ B3 –0.49 C1 + H2O ⇌ C2 2.5 × 10
3 1 × 10⁷
B3 + e– ⇌ C3 –0.82 C2 + H2O ⇌ C3 1.0 × 10
3 1 × 10⁷

CHAPTER 3
73
organic solvent with the reduced forms of VK1. Therefore, due to the large number of
interactions and the uncertainties associated with their respective chemical parameters
(equilibrium and rate constants) it is extremely difficult to accurately simulate the
voltammetric data over a wide water concentration range.
Nevertheless, the trends in simulated values in Table 1 are consistent with values
that can be obtained over narrow water concentration ranges. In particular, the
equilibrium constants for the hydrogen bonding interactions increase as the negative
charge on VK1 increases. The potential of the electron transfer step shifts to more
positive potentials as the number of water molecules undergoing hydrogen bonding
increases for each species, indicating that the hydrogen bonded anions are easier to
reduce than their analogous non-hydrogen bonded forms.
3.2.3 Electrochemistry at Low (0.001 – 0.05 M) Water Concentrations
Having established the electrochemical and spectroscopic behavior of VK1 in
intermediate to high water concentrations, voltammetric experiments were next
conducted at very low water concentrations by carefully drying the solvents and
accurately measuring the water content by KF titration (see Chapter 2 for details).
For water concentrations between 0.001 – 0.05 M, H2O was allowed to increase
under natural humidity conditions from the lowest level.20
Even under an argon
atmosphere, the water content increased from 0.01 M to 0.05 M within approximately 2
hours for CH3CN solutions. In order to have the initial water content below 0.05 M, it

CHAPTER 3
74
was necessary to use a pseudo Pt wire as the reference electrode, located in the same
compartment as the working electrode. Therefore, accurate potentials could not be
obtained for the first and second processes. However, this was not considered
problematic because the low concentration experiments were concerned with measuring
the potential difference between the first and second processes and these potentials were
unlikely to drift on the time-scale of a voltammetric scan (a few seconds). Figure 9a
shows a SWV of 1 mM of VK1 in CH3CN containing 0.011 (0.002) M water. At this
concentration the voltammogram shows two clear processes separated by 0.635 V. The
second process was always smaller than the first process in SWV experiments because
of relatively slow heterogeneous electron transfer.

CHAPTER 3
75
Figure 9. Voltammetric data recorded at a 1 mm diameter planar GC electrode in
CH3CN with 0.2 M Bu4NPF6 at 293 K. CVs were recorded at a scan rate of 0.1 V s–1
and
SWVs were recorded with a pulse period (τ) = 25 Hz, a potential step = 2 mV and a
pulse amplitude = 20 mV. (a) SWVs of 1.0 mM VK1 with different concentrations of
water. (b) CVs of (Red line) 1.0 mM VK1 and 0.005 (0.002) M H2O, and (Black line)
5.0 mM VK1 and 0.005 (0.002) M H2O. (c) In-situ (___
) CV and (…..
) SWV obtained in
a solution containing 1.4 mM VK1 and 3Å molecular sieves. (d) Plot of cathodic peak
separations measured by SWV versus water content during the electrochemical
reduction of 1.0 mM VK1.

CHAPTER 3
76
Interesting voltammetric features were observed when the water concentration was
below 0.010 M. Figure 9b (red line) is a CV obtained of 1 mM VK1 in the presence of
0.005 (0.002) M H2O. While the first process appears as a chemically reversible one
electron process, the second process has a wider than normal peak-to-peak separation
(200 mV) with broad and non-ideal shaped peaks, and with additional complicated
features detected on the reverse oxidation sweep at ~ –0.8 V vs. Pt wire. The unusual
peak shapes are possibly caused by interactions of the dianions with the electrode
surface, due to the low concentrations of water reducing the amount of hydrogen
bonding and lowering the solubility of the dianion. Figure 9b (black line) shows the CV
of VK1 at a higher concentration (5 mM) but in the presence of a lower water content
ratio (0.005 (0.002) M). Similar features were observed to the lower concentration
experiment with the second process showing additional features and an extra process
evident at –0.8 V vs. Pt wire when the scan direction was reversed.
Another feature that is evident in the voltammograms in Figure 9b is that the |E1 –
E2|-values measured for a 5 mM solution of VK1 are greater than those for a 1 mM
solution of VK1, for close to equivalent H2O concentrations (|E1 – E2| = 680 and 645 mV,
respectively). This effect is only observable at concentrations of H2O < ~0.03 M, while
at H2O concentrations > ~0.03 M, the |E1 – E2|-values are the same (within experimental
error) for different concentrations of VK1 in CH3CN measured at equivalent
concentrations of H2O.

CHAPTER 3
77
Experiments were also conducted at very low water concentrations by performing
in-situ voltammetric experiments in the presence of 3 Å molecular sieves. Under these
conditions it was possible to lower the water content to 0.0015 (0.0005) M, almost the
same as that of VK1 (Figure 9c). Interestingly, both the CV and SWV showed the first
process, which seemed unchanged from other experiments, but the second process was
difficult to detect. This result can be interpreted in two ways; (i) the electron transfer
step occurs concertedly with the hydrogen bonding, so if there is insufficient water
present the electron transfer does not occur, or (ii) the very low water content results in
an unusual adsorptive affect where the reduction of the semiquinone is somehow
masked. A small reductive process can be detected close to the potential where the
semiquinone is normally reduced, but with a wide peak-to-peak separation (Figure 9c).
In light of the results shown in Figure 9b, it is more likely that scenario (ii) occurs, so
that the lack of the second process in very low water concentration environments is due
to specific interactions of the dianion with the electrode surface.
The results in Figures 9b and 9c indicate that low levels of water make a large
difference to the voltammetric behavior of VK1, especially the second reduction process.
It is possible that some of the unusual voltammetric behavior reported for quinones in
organic solvents can be explained by low levels of water in the solvent, or by the effects
of dissolved molecular oxygen as shown in Figure 3. Lehmann and Evans examined a
number of quinones in aprotic media and observed anomalous voltammetric behavior,
some of which was of unknown origin.17a

CHAPTER 3
78
Based on the electrochemical results on VK1, it seems appropriate that studies that
report on the electrochemical behavior of quinones in non-aqueous solvents should also
report the trace water content of the solvent, to enable unambiguous comparisons with
different data sets. This is particularly true for studies that examine interactions between
reduced quinones and a range of hydrogen bonding additives (such as alcohols and
amines), because the trace water content of the solvent could significantly affect the
measured |E1 – E2|-values.15,16
With this point in mind, we have constructed calibration
curves of the potential separation between the first and second processes (E1 – E2)
against the water content of the solvent, which allows a straightforward method for
determining the concentration of water. Figure 9d shows the aforementioned plot over a
wide water content range (0.01 – 9.26 M). The plot illustrates that there is an abrupt
increase in the potential separation (E1 – E2) as the water content approaches zero. From
an analytical perspective, the more useful range for measuring the water content is
between 0 – 0.1 M, since it is straightforward to exclude water at higher concentrations
and in many instances where "dry" solvents are reported the water content could still be
in the mM range (more detailed experiments on the electrochemistry of VK1 in the
presence of very low concentrations of water are described in Chapter 4).
The primary error in measuring the water content in this study is systematic and
arises from transferring a sample of the test solution from the electrochemical cell into
the KF titration cell. During the transfer it is likely that some atmospheric water will
enter into the syringe needle, but this is only avoidable if both reactions are performed in

CHAPTER 3
79
a dry box. However, the observation that there is not an excessive scatter in the slope of
the plot in Figure 9d would suggest that the systematic error is not severe. This is
because the data in Figure 9d is a combination of a least 3 experimental runs for the
solvent, under conditions where the atmospheric humidity varied, but there is no
obvious change in slope between the different experiments. With the low water
concentration measurements it was not possible to perform more than one measurement
at a fixed water concentration (in order to obtain a statistical average) because the water
content was continually changing over time.
3.3 Conclusions
This work has demonstrated that differences of a few mM water can have a
pronounced affect on the reductive electrochemistry of a quinone in non-aqueous
solvents, especially at low water levels (< 0.05 M). Therefore, it is important that
electrochemical studies on quinones in non-aqueous solvents report the initial water
content of their solvents, since trace amounts of water are likely to interfere with
measurements made in the presence of other hydrogen bonding donors (such as alcohols
and amines).
The voltammograms and UV-Vis spectra obtained during the one- and
two-electron reduction of VK1 in CH3CN in the presence of varying H2O concentrations
allowed estimations of the degree of hydrogen bonding. The semiquinone anion radical
exists in a predominantly non-hydrogen bonded form at concentrations of water < 0.5 M,

CHAPTER 3
80
since the UV-Vis spectra and the voltammetric potential (E1) changed by a small
amount when the water concentration was varied below this level. In contrast, the
quinone dianion undergoes extensive hydrogen bonding at even very low water
concentrations, indicated by how the second voltammetric peak (E2) shifts substantially
over a wide range of water concentration (0.01 – 7.2 M) and by how the bands in the
UV-Vis spectra shift uniformly with water concentrations between 0.05 – 5 M. It is
unlikely that the UV-Vis spectrum of the non-hydrogen bonded dianion can be obtained
unless extremely dry solvents can be used, where [H2O] ≤ [VK1]. The voltammetric
behavior became very complicated when the concentration of water began to approach
that of the substrate. At these very low water concentrations ([H2O] < 0.01 M), there is
insufficient water for favored hydrogen bonding of the dianion, likely resulting in a
decrease in solubility of VK12–
and hence the appearance of adsorptive processes in the
voltammograms.

CHAPTER 3
81
References
1. Vitamin K and Vitamin K-Dependent Proteins: Analytical, Physiological and
Clinical Aspects; CRC Press: Boca Raton, FL, 1993.
2. Wang, X. Y.; Quinn, P. J. Mol. Membr. Biol. 2000, 17, 143–156.
3. (a) Hammerich, O.; Svensmark, B. In Organic Electrochemistry, 3rd ed.; Lund,
H., Baizer, M. M., Eds.; Marcel Dekker: New York, 1991; Chapter 16. (b) Chambers, J.
Q. In The Chemistry of the Quinonoid Compounds; Patai, S., Rappoport, Z.; Eds.; Wiley:
New York, 1988: Vol II, Chapter 12, pp 719–757.
4. (a) Quan, M.; Sanchez, D.; Wasylkiw, M. F.; Smith, D. K. J. Am. Chem. Soc.
2007, 129, 12847–12856. (b) Ge, Y.; Miller, L.; Ouimet, T.; Smith, D. K. J. Org. Chem.
2000, 65, 8831– 8838. (c) Ge, Y.; Lilienthl, R. R.; Smith, D. K. J. Am. Chem. Soc. 1996,
118, 3976–3977.
5. (a) Müller, O. H. J. Am. Chem. Soc. 1940, 62, 2434–2441. (b) Kolthoff, I. M.;
Orlemann, E. F. J. Am. Chem. Soc. 1941, 63, 664–667. (c) Abbott, J. C.; Collat, J. W.
Anal. Chem. 1963, 35, 859–863. (d) Bailey, S. I.; Ritchie, I. M.; Electrochim. Acta 1985,
30, 3–12. (e) Robertson, R. T.; Pendley, B. D.; J. Electroanal. Chem. 1994, 374,
173–177. (f) Sato, Y.; Fujita, M.; Mizutani, F.; Uosaki, K. J. Electroanal. Chem. 1996,
409, 145–154. (g) Shim, Y.-B.; Park, S.-M. J. Electroanal. Chem. 1997, 425, 201–207.
(h) Park, H.; Won, M.-S.; Cheong, C.; Smith, Y.-B. Electroanalysis 2002, 14,
1501–1507. (i) Tang, Y.; Wu, Y.; Wang, Z. J. Electrochem. Soc. 2001, 148, E133–E138.
(j) Forster, R. J.; O'Kelly, J. P. J. Electroanal. Chem. 2001, 498, 127–135.
CHAPTER 3
82
6. (a) Peover, M. E. J. Chem. Soc. 1962, 4540–4549. (b) Peover, M. E.; Davies, J.
D. J. Electroanal. Chem. 1963, 6, 46–53. (c) Peover, M. E.; Davies, J. D. Trans. Farad.
Soc. 1964, 60, 476–478. (d) Peover, M. E. In Electroanalytical Chemistry; Bard, A. J.,
Ed.; Dekker: New York, 1967; pp 1–51.
7. Umemoto, K. Bull. Chem. Soc. Jpn. 1967, 40, 1058–1065.
8. Eggins, B. R. Chem. Commun. 1969, 1267–1268.
9. Hayano, S.; Fujihira, M. Bull. Chem. Soc. Jpn. 1971, 44, 2051–2055.
10. Nagaoka, T.; Okazaki, S.; Fujinaga, T. J. Electroanal. Chem. 1982, 133,
89–99.
11. Ashnagar, A.; Bruce, J. M.; Dutton, P. L.; Prince, R. C. Biochim. Biophys. Acta
1984, 801, 351–359.
12. Wilford, J. H.; Archer, M. D.; J. Electroanal. Chem. 1985, 190, 271–277.
13. Rüssel, C.; Jaenicke, W. J. Electroanal. Chem. 1986, 199, 139–151.
14. Laviron, E. J. Electroanal. Chem. 1986, 208, 357–372.
15. Gupta, N.; Linschitz, H. J. Am. Chem. Soc. 1997, 119, 6384–6391.
16. (a) González, F. J. Electroanalysis 1998, 10, 638–642. (b) Gómez, M.;
González, F. J.; González, I. Electroanalysis 2003, 15, 635–645. (c) Gómez, M.;
González, F. J.; González, I. J. Electrochem. Soc. 2003, 150, E527–E534. (d) Gómez,
M.; Gómez-Castro, C. Z.; Padilla-Martínez, I. I.; González, F. J. J. Electroanal. Chem.
2004, 567, 269–276. (e) Macías-Ruvalcaba, N. A.; González, I.; Aguilar-Martínez, M. J.
CHAPTER 3
83
Electrochem. Soc. 2004, 151, E110–E118. (f) Gómez, M.; González, F. J.; González, I.
J. Electroanal. Chem. 2004, 578, 193–202.
17. (a) Lehmann, M. W.; Evans, D. H. J. Electroanal. Chem. 2001, 500, 12–20. (b)
Lehmann, M. W.; Evans, D. H. J. Phys. Chem. B 2001, 105, 8877–8884.
18. (a) Stone, E. W.; Maki, A. H. J. Chem. Phys. 1962, 36, 1944–1945. (b) Gendell,
J.; Freed, J. H.; Fraenkel, G. K. J. Chem. Phys. 1962, 37, 2832–2841. (c) Fujihira, M.;
Hayano, S. Bull. Chem. Soc. Jpn. 1972, 45, 644–645.
19. (a) Burfield, D. R.; Lee, K. H.; Smithers, R. H. J. Org. Chem. 1977, 42,
3060–3065. (b) Burfield, D. R.; Gan, G.-H.; Smithers, R. H. J. Appl. Chem. Biotechnol.
1978, 28, 23–30.
20. The mean relative humidity in Singapore is 84%, typically ranging from >90%
in the early morning to 60% in the late afternoon.
21. Fry, A. J.; Britton, W. E. In Laboratory Techniques in Electroanalytical
Chemistry; Kissinger, P. T., Heineman, W. R., Eds.; Marcel Dekker: New York, 1984;
Chapter 13.
22. Bard, A. J.; Faulkner, L. R. Electrochemical Methods: Fundamentals and
Applications, 2nd
ed.; Wiley: New York, 2001.
23. Bond A. M.; Henderson, T. L. E.; Mann, D. R.; Mann, T. F.; Thormann, W.;
Zoski, C. G. Anal. Chem. 1988, 60, 1878–1882.
24. (a) Hammerich, O.; Parker, V. D. Acta Chem. Scand., Ser. B, 1981, 35,
341–347. (b) Parker, V. D. Acta Chem. Scand., Ser. B, 1981, 35, 349–356. (c)

CHAPTER 3
84
Hammerich, O.; Parker, V. D. Acta Chem. Scand., Ser. B, 1983, 37, 379–392. (d)
Hammerich, O.; Parker, V. D. Acta Chem. Scand., Ser. B, 1983, 37, 851–856. (e)
Amatore, C.; Pinson, J.; Savéant, J. M. J. Electroanal. Chem. 1982, 137, 143–148. (f)
Amatore, C.; Pinson, J.; Savéant, J. M., J. Electroanal. Chem. 1982, 139, 193–197. (g)
Amatore, C.; Garreau, D.; Hammi, M.; Pinson, J.; Savéant, J. M. J. Electroanal. Chem.
1985, 184, 1–24. (h) Smith, C. Z.; Utley, J. H. P. J. Chem. Research (S), 1982, 18–19. (i)
Mendkovich, A. S.; Michalchenko, L. V.; Gultyai, V. P. J. Electroanal. Chem. 1987,
224, 273–275.
25. Webster, R. D. J. Chem. Soc., Perkin Trans. 2, 1999, 263–269.
26. Webster, R. D.; Bond, A. M. J. Chem. Soc., Perkin. Trans. 2, 1997, 1075–1079.
27. (a) Mohandas, P.; Umapathy, S. J. Phys. Chem. A 1997, 101, 4449–4459. (b)
Zhan, C.G.; Chipman, D. M. J. Phys. Chem. A 1998, 102, 1230–1235. (c) Wheeler, D.
E.; Rodriguez, J. H.; McCusker, J. K. J. Phys. Chem. A 1999, 103, 4101–4112. (d)
Tripathi, G. N. R.; Chipman, D. M. J. Phys. Chem. A 2002, 106, 8908–8916.
28. (a) Costentin, C.; Robert, M.; Savéant, J.-M. Chem. Phys. 2006, 324, 40–56. (b)
Costentin, C. Chem. Rev. 2008, 108, 2145–2179.
29. (a) Hawley, M. D.; Tatawawadi, S. V.; Piekarski, S. Adams, R. N. J. Am. Chem.
Soc. 1967, 89, 447–450. (b) Sternson, A. W.; McCreery, R.; Feinberg, B.; Adams, R. N;
J. Electroanal. Chem. 1973, 46, 313–321.
30. Brahmia, O.; Richard, C. Photochem. Photobiol. Sci. 2003, 2, 1038–1043.
31. Kuan, S. L.; Leong, W. K.; Goh, L. Y.; Webster, R. D. Organometallics, 2005,

CHAPTER 3
85
24, 4639–4648, and references therein.
32. (a) Rudolph M. J. Electroanal. Chem. 2003, 543, 23–39. (b) Rudolph M. J.
Electroanal. Chem. 2004, 571, 289–307. (c) Rudolph M. J. Electroanal. Chem. 2003,
558, 171–176. (d) Rudolph M. J. Comput. Chem. 2005, 26, 619–632. (e) Rudolph M. J.
Comput. Chem. 2005, 26, 633–641. (f) Rudolph M. J. Comput. Chem. 2005, 26,
1193–1204.
33. Gutmann, V. Electrochim. Acta 1976, 21, 661–670.
34. Krygowski, T. M.; Fawcett, W. R. J. Am. Chem. Soc. 1975, 97, 2143–2148.

86

CHAPTER 4
87
Chapter 4
Voltammetric Method for Determining the Trace
Moisture Content of Organic Solvents Based on Hydrogen
Bonding Interactions between Reduced Vitamin K1 and H2O
4.1 Introduction
In aprotic organic solvents, the quinones are able to be electrochemically reduced
in two chemically reversible one-electron reduction processes to form first the anion
radical (Q–•
), followed by further reduction to the dianion (Q2–
).1,2
It has been shown via
electrochemical3-12
and spectroscopic11,14-16
measurements that Q–•
and Q2–
undergo
hydrogen bonding interactions with water or other hydrogen bonding additives (such as
alcohols and amines) present in the solvent. The potential of both the first reduction
process (E1) and especially the second reduction process (E2) shift to more positive
potentials with increasing water concentration (ΔE2 > ΔE1), so that at high enough water
concentrations the two processes can merge together into one two-electron process,
providing that the water content of the solvents can be increased to a sufficiently high
ratio. The shift in potential is caused by an equilibrium that exists between Q–•
and Q2–
,
and their hydrogen bonded forms.5-12
The voltammetric behavior of vitamin K1 (VK1) in MeCN has previously been
described in the presence of varying concentrations of water (Chapter 3).11,13
It was
established that the greatest change in the difference between E1 and E2 (|E1 – E2|)
CHAPTER 4
88
occurred at very low levels of water (between 0 – 0.1 M).11,13
In this chapter the number
of solvents studied have been extended and calibration data that are used to estimate the
water content of a solvent are presented. It will be demonstrated that the degree of
hydrogen bonding with reduced forms of VK1 and trace water varies significantly in the
different solvents, which requires that the voltammetric data be interpreted based on a
complex mixture of solvent-water-substrate-electrolyte interactions. The results have
consequences on the way that formal potentials (E0f) for semiquinones and perhaps
other compounds are reported and evaluated, because the presence of trace water can
have an effect on the measured redox potentials.
We were also interested in determining whether it was possible to attach the VK1 to
an electrode surface and thereby use the voltammetry of the attached form as a method
for estimating the water content of a solvent (after suitable calibration experiments).
Self-assembled monolayers (SAMs) of alkanethiolates on gold have been used as a
method to modify electrode surfaces.17-19
Voltammetry experiments have previously
been performed by self-assembling alkanethiols on Au electrodes in aqueous solutions,
and incorporating vitamin K inside the alkanethiol layers.20,21
An alternative method to
attach vitamin K to an electrode surface, is via synthesizing a vitamin K derivative
containing an alkyl chain with sulfhydryl head group in the 3-position.20
Scheme 1
shows the structures of VK1 and the VK1 derivative (VKSH), which is proposed to have
similar electrochemical behavior as VK1.22,23,24

CHAPTER 4
89
Scheme 1. Forms of vitamin K1 (VK1) and derivative of VK1 with alkanethiol
linkage (VKSH).
4.2 Results and Discussion
4.2.1 The Effect of Water on Reduction Processes of Vitamin K1
Figure 1 shows cyclic voltammograms obtained of VK1 in a range of organic
solvents with different dielectric constant values. Process E1 corresponds to the
one-electron reduction of VK1 to the semiquinone anion radical (VK1–•
) (eq 1) and
process E2 is the further one-electron reduction of the semiquinone radical to the dianion
(VK12–
) (eq 2).11,13
E0
f(1) and E0
f(2) refer to the formal electrode potentials, which for
quinones are strongly dependant on the water content of the solvent; thus absolute
values can only be reported if the water content is accurately known. As water is added
to the organic solvents, the potential of E0
f(1) and E0
f(2) shift to more positive values due
to hydrogen bonding interactions.11,13
(1)
(2)

CHAPTER 4
90
The differences in reductive peak current (ipred
) for the first process (E1) in the CVs
shown in Figure 1 are mainly due to differences in diffusion coefficient of VK1 in the
different solvents. The peak currents measured in DMSO and 1,1,2,2-tetrachlorothane
(TCE) are relatively small compared to the other solvents due to their high viscosities.
The CV performed on VK1 in TCE showed only one chemically irreversible reduction
process, indicating that the reduced form was short-lived. Surprisingly, only one
reductive process was observed in propionitrile (EtCN) (even at water concentrations <
0.01 M) with a relatively high ipred
-value compared to MeCN and butyronitrile (PrCN).
Coulometry experiments on VK1 in EtCN indicated the transfer of 1.5 electrons per
molecule, suggesting that the electrochemical reduction mechanism was more
complicated than simple electron transfer.

CHAPTER 4
91
Figure 1. CVs obtained of 1 mM solutions of VK1 (with 0.2 M Bu4NPF6 as the
supporting electrolyte) at a 1 mm diameter glassy carbon (GC) electrode at 22 ± 2 oC
and at a scan rate of 100 mV s–1
. Water contents of the solvents are between 0.01 – 0.05
M.
The mechanism for the interaction of VK1 and reduced forms (VK1–•
and VK12–
)
with H2O molecules is given in Scheme 3 in Chapter 3 (Page 68). For the solvents in
Figure 1, where two one-electron reduction processes were detected, SWV experiments
were performed and the |E1 – E2|-values were measured over a range of water
concentrations (E1 and E2 were measured as the cathodic peak potentials (Epred
)26
).
Water is highly soluble in MeCN, DMF and DMSO; therefore, voltammetric data could
be obtained over a very wide range of H2O concentrations (Figure 2a). The results in

CHAPTER 4
92
Figure 2a show a large steepening of the plots as the H2O concentration approaches zero.
In MeCN, the E1 and E2 processes cannot be distinguished from each other at a water
concentration of approximately 7 M.11,13
For DMSO and DMF the voltammetry showed additional complicated features at
high H2O concentrations possibly caused by adsorption effects, therefore, the data
collection was stopped before the |E1 – E2|-values reached zero. A plot giving the log
transformation of the water concentrations in Figure 2a is provided in Figure 2b, which
has the effect of spreading the low H2O concentration values over a wider range and
improving the linearity at low concentrations (although the log plots are not linear over
the entire concentration range).
The water concentration of the solvent/electrolyte/VK1 mixture contained within
the syringe could be lowered to approximately 0.001 M (depending on the solvent).
However, as soon as the solvent/electrolyte/VK1 was added to the electrochemical cell,
the water levels increased (even with the cell maintained under an argon atmosphere),
with the rate of increase dependent on the particular solvent. Water solubility in PrCN,
dichloromethane (DCM) and 1,2-dichloroethane (DCE) is much lower than in MeCN,
DMF and DMSO. It was found that when PrCN, DCM or DCE were added to the
electrochemical cell, the measured water concentrations increased from approximately
0.002 M (0.01 M in PrCN) to a maximum of 0.025 M in around two hours. DMF and
DMSO are considerably more hydroscopic and absorb water quickly within the
electrochemical cell; hence the starting concentrations of H2O were approximately
0.020 M.

CHAPTER 4
93
Figure 2. Plots of |E1 – E2| (measured by SWV at a 1 mm diameter GC electrode)
versus the water concentration (measured by KF titration) at 22 ± 2 oC for 1 mM
solutions of VK1 in different solvents. For (a), (b) and (c) the concentration of Bu4NPF6
is 0.2 M, while for (d) the data were obtained in DCM with varying concentrations of
Bu4NPF6.
The |E1 – E2|-values obtained for all of the solvents plotted against the log of the
water concentration (over a low concentration range of H2O) are given in Figure 2c. For

CHAPTER 4
94
each of the solvents tested, the change in the |E1 – E2|-values with change in water
concentration mainly came about due to the positive potential shift of the E2 process.
The E1 process was considerably less sensitive to changes in the water concentration.
The plots in Figure 2c are summarized in equation form in Table 1. The data in
Table 1 provide a simple procedure to estimating the water content of the solvent by
measuring the |E1 – E2|-values and applying the equation. It is preferable that the VK1
concentration is close to 1 mM to avoid concentration dependant deviations of the
straight lines at very low water concentrations.11
|E1 – E2|-values above or below the
usable range given in Table 1 are either drier or wetter, respectively, than the given
water content range (some extrapolation outside the usable range may be permissible).
Recording a single voltammogram in the presence of VK1 and applying the constants in
Table 1 provides a simple method for determining the water content of solvents used
during electrochemical experiments, in a similar fashion that ferrocene is often used as
an internal calibrant for the potential. As well as measuring the water content during the
reduction of quinones,1-16
the method may be valuable for any process where the redox
active species are suspected of undergoing reactions with trace water, such as during the
reduction of aromatic esters27,28
and the oxidation of vitamin E.29,30
The uncompensated solution resistance is not expected to reduce the accuracy of
the measured |E1 – E2|-values because each individual potential will be uniformly
effected. Furthermore, providing low scan rates are used for the CV or SWV
experiments, there will be minimal distortion of the voltammograms due to resistance
effects.

CHAPTER 4
95
Table 1
. Solv
ent p
arameters an
d ex
perim
entally
deriv
ed co
nstan
ts (a an
d b
) that can
be u
sed to
estimate th
e water co
nten
t of a so
lven
t
(betw
een sp
ecified ran
ges) acco
rdin
g to
the eq
uatio
n: a
𝑤𝑎𝑡𝑒𝑟 𝑐𝑜
𝑛𝑡𝑒𝑛
𝑡 mol L
-1 =
10
𝑎× 𝐸
1−𝐸
2
+𝑏
aThe co
ncen
tration o
f VK
1 used
for o
btain
ing th
e |E1 –
E2 |-v
alues sh
ould
equal 1
.0 ×
10
–3 (
0.2
× 1
0–
3) M an
d th
e supportin
g electro
lyte
(Bu
4 NP
F6 ) sh
ould
equal 0
.2 M
. bFro
m referen
ce 32.
DC
E
DC
M
MeC
N
PrC
N
DM
F
DM
SO
Solv
ent
10.4
9.1
37.5
20.3
36.7
46.7
Dielectric
constan
t
0.1
26
0.1
78
0.2
86
0.3
65
0.6
13
0.6
47
Norm
alized so
ven
t
basicity
b
–8.9
76
–7.2
69
–6.1
83
–6.3
00
–10.0
96
–13.1
07
a / (lo
g10 M
) V–1
2.0
92
1.7
48
2.11
8
2.3
75
6.0
45
8.4
33
b / lo
g10 M
0.5
30 –
0.4
10
0.6
10 –
0.4
70
0.6
60 –
0.4
10
0.6
85 –
0.6
30
0.7
70 –
0.6
40
0.7
70 –
0.6
75
Calib
rated p
oten
tial range
|E1 –
E2 | / V
0.0
02 –
0.0
25
0.0
02 –
0.0
20
0.0
10 –
0.4
00
0.0
10 –
0.0
25
0.0
20 –
0.4
00
0.0
20 –
0.4
00
Calib
rated w
ater conten
t range /
mol L
–1

CHAPTER 4
96
A useful feature of the proposed voltammetric method for determining the water
content of the solvents is that the procedure is independent of the nature of the reference
electrode, since a potential difference is measured between two redox processes within
the same compound. Furthermore, it was found that the |E1 – E2|-values were not
strongly influenced by the solution resistance effects, since experiments performed with
and without IR compensation yielded the same values for |E1 – E2| at equivalent water
concentrations. The reason for this is because the voltammetric effects of solution
resistance would be expected to affect both E1 and E2 processes equally, so the
difference between the two processes remains the same as the solution resistance
increases, at least for the slow scan rates used in this study. The effects of solution
resistance are also reduced by performing the voltammetry using relatively low
concentrations of VK1 and high concentrations of the supporting electrolyte.
The results in Figure 2 illustrate that there is a large difference in the |E1 –
E2|-values between the different solvents for equivalent concentrations of water. It can
be reasoned that any interactions between VK1–•
/VK12–
and the solvent molecules are
very low, because small additions of H2O are able to substantially decrease the |E1 –
E2|-values even in the presence of vastly outnumbering solvent molecules. The
differences in the data shown in Figure 2 between the different solvents can be
explained based on how interacting the solvent is with water, which indirectly effects
how H2O is able to undergo hydrogen bonding with VK1–•
and VK12–
. For example,
DMSO and DMF are known to interact relatively strongly with water,31,32
while
solvents with low dielectric constants (ε) such as DCM and DCE do not readily interact

CHAPTER 4
97
with water (being poorly soluble). Therefore, VK1–•
and VK12–
are able to undergo more
hydrogen bonding with equivalent concentrations of water in DCE compared to in
DMSO, because in DMSO the free water concentration is effectively reduced because
of extensive interactions with the solvent.
The plots in Figure 2 show that a |E1 – E2|-value of 0.5 V occurs for a water
concentration of 0.005 M in DCE, and for a water concentration of 3.0 M in DMSO. If
the |E1 – E2|-values are used as an absolute measure of the degree of hydrogen bonding,
it can be interpreted that H2O is 600 times more effective at hydrogen bonding with
VK1–•
/VK12–
in DCE compared to in DMSO (due to the DMSO more strongly
interacting with H2O than DCE). An interesting consequence of the differing reactivities
is that even though DCE is less hygroscopic than DMSO and so easier to keep dry, the
water that exists in DCE is more reactive (at least to hydrogen bonding) than higher
concentrations of water in DMSO.
An alternative parameter that can be used to estimate the degree of interactions
between the solvent and water is the experimentally derived normalized solvent basicity
scale, whose values for the different solvents follow the order DCE (0.126) < DCM
(0.178) < MeCN (0.286) < PrCN (0.365) < DMF (0.613) < DMSO (0.647).33
It would
be expected that the higher the solvent on the basicity scale, the more it is likely to
undergo hydrogen bonding reactions itself with water, and consequently the less
interactions between reduced forms of VK1 and water occur. In support of this, the data
in Figure 2c show that the solvent basicity scale does appear to correlate inversely with
the order of interactions between reduced forms of VK1 and water, and a similar

CHAPTER 4
98
correlation exists with the solvent donicity or donor number (DN) scale.34
An additional
complication to interpreting the data is the extent that the solvent interacts with the
water molecules can vary in the presence of the radical anions and dianions. Because the
water molecules are reacting as Lewis acids for H-bonding with radical anions and
dianions, the amphoteric (Lewis acid and Lewis base) properties of the solvents may
also be important.35
In addition to interactions between the solvent-water-analyte, it would also be
expected that the Bu4N+ cation would interact as an ion-pair with the charged
compounds and thereby reduce the water interactions with VK1–•
and VK12–
, especially
in solvents with low dielectric constants.36,37
Thus the data in Figure 2d demonstrate that
as the concentration of Bu4NPF6 increases, the |E1 – E2|-values also increase, due to the
supporting electrolyte ions reducing the hydrogen bonding interactions between water
and VK1–•
/VK12–
. Therefore, in order to use the calibration data in Table 1, it is
important that the supporting electrolyte concentration equals 0.2 M.
4.2.2 Reduction Mechanism
The shift in observed potential (Eobs) for both the E1 and E2 processes with
increasing water concentration can be accounted for by the equilibrium that occurs
between the reduced forms of the VK1 and the H2O molecules. The Eobs can be
measured from the mid-point of the Epred
and Epox
peaks during CV experiments, or from
the Epred
peak during SWV experiments.26
If the equilibrium reaction between the
reduced forms of VK1 with H2O strongly favors the hydrogen bonded forms, then the

CHAPTER 4
99
Nernst equations for the reduction reactions can be given by equations 3 and 4;
𝐸1 obs = 𝐸f 1 0 −
2.303𝑅𝑇
nF× log
VK1 H2O x −∙
VK1 H2O x (3)
𝐸2 obs = 𝐸f 2 0 −
2.303𝑅𝑇
nF× log
VK1 H2O x +y 2−
VK1 H2O x −∙ H2O y (4)
where n is the number of electrons transferred in each step (1), R is the gas constant
(8.3143 J K–1
mol–1
), T is the temperature (in K) and F is the Faraday constant (96485 C
mol–1
). However, the electrochemical experiments indicated that the potential of the
first reduction process was weakly affected by the addition of water, while the second
reduction process was strongly affected by the addition of even very small quantities of
water. Therefore, process E2 is likely to be more accurately represented by equation 5 at
low water concentrations,
𝐸2 obs = 𝐸f 2 0 −
2.303𝑅𝑇
nF× log
VK1 H2O z 2−
VK1−∙ H2O z (5)
where the equilibrium expression involves the one-electron reduction of the
non-hydrogen bonded VK1–•
to form VK12–
, which then undergoes immediate hydrogen
bonding with z molecules of H2O (at high water concentrations, the equilibrium
expressions for the hydrogen bonding reactions need to be incorporated into the Nernst
equation3,9,36,39,40
).
At low water concentrations, such as for the data given in Figure 2c, the change in
the |E1 – E2|-values with varying water concentration are entirely due to the shift in E2,
therefore, equation 5 can be used to estimate the number of water molecules involved in
the reaction. Equation 5 predicts that the slope of the plots in Figure 2c should increase
(become more negative) by –0.059 V for every molecule of water involved in hydrogen
bonding. The slopes of the plots in Figure 2c are given as the inverse of the a values in

CHAPTER 4
100
Table 1 and vary from –0.076 in DMSO to –0.162 in CH3CN, suggesting between 1 – 3
molecules involved in the reaction. The values are only approximate because eq 5 does
not account for the interactions between the solvent and water, and ion-pairing effects,
which are also known to occur. The data in MeCN show a substantial steepening of the
plots at higher water concentrations suggesting more water molecules are involved in
hydrogen bonding, although the interpretation of the data becomes more complicated
because the monoanion also undergoes hydrogen bonding with H2O.
4.2.3 Effect of Water on Reduction Processes of 7,7,8,8-Tetracyanoquinodimethane
(TCNQ)
We were interested in determining whether the reduction potentials of other
compounds were as affected by the presence of trace water as VK1 (and other quinones).
TCNQ was chosen as a comparison molecule because it undergoes two chemically
reversible one-electron reduction processes, because its reduced forms are known to be
long-lived in the presence of water, and because it contains nitrogen atoms which could
undergo hydrogen bonding interactions.37
SWVs obtained during the reduction of
TCNQ in MeCN are given in Figure 3a which show that the second reduction process
(E2) does shift positively with increasing water concentrations, although the first
process (E1) was barely observed to shift. The change in the |E1 – E2|-values with
varying water content are considerably less than observed during the reduction of VK1,
as shown in the plot in Figure 3b for TCNQ and in Figure 2a for VK1, plotted over the
same scale. The peak currents in the SWVs shown in Figure 3a appear to initially

CHAPTER 4
101
increase in intensity as water is added, but this is brought about by a small concentration
change due to some evaporation of the solvent. The decrease in peak current values of
the SWVs at high concentrations of water shown in Figure 3a are due to dilution effects
as more water is added to the MeCN solution.
Figure 3. (a) SWVs obtained during the reduction of 1.0 mM TCNQ in MeCN
containing varying amounts of water and 0.2 M Bu4NPF6 at a 1 mm diameter GC
electrode at 22 ± 2 oC. Recorded with a pulse period (τ) = 25 Hz, a potential step = 2 mV
and a pulse amplitude = 20 mV. (b) and (c) Plots of |E1 – E2| (measured by SWV at a 1
mm diameter GC electrode) versus the water concentration (measured by KF titration)
at 22 ± 2 oC for 1 mM solutions of TCNQ in MeCN or DCM containing 0.2 M Bu4NPF6.

CHAPTER 4
102
Experiments were also performed on the reduction of TCNQ in the presence of
very low levels of water and the plots of the |E1 – E2|-values with varying water content
for the solvents MeCN and DCM are shown in Figure 3c. In contrast to the results
obtained for VK1 (Figure 2c), the plots for TCNQ show no change (within experimental
error) in |E1 – E2|-values at low water concentrations. The results in Figure 3c also show
that the |E1 – E2|-value at a particular water concentration is slightly greater for DCM
compared to MeCN, which is the reverse effect observed for VK1. The difference
between the data obtained for TCNQ and VK1 can be rationalized if the interactions
between TCNQ and the solvents (i.e. solvation effects) are more important than
interactions between TCNQ (and its reduced forms) with trace water. Therefore, the
effects of trace water on the reduction or oxidation potentials of compounds need to be
assessed on a case-by-case basis, although it is likely that for most compounds the
presence of trace water has a small effect on the measured redox potentials.
4.2.4 Method for Coating Gold Electrode and Voltammetry of Vitamin K-SH
The following discussion referes to the procedure that was used in order to attach
VK1 to an electrode surface. The aim of this approach was to see whether the
immobilized VK1 gave a voltammetric response that was similar to the diffusional
controlled voltammetric behavior. The gold electrode was first polished carefully with
3 μm and 1 μm grit alumina oxide powder on polishing pad and then sonicated in
deionised water for 15 min followed by EtOH for 3 min. After the electrode was
cleaned with hot sulfuric acid and rinsed with water, 5 scans were taken in the range of

CHAPTER 4
103
–0.3 V to 1.5 V (vs. Ag/AgCl) in freshly prepared deoxygenated 0.5 M H2SO4. The
electrode was then rinsed with water and EtOH, dried in air, and immersed finally into
an ethanolic solution with 2mM VKSH overnight. Before electrochemical
measurements, the electrode was rinsed with EtOH and dried in a steam of nitrogen.
Or a 2 μL aliquot of the ethanolic solution of 2 mM VKSH was deposited on top of the
Au electrode surface and the EtOH allowed to evaporate under vacuum or in air, to
produce a SAM.
It was believed that an alternative voltammetric method that could be used to
measure the water content of a solvent (after appropriate calibration studies), was to
attach the VK1 to an electrode surface and then immerse the electrode into the solution
(rather than adding the VK1 directly to the solution). Therefore, to produce SAMs on top
of the Au electrode surface, three methods were tried. One method involved immersing
an Au electrode in an ethanolic solution of 2 mM VKSH overnight. The second
method consisted of dropping 2 μL of an ethanolic solution of 2 mM VKSH onto the
surface of the Au electrode, and drying the electrode under vacuum. The third method
consisted of dropping 2 μL of an ethanolic solution of 2 mM VKSH onto the surface of
the Au electrode surface and drying in air.
Figure 3 shows the CVs recorded in CH3CN with 0.2 M Bu4NPF6 as supporting
electrolyte with an Au electrode that had been modified with a SAM by coating it from
an ethanolic solution containing 2 mM VKSH (according to the three methods). In each
case, the first (least negative) process corresponds to the one-electron reduction of
VKSH to the semiquinone anion radical (VKSH–•
) (eq 6), and the second process is the

CHAPTER 4
104
further one-electron reduction of the semiquinone radical to the dianion (VKSH2–
) (eq
7).11,13
E0f(3) and E
0f(4) refer to the formal electrode potentials, that are analogous to the
E0
f(1) and E0
f(2) processes for solution phase VK1 (eqs 1 and 2). The mechanism for the
interaction of VKSH and reduced forms (VKSH–•
and VKSH2–
) with H2O molecules is
given in Scheme 3 (essentially the same as in Scheme 2 in Chapter 3).
The CVs in Figure 3 illustrate that the anodic and cathodic peak current ratio
(ipox
/ipred
) of the first process are close to unity for the second and subsequent scans for
each method. However, the second process appears only partly chemically reversible
because only the reduction peak is observed. The CVs in Figure 3 indicate that the
results from each coating method were similar. The peak current for the first process
observed on the first scan was larger than the subsequent scans, while the
voltammograms observed on scans 2 – 5 closely overlapped, indicating that the coated
electrodes were fairly robust. The reason for the apparent chemical irreversibility of the
second process it not clear, but it does not appear to relate to chemical stability of the
tethered dianion otherwise the voltammograms would be expected to show large
differences when multiple scans were performed. The CVs in Figure 3 were obtained
using a pseudo Pt wire reference electrode; therefore, the potentials differences
observe between the different methods are not significant.
(6)
(7)

CHAPTER 4
105
Figure 3. Cyclic voltammograms (5 scans) recorded at a scan rate of 0.1 V s–1
of
films of VKSH deposited on a 3 mm diameter planar Au electrode at 22 ± 2 oC. (a)
Immerse Au electrode in an ethanolic solution of 2 mM VKSH overnight. (b) Drop 2
μL of ethanolic solution of 2 mM VKSH on top of the Au electrode surface, dry under
vacuum. (c) Drop 2 μL of ethanolic solution of 2 mM VKSH on top of the Au
electrode surface, dry in air. Red is the first scan, black are the intermediate scans and
blue is the final scan.

CHAPTER 4
106
Scheme 3. Mechanism shows hydrogen-bonding interactions between VKSH and
its reduced forms with H2O.

CHAPTER 4
107
Figure 4. CVs recorded at a scan rate of 0.1 V s–1
of films of VKSH deposited on
a 3 mm diameter planar Au electrode at 22 ± 2 oC. (a) CH3CN with 0.2 M Bu4NPF6 as
the supporting electrolyte (Fifth scan of 5 scans). (b) CH2Cl2 with 0.2 M Bu4NPF6 as
the supporting electrolyte. Red is the lowest water concentration, black is intermediate
water concentration and blue is the highest water concentration.

CHAPTER 4
108
Figure 5. Plots of |E3 – E4| (measured by SWV at a 3 mm diameter Au electrode)
vs. the water concentration (measured by KF titration) at 22 ± 2 oC for 2 mM solution
of VKSH in different solvents with 0.2 M Bu4NPF6 as the supporting electrolyte. Red
is CH3CN and blue is CH2Cl2.
Voltammetric experiments were performed by adding water to organic solvents
that contained a gold electrode coated with VKSH, in order to determine whether the
coated electrode displayed the same trend (in terms of the position of the E3 and E4
processes) as when the VK1 was in solution. Figure 4 shows CVs obtained for SAMs of
VKSH in carefully deoxygenated solutions of CH3CN and CH2Cl2 in the presence of
varying H2O concentrations. It can be observed that both the first and second processes
shift to more positive potentials with increasing water concentrations, which is similar
to the results obtained from VK1 solutions.11,13
For each scan, a new SAM on the Au
working electrode surface was prepared (and the second scan used), followed by KF
titration to obtain the water concentration. There was a large amount of potential drift
observed in the voltammograms in Figure 4 due to the fact that a pseudo reference

CHAPTER 4
109
electrode was used. The drift was not critical to the measurements because we were only
interested in measuring the difference between E3 and E4.
SWV experiments were performed to measure the |E3 – E4|-values over a range of
water concentrations. Figure 5 shows the |E3 – E4|-values against the water
concentrations of the solvents CH3CN and CH2Cl2. The data in Figure 5 are a
combination of several experiments, and show a similar trend as was observed for the
data obtained when VK1 is dissolved in solution. However, the results show more
scatter and the shift in |E3 – E4| was not as great as when VK1 was used in solution.
4.3 Conclusions
The data in this study has demonstrated that the presence of what is often
considered trace amounts of water (mM levels) has a pronounced influence on the
E0
f-values of semiquinones, especially in solvents with low relative basicity. The degree
of hydrogen bonding of VK12–
with water in organic solvents was found to increase in
the order DMSO < DMF < PrCN < MeCN < DCM < DCE, for equivalent
concentrations of water and supporting electrolyte. The extent that VK1–•
and VK12–
undergo hydrogen bonding with low levels of water is indirectly determined by how
interacting the solvent is with water (inversely correlating with the relative solvent
basicity) and the concentration of the supporting electrolyte.
This study has demonstrated that VKSH, a derivative of VK1, can be attached to
Au electrode surfaces via a sulfur linkage and the voltammetry of immobilized VKSH
can be used to estimate water concentrations in organic solvents by performing

CHAPTER 4
110
voltammetry experiments. Two reduction peaks were observed in CVs, which indicated
VKSH–•
and VKSH2–
were produced at the surface of Au electrode. The reduced form
of VKSH, VKSH–•
and VKSH2–
, both undergo hydrogen-bonding with H2O in
solutions and the peaks shift to more positive potentials.
CHAPTER 4
111
References
1. Hammerich, O.; Svensmark, B. In Organic Electrochemistry, 3rd ed.; Lund, H.,
Baizer, M. M., Eds.; Marcel Dekker: New York, 1991; Chapter 16.
2. Chambers, J. Q. In The Chemistry of the Quinonoid Compounds; Patai, S.,
Rappoport, Z.; Eds.; Wiley: New York, 1988: Vol II, Chapter 12, pp 719–757.
3. Peover, M. E. In Electroanalytical Chemistry; Bard, A. J., Ed.; Dekker: New
York, 1967; pp 1–51.
4. Laviron, E. J. Electroanal. Chem. 1986, 208, 357–372.
5. Gupta, N.; Linschitz, H. J. Am. Chem. Soc. 1997, 119, 6384–6391.
6. Ge, Y.; Miller, L.; Ouimet, T.; Smith, D. K. J. Org. Chem. 2000, 65, 8831–
8838.
7. Lehmann, M. W.; Evans, D. H. J. Electroanal. Chem. 2001, 500, 12–20.
8. Lehmann, M. W.; Evans, D. H. J. Phys. Chem. B 2001, 105, 8877–8884.
9. Gómez, M.; González, F. J.; González, I. Electroanalysis 2003, 15, 635–645.
10. Quan, M.; Sanchez, D.; Wasylkiw, M. F.; Smith, D. K. J. Am. Chem. Soc. 2007,
129, 12847–12856.
11. Hui, Y.; Chng, E. L. K.; Chng, C. Y. L.; Poh, H. L.; Webster, R. D. J. Am.
Chem. Soc. 2009, 131, 1523–1534.
12. Zhang, L.; Zhou, H.; Li, X.; Lin, Y.; Yu, P.; Su, L.; Mao, L. Electrochem.
Commun. 2009, 11, 808–811.
13. Hui, Y.; Chng, E. L. K.; Chua, L. P.-L.; Liu, W. Z.; Webster, R. D. Anal. Chem.
2010, 82, 1928–1934.

CHAPTER 4
112
14. Stone, E. W.; Maki, A. H. J. Chem. Phys. 1962, 36, 1944–1945.
15. Gendell, J.; Freed, J. H.; Fraenkel, G. K. J. Chem. Phys. 1962, 37, 2832–2841.
16. Fujihira, M.; Hayano, S. Bull. Chem. Soc. Jpn. 1972, 45, 644–645.
17. Ulman, A. An Introduction to Ultrathin Organic Films: From
Langmuir-Blodgett to Self-Assembly; Academic Press: San Diego, CA, 1991.
18. Finklea, H. O. in: Bard, A. J.;Rubinstein, I. (Eds.), Electroanalytical
Chemistry, Marcel Dekker, New York, 1996, pp. 108–335.
19. Sandhyarani, N.; Pradeep, T. Int. Rev. Phys. Chem. 2003, 22, 221.
20. Bulovas, A.; Dirvianskyt_e, N.; Talaikyt_e, Z.; Niaura, G.; Valentukonyt_e, S.;
Butkus, E.; Razumas, V. J. Electroanal. Chem. 2006, 591, 175–188.
21. Abhayawardhana, A. D.; Sutherland, T. C. J. Phys. Chem. C. 2009, 113,
4915–4924.
22. Vitamin K and Vitamin K-Dependent Proteins: Analytical, Physiological and
Clinical Aspects; Shearer, M. J.; Seghatchian, M. J.; Eds.; CRC Press: Boca Raton, FL,
1993.
23. Blankenship, R. E. Molecular Mechanisms of Photosynthesis, 1st ed.;
Blackwell Science: Oxford, 2002.
24. Trumpower, B. L. Function of Quinones in Energy Conserving Systems;
Academic Press: New York, 1982.
25. Kuan, S. L.; Leong, W. K.; Goh, L. Y.; Webster, R. D. Organometallics, 2005,
24, 4639–4648, and references therein.
26. Bard, A. J.; Faulkner, L. R. Electrochemical Methods: Fundamentals and

CHAPTER 4
113
Applications, 2nd ed.; Wiley: New York, 2001.
27. Webster, R. D.; Bond, A. M.; Compton, R. G. J. Phys. Chem. 1996, 100,
10288–10297.
28. Webster, R. D.; Bond, A. M. J. Org. Chem. 1997, 62, 1779–1787.
29. Williams, L. L.; Webster, R. D. J. Am. Chem. Soc. 2004, 126, 12441–12450.
30. Webster, R. D. Acc. Chem. Res. 2007, 40, 251–257.
31. Jezorek, J. R.; Mark, H. B. Jr. J. Phys. Chem. 1970, 74, 1627–1633.
32. Tokuhiro, T.; Menafra, L.; Szmant, H. H. J. Chem. Phys. 1974, 61, 2275–2282.
33. Catalán, J. J. Phys. Chem. B 2009, 113, 5951–5960.
34. Gutmann, V. Electrochim. Acta 1976, 21, 661–670.
35. Krygowski, T. M.; Fawcett, W. R. J. Am. Chem. Soc. 1975, 97, 2143–2148.
36. Peover, M. E.; Davies, J. D. J. Electroanal. Chem. 1963, 6, 46–53.
37. Woods, J. E.; Ge, Y.; Smith, D. K. J. Am. Chem. Soc. 2008, 130, 10070–10071.
38. Yao, W. W.; Tan, Y. S.; Low, Y. X.; Yuen, J. S. Y.; Lau, C.; Webster, R. D. J.
Phys. Chem. B 2009, 113, 15263–15271.
39. Lasia, A.; Kalinowski, M. K. J. Electroanal. Chem. 1972, 36, 511–514.
40. Lipsztajn, M.; Krygowski, T. M.; Galus, Z.; J. Electroanal. Chem. 1974, 49,
17–26.

114

CHAPTER 5
115
Chapter 5
The Absorption of Water into Organic Solvents used for
Electrochemistry under Conventional Operating Conditions
5.1 Introduction
Voltammetric experiments often need to be performed in non-aqueous solvents
because of the solubility properties of the analytes, as well as to prevent reactions of the
oxidized or reduced species with water.1,2
The Karl Fischer coulometric (or volumetric)
titration is the major method used to determine the water content of non-aqueous
solvents. However, despite it being commonly known that water is a major impurity in
all organic solvents, a literature search in ISI Web of Science combining the keywords
“Karl Fischer” with “voltammetry” found just 10 publications over the last 20 years!
Although there are likely to be other publications using voltammetry where the water
content is measured, the vast majority of studies that perform electrochemistry in
non-aqueous solvents do not report the water content of the electrochemical solutions
under the conditions that the experiments were carried out.
The problem of interference from trace water is exacerbated by the requirement
that voltammetry be conducted with low concentrations of analytes;1,2
thus the water
content can be much greater than the analyte concentration. An analyte concentration of
between 0.5 × 10⁻³
M to 2 × 10⁻³
M is typically used for cyclic voltammetry
experiments, which is high enough to provide adequate signal-to-noise ratios, but

CHAPTER 5
116
sufficiently low so as not to distort the voltammograms due to resistance effects
(IR-drop) or migration effects.3 It can be argued that the water content of the test
solution should always be reported in order for the formal potentials (E0f) to be
meaningful. Furthermore, unless the initial water content of the solvent is known, it is
not possible to know whether the effects of trace water on the electrochemical reaction
are important or unimportant.
While, it is relatively straightforward to dry many solvents to < millimolar levels of
water (which is less than the normal analyte concentration for voltammetry
measurements),4-7
once the solvent is added to the electrochemical cell, the water levels
will immediately significantly increase unless the experiments are conducted in a glove
box, which is not usually convenient for electrochemical measurements due to the
positioning of the potentiostat and the requirement of having to frequently polish the
electrodes. Other major sources of water that need to be considered and controlled are
from the supporting electrolyte, the reference electrode (especially if it is separated from
the test solution by a junction containing an internal filling solution), the surface of the
electrochemical cell and the substrate itself.1-3
Pre-saturation containers that are used to
compensate for evaporation of volatile solvents are another major source of water.
Therefore, it is far more important to know the water content of the test solution under
operating conditions, rather than the water content of the dried solvent in its storage
vessel. The purpose of the research presented in this Chapter is to provide guidelines for
estimating the water content of organic solvents under conventional electrochemical
operating conditions.

CHAPTER 5
117
5.2 Results and Discussion
It is not the purpose of this study to perform measurements under ultra-dry
conditions, which generally requires a glove box or high vacuum conditions. Instead,
interest was in measuring the water content of organic solvents under normal conditions
where low water content is preferred, but the vigorous requirements of an ultra-dry
environment are not necessary. It is not possible to cover all the possible cell designs,
but the conditions represented in this work are typical of many experiments. Namely, a
solution containing solvent, electrolyte and analyte are placed in a glass electrochemical
cell under an argon or nitrogen atmosphere and voltammetry experiments are conducted
over a period of a few minutes to a few hours. The most significant local variation is the
humidity conditions, which can change substantially in some locations on an hourly
basis, thus were carefully controlled for these measurements using a constant humidity
chamber that contained all of the apparatus (Figure 1).
Figure 1. Constant humidity chamber containing apparatus for performing water
content measurements.

CHAPTER 5
118
One major source of water, which is not accounted for in this study, is from
reference electrodes that use internal filling solutions. If an aqueous reference electrode
is placed in a non-aqueous solvent, then the water content of the solvent will
immediately increase. Trial experiments indicated that the water content of a “dry” (~1
× 10–3
M H2O) solvent will quickly increase within a few minutes to > 0.1 M H2O if an
aqueous reference electrode is used. Reference electrodes that contain organic filling
solutions will also add substantial amounts of water to the solvent, since it is difficult to
load the internal filling solution without exposing the solution to the atmosphere. The
longer the non-aqueous reference electrode is stored, the more water it will absorb.
Therefore, experiments at low water content should only be performed using a pseudo
wire reference electrode, which is the de facto assumption for this study.
The drying procedure described in the Experimental Section (page 38) lowered the
water content of the solution inside the syringe to a base level that depended on the
properties of the solvent (Table 1). For dichloromethane (DCM), acetonitrile (MeCN),
dichloroethane (DCE) and butyronitrile (PrCN) the drying procedure lowered the water
content of the solvent/electrolyte inside the syringe to < 1 × 10⁻³
M (column 2 in Table
1). For N,N-dimethylformamide (DMF) and propionitrile (EtCN) the water content of
the solvent/electrolyte inside the syringe could be lowered to approximately 2.5 × 10⁻³
M, while for dimethylsulfoxide (DMSO) the water content remained ≥ 20 × 10–3
M.
DMSO is known to be very difficult to dry because of strong hydrogen bonding
interactions between the solvent and water.8,9
For the solvents used in this study, it has
been found that pre-drying the solvents by distilling over chemical drying agents (such

CHAPTER 5
119
as CaH2 or P2O5) or passing the solvent through a column of activated alumina, does not
improve the drying procedure beyond using the molecular sieves.4-7
For some solvents, such as DMSO, improved drying has reported to be possible by
using 4 Å molecular sieves (rather than 3 Å), but under these conditions the solvent also
needs to be dried and stored inside a glove box to maintain its ultra-dry state.6 The
possibilities of using larger amounts of molecular sieves or drying the samples for
longer periods of time (many days) were not investigated. Some molecular sieves can
introduce impurities into solution that can affect the electrochemical results. It was
found that the brand of molecular sieves listed in the experimental section had good
drying characteristics that did not appear to introduce impurities into solution.10,11
An advantage of using the molecular sieves for drying the solutions compared to
other methods is that it enables the solvent and electrolyte to be dried together, because
the electrolyte often contains waters of crystallization which can be difficult to remove
by heating. Furthermore, if the electrolyte is weighed in air and then added to the
electrochemical cell, it would have already absorbed water from the atmosphere
(depending on the local humidity conditions). If possible, adding the analyte to the
solvent and electrolyte in the syringe is also useful in obtaining a starting solution with
reasonably low water content (providing it does not react with the molecular sieves). For
the measurements discussed in this Chapter, it was found that within experimental error,
the presence of the electrolyte did not increase the rate that water was absorbed from the
atmosphere compared to results obtained using the pure solvent, but for consistency all
reported measurements were performed in the presence of 0.2 M supporting electrolyte.

CHAPTER 5
120
Table 1. Concentration of water in dried organic solvents measured by Karl
Fischer coulometric titrations at 22 ± 2 oC.
aSolvent contains 0.2 M Bu4NPF6.
bThe error is the standard deviation from
measurements on at least three different samples of each solvent.
The concentration of water obtained by KF titrations are usually calculated in units
of ppm (μg g–1
) for the mass of water divided by the mass of solvent. However, for
cyclic voltammetry measurements the units of concentration are typically reported in
mol L–1
. Therefore, in this study all measured water concentrations have been converted
to mol L–1
(or mmol L–1
in Table 1). As a comparison, 1 × 10⁻³
M H2O in DCM, MeCN,
DMF and DMSO correspond to 14, 23, 19 and 16 ppm H2O, respectively. In order to
confirm the accuracy of the KF titrations for the present measurements, accurately
controlled μL volumes of H2O were added to test solutions and KF titrations conducted
to determine if the added amount agreed with the measured amount. It was found that
the KF titrations were accurate up to 0.5 M total concentration of water, which is
considerably higher than the amounts measured for the dried solvents used in this study.
Solventa b
Water concentration / mmol L–1
Solvent/electrolyte
stored over 3 Å
molecular sieves
Solvent/electrolyte transferred into electrochemical cell
under a nitrogen atmosphere (t = 0)
30% humidity 50% humidity 70% humidity
DCM 0.2 ± 0.1 0.7 ± 0.2 0.7 ± 0.2 1.0 ± 0.2
MeCN 0.5 ± 0.3 0.7 ± 0.3 0.7 ± 0.3 1.2 ± 0.3
DMF 2.5 ± 0.5 3.0 ± 1.0 3.0 ± 1.0 5.0 ± 1.5
DMSO 25 ± 5 30 ± 5 30 ± 5 30 ± 5
DCE 0.15 ± 0.1
EtCN 2.5 ± 0.5
PrCN 0.2 ± 0.1

CHAPTER 5
121
Columns 3 – 5 in Table 1 give the water content of the dried DCM, MeCN, DMF
and DMSO solutions (containing electrolyte) immediately after they were added to the
electrochemical cell under different humidity conditions. It can be observed from the
data in Table 1 that in each case there was an immediate increase in the water content as
the solvent was added to the electrochemical cell. For DCM and MeCN the initial water
content inside the electrochemical cell remained ≤ 1 × 10⁻³
M (except for MeCN at the
highest humidity). The results in Table 1 indicate that if an identical drying and
solvent/electrolyte transfer procedure is used as in this study, it is possible in most
instances to obtain water concentrations close to that of the analyte concentrations
(except for DMSO), at least for experiments that are conducted immediately after
adding the solvent/electrolyte to the electrochemical cell.
Figure 2 gives plots showing how the water content of the solvents varied over
time when stored in an electrochemical cell under a nitrogen atmosphere in different
relative humidity environments at 22 ± 2 oC. The plots are all on the same scale to aid
comparison purposes and demonstrate that the electrochemical cell does not exclude
the entry of water, even when under a nitrogen atmosphere. For DCM, the water
content inside the electrochemical cell over all humidity values was < 1 × 10⁻³
M at t =
0 min. and increased to < 5 × 10⁻³
M at t = 120 min. For MeCN, DMF and DMSO
differences in water content were detected depending on the relative humidity, with
the highest humidity levels resulting in measurably larger increases in the solvent
water contents over time. For MeCN, the water content increased from ~1 × 10⁻³
M at
t = 0, up to ~10 × 10–3
M (30% humidity) and ~25 × 10–3
M (70% humidity) at t = 120

CHAPTER 5
122
min. For DMF the water content increased by approximately double the amount
observed for MeCN over similar humidity levels and times. For DMSO the water
content increased by a lesser amount than DMF, but because the starting water
concentration was much higher (~30 × 10–3
M), it recorded the highest overall
concentrations of H2O after 120 min. (~60 × 10–3
M).
In Singapore, where these measurements were performed, the mean relative
humidity is 84%, typically ranging from > 90% in the early morning to 60% in the late
afternoon. The laboratory where the experiments were performed has 24 hour
air-conditioning with the temperature maintained at 22 ± 2 oC, and the relative
humidity measured to be 55 (± 2)%. Therefore, when working in the open laboratory it
would be expected that the water content of the pre-dried solvents would increase at a
rate closest to that observed for 50% humidity. Researchers conducting
electrochemical experiments under environments with < 30% humidity or > 70%
humidity would be expected to observe the water contents of the solvents increasing at
a lesser or greater amount, respectively, than given in Figure 2.

CHAPTER 5
123
Figure 2. Plots showing how the solvent water contents (measured by KF
titrations) change over time when pre-dried solvents (containing 0.2 M Bu4NPF6) are
stored in an electrochemical cell under a N2 atmosphere at a fixed flow of 100 cm3 min
–1
at different relative humidity values (30, 50 and 70%) at 22 ± 2 oC. Plotted
measurements are from one experimental run.

CHAPTER 5
124
Figure 3 shows the effect that the nitrogen atmosphere has on the rate that water is
absorbed from the atmosphere at different humidity levels. As expected, having the
solvent maintained under the dry nitrogen atmosphere (lower plot) does significantly
reduce the rate that the atmospheric water is absorbed into the solvent compared to the
results obtained without a nitrogen atmosphere (upper plot). Because the KF titrations
involve aliquots of the solvent being removed from the electrochemical cell, the
solution volume does not remain constant over the time scale of the experiments.
Therefore, the upwards curvature that is observed in the plots in Figure 3 (and Figure 2)
is most likely caused by changes in the solvent volume over time increasing the apparent
rate that water is absorbed from the atmosphere.
The sampling procedure can itself potentially increase the rate that water is
absorbed from the atmosphere because it involves having to repeatedly insert a needle
into the electrochemical cell to extract an aliquot of the solvent for injection into the
Karl Fischer titrator. It was found that in the case of MeCN, when the dried sample was
added to the electrochemical cell under nitrogen and left for a period of one hour, the
amount of water detected in the MeCN was within 5% of the amount obtained after one
hour when samples were taken every 10 minutes (suggesting that the sampling method
was not affecting the accuracy of the results).
The error associated with the measurements given in Figures 2 and 3 depends on
the absolute amount of water in the sample and the mass of the sample. There is a
minimum charge that can be accurately measured by the coulometer; meaning that low
concentrations of water require higher masses of the analyte in order to achieve the

CHAPTER 5
125
greatest accuracy.12
The error is also highest at the lowest water concentrations and at
the highest relative humidities. This arises from the sampling procedure where some
water from the atmosphere could enter the syringe needle and some solvent can be lost
(evaporate) during the transfer of the solution to the KF coulometric titrator. However, it
is believed that any error due to water being introduced during the sampling is small;
otherwise the results obtained for all the solvents would be very similar, since an
identical sampling procedure is used in each case. The biggest percentage error (seen by
the amount of scatter in the water content vs. time plots) was observed for DCM because
it contains the least amount of water.
Figure 3. Plots showing how the solvent water contents (measured by KF
titrations) change over time when pre-dried solvents (containing 0.2 M Bu4NPF6) are
stored in an electrochemical cell at 50% relative humidity at 22 ± 2 oC in the presence or
absence of a N2 atmosphere at a fixed flow of 100 cm3 min
–1. Plotted measurements are
from one experimental run.

CHAPTER 5
126
5.3 Conclusions
The results in this study demonstrate that for many organic solvents it is possible to
reduce the water content to below or slightly above the analyte concentration by storing
the solvent/electrolyte over 3 Å molecular sieves. Once the dried solvent is added to the
electrochemical cell under an inert atmosphere, the water content of the solvent
increases over time with the rate of increase depending on the properties of the solvent
and the relative humidity. Experiments with very low water concentration (~1 × 10⁻³
M)
are still possible in many solvents in a conventional electrochemical cell if the
experiments are conducted in the presence of the molecular sieves, or if the
measurements are done as soon as the solvent/electrolyte is added to the cell.
One important reason for making the effort to accurately measure and report the
water content of the organic solvent used during voltammetric measurements is that
relative changes in the observed (Eobs) or formal (E0
f) peak potentials will be the largest
at the lowest (mM) water concentrations if the product of the electron transfer reaction
undergoes a reaction with water. For example, equations 1 and 2 (ignoring the charge on
the species and using concentrations in place of activities) represent the situation where
an oxidized species, [Ox], is reduced by x electrons to form [Red], and [Red] further
reacts with y molecules of trace water in the solvent to form [Red(H2O)y]. If the
equilibrium reaction in equation 2 strongly favors the product, the Nernst equation can
be given by equation 3, which predicts that the shift in potential will be dependent on
ln(1/[H2O]y). An analogous situation is observed for electron transfer reactions that are

CHAPTER 5
127
coupled to proton transfer steps, where there is a linear dependence of the reversible
half-wave potential (Er1/2) on the pH.
13
Ox + 𝑥𝑒− Red (1)
Red + 𝑦H2O Red(H2O)y (2)
𝐸obs = 𝐸f0 −
𝑅𝑇
𝑛𝐹× 𝑙𝑛
Red (H2O)y
Ox H2O y (3)
An interesting observation that needs to be considered when working in dry
conditions is the effect that the solvent has on the availability of water to react with the
solute. Although it appears that the solvent DCM is easier to keep dry than the other
solvents (see Figures 2 and 3), it does not mean that solutes in DCM are less likely to
react with water. For example, it has been observed that quinone anions are far more
reactive with water in DCM compared to DMSO, because in DMSO the water itself
undergoes very strong hydrogen-bonding reactions with the solvent (essentially
reducing the water reactivity in that media).11
Since DCM only interacts very weakly
with water, the water in DCM is freer to interact with the solute than the water in
DMSO. Parameters that can be used to estimate the degree of interactions between the
solvent and water are the experimentally derived normalized solvent basicity scale14
and
the donor number scale (see Chapter 4).15

CHAPTER 5
128
References
1. Kissinger, P. T., Heineman, W. R., Eds.; Laboratory Techniques in
Electroanalytical Chemistry; Marcel Dekker: New York, 1984.
2. Lund, H., Baizer, M. M., Eds.; Organic Electrochemistry, 3rd ed.; Marcel
Dekker: New York, 1991.
3. Bard, A. J.; Faulkner, L. R. Electrochemical Methods: Fundamentals and
Applications, 2nd
ed.; Wiley: New York, 2001.
4. Burfield, D. R.; Lee, K. H.; Smithers, R. H. J. Org. Chem. 1977, 42, 3060–3065.
5. Riddick, J. A.; Bunger, W. B.; Sakano, T. K. Organic solvents: physical
properties and methods of purification, 4th ed.; John Wiley and Sons: New York, 1986.
6. Perrin, D. D.; Armarego, W. L. F. Purification of Laboratory Chemicals;
Pergamon Press: New York, 1988.
7. Williams, D. B. G.; Lawton, M. J. Org. Chem. 2010, 75, 8351–8354.
8. Jezorek, J. R.; Mark, H. B. Jr. J. Phys. Chem. 1970, 74, 1627–1633.
9. Tokuhiro, T.; Menafra, L.; Szmant, H. H. J. Chem. Phys. 1974, 61, 2275–2282.
10. Hui, Y.; Chng, E. L. K.; Chng, C. Y. L.; Poh, H. L.; Webster, R. D. J. Am.
Chem. Soc. 2009, 131, 1523–1534.
11. Hui, Y.; Chng, E. L. K.; Chua, L. P.-L.; Liu, W. Z.; Webster, R. D. Anal. Chem.
2010, 82, 1928–1934.
12. Scholz, E. in Karl Fischer titration, Springer-Verlag, Berlin, 1984.
13. Quan, M.; Sanchez, D.; Wasylkiw, M. F.; Smith, D. K. J. Am. Chem. Soc. 2007,
129, 12847–12856.

CHAPTER 5
129
14. Catalán, J. J. Phys. Chem. B 2009, 113, 5951–5960.
15. Gutmann, V. Electrochim. Acta 1976, 21, 661–670.

130
CHAPTER 6
131
Chapter 6
In-situ Infra-red Spectroscopy of Reduced Forms of
Vitamin K1
6.1 Introduction
Based on the understanding of vitamin K1 (VK1) from the voltammetric and
in-situ UV-Vis spectroscopic data (Chapters 3 and 4), the degree of hydrogen bonding
between the reduced forms with water in the solvent were further investigated using
in-situ electrochemical infra-red (IR) spectroscopy with an attenuated total reflection
(ATR) probe (see Experimental section, Chapter 2). IR spectroscopy is extremely
useful because it can give information on the molecular structure of a molecule and
allows for compounds to be characterized, identified and also quantified.1 The IR
spectra of VK1 and its reduced forms were studied by combining both electrochemical
and spectroscopic techniques. In an attempt to identify how the positions of the IR
bands of the reduced compounds varied depending on the solvent water content,
in-situ IR spectroscopy was conducted simultaneously with the electrolysis of VK1
solutions. The solution containing VK1 was dried very carefully and Karl Fischer (KF)
titration was used to determine the precise water content. Subsequently, different
volumes of water were added into the dry VK1 solution and their spectra (after
reduction) were compared. A two compartment electrochemical electrolysis cell
(Figure 1) was designed to enable FTIR spectra to be simultaneously collected. This

CHAPTER 6
132
cell enabled the quantitative and reversible formation of the radical monoanion and
dianion, allowing the simultaneous recording of electrochemical and IR spectroscopic
data in a single set-up that includes an electrochemical cell, potentiostat, and a
spectrophotometer (Figure 1).
Figure 1. Electrochemical cell for electrolysis and in-situ FTIR spectroscopy.
6.2 Results and Discussion
6.2.1 IR Spectroscopy for Vitamin K1 in Non-dried CH3CN
The electrolysis experiments described in Chapter 3 indicated that the monoanion
and dianion survived in solution for many minutes, therefore should be observable by
in-situ FTIR spectroscopy. CH3CN was used as the solvent in the electrolysis
experiments that were carried out concurrently with IR spectroscopy. It was
discovered that by using non-dried CH3CN, i.e. using it directly from the bottle
without drying it, the electrolysis of VK1 solution could proceed to completion and the

CHAPTER 6
133
reduced states could be successfully reoxidized back to the starting material. KF
titration was used to measure the initial concentration of water content in the wet
CH3CN which was found to be 0.100 M.
Upon the completion of the electrolysis, KF titration was carried out separately
on the solution contained in the cathodic and anodic compartments. It was revealed
that although the volume of the anodic compartment solution was four times that of
the solution volume in the cathodic compartment; the water content in the cathodic
compartment solution where the reduced species are generated was approximately
twice the water content found in the anodic compartment solution. This finding is in
agreement with what we know regarding the interaction between the reduced species
and water found in solvents where the dianion VK12–
undergoes hydrogen bonding
with water molecules (radical monoanion VK1–•
undergoes little hydrogen bonding at
water concentrations < 0.5 M)2. Hence, it is possible that the water molecules from the
anodic compartment are transferred into the cathodic compartment during the course
of the second reduction process, due to the ability of the strongly electronegative
oxygen atoms in VK12–
to form strong hydrogen bonding with water. An equilibrium
exists between the rate at which the water enters and moves out the cathodic
compartment and based on the KF titrations, it seems to suggest that the rate at which
water moves out of the cathodic compartment after reoxidization is much slower than
the rate of water entering it during the second reduction step, and consequently the
water content of the solution in cathodic compartment is greater than that of the
solution in anodic compartment.

CHAPTER 6
134
Figure 2 shows the IR spectra of VK1 and its reduced forms obtained during the
electrolysis in non-dried CH3CN. The IR spectra of the neutral starting material VK1
(shown as red lines in Figure 2) show characteristic bands between 1700 and 1200
cm–1
. The strongest bands arise from the C=C vibrations that are due to ring stretching
band of the aryl group as well as from the C=O vibrations. These bands are located
between 1692 and 1560 cm–1
based on theoretical calculations,3 experimental data,
4
and results from using isotopically labeled 2,3-dimethoxy-5-methyl-6-decaisoprenyl-
1,4-benzoquinone.5 The sharp and intense band at 1663 cm
–1 is assigned to the C=O
and the band at 1598 cm–1
to the symmetric C=C vibration of the aryl group in VK1.
The assignment of the C=O and C=C bands to single IR bands is facilitated since both
these modes are allowed to be closely approximated as group vibrations.3 It is mostly
the electronic effects of the substituent on the quinone ring in VK1 that will determine
the exact positions of the C=O and C=C bands, and only to a little extent by
interactions with other molecules, e.g. hydrogen bonding to water found in solvent.
Since the quinone structure in VK1 is asymmetrically substituted, a total of four bands
are expected to be observed in these spectra, i.e. two C=C and two C=O bands.
However, it is usually difficult to clearly differentiate the four individual bands due to
band overlapping. The assignment of bands in the remaining region between 1500 and
1200 cm–1
is less certain and will be neglected here since it does not contain valuable
information to aid in the understanding of the IR spectra.

CHAPTER 6
135
Figure 2. In-situ IR data recorded during the electrolysis of 5 mL 20 mM VK1
solution using wet CH3CN as solvent arranged in increasing water concentration of the
solution tabulated using KF titration after electrolysis. (a) 0.0089 M. (b) 0.0395 M. (c)
0.0414 M. Starting material VK1 (Red lines). Radical monoanion of VK1 obtained
after first reduction at applied potential of –1.1 V (Green lines). Dianion of VK1
obtained after second reduction at applied potential of –1.8 V (Blue lines). Products
obtained after oxidation at applied potential at 0 V (Black lines).

CHAPTER 6
136
Upon the first reduction at an applied potential of –1.1 V to generate the radical
monoanion (Green lines of Figure 2), the colour of the solution changed from yellow
to dark green, and the intense band at 1663 cm–1
in the spectrum disappeared. A new
strong peak appears at 1710 cm–1
which initially looks to be rather broad but on closer
inspection, the peak actually consists of two bands that are overlapping with each
other. The original C=C band at 1598 cm–1
is also observed in the monoanion
spectrum and similarly, the band appears to have two overlapping bands. Recall that in
the original VK1 spectrum, two C=O and two C=C bands are expected although due to
band overlapping, it was not possible to distinguish them. But for the radical
monoanion which in fact exists as two resonance forms (Figure 3), the spectrum
revealed that the degree of band overlapping has decreased as shoulder peaks could be
seen from the bands at 1710 cm–1
and 1598 cm–1
. Hence, it is inferred here that the
resonance forms of the monoanion are actually causing the overlapping bands to be
more easily distinguished in the monoanion spectrum. As such, the intense peak and
its shoulder peak at 1710 cm–1
and 1702 cm–1
respectively are assigned to the two
C=O bonds of the monoanion resonance structures. And the band at 1598 cm–1
together with its shoulder peak at 1582 cm–1
are assigned to the two C=C bonds in the
VK1–•
structure where they belong to both the symmetric and asymmetric stretching
modes of the benzoquinone radical anion group.
Figure 3. Resonance structures of the radical monoanion.

CHAPTER 6
137
Comparing the positions of the C=O bands belonging to VK1 and its monoanion,
it is apparent that the C=O peak in the monoanion is located at a higher wavenumber
than the C=O band in VK1. This suggests that the C=O bond in the monoanion is
stronger because a stronger bond would require greater energy to stretch the bond; and
consequently, the higher the energy (or wavenumber, in cm–1
) of the corresponding
band. The stronger C=O bond can be attributed to the increased electron density being
distributed in the aromatic ring. This observation is consistent with the CV results
obtained in a study which showed that the potential of the first reduction peak did not
change much with varying water concentration, given that a strong C=O bond would
imply that the radical monoanion is less likely to interact with water molecules via
hydrogen bonding.
Due to the resonance structures of the monoanion, there should also exist two
C–O bands in its IR spectrum. Two separate distinct peaks were found at lower
wavenumbers at 1492 cm–1
and 1465 cm–1
and these are assigned to the C–O single
bonds, since according to a study which reported on the IR bands of various quinones,
they located the C–O band belonging to the VK1 radical monoanion at 1488 cm–1
although the solvent used in the study was dichloromethane (CH2Cl2).5 The positions
of the C–O IR bands can still be found in approximately the same region even though
CH3CN is used as the solvent.
At an applied potential of –1.8 V, the second reduction process is carried out,
forming the dianion with the solution changing colour from dark green to dark maroon.
From the dianion IR spectra shown in Figure 2 (Blue lines), it can be seen that the two

CHAPTER 6
138
C=O bands at 1710 cm–1
and 1702 cm–1
have disappeared. This signifies that all, if not
most of the radical monoanion have been reduced to form the dianion since the
dianion structure does not contain any C=O bonds (Figure 3b). In the dianion spectrum
at lower wavenumbers, two peaks are located at 1373 cm–1
and 1343 cm–1
and these
are tentatively assigned to the two C–O single bonds present in the dianion structure.
Recall that in the radical monoanion spectrum, two peaks found at 1492 cm–1
and
1465 cm–1
were assigned to C–O bonds. Using that as a comparison, it is evident that
the C–O bands belonging to the dianion are found at fairly low wavenumbers which
could suggest that the C–O bonds in the dianion are weaker than the C–O bonds in the
monoanion. The weaker C–O bond can be explained by the observation that the
dianion is capable of forming much stronger hydrogen bonding interactions with water
molecules as its structure contains strongly negatively charged oxygen atoms. As a
result of the stronger hydrogen bonding with water, the bond strength of the C–O bond
will weaken; meaning that less energy is needed to stretch the bond and that is why the
C–O bands belonging to the dianion are located at lower wavenumbers than in the
monoanion.
When the dianion was electrochemically oxidized by applying 0 V to the
electrode surface, the colour of the solution changed from dark maroon to yellow,
indicating that the VK1 was being regenerated from the reduced forms in the solution.
Furthermore, it was observed that in all the IR spectra, the characteristic peaks
representing the starting material of VK1 at 1663 cm–1
and 1598 cm–1
appeared after
the reoxidation (Black lines in Figure 2) of the dianion VK12–
, thereby reaffirming that

CHAPTER 6
139
the reduced states were stable on the timescale of the experiment, which was
approximately 60 minutes.
6.2.2 IR Spectroscopy of Vitamin K1 in Ultra-dry CH3CN
Having established the electrochemical and spectroscopic behavior of VK1 in
intermediate water concentration of 0.100 M, electrolysis experiments were next
performed at low water concentrations by carefully drying the solvents. The water
content of the dry solution could reach to as low as 0.0010 M which was determined
by KF titration. Although the solution used is dry, once it is in the electrochemical cell
under a nitrogen atmosphere, the water content will increase slowly. Previous studies
has shown that even under an argon atmosphere, the water content of the dry VK1
solution increased steadily from 0.01 to 0.05 M within 2 hours when using CH3CN as
the solvent.6 But in these electrochemical-ATR-FTIR experiments, the concentration
of VK1 solution is much higher at 20 mM, which is 20 times higher than used for the
purely voltammetric experiments. Therefore, it is reasonable to assume that the trace
water will have a lesser effect on the hydrogen-bonding with the VK1 anions. The IR
spectra in Figure 4 were obtained from the electrolysis of VK1 in dry CH3CN. The IR
spectra obtained for the first reduction step to produce the anion radical were similar to
obtained in the non-dried CH3CN. However, it can be seen that the second reduction
spectrum (Blue line) obtained is similar to the spectrum of the first reduction (Green
line), indicating that the second reduction was not progressing even though the applied
voltage was at –1.8 V and the solution was being stirred continuously to ensure the

CHAPTER 6
140
homogeneity of the solution. Furthermore, the solution in the cathodic compartment
remained dark green, confirming that the second process was not proceeding. The
electrolysis of dry VK1 solution was repeated several times and the same results were
obtained each time where the second reduction would appear not to proceed.
Figure 4. In-situ IR spectra recorded during the electrolysis of 5 mL 20 mM VK1
solution using dry CH3CN as solvent. Starting material VK1 (Red line). Radical
monoanion of VK1 obtained after first reduction at applied potential of –1.1 V (Green
line). Dianion of VK1 obtained after second reduction at applied potential of –1.8 V
(Blue line).
This interesting feature observed could be due to the fact that the water content in
the solution was insufficient to allow hydrogen bonding of the dianion with water
molecules, and consequently reducing the solubility of the dianion. As a result of the
lowered solubility of the dianion, the dianion is likely to be adsorbed on the electrode
surface and therefore the second reduction process could not be observed. One piece
of evidence for this interpretation is that a dark green residue was found coating the

CHAPTER 6
141
surface of the platinum plate when the working electrode was removed after the
experiment. This reasoning is also supported by the CVs that were carried out on dry
VK1 solution in a study where unique voltammetric characteristics were observed
when the water content was below 0.010 M (Chapter 3).6 In the study, the CV
performed showed the second reduction process gave wide and oddly shaped peaks
which were rationalized to be due to the lack of water for hydrogen-bonding of the
dianion and causing it to interact with the electrode surface (by absorbing).
The water content of dry VK1 solution which was used to perform the electrolysis
experiment is very low at 0.0010 M as compared with the substrate concentration, in
this case 0.0200 M (20 mM) of VK1. And therefore at such low water concentrations,
the most suitable explanation for the lack of the second reduction process is that
inadequate hydrogen-bonding led to the reduced solubility of the dianion and as a
result, the dianion interacts with the electrode surface in a specific manner causing an
adsorptive effect.
6.2.3 IR Spectroscopy of Vitamin K1 in CH3CN with the Addition of Large Amounts
of Water
Because the IR spectra obtained during controlled potential electrolysis
experiments showed that the second reduction step for VK1 cannot proceed when dry
CH3CN solution was used, experiments were performed by adding large amounts of
water into the CH3CN solutions. Electrolysis experiments were then carried out with
the aim of observing any shift of the IR bands, especially for the second reduction step
CHAPTER 6
142
where the dianion is understood to form strong hydrogen-bonds with water. IR spectra
shown in Figure 5 indicate that with the addition of water to the dry VK1 solution, the
electrolysis experiments that were carried out were able to go to completion, which
indirectly affirms the fact that hydrogen-bonding between the dianion and water
molecules is an important interaction that is required for the second reduction step to
proceed. Figure 5 shows FTIR spectra obtained during the electrolysis of VK1 in the
presence of increasing amounts of water. Unfortunately in the presence of extremely
high concentrations of water (> 0.2 M) the bands associated with VK1 suffer from
excessive interference from the bands associated with free water, even when
background subtracted spectra were used.
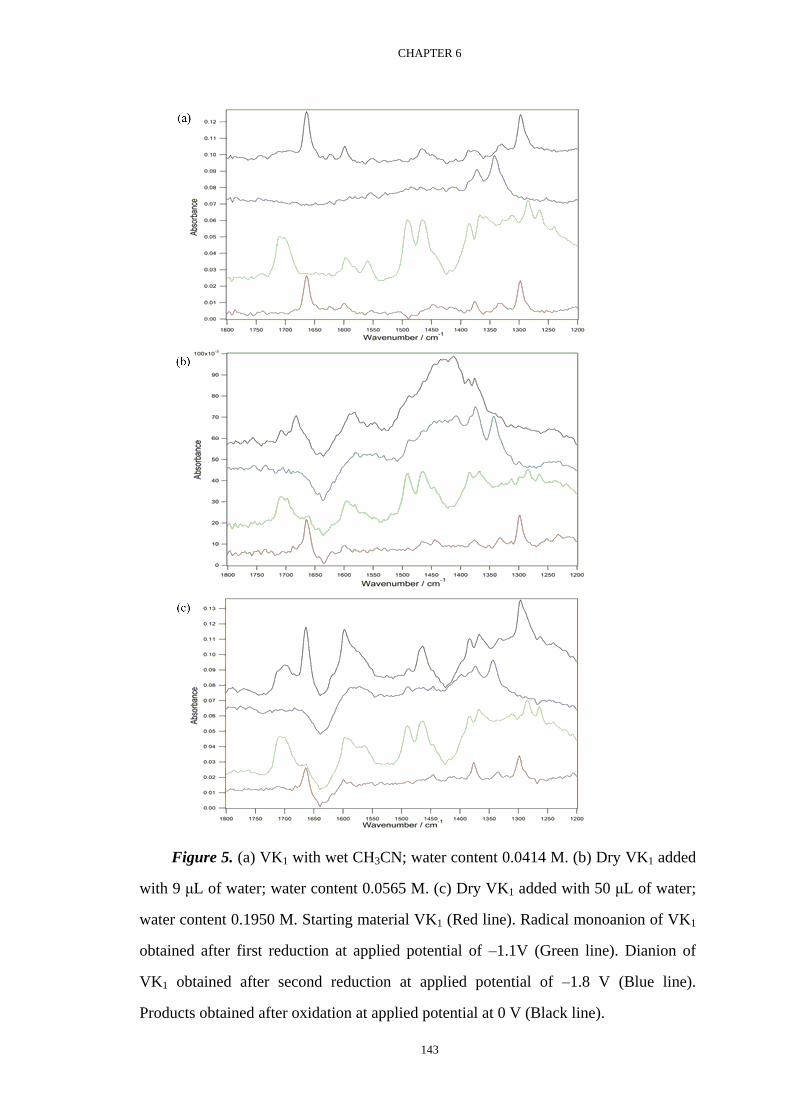
CHAPTER 6
143
Figure 5. (a) VK1 with wet CH3CN; water content 0.0414 M. (b) Dry VK1 added
with 9 μL of water; water content 0.0565 M. (c) Dry VK1 added with 50 μL of water;
water content 0.1950 M. Starting material VK1 (Red line). Radical monoanion of VK1
obtained after first reduction at applied potential of –1.1V (Green line). Dianion of
VK1 obtained after second reduction at applied potential of –1.8 V (Blue line).
Products obtained after oxidation at applied potential at 0 V (Black line).

CHAPTER 6
144
In order to find out the affect on the IR spectra for the first and second reductions
through the addition of different volumes of water to the VK1 solution, IR spectra for
different concentrations of water were compared. Figure 6 shows the bands between
1740 cm–1
and 1420 cm–1
for the first reduction process, and the bands between 1500
cm–1
and 1300 cm–1
for second reduction process in the presence of different amounts
of water.
Figure 6. IR spectra for the (a) first and (b) second reduction processes of VK1.
(Solid lines) Dry VK1 solution with 50 μL of water; water content = 0.1950 M.
(Dotted lines) Dry VK1 solution with 9 μL of water; water content = 0.0565 M.
(Dashed lines) VK1 solution with wet CH3CN; water content = 0.0414 M.

CHAPTER 6
145
Looking at the main IR bands belonging to the radical monoanion in Figure 6(a),
which includes the overlapping bands for both C=O (1710 cm–1
, 1702 cm–1
) and C=C
(1598 cm–1
, 1565 cm–1
) as well as the two C–O bands at 1492 cm–1
and 1465 cm–1
, it
is observed that there are no noticeable changes to the positions of those IR bands even
though water was added to the dry VK1 solution. This is expected since it is
understood that the oxygen atoms on the monoanion are not sufficiently
electronegative for the radical monoanion to be able to undergo significant
hydrogen-bonding with water. Therefore even with the addition of water, there will be
insignificant changes to the behavior of monoanion since there is little
hydrogen-bonding occurs between the monoanion and water molecules.
The CV results obtained in the previous studies have shown that when the water
concentration in VK1 solution was gradually increased, the potential of the second
reduction process shifts by a more significant amount as compared to that of the first
reduction potential (Chapters 3 and 4).6 Therefore, the IR spectra obtained for the
second reduction step would be expected to show significant changes when the water
concentration of the VK1 solution is varied by adding water. Because the C–O bonds
in the dianion are considerably weakened due to the strong hydrogen-bonding
interactions between the dianion and the water molecules, the two C–O bands in the
dianion which were located at lower wavenumbers (1371 cm–1
, 1343 cm–1
) as
compared to the two C–O bands in the radical monoanion (1492 cm–1
, 1465 cm–1
).
Therefore, it is predicted that the two C–O bands would shift towards lower
wavenumbers as a result of the greater degree of hydrogen bonding when the water

CHAPTER 6
146
concentration increases.
The two C–O IR spectra for the second reduction step shown in Figure 6(b) were
inspected carefully showed no difference in wavenumber as the water content was
varied. This finding may be due to how the water content was not able to be varied
over a significantly wide range in order to observe an effect, and due to uncertainty in
the true position of the C–O bands.
6.2.4 Effect of Water on the Apparent Absorbance Intensity of Vitamin K1
An interesting effect was observed when increasing amounts of water were added
to the CH3CN solutions. Looking at the IR spectra obtained in Figure 7(a), it was
discovered that there is a dramatic increase in the intensities of the VK1 bands even
though the volume of water added to the solution was very small as compared to the
total volume of the VK1 solution. Only 0.01 mL (10 μL) of water was added to 5 mL
of the solution each time, meaning that the volume of the VK1 solution is 500 times
that of the volume of water added. However, it is clear from the spectra that even with
the addition of such a low volume of water; the IR bands for VK1 became much
stronger and more intense as though somehow the ATR probe is detecting more of the
VK1.

CHAPTER 6
147
Figure 7. In-situ IR spectra obtained during the sequential addition of water to 5
mL of 20 mM VK1 solution prepared (a) with wet CH3CN; (b) with dry CH3CN
without Bu4NPF6; (c) IR spectra obtained in transmittance mode during the sequential
addition of water to 5 mL of 20 mM VK1 solution prepared with dry CH3CN without
Bu4NPF6. 10 μL of water was added each time until a total volume of 100 μL was
added into the solution. (Red line) VK1 solution with 0 μL water added. (Black line)
VK1 solution with 10 – 90 μL water added. (Blue line) VK1 solution with 100 μL
water added.

CHAPTER 6
148
In order to verify this unique result obtained, this experiment was repeated again
but with dry CH3CN as solvent and without the presence of supporting electrolyte to
see if the same effect can be attained. Figure 7(b) shows that the same result was
obtained and it can be seen that the overall increment in the absorbance (by comparing
the red and the blue lines) is slightly greater than that when the wet CH3CN is used.
This is an indication that the increased sensitivity of the ATR probe towards VK1 is
most likely due to the presence of water that is being added. The fact that with the
addition of only 100 μL of water, the intensity of the VK1 absorbance is able to
increase almost twenty-fold seems to be suggesting that there exists a unique form of
interaction between VK1 and water.
IR spectroscopy in the transmittance mode was used to repeat the same
experiment to see if the same results can be obtained or that such an observation was
only exclusive to ATR. Figure 7(c) shows the IR data obtained when transmittance
mode is used and the spectra shows that the VK1 peaks did not increase; only the water
peak at 1637 cm–1
increased correspondingly with the sequential addition of water into
the VK1 solution. The results shown in Figures 7 indicate that only the ATR probe is
capable of sensing the unique manner in which VK1 is interacting with water.
The structure of VK1 contains two C=O bonds and it is understood that the C=O
bonds are able to form hydrogen bonds with water molecules. There, it could be
argued that hydrogen bonding interactions are somehow allowing the ATR probe to be
more sensitive to the VK1 present, and thereby increasing the intensities of the IR
bands. To test this theory out, the same procedure was produced on the compound,

CHAPTER 6
149
Dimethyl terephthalate (DMT) (Scheme 2(a)), which has two C=O bonds like VK1.
Scheme 2. The structures of (a) Dimethyl terephthalate and (b) VK1 model
compound.
Figure 8 shows that for DMT, the band at 1725 cm–1
is assigned to C=O and it is
obvious from the IR data that with the addition of water to the solution, the main C=O
band shows no increase in intensity at all; only the intensity belonging to the water
peak at 1637 cm–1
is increasing. This result suggests that hydrogen bonding may not
be the factor that is responsible for the effect of water on the VK1 IR bands.

CHAPTER 6
150
Figure 8. In-situ IR spectra obtained during the sequential addition of water to 5
mL of 20 mM DMT solution prepared with dry CH3CN without Bu4NPF6. 10 μL was
added each time until a total volume of 100 μL was added into the solution. (Red line)
DMT solution with 0 μL water added. (Black line) DMT solution with 10 – 90 μL
water added. (Blue line) DMT solution with 100 μL water added.
FTIR experiments were performed on the VK1 model compound (without the
phytyl tail) (Scheme 2(b)) to determine whether the presence of the phytyl tail was
somehow influencing the ATR-FTIR results. Cyclic voltammetry experiments were
first carried out with the VK1 model compound and it was found that it displayed the
same voltammetric behavior when water was added sequentially to the solution as
observed for VK1 (Figure 9). Using the peak separation data obtained for the model
compound, calibration graphs of peak separations versus water concentration were
also plotted and they were found to be similar to those of VK1 (Figure 10).
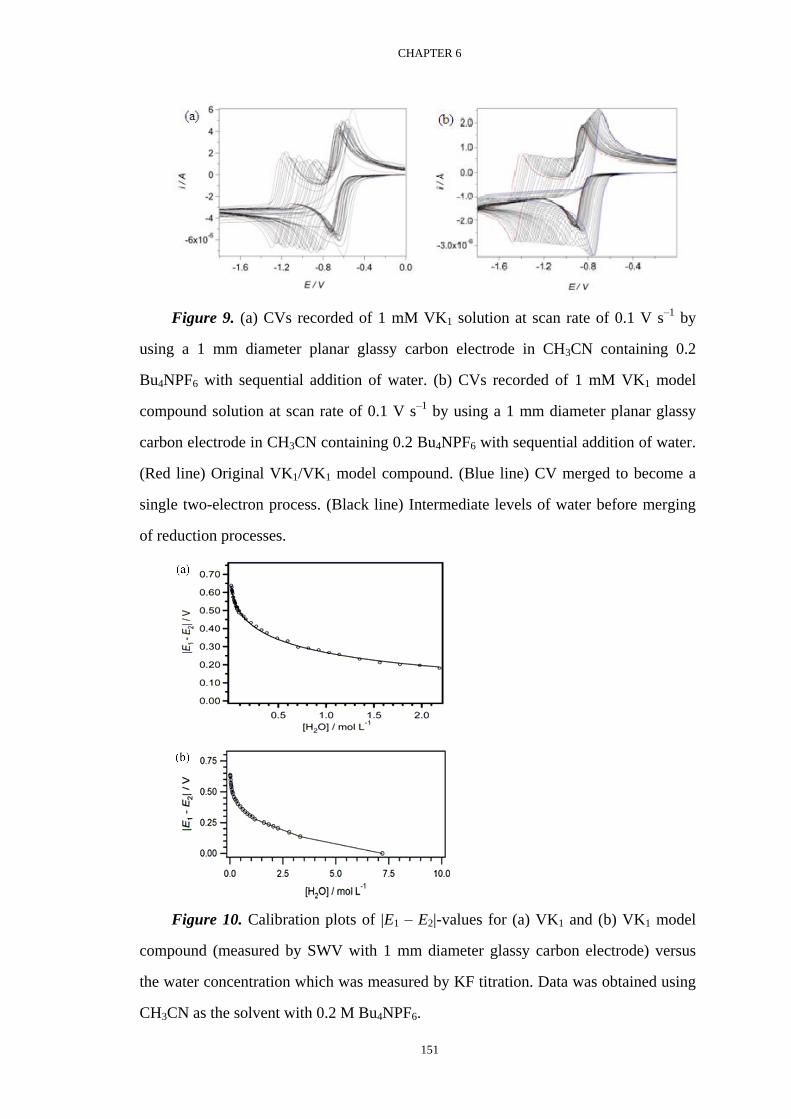
CHAPTER 6
151
Figure 9. (a) CVs recorded of 1 mM VK1 solution at scan rate of 0.1 V s–1
by
using a 1 mm diameter planar glassy carbon electrode in CH3CN containing 0.2
Bu4NPF6 with sequential addition of water. (b) CVs recorded of 1 mM VK1 model
compound solution at scan rate of 0.1 V s–1
by using a 1 mm diameter planar glassy
carbon electrode in CH3CN containing 0.2 Bu4NPF6 with sequential addition of water.
(Red line) Original VK1/VK1 model compound. (Blue line) CV merged to become a
single two-electron process. (Black line) Intermediate levels of water before merging
of reduction processes.
Figure 10. Calibration plots of |E1 – E2|-values for (a) VK1 and (b) VK1 model
compound (measured by SWV with 1 mm diameter glassy carbon electrode) versus
the water concentration which was measured by KF titration. Data was obtained using
CH3CN as the solvent with 0.2 M Bu4NPF6.

CHAPTER 6
152
From Figures 9 and 10, it is firmly established that the electrochemical properties
of VK1 model compound are similar to that of VK1. Like the reduced forms of VK1,
the reduced species of VK1 model compound are also capable of forming
hydrogen-bonding interactions with water and likewise, as Figure 9(b) shows, the
potential of the second reduction process is found to shift by a larger amount than the
first reduction potential, such that at adequately high water concentrations, the two
processes merge into a single two-electron process. As for the calibration plots, the
trend of peak separations decreasing with increasing water concentrations for both
VK1 and VK1 model compound are also demonstrated to be similar as shown in Figure
10. Therefore, if we were to attribute the effect water has on the absorbance of VK1
peaks to hydrogen-bonding interactions with water, then hypothetically the same effect
should also be seen on the VK1 model compound since it is evident that they both
share similar electrochemistry.
The distinct peak at 1663 cm–1
located on the red line in Figure 11 is assigned to
the C=O bond in the VK1 model compound structure. From the IR spectra obtained, it
is basically the water peak at 1637 cm–1
that is increasing in intensity in response to
the increasing volume of water in the solution, whereas the intensities of the C=O IR
peaks are not shown to be affected by the extra volumes of water being added
sequentially. Hence, judging from the IR results that have been acquired for both DMT
and VK1 model compound, it can be ascertained that the increased intensities of VK1
peaks (Figure 7) due to the adding of water into the solution cannot be caused by
hydrogen-bonding interactions.

CHAPTER 6
153
Figure 11. In-situ IR data obtained during the sequential addition of water to 5
mL of 20 mM VK1 model compound solution prepared with dry CH3CN without
Bu4NPF6. 10 μL was added each time until a total volume of 100 μL was added into
the solution. (Red line) VK1 model compound solution with 0 μL water added. (Black
line) VK1 model compound solution with 10 – 90 μL water added. (Blue line) VK1
model compound solution with 100 μL water added.
VK1 exists in as yellow liquid oil at 293 K (the temperature at which all
experiments is carried out) and it is understood that oil and water are immiscible when
added together. In addition, it was observed that the solution would turn cloudy
whenever water was added to the solution using a micropipette but after stirring and
then allowing the mixture to settle, the solution became clear again. Building on this
observation and the understanding regarding the immiscibility of oil and water, it
could be deduced that by introducing more water into the CH3CN solution containing

CHAPTER 6
154
VK1 causes the VK1 to form small oil droplets. As a result of this solubility effect, it is
likely that the VK1 forms micro-particles, which in turn are interacting more with the
ATR probe at the inter-facial surface of the solution. This effect consequently leads to
a heightened sensitivity of the ATR probe towards VK1, which translates into a
dramatic increase in the intensity of the IR bands in the VK1 spectrum.
6.3 Conclusions
In-situ ATR-FTIR experiments were performed during the electrochemical
reduction of VK1 in CH3CN in the presence of varying concentrations of water. It was
found that FTIR spectrum VK1–•
showed intense bands at 1710 and 1702 cm–1
that
were associated with the carbonyl resonances and bands at 1598 and 1582 cm–1
that
were associated with symmetric and asymmetric C=C ring stretches. The FTIR
spectrum of the dianion showed no bands in the carbonyl region and no recognizable
ring stretching bands, although bands associated with the C–O group were possibly
observed at 1373 and 1343 cm–1
. ATR-FTIR measurements of the anion radical and
dianion at varying quantities of water did not lead to show any differences in the
position of the absorbance.
Some interesting features were observed during the in-situ electrolysis
experiments. Firstly, it was found that at very low concentrations of water, the
electrolysis reaction to form the dianion did not progress. The reason is thought to be
due to the solubility of the (non-hydrogen-bonded) dianion being so low that it
precipitates from solution and blocks the electrode surface. The second observation is

CHAPTER 6
155
that during the electrolysis experiments the water content of the cathode compartment
increases over time, while the water content of the auxiliary electrode compartment
decreases (with the water content measured by KF titrations). The reason for this
observation is thought to relate to the anion radical and dianion interacting with water,
thereby increasing the transfer of water across the glass membrane interface separating
the working electrode and auxiliary electrode.

CHAPTER 6
156
References
1. Colthup, N. B.; Daly, L. H.; Wiberley, S. H. Introduction to Infrared and Raman
Spectroscopy, 3rd ed. New York: Academic Press, 1990.
2. Vitamin K and Vitamin K-Dependent Proteins: Analytical, Physiological, and
Clinical Aspects; Shearer, M. J., Seghatchian, M. J., Eds.; CRC Press: Boca Raton, FL,
1993.
3. Girlando, A.; Pecile, C. J. Mol. Spectrosc. 1979, 77, 374.
4. Flaig, W.; Salfeld, J. C. Ann. Chem. 1959, 626, 215.
5. Bauscher, M.; Mantele, W. J. Phys. Chem. 1992, 96, 11101–11108.
6. Hui, Y.; Chng, E. L. K.; Chng, C. Y. L.; Poh, H. L.; Webster, R. D. J. Am. Chem.
Soc. 2009, 131, 1523–1534.

CHAPTER 7
157
Chapter 7
An Electrode-Supported Biomembrane for Examining
Electron Transfer and Ion Transfer Reactions of Vitamin K1
7.1 Introduction
Many low molecular weight (< 1000 g mol–1
) lipid soluble naturally occurring
biological molecules, such as vitamin K, are thought to undergo electron transfer
reactions as part of their natural function.1-3
While the procedures for examining
electron transfer reactions of solution phase species are well-established,4 there are
experimental difficulties in studying the electrochemical properties of vitamin K in an
environment similar to where it exists naturally; that is, inside lipid bilayer membranes.
The primary difficulties relate to the ion-transfer processes that must occur
simultaneously to the electron-transfer steps in order to maintain overall charge
neutrality, and the non-ideal solvent properties (in an electrochemical sense) of the
biomembranes. In this Chapter a procedure is described that enables voltammetry
experiments to be performed directly on bilayer membrane bound molecules.
Vitamin K1 (VK1), phylloquinone, chemically known as
2-methyl-1,4-nephthoquinone; acts as a crucial cofactor for the formation of
coagulation factors II (prothrombin), VII, IX and X by the liver which are required for
blood-clotting. VK1 acts as a cofactor through electrochemical reactions where
naphthoquinone, the key functional group of the entire molecular structure; undergoes

CHAPTER 7
158
proton and electron transfers. Since the quinone structure is found in all the compounds
of the vitamin K family, the redox reaction results observed in this experiment will most
likely be similar for all K-vitamins. Being a fat-soluble compound, VK1 and its reduced
forms exist inside the hydrophobic cell membranes. This property is due to the
lipophilic side chain of the vitamin structure that allows it to be soluble in lipid mediums
such as lecithin, squalene and cholesterol.
In this Chapter, the redox reactions of VK1 in an emulsion layer consisting of
lecithin and water will be discussed. Lecithin forms a bilayer membrane structure and
VK1 can be embedded inside the membrane. The reason for using lecithin is to keep
VK1 attached to a GC electrode surface at all times and at the same time; providing a
lipid environment, which has some similarities to its biological environment when in the
human body.
In recent years there have been considerable advances made in examining the
electrochemical properties of high molecular weight biological molecules such as
proteins and enzymes usually by chemically modifying the surface of a solid electrode
to encourage an interaction between the solution phase macromolecule and the
surface-modified electrode.5-10
For protein-sized molecules, maintaining
electroneutrality during the electron transfer process is not usually problematic, because
the bulk of the macromolecule lies outside of the surface confined layers, thus ions from
solution are easily able to balance the charge brought about by the electron transfer
reactions initiated at the electrode surface. However, for small molecules located
completely inside the bilayer membranes, the movement of ions is more difficult

CHAPTER 7
159
because of the hydrophobic nature of the membranes which hinders ion transfer across
the membrane-aqueous solution interface. Nevertheless, there have been important
advances made in using electrochemistry to initiate and study ion transfer reactions
across interfaces where ions would be expected to have very low solubility. For example,
voltammetric techniques have been used to reversibly insert ions into microcrystals
across a solid-solution interface,11
and ion-transfer processes have been initiated at
liquid-liquid (solvent) interfaces,12
where in some cases one of the liquids is a viscous
oil type droplet,13-15
with similar solubility properties to a hydrophobic membrane.
There are two major methods that have been developed to study electron-transfer
reactions of low molecular weight molecules incorporated inside membrane
environments using supported bilayer membranes (s-BLMs). In one instance, a solid
electrode is first coated with a self-assembled monolayer (SAM), such as an
alkanethiol,16-21
and then a solution containing the molecule of interest and another
bilayer forming molecule are allowed to spontaneously interact and form a membrane
by attaching themselves to the tethered portion [a tethered bilayer membrane
(t-BLM)].22-35
An alternative procedure simply involves placing a droplet of a volatile
organic solvent (such as chloroform) that contains membrane forming molecules onto
the surface of the electrode and allowing the bilayer to form during the evaporation
process,7-9,35-39
or allowing a clean electrode surface (such as a freshly cut Pt electrode)
to come into contact with bilayer forming molecules in aqueous solution.40-43
In order to
improve the conductivity properties of the membrane, there are several reports where
low molecular weight molecules such as TCNQ are incorporated into the s-BLM in

CHAPTER 7
160
order to promote the transfer of an electron through the membrane to a solution phase
species (a mediated electron transfer).17,35,44-51
One major issue with interpreting the results from electrochemical studies on
s-BLMs is that defect free bilayer membranes will only form on glass substrates, with
metallic and carbon surfaces being poor substrates to obtain ideal membrane coverage.52
Similarly, even with tethered molecules attached to the electrode surface, such as
self-assembled layers of alkanethiols, it is highly likely that pin-holes will exist in the
layers.16,53
The presence of pin-holes or defects in the SAMs or s-BLMs means that it is
often difficult to determine whether the Faradaic current that is observed during
voltammetric measurements is due to the electroactive molecules confined inside the
membrane layers, or due to electron transfer reactions that occur between the electrode
surface and solution phase molecules that reside in the defects (or channels) in the
membrane coating.
In order to overcome the uncertainty of the presence of pin-holes in the s-BLM,
this study has developed an alternative approach where the biological molecules are first
incorporated into liposomes, and then the liposomes are deposited on the surface of a
chemically modified electrode to spontaneously form multilayers. Using this procedure
it is not critical for the electrode to be perfectly coated, since any pin-holes or defects
will only incorporate the electrolyte ions, whereas the electroactive molecules will
remain completely encapsulated within the membrane structure. VK154-58
that exists
naturally within lipid bilayer membranes was chosen to examine because it undergoes
redox reactions as part of its modus operandi and there exists extensive literature reports

CHAPTER 7
161
of the voltammetric properties of it in both organic solvents54,57-68
and as an oil attached
to electrodes in aqueous solutions. 54-56,69
Chart 1. Structure of membrane forming molecules.
7.2 Results and Discussion
7.2.1 Preparation of Electrode Surfaces
The electrodes were polished consecutively with P400 (35 μm) P1200 (15.3 μm)
P2000 (10.3 μm) and P4000 (6.5 μm) grades of SiC paper followed by polishing with
3 μm and 1 μm grit alumina oxide powder on Buehler Ultra-Pad polishing cloths.
The procedure for preparing the vitamins inside the lipid (lecithin) multilayers
was based on literature methods.54,70
The VK1 (0.01 g) and lecithin (0.09 g) were
combined in 2 mL of chloroform in a vial and placed in a vortex mixture for 1 minute
(a clear solution was obtained). The chloroform was slowly removed (~20 minutes)

CHAPTER 7
162
with a rotary evaporator and the VK1/lecithin mixture dried under vacuum at room
temperature (22 ± 2 oC) for 2 hours. 4 mL of ultrapure water was added to the
VK1/lecithin mixture and the slurry heated to 40 oC. The slurry was placed in a vortex
mixer for 30 minutes, periodically reheating the solution so that it remained at 40 ± 5
oC, and then the solution was finally homogenized in an ultrasonic bath at 40
oC for 10
minutes and appeared as a milky white consistency.
In order to provide an optimal droplet size to completely coat the electrode,
different μL-sized volumes of the solutions that contained the materials for coating the
electrodes were used depending on the size of the electrode to be coated. A 1-μL
coating drop volume was used for the 1 mm diameter electrodes and a 2-μL coating
drop volume was used for the 3 mm diameter electrodes. A 1-μL or 2-μL droplet of the
Nafion solution was placed on the electrode surface with a micropipette and the
solvent allowed to evaporate in air for 5 minutes. A 1-μL or 2-μL aliquot of the
homogenized VK1/lecithin solution was deposited on top of the Nafion coated
electrode surface and the water allowed to evaporate in air (around 5 minutes), to
produce a multilayer film containing 22.5 – 45 μg of lecithin and 2.5 – 5 μg of the VK1.
Three further 1-μL or 2-μL droplets of the Nafion solution were deposited on top of
the VK1/lecithin multilayer, with the solvent allowed to evaporate for 5 minutes after
each addition. The optimal coating procedure described above was determined by a
number of trial and error experiments.

CHAPTER 7
163
7.2.2 Preparation of Membranes and Electrodes for Electrochemistry
Previous studies described experiments where TCNQ35
or vitamin E54
were
incorporated inside lecithin layers and deposited on Au or GC electrode surfaces.
Refined lecithin was chosen for the lipid bilayers because it is a naturally occurring
phospholipid present in plant and animal tissues. Lecithin consists of a range of lipid
acyl chain lengths (in addition to the phosphatidylcholine shown in Chart 1) which
favors the formation of bilayer membranes that are perfectly aligned and defect free.71-74
Thus, once the homogenized liposome solutions are placed on the electrode surface,
they spontaneously form highly ordered multilamellar phases interleaved with layers of
solvent molecules. Based on the amount of lecithin deposited on the electrode surface,
and comparing previous FTIR measurements of lecithin coated electrodes,35
it can be
estimated that the electrodes used in this work contained on average between 5 – 10
lecithin bilayers making up the multilamellar lipid phases on the electrode surface.

CHAPTER 7
164
Figure 1. Schematic diagram showing proposed structure of
electrode|Nafion|lecithin-vitamin|Nafion|water interfaces.
In order to improve the voltammetric responses, the electrode coating procedure
described above was modified by the addition of a Nafion layer onto the electrode
surface, with another Nafion layer deposited on top of the lecithin multilayers, to form a
sandwich structure (Figure 1). Nafion is a cation-exchange polymer with a highly acidic
sulfonate group (Chart 1). Electrodes coated with Nafion (and other surface confined
molecules) have frequently been used to trap or concentrate solution phase species and
thereby improve their analytical detection.75-77
In this work the Nafion layers are thought
to have two functions; (i) to improve the ion conduction between the electrode surface
and the lecithin multilayers and, (ii) to provide a readily exchangeable source of H+ to

CHAPTER 7
165
molecules within the membranes in order to balance the charge brought about by
electrochemical reactions.
7.2.3 Voltammetry of Vitamin K1
Figure 2a (solid line) shows a CV of the quinone, VK1, in acetonitrile (CH3CN)
solutions containing approximately 50 mM of water. Two reduction processes are
observed corresponding to the one-electron reduction of the quinone into its radical
anion (semiquinone) (E1) and at more negative potentials the further one-electron
reduction of the semiquinone into its dianion (E2).57
When water is increasingly added
to the CH3CN, both E1 and E2 shift to more positive potentials, but E2 shifts more than
E1, so at high enough water concentrations the two one-electron reduction processes
merge into one two-electron process (E3) (Figure 2a, dashed line).58
The reason that E1
and E2 shift in potential is due to hydrogen-bonding reactions of the reduced forms of
VK1 with water in the solvent.57,58,78

CHAPTER 7
166
Figure 2. Cyclic voltammograms recorded at a scan rate of 0.1 V s–1
at 22 ± 2 oC.
(a) 1 mM VK1 in CH3CN containing 0.2 M Bu4NPF6 at a 1 mm diameter planar Pt
electrode, (___
) in the presence of 0.05 M water, and (---) in the presence of 7 M water. (b)
5 μg of VK1 inside Nafion|lecithin|Nafion layers deposited on a 3 mm diameter planar
GC electrode in a pH 3 buffered solution.
In the presence of acid, VK1 can be electrochemically reduced in a chemically
reversible two-electron process to form the vitamin K1 hydroquinone (VK1H2), typical
of the reduction mechanism of quinones in acidic conditions.78
Therefore, two
one-electron reduction processes are only observed in organic solvents containing
limited amounts of water, while in the presence of acid or in aqueous systems, one
two-electron reduction process is always observed.78,79
The “square-scheme”
mechanism containing the individual electron transfer and chemical steps for the

CHAPTER 7
167
reduction of quinones (Q) in acidic conditions and in the presence of water are given in
Schemes 2 and 3 respectively. The vertical arrows in Schemes 2 and 3 involve electron
transfer steps, while the horizontal arrows involve homogeneous reactions with H+ or
H2O. At pH < 7 the reactions in Scheme 2 will mainly occur, while at pH > 7 the
reactions in Scheme 3 will mainly occur, depending on the pKa‟s of all the individual
species. In unbuffered solutions of approximately neutral pH, the protons released
during the oxidation of the hydroquinones (QH2) can sufficiently decrease the localized
pH at the electrode surface to give similar voltammetric results to those obtained in
more acidic bulk conditions.79

CHAPTER 7
168
R1
R2
R4
R3
O
O
R1
R2
R4
R3
OH
O
R1
R2
R4
R3
OH
OH
+ H+
- H+
- e- + e- - e- + e- - e- + e-
R1
R2
R4
R3
O
O
R1
R2
R4
R3
OH
O
R1
R2
R4
R3
OH
OH
- e- + e- - e- + e- - e- + e-
R1
R2
R4
R3
O
O
R1
R2
R4
R3
OH
O
R1
R2
R4
R3
OH
OH
+ H+
- H+
+ H+
- H+
+ H+
- H+
+ H+
- H+
+ H+
- H+
Q QH+ QH22+
QH2+QHQ
Q2- QH QH2
Scheme 2. Electrochemical square-scheme mechanism showing series of possible
consecutive electron-transfer and proton-transfer reactions associated with the
chemically reversible transformation between quinones (Q) and hydroquinones (QH2)
in acidic conditions.
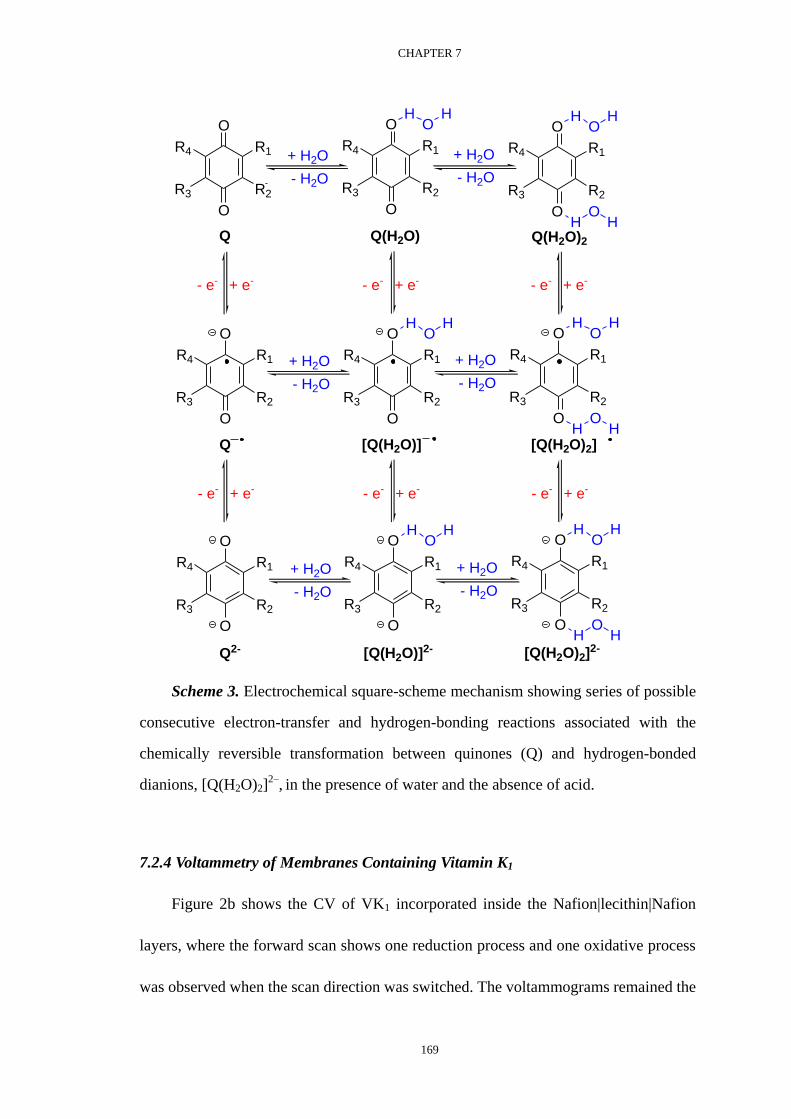
CHAPTER 7
169
R1
R2
R4
R3
O
O
R1
R2
R4
R3
O
O
HO
H
R1
R2
R4
R3
O
O
HO
H
+ H2O
- H2O
+ H2O
- H2O
HO
H
R1
R2
R4
R3
O
O
R1
R2
R4
R3
O
O
HO
H
R1
R2
R4
R3
O
O
HO
H
+ H2O
- H2O
+ H2O
- H2O
HO
H
R1
R2
R4
R3
O
O
R1
R2
R4
R3
O
O
HO
H
R1
R2
R4
R3
O
O
HO
H
+ H2O
- H2O
+ H2O
- H2O
HO
H
- e- + e- - e- + e- - e- + e-
- e- + e- - e- + e- - e- + e-
Q Q(H2O) Q(H2O)2
[Q(H2O)2][Q(H2O)]Q
Q2- [Q(H2O)]2- [Q(H2O)2]2-
Scheme 3. Electrochemical square-scheme mechanism showing series of possible
consecutive electron-transfer and hydrogen-bonding reactions associated with the
chemically reversible transformation between quinones (Q) and hydrogen-bonded
dianions, [Q(H2O)2]2–
, in the presence of water and the absence of acid.
7.2.4 Voltammetry of Membranes Containing Vitamin K1
Figure 2b shows the CV of VK1 incorporated inside the Nafion|lecithin|Nafion
layers, where the forward scan shows one reduction process and one oxidative process
was observed when the scan direction was switched. The voltammograms remained the

CHAPTER 7
170
same as multiple scans were performed, indicating that the reductive and oxidative
processes were chemically reversible.
Figure 3. Cyclic voltammograms (second scan) recorded at a scan rate of 0.5 V s–1
of films of VK1 deposited on a 3 mm diameter planar GC electrode at 22 ± 2 oC. (a) 5 μg
of VK1 inside Nafion|lecithin|Nafion layers. (b) 5 μg of VK1 inside lecithin layers.
Figure 3a shows the CVs obtained for the Nafion|lecithin-VK1|Nafion layers at
different bulk solution pH values and Figure 3b show CVs of VK1-lecithin layers
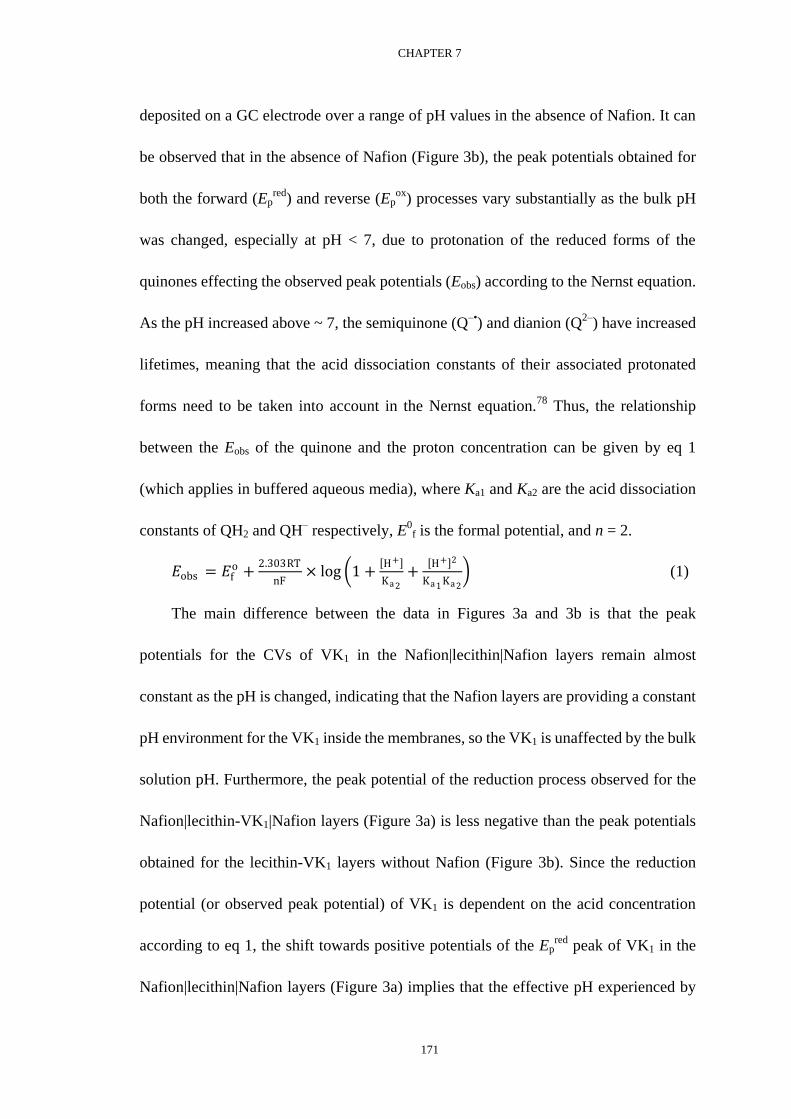
CHAPTER 7
171
deposited on a GC electrode over a range of pH values in the absence of Nafion. It can
be observed that in the absence of Nafion (Figure 3b), the peak potentials obtained for
both the forward (Epred
) and reverse (Epox
) processes vary substantially as the bulk pH
was changed, especially at pH < 7, due to protonation of the reduced forms of the
quinones effecting the observed peak potentials (Eobs) according to the Nernst equation.
As the pH increased above ~ 7, the semiquinone (Q–•
) and dianion (Q2–
) have increased
lifetimes, meaning that the acid dissociation constants of their associated protonated
forms need to be taken into account in the Nernst equation.78
Thus, the relationship
between the Eobs of the quinone and the proton concentration can be given by eq 1
(which applies in buffered aqueous media), where Ka1 and Ka2 are the acid dissociation
constants of QH2 and QH– respectively, E
0f is the formal potential, and n = 2.
𝐸obs = 𝐸fo +
2.303RT
nF× log 1 +
H+
Ka 2
+ H+ 2
Ka 1 Ka 2
(1)
The main difference between the data in Figures 3a and 3b is that the peak
potentials for the CVs of VK1 in the Nafion|lecithin|Nafion layers remain almost
constant as the pH is changed, indicating that the Nafion layers are providing a constant
pH environment for the VK1 inside the membranes, so the VK1 is unaffected by the bulk
solution pH. Furthermore, the peak potential of the reduction process observed for the
Nafion|lecithin-VK1|Nafion layers (Figure 3a) is less negative than the peak potentials
obtained for the lecithin-VK1 layers without Nafion (Figure 3b). Since the reduction
potential (or observed peak potential) of VK1 is dependent on the acid concentration
according to eq 1, the shift towards positive potentials of the Epred
peak of VK1 in the
Nafion|lecithin|Nafion layers (Figure 3a) implies that the effective pH experienced by

CHAPTER 7
172
VK1 is < 3, regardless of the bulk solution pH. Thus, all the processes shown in Figure
3a are likely to involve a chemically reversible 2e–/2H
+ reaction and follow the
mechanism in Scheme 2 (eqs 2 and 4). In contrast, the voltammograms obtained of
lecithin-VK1 films (without Nafion) in Figure 3b are likely to follow the reactions in
Scheme 2 at lower pH (eqs 2 and 4), and the reactions in Scheme 3 at higher pH (eqs 3
and 5).
VK1 + 2e– + 2H
+ → VK1H2 Process D1′ (2)
VK1 + 2e– + xH2O → [VK1(H2O)x]
2– Process D1″ (3)
VK1H2 – 2e– – 2H
+ → VK1 Process D2′ (4)
[VK1(H2O)x]2–
– 2e– – xH2O
→ VK1 Process D2″ (5)
Variable scan rate CVs of Nafion|lecithin-VK1|Nafion layers are given in Figure 4,
which display a particularly wide cathodic to anodic peak-to-peak potential separation
(ΔEpp) at all scan rates, which is also observed when films of VK1 are directly deposited
on the electrode surface56
or when VK1 is attached to an electrode surface by an
alkanethiol linkage (and the voltammograms conducted in aqueous solutions).80,81
It is
not believed that the resistance property of the membranes is responsible for the wide
separation between the forward and reverse peaks. Instead, the reason for the wide
separation between the reductive and oxidative peaks with increasing scan rate could
relate to either slow heterogeneous electron transfer of one or more of the electron
transfer steps in Scheme 2, or slow homogeneous chemical reactions with H+. It is also
likely that the relative high ΔEpp-value at slow scan rates is because the forward

CHAPTER 7
173
(reductive) and reverse (oxidative) reactions of VK1 occur by partly different routes
(Scheme 2).
Figure 4. Cyclic voltammograms (second scan) recorded at variable scan rates of 5
μg VK1 inside Nafion|lecithin|Nafion layers deposited on a 3 mm diameter planar GC
electrode and placed in a pH 3 buffered solutions at 22 ± 2 oC.
Based on the observation that the pH experienced by VK1 within the
Nafion|lecithin|Nafion layers is low, it can be assumed that the forward and reverse
reactions occur by two-electrons per molecule and also involve the transfer of
two-protons. In an acidic environment it is unlikely that the semiquinone can survive for
long enough to be detected using moderate scan rates. The reason that only one process
is observed for both the forward and the reverse reactions even though two one-electron
steps are involved, is because in both directions (reduction and oxidation), the second
one-electron transfer process occurs at a lesser potential than the first one-electron
transfer process, so the two electrons appear to transfer in one step.

CHAPTER 7
174
CV experiments were also conducted on the Nafion|lecithin-VK1|Nafion layers in
pH 13 buffers, with the results being substantially different from the data obtained
between pH 3 – 11. At a scan rate of 0.1 V s–1
(Figure 5a), two voltammetric processes
were observed on the first scan when the potential was applied in the negative direction,
one at approximately –0.4 (process D1′) and one at –0.7 V (process D1″) vs. Ag/AgCl.
The process at –0.4 V occurs at a similar potential to the reductive process observed
when experiments were conducted with bulk solution pH values between 3 – 11. An
oxidative peak was detected at close to 0 V vs. Ag/AgCl when the scan direction was
reversed (process D2′). Processes D1′ and D2′ are thus associated with the reduction of
the quinone (VK1) and oxidation of the hydroquinone (VK1H2), respectively (Q and
QH2 in Scheme 2). As multiple scans were performed, processes D1′/D2′ diminished and
processes D1″/D2″ increased in magnitude. When CV experiments were conducted at
pH 13 using VK1 directly attached to the electrode surface or incorporated into lecithin
layers (without Nafion), it was found that only processes D1″/D2″ were observed (Figure
5a, dashed line). Processes D1′ and D1″ both involve reduction of the VK1, but the shift
in potential is due to the quinone existing in a different environment. The shift in
potential to more negative potentials of process D1″ compared to process D1′ indicates
that the VK1 exists in a higher pH environment.
At high pH, processes D1″/D2″ most likely involve the transformation between the
quinone (VK1) and the hydrogen bonded dianion, [VK1(H2O)x]2–
(Scheme 3). Although
the peak-to-peak separation for processes D1″/D2″ is relatively small compared to the
wide ΔEpp-values obtained for processes D1′/D2′ at lower pH values, it is unlikely that it

CHAPTER 7
175
is because the electron transfer process occurs via only one-electron, such as a reversible
transformation between the quinone and semiquinone (Q/Q–•
). In the presence of water
the reduced forms of VK1 (VK1–•
and VK12–
) will undergo immediate hydrogen bonding
with water.57,58,78
So it is likely that processes D1″/D2″ also involve the transfer of
two-electrons (eqs 3 and 5).

CHAPTER 7
176
Figure 5. Cyclic voltammograms of 5 μg of VK1 inside Nafion|lecithin|Nafion
layers deposited on a 3 mm diameter planar GC electrode and placed in pH 13 buffered
solutions at 22 ± 2 oC.

CHAPTER 7
177
The results in Figure 5a indicate that the VK1 inside the Nafion|lecithin|Nafion
layers must undergo a change in environment as multiple CV scans are performed.
Initially the VK1 exists in a low pH environment controlled by the high acidity of Nafion.
However, in order for VK1H2 to convert into [VK1(H2O)x]2–
(as indicated by the
appearance of processes D1″/D2″), the pH within the Nafion layers must substantially
increase. At very high pH, the reduction cycle must be accompanied by a transfer of
hydroxide through the Nafion membranes, which could occur via pores in the Nafion
membrane structure.
Evidence of a relatively slow transfer of hydroxide into the membrane following
reduction of VK1 is supported by experiments conducted at pH 13 at variable scan rates
(Figure 5). As the scan rate increased (Figure 5a – 5d), there was a decrease in the rate of
conversion of the VK1 in an acidic environment (shown by processes D1′/D2′) compared
to VK1 in a basic environment (shown by the appearance of processes D1″/D2″). Once
the scan rate reached 2 V s–1
(Figure 5d), only processes D1′/D2′ were observed,
indicating that the quinone was chemically reversibly converted into the hydroquinone,
without being further converted into the hydrogen bonded dianion (the conversion
process from VK1H2 back to VK1 was sufficiently fast that it did not undergo
deprotonation).
7.3 Conclusions
This study has demonstrated that it is possible to construct membranes on electrode
surfaces that allow CV experiments to be performed over a wide potential range on

CHAPTER 7
178
molecules confined inside the membranes. The method should be applicable to all low
molecular weight biological molecules that exist in lipid bilayer membranes. The
membranes when constructed of Nafion|lecithin|Nafion layers allow reproducible
voltammograms to be obtained at moderately fast scan rates. The voltammetric results
indicate that the membranes have solvent like properties that allow both electron
transfer and ion transfer processes to occur. In all the experiments that were conducted
on VK1 within the Nafion|lecithin|Nafion layers, there was no evidence that the organic
molecule left the membrane. Instead, the balance in charge that was brought about by
the reduction and oxidation processes was controlled by the transfer of protons through
the Nafion layers. The function of Nafion is to interface with the hydrophilic groups of
the bilayer membranes and thereby provide an improved pathway for ion transfer
between the membranes and aqueous solutions.
VK1 undergo a series of electron and proton transfer reactions that can be
voltammetrically detected within the membranes. The processes are complicated but
can be interpreted based on previous voltammetry experiments of the compounds in
non-aqueous solvents54,57-68
and where the compounds are attached to the electrodes in
aqueous solutions.54-56,69
For bulk solution pH values between 3 – 11, the Nafion layers
were able to shield the membranes from the solution phase electrolytes and thereby
provide a constant and low pH environment for the molecules within the membranes
during the voltammetric experiments. At pH 13, hydroxide ions were able to enter the
membrane structure during slow voltammetric scanning experiments, while at faster
scan rates (ν > 2 V s–1
), the hydroxide was excluded from the membranes.
CHAPTER 7
179
References
1. Vitamin K and Vitamin K-Dependent Proteins: Analytical, Physiological and
Clinical Aspects; Shearer, M. J., Seghatchian, M. J., Eds.; CRC Press: Boca Raton, FL,
1993.
2. Blankenship, R. E. Molecular Mechanisms of Photosynthesis, 1st ed.; Blackwell
Science: Oxford, 2002. 3. Trumpower, B. L. Function of Quinones in Energy
Conserving Systems; Academic Press: New York, 1982.
4. Bard, A. J.; Faulkner, L. R. Electrochemical Methods: Fundamentals and
Applications, 2nd
ed.; Wiley: New York, 2001.
5. Rusling, J. F.; Nassar, A.-E. F. J. Am. Chem. Soc. 1993, 115, 11891–11897.
6. Nassar, A.-E. F.; Zhang, Z.; Hu, N.; Rusling, J. F.; Kumosinski, T. F. J. Phys.
Chem. B 1997, 101, 2224–2231.
7. Rusling, J. F. Acc. Chem. Res. 1998, 31, 363–369.
8. Armstrong, F. A.; Wilson, G. S. Electrochimica Acta 2000, 45, 2623–2645.
9. Hu, N. Pure Appl. Chem. 2001, 73, 1979–1991.
10. Jeuken, L. J. C.; Connell, S. D.; Henderson, P. J. F.; Gennis, R. B.; Evans, S.
D.; Bushby, R. J. J. Am. Chem. Soc. 2006, 128, 1711−1716.
11. Scholz, F.; Schröder, U.; Gulaboski, R. Electrochemistry of immobilized
particles and droplets; Springer: Berlin, 2005.
12. Dryfe, R. A. W. in Advances in Chemical Physics, Vol. 141; Rice, R. A., Ed.;
Wiley: New York, 2009, 153–215.

CHAPTER 7
180
13. Marken, F.; Webster, R. D.; Bull, S. D.; Davies, S. G. J. Electroanal. Chem.
1997, 437(1-2), 209–218.
14. Tasakorn, P.; Chen. J.; Aoki, K. J. Electroanal. Chem. 2002, 533, 119–126.
15. Banks, C. E.; Davies, T. J; Evans, R. G.; Hignett, G.; Wain, A. J.; Lawrence,
N. S.; Wadhawan, J. D.; Marken, F.; Compton, R. G. Phys. Chem. Chem. Phys. 2003,
5, 4053–4069.
16. Porter, M. D.; Bright, T. B.; Allara, D. L.; Chidsey, C. E. D. J. Am. Chem. Soc.
1987, 109, 3559−3568.
17. Diao, P.; Jiang, D. L.; Cui, X. L.; Gu, D. P.; Tong, R. T.; Zhong, B. Chin. Chem.
Lett. 1999, 10, 587–590.
18. Diao, P.; Guo, M.; Jiang, D.; Jia, Z.; Gu, D.; Tong, R.; Zhong, B. Colloids Surf.,
A 2000, 175, 203–206.
19. Bergren, A. J.; Porter, M. D. J. Electroanal. Chem. 2005, 585, 172–180.
20. Bergren, A. J.; Porter, M. D. J. Electroanal. Chem. 2006, 591, 189–200.
21. Bergren, A. J.; Porter, M. D. J. Electroanal. Chem. 2007, 599, 12–22.
22. Brink, G.; Schmitt, L.; Tampé, R.; Sackmann, E. Biochim. Biophys. Acta, Rev.
Biomembr. 1994, 1196, 227−230.
23. Williams, L. M.; Evans, S. D.; Flynn, T. M.; Marsh, A.; Knowles, P. F.;
Bushby, R. J.; Boden, N. Langmuir 1997, 13, 751−757.
24. Cheng, Y.; Boden, N.; Bushby, R. J.; Clarkson, S.; Evans, S. D.; Knowles, P. F.;
Marsh, A.; Miles, R. E. Langmuir 1998, 14, 839−844.

CHAPTER 7
181
25. Jenkins, A. T. A.; Boden, N.; Bushby, R. J.; Evans, S. D.; Knowles, P. F.; Miles,
R. E.; Ogier, S. D.; Schönherr, H.; Vancso, G. J. J. Am. Chem. Soc. 1999, 121,
5274−5280.
26. Jenkins, A. T. A.; Bushby, R. J.; Evans, S. D.; Knoll, W.; Offenhäusser, A.;
Ogier, S. D. Langmuir 2002, 18, 3176−3180.
27. Jeuken, L. J. C.; Connell, S. D.; Henderson, P. J. F.; Gennis, R. B.; Evans, S.
D.; Bushby, R. J. J. Am. Chem. Soc. 2006, 128, 1711−1716.
28. Bunjes, N.; Schmidt, E. K.; Jonczyk, A.; Rippmann, F.; Beyer, D.; Ringsdorf,
H.; Gräber, P.; Knoll, W.; Naumann, R. Langmuir 1997, 13, 6188−6194.
29. Naumann, R.; Schmidt, E. K.; Jonczyk, A.; Fendler, K.; Kadenbach, B.;
Liebermann, T.; Offenhäusser, A.; Knoll, W. Biosens. Bioelectron. 1999, 14, 651−662.
30. Giess, F.; Friedrich, M. G.; Heberle, J.; Naumann, R. L.; Knoll, W. Biophys. J.
2004, 87, 3213−3220.
31. Schiller, S. M.; Naumann, R.; Lovejoy, K.; Kunz, H.; Knoll, W. Angew. Chem.,
Int. Ed. 2003, 42, 208−211.
32. Raguse, B.; Braach-Maksvytis, V.; Cornell, B. A.; King, L. G.; Osman, P. D. J.;
Pace, R. J.; Wieczorek, L. Langmuir 1998, 14, 648−659.
33. Krishna, G.; Schulte, J.; Cornell, B. A.; Pace, R.; Wieczorek, L.; Osman, P. D.
Langmuir 2001, 17, 4858−4866.
34. Sinner, E.-K.; Knoll, W. Curr. Opin. Chem. Biol. 2001, 5, 705−711.
35. Yao, W. W.; Tan, Y. S.; Low, Y. X.; Yuen, J. S. Y.; Lau, C.; Webster, R. D. J.
Phys. Chem. B 2009, 113, 15263–15271.

CHAPTER 7
182
36. Marchal, D.; Boireau, W.; Laval, J. M.; Moiroux, J.; Bourdillon, C. Biophys. J.
1997, 72, 2679–2687.
37. Jiang, D.; Diao, P.; Tong, R.; Gu, D.; Zhong, B. Bioelectrochem. Bioenerg.
1998, 44, 285–288.
38. Wu, Z.; Tang, J.; Cheng, Z.; Yang, X.; Wang, E. Anal. Chem. 2000, 72,
6030–6033.
39. Zhang, H.; Zhang, Z.; Li, J.; Cai, S. Int. J. Electrochem. Sci. 2007, 2, 788–796.
40. Tien, H. T. Prog. Sur. Sci. 1985, 19, 169–274.
41 Tien, H. T. J. Phys. Chem. 1984, 88, 3172–3174.
42. Wardak, A.; Tien, H. T. Bioelectrochem. Bioenerg. 1990, 24, 1–11.
43. Martynski, T.; Tien, H. T. Bioelectrochem. Bioenerg. 1991, 25, 317–324.
44. Tien, H. T.; Lojewska, Z. K. Biochem. Biophys. Res. Commun. 1984, 119,
372–375.
45. Yamada, H.; Shiku, H.; Matsue, T.; Uchida, I. J. Phys. Chem. 1993, 97,
9547–9549.
46. Cheng, Y.; Schiffrin, D. J. J. Chem. Soc., Faraday Trans. 1994, 90,
2517–2523.
47. Wang, H. M.; Wang, E. K.; Tien, H. T.; Ottova, A. L. Bull. Electrochem. 1996,
12, 496–498.
48. Sabo, J.; Ottova, A.; Laputkova, G.; Legin, M.; Vojcikova, L.; Tien, H. T. Thin
Solid Films 1997, 306, 112–118.
49. Bender, C. J. Anal. Biochem. 1997, 253, 196–200.

CHAPTER 7
183
50. Krysiński, P. Adv. Mater. Opt. Electron. 1998, 8, 121–128.
51. Asaka, K.; Ottova, A.; Tien, H. T. Thin Solid Films 1999, 354, 201–207.
52. Groves, J. T.; Boxer, S. G. Acc. Chem. Res. 2002, 35, 149–157.
53. Lahann, J.; Mitragotri, S.; Tran, T.-N.; T.; Kaido, H.; Sundaram, J.; Choi, I. S.;
Hoffer, S.; Somorjai, G. A.; Langer, R. Science 2003, 299, 371–374.
54. Yao, W. W.; Peng, H. M.; Webster, R. D. J. Phys. Chem. C 2009, 113,
21805–21814.
55. Wain, A. J.; Wadhawan, J. D.; Compton, R. G. ChemPhysChem 2003, 4,
974–982.
56. Wadhawan, J. D.; Wain, A. J.; Compton, R. G. ChemPhysChem 2003, 4,
1211–1215.
57. Hui, Y.; Chng, E. L. K.; Chng, C. Y. L.; Poh, H. L.; Webster, R. D. J. Am.
Chem. Soc. 2009, 131, 1523–1534.
58. Hui, Y.; Chng, E. L. K.; Chua, L. P.-L.; Liu, W. Z.; Webster, R. D. Anal. Chem.
2010, 82, 1928–1934.
59. Parker, V. D. J. Am. Chem. Soc. 1969, 91, 5380–5381.
60. Svanholm, U.; Bechgaard, K.; Parker, V. D. J. Am. Chem. Soc. 1974, 96,
2409–2413.
61. Nanni, Jr., E. J.; Stallings, M. D.; Sawyer, D. T. J. Am. Chem. Soc. 1980, 102,
4481–4485.
62. Webster, R. D. Electrochem. Commun. 1999, 1, 581–584.

CHAPTER 7
184
63. Wilson, G. J.; Lin, C. Y.; Webster, R. D. J. Phys. Chem. B 2006, 110,
11540–11548.
64. Lee, S. B.; Willis, A. C.; Webster, R. D. J. Am. Chem. Soc. 2006, 128,
9332–9333.
65. Webster, R. D. Acc. Chem. Res. 2007, 40, 251–257.
66. Peng, H. M.; Webster, R. D. J. Org. Chem. 2008, 73, 2169–2175.
67. Yao, W. W.; Peng, H. M.; Webster, R. D.; Gill, P. M. W. J. Phys. Chem. B 2008,
112, 6847–6855.
68. Peng, H. M.; Choules, B. F.; Yao, W. W.; Zhang, Z.; Webster, R. D.; Gill P. M.
W. J. Phys. Chem. B 2008, 112, 10367–10374.
69. Wain, A. J.; Wadhawan, J. D.; France, R. R.; Compton, R. G. Phys. Chem.
Chem. Phys. 2004, 6, 836–842.
70. Lefevre, T.; Picquart, M. Biospectroscopy 1996, 2, 391–403.
71. Small. D. M. J. Lipid Res. 1967, 8, 551–557.
72. Asher, S. A.; Pershan, P. S. Biophys. J. 1979, 27, 393–422.
73. Lipowsky, R. Nature 1991, 349, 475–481.
74. Du, X.; Whallon, J. H.; Hollingsworth, R. I. Langmuir 1998, 14, 5581–5585.
75. Kawagoe, K. T.; Garris, P. A.; Wiedemann, D. J.; Wightman, R. M.
Neuroscience 1992, 51, 55–64.
76. Downey, T. M.; Nieman, T. A.; Anal. Chem. 1992, 64, 261–268.
77. Ugo, P.; Moretto, L. M. Electroanalysis 1995, 7, 1105–1113.

CHAPTER 7
185
78. Quan, M.; Sanchez, D.; Wasylkiw, M. F.; Smith, D. K. J. Am. Chem. Soc. 2007,
129, 12847–12856.
79. Hammerich, O.; Svensmark, B. In Organic Electrochemistry, 3rd
ed.; Lund, H.,
Baizer, M. M., Eds.; Marcel Dekker: New York, 1991; Chapter 16.
80. Bulovas, A.; Dirvianskytė, N.; Talaikytė, Z.; Niaura, G.; Valentukonytė, S.;
Butkus, E.; Razumas, V. J. Electroanal. Chem. 2006, 591, 175–188.
81. Abhayawardhana, A. D.; Sutherland, T. C. J. Phys. Chem. C 2009, 113,
4915–4924.

186
CHAPTER 8
187
Chapter 8
Summary
Vitamin K1 (VK1) was shown by voltammetry and coulometry to undergo two
chemically reversible one-electron reduction processes in acetonitrile (CH3CN)
containing Bu4NPF6 as the supporting electrolyte. The potential separation between
the first and second electron transfer steps diminished sequentially with the addition of
water, so that at a H2O concentration of approximately 7 M (~13% v/v) only one
process was detected, corresponding to the reversible transfer of two-electrons per
molecule. The voltammetric behavior was interpreted based on the degree of
hydrogen-bonding between the reduced forms of VK1 with water in the solvent. It was
found that the potential separation between the first and second processes was
especially sensitive to water in the low molar levels (0.001 – 0.1 M), therefore; by
measuring the peak separation as a function of controlled water concentrations
(accurately determined by Karl Fischer coulometric titrations) it was possible to
prepare calibration curves of peak separation versus water concentration. The
calibration procedure is independent of the type of reference electrode and can be used
to determine the water content of CH3CN between 0.01 – 5 M, by performing a single
voltammetric scan in the presence of 1.0 mM VK1. The reduction processes were
monitored by in-situ electrochemical–UV–Vis spectroscopy in CH3CN over a range of

CHAPTER 8
188
water concentrations (0.05 – 10 M) in order to spectroscopically identify the hydrogen
bonded species.
The voltammetry of VK1 was investigated in a range of other organic solvents of
varying dielectric constant that are commonly used for electrochemical measurements
[dimethyl sulfoxide (DMSO), N,N-dimethylformamide (DMF), propionitrile (EtCN),
butyronitrile (PrCN), 1,2-dichloroethane (DCE), dichloromethane (DCM) and
1,1,2,2-tetrachloroethane (TCE)]. The water content of the solvents were accurately
measured using KF coulometric titrations and the voltammetric data were used to
estimate the degree of hydrogen-bonding interactions between the reduced forms of
VK1 and variable levels of water, thereby allowing a ranking of water-substrate
interactions in the different solvents. The voltammetric data were analyzed based on
interactions that occur between reduced forms of VK1 and the water, the solvent and
the supporting electrolyte. Calibration data were obtained which are independent of
the nature of the reference electrode, and allow the water content of the solvents to be
calculated by performing a single voltammetric scan in the presence of VK1 and 0.2 M
supporting electrolyte (Bu4NPF6).
Vitamin K-SH (VKSH), a derivative of VK1, was used to investigate the
electrochemical properties of surface bound vitamin K by performing voltammetry in
CH3CN and CH2Cl2. VKSH was chemically attached to the surface of a Au working
electrode through the sulfur linkage. Two one-electron processes were observed when a
Pt wire was used as a reference electrode in solutions with 0.2 M Bu4NPF6 as the
supporting electrolyte. The water concentrations were accurately measured by KF

CHAPTER 8
189
titration, and the peak separations between the two processes diminished when the water
concentration increased. The voltammetric behavior of VKSH was similar to that of
VK1, which was based on the hydrogen-bonding between the reduced forms of VKSH
and the water in the solvents.
A robust model membrane environment was developed to enable voltammetry
experiments to be performed on low molecular weight biological molecules completely
incorporated inside artificial lipid bilayer (or multilayer) membranes. The artificial
supported membranes were prepared by sandwiching multilayers of lecithin between
layers of Nafion that were deposited on the surface of a glassy carbon electrode. The
Nafion films acted as a conduit to aid proton transfer across the lecithin solution
interface, and thereby balance the charge brought about by the electrochemical reactions.
VK1 was separately incorporated inside the Nafion|lecithin|Nafion layers and the coated
electrodes were immersed in aqueous solutions between pH 3 – 13. The electrode
coating procedure produced multilayer membranes with solvent like properties enabling
highly reproducible diffusion controlled voltammetric processes to be observed. VK1
underwent multiple electron-transfer and proton-transfer reactions inside the
membranes.
Many solvents used for electrochemistry can be dried to < 1 × 10⁻³
M water content
by storing the solvents over 3Å molecular sieves in a nitrogen or argon atmosphere.
However, as soon as the solvents are placed in an electrochemical cell, the water content
increases significantly. KF coulometric titrations were conducted on several pre-dried
solvents commonly used for electrochemistry (CH3CN, CH2Cl2, DMF and DMSO) in a

CHAPTER 8
190
controlled humidity environment (30%, 50% and 70% relative humidity) to determine
the rate of moisture uptake into the organic solvents when used under typical
electrochemical conditions (either in an electrochemical cell under a nitrogen
atmosphere or in an electrochemical cell directly exposed to the atmosphere). The
results in this study give guidelines for estimating the water content of organic solvents
under conventional electrochemical operating conditions.

191
Publications
1. Hui, Y. L.; Chng, E. L. K.; Chng, C. Y. L.; Poh, H. L.; Webster, R. D.
Hydrogen Bonding Interactions between Water and the One- and Two-Electron
Reduced forms of Vitamin K1: Applying Quinone Electrochemistry to Determine the
Moisture Content of Non-Aqueous Solvents
J. Am. Chem. Soc. 2009, 131, 1523–1534.
2. Hui, Y. L.; Chng, E. L. K.; Chua, L. P.-L.; Liu, W. Z.; Webster, R. D.
Voltammetric Method for Determining the Trace Moisture Content of Organic
Solvents Based on Hydrogen-Bonding Interactions with Quinones
Anal. Chem. 2010, 82, 1928–1934
3. Hui, Y. L.; Webster, R. D.
Absorption of Water into Organic Solvents Used for Electrochemistry under
Conventional Operating Conditions
Anal. Chem. 2011, 83, 976–981
4. Yao, W. W.; Lau, C.; Hui, Y.; Poh, H. L.; Webster, R. D.
An Electrode-Supported Biomembrane for Examining Electron Transfer and Ion
Transfer Reactions of Encapsulated Low Molecular Weight Biological Molecules
J. Phys. Chem. C 2011, 115, 2100–2113