Volleyball Float Serve: A Biomechanical Analysis...
27
Volleyball Float Serve: A Biomechanical Analysis 1 Jesse Barfknecht Nicole Cereda Volleyball Float Serve: A Biomechanical Analysis In 1895, William G. Morgan invented the game of volleyball. Since then, volleyball has become a mainstream sport and has many different variations. Today, volleyball is played recreationally and competitively by people of all ages and both sexes. This paper looks at certain aspects of volleyball; how it is played, specific skills, differences between male and female players, results of playing, and more. Looking at the game of volleyball, it does not appear to be a game that requires precision, timing or any complex movement skills. Most novice players or beginners will just focus on trying to not let the ball hit the ground or try and hit the ball over within the limit of three hits. To really achieve a high level of play, discipline and practice of high difficult degrees of movements need to be done. Volleyball has many movements other than just striking the ball with extremities. Players must be able to get in the right position both vertically and horizontally. Lateral movements that precede an attack can give players the maximum chance in achieving the best outcome. Environments like beach volleyball cause different challenges with sand slowing the acceleration of movements. Perez-Turpin et al. (2009), break down the chart of movement patterns using camera and video analysis tools and software. The data showed that the players used offensive movement patterns fifty nine percent of the time and defensive patterns forty one percent of the time.
Transcript of Volleyball Float Serve: A Biomechanical Analysis...

Volleyball Float Serve: A Biomechanical Analysis 1
Jesse Barfknecht
Nicole Cereda
Volleyball Float Serve: A Biomechanical Analysis
In 1895, William G. Morgan invented the game of volleyball. Since then, volleyball
has become a mainstream sport and has many different variations. Today, volleyball is played
recreationally and competitively by people of all ages and both sexes. This paper looks at certain
aspects of volleyball; how it is played, specific skills, differences between male and female
players, results of playing, and more. Looking at the game of volleyball, it does not appear to
be a game that requires precision, timing or any complex movement skills. Most novice players
or beginners will just focus on trying to not let the ball hit the ground or try and hit the ball over
within the limit of three hits. To really achieve a high level of play, discipline and practice of
high difficult degrees of movements need to be done.
Volleyball has many movements other than just striking the ball with extremities. Players must
be able to get in the right position both vertically and horizontally. Lateral movements that
precede an attack can give players the maximum chance in achieving the best outcome.
Environments like beach volleyball cause different challenges with sand slowing the acceleration
of movements. Perez-Turpin et al. (2009), break down the chart of movement patterns using
camera and video analysis tools and software. The data showed that the players used offensive
movement patterns fifty nine percent of the time and defensive patterns forty one percent of the
time.

Volleyball Float Serve: A Biomechanical Analysis 2
While the game is still played the same with the same rules, there are some change
attributes of the net when males and females play. To play the game with the net the same height
for women as men would be unfair as males are on average taller than the ladies counterparts.
The net is lowered to adjust for the high differential between the two sexes. Other possible
differences in physical characteristics and attributes between males and females were researched
for an article about sex differences. The research analyzed sex differences in statistics. The focus
was on shot spikes, reception digs, and fault serves. The researchers used the software, VIS from
the International Volleyball Federation. In order for them to be able to identify which variables
were discriminated by sex, they computed a discriminate analysis which led to their adoption of
a .30 coefficient structure. (Joao, Leite, Mesquita, 2010)
From the study, the researchers concluded that “men’s volleyball performance was
more strongly associated with terminal effects (errors of service), whereas women’s volleyball
performance was characterized by actions of continuity (effective defense and attack).” (Joao,
Leite, Mesquita, 2010, p. 897-8) The authors also concluded that there are differences in men’s
and women’s statistics due to their body build. They stated that different “strategies and tactical
procedures, and training should be focused on tasks that integrate perceptual decisions, and
motor components.” (Joao, Leite, Mesquita, 2010, p. 898)
After analyzing the results, the differences between men’s and women’s spike, fault
serve, shot spikes, fault blocks, and rebound blocks, appeared to be significant with the men
scoring higher. The women scored higher in the reception digs, still sets, digs, and fault sets.
There was no significant differences for the reception serve aces, serve hits, fault spikes, kill
blocks, and serve receptions. A discriminate function was present only when it pertained to

Volleyball Float Serve: A Biomechanical Analysis 3
reception digs, shot spikes, and fault serves. (Joao, Leite, Mesquita, 2010)
The information that they found is useful, because coaches and players can take the
information and apply it to what skills that they work on during practice. From their findings,
the players should work on their lateral (side) step added, advance (forward) step, and lateral
extension in order to improve their defensive movements. In order to improve the players’
offensive movements, they should work on their advance step for their approach during their
attack. The authors stated that the players should also work to improve their overall offensive
movement patterns before their defensive movement patterns. (Cejuela, Chinchilla, Cortell-
Tormo, Perez-Turpin, Suarez, 2011)
The results that the researchers found were that the players used more offensive
movement patterns than defensive movement patterns. Offensive movement patterns are
the attack, placement, and approach to the attack. The defensive movement patterns are the
reception, defense, and block. The players had four different types of locomotion directions. The
four are: advance (forward), lateral step, lateral extension, and post (backwards). Out of the four
locomotion directions, the players used the lateral movement extension the most.
A major factor of volleyball that can change how every point is played is the serve. Simon
Coleman did a study on the volleyball jump serve. Serving is the first attack that can be made in
the game of volleyball. To make the serve the most powerful that it can be, one jumps while
serving the ball. The server throws the ball into the air at the baseline of the volleyball court. As
the ball is thrown in the air, the server jumps across the baseline, hits the ball, and lands in the
court. The jump serve gives the opponents a fifth of a second to react to the serve and the jump
serve creates a top spin that makes the ball even harder to return. Coleman examined
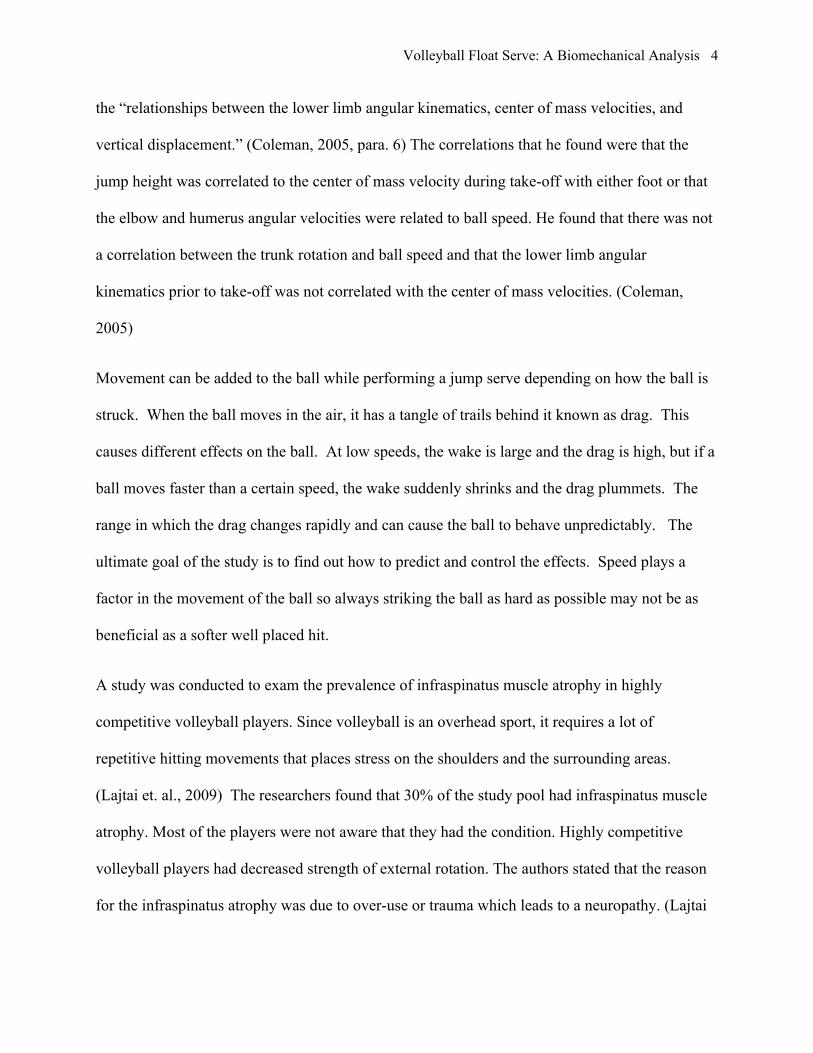
Volleyball Float Serve: A Biomechanical Analysis 4
the “relationships between the lower limb angular kinematics, center of mass velocities, and
vertical displacement.” (Coleman, 2005, para. 6) The correlations that he found were that the
jump height was correlated to the center of mass velocity during take-off with either foot or that
the elbow and humerus angular velocities were related to ball speed. He found that there was not
a correlation between the trunk rotation and ball speed and that the lower limb angular
kinematics prior to take-off was not correlated with the center of mass velocities. (Coleman,
2005)
Movement can be added to the ball while performing a jump serve depending on how the ball is
struck. When the ball moves in the air, it has a tangle of trails behind it known as drag. This
causes different effects on the ball. At low speeds, the wake is large and the drag is high, but if a
ball moves faster than a certain speed, the wake suddenly shrinks and the drag plummets. The
range in which the drag changes rapidly and can cause the ball to behave unpredictably. The
ultimate goal of the study is to find out how to predict and control the effects. Speed plays a
factor in the movement of the ball so always striking the ball as hard as possible may not be as
beneficial as a softer well placed hit.
A study was conducted to exam the prevalence of infraspinatus muscle atrophy in highly
competitive volleyball players. Since volleyball is an overhead sport, it requires a lot of
repetitive hitting movements that places stress on the shoulders and the surrounding areas.
(Lajtai et. al., 2009) The researchers found that 30% of the study pool had infraspinatus muscle
atrophy. Most of the players were not aware that they had the condition. Highly competitive
volleyball players had decreased strength of external rotation. The authors stated that the reason
for the infraspinatus atrophy was due to over-use or trauma which leads to a neuropathy. (Lajtai

Volleyball Float Serve: A Biomechanical Analysis 5
et. al., 2009)
Infraspinatus atrophy was not directly linked to a specific body style or with the amount
of time spent playing volleyball. The players that had infraspinatus atrophy did not have any
physical signs that would signal that it was apparent in their body; there was just occasional
shoulder soreness, which is common among volleyball players. Of the thirty percent who had
infraspinatus atrophy; there was a relevant effect on their shoulder strength and a significant loss
of abduction strength in the hitting shoulder. (Lajtai et. al., 2009)
Different studies have been done to test the recruitment patterns of muscles during
sports that require the upper extremities. Escamilla and Andrews (2009) studied the
EMG “Electromyography” data of sports that use the shoulder muscles. EMG is the science
of quantifying muscle activity. The study has been helpful to physicians, therapists, trainers as
well as players. EMG analyses are helpful in determining the timing and quantity of muscle
activation throughout a given movement. Below is a chart of the shoulder activity by muscle and
phase during a tennis serve, which is very similar to that of a volleyball attack or serve. The data
shows the maximum voluntary isometric contraction or the MVIC per each muscle during each
phase.
Muscles # of Subjects Phase/Wind
up
Cocking Acceleration Follow
through
Biceps
brachii
6 6 39 10 34
Middle 6 18 23 14 36

Volleyball Float Serve: A Biomechanical Analysis 6
deltoid
Supraspinatu
s
6 15 53 26 35
Infraspinatus 6 7 41 31 30
Subscapularis 6 5 25 113 63
Pectoralis
major
6 5 21 115 39
Serrratus
Ant.
6 24 70 74 53
Lat. Dorsi 6 16 32 57 48
Ciapponi et al. (1996) did a study to figure out what effects balance and skill had on one
performing a volleyball approach. The subjects were two female volleyball players; one
advanced performer and one intermediate performer. The advanced performer used a step-close
approach for hitting. The intermediate player used a hop-style approach. Both performers kept
their body’s line of gravity at their center. Throughout both approaches, their horizontal velocity
remained constant at moving forward. When comparing the results found, the authors stated
that “there appears to be an inverse relationship between stability and mobility in the approach.

Volleyball Float Serve: A Biomechanical Analysis 7
Volleyball is still being played around the world daily and is one of the more universal sports
known around the globe. Compared to when it was created in 1895 to now the changes of the
game and what people are able to do with the ball is incredible. There will always be slight rule
tweaks and changes over time but the core of the game will stay the same for generations to
come. With continued studies in the aspects of ball rotation and movement and how players
perform it will be exciting to see what becomes more valuable in volleyball, the players natural
ability or the science and technique of manipulating the ball.
The purpose of this paper is to look at the present studies of aspects of the volleyball float serve.
The phases of the float serve, the timing of the phases, the velocity and acceleration in volleyball
movement, and kinematics of the volleyball float serve were all studied. This paper will take a
closer look on the items just stated and apply specific biomechanical terms to the volleyball float
serve.
The first study was done on the phases of the volleyball float serve.
Introduction:
The objective of the video analysis is to focus on all phases of a float serve in volleyball as
well as grade the participants using a four point checklist based on the critical elements. Each
participant was graded with the checklist based upon key elements during each phase of the float
serve. Grades for the three phase’s preparatory, action, and ending were given using a 1 – 4
scale with 1 being the weakest and 4 being the strongest. The contributing joints to successfully
completing an overhand float serve at listed in the chart below.
Joints Movement Muscle Shoulder Abduction
Deltoids

Volleyball Float Serve: A Biomechanical Analysis 8
Adduction Flexion Extension External/Internal rotation
Pectorals Latissimus Dorsi Trapezius
Elbow Flexion
Extension
Triceps Biceps Wrist Flexors
Hip Flexion
Extension
Quadriceps Hamstring Hip Flexors
Knee Flexion
Extension
Hamstring Tibialis Anterior
Hand/Wrist Flexion
Extension
Wrist Flexors Wrist Extensors
Ankles Plantar Flexion
Dorsiflexion
Gastrocnemius Tibialis Anterior
Methods:
For the analysis, a recreational volleyball player and a competitive college volleyball player’s
float serves were compared. The recreational volleyball player was observed in real time. The
recreational volleyball player preformed the float serve in a gym while the authors observed the

Volleyball Float Serve: A Biomechanical Analysis 9
performance. The competitive college volleyball player was observed by the authors through an
online video that is cited below.
D. (2009, August 29). How to Serve a Floater in Volleyball. VolleyballDrills.tv. Retrieved
January 29, 2012, from http://www.volleyballdrills.tv/volleyballdrills/volleyball-drills/
float-serve
Results:
Ratings 1=Weak
2=Developing
3=Strong
4=Mastered
Subjects Subject 1=recreational volleyball player
Subject 2=competitive volleyball player
Subject 1 Subject 2
Preparatory Phase
Feet shoulder width apart 3 4
Foot opposite of striking hand pointed forward slightly in front of other foot
4 4
Striking hand foot slightly pointed away from other foot
4 4
Ball held out in front of body with hands placed on top and bottom. Striking hand on top
4 4

Volleyball Float Serve: A Biomechanical Analysis 10
Body facing towards target 4 4
Action Phase
Vertical toss of the ball in front of body
3 4
Striking arm is pulled back behind head with elbow up
2 4
Small step as you toss with foot that’s opposite of striking hand
4 4
Ball is hit above head 4 4
Ball is hit with the palm of the hand
2 4
Ball is contacted in the center 2 4
Back foot slides along ground while hand contacts the ball
2 4
Ending Phase
Weight transferred to front foot
4 4
Back foot meets front foot shoulder width apart
3 4
Hand remains open and flat without following through
3 4
Limited rotation of ball
2 4
Whole Skill 3 4
Discussion:

Volleyball Float Serve: A Biomechanical Analysis 11
After completing the evaluations using the checklist, the results found were similar in the
preparatory phase and varied in the action and ending phases. Both players had high ratings in
the preparatory phase. In the phases that required movement, subject one had lower ratings.
The checklist is very good for the first evaluations and may need to be expanded as the phases
are further broken down.
The researches then looked into the time spent in each of the phases that were created. Figuring
out how long each phase lasted amongst various volleyball players was researched to see if it
affected the float serve.
Introduction:
The purpose of this study was to determine the time spent during each phase of serving
a volleyball. The study was broken up into three different phases of action. Phase one was the
loading or preparation phase where the subject eccentrically contracts the muscles to prepare
for a striking motion of the ball. Phase two begins the moment the subject beings the action
of motion to strike the ball. The force of impact comes from the mass of the striking arm’s
concentric contraction and the shift of body weight during the strike. When the object or ball in
this scenario is struck, phase three or the end phase beings bringing the arm to a stop completing
the action.
Methods:
For the analysis, a recreational volleyball player and a competitive college volleyball player’s
float serve were compared. The recreational volleyball player was observed in real time. The
recreational volleyball player preformed the float serve in a gym while the authors observed the

Volleyball Float Serve: A Biomechanical Analysis 12
performance. The competitive college volleyball player was observed by the authors through an
online video that is cited below. The video was filmed with a Samsung Galaxy S2 a resolution
of 1920x1080 at 30fps. Frame count analysis was performed using Apple QuickTime software.
Results:
Absolute Timing
Relative Timing
Ser
ver 1
Server 2
Server 1
Server 2
Server 1
Server 2
Phase
Frames
Time(sec)
Time(sec)
100%
100%
1 45 39 1.5
01.3
0 80
%54%
2 11 6 0.3
70.2
0 20
%8%
3 10 22 0.3
30.7
3 18
%31%
To
tal Time
2.20
2.23

Volleyball Float Serve: A Biomechanical Analysis 13
Conclusion:
The results showed a few differences in how each subject served the ball as well as differences
in time relative to each phase. Subject 1 had a longer preparatory phase than Subject 2 as well as
a much slower action phase. Subject 2’s action was almost twice as fast as Subject 1 as it took
about half the time to make contract with the ball as the results show an 11-6 frame count
differential. Another noticeable difference was in phase three. Subject 1 would stop their

Volleyball Float Serve: A Biomechanical Analysis 14
motion or follow through in half the time of Subject 2, therefore it is concluded that Subject 2
was swinging almost twice as hard and needed twice the amount of time to stop the follow
through motion.
D. (2009, August 29). How to serve a floater in volleyball. VolleyballDrills.tv. Retrieved
January 29, 2012, from http://www.volleyballdrills.tv/volleyballdrills/volleyball-drills/
float-serve
After looking at the timing phases of the volleyball float serve, a study was done to compare the
velocity and acceleration of lateral movements in volleyball. Volleyball players need to be able
to move side to side when receiving the ball.
Introduction:
The purpose of this study was to exam the velocity and acceleration during a specific volleyball
movement. The study focused specifically on lateral movement for a distance of the width of a
volleyball court.
Methods:
For the analysis, a recreational volleyball player was observed. The recreational volleyball player
was observed in real time. The recreational volleyball player preformed lateral side stepping, a
shuffle, while being videotaped. The video was filmed with a Samsung Galaxy S2 a resolution
of 1920x1080 at 30fps. Frame count analysis was performed using Apple QuickTime software.
The results were found by using Kinovea and Microsoft Excel for table calculations.

Volleyball Float Serve: A Biomechanical Analysis 15

Volleyball Float Serve: A Biomechanical Analysis 16
Discussion:
The subject side stepped laterally across the width of a standard volleyball court which is
30ft wide. Each segment was broken down into a distance of 7.5 feet. Based on the results the
subject accelerated past the first to marks then let up through the 3rd segment then sped back up
for finish.
Comparing the acceleration of the subject shows that he started off very well but decided
to slow down during the 3rd segment. The graph above shows the deceleration during that
segment and how once the subject was almost to the end he picked up the speed to finish strong.
To better performance for the test subject changes to a few areas need to be addressed.
The first change should be to encourage the subject to go at full speed for the whole test. A
distance of 30 feet should not be a problem for a person to maintain full speed throughout the
test. Second, the subject’s arms could be placed in a better position. The subject had his arms
right at his side and if they were wider out if could increase his balance at a higher speed as a
lack of balance may have been why he decelerated during the test.
The last study that was done was on the kinematics of the float serve in volleyball. The
researchers looked at different aspects of the body and ball relationship.
Introduction:
The purpose of this study was to examine the ball movement and release angles during
the float serve. The study focused specifically on the release angle of the ball in order for the ball
to hit a horizontal target effectively. The study also focused on ball movement, acceleration, and
velocity of two subject’s float serves.

Volleyball Float Serve: A Biomechanical Analysis 17
Methods:
For the analysis, two recreational volleyball player’s float serve were compared. Both of the
recreational volleyball players were observed in real time. Both players preformed the float serve
in a gym while being videotaped. The video was filmed with a Samsung Galaxy S2 a resolution
of 1920x1080 at 30fps. Frame count analysis was performed using Apple QuickTime software.
The results were found by using the Kinovea software.
Results:
Figure 1

Volleyball Float Serve: A Biomechanical Analysis 18
Figure 2
Figure 3
Table 1 Subject 1: Ball Acceleration and Velocity
29.41 35.71 38.46 38.46

Volleyball Float Serve: A Biomechanical Analysis 19
Avg. Velocity (ft/s)
Avg. Acceleration (ft/s^2)
40.66 20.35 0.00
(∆v/∆t)

Volleyball Float Serve: A Biomechanical Analysis 20
Table 2 Subject 2: Ball Acceleration and Velocity
Avg. Velocity (ft/s)
38.46 50.00 50.00 41.67
(∆d/∆t) Overall 44.44444
Avg. Acceleration (ft/s^2)
100.33 0.00 -75.76
(∆v/∆t)

Volleyball Float Serve: A Biomechanical Analysis 21
Conclusion:
When aiming to hit a horizontal target, the most effective release angle for the object is an angle
equal to or greater than 45 degrees. In figure 1, Subject 1’s release angle of the ball during a float
serve was analyzed. Subject 1’s release angle was 53 degrees. In figure 2, Subject 2’s release
angle of the ball during a float serve was analyzed. Subject 2’s release angle was 46 degrees.

Volleyball Float Serve: A Biomechanical Analysis 22
When comparing the two subjects’ release angles, Subject 2’s release angle is more effective
when it is applied to a float serve. Subject 2’s release angle was seven degrees less than Subject
1’s. With having a lower release angle, Subject 2’s ball crossed the top of the volleyball net
closer than Subject 2’s ball. This is beneficial for the serve, so that it is able to drop inside the
court boundaries. The higher the release angle, the more chances there are for the ball to land
past the end line of the court.
The study shows the velocity and acceleration of the 2 subjects serving a volleyball using
a technique to create afloat serve. The distance being measured is 30ft. 30ft represents the
distance from the subject to the middle of the court where the volleyball net stands. Note the
differences between Subject 1 and Subject 2. Subject 1's serve had a lower maximum velocity as
well as it did not hit its peak speed until the later end of the serve where as Subject 2's serve hit
its maximum velocity right away. The differences between velocities could be the force at which
the ball was contacted as well as the trajectory of the ball during the serve.
With the float serve the less rotation on the ball is better so it creates a high amount of
drag and the ball creates an unpredictable path during its flight. Figure 3 represents the flight
pattern of the ball during a serve. As you track the ball from the toss, from the start the ball
is drifting slightly horizontally to the right. When the ball comes down and contact is made,
the trajectory of the ball is continued to the right. The longer the ball is in flight the more
drag builds up and can create the sporadic flight pattern. Looking closely at the line you can
see a big shift to the right as well as curves that sway horizontally as the ball descends. The
movement of the ball horizontally represents a proper float serve was executed.

Volleyball Float Serve: A Biomechanical Analysis 23
To conclude the research, the authors looked at five biomechanical principles and applied
them to the volleyball float serve.
Physics of Volleyball — The Magnus Effect and Air Resistance
The airborne time of the volleyball can be reduced even more by putting top-spin on the
volleyball. This causes the ball to experience an aerodynamic force known as the magnus effect,
which "pushes" the ball downward so that it lands faster. The figure below illustrates the magnus
effect.
For a proper float serve, the person should limit any type of rotation on the ball or the
magnus effect will take over and eliminate the odd unpredictable movements of the float serve.
If the ball is served with any form of topspin it causes the velocity of the air around the top half
of the ball to become less than the air velocity around the bottom half of the ball. This is because
the tangential velocity of the ball in the top half acts in the opposite direction to the airflow, and
the tangential velocity of the ball in the bottom half acts in the same direction as the airflow.
This causes a net downward force to act on the ball. This is due to Bernoulli's principle which

Volleyball Float Serve: A Biomechanical Analysis 24
states that when air velocity decreases, air pressure increases (and vice-versa).
Surface Drag
The motion of a float serve is created by aerodynamic drag. The magnitude of the drag
depends on the viscosity of the air. Along the solid surface of the ball a layer of energy flow is
generated. The magnitude of the friction depends on the state of this flow. The drag and forces
exerted against it in flight create an erratic flight path of the volleyball during a float serve.
Impulse and Inertia
Impulse = force x change in time. In a serve, the impulse experienced by an object
= the change in momentum of the object. During the float serve, this is when first contact is
made during the serve. Inertia is essentially an objects resistance to acceleration. When a
volleyball player strikes the ball during the float serve its inertia keeps it moving with speed.
Without inertia the ball would fall straight to the ground after contact. The principle of inertia
as described by Newton in his First Law of Motion; that an object not subject to any net external
force moves at a constant velocity. Thus an object will continue moving at its current velocity
until some force causes its speed or direction to change such as striking the ball during the float
serve.
Changes in uniform motion
The starting velocity of a volleyball float serve is zero. The player is stationary and the ball is
held out in front of the player with no movement. The ball then has a small degree of velocity
dropping down in preparation for the toss. The velocity increases during the toss to get the ball at
the proper level for striking while the serving arm eccentrically contracts at a low degree of

Volleyball Float Serve: A Biomechanical Analysis 25
velocity. The force of the impact comes from the mass of the striking arm’s concentric
contraction during the action phase.
The ball’s velocity instantly changes from a slow speed, vertical velocity to a high speed,
horizontal velocity. After the striking arm contacts the ball, there is a slowing down velocity of
the arm until it comes to a stop. The degree of velocity change is high, due to the need of a
minimal follow through of the float serve. The kinetic energy of the arm is transferred into the
horizontal movement of the ball.
Factors influencing stability
While performing a volleyball float serve, the base of support comes from the feet being
shoulder width apart, with one foot slightly in front of the other foot. With this staggered form,
there is more anterior and posterior support and less side to side movement support. The center
of gravity within the body is lower during the preparatory phase, the toss of the ball, and higher
during the action phase, the hitting of the ball.
The action and ending phases are the only times that directional stability is observed. When
those phases are being performed the player is slightly moving forward in anticipation of making
contact with the ball and completing the serve. With the forward directional stability, there is
weight transfer. During the preparatory phase, the weight is evenly distributed between both feet.
Once the action phase starts, weight is transferred to the hitting hand side foot. At the end of the
action phase when the ball is contacted, the weight transfers to the non hitting hand side foot.

Volleyball Float Serve: A Biomechanical Analysis 26
When the weight transfer is taking place and the ball is being contacted with the hand,
directional instability is observed. The body is not completely stable during movement and does
not have a solid base with weight evenly distributed on both feet.
References:
Alfonso, J., Mesquita, I., Marcelino, R., & da Silva, J. (2010). Analysis of the setter’s tactical action in high-performance women’s volleyball. Kinesiology, 42(1), 82-89.
Bergün, M., Mensure, A., Tuncay, Ç., Aydin, Ö., & Çigdem, B. (2009). 3D kinematic analysis of over arm movements for different sports. Kinesiology, 41(1), 105-111
Ciapponi, T. M., McLaughlin, E. J., & Hudson, J. L. (1996). The volleyball approach: An exploration of balance. Proceedings of the XIIIth International Symposium on Biomechanics in Sports, 282-285.
Coleman, S. (2005). A 3D kinematic analysis of the volleyball jump serve . Coaches Info. Retrieved January 15, 2012, from http://www.coachesinfo.com/index.php?option=com_content&view=article&id=375%3A3dkinematic-article&catid=103%3Avolleyball-generalarticles&Itemid=197#conclusion

Volleyball Float Serve: A Biomechanical Analysis 27
Cortell-Tormo, J., Pérez-Turpin, J., Chinchilla, J., Cejuela, R., & Suárez, C. (2011). Analysis of movement patterns by elite male players of beach volleyball. Perceptual And Motor Skills, 112(1), 21-8.
Escamilla, R. F., & Andrews, J. R. (2009). Shoulder muscle recruitment patterns and related biomechanics during upper extremity sports. Sports Medicine, 39(7), 569-590
João, P., Leite, N., & Mesquita, I.J. (2010). Sex differences in discriminative power of volleyball game-related statistics. Perceptual And Motor Skills, 111(3), 893-900.
Lajtai , G., Pfirrmann, C., Aitzetmüller, G., Pirkl, C., Gerber, C., & Jost, B. (2009). The shoulders of professional beach volleyball players: high prevalence of infraspinatus muscle atrophy. The American Journal Of Sports Medicine, 37(7), 1375-83.
Pérez-Turpin, J. A., Cortell-Tormo, J. M., Suárez-Llorca, C., Chinchilla-Mira, J. J., & Cejuela-Anta, R. (2009). Gross movement patterns in elited female beach volleyball. Kinesiology, 41(2), 212-219.
In volleyball, crafty players serve up an aerodynamic crisis. (2004). Science, 306(5693), 42.