Volcanic Landslide Risk Management, Lillooet River Valley ...
27
Volcanic Landslide Risk Management, Lillooet River Valley, BC: Start of north and south FSRs to Meager Confluence, Meager Creek and Upper Lillooet River. Submitted to: Malcolm Schulz, RPF Engineering Officer Metro Vancouver Squamish District Ministry of Forests, Lands and Natural Resource Operations Submitted by: Pierre Friele, P. Geo. Cordilleran Geoscience, PO Box 612, 1021 Raven Drive, Squamish, BC V8B 0A5 March 10, 2012
Transcript of Volcanic Landslide Risk Management, Lillooet River Valley ...

Volcanic Landslide Risk Management, Lillooet River Valley, BC: Start of north and south FSRs to Meager Confluence, Meager Creek and Upper Lillooet River. Submitted to: Malcolm Schulz, RPF Engineering Officer Metro Vancouver Squamish District Ministry of Forests, Lands and Natural Resource Operations Submitted by: Pierre Friele, P. Geo. Cordilleran Geoscience, PO Box 612, 1021 Raven Drive, Squamish, BC V8B 0A5 March 10, 2012

ii
Table of Contents Introduction ......................................................................................................................... 1 Scope ................................................................................................................................... 1 Hazard & Risk Assessment ................................................................................................. 1 Volcanic Landslide Hazard ................................................................................................. 2
Hazard Frequency and Magnitude .................................................................................. 2 Affected Areas ................................................................................................................ 3
Proximal Zones ........................................................................................................... 3 Distal Zone .................................................................................................................. 4
Consequences of Volcanic Landslide Impacts ............................................................... 5 Partial Risk Mapping .......................................................................................................... 5
Proximal Zones ............................................................................................................... 5 Distal Zone ...................................................................................................................... 6
Climate Thresholds for Landslide Initiation ....................................................................... 7 Historic Landslides with Climate Data ........................................................................... 9 Existing Rainfall and Landslide Hazard Criteria .......................................................... 11 Existing Climate and Frequency of Exceedence of Existing Hazard Criteria .............. 11 Recommended Climate Thresholds .............................................................................. 14
Landslide Risk Management ............................................................................................. 16 Risk Management Plan Objectives ............................................................................... 16 Climate Monitoring ....................................................................................................... 16 Landslide Risk Management Measures ........................................................................ 16 Access to Hurley FSR ................................................................................................... 16 Proposed Gate locations ................................................................................................ 17 Landslide Risk and Recommended Access Restrictions .............................................. 17
References ......................................................................................................................... 20 Caveat ............................................................................................................................... 21 Closure .............................................................................................................................. 21

iii
List of Tables Table 1. Qualitative hazard frequency categories (after MoE 1999). Table 2. Consequences of volcanic landslides (after Jakob 2005). Table 3. Spatial hazard zone for proximal valleys. Table 4. Frequency of occurrence of volcanic landslides from Mount Meager. Table 5. Volcanic landslide hazard affecting the distal reach of Lillooet River valley. Table 6. Dated landslides with climate data. Climate data is from Pemberton BCFS
(1969-1984) or Pemberton airport (1984-2012). Table 7. Difference between Pemberton and Meager daily climate, July 14, 2010 to
August 11, 2010. Table 8. Data range, quality, maximum daily temperature and number of days exceeding
25 °C, 30 °C and 35 °C, Pemberton Airport 1984-2011 (n=28). Table 9. Data range, quality, maximum daily rainfall and number of days exceeding 20
mm/24hr, 50 mm/24hr and 75 mm/48hr, Pemberton Airport 1984-2011 (n=28). Table 10. Intensity (mm/hr) Frequency-Duration data for Pemberton (Environment
Canada). Table 11. Hazard levels for landslide risk management. These thresholds should be
revised and updated as new data allow. Table 12. Recommended landslide hazard/risk management matrix and measures. List of Figures Figure 1. Frequency-Magnitude model for Mount Meager volcanic complex
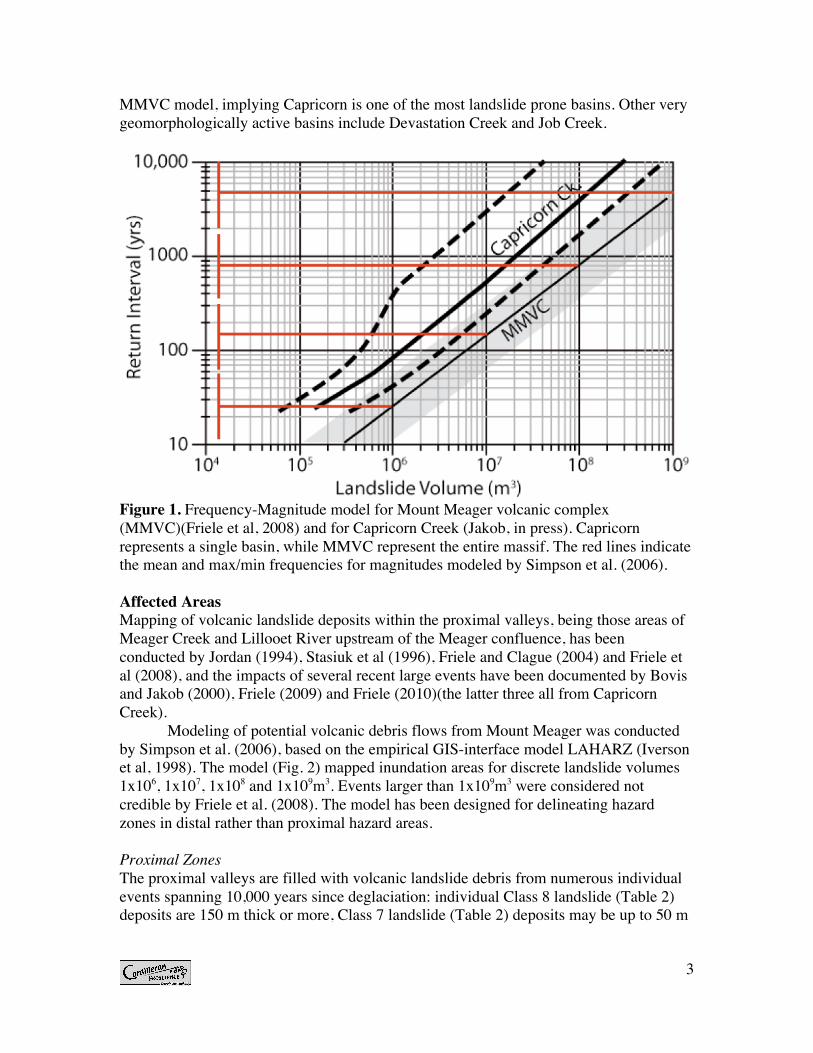
(MMVC)(Friele et al, 2008) and for Capricorn Creek (Jakob, in press). Capricorn represents a single basin, while MMVC represent the entire massif. The red lines indicate the mean and max/min frequencies for magnitudes modeled by Simpson et al. (2006).
Figure 2. Travel distance along Lillooet River of selected volcanic landslides originating in Job Creek (after Simpson et al 2006).
Figure 3. Distal valley, landslide hazard zone. Figure 4. Charts of 2 week antecedent climate data for volcanic landslides with known
dates of occurrence. Climate data is from Pemberton BCFS (1969-1984) or Pemberton airport (1984-2012). The events are grouped into three seasonal climate triggers: summer heat; late summer heat with rain; and fall rain. No landslides are known to have occurred in winter or spring. Max T is daily maximum temperature (ºC). 6 day T is 6 day running mean of daily max T (ºC). 24hr ppt is daily rainfall (mm).
Figure 5. Mean and standard deviation of daily differences between Pemberton airport and Meager climate stations.
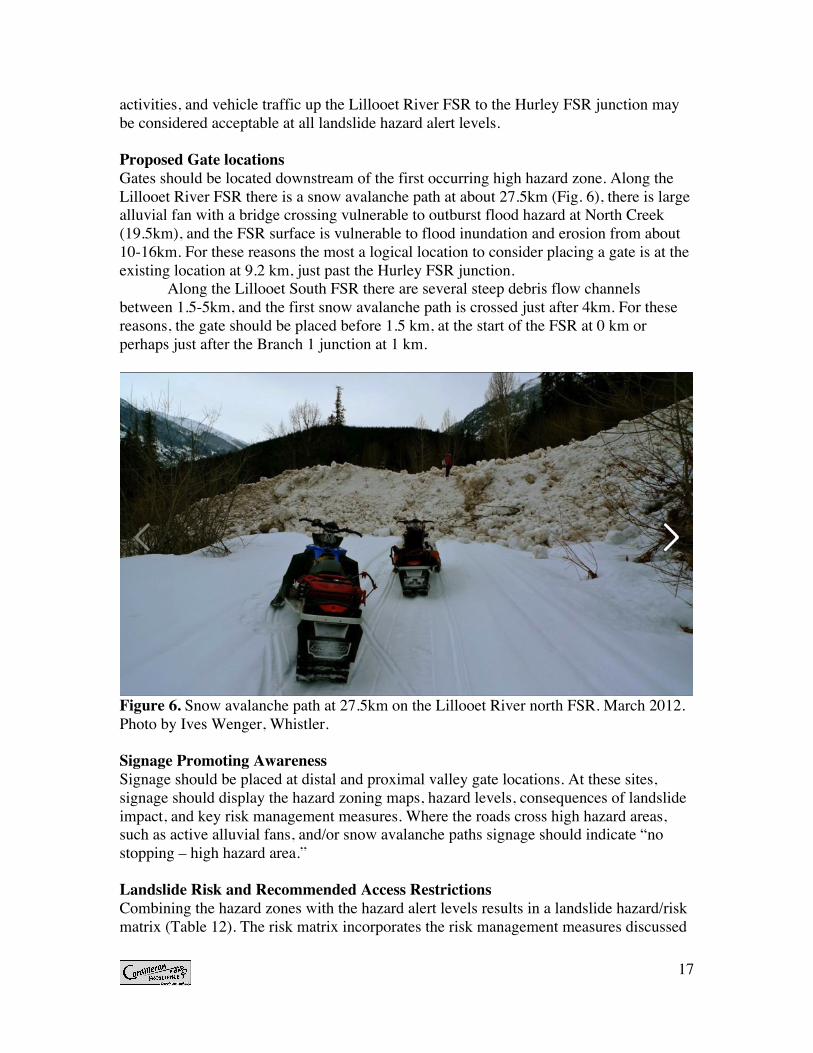
Figure 6. Snow avalanche path at 27.5km on the Lillooet River north FSR. March 2012. Photo by Ives Wenger, Whistler.
List of Appendices Appendix 1: Existing shutdown and startup procedures for Meager Creek Hotsprings and
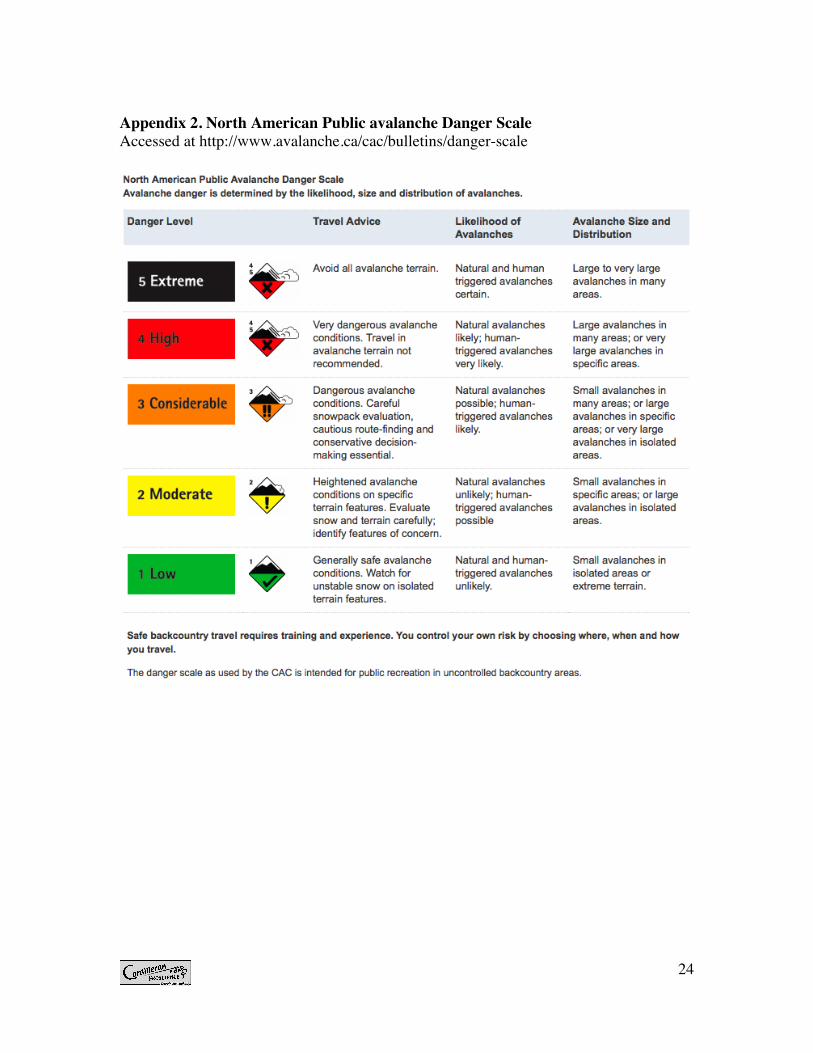
access closure to the Meager Creek drainage. Appendix 2. North American Public avalanche Danger Scale

1
Introduction Since 1999 the Ministry of Forests, Lands and Natural Resource Operations (MoFLNRO) has applied landslide risk management as part of the operation of Meager Creek Hotsprings Recreation Site. This procedure allowed only day use of the Hotsprings Recreation Site, shifted overnight camping to a designated site at the mouth of Meager Creek (now closed) and managed access into Meager Creek according to an operational shutdown procedure (Appendix 1).
The occurrence of the August 6, 2010 landslide (Friele 2010) heightened the awareness of the landslide risk in Lillooet River valley and has led to a desire for a revised access management plan. Following the landslide, the gate location was shifted downstream from the start of Branch 3 up Meager Creek to 9.2 km just past the Hurley FSR junction on the Lillooet FSR.
This report reviews the volcanic landslide hazards and partial risks affecting the crown portion of Lillooet River valley upstream of Pemberton Meadows rural/residential area, and proposes a landslide risk management plan for MoFLNRO.
Scope Hazard mapping was based on 1/20,000 scale TRIM maps. Extensive basin-wide mapping of all hazard areas is beyond the scope of this project. The primary focus is on the risk associated with volcanic landslides affecting the mainline travel corridors. Other hazards affecting the travel corridors (flooding, snow avalanche) are considered insofar as they contribute to choosing a reasonable location for controlling access. More detailed 1/5000 scale mapping is commensurate with operational level TSA and is the responsibility of industrial users.
Hazard & Risk Assessment A hazard is a phenomenon with the potential to cause harm; it is usually represented by a magnitude and recurrence interval (see Table 1). Consequence is a product of factors, including whether a given hazard will reach a site, whether elements at risk will be present when the site is affected by the hazard, how vulnerable the elements at risk are to the hazard affecting the site, and the value of the elements at risk or the number of persons exposed. The product of the factors Hazard and Consequence equals Risk. A Partial Risk is the probability of a given hazard affecting a site, otherwise known as the encounter probability. In British Columbia, terrain stability assessments (TSAs) in the forest sector typically present partial risk assessments, because the details of human (or other elements at risk) exposure to the hazard are generally not known in enough detail to conduct a meaningful total risk assessment site (Wise et al. 2004).
No activity is free of risk, and the concept of safety embodies risk tolerance. In Canada and BC there is no legislated guidance for risk tolerance to landslides and associated phenomenon, and the term “safe” has not been defined. In considering risk tolerance, an important concept is that risk of loss of life from natural hazards should not add substantially to those that one is typically subject to (driving, health, recreation, etc) combined. For reference, the risk of death and injury from driving in Canada is approximately 1/10,000 and 1/1000 per annum, respectively (Transport Canada 2011).
2
Table 1. Qualitative hazard frequency categories (after MoE 1999). Qualitative frequency
Annual return frequency
Comments
Very high >1/20 Hazard is well within the lifetime of a person or typical structure. Clear fresh signs of hazard are present.
High 1/100 to 1/20 Hazard could happen within the lifetime of a person or structure. Events are identifiable from deposits and vegetation, but may not appear fresh.
Moderate 1/500 to 1/100 Hazard within a given lifetime is possible, but not likely. Signs of previous events may not be easily noted.
Low 1/2500 to 1/500 The hazard is of uncertain significance. Very low <1/2500 The occurrence of the hazard is remote.
The report forms a “model” for managing volcanic landslide risks facing public user groups and Ministry of Forests, Lands and Natural Resource Operations personnel, as per APEGBC & ABCFP (2008). Industrial user groups are encouraged to prepare their own terrain models and operational safety plans, as per WorkSafeBC, Occupational Health and Safety Regulation, Sections 4.1 and 4.2.
Volcanic Landslide Hazard The analysis is restricted to volcanic landslides not associated with eruptive activity. Mount Meager Volcanic Complex (MMVC) last erupted 2400 years ago. Geothermal and earthquake activity indicates an active magma chamber beneath the complex (Friele et al. 2008). Volcanic eruptions are typically heralded by increases in magmatic earthquake activity. Earthquakes in British Columbia are monitored by NRCan’s Pacific Geoscience Centre. Thus, it is assumed that a warning would precede eruptive activity and timely evacuation would occur. Hazard Frequency and Magnitude Friele et al. (2008) compiled all known non-eruption related landslides in a frequency-magnitude (F-M) diagram for the entire MMVC (Fig. 1). The grey shaded band on Figure 1 was the assumed error in the frequency estimate. This model is useful for estimating landslide risk downstream of the Meager Creek confluence where the hazard from both proximal valleys merges.
On the flanks of the MMVC there are several volcanic source basins: in Meager Creek there is Capricorn, Canyon, Angel, No Good, Boundary, Devastation Creeks; while in upper Lillooet River there is Job, Affliction, and Plinth. Each of these source basins will have its own unique F-M relationship, but the aggregate of them all should sum to the F-M model for the entire Massif. In addition to these volcanic source basins, the FSRs cross several large active fans from granitic basins including Hotsprings, Salal, Pebble, South and North Creeks, and several other smaller basins (e.g., Spidery Creek).
Following the August 6, 2010 landslide, Jakob (in press) compiled all landslide data for Capricorn Creek to produce an F-M diagram for that basin (Fig. 1), the only F-M model for a source basin that spans the full range of possible landslide sizes. The Capricorn F-M model represents approximately 25% of the hazard depicted by the
3
MMVC model, implying Capricorn is one of the most landslide prone basins. Other very geomorphologically active basins include Devastation Creek and Job Creek.
Figure 1. Frequency-Magnitude model for Mount Meager volcanic complex (MMVC)(Friele et al, 2008) and for Capricorn Creek (Jakob, in press). Capricorn represents a single basin, while MMVC represent the entire massif. The red lines indicate the mean and max/min frequencies for magnitudes modeled by Simpson et al. (2006). Affected Areas Mapping of volcanic landslide deposits within the proximal valleys, being those areas of Meager Creek and Lillooet River upstream of the Meager confluence, has been conducted by Jordan (1994), Stasiuk et al (1996), Friele and Clague (2004) and Friele et al (2008), and the impacts of several recent large events have been documented by Bovis and Jakob (2000), Friele (2009) and Friele (2010)(the latter three all from Capricorn Creek).
Modeling of potential volcanic debris flows from Mount Meager was conducted by Simpson et al. (2006), based on the empirical GIS-interface model LAHARZ (Iverson et al, 1998). The model (Fig. 2) mapped inundation areas for discrete landslide volumes 1x10⁶, 1x10⁷, 1x10⁸ and 1x10⁹m3. Events larger than 1x10⁹m3 were considered not credible by Friele et al. (2008). The model has been designed for delineating hazard zones in distal rather than proximal hazard areas. Proximal Zones The proximal valleys are filled with volcanic landslide debris from numerous individual events spanning 10,000 years since deglaciation: individual Class 8 landslide (Table 2) deposits are 150 m thick or more, Class 7 landslide (Table 2) deposits may be up to 50 m

4
thick, and Class 6 landslide (Table 2) deposits several 10s of metres thick. All deposits are characterized by large spatial variability in deposit thickness.
Deposit thickness is only an indication of the spatial impact of the landslide hazard as the cross sectional area occupied by the peak discharge trimlines may be much larger than the area occupied by the deposit at rest. For example the Class 6, 1931 Devastation debris flow ran 60m up the opposing valley wall of Meager Creek, while the Class 7, 2010 Capricorn event ran 275m up the opposing valley wall, falling back, then up some 100m and then careened upstream and downstream at subsequently lower heights. Because of this dynamic behaviour, the modeling by Simpson et al (2006) cannot be used to convey hazard zones within proximal valleys. Distal Zone In the LAHARZ model (Iverson et al, 1998), the confidence interval of the regression is such that the mean estimate for the inundation area for one magnitude (e.g., 1 x 10⁸ m3) is coincident with the upper and lower bounds for the next smaller (e.g., 1 x 10⁷ m3) and larger (e.g., 1 x 10⁹ m3) magnitudes, respectively. Thus, a 1 x 10⁸ m3 event could stop at the Meager Creek confluence, or could reach Lillooet Lake. That there is considerable uncertainty in the prediction of landslide inundation area was illustrated by the August 6, 2010 event; a Class 7 landslide (Table 2) with a magnitude of 4 x 10⁷ m3. This event would have been predicted to reach between 9-12km downstream from the Meager Creek confluence (24-27km on the Lillooet River FSR), but only reached about 2km downstream from the confluence (34km on the FSR), the extent predicted for a 1x10⁶ m3 event.
Figure 2. Travel distance along Lillooet River of selected volcanic landslides originating in Job Creek (after Simpson et al 2006). Job Creek, Devastation Creek, Angel Creek and Capricorn Creek were modeled.

5
Consequences of Volcanic Landslide Impacts The consequences of large volcanic landslides are extremely severe (Table 2). Table 2. Consequences of volcanic landslides (after Jakob 2005).
Class Volume (m3)
Potential consequences1
6 106 - 107 Could obliterate valleys or fans up to several tens of km2 in size, and dam large rivers with the potential for destructive outburst floods and hyperconcentrated flows. Modeling indicates debris flows travel up to 5 km downstream from the Meager-Lillooet river confluence. The 1931 Devastation debris flow reached Lillooet River and caused muddy surges 15 km downstream.
7 107 - 108 Could inundate large valleys up to 100 km2 in size, and dam large rivers with the potential for destructive outburst floods and hyperconcentrated flows. Modeling indicates debris flows may reach upstream limits of settlement in Pemberton Valley, 32 km downstream from MMVC.
8 108 - 109 Vast and complete destruction over hundreds of km2. Modeling indicates debris flows would inundate the entire Lillooet River valley, traveling 20-75 km downstream from Mount Meager to Lillooet Lake. Field evidence documents three debris flow deposits 32-50 km downstream from the volcano.
9+ >109 No known events.
Partial Risk Mapping Partial risk is the probability of a given location being affected by a hazard (i.e., PH x PS:H)(Wise et al. 2004). Smaller events are more frequent, but impact smaller areas; whereas large events are more rare, but impact larger areas. The hazard levels in Table 1 applied spatially are used herein to convey partial risk categories. Proximal Zones Due to the presence of multiple source basins, imperfect knowledge of the F-M relationship for each basin, complex valley topography, and variable landslide rheology, it is very difficult to delineate hazard zones within the proximal valleys. As a result, hazard zones could be conservatively delineated, as per the guidelines set out in Table 3. This mapping has not been completed by MoFLNRO to date.

6
Table 3. Spatial hazard zone for proximal valleys. Landform Hazard (Table 1) Affected area Source basin (i.e., Capricorn, Canyon, Angel, No Good Creek, Boundary, Devastation, Hotsprings, Job, Affliction, Salal, Plinth, Pebble and other smaller basins)
High Encompassing entire watershed area delineated from fan apex.
Source basin alluvial fan High Encompassing entire fan surface Opposing walls High Encompassing opposing wall for
width of fan x 1.5, semicircle apex 40 m above river level
Opposing walls Moderate Encompassing opposing wall for width of fan x 2, semicircle apex 100 m above river level
Opposing walls Low Encompassing opposing wall for width of fan x 3, semicircle apex 300 m above river level
Intervening valley areas High Valley walls up to 20 m above river level.
Intervening valley areas Moderate Valley walls up to 50 m above river level.
Intervening valley areas Low Valley walls up to 125 m above river level
Snow avalanche paths High From air photo or available forest cover mapping.
Distal Zone The frequency of occurrence of volcanic landslides affecting that portion of Lillooet River between the Meager Creek confluence and the Forestry Bridge was estimated in the following way: • For the four landslide classes modeled by Simpson et al. (2006)(. 2), the average,
maximum and minimum frequencies were recorded (Fig. 1, Table 4). • Next, the Lillooet River valley from the Meager confluence to the Hurley FSR
junction was divided into two zones: the confluence to the downstream limit of 107 m3 landslides at about 29 km (Figs. 2 & 3), and 29 km to the Forestry Bridge. The probability of volcanic landslide hazards affecting the upstream reach (Meager confluence to 29km) is the sum of the 107 m3, 108 m3 and 109 m3 volcanic landslide hazard frequencies, while the hazard affecting the downstream reach (29 km to Forestry Bridge) is the sum of the 108 m3 and 109 m3 volcanic landslide hazard frequencies (Table 5).
• Finally, the average frequency of occurrence was plotted at the mid point of the reach, and the maximum and minimum estimates were plotted at the upstream and downstream ends of each reach, respectively, thereby mimicking the spatial uncertainty in travel for each magnitude class (as described previously). These values were used to define partial risk zones according (Table 1, Fig. 3).

7
Table 4. Frequency of occurrence of volcanic landslides from Mount Meager.
Volcanic landslide volume (m3)
Volcanic landslide frequency (from Figure 1)
Maximum Average Minimum 1 x 10⁶ 1/10 1/30 1/60 1 x 10⁷ 1/60 1/150 1/300 1 x 10⁸ 1/300 1/800 1/2000 1 x 10⁹ 1/2000 1/5000 1/10000
Table 5. Volcanic landslide hazard affecting the distal reach of Lillooet River valley.
Confluence to 29km = sum of probabilities for
107, 108 and 109 m3 landslide classes
29km to Forestry Bridge = sum of probabilities for
108 and 109 m3 landslide classes Return freq (years) Probability Return freq (years) Probability Max 1/50 64% in 50 years 1/250 18% in 50 years Av 1/125 33% in 50 years 1/690 7% in 50 years Min 1/250 18% in 50 years 1/1700 3% in 50 years
By this method, in the vicinity of the confluence of Meager Creek the frequency of occurrence of large volcanic landslides is estimated to be 1/50 per annum. Historically, two landslides larger than 106 m3 have affected this area, the October 1931 event and the Aug 2010 with an apparent frequency of 1/40 per annum. Conversely, at Hillaby Farm, on the south side of the Lillooet River opposite the Hurley FSR junction, drilling (Friele et al 2005) has revealed three events in about 6000 years, with an apparent frequency of 1/2000. Thus, the representation of the hazard on Figure 3 appears reasonable.

Snow avalanche
Hur
ley
junc
tion
37km
Outburst �ood hazard
Pebble Creek Hotsprings
Hillaby Farm
0km FSR
Meager Creek Hotsprings
High: 1/20-1/100 per annum
Moderate: 1/100-1/500 per annum
Low: 1/500-1/2000 per annum
Volcanic Landslide Hazard Zones
North CreekSouth Creek
Spid
ery
Cree
kMeager C
reek
Snow avalanche
Outburst �ood hazard
27.5 km Snow avalanche
Floo
d ha
zard
Hur
ley
junc
tion
North
Cre
ek B
r.
Pebble Creek Hotsprings
1/125 per annum33% in 50 years
1/250 per annum18% in 50 years
Estimated encounter probabilities. See report.
1/50 per annum64% in 50 years
1/690 per annum7% in 50 years
1/1700 per annum3% in 50 years
27km
14km
Gate
0km FSR
Lillooet River north FSR
Lillooet River south FSR

9
Climate Thresholds for Landslide Initiation Volcanic landslides at Meager Creek are conditioned by many factors including slope relief, glacial oversteepening, debuttressing by glacier retreat, weak rock including hydrothermally altered bedrock, and time (Friele et al 2008). Not all landslides are formed in the same way: small debris flows may be caused by runoff mobilizing debris stored along channels, whereas large debris flows or rock avalanches may be derived from deep-seated slope failures (e.g., Jakob and Friele 2009). Some landslides may occur without an apparent trigger, and others may be clearly triggered by phenomenon such as earthquake or intensive precipitation, or rapid snowmelt or both. Historic Landslides with Climate Data At MMVC several historic landslides have been ascribed to weather-related triggers (Table 6; Fig. 4): the 1975 Devastation, 1998 Capricorn and 2010 Capricorn events occurred during late summer heat waves; according to Jordan (1994), many small debris flows are triggered in early fall by small rainstorms that follow long dry spells, such as at Boundary and No Good creeks in 1988 and on Capricorn and Plinth Creeks in 2009; while the 1931 Devastation debris flow and the 1984 Hotsprings and Affliction Creek debris flows occurred during October rains with presumably very little snow cover. Due to the remoteness of the location, the lack of local weather monitoring, the movement of Pemberton weather stations over time, the small number of historic landslides with known antecedent weather conditions, and the variability of the phenomenon it is not feasible to provide an accurate and reliable weather-related shutdown procedure based on statistically significant analysis. Thus, judgment is applied. Table 6. Dated landslides with climate data. Climate data is from Pemberton BCFS (1969-1984) or Pemberton airport (1984-2012). Max. daily temp. (ºC) Rainfall (mm)
Event Climate driver Daily max. 6 day av. 24 hr 48 hr 120 hr
Devastation July 22 1975 Heat 29 23 0 0 0 Capricorn July 29 1998 Heat 36 38 0 1.4 1.4 Capricorn August 6 2010 Heat 27 29 0 0 0 Boundary Sept 6 1988 Heat&Rain 20 30 183 18 18 Capricorn Sept 19 20091 Heat&Rain 22 20 21 31 39 Hotsprings Oct 8 19842 Rain 12 13 24 92 108 Boundary November 9 1989 Rain 12 9 31 874 69 1Also an event at Plinth Creek. 2Also an event at Affliction Creek. 3The recorded rainfall at Pemberton was 1.6 mm, but Jordan (1994) recorded 18 mm at No Good Creek.
4 The recorded rainfall at Pemberton was 58 mm, but Jordan (1994) recorded 87 mm at No Good Creek.

10
Figu
re 4
. Cha
rts o
f 2-w
eek
ante
cede
nt c
limat
e da
ta fo
r vol
cani
c la
ndsli
des w
ith k
now
n da
tes o
f occ
urre
nce.
Cl
imat
e da
ta is
from
Pem
berto
n BC
FS (1
969-
1984
) or P
embe
rton
airp
ort (
1984
-201
2). T
he e
vent
s are
gro
uped
in
to th
ree
seas
onal
clim
ate
trigg
ers:
sum
mer
hea
t; la
te su
mm
er h
eat w
ith ra
in; a
nd fa
ll ra
in. N
o la
ndsli
des a
re
know
n to
hav
e oc
curre
d in
win
ter o
r spr
ing.
Max
T is
dai
ly m
axim
um te
mpe
ratu
re (º
C). 6
day
T is
6 d
ay ru
nnin
g m
ean
of d
aily
max
T (º
C). 2
4hr p
pt is
dai
ly ra
infa
ll (m
m).

11
In summary, volcanic landslides have occurred during: • heat waves when the maximum daily temperature recorded at Pemberton airport is ≥20
ºC and the 6 day average maximum daily temperature is ≥25 ºC, or when the maximum daily temperature is ≥25ºC and the 6 day average maximum daily temperature is ≥ 20 ºC;
• heat waves when both the maximum daily temperature and the 6 day average maximum daily temperature is ≥ 20 ºC and the 24 hr rainfall is ≥ 20 mm; and
• fall rainstorms when the 24 hr rainfall is ≥ 25 mm and the 48 hr rainfall is ≥ 60 mm.
However, landslides are not automatically triggered whenever these conditions are met. Due to the incompleteness of the landslide record, and the lack of local climate data it is not feasible to assign probabilities of occurrence of a volcanic landslide at MMVC given these conditions. It is judged that these conditions establish the lower bound for landslide occurrence: below the threshold the landslide hazard is low, while above the landslide hazard is moderate or better. Existing Rainfall and Landslide Hazard Criteria Environment Canada issues rainfall warnings when the 24hr rainfall is forecast to be ≥50mm and the 48hr rainfall ≥75mm (http://www.ec.gc.ca/meteo-weather/default.asp?lang=En&n=D9553AB5-1#rainfall). Baumann and EBA (1999) established the following climate criteria for closure of Meager Creek:
• Average 6 day mean maximum daily temperature ≥25°C; • 24 hour rainfall (actual or forecast) of 20mm/24 hour, in conjunction with 2 to 5 days
of temperatures averaging ≥25°C. • 24 hour rainfall ≥70mm/24 hour.
Existing Climate and Frequency of Exceedence of Existing Hazard Criteria A climate station was installed at Meager Creek confluence in July 2010. There is automated data from July 14, 2010 to February 2012. The nearest long term climate records are from Pemberton. The relationship between Meager Pemberton climate data for July-Dec 2010 and all of 2011 is presented in Figure 5. The 2012 data was not examined because landslide hazard is low in January, February and March. In July and August 2010 Pemberton was a reasonable proxy for maximum dailt temperature at Meager Creek; however, in the summer of 2011 Pemberton was 10-15 °C warmer than Meager. With respect to fall and early winter daily precipitation, Meager was 5-15mm wetter in 2010; while in 2011 the difference fluctuated about zero difference, but the variance (1 stdev) was 10mm.
These data do not provide a long enough record to make statements about general patterns, although it is likely that in summer Meager will be cooler and in fall and early winter Meager will be wetter. It will take many years to be able to draw good correlations.

12
Figure 5. Mean and standard deviation of daily differences between Pemberton airport and Meager climate stations.

13
There are no published Climate Normals for Pemberton; although records have been kept since 1969, the weather stations have moved and the data quality is poor, with lots of missing data. Two main records exist: that from the old British Columbia Forest Service office in downtown Pemberton (1969-1984) and from the Pemberton Airport (1984-2011). Temperature and precipitation data for Pemberton Airport (1984-2011) were downloaded (http://www.climate.weatheroffice.gc.ca) and are summarized in the Tables 8 & 9. The daily peak temperature and 24 hr. precipitation record (28 yrs.) is incomplete; for any given month, on average 10% (Table 8) and 30-50% (Table 9) of data are missing, respectively.
Summer heat is elucidated in Table 8. July and August see about 19-20 days per month with temperatures exceeding 25 °C, while the shoulder season (May-Jun, Sep) sees 5-10 days exceeding 25 °C. June through August may experience 1-3 days/month with maximum daily temperatures exceeding 35 °C, and may reach 40 °C in July. Table 8. Data range, quality, maximum daily temperature and number of days exceeding 25 °C, 30 °C and 35 °C, Pemberton Airport 1984-2011 (n=28). Data Quality Climate Statistics & Thresholds Month
Day
s of r
ecor
d (2
8 ye
ars)
Day
s da
ta r
ecor
ded
% ti
me
data
reco
rded
M
onth
s da
ta re
cord
ed
Max
. dai
ly
tem
p. (°
C)
Av.
day
s/mon
th
max
. tem
p. ≥
25
°C
Av.
Day
s/mon
th
max
. tem
p.≥
30 °C
Av.
day
s/mon
th
max
. tem
p.≥
35 °C
Jan 868 721 83% 11.7 8 0 0.0 0.0 Feb 812 707 87% 18.8 13.6 0.0 0.0 0.0 Mar 868 775 89% 21.8 23.3 0.0 0.0 0.0 Apr 840 788 94% 23.5 30.1 1.0 0.6 0.0 May 868 825 95% 25.7 34.5 5.9 1.3 0.0 Jun 840 790 94% 25.0 39.4 12.0 4.6 0.9 Jul 868 786 91% 26.2 40.6 20.0 10.4 2.9 Aug 868 805 93% 26.6 38.1 19.4 10.1 1.3 Sep 840 794 95% 25.7 35.9 9.4 2.3 0.1 Oct 868 802 92% 24.7 27.7 0.4 0.0 0.0 Nov 840 734 87% 18.4 13.6 0.0 0.0 0.0 Dec 868 766 88% 16.3 9.5 0.0 0.0 0.0 Note: For colour codes see Table 11.
Monthly maximum 24 hr. (daily) precipitation ranges from 30-70 mm/24 hr. with 40-70 mm/24 hr. possible from October through March. A rainfall intensity of 20 mm/24 hr. occurs 1-2 days/month from October through January; 50 mm/24 hr. occurs 0.2-0.5 days/month from November through January; and 75 mm/48 hr. occurs 1-2 days/month October through January.

14
Table 9. Data range, quality, maximum daily rainfall and number of days exceeding 20 mm/24hr, 50 mm/24hr and 75 mm/48hr, Pemberton Airport 1984-2011 (n=28). Data Quality Climate Statistics & Thresholds Month
Day
s of r
ecor
d (2
8 ye
ars)
Day
s da
ta r
ecor
ded
% ti
me
data
reco
rded
M
onth
s da
ta re
cord
ed
Max
24
hr p
pt.
Av.
Day
s/mon
th
24 h
r. pp
t. ≥
20 m
m
Av.
Day
s/mon
th
24 h
r. pp
t. ≥
50 m
m
Max
. 48
hr p
pt.
Av.
Day
s/mon
th
48 h
r. pp
t. ≥
75 m
m
Jan 868 351 40% 11.7 72 1.6 0.4 115 0.9 Feb 812 565 70% 18.8 41.5 0.4 0.0 55.6 0.0 Mar 868 655 75% 21.8 43.2 0.6 0.0 66.2 0.0 Apr 840 704 84% 23.5 31.2 0.2 0.0 35.8 0.0 May 868 772 89% 25.7 32 0.1 0.0 33.4 0.0 Jun 840 749 89% 25.0 47.2 0.3 0.0 61.4 0.0 Jul 868 786 91% 26.2 43 0.2 0.0 43.8 0.0 Aug 868 799 92% 26.6 28.8 0.1 0.0 36 0.0 Sep 840 771 92% 25.7 37 0.3 0.0 50.8 0.0 Oct 868 742 85% 24.7 41.8 1.8 0.0 67 0.0 Nov 840 551 66% 18.4 67.1 2.2 0.2 94.3 0.1 Dec 868 490 56% 16.3 40.2 1.4 0.0 69.2 0.0 Note: For colour codes see Table 11.
The published intensity-duration-frequency (IDF) curve for Pemberton BCFS (Table 10) indicates a 50mm/24hr rainfall equates to a 2yr return event for Pemberton, while a 70mm/24hr rainfall equates to a 10yr return event. There are no IDF curves for montane areas representative of the study area. The nearest is Whistler, and the IDF values for 24hr events are similar to that of Pemberton. Table 10. Intensity (mm/hr) Frequency-Duration data for Pemberton BCFS (Environment Canada). 2 yr 5 yr 10 yr 25 yr 50 yr 100 yr 1 hr 8.0 11.3 13.4 16.1 18.1 20.1 2 hr 6.0 8.2 9.7 11.5 12.9 14.2 6 hr 3.9 5.3 6.3 7.5 8.4 9.2 12 hr 2.7 3.7 4.1 4.8 5.4 5.9 24 hr 1.9 2.5 2.9 3.4 3.7 4.1 Recommended Climate Thresholds Climate trigger hazard criteria are judgmentally established below, based on the comparison of observed landslide climate triggers and the last 28 years climate data, as outlined by the general observations below: • The existing range of maximum daily temperature, 24 hr and 48 hr precipitation defines
the bounds on criteria for climate thresholds (Tables 8 & 9).

15
• Maximum daily temperature of 25 °C, June through September, 10-20 exceedences/month. Approximate threshold between Low and Moderate hazard.
• A maximum daily temperature of 30 °C, June through August, 5-10 exceedences/month. Approximate threshold between Moderate and High hazard.
• A maximum daily temperature of 35 °C, June through August, 1-3 exceedences/month. Approximate threshold between High and Extreme hazard.
• Sustained temperatures, or heat waves add to meltwater and increase the hazard. • A 20 mm/24 hr rainfall, October through January, 1-2 exceedences/month.
Approximate threshold between Low and Moderate hazard. • A 50 mm/24 hr rainfall, the Ministry of Environment rainfall warning, October through
January, <1 exceedences/month. Approximate threshold between Moderate and High hazard.
• A rainfall of 70 mm/24 hr has a 10 year return interval and defines the break between High and Extreme hazard.
• Rainfall following sustained heat adds to runoff and increases the hazard. • A rainfall of 75 mm/48 hr, the Ministry of Environment rainfall warning, has <1
exceedences/month, October through January, and is an Extreme hazard level. These general observations are embodied in Table 11. Table 11. Hazard levels for landslide risk management. These thresholds should be revised and updated as new data allow.
Max. daily temp. (ºC) Rainfall (mm) Hazard Level Daily max. 6 day av. 24 hr 48hr Low <25 .. .. .. Low <20 <20 <20 <50 Moderate ≥25 .. .. .. Moderate ≥20 ≥25 .. .. Moderate .. .. ≥20 ≥50 Moderate ≥20 ≥20 ≥10 .. High ≥30 .. .. .. High ≥25 ≥30 .. .. High .. .. ≥50 ≥75 High ≥25 ≥25 ≥20 .. Extreme ≥35 .. .. .. Extreme .. .. ≥70 ≥100

16
Landslide Risk Management Risk Management Plan Objectives • Promote awareness and human safety. • Plan is to be simple, practicable and credible to the general public and industrial users. If the mainline roads are closed too often, the public and industrial users will likely reject the risk management plan. To function properly, access restrictions have to be respected by user groups. For such a large area with two proximal valleys and downstream distances up to 30 km removed from the landslide source, there is considerable spatial complexity in the distribution of hazard zones, and implementation could become unduly complicated. The management plan needs to balance safety with simplicity and yet remain credible.
Industrial are required to operate under a “natural hazards operational safety plan” prepared and signed off by a qualified professional, consistent with the guidelines set out by APEGBC/ABCFP (2008) and WorksafeBC regulations. Climate Monitoring Climate data should be monitored at Meager Creek and Pemberton. The relationship between the stations should be compared to develop correlations. The hazard levels discussed above, developed from Pemberton climate data should be modified as correlations improve. For forecasting, refer to Pemberton weather forecasts provided by Environment Canada. Hazard levels are presented in Table 11. Landslide Risk Management Measures Landslide risk management may include some or all of the following measures: • Reference to landslide hazard maps (Appendix 2) and/or detailed TSAs; • Signage at key locations displaying hazard zoning maps and hazard levels (Table 11); • Monitoring/forecasting of hazard levels; • Posting hazard levels on signs at key locations, on websites & radio, and in print media; • Recommending exposure reduction at certain hazard levels for certain hazard zones; • Controlling access at key locations during periods of high or extreme hazard; • Requiring industrial users to develop operational safety plans.
The MoFLNRO District Manager, or his designated officials have the authority to
close FSR roads. Vehicle access to the Lillooet River drainage and headwater drainages of Meager Creek and upper Lillooet River may be restricted for the following reasons: • Landslide hazard (debris flows, rock avalanches, etc.) is very high or extreme due to hot
weather, rainfall or both; • Snow avalanche risk affecting mainline roads is high; • Flood hazard affecting mainline roads is high and/or roads are inundated. Access to Hurley FSR The distal reach of Lillooet River is vulnerable to volcanic landslides, but at a low return frequency (Table 1). In these areas, the landslide risk may be tolerable for non-permanent
17
activities, and vehicle traffic up the Lillooet River FSR to the Hurley FSR junction may be considered acceptable at all landslide hazard alert levels. Proposed Gate locations Gates should be located downstream of the first occurring high hazard zone. Along the Lillooet River FSR there is a snow avalanche path at about 27.5km (Fig. 6), there is large alluvial fan with a bridge crossing vulnerable to outburst flood hazard at North Creek (19.5km), and the FSR surface is vulnerable to flood inundation and erosion from about 10-16km. For these reasons the most a logical location to consider placing a gate is at the existing location at 9.2 km, just past the Hurley FSR junction.
Along the Lillooet South FSR there are several steep debris flow channels between 1.5-5km, and the first snow avalanche path is crossed just after 4km. For these reasons, the gate should be placed before 1.5 km, at the start of the FSR at 0 km or perhaps just after the Branch 1 junction at 1 km.
Figure 6. Snow avalanche path at 27.5km on the Lillooet River north FSR. March 2012. Photo by Ives Wenger, Whistler. Signage Promoting Awareness Signage should be placed at distal and proximal valley gate locations. At these sites, signage should display the hazard zoning maps, hazard levels, consequences of landslide impact, and key risk management measures. Where the roads cross high hazard areas, such as active alluvial fans, and/or snow avalanche paths signage should indicate “no stopping – high hazard area.” Landslide Risk and Recommended Access Restrictions Combining the hazard zones with the hazard alert levels results in a landslide hazard/risk matrix (Table 12). The risk matrix incorporates the risk management measures discussed
18
above. It should be referred to when deciding what risk management measures to implement at various hazard alert levels.
During low hazard access is unrestricted. With respect to public access, at moderate hazard levels, the gates could remain open with landslide risk in low, moderate and some high (e.g., fans) hazard zones managed by public awareness measures such as media postings (MoFLNRO website, radio broadcasts, local newspapers) and signage. Specific high hazard areas, such as the Meager and Pebble Creek Hotsprings sites, should be closed. When the landslide hazard level is high the proximal valleys should be closed, but the distal valley could remain open up to the Branch 3 junction, or some intermediate point such as North Creek. When the landslide hazard level is extreme access should be restricted by gating at 9.2 km on the Lillooet River north FSR and 1km on the Lillooet River south FSR.
Access to proximal and distal valleys should also be restricted appropriately when conditions are noted that suggest landslides have occurred upstream, such as sudden changes in creek discharge or colour,
Allowance of vehicle access into Lillooet River valley would be a return of climate conditions to below thresholds with no evidence of landslide occurrence.
With respect to snow avalanche activity, the Lillooet River drainage shall be gated sometime in early winter coincident with valley bottom accumulations themselves causing restricted access, or if the hazard in the start zones is such that avalanches could affect the roads. The preceding management plan used December 5 as the closure date. This is reasonable, but could be varied year to year as conditions dictate. The road would be opened in the spring once it has been determined by a qualified professional that the snow avalanche risk is low to moderate and will not have an impact on the road.
The exception to these access closures will be for industrial users that are operating under a “natural hazards operational safety plan” prepared and signed off by a qualified professional, consistent with the guidelines set out by APEGBC/ABCFP (2008) and WorksafeBC regulations.

19
Table 12. Recommended landslide hazard/risk management matrix and measures. Landslide Hazard Zones None Low Moderate High
Land
slide
Haz
ard
Leve
l
Low
No action required
No action required No action required No action required.
Mod
erat
e No action required
Tolerable risk for public. Traffic should keep moving. Overnight camping not recommended.
Traffic should keep moving. No overnight camping. Meager and Pebble Creek Hotsprings closed.
Hig
h
May be local terrain hazards. Use judgment.
Traffic should keep moving. Overnight camping not recommended.
Traffic should keep moving. No overnight camping.
Actively avoid these areas if possible, otherwise traffic should keep moving. No overnight camping. Access to proximal valleys closed.
Extre
me
May be local terrain hazards. Use judgment or refer to detailed TSA.
Public access to entire valley is restricted.
Public access to entire valley is restricted.
Public access to entire valley is restricted.
Note: When landslide hazard level is above LOW, industrial operations must be governed by detailed TSA.
20
References APEGBC & ABCFP, 2008. Guidelines for Management of Terrain Stability in the Forest
Sector. APEGBC, Burnaby, BC. Baumann, F.W., Friele, P.A. and Jakob, M. 1999. Meager Creek geologic hazards
assessment and risk management. For B.C. Ministry of Forests, Squamish Forest District.
Bovis, M.J., and Jakob, M., 2000. The July 29, 1998, debris flow and landslide dam at Capricorn Creek, Mount Meager Volcanic Complex, southern Coast Mountains, British Columbia. Can. J. Earth Sci. 37: 1321–1334.
BGC Engineering Inc. 2006. District of North Vancouver, Berkley Landslide Risk Management, Phase 1 Risk Assessment. Report prepared for DNV dated January 13, 2006.
Friele, P.A. 2009. The September 19, 2009, Capricorn Creek debris flow, hazard & risk management report. For Dave Southam, MFR, District of Squamish, BC.
Friele, P.A. 2010. The August 6, 2010 Capricorn Creek Landslide, Meager Creek valley, southwestern British Columbia: Description, emergency response, infrastructure damage and future hazards. For BC Ministry of Environment, Victoria, BC.
Friele, P.A. and Clague, J.J. 2004. Large Holocene landslides from Pylon Peak, southwestern British Columbia. Canadian Journal of Earth Sciences, 41:165-182.
Friele, P.A., Clague, J.J., Simpson, K., and Stasiuk, M., 2005. Impact of a Quaternary volcano on Holocene sedimentation in Lillooet River valley, British Columbia. Sedimentary Geology 176 (2005) 305–322.
Friele, P. A., Jakob, M., and Clague J.J. 2008. Hazard and risk from large landslides from Mount Meager volcano, British Columbia, Canada. Georisk: Assessment and Management of Risk for Engineered Systems and Geohazards, 2(1): 48-64.
Iverson, R.M., Schilling, S.P. and Vallance, J.W., 1998. Objective delineation of lahar-inundation hazard zones. GSA Bulletin, 110 (8): 972–984.
Jakob, M., 1996. Morphometric and Geotechnical Controls of Debris Flow Frequency and Magnitude in Southwestern British Columbia. UBC, PhD Thesis.
Jakob, M., 2005. A size classification for debris flows. Engineering Geology, 79: 151-161.
Jakob, M., in press. The fallacy of frequency: statistical techniques for debris-flow frequency – magnitude analyses. Submitted to the Banff landslide conference, 2012.
Jakob, M., and Friele, P.A., 2009. Frequency and magnitude of debris flows on Cheekye River, British Columbia. Geomorphology, 114: 382–395.
Jordan, P., 1994. Debris Flows in the Southern Coast Mountains, British Columbia: Dynamic Behaviour and Physical Properties. UBC, PhD Thesis.
Simpson, K., Stasiuk, M., Clague, J.J., and Friele, P.A. 2006. Evidence for catastrophic volcanic debris flows in Pemberton Valley, British Columbia. Canadian Journal of Earth Sciences. 43: 679-689.
Stasiuk, M.V., Russell, J.K., and Hickson, C.J., 1996. Distribution, nature, and origins of the 2400 BP eruption products of Mount Meager, British Columbia; linkages
21
between magma chemistry and eruption behaviour. Geological Survey of Canada, Bulletin 486.
Transport Canada, 2011- http://www.tc.gc.ca/eng/roadsafety/tp-tp3322-2007-1039.htm#t12
Wise, M.P., G.D. Moore, and D.F. VanDine (editors). 2004. Landslide risk case studies in forest development, planning and operation. BC Ministry of Forests, Research Branch, Victoria, BC. Land Management Handbook Number 56.
Caveat The Mount Meager Volcanic Complex is the most active landslide region in Canada, and there is always some residual risk. Landslides may occur without warning, by triggers than other than climate, such as by earthquake or gravitational stress.
Closure This report was prepared for use by Ministry of Forests, Lands and Natural Resource Operations, including distribution as required for purposes for which the report was commissioned. The report cannot be distributed to other third parties without prior written consent by Cordilleran Geoscience. The work has been carried out in accordance with generally accepted geoscience practice. Judgment has been applied in developing the conclusions stated herein. No other warranty is made, either expressed or implied to our clients, third parties, and any regulatory agencies affected by the conclusions. If you questions please call. Sincerely, Pierre Friele, P.Geo. Geoscientist

22
Appendix 1: Existing SHUTDOWN AND START UP PROCEDURES FOR MEAGER CREEK HOTSPRINGS AND ACCESS CLOSURE TO THE MEAGER CREEK DRAINAGE Vehicle access to the Meager Creek and Upper Lillooet River drainages may be restricted for the following reasons.
• Snow avalanche risk is high; • High to extreme risk of mass movements (landslides, mud flows, debris flows, etc.)
and flooding. The Upper Lillooet River drainage shall be closed to all vehicles starting December 5 each year. The exception will be industrial traffic, which must retain the services of a qualified person in avalanche assessments. The road will be opened in the spring once it has been determined the avalanche risk is low to moderate and will not have an impact on the road. The hazard rating for mass movements are significantly influenced by three separate climatic events:
• Spring freshets and runoff; • July-August snow and glacier melt; • October-November rains on snow events.
The following guidelines are to be used as criteria to shutdown the Meager Creek Hotsprings Recreation Site and to restrict access to the Meager Creek drainage:
• Instantaneous high flows to the various tributaries within the Meager Creek drainage during spring runoff;
• When average daily temperature for 6 days exceeds 25°C; • Sudden drop in water flow or significant colour change of Meager Creek or its
tributaries shall warrant immediate shutdown of Meager Creek hotsprings and restriction of vehicle access into drainage;
• An actual rainstorm or the forecast of a high intensity rainstorm (20mm/24 hour) in conjunction with 2 to 5 days of temperatures averaging more than 25°C warrants immediate shutdown of the drainage;
• Rainfall intensity exceeds 70mm/24 hour. Industrial activities will be subject to the same criteria if operating within any of the high risk zones of the Meager Creek drainage. Start up or allowance of vehicle access into Meager Creek drainage will be clear reversal of shutdown procedures:
• Meager Creek tributaries return to normal flows; • 6-day temperature average drops below 25°C. (Please note, if the forecast for the next
several days is for extreme temperatures, do not re-open, even if average drops below 25°C);
• The creeks have returned to a more normal coloration and the 6day temperature average has dropped below 25°C;

23
• Minimum of 48 hours after high intensity rainstorm. Who has the authority to close the road:
• MOF District Manager; • Or his designated officials;
The Meager Hotsprings contractor/gatekeeper is to contact the Ministry of Tourism, Sport and the Arts if any of the shutdown criteria has been reached or observed. Contractor has the authority to close the gate unilaterally, if contact with the Ministry of Tourism, Sport and the Arts is not possible. Once the ministry has been advised the shutdown criteria has been reached or have implemented a shutdown, the Public will be notified through Squamish web page and local radio and print media.
Closure Procedures (signs) Contractor shall: Erect road closure signs at Gate (Lillooet
River), and .1km Hurley FSR, and 0km (jct. of Pemberton Valley
Rd/Lillooet FSR)
Contractor shall contact: MoTSA/MFR office 604-898-2100 fax
604-898-2191 Pemberton Visitor Info 604-894-6175
or 8946477 Renville’s 604-894-6423 (Pemb Meadows/Pemb Farm Road) MoTSA shall: Update website
Closure happens: When average temperature for 6 days
exceeds 25°C; or Rainfall exceeds 20mm/24 hours with 2
or more days of temperatures above 25°C; or
Rainfall intensity exceeds 70mm/24 hours.
Start up happens: When average temperature for 6 days
drops below 25°C, and Minimum of 48 hours after high
intensity rainfall. MoTSA shall: Update website
24
Appendix 2. North American Public avalanche Danger Scale Accessed at http://www.avalanche.ca/cac/bulletins/danger-scale