Vmi Ppt Final
13
Virtualization Management Index 2010 Year End Report
-
Upload
josemariagonzalez -
Category
Documents
-
view
229 -
download
0
Transcript of Vmi Ppt Final
8/8/2019 Vmi Ppt Final
http://slidepdf.com/reader/full/vmi-ppt-final 1/13
Virtualization Management Index2010 Year End Report
8/8/2019 Vmi Ppt Final
http://slidepdf.com/reader/full/vmi-ppt-final 2/13
Available Data
• Hosts
• VMs
• Clusters
• Resource Pools
• Storage (allocated, attached)• Memory (allocated, available)
• CPU (allocated, available)
• Power On, Power Off VMs
• Cores, Sockets, vCPU
• VMs with performance problems – CPU, memory, storage,
latency
• VMs under utilized – CPU, memory, storage
VKernel Confidential

8/8/2019 Vmi Ppt Final
http://slidepdf.com/reader/full/vmi-ppt-final 3/13
Analysis Drawn from 578,000 Virtual Machines
VKernel Confidential
Average Size: 225 VMsAverage Hosts: 18Average VM/Host: 15.72500 unique environments
578,000 VMs>50 VMs to be includedFree tools source anonymous data
8/8/2019 Vmi Ppt Final
http://slidepdf.com/reader/full/vmi-ppt-final 4/13
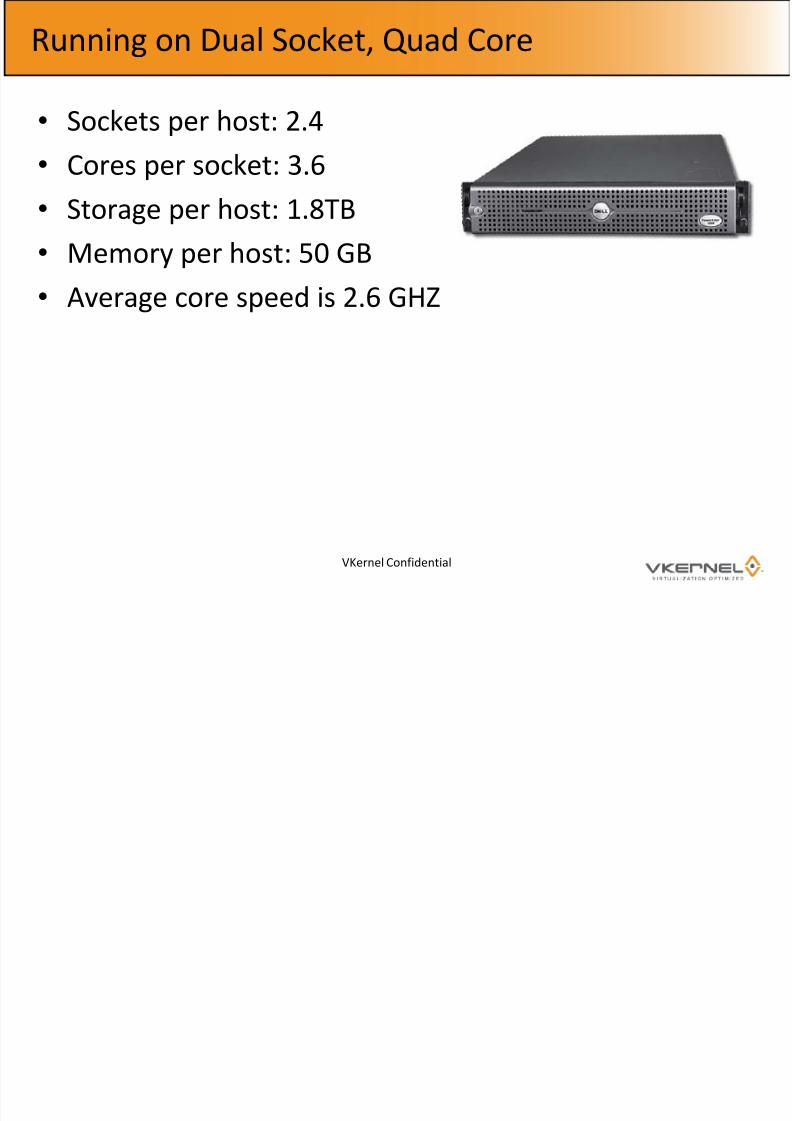
Running on Dual Socket, Quad Core
• Sockets per host: 2.4
• Cores per socket: 3.6
• Storage per host: 1.8TB
• Memory per host: 50 GB
• Average core speed is 2.6 GHZ
VKernel Confidential
8/8/2019 Vmi Ppt Final
http://slidepdf.com/reader/full/vmi-ppt-final 5/13
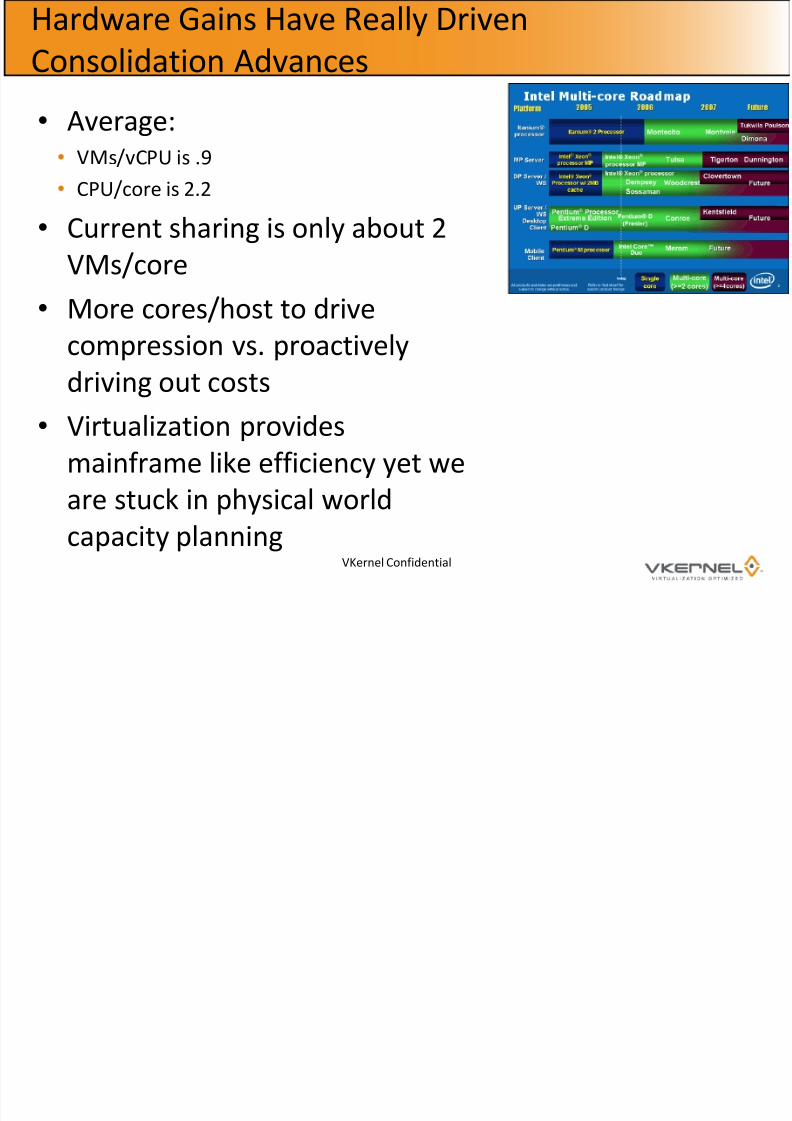
Hardware Gains Have Really Driven
Consolidation Advances
• Average:• VMs/vCPU is .9
• CPU/core is 2.2
• Current sharing is only about 2
VMs/core• More cores/host to drive
compression vs. proactively
driving out costs
• Virtualization providesmainframe like efficiency yet we
are stuck in physical world
capacity planningVKernel Confidential
8/8/2019 Vmi Ppt Final
http://slidepdf.com/reader/full/vmi-ppt-final 6/13
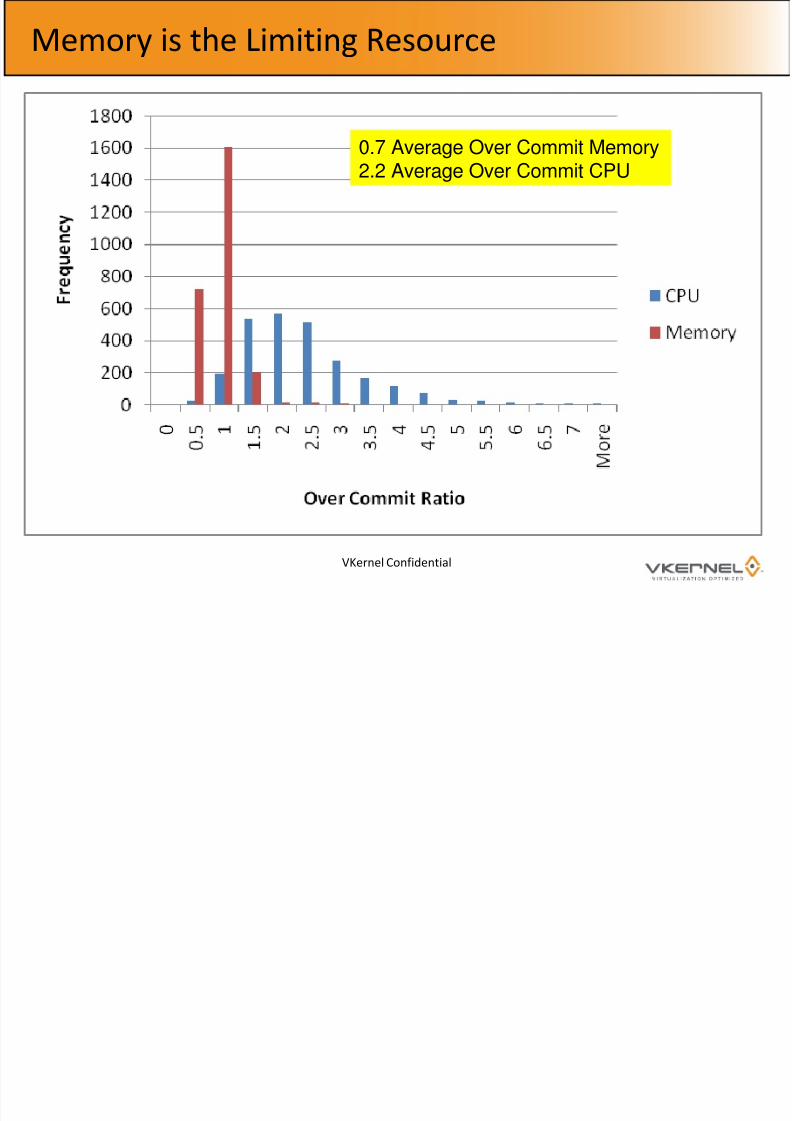
Memory is the Limiting Resource
VKernel Confidential
0.7 Average Over Commit Memory2.2 Average Over Commit CPU
8/8/2019 Vmi Ppt Final
http://slidepdf.com/reader/full/vmi-ppt-final 7/13
Balancing High Density Memory Cost Vs. Fewer
CPUs
• Enterprises are still CPU rich but memory starved
• Cost of higher density memory causing sticker shock
• Efficiency point - higher cost for memory balanced
against:
• Lower power costs for fewer CPUs
• Lower software licensing costs
• Lower datacenter costs for fewer servers
VKernel Confidential
8/8/2019 Vmi Ppt Final
http://slidepdf.com/reader/full/vmi-ppt-final 8/13
Finding High Density Environments
• Start 2563 environments
• Memory allocation >= 1.0
• 236 remaining
• CPU allocation >= 1.0
• 235 remaining
• Zero VM performance issues
• 95 remaining or top 3.7% of sample
VKernel Confidential
8/8/2019 Vmi Ppt Final
http://slidepdf.com/reader/full/vmi-ppt-final 9/13
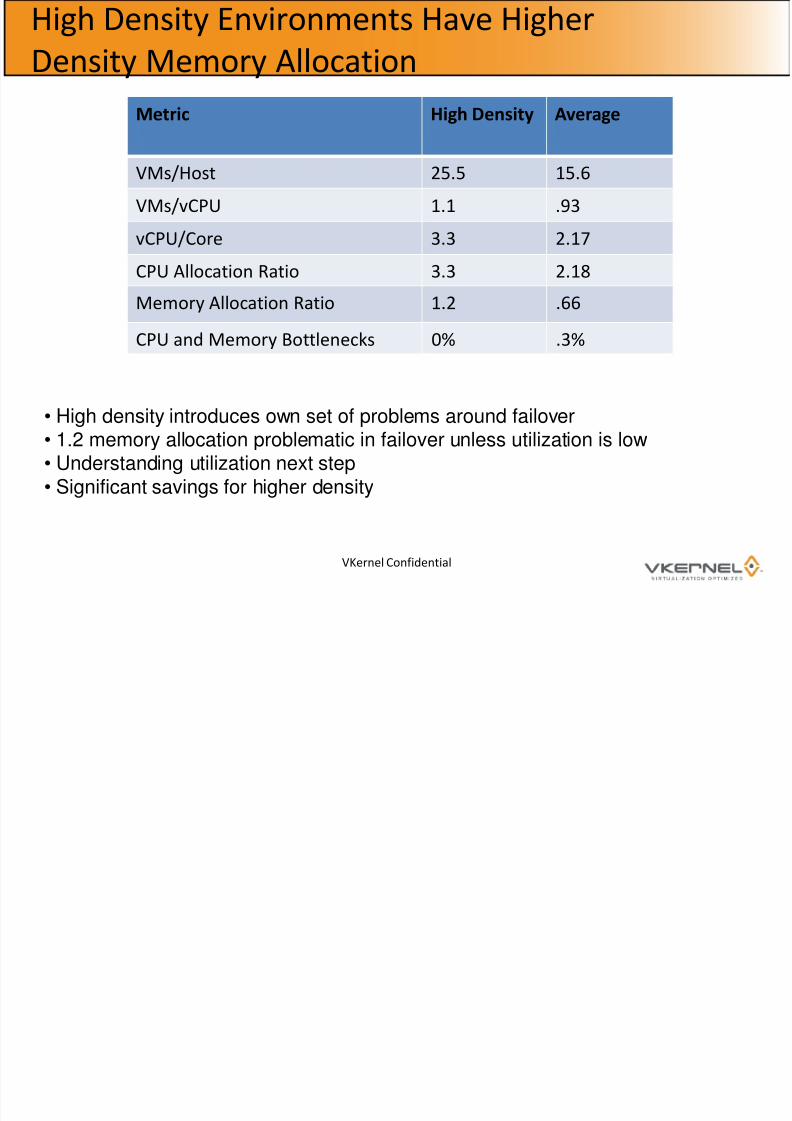
High Density Environments Have Higher
Density Memory Allocation
VKernel Confidential
Metric High Density Average
VMs/Host 25.5 15.6
VMs/vCPU 1.1 .93
vCPU/Core 3.3 2.17
CPU Allocation Ratio 3.3 2.18Memory Allocation Ratio 1.2 .66
CPU and Memory Bottlenecks 0% .3%
• High density introduces own set of problems around failover• 1.2 memory allocation problematic in failover unless utilization is low• Understanding utilization next step• Significant savings for higher density
8/8/2019 Vmi Ppt Final
http://slidepdf.com/reader/full/vmi-ppt-final 10/13
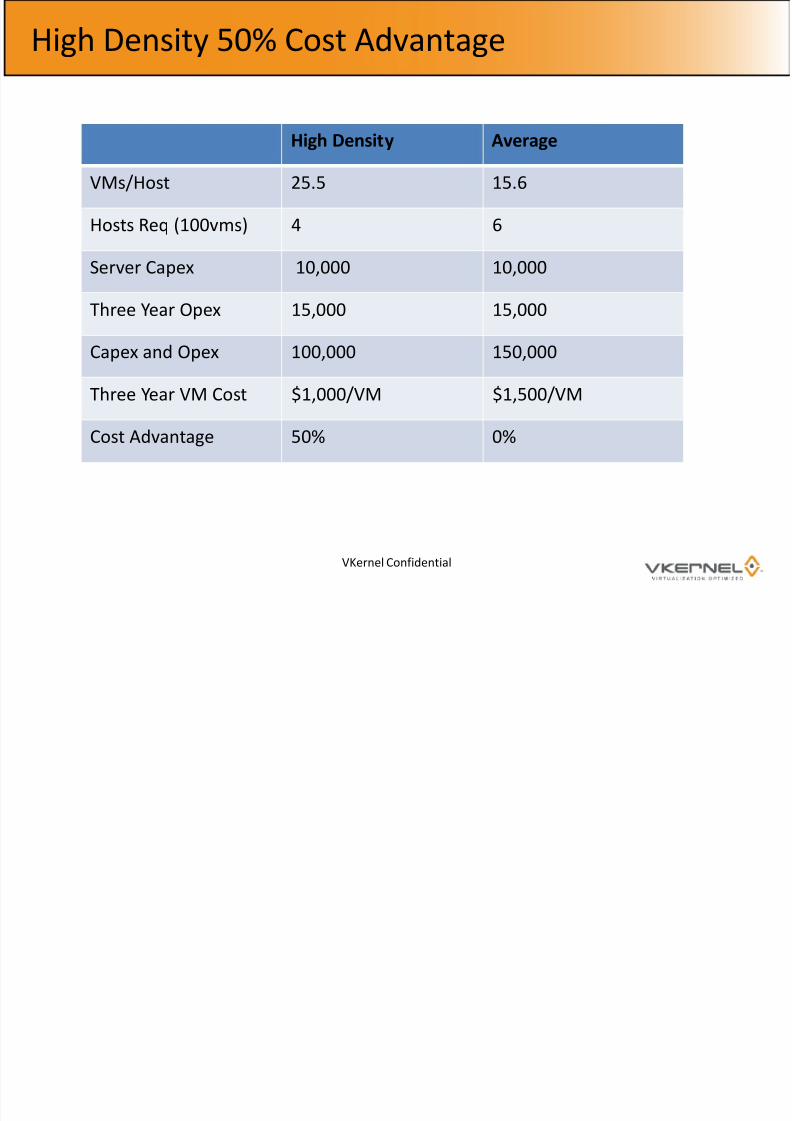
High Density 50% Cost Advantage
VKernel Confidential
High Density Average
VMs/Host 25.5 15.6
Hosts Req (100vms) 4 6
Server Capex 10,000 10,000
Three Year Opex 15,000 15,000
Capex and Opex 100,000 150,000
Three Year VM Cost $1,000/VM $1,500/VM
Cost Advantage 50% 0%
8/8/2019 Vmi Ppt Final
http://slidepdf.com/reader/full/vmi-ppt-final 11/13
All Good Analysis Asks More Questions than it
Answers
• Optimal memory density for a server that maximizes
ROI
• Are VMware functions that compress memory and do
other memory saving features useful if enterprises
don’t over allocate?• How to break through 2 VMs/core barrier
VKernel Confidential
8/8/2019 Vmi Ppt Final
http://slidepdf.com/reader/full/vmi-ppt-final 12/13
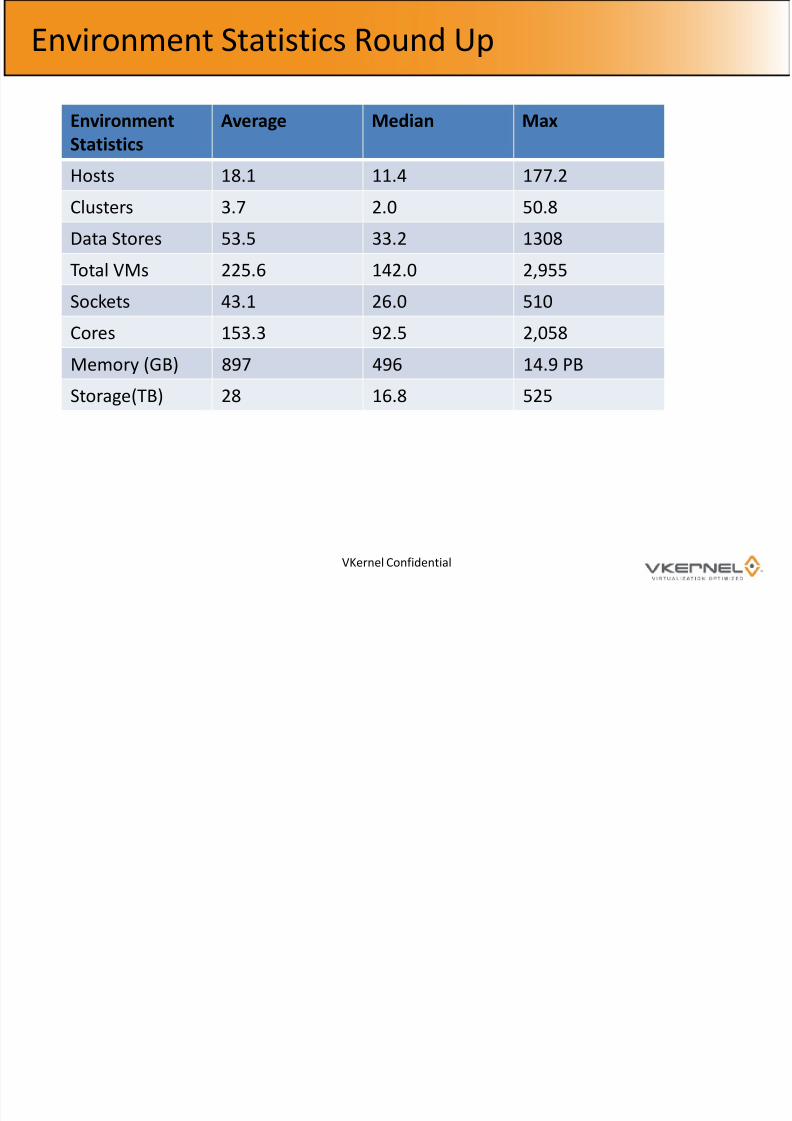
Environment Statistics Round Up
VKernel Confidential
Environment
Statistics
Average Median Max
Hosts 18.1 11.4 177.2
Clusters 3.7 2.0 50.8
Data Stores 53.5 33.2 1308
Total VMs 225.6 142.0 2,955Sockets 43.1 26.0 510
Cores 153.3 92.5 2,058
Memory (GB) 897 496 14.9 PB
Storage(TB) 28 16.8 525
8/8/2019 Vmi Ppt Final
http://slidepdf.com/reader/full/vmi-ppt-final 13/13
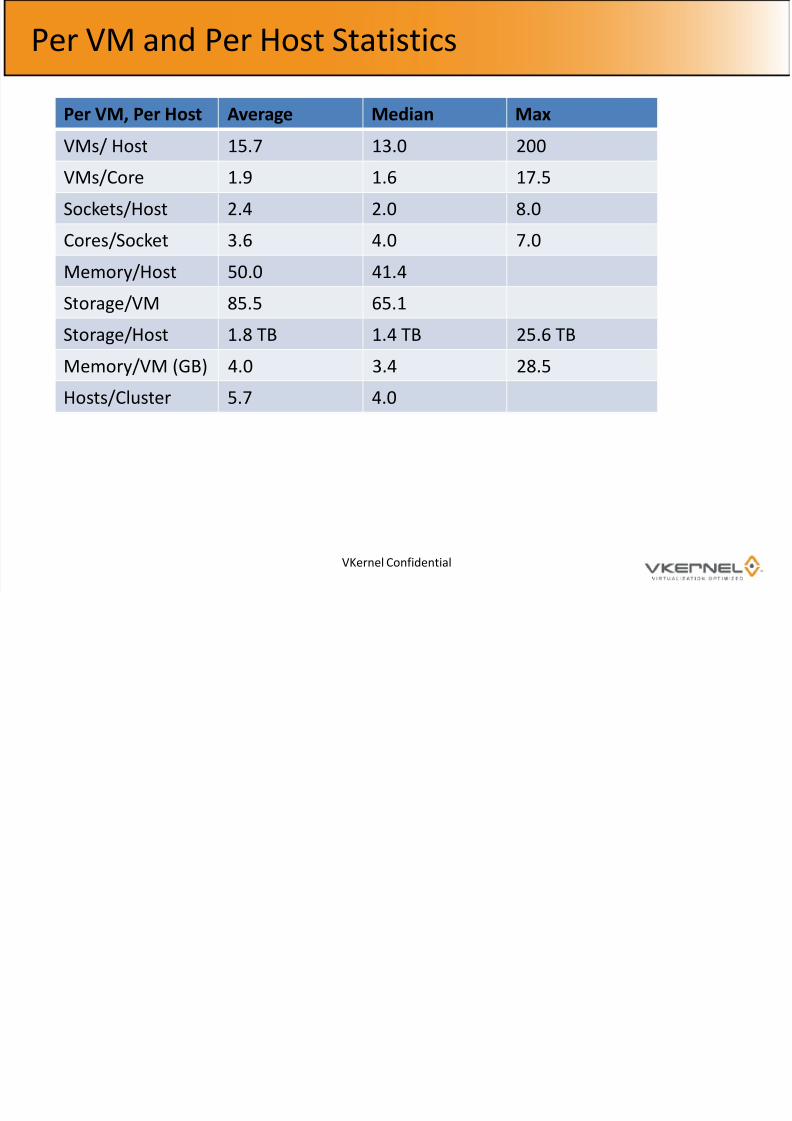
Per VM and Per Host Statistics
VKernel Confidential
Per VM, Per Host Average Median Max
VMs/ Host 15.7 13.0 200
VMs/Core 1.9 1.6 17.5
Sockets/Host 2.4 2.0 8.0
Cores/Socket 3.6 4.0 7.0
Memory/Host 50.0 41.4Storage/VM 85.5 65.1
Storage/Host 1.8 TB 1.4 TB 25.6 TB
Memory/VM (GB) 4.0 3.4 28.5
Hosts/Cluster 5.7 4.0