VMI images – fitting
69
VMI images –fitting Helgi Rafn Hróðmarsson
description
VMI images – fitting. Helgi Rafn Hróðmarsson. The purpose of this fitting procedure is to check whether the assumption that the angular distribution data can be fitted with an expression of both the two-photon excitation transition as well as the ionization pathway. - PowerPoint PPT Presentation
Transcript of VMI images – fitting

VMI images –fitting
Helgi Rafn Hróðmarsson
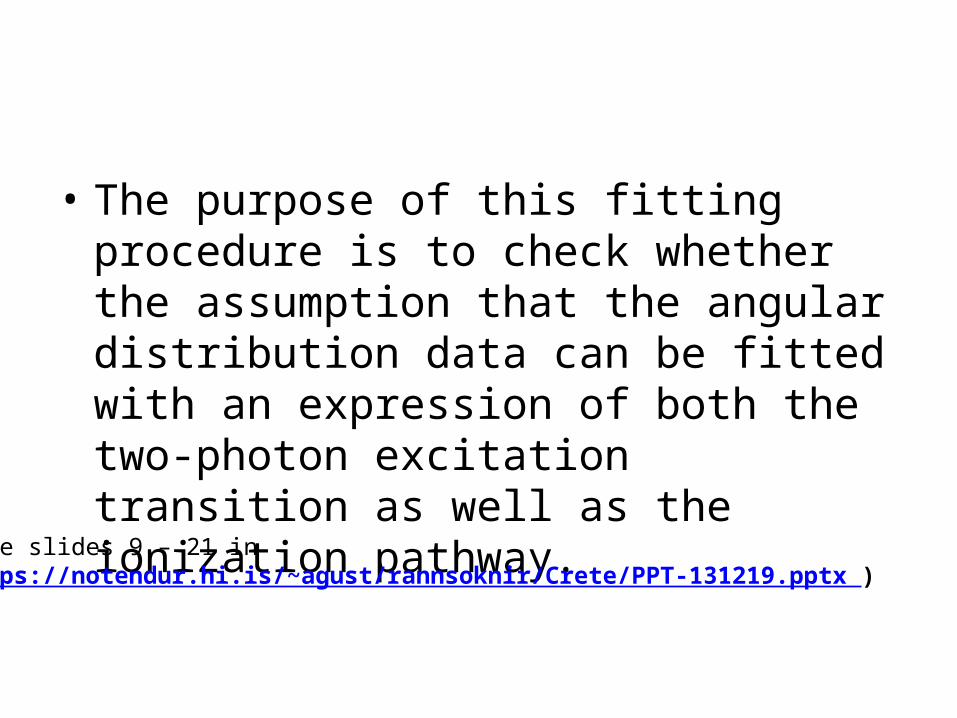
• The purpose of this fitting procedure is to check whether the assumption that the angular distribution data can be fitted with an expression of both the two-photon excitation transition as well as the ionization pathway.
(see slides 9 – 21 in https://notendur.hi.is/~agust/rannsoknir/Crete/PPT-131219.pptx )
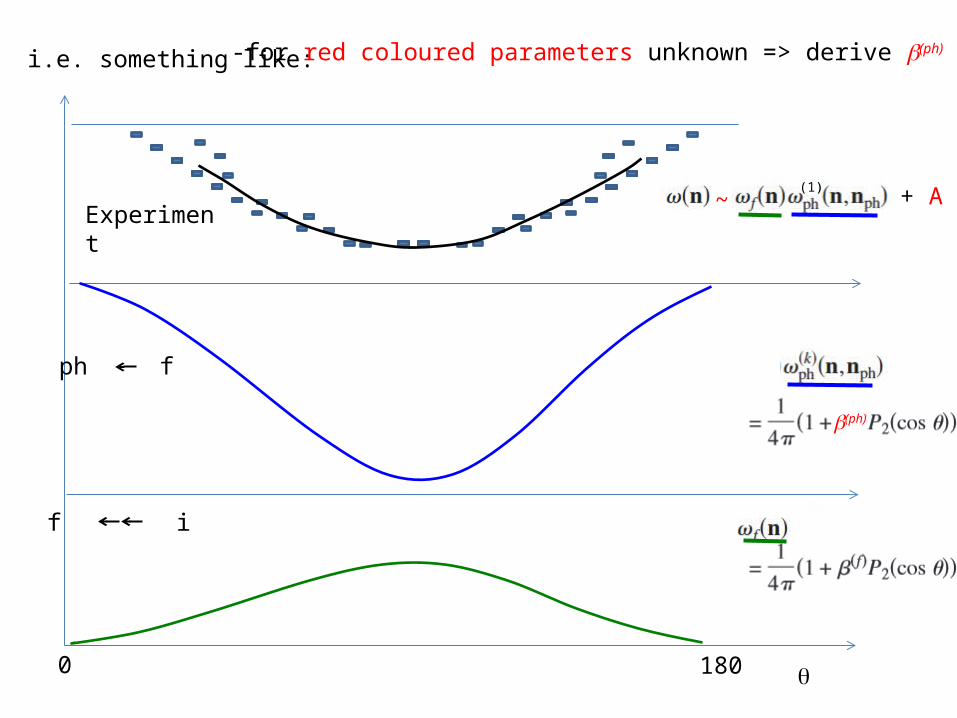
i.e. something like:
q0 180
f i
ph f
Experiment
b(ph)
(1) + A~
-for red coloured parameters unknown => derive b(ph)
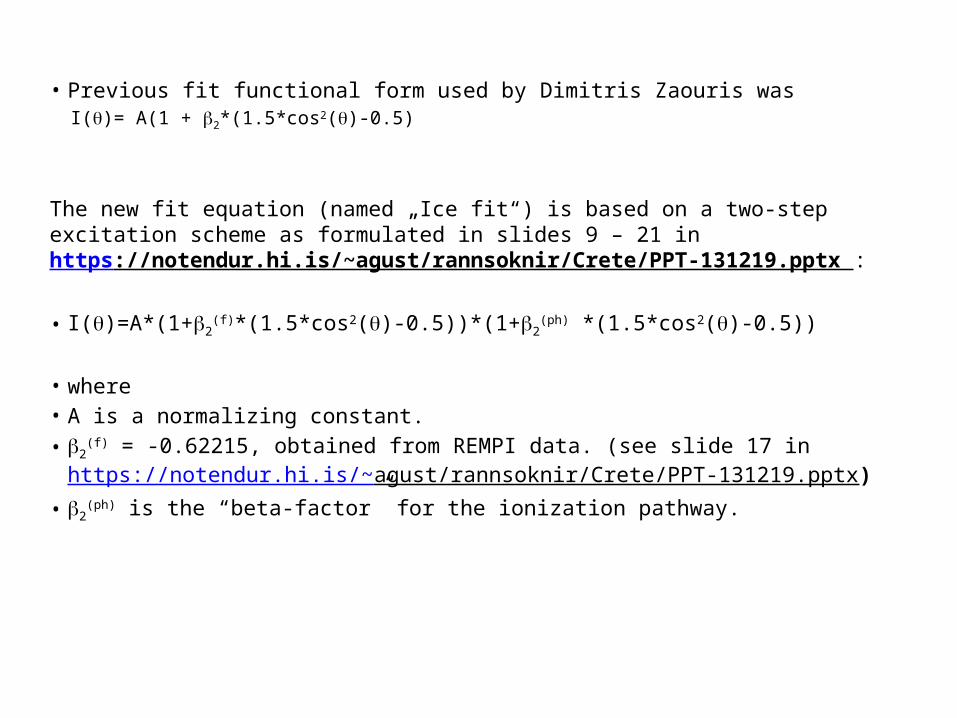
• Previous fit functional form used by Dimitris Zaouris wasI(q)= A(1 + b2*(1.5*cos2(q)-0.5)
The new fit equation (named „Ice fit“) is based on a two-step excitation scheme as formulated in slides 9 – 21 in https://notendur.hi.is/~agust/rannsoknir/Crete/PPT-131219.pptx :
• I(q)=A*(1+b2(f)*(1.5*cos2(q)-0.5))*(1+b2
(ph) *(1.5*cos2(q)-0.5))
• where • A is a normalizing constant.• b2
(f) = -0.62215, obtained from REMPI data. (see slide 17 in https://notendur.hi.is/~agust/rannsoknir/Crete/PPT-131219.pptx)
• b2(ph) is the “beta-factor” for the ionization pathway.
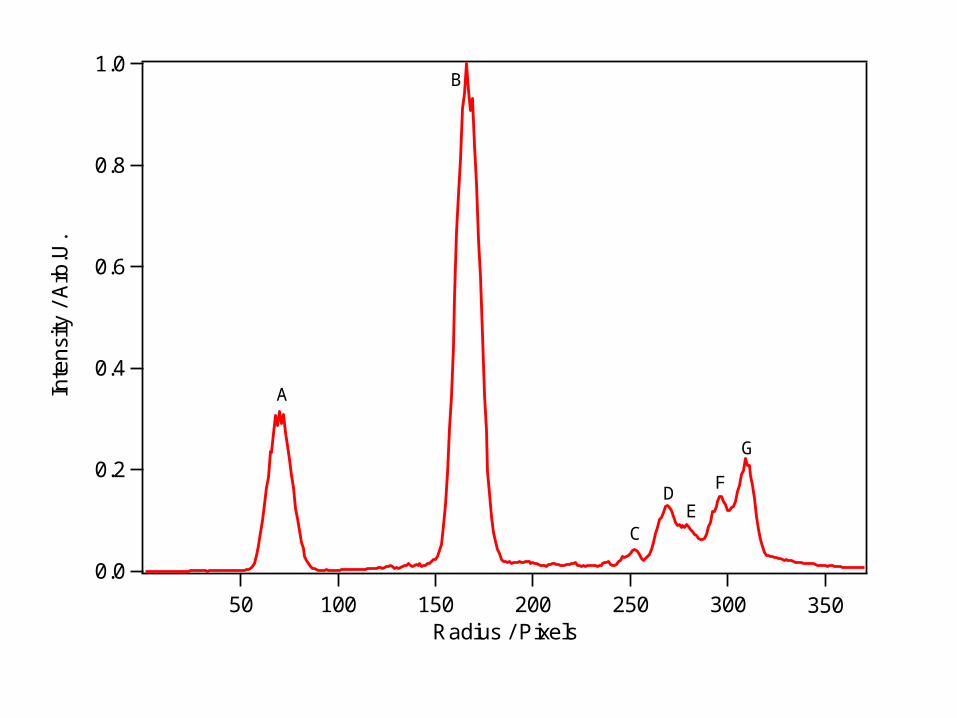
1.0
0.8
0.6
0.4
0.2
0.0
Inte
nsity
/ A
rb.U
.
35030025020015010050Radius / Pixels
A
B
C
DE
F
G

E(v=0,J=1) – peak A – Ice fit 11.0
0.8
0.6
0.4
0.2
0.0
Inte
nsity
/ A
rb.U
.
150100500
Scattering Angle / Deg
Curve Fit Results Mon, Feb 10, 2014Coefficient values ± one standard deviation beta1 =-0.62215 ± 0 A =0.86907 ± 0.0127 beta2 =1.1514 ± 0.0345

E(v=0,J=1) – peak B – Ice fit 11.0
0.8
0.6
0.4
0.2
0.0
Inte
nsity
/ A
rb.U
.
150100500
Scattering Angle / Deg
Curve Fit Results Mon, Feb 10, 2014Coefficient values ± one standard deviation beta1 =-0.62215 ± 0 A =0.89662 ± 0.00382 beta2 =0.33335 ± 0.00962

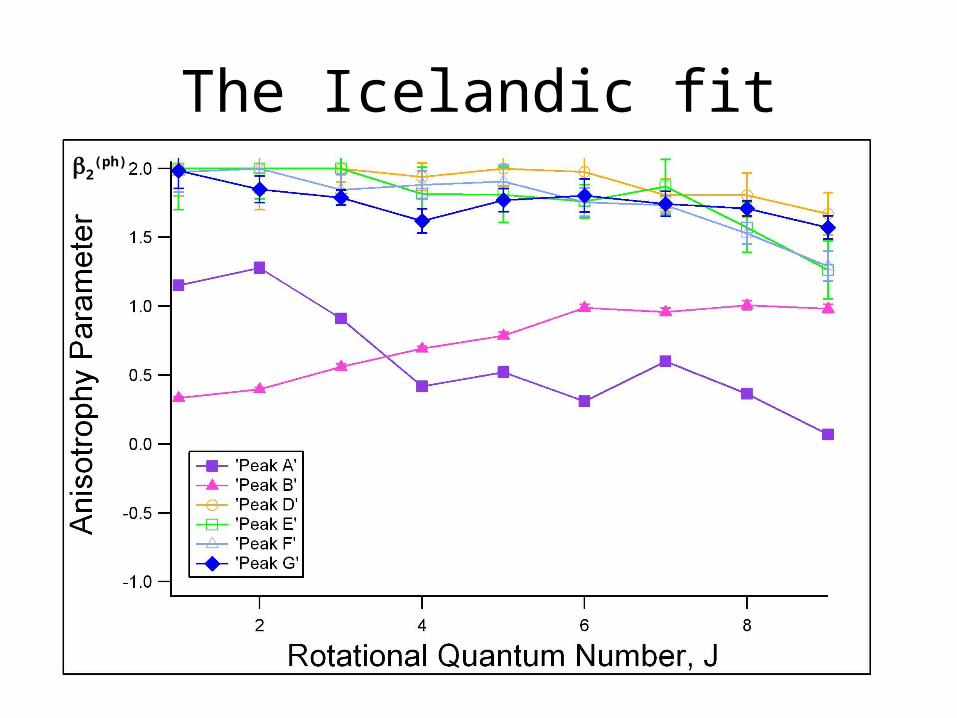
Peaks (J=1) Greek Icelandic 1
A (A;b1;b2) 0,76118±0,009250,45744±0,0283
0,86907±0,0127-0,622151,1514±0,0345
B 0,85873±0,00499-0,37458±0,0126
0,89662±0,00382-0,622150,33335±0,00962
C 0,13704±0,00751,9112±0,173
0,17007±0,0112-0,622152±0,17
D 0,41475±0,005411,7632±0,0399
0,52983±0,0235-0,622152±0,14
E 0,27321±0,01061,8038±0,12
0,3591±0,0268-0,622152±0,192
F 0,36161±0,008171,5113±0,0651
0,46318±0,027-0,622151,9759±0,148
G 0,39409±0,009231,4896±0,0672
0,50614±0,0259-0,622151,9828±0,131

E(v=0,J=2) – peak A – Ice Fit 11.0
0.8
0.6
0.4
0.2
0.0
Inte
nsity
/ A
rb.U
.
150100500
Scattering Angle /Deg
Curve Fit ResultsTue, Feb 11, 2014
Fit Type: least squares fitCoefficient values ± one standard deviation A =0.81307 ± 0.0134 beta1 =-0.62215 ± 0 beta2 =1.2773 ± 0.0392
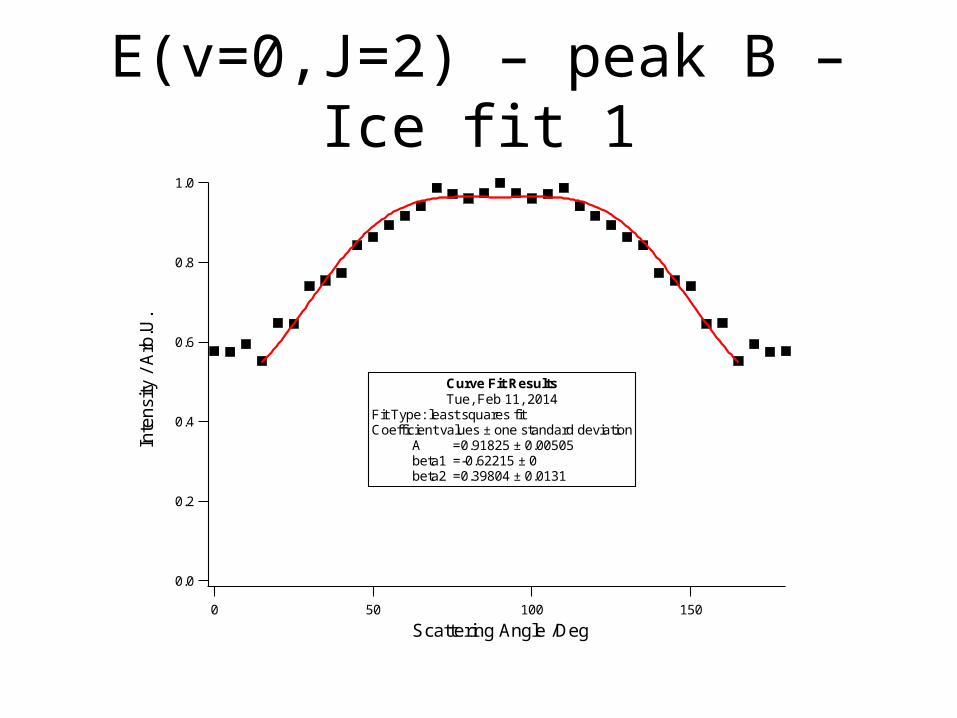
E(v=0,J=2) – peak B – Ice fit 11.0
0.8
0.6
0.4
0.2
0.0
Inte
nsity
/ A
rb.U
.
150100500
Scattering Angle /Deg
Curve Fit ResultsTue, Feb 11, 2014
Fit Type: least squares fitCoefficient values ± one standard deviation A =0.91825 ± 0.00505 beta1 =-0.62215 ± 0 beta2 =0.39804 ± 0.0131
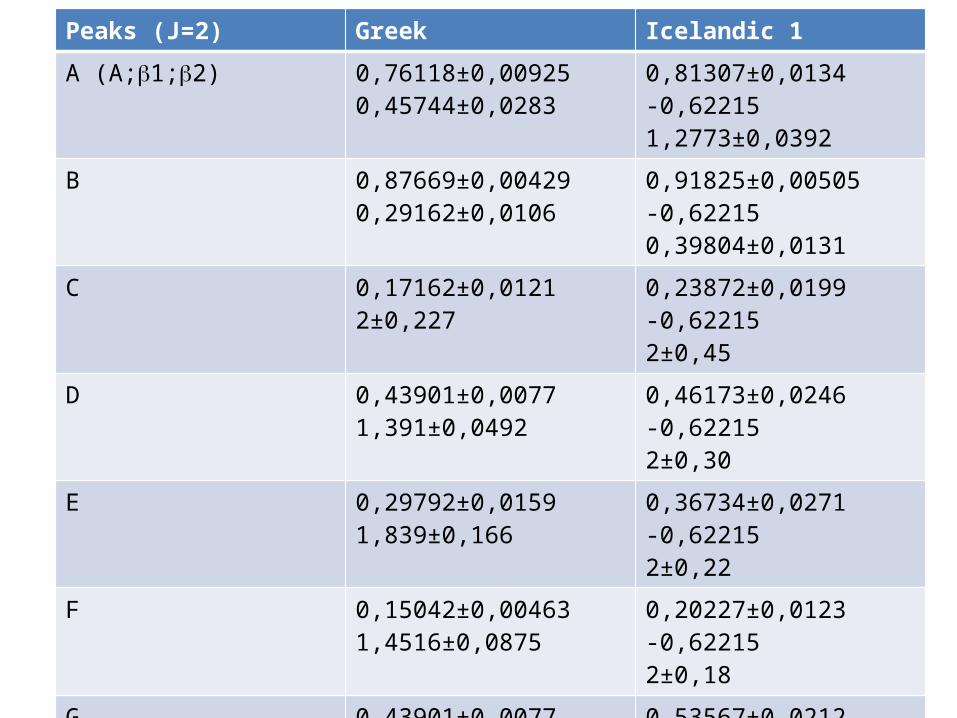
Peaks (J=2) Greek Icelandic 1
A (A;b1;b2) 0,76118±0,009250,45744±0,0283
0,81307±0,0134-0,622151,2773±0,0392
B 0,87669±0,004290,29162±0,0106
0,91825±0,00505-0,622150,39804±0,0131
C 0,17162±0,01212±0,227
0,23872±0,0199-0,622152±0,45
D 0,43901±0,00771,391±0,0492
0,46173±0,0246-0,622152±0,30
E 0,29792±0,01591,839±0,166
0,36734±0,0271-0,622152±0,22
F 0,15042±0,004631,4516±0,0875
0,20227±0,0123-0,622152±0,18
G 0,43901±0,00771,391±0,0492
0,53567±0,0212-0,622151,8482±0,0971
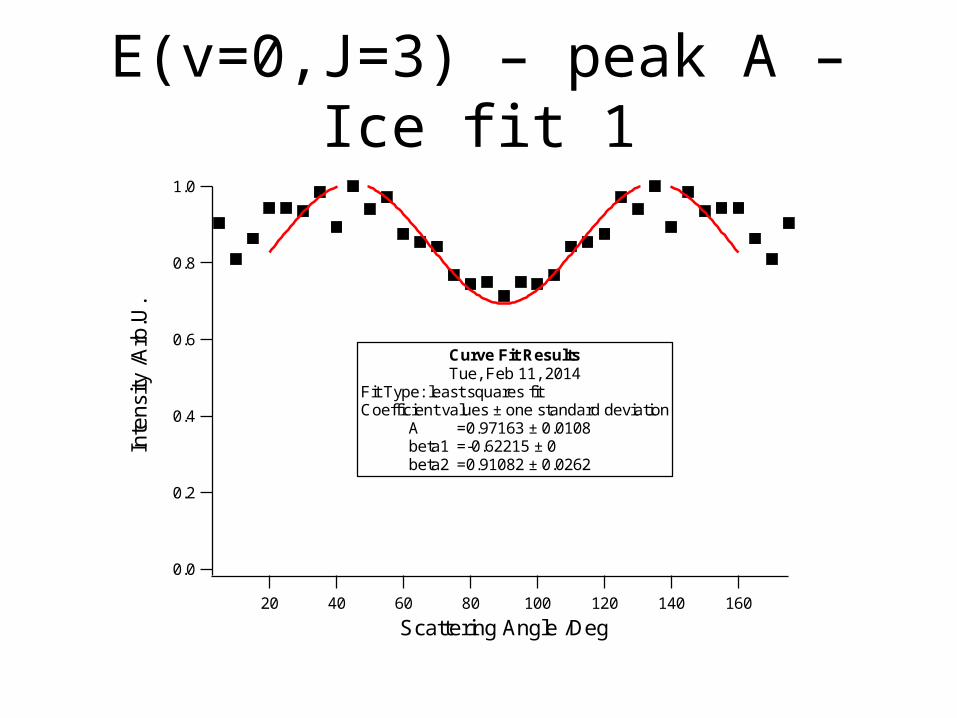
E(v=0,J=3) – peak A – Ice fit 11.0
0.8
0.6
0.4
0.2
0.0
Inte
nsity
/Arb
.U.
16014012010080604020
Scattering Angle /Deg
Curve Fit ResultsTue, Feb 11, 2014
Fit Type: least squares fitCoefficient values ± one standard deviation A =0.97163 ± 0.0108 beta1 =-0.62215 ± 0 beta2 =0.91082 ± 0.0262
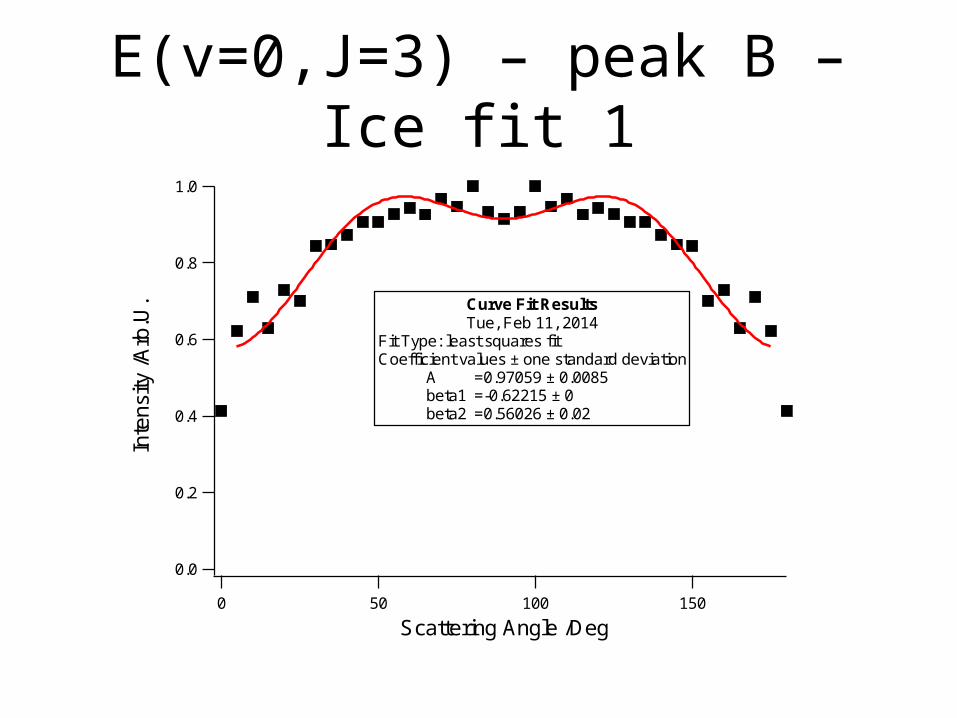
E(v=0,J=3) – peak B – Ice fit 11.0
0.8
0.6
0.4
0.2
0.0
Inte
nsity
/Arb
.U.
150100500
Scattering Angle /Deg
Curve Fit ResultsTue, Feb 11, 2014
Fit Type: least squares fitCoefficient values ± one standard deviation A =0.97059 ± 0.0085 beta1 =-0.62215 ± 0 beta2 =0.56026 ± 0.02

Peaks (J=3) Greek Icelandic 1
A (A;b1;b2) 0,87109±0,01040,18036±0,0267
0,97163±0,0108-0,622150,91082±0,0262
B 0,90372±0,00754-0,17687±0,0182
0,97059±0,0085-0,622150,56026±0,02
C
D 0,22624±0,01061,3921±0,131
0,31474±0,00922-0,622152±0,10
E 0,48809±0,0241-0,622152±0,15
F 0,3953±0,01461,2594±0,1
0,49898±0,0216-0,622151,8438±0108
G 0,49621±0,01771,0946±0,0939
0,63018±0,0132-0,622151,7876±0,0531
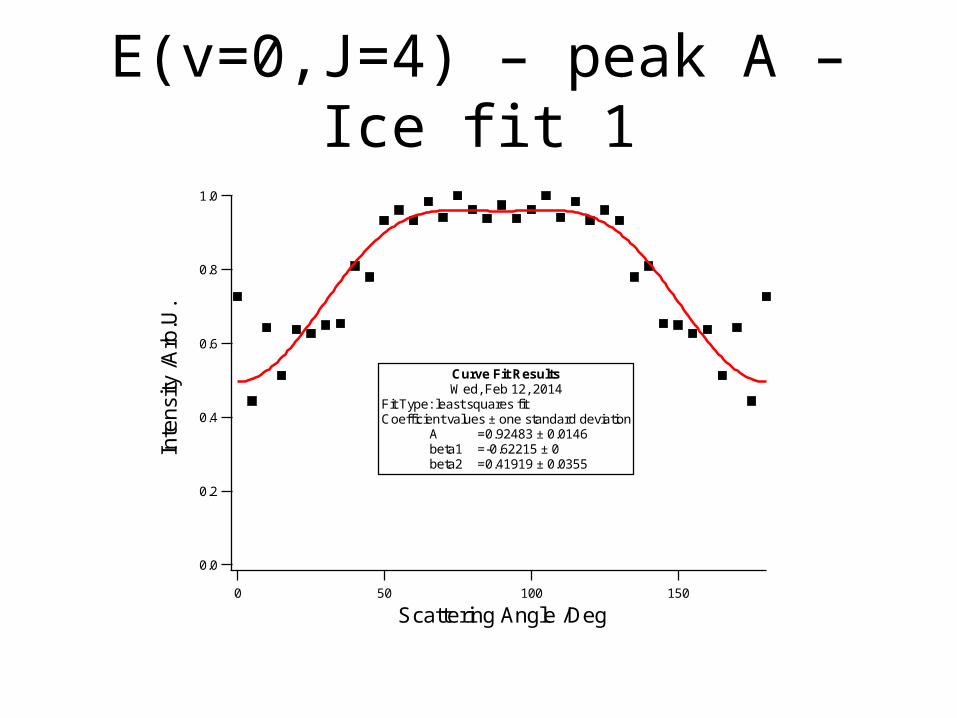
E(v=0,J=4) – peak A – Ice fit 11.0
0.8
0.6
0.4
0.2
0.0
Inte
nsity
/Arb
.U.
150100500
Scattering Angle /Deg
Curve Fit ResultsWed, Feb 12, 2014
Fit Type: least squares fitCoefficient values ± one standard deviation A =0.92483 ± 0.0146 beta1 =-0.62215 ± 0 beta2 =0.41919 ± 0.0355
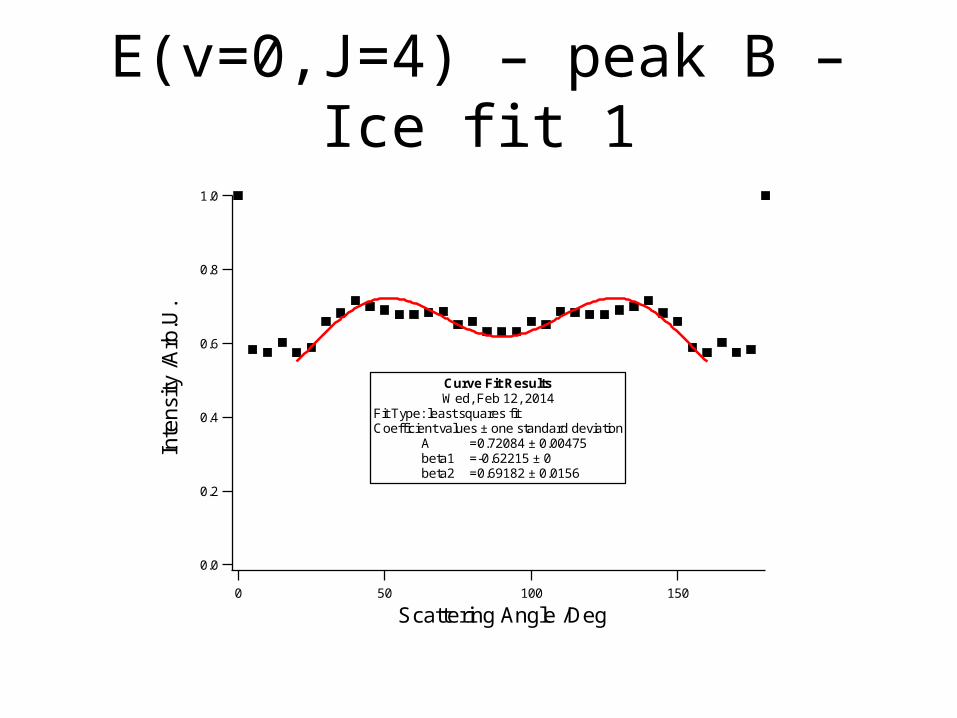
E(v=0,J=4) – peak B – Ice fit 11.0
0.8
0.6
0.4
0.2
0.0
Inte
nsity
/Arb
.U.
150100500
Scattering Angle /Deg
Curve Fit ResultsWed, Feb 12, 2014
Fit Type: least squares fitCoefficient values ± one standard deviation A =0.72084 ± 0.00475 beta1 =-0.62215 ± 0 beta2 =0.69182 ± 0.0156
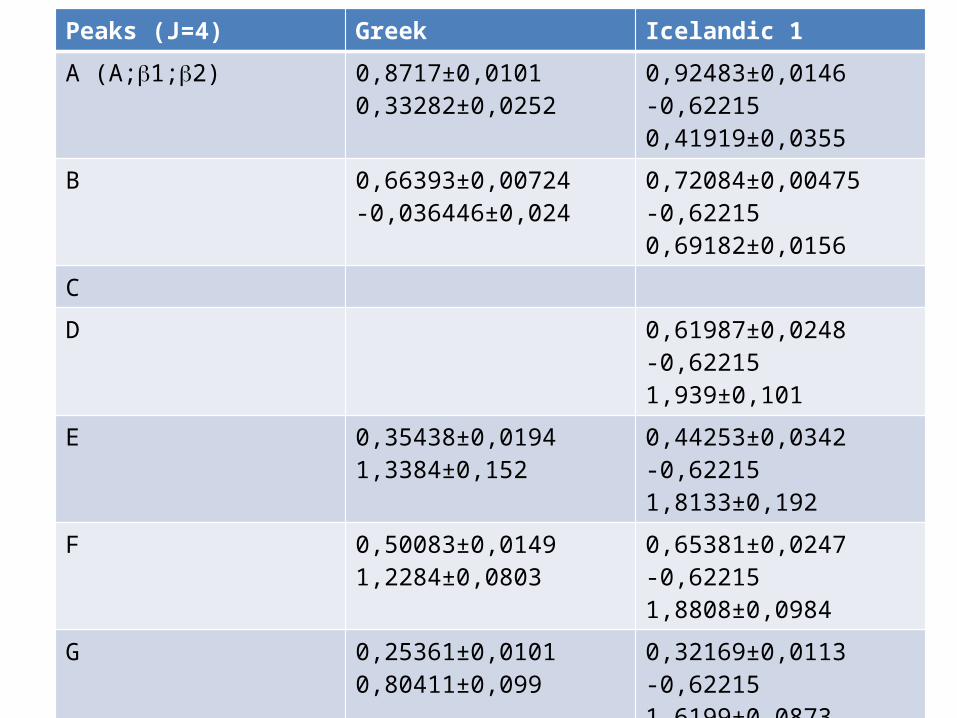
Peaks (J=4) Greek Icelandic 1
A (A;b1;b2) 0,8717±0,01010,33282±0,0252
0,92483±0,0146-0,622150,41919±0,0355
B 0,66393±0,00724-0,036446±0,024
0,72084±0,00475-0,622150,69182±0,0156
C
D 0,61987±0,0248-0,622151,939±0,101
E 0,35438±0,01941,3384±0,152
0,44253±0,0342-0,622151,8133±0,192
F 0,50083±0,01491,2284±0,0803
0,65381±0,0247-0,622151,8808±0,0984
G 0,25361±0,01010,80411±0,099
0,32169±0,0113-0,622151,6199±0,0873
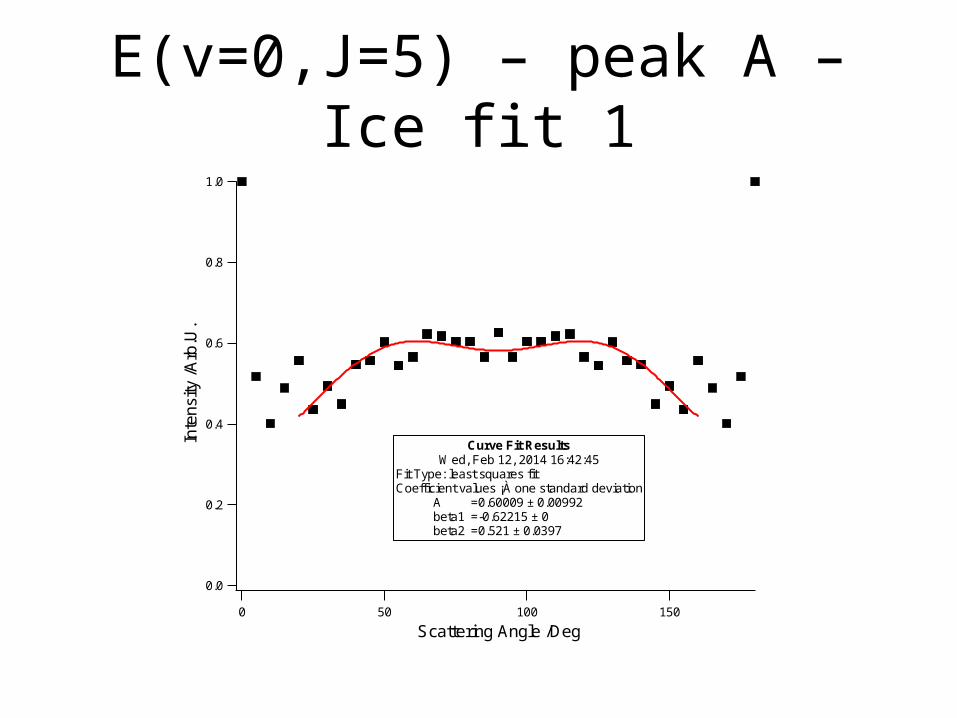
E(v=0,J=5) – peak A – Ice fit 11.0
0.8
0.6
0.4
0.2
0.0
Inte
nsity
/Arb
.U.
150100500
Scattering Angle /Deg
Curve Fit ResultsWed, Feb 12, 2014 16:42:45
Fit Type: least squares fitCoefficient values ¡À one standard deviation
A =0.60009 ± 0.00992beta1 =-0.62215 ± 0beta2 =0.521 ± 0.0397

E(v=0,J=5) – peak B – Ice fit 11.0
0.8
0.6
0.4
0.2
0.0
Inte
nsity
/Arb
.U.
150100500
Scattering Angle /Deg
Curve Fit ResultsWed, Feb 12, 2014 16:48:21
Fit Type: least squares fitCoefficient values ¡À one standard deviation
A =0.99436 ± 0.0101beta1 =-0.62215 ± 0beta2 =0.7879 ± 0.0241
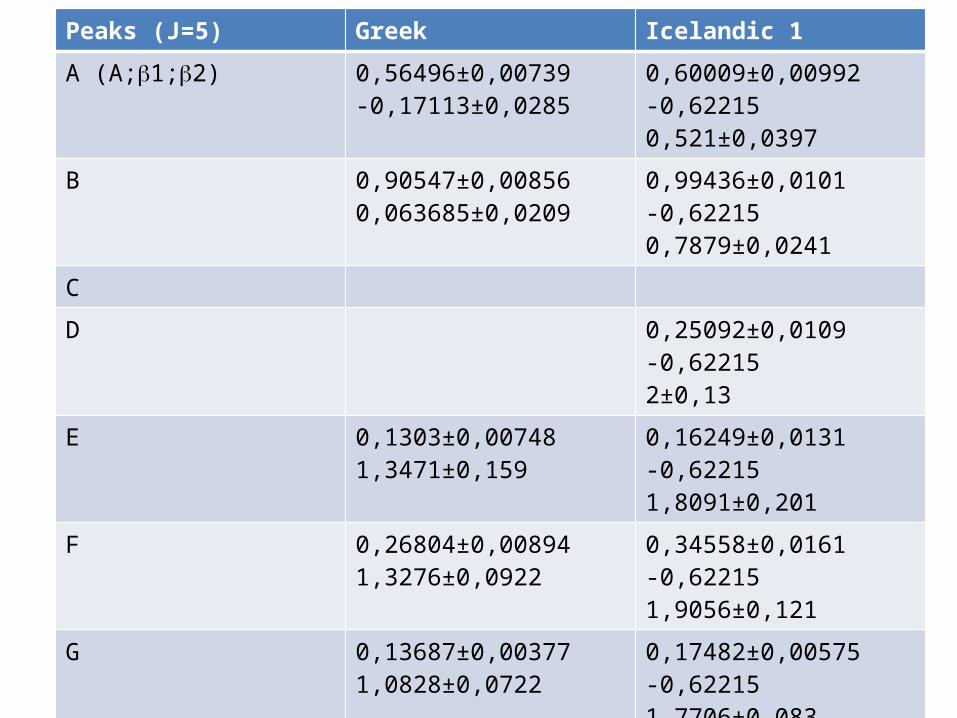
Peaks (J=5) Greek Icelandic 1
A (A;b1;b2) 0,56496±0,00739-0,17113±0,0285
0,60009±0,00992-0,622150,521±0,0397
B 0,90547±0,008560,063685±0,0209
0,99436±0,0101-0,622150,7879±0,0241
C
D 0,25092±0,0109-0,622152±0,13
E 0,1303±0,007481,3471±0,159
0,16249±0,0131-0,622151,8091±0,201
F 0,26804±0,008941,3276±0,0922
0,34558±0,0161-0,622151,9056±0,121
G 0,13687±0,003771,0828±0,0722
0,17482±0,00575-0,622151,7706±0,083
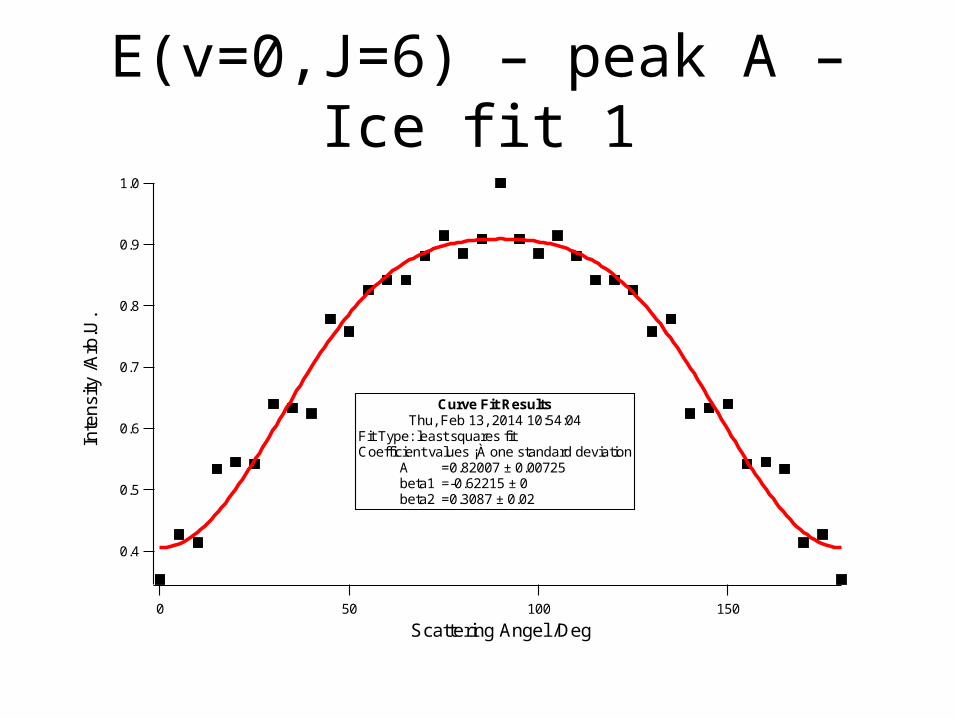
E(v=0,J=6) – peak A – Ice fit 11.0
0.9
0.8
0.7
0.6
0.5
0.4
Inte
nsity
/Arb
.U.
150100500
Scattering Angel /Deg
Curve Fit ResultsThu, Feb 13, 2014 10:54:04
Fit Type: least squares fitCoefficient values ¡À one standard deviation
A =0.82007 ± 0.00725beta1 =-0.62215 ± 0beta2 =0.3087 ± 0.02
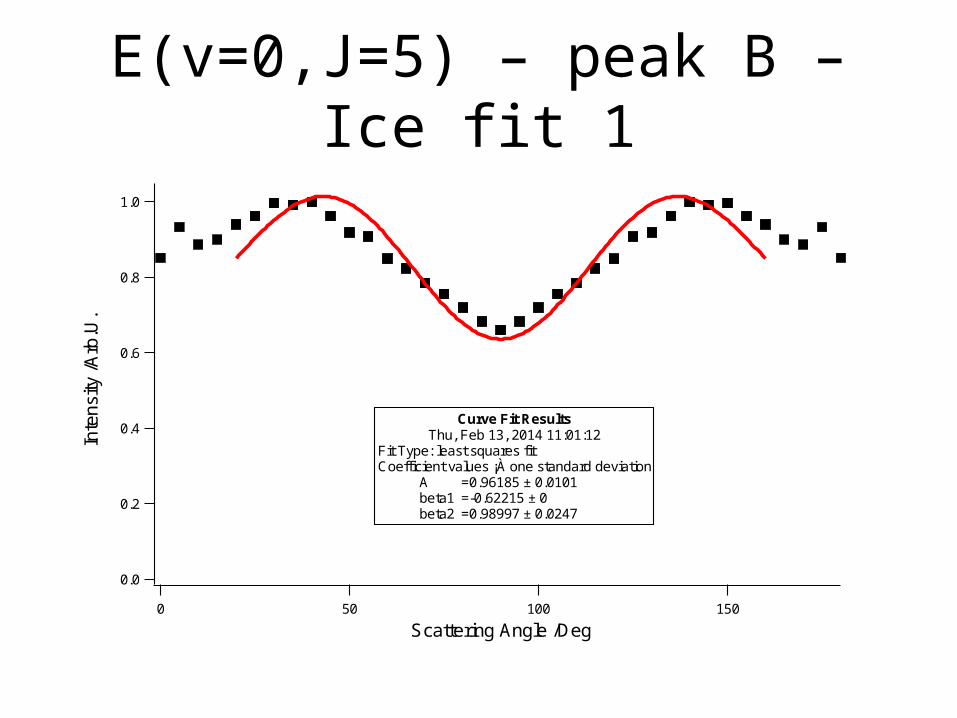
E(v=0,J=5) – peak B – Ice fit 1
1.0
0.8
0.6
0.4
0.2
0.0
Inte
nsity
/Arb
.U.
150100500
Scattering Angle /Deg
Curve Fit ResultsThu, Feb 13, 2014 11:01:12
Fit Type: least squares fitCoefficient values ¡À one standard deviation
A =0.96185 ± 0.0101beta1 =-0.62215 ± 0beta2 =0.98997 ± 0.0247
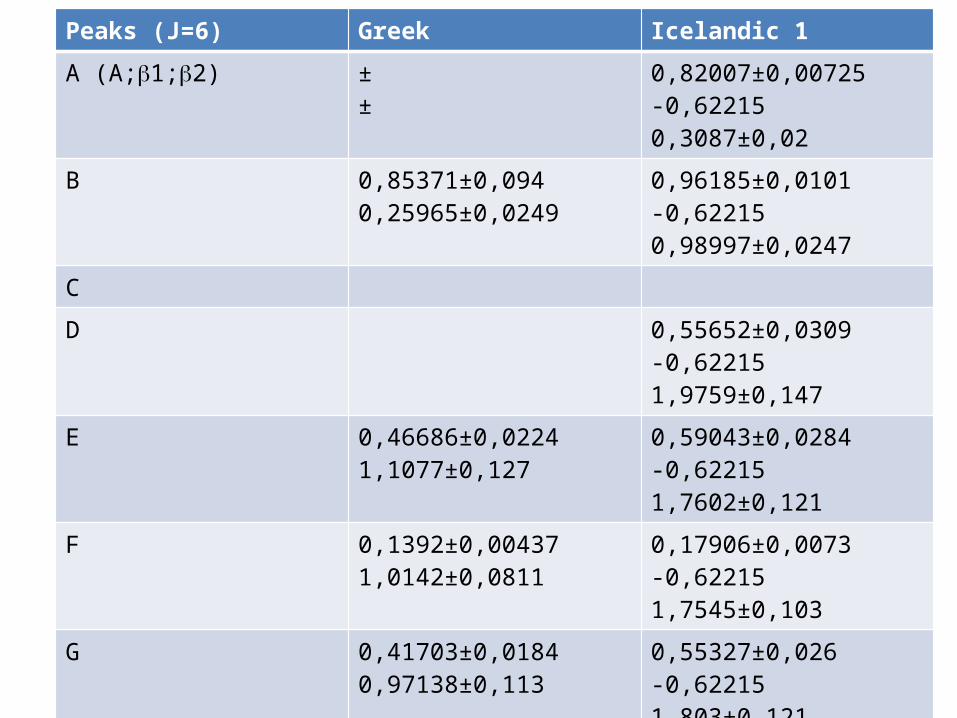
Peaks (J=6) Greek Icelandic 1
A (A;b1;b2) ±±
0,82007±0,00725-0,622150,3087±0,02
B 0,85371±0,0940,25965±0,0249
0,96185±0,0101-0,622150,98997±0,0247
C
D 0,55652±0,0309-0,622151,9759±0,147
E 0,46686±0,02241,1077±0,127
0,59043±0,0284-0,622151,7602±0,121
F 0,1392±0,004371,0142±0,0811
0,17906±0,0073-0,622151,7545±0,103
G 0,41703±0,01840,97138±0,113
0,55327±0,026-0,622151,803±0,121
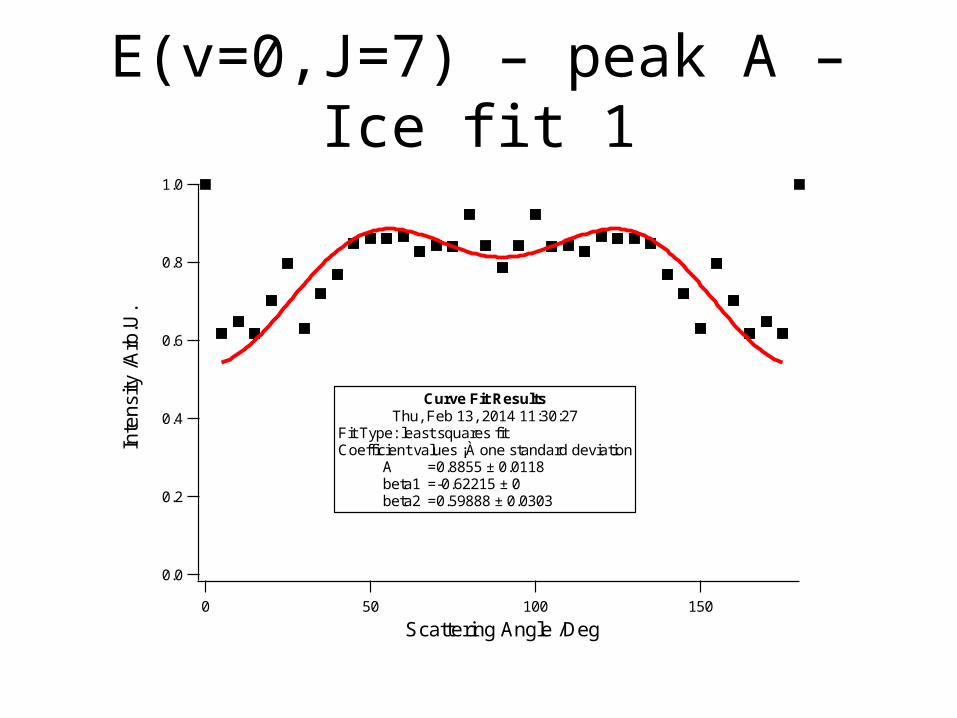
E(v=0,J=7) – peak A – Ice fit 11.0
0.8
0.6
0.4
0.2
0.0
Inte
nsity
/Arb
.U.
150100500
Scattering Angle /Deg
Curve Fit ResultsThu, Feb 13, 2014 11:30:27
Fit Type: least squares fitCoefficient values ¡À one standard deviation
A =0.8855 ± 0.0118beta1 =-0.62215 ± 0beta2 =0.59888 ± 0.0303
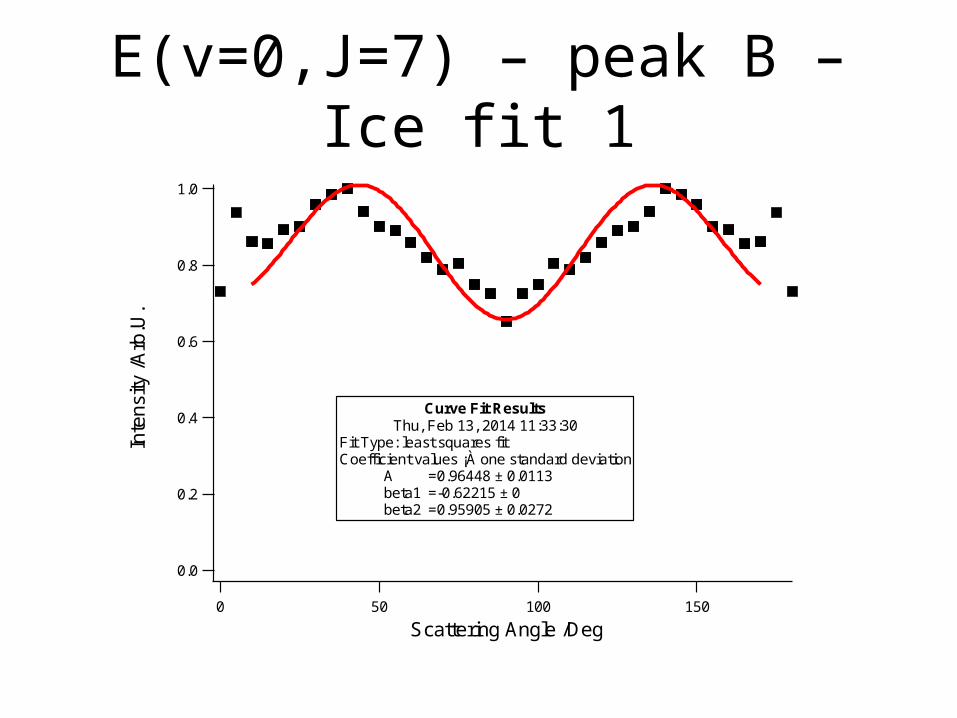
E(v=0,J=7) – peak B – Ice fit 11.0
0.8
0.6
0.4
0.2
0.0
Inte
nsity
/Arb
.U.
150100500
Scattering Angle /Deg
Curve Fit ResultsThu, Feb 13, 2014 11:33:30
Fit Type: least squares fitCoefficient values ¡À one standard deviation
A =0.96448 ± 0.0113beta1 =-0.62215 ± 0beta2 =0.95905 ± 0.0272

Peaks (J=7) Greek Icelandic 1
A (A;b1;b2) 0,81874±0,00999-0,1475±0,0266
0,8855±0,0118-0,62215 0,59888±0,0303
B 0,85244±0,01030,19325±0,027
0,96448±0,0113-0,622150,95905±0,0272
C
D 0,35768±0,0169-0,622151,8061±0,119
E 0,20043±0,01211,3719±0,168
0,2557±0,0196-0,622151,8678±0,196
F 0,56079±0,02240,96569±0,102
0,71665±0,0184-0,622151,7332±0,0651
G 0,47816±0,02270,92885±0,121
0,61749±0,0223-0,622151,7435±0,0918
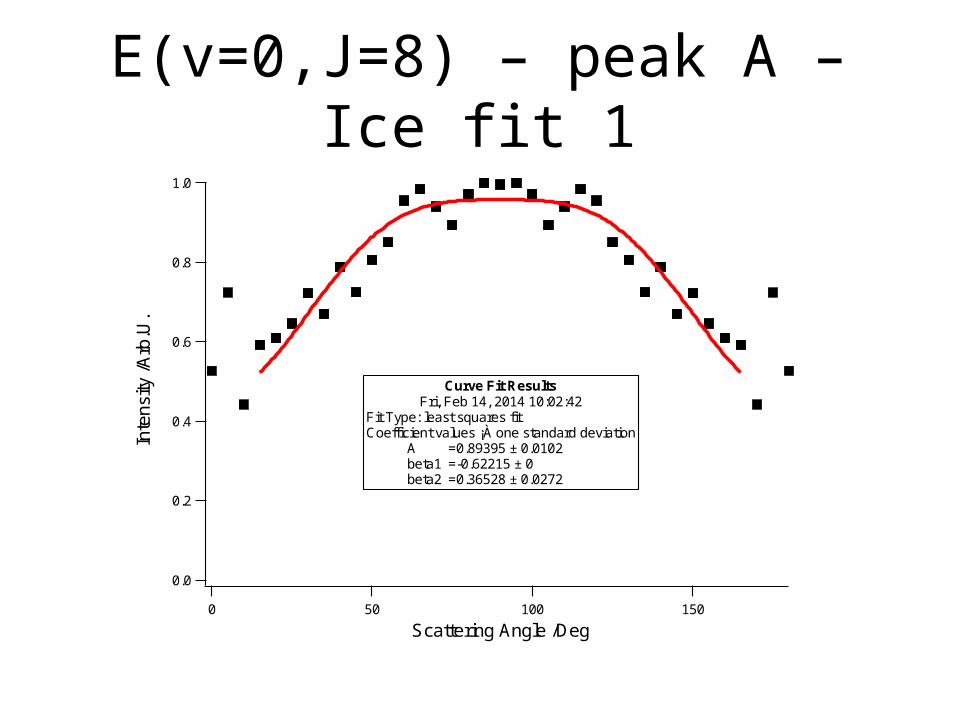
E(v=0,J=8) – peak A – Ice fit 11.0
0.8
0.6
0.4
0.2
0.0
Inte
nsity
/Arb
.U.
150100500
Scattering Angle /Deg
Curve Fit ResultsFri, Feb 14, 2014 10:02:42
Fit Type: least squares fitCoefficient values ¡À one standard deviation
A =0.89395 ± 0.0102beta1 =-0.62215 ± 0beta2 =0.36528 ± 0.0272
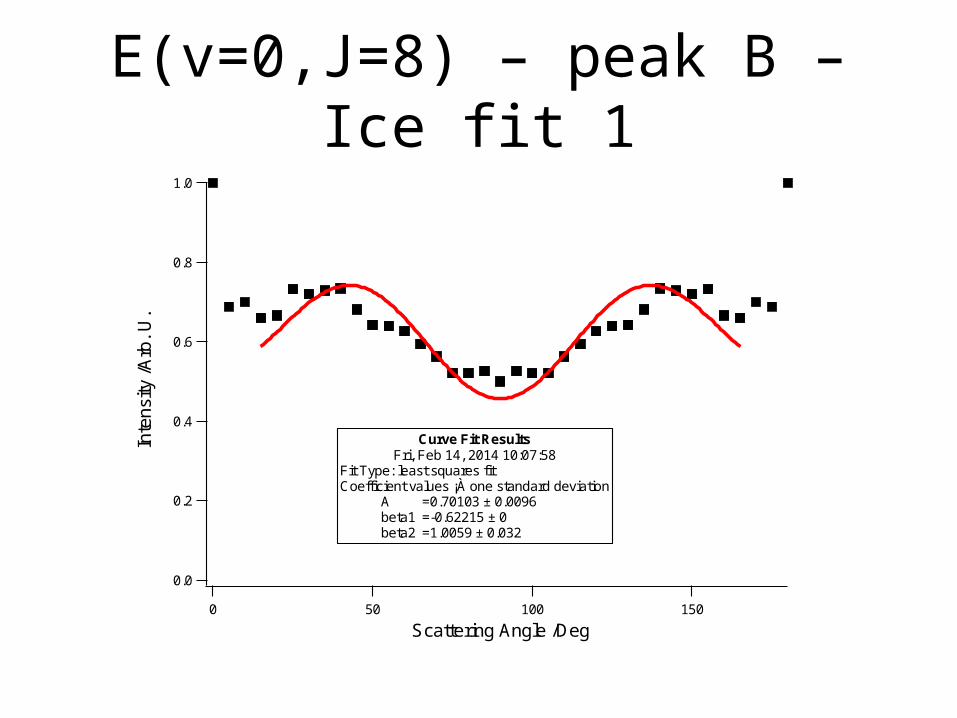
E(v=0,J=8) – peak B – Ice fit 11.0
0.8
0.6
0.4
0.2
0.0
Inte
nsity
/Arb
. U.
150100500
Scattering Angle /Deg
Curve Fit ResultsFri, Feb 14, 2014 10:07:58
Fit Type: least squares fitCoefficient values ¡À one standard deviation
A =0.70103 ± 0.0096beta1 =-0.62215 ± 0beta2 =1.0059 ± 0.032
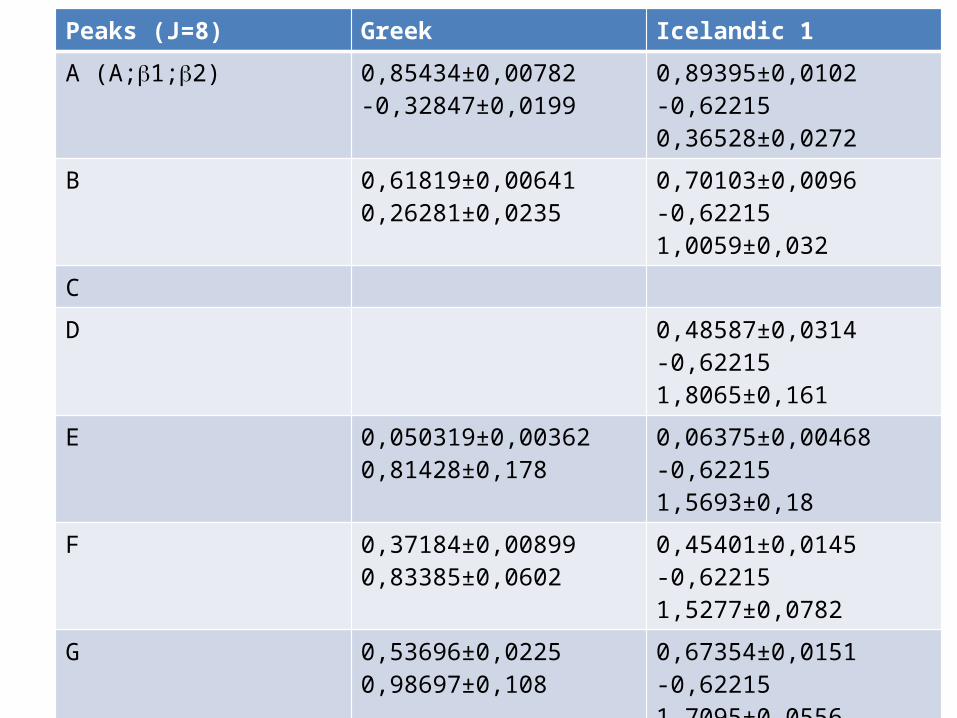
Peaks (J=8) Greek Icelandic 1
A (A;b1;b2) 0,85434±0,00782-0,32847±0,0199
0,89395±0,0102-0,62215 0,36528±0,0272
B 0,61819±0,006410,26281±0,0235
0,70103±0,0096-0,62215 1,0059±0,032
C
D 0,48587±0,0314-0,62215 1,8065±0,161
E 0,050319±0,003620,81428±0,178
0,06375±0,00468-0,62215 1,5693±0,18
F 0,37184±0,008990,83385±0,0602
0,45401±0,0145-0,62215 1,5277±0,0782
G 0,53696±0,02250,98697±0,108
0,67354±0,0151-0,62215 1,7095±0,0556

E(v=0,J=9) – peak A- Ice fit 11.0
0.8
0.6
0.4
0.2
0.0
Inte
nsity
/Arb
.U.
150100500
Scattering Angle /Deg
Curve Fit ResultsFri, Feb 14, 2014 10:56:52
Fit Type: least squares fitCoefficient values ¡À one standard deviation
A =0.76278 ± 0.00548beta1 =-0.62215 ± 0beta2 =0.068452 ± 0.0165
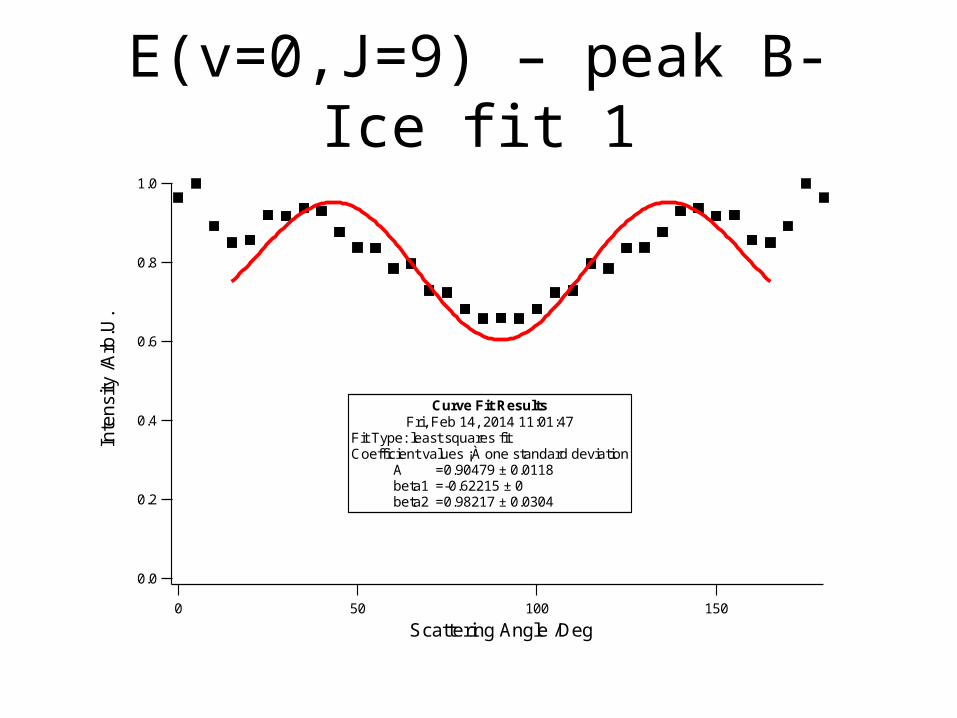
E(v=0,J=9) – peak B- Ice fit 11.0
0.8
0.6
0.4
0.2
0.0
Inte
nsity
/Arb
.U.
150100500
Scattering Angle /Deg
Curve Fit ResultsFri, Feb 14, 2014 11:01:47
Fit Type: least squares fitCoefficient values ¡À one standard deviation
A =0.90479 ± 0.0118beta1 =-0.62215 ± 0beta2 =0.98217 ± 0.0304

Peaks (J=9) Greek Icelandic 1
A (A;b1;b2) 0,7539±0,00573-0,59057±0,0166
0,76278±0,00548-0,62215 0,068452±0,0165
B 0,8±0,007980,23631±0,0225
0,90479±0,0118-0,62215 0,98217±0,0304
C
D 0,29856±0,0186-0,62215 1,6688±0,155
E 0,10717±0,007550,73928±0,172
0,12381±0,011-0,62215 1,2622±0,21
F 0,25428±0,1020,55248±0,0946
0,30221±0,0139-0,62215 1,2887±0,109
G 0,21671±0,009260,78085±0,105
0,27046±0,0092-0,62215 1,5698±0,0834
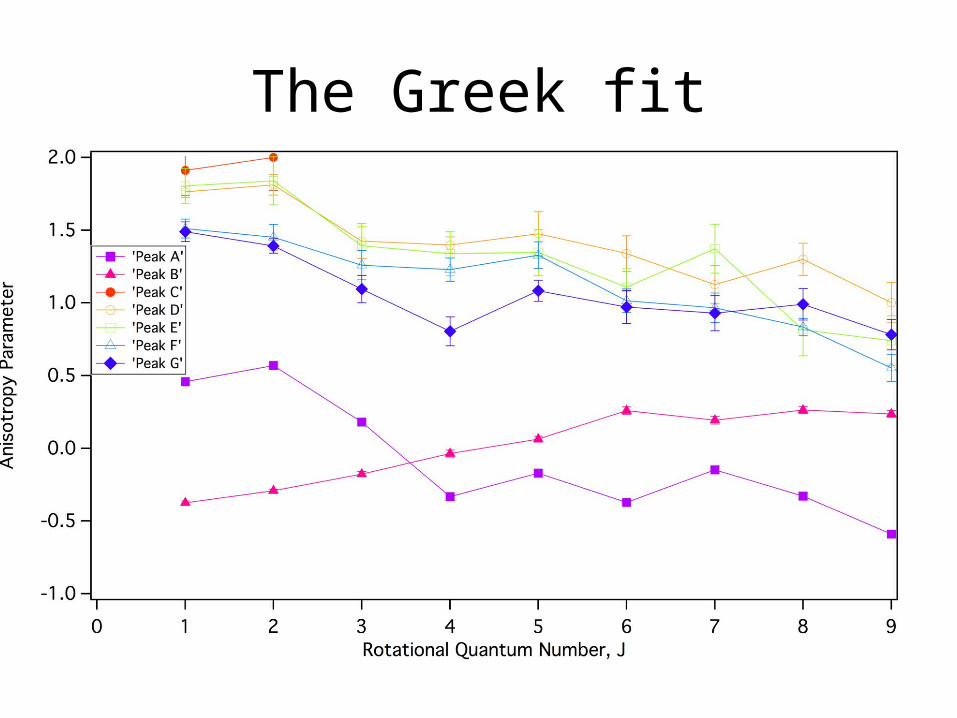
The Greek fit

The Icelandic fitb2
(ph)
Peak A angular distributions„Ice fit“:
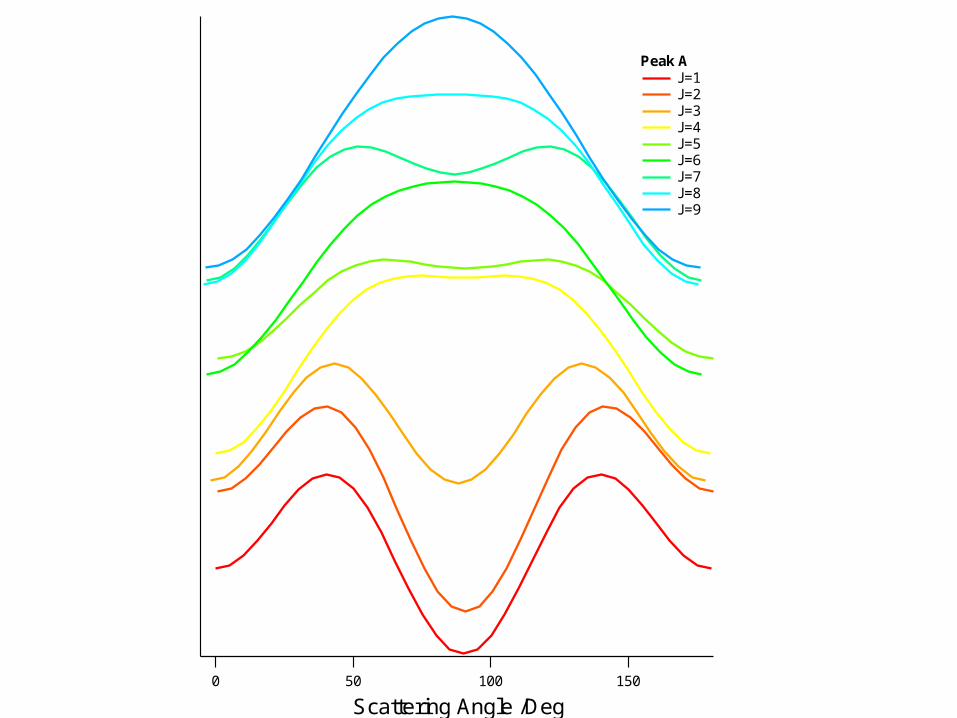
150100500
Scattering Angle /Deg
Peak A J=1 J=2 J=3 J=4 J=5 J=6 J=7 J=8 J=9
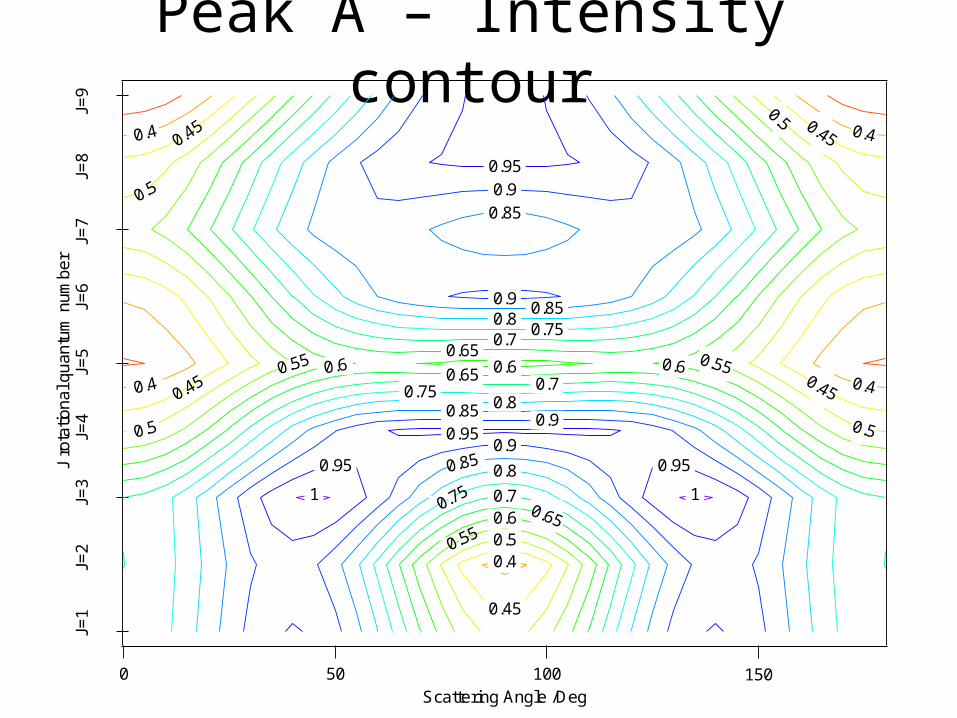
Peak A – Intensity contourJ
rota
tiona
l qua
ntum
num
ber
J=1
J=2
J=3
J=4
J=5
J=6
J=7
J=8
J=9
150100500Scattering Angle /Deg
1 1
0.95
0.95
0.95
0.95
0.9
0.9
0.9 0.9
0.85
0.85
0.85
0.85
0.8
0.8
0.8
0.75
0.75
0.75
0.7
0.7
0.7
0.65
0.65
0.65 0.6
0.6
0.6 0.6
0.55
0.55 0.55
0.5
0.5
0.5
0.5 0.5
0.45
0.45 0.45
0.45 0.45
0.4
0.4 0.4
0.4 0.4

Peak B angular distributions
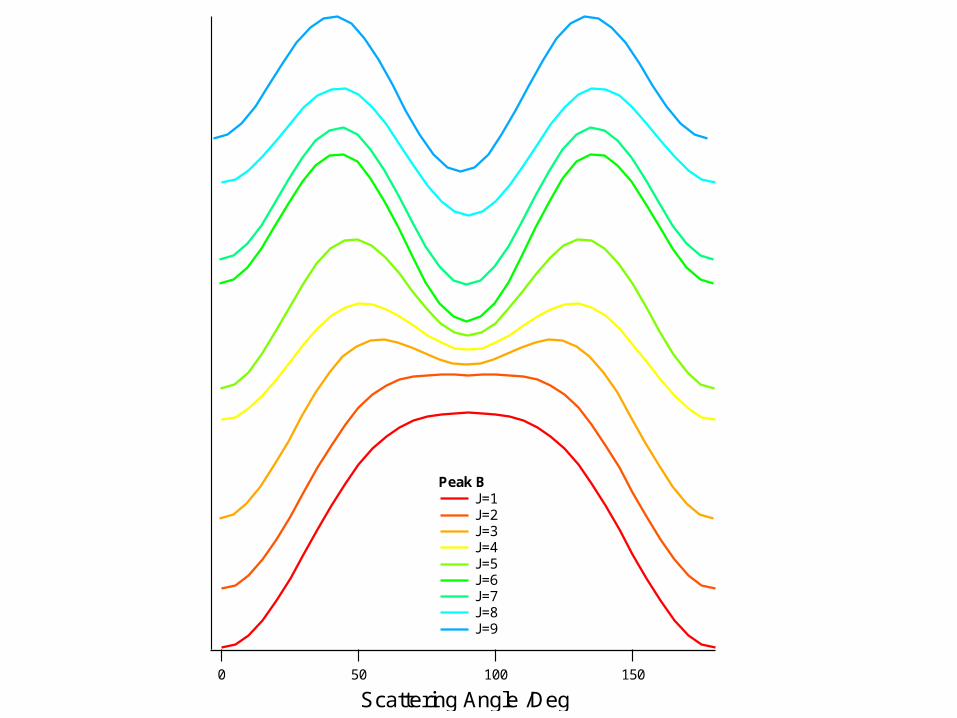
150100500
Scattering Angle /Deg
Peak B J=1 J=2 J=3 J=4 J=5 J=6 J=7 J=8 J=9
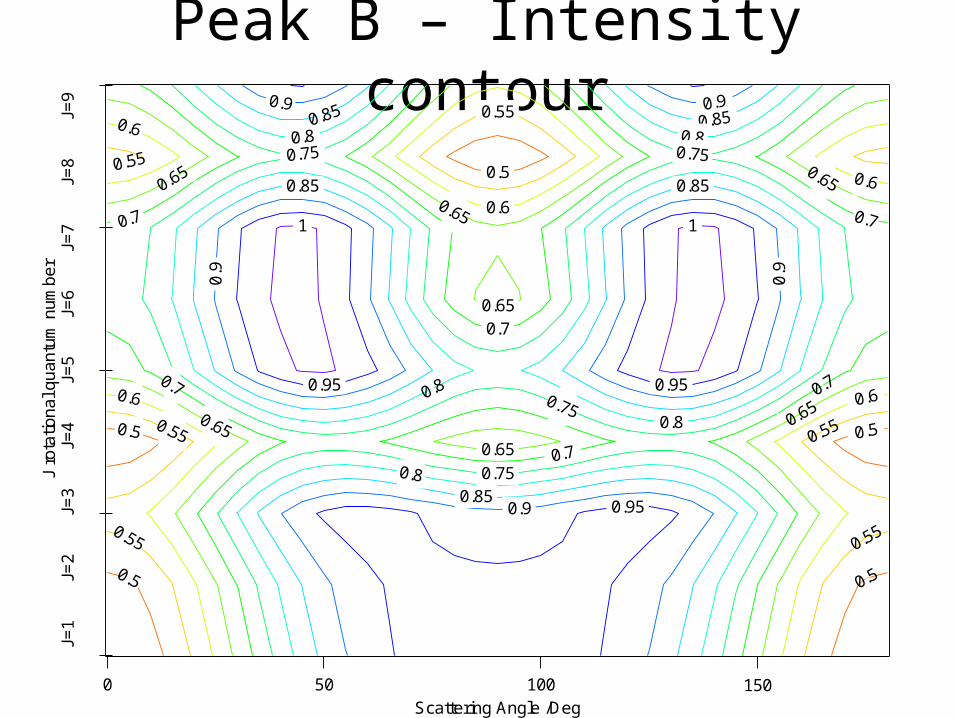
Peak B – Intensity contourJ
rota
tiona
l qua
ntum
num
ber
J=1
J=2
J=3
J=4
J=5
J=6
J=7
J=8
J=9
150100500Scattering Angle /Deg
1 1
0.95 0.95
0.95
0.9
0.9
0.9 0.9
0.9
0.85 0.85
0.85 0.85
0.85
0.8 0.8
0.8 0.8
0.8
0.75
0.75 0.75
0.75 0.7
0.7 0.7
0.7
0.7 0.7
0.65
0.65
0.65 0.65 0.65
0.65 0.65
0.6
0.6
0.6
0.6 0.6
0.55
0.55
0.55
0.55 0.55
0.55
0.5
0.5
0.5 0.5
0.5
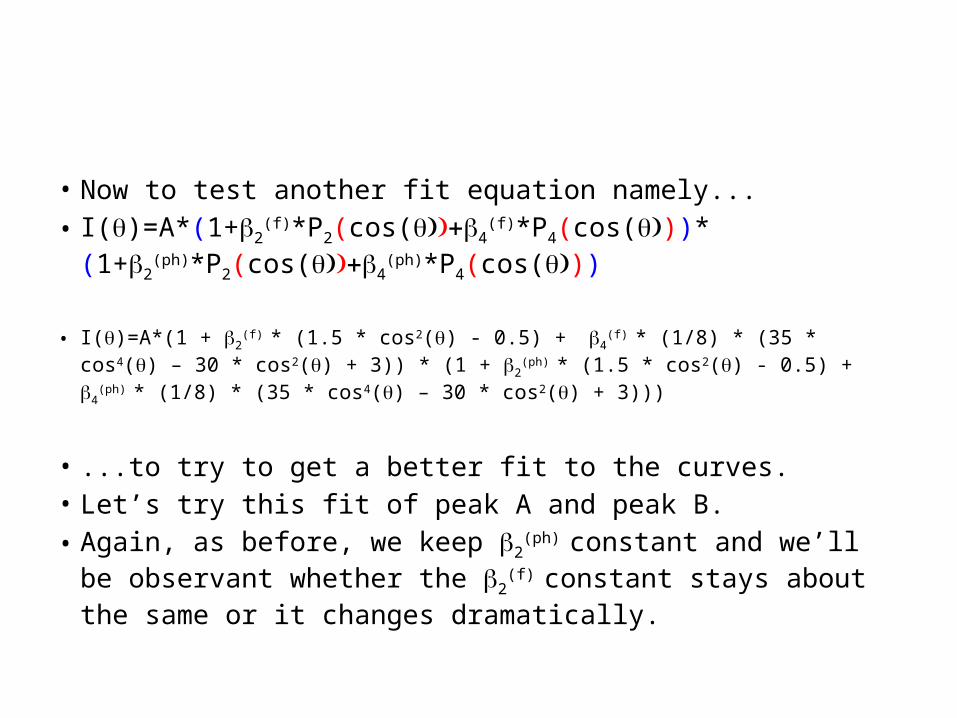
• Now to test another fit equation namely...• I(q)=A*(1+b2
(f)*P2(cos(q))+b4(f)*P4(cos(q)))*
(1+b2(ph)*P2(cos(q))+b4
(ph)*P4(cos(q)))
• I(q)=A*(1 + b2(f) * (1.5 * cos2(q) - 0.5) + b4
(f) * (1/8) * (35 * cos4(q) – 30 * cos2(q) + 3)) * (1 + b2
(ph) * (1.5 * cos2(q) - 0.5) + b4(ph) * (1/8) * (35 * cos4(q) – 30 * cos2(q) + 3)))
• ...to try to get a better fit to the curves. • Let’s try this fit of peak A and peak B.• Again, as before, we keep b2
(ph) constant and we’ll be observant whether the b2
(f) constant stays about the same or it changes dramatically.

J=1 – Peak A1.0
0.8
0.6
0.4
0.2
0.0
Inte
nsity
/Arb
.U.
150100500
Scattering Angle /Deg
Curve Fit ResultsTue, Mar 11, 2014 16:10:06
Fit Type: least squares fitCoefficient values ¡À one standard deviation
A =0.89905 ± 0.0104beta2f =1.2806 ± 0.0331beta2 =-0.62215 ± 0beta4f =0.30293 ± 0.0561beta4 =-0.012273 ± 0.0179
• And comparison with the previous “Ice fit”.
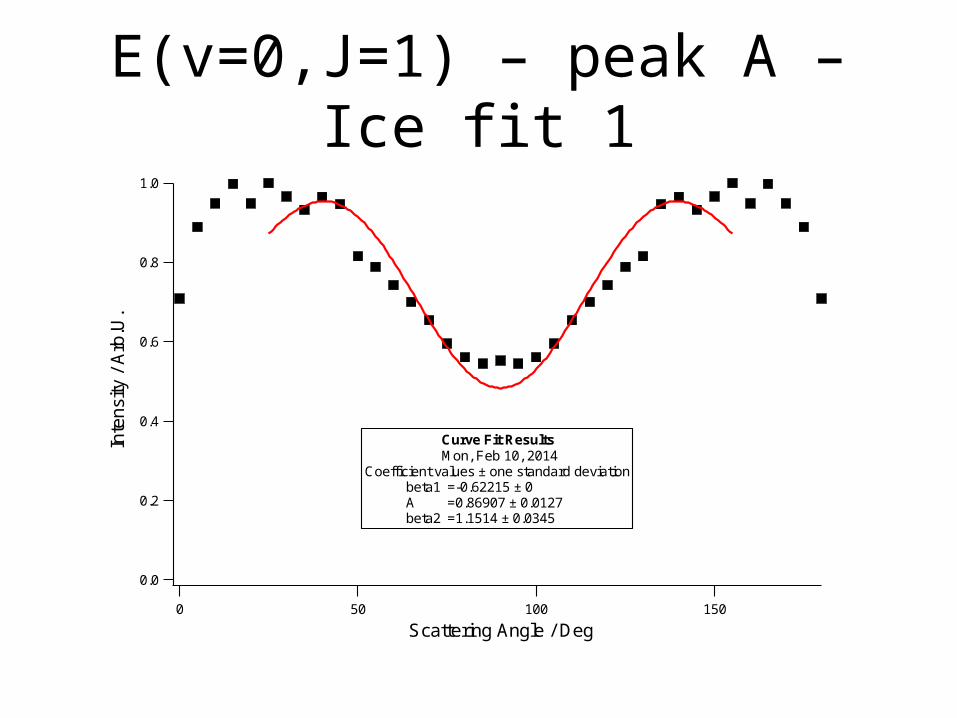
E(v=0,J=1) – peak A – Ice fit 11.0
0.8
0.6
0.4
0.2
0.0
Inte
nsity
/ A
rb.U
.
150100500
Scattering Angle / Deg
Curve Fit Results Mon, Feb 10, 2014Coefficient values ± one standard deviation beta1 =-0.62215 ± 0 A =0.86907 ± 0.0127 beta2 =1.1514 ± 0.0345
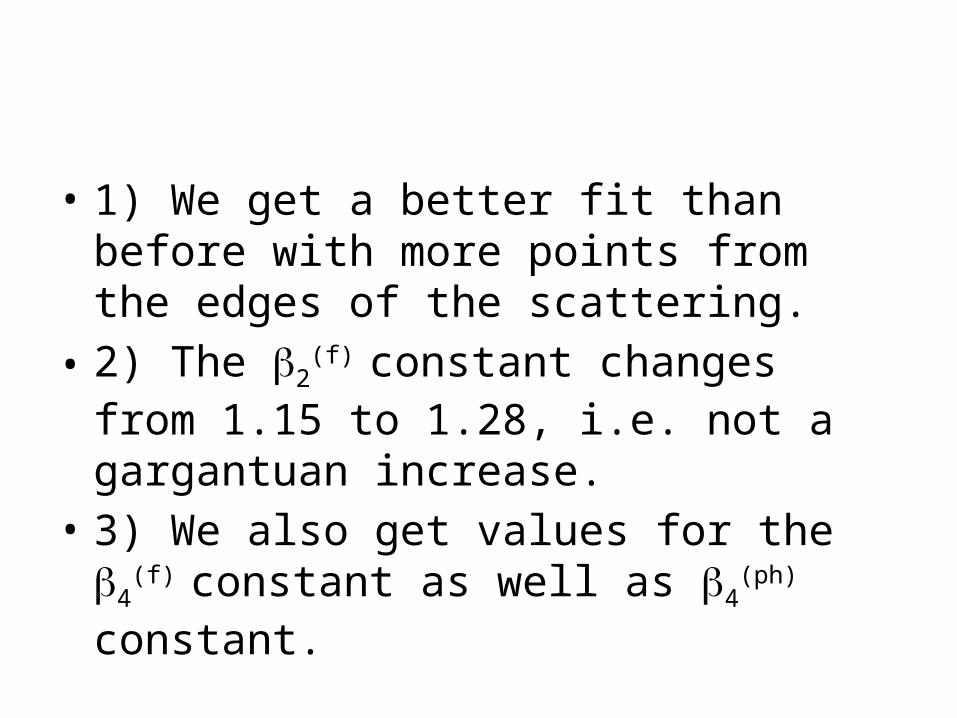
• 1) We get a better fit than before with more points from the edges of the scattering.
• 2) The b2(f) constant changes from 1.15 to 1.28,
i.e. not a gargantuan increase. • 3) We also get values for the b4
(f) constant as well as b4
(ph) constant.
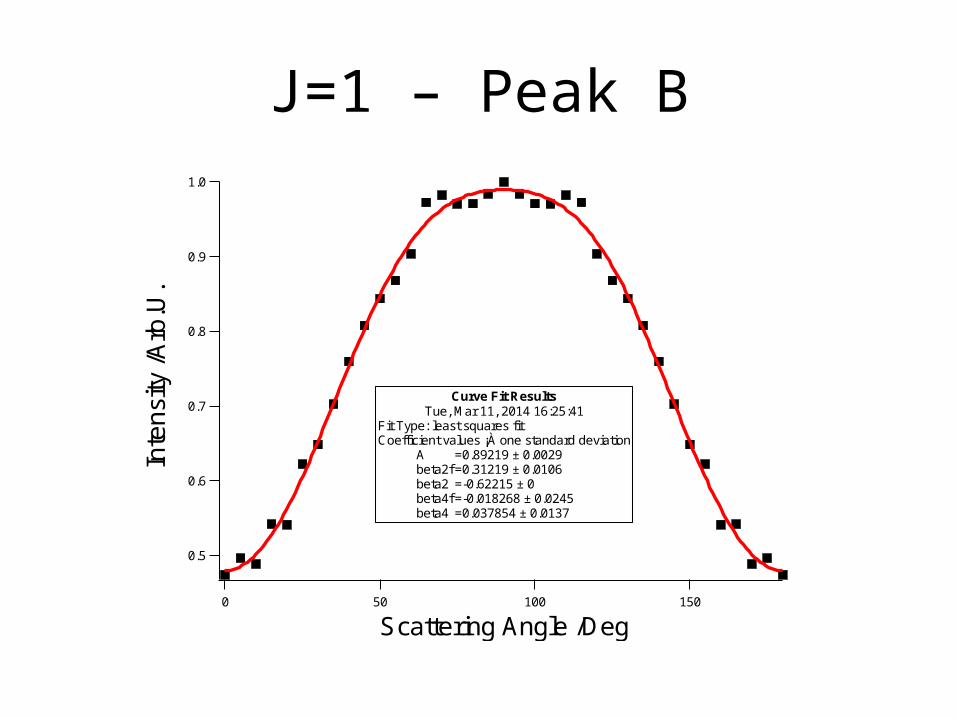
J=1 – Peak B1.0
0.9
0.8
0.7
0.6
0.5
Inte
nsity
/Arb
.U.
150100500
Scattering Angle /Deg
Curve Fit ResultsTue, Mar 11, 2014 16:25:41
Fit Type: least squares fitCoefficient values ¡À one standard deviation
A =0.89219 ± 0.0029beta2f =0.31219 ± 0.0106beta2 =-0.62215 ± 0beta4f =-0.018268 ± 0.0245beta4 =0.037854 ± 0.0137
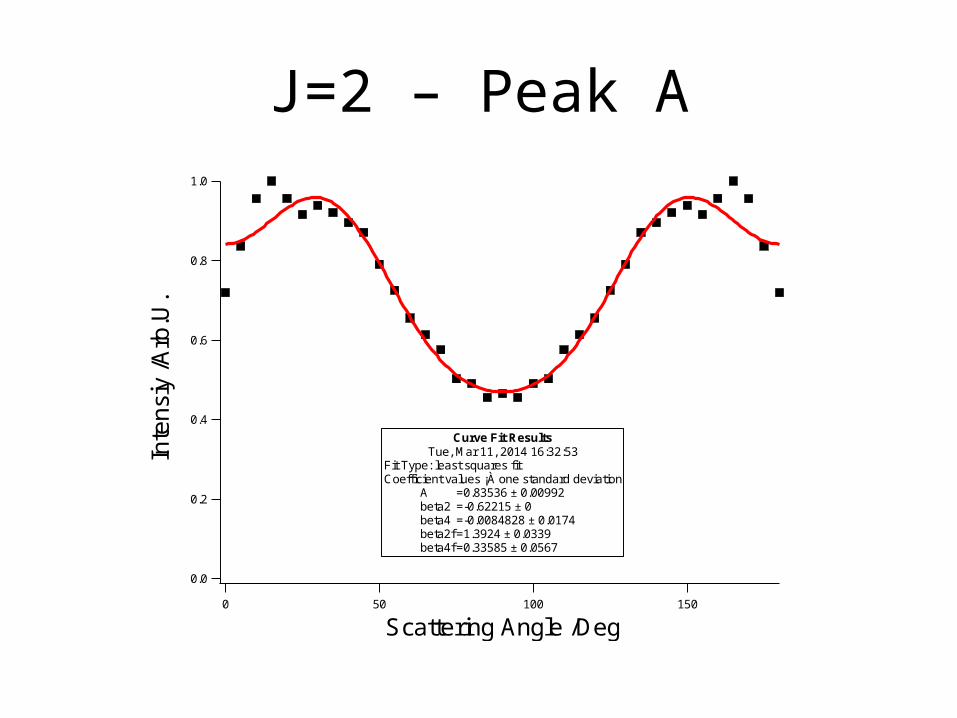
J=2 – Peak A1.0
0.8
0.6
0.4
0.2
0.0
Inte
nsiy
/Arb
.U.
150100500
Scattering Angle /Deg
Curve Fit ResultsTue, Mar 11, 2014 16:32:53
Fit Type: least squares fitCoefficient values ¡À one standard deviation
A =0.83536 ± 0.00992beta2 =-0.62215 ± 0beta4 =-0.0084828 ± 0.0174beta2f =1.3924 ± 0.0339beta4f =0.33585 ± 0.0567
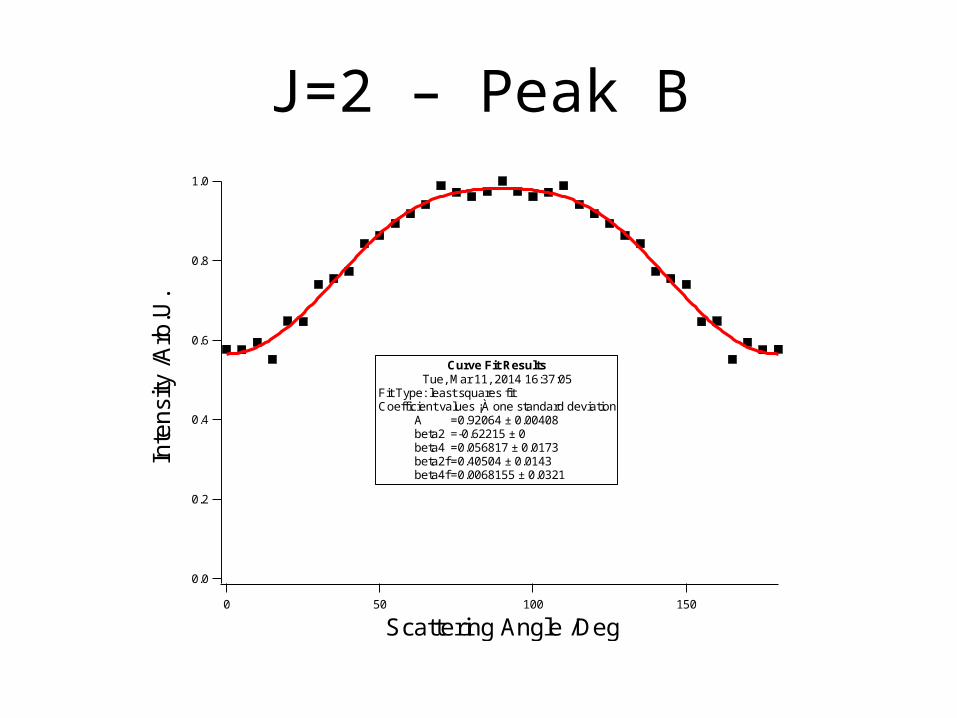
J=2 – Peak B1.0
0.8
0.6
0.4
0.2
0.0
Inte
nsity
/Arb
.U.
150100500
Scattering Angle /Deg
Curve Fit ResultsTue, Mar 11, 2014 16:37:05
Fit Type: least squares fitCoefficient values ¡À one standard deviation
A =0.92064 ± 0.00408beta2 =-0.62215 ± 0beta4 =0.056817 ± 0.0173beta2f =0.40504 ± 0.0143beta4f =0.0068155 ± 0.0321
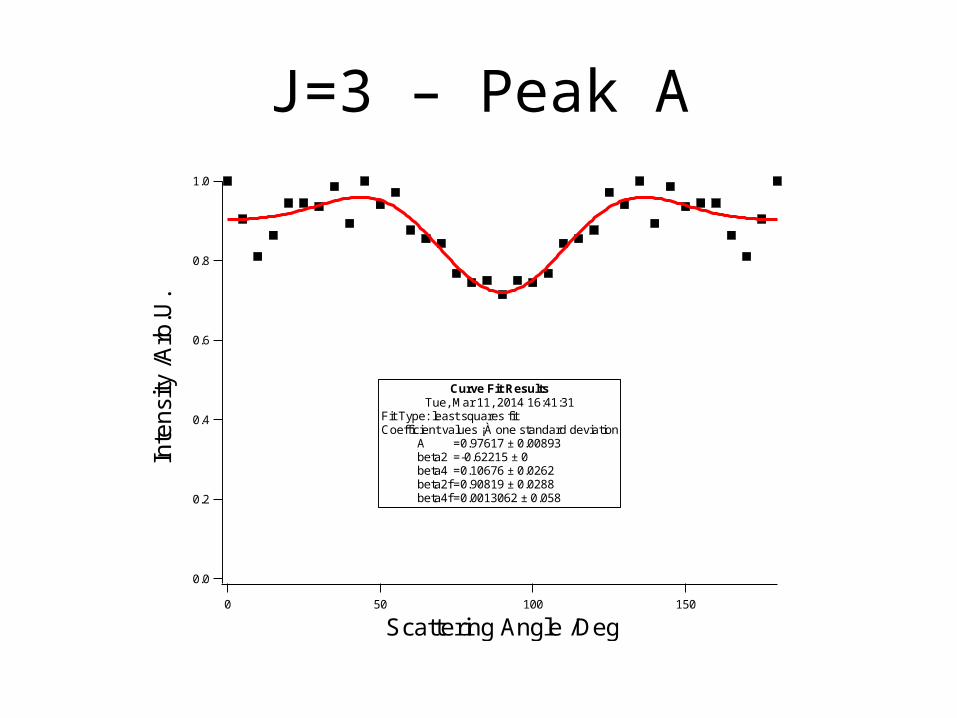
J=3 – Peak A1.0
0.8
0.6
0.4
0.2
0.0
Inte
nsity
/Arb
.U.
150100500
Scattering Angle /Deg
Curve Fit ResultsTue, Mar 11, 2014 16:41:31
Fit Type: least squares fitCoefficient values ¡À one standard deviation
A =0.97617 ± 0.00893beta2 =-0.62215 ± 0beta4 =0.10676 ± 0.0262beta2f =0.90819 ± 0.0288beta4f =0.0013062 ± 0.058
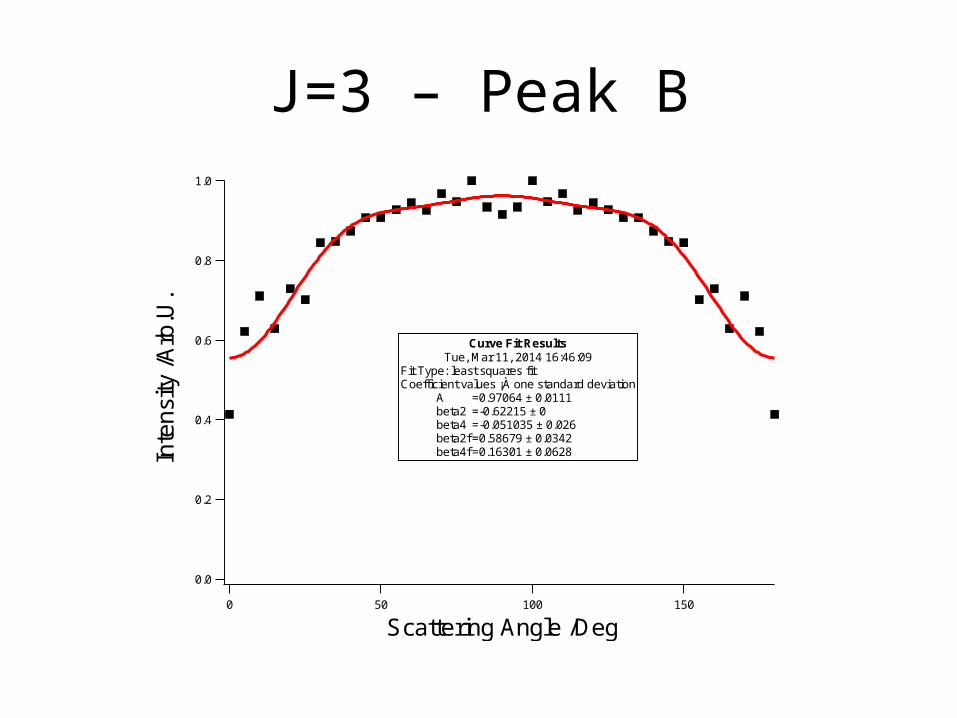
J=3 – Peak B1.0
0.8
0.6
0.4
0.2
0.0
Inte
nsity
/Arb
.U.
150100500
Scattering Angle /Deg
Curve Fit ResultsTue, Mar 11, 2014 16:46:09
Fit Type: least squares fitCoefficient values ¡À one standard deviation
A =0.97064 ± 0.0111beta2 =-0.62215 ± 0beta4 =-0.051035 ± 0.026beta2f =0.58679 ± 0.0342beta4f =0.16301 ± 0.0628
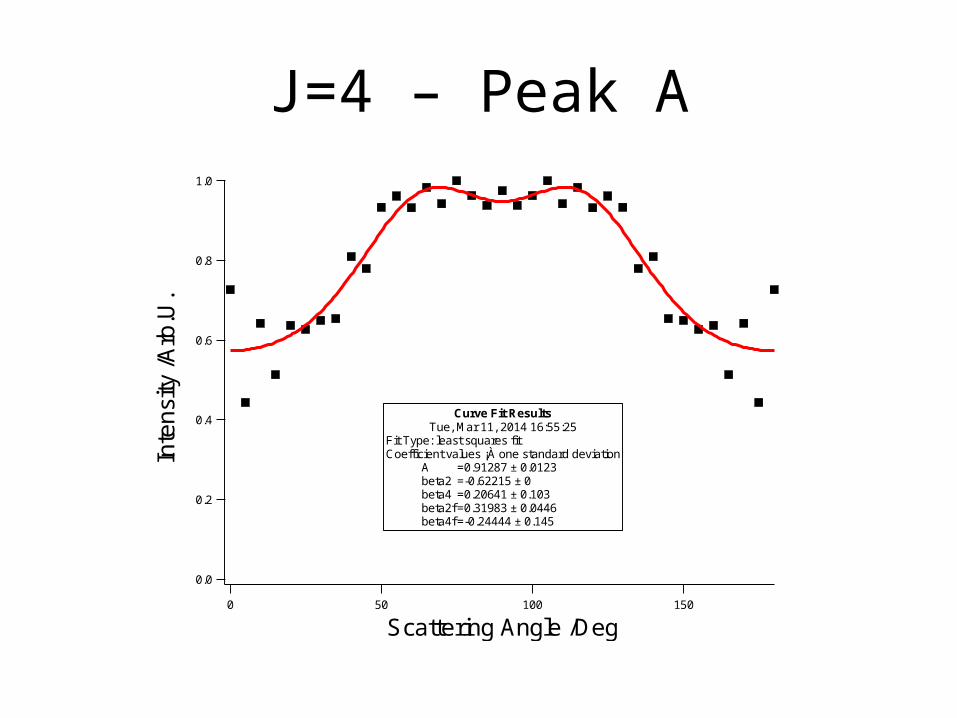
J=4 – Peak A1.0
0.8
0.6
0.4
0.2
0.0
Inte
nsity
/Arb
.U.
150100500
Scattering Angle /Deg
Curve Fit ResultsTue, Mar 11, 2014 16:55:25
Fit Type: least squares fitCoefficient values ¡À one standard deviation
A =0.91287 ± 0.0123beta2 =-0.62215 ± 0beta4 =0.20641 ± 0.103beta2f =0.31983 ± 0.0446beta4f =-0.24444 ± 0.145

J=4 – Peak B1.0
0.8
0.6
0.4
0.2
0.0
Inte
nsity
/Arb
.U.
150100500
Scattering Angle /Deg
Curve Fit ResultsTue, Mar 11, 2014 17:01:34
Fit Type: least squares fitCoefficient values ¡À one standard deviation
A =0.72831 ± 0.00394beta2 =-0.62215 ± 0beta4 =0.058362 ± 0.0169beta2f =0.724 ± 0.017beta4f =0.049751 ± 0.0348
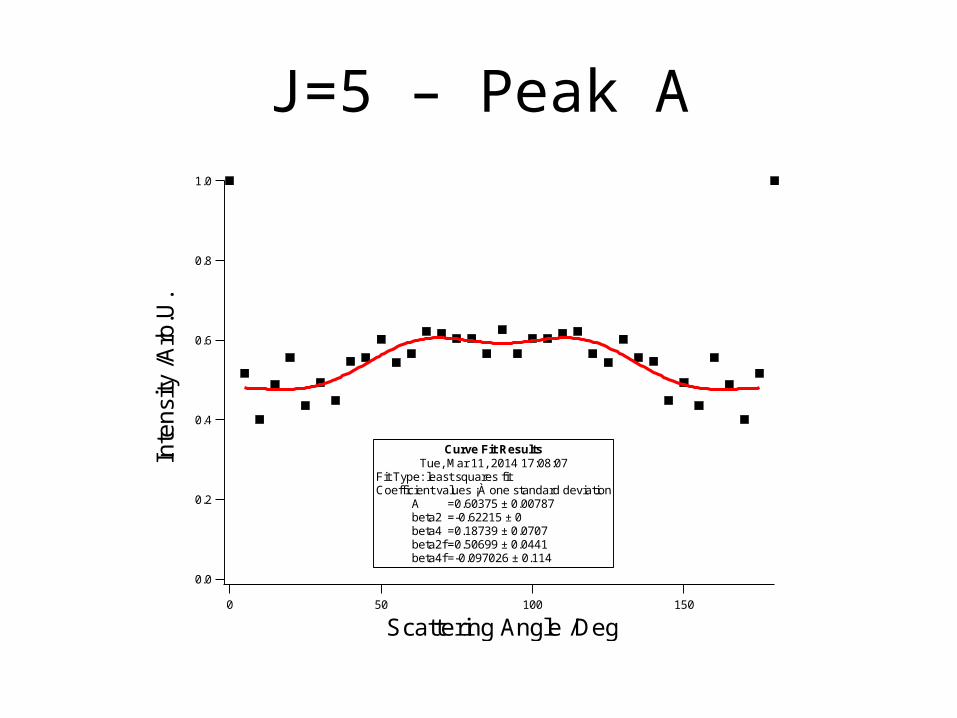
J=5 – Peak A1.0
0.8
0.6
0.4
0.2
0.0
Inte
nsity
/Arb
.U.
150100500
Scattering Angle /Deg
Curve Fit ResultsTue, Mar 11, 2014 17:08:07
Fit Type: least squares fitCoefficient values ¡À one standard deviation
A =0.60375 ± 0.00787beta2 =-0.62215 ± 0beta4 =0.18739 ± 0.0707beta2f =0.50699 ± 0.0441beta4f =-0.097026 ± 0.114
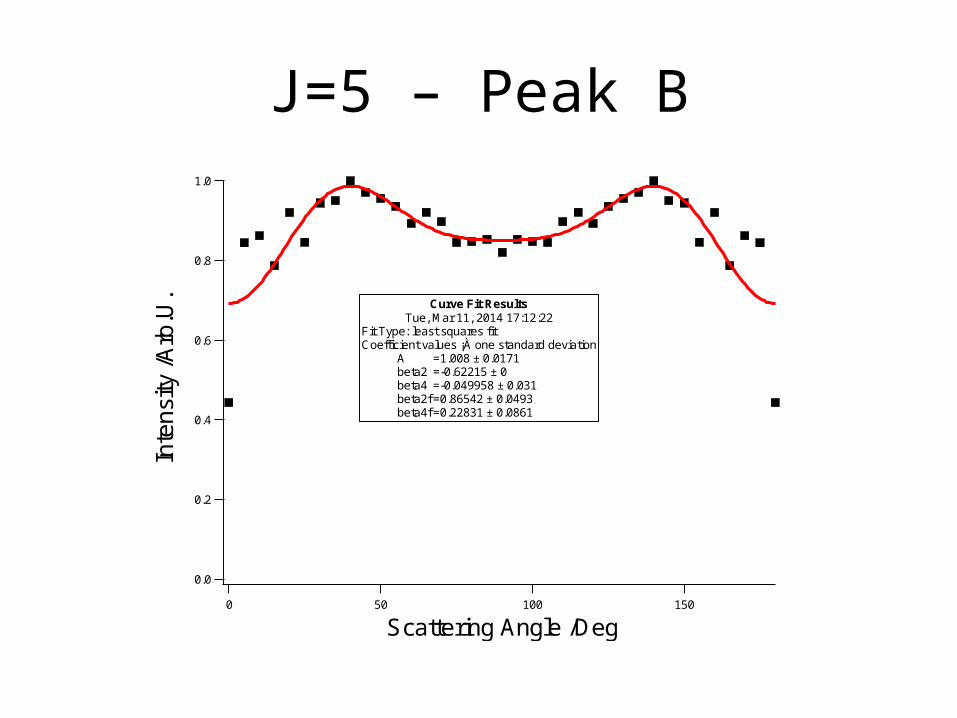
J=5 – Peak B1.0
0.8
0.6
0.4
0.2
0.0
Inte
nsity
/Arb
.U.
150100500
Scattering Angle /Deg
Curve Fit ResultsTue, Mar 11, 2014 17:12:22
Fit Type: least squares fitCoefficient values ¡À one standard deviation
A =1.008 ± 0.0171beta2 =-0.62215 ± 0beta4 =-0.049958 ± 0.031beta2f =0.86542 ± 0.0493beta4f =0.22831 ± 0.0861
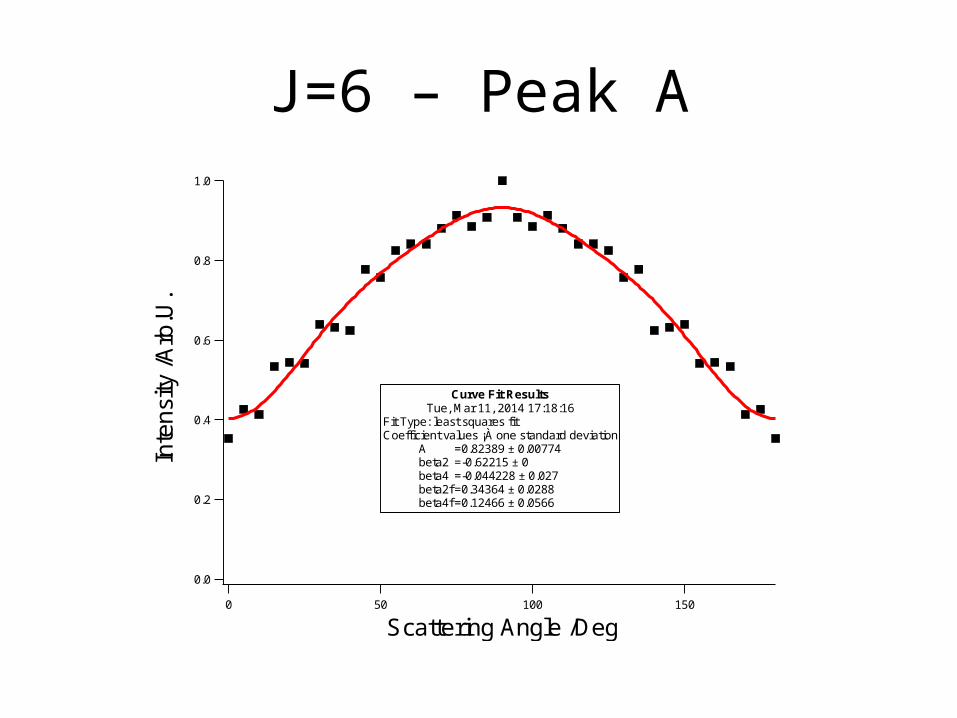
J=6 – Peak A1.0
0.8
0.6
0.4
0.2
0.0
Inte
nsity
/Arb
.U.
150100500
Scattering Angle /Deg
Curve Fit ResultsTue, Mar 11, 2014 17:18:16
Fit Type: least squares fitCoefficient values ¡À one standard deviation
A =0.82389 ± 0.00774beta2 =-0.62215 ± 0beta4 =-0.044228 ± 0.027beta2f =0.34364 ± 0.0288beta4f =0.12466 ± 0.0566
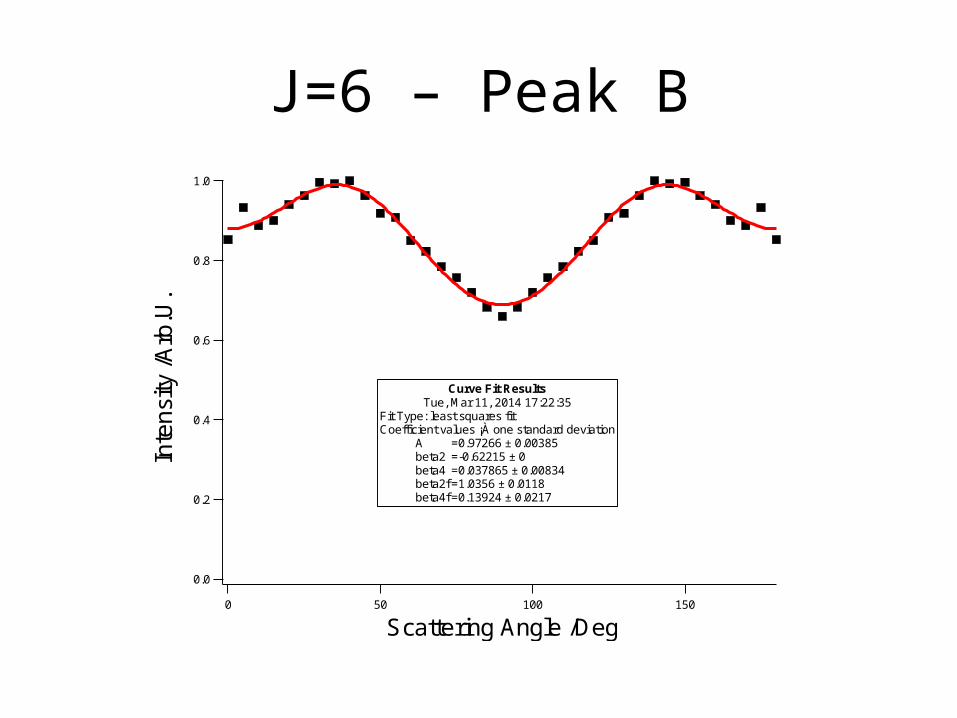
J=6 – Peak B1.0
0.8
0.6
0.4
0.2
0.0
Inte
nsity
/Arb
.U.
150100500
Scattering Angle /Deg
Curve Fit ResultsTue, Mar 11, 2014 17:22:35
Fit Type: least squares fitCoefficient values ¡À one standard deviation
A =0.97266 ± 0.00385beta2 =-0.62215 ± 0beta4 =0.037865 ± 0.00834beta2f =1.0356 ± 0.0118beta4f =0.13924 ± 0.0217
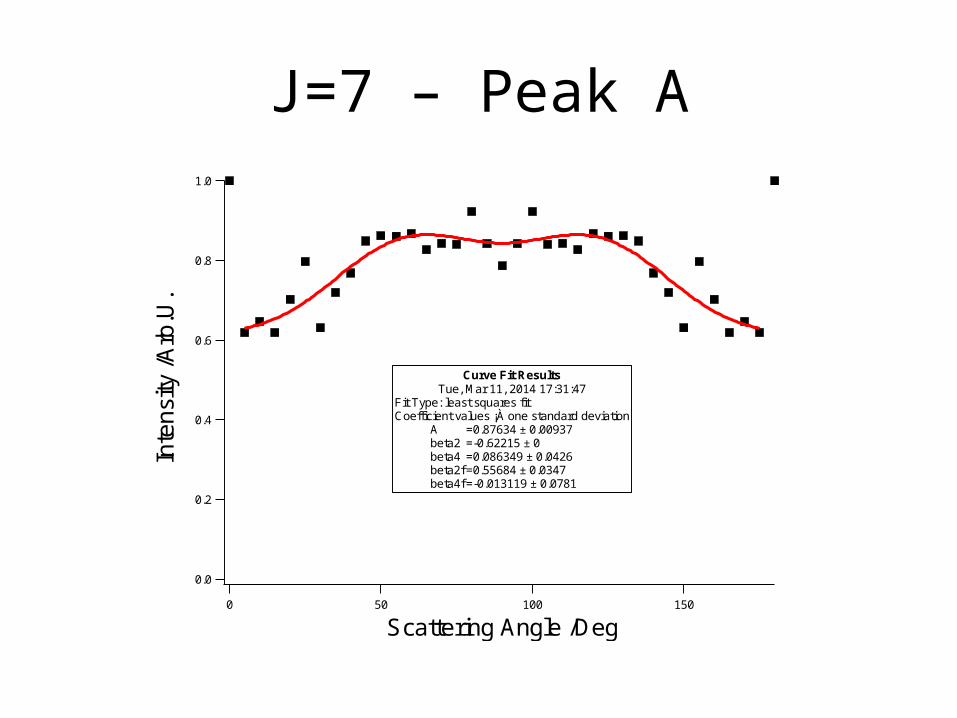
J=7 – Peak A1.0
0.8
0.6
0.4
0.2
0.0
Inte
nsity
/Arb
.U.
150100500
Scattering Angle /Deg
Curve Fit ResultsTue, Mar 11, 2014 17:31:47
Fit Type: least squares fitCoefficient values ¡À one standard deviation
A =0.87634 ± 0.00937beta2 =-0.62215 ± 0beta4 =0.086349 ± 0.0426beta2f =0.55684 ± 0.0347beta4f =-0.013119 ± 0.0781
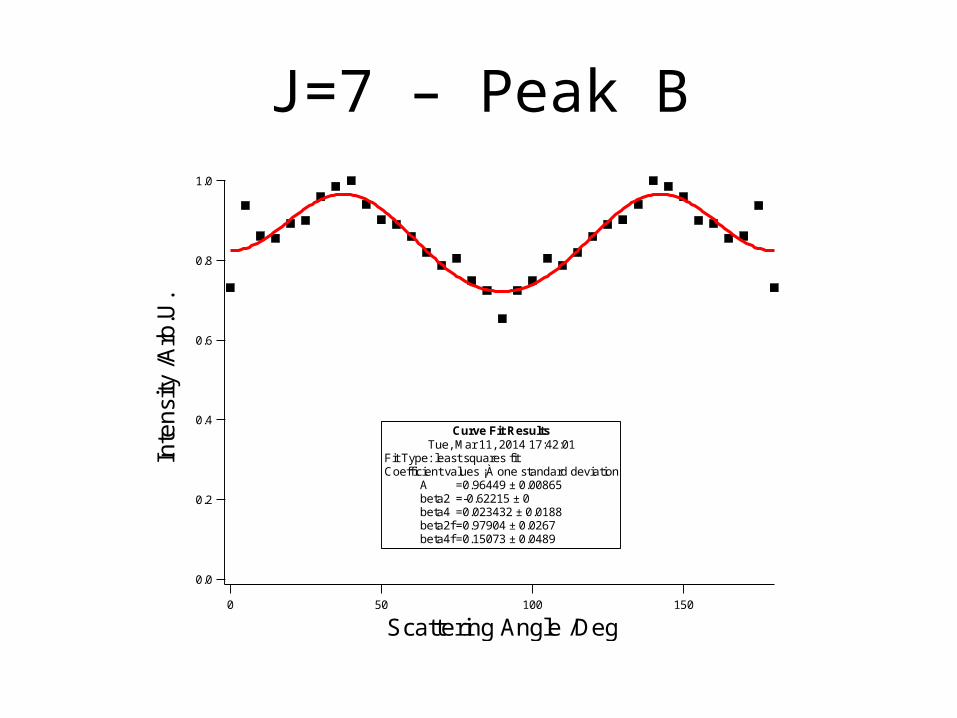
J=7 – Peak B1.0
0.8
0.6
0.4
0.2
0.0
Inte
nsity
/Arb
.U.
150100500
Scattering Angle /Deg
Curve Fit ResultsTue, Mar 11, 2014 17:42:01
Fit Type: least squares fitCoefficient values ¡À one standard deviation
A =0.96449 ± 0.00865beta2 =-0.62215 ± 0beta4 =0.023432 ± 0.0188beta2f =0.97904 ± 0.0267beta4f =0.15073 ± 0.0489
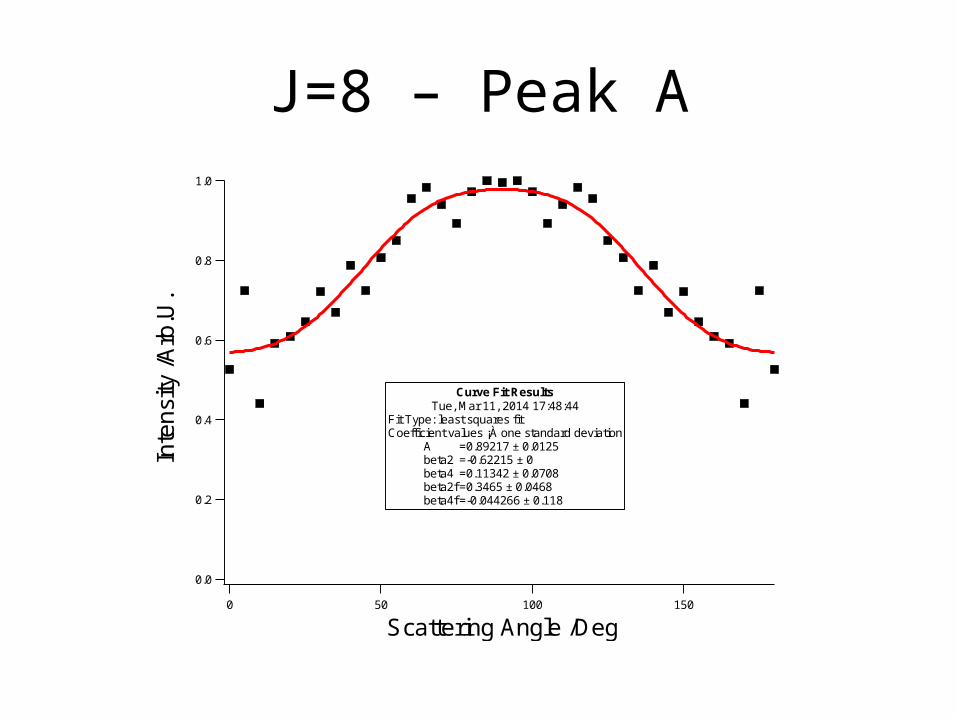
J=8 – Peak A1.0
0.8
0.6
0.4
0.2
0.0
Inte
nsity
/Arb
.U.
150100500
Scattering Angle /Deg
Curve Fit ResultsTue, Mar 11, 2014 17:48:44
Fit Type: least squares fitCoefficient values ¡À one standard deviation
A =0.89217 ± 0.0125beta2 =-0.62215 ± 0beta4 =0.11342 ± 0.0708beta2f =0.3465 ± 0.0468beta4f =-0.044266 ± 0.118

J=8 – Peak B1.0
0.8
0.6
0.4
0.2
0.0
Inte
nsity
/Arb
.U.
150100500
Scattering Angle /Deg
Curve Fit ResultsTue, Mar 11, 2014 17:51:54
Fit Type: least squares fitCoefficient values ¡À one standard deviation
A =0.70668 ± 0.00398beta2 =-0.62215 ± 0beta4 =0.047804 ± 0.013beta2f =1.049 ± 0.017beta4f =0.18153 ± 0.0315

J=9 – Peak A1.0
0.8
0.6
0.4
0.2
0.0
Inte
nsity
/Arb
.U.
150100500
Scattering Angle /Deg
Curve Fit ResultsTue, Mar 11, 2014 17:57:10
Fit Type: least squares fitCoefficient values ¡À one standard deviation
A =0.75873 ± 0.00507beta2 =-0.62215 ± 0beta4 =0.12886 ± 0.0691beta2f =0.022121 ± 0.023beta4f =-0.16096 ± 0.0904
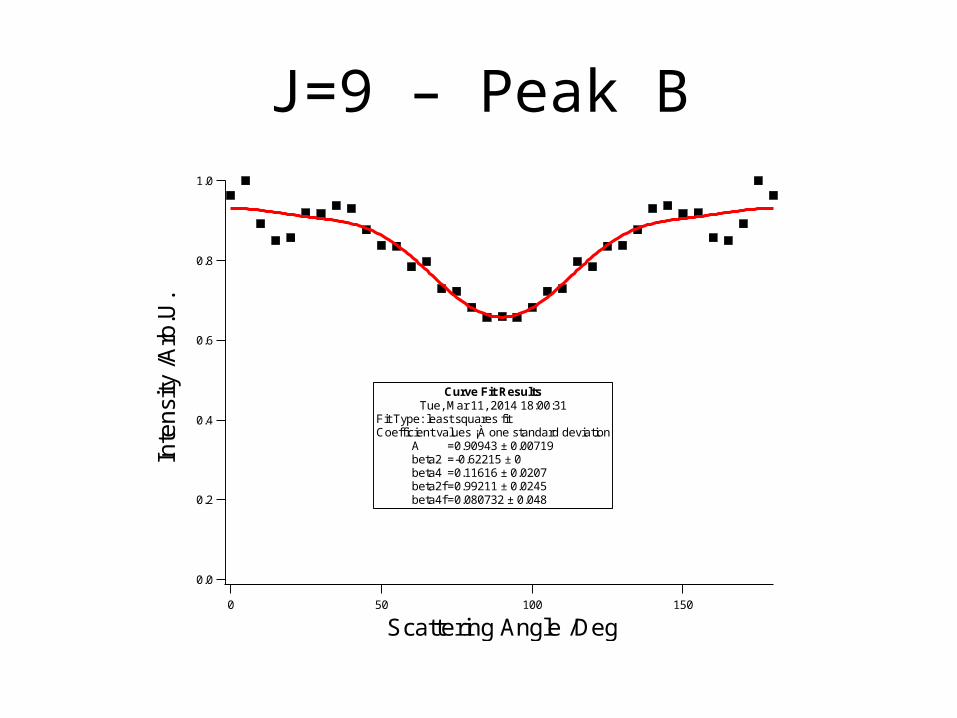
J=9 – Peak B1.0
0.8
0.6
0.4
0.2
0.0
Inte
nsity
/Arb
.U.
150100500
Scattering Angle /Deg
Curve Fit ResultsTue, Mar 11, 2014 18:00:31
Fit Type: least squares fitCoefficient values ¡À one standard deviation
A =0.90943 ± 0.00719beta2 =-0.62215 ± 0beta4 =0.11616 ± 0.0207beta2f =0.99211 ± 0.0245beta4f =0.080732 ± 0.048
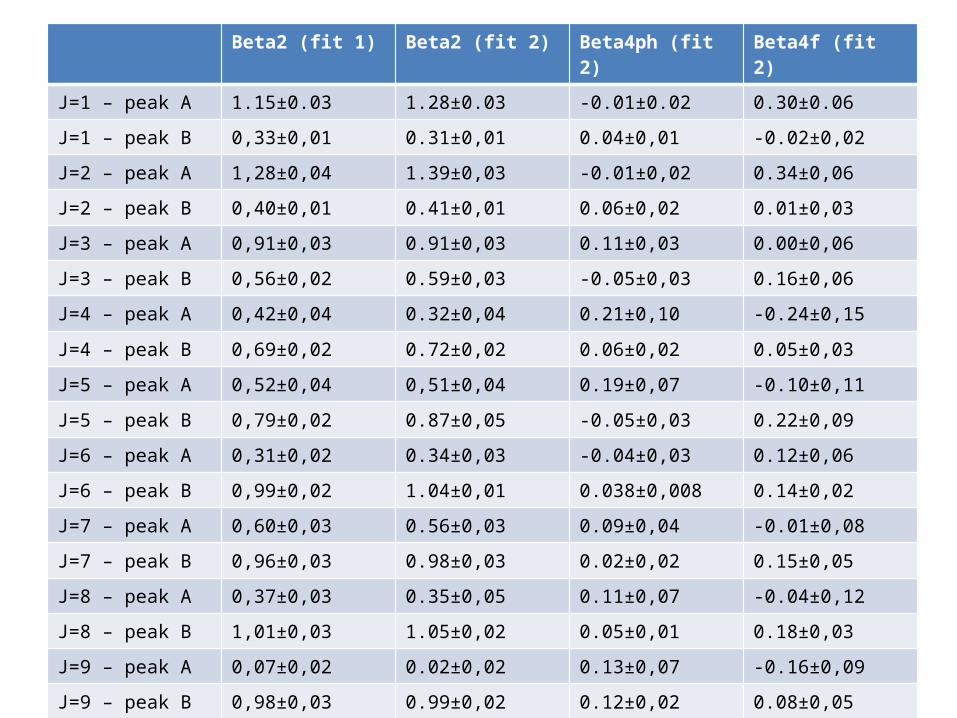
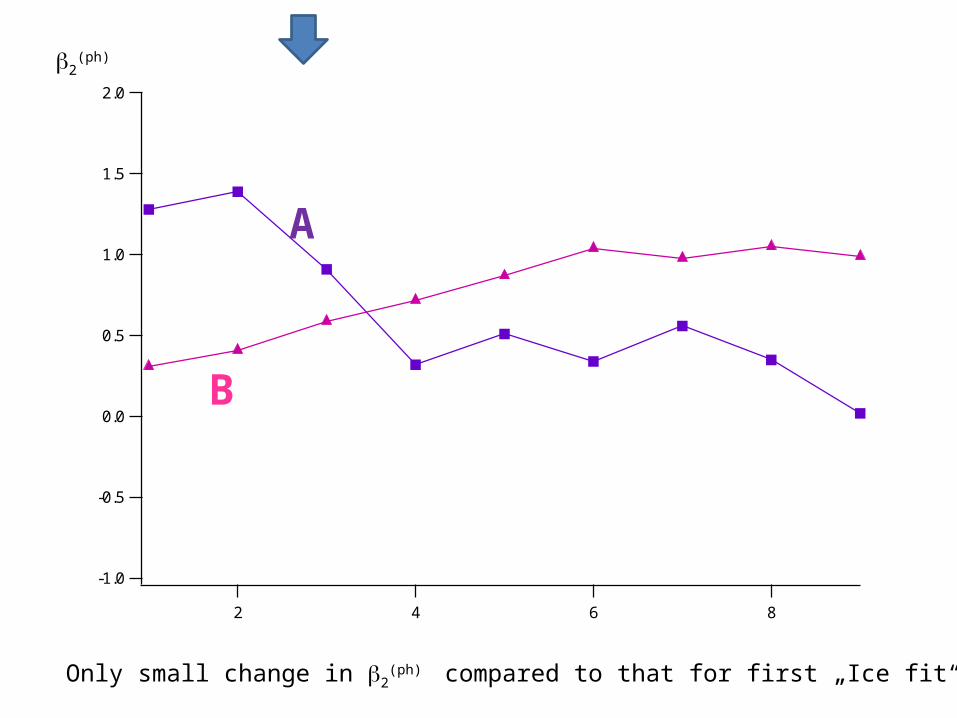
Beta2 (fit 1) Beta2 (fit 2) Beta4ph (fit 2) Beta4f (fit 2)
J=1 – peak A 1.15±0.03 1.28±0.03 -0.01±0.02 0.30±0.06
J=1 – peak B 0,33±0,01 0.31±0,01 0.04±0,01 -0.02±0,02
J=2 – peak A 1,28±0,04 1.39±0,03 -0.01±0,02 0.34±0,06
J=2 – peak B 0,40±0,01 0.41±0,01 0.06±0,02 0.01±0,03
J=3 – peak A 0,91±0,03 0.91±0,03 0.11±0,03 0.00±0,06
J=3 – peak B 0,56±0,02 0.59±0,03 -0.05±0,03 0.16±0,06
J=4 – peak A 0,42±0,04 0.32±0,04 0.21±0,10 -0.24±0,15
J=4 – peak B 0,69±0,02 0.72±0,02 0.06±0,02 0.05±0,03
J=5 – peak A 0,52±0,04 0,51±0,04 0.19±0,07 -0.10±0,11
J=5 – peak B 0,79±0,02 0.87±0,05 -0.05±0,03 0.22±0,09
J=6 – peak A 0,31±0,02 0.34±0,03 -0.04±0,03 0.12±0,06
J=6 – peak B 0,99±0,02 1.04±0,01 0.038±0,008 0.14±0,02
J=7 – peak A 0,60±0,03 0.56±0,03 0.09±0,04 -0.01±0,08
J=7 – peak B 0,96±0,03 0.98±0,03 0.02±0,02 0.15±0,05
J=8 – peak A 0,37±0,03 0.35±0,05 0.11±0,07 -0.04±0,12
J=8 – peak B 1,01±0,03 1.05±0,02 0.05±0,01 0.18±0,03
J=9 – peak A 0,07±0,02 0.02±0,02 0.13±0,07 -0.16±0,09
J=9 – peak B 0,98±0,03 0.99±0,02 0.12±0,02 0.08±0,05
2.0
1.5
1.0
0.5
0.0
-0.5
-1.0
8642
A
B
Only small change in b2(ph) compared to that for first „Ice fit“:
b2(ph)
The Icelandic fitb2
(ph)

All in alla) The vibrational peaks C – G involve almost purely Parallel photodissociation transitionb) The H+ + Br(1/2) formation (peak A) involves decreasing parallel/ increasing perpendicular
photodissociation transition with J´.c) The H + + Br(3/2) formation (peak B) involves increasing parallel/ decreasing perpendicular
photodissociation transition with J´.
This can be compared with the predicted transitions, based on the comparison with HCl as shown on next slides (see also https://notendur.hi.is/~agust/rannsoknir/Crete/HBr%20REMPI%20work-Crete.pptx )
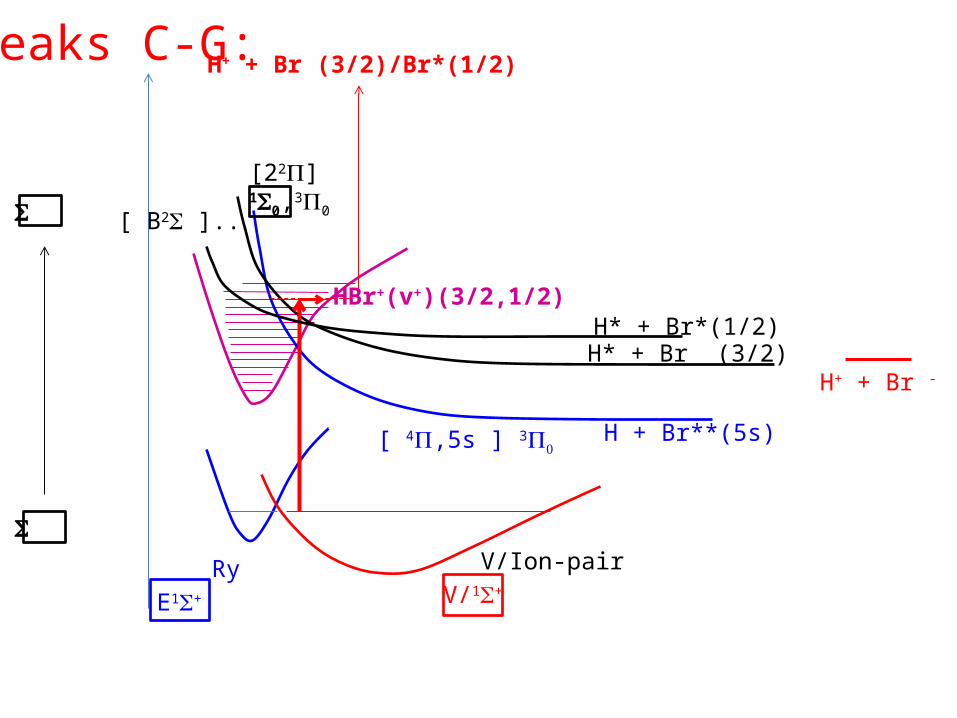
H* + Br (3/2)H+ + Br -
Ry V/Ion-pair
[ 4P,5s ] 3P0
H* + Br*(1/2)
[ B2S ]..
H + Br**(5s)
H+ + Br (3/2)/Br*(1/2)
HBr+(v+)(3/2,1/2)
E1S+ V/1S+
Peaks C-G:
[22P]1S0,3P0S
S

H* + Br (3/2)H+ + Br-
Ry V/Ion-pair
[ 4P,5s ] 3P0
H* + Br*(1/2)
[22P]1S0,3P0[ B2S ]..
H + Br**(5s)
H+ + Br*(1/2)
E1S+ V/1S+
Peak A:
S and Pstatesinvolved

H* + Br (3/2)
Ry V/Ion-pair
[ 4P,5s ] 3P0
H* + Br*(1/2)
[ B2S ]..
H + Br**(5s)
H+ + Br(3/2)
H+ + Br-
[22P]1S0,3P0
Peak B:
E1S+ V/1S+
S and Pstatesinvolved