Vital and Health Statistics; Series 11, No. 38 (8/73) · PDF fileNational Center for Health...
35
Data from. the NATIONAL HEALTH SURVEY Series 11 Number 38 Parity and Hypertension Relationship between parity and hypertension as shown in data from the Health Examination Survey, 1960-62, DHEW Publication No. (HRA) 74-1024 U.S. DEPARTMENT OF HEALTH, EDUCATION, AND WELFARE Public Health Service Health Resources Administration National Center for Health Statistics Rockville, Maryland
Transcript of Vital and Health Statistics; Series 11, No. 38 (8/73) · PDF fileNational Center for Health...
Data from. theNATIONAL HEALTH SURVEY
Series 11Number 38
Parity andHypertension
Relationship between parity and hypertensionas shown in data from the Health ExaminationSurvey, 1960-62,
DHEW Publication No. (HRA) 74-1024
U.S. DEPARTMENT OF HEALTH, EDUCATION, AND WELFAREPublic Health Service
Health Resources AdministrationNational Center for Health Statistics
Rockville, Maryland

I
Vkd and Health Statistics-Series 11, No. 38Reprinted as DHEW kblication No. (HRA) 741024
August 1973
First issued as DHEW Publication No. (HSM) 72-1024
For sale by the Superintendent of Documents, U.S. Government Printing Office,Washington, D.C., 20402-Price 35 cents
COOPERATION OF THE BUREAU OF THE CENSUS
In accordance with specijkations established by the National Health Sur-vey, the Bureau of the Census, under a contractual agreement, participatedin the design and selection of the sample, and carried out the first stage ofthe field interviewing and certain parts of the statistical processing.
Library of Congress Catalog Card Number 79-169286
CONTENTS
Introduction --------------------------- --------------------------- ----
Source of Data --------------------------------------------------------
Analytical Methods ----------------------------------------------------
Findings ---------------------------- --------------------------- .------
Summary -------------------------------------------------------------
References -------- -------- -------- ---------------- --------------------
List of Detailed Tables --------------------------- ----------------------
Appendix --------- ---------------------------- -------------------------
Page
1
2
7
8
11
12
14
26
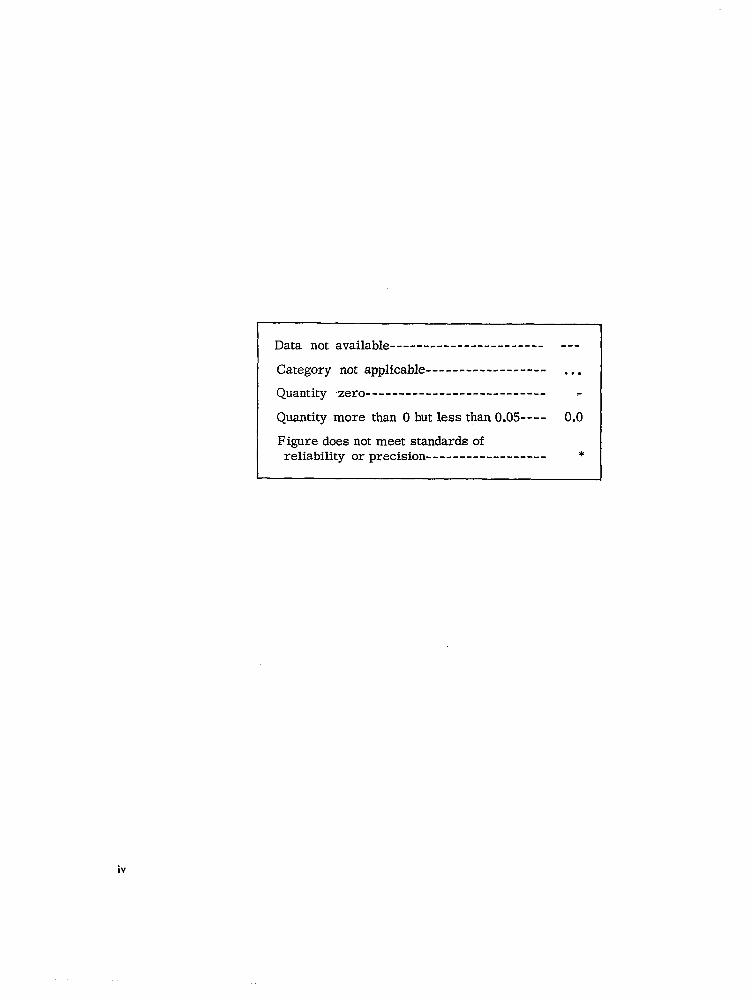
Data not available ----------------------- ---
Category not applicable ------------------ . . .
Quantity zero--------------------------- -I
Quantity more than Obutless than 0.05---- 0.0I
Figure doesnot meet standards ofreliability or precision ------------------ *
}

PARITY AND HYPERTENSIONJames T. Baird, Jrc, Division of Health Examination Statistics
.Leslie G. Quinlivan, M.D., F. R.C.S. (Can.), F. R. C.O.G. University of California at Irvine
INTRODUCTION
Among the many physiological factors whichhave been hypothesized as associated with ele-vated blood pressure levels and increased in-cidence of hypertension, the possible effect ofpregnancy in the production of these conditionshas proven to be among the more elusive toquantitate and evaluate. At the same time, thepossible association is among the more inter-esting from an epidemiological standpoint, notonly because of the importance of the primalquestion of whether or not pregnancy is a fac-tor in the etiology of hypertension, but also be-cause of the component parts represented by thosepregnancies complicated by preeclampsia.
Age is considered by many observers to kan important factor in the production of residualhypertension, and the statistical association ofage with increased blood pressure levels isprobably the most pronounced and easily dem-onstrated phe omenon observable in any study
-4, 5, ? 10, 1spopulation. A moderate decline in averagediastolic blood pressure among the general popu-lation after age 55 is an exce tion to this, and
J’is less frequently evaluated} Body measure-ments, race, and several other variables may becited as also being correlated with blood pressurelevels, however, their effect is much less sig-nificant than that ~bservable for age. 3-‘Y8>13-15
Changes in observed blood pressure levelswith increased parity are certainly, to someextent, the result of indirect association withage, and attempts to identify any remainingadditional effect which might be attributed only
to parity are usually compromised in the typicalsmaller scale clinical study by the very fewcases available on which to base mean bloodpressures specific for age-parity cross-classi-fications.
The association between pregnancy, pre-eclamptic toxemia, and essential hypertensionhas not been clearly defined despite the resultsof several studies. It has been noted that 30.2to 50.9 percent of women who have preeclamptictoxemia are left with a residual hypertensionfollowing the pregnancy. 2>5A residual hyper-tension is considered to be the main factor inthe causation of recurrent preeclamptic tox-emia,2’3 which has a reported incidence rangingfrom 13 to 65 percent in women who had a pre-vious preeclamptic toxemia.3”~ 6
Age and parity are also considered to kcausative factors in recurrent preeclamptic tox-emia2-4 If hypertension present pior to a preg-.nancy is a precursor to recurrent preeclamptictoxemia, the question still remains as to howmuch age and parity affect this hypertension.In support of parity being the factor, Quinlivanobserved that the incidence of cardiovasculardisease in 31,986 women of all parities was 0.8percent, while in 4,721 women of parity 6 ormore, it was 8.4 percent. Isenhour, et. al.’sstudy of 900 nulliparous and 900 parous hos-pitalized women however provides opposing evi-dence.7 They compared the blood pressures in10- year age groups as shown in the patient’srecords and were unable to demonstrate thedifference in the incidence of hypertension oraverage blood pressure levels between nulli-
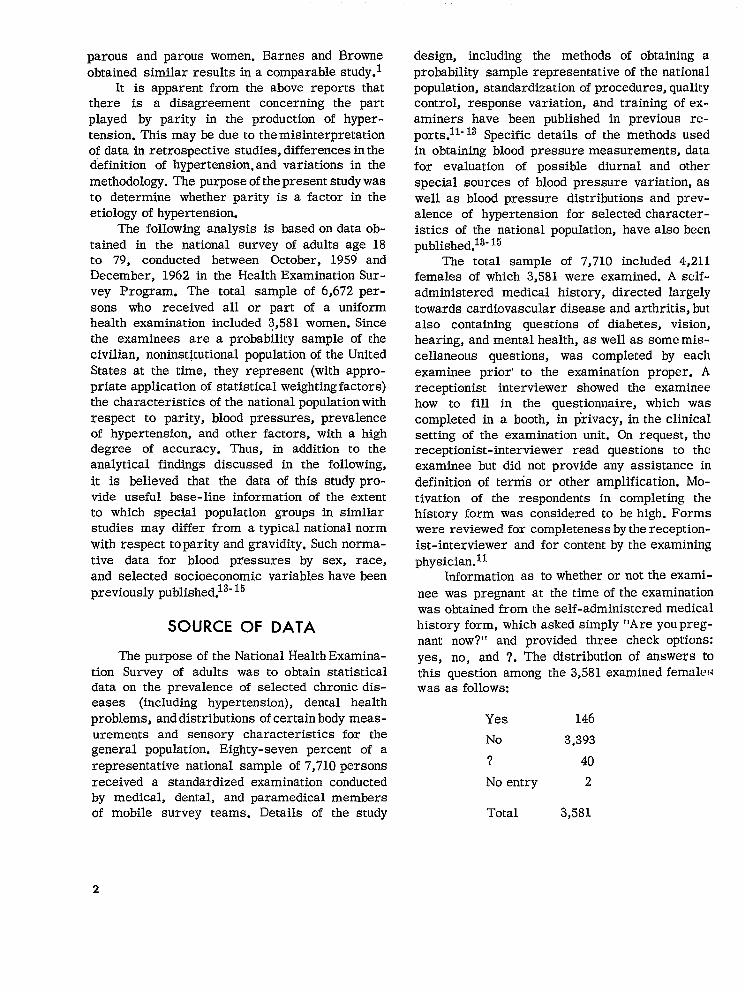
parous and parous women. Barnes and Browneobtained similar results in a comparable study.l
It is apparent from the above reports thatthere is a disagreement concerning the partplayed by parity in the production of hyper-tension. This may be due to the misinterpretationof data in retrospective studies, differences in thedefinition of hypertension, and variations in themethodology. The purpose of the present study wasto determine whether parity is a factor in theetiology of hypertension.
The following analysis is based on data ob-tained in the national survey of adults age 18to 79, conducted between October, 1959 andDecember, 1962 in the Health Examination Sur-vey Program. The total sample of 6,672 per-sons who received all or part of a uniformhealth examination included 3,581 women. Sincethe examinees are a probability sample of thecivilian, noninstitutional population of the UnitedStates at the time, they represent (with appro-priate application of statistical weighting factors)the characteristics of the national population withrespect to parity, blood pressures, prevalenceof hypertension, and other factors, with a highdegree of accuracy. Thus, in addition to theanalytical findings discussed in the following,it is believed that the data of this study pro-vide useful base-line information of the extentto which special population groups in similarstudies may differ from a typical national normwith respect to parity and gravidity. Such norma-tive data for blood pressures by sex, race,and selected socioeconomic variables have beenpreviously published.13- 15
SOURCE OF DATA
The purpose of the National Health Examina-tion Survey of adults was to obtain statisticaldata on the prevalence of selected chronic dis-eases (including hypertension), dental healthproblems, and distributions of certain body meas-urements and sensory characteristics for thegeneral population. Eighty-seven percent of arepresentative national sample of 7,710 personsreceived a standardized examination conductedby medical, dental, and paramedical membersof mobile survey teams. Details of the study
design, including the methods of obtaining aprobability sample representative of the nationalpopulation, standardization of procedures, qualitycontrol, response variation, and training of ex-aminers have been published in previous re-ports.l~- 13 Specific details of the methods usedin obtaining blood pressure measurements, datafor evaluation of possible diurnal and otherspecial sources of blood pressure variation, aswell as blood pressure distributions and prev-alence of hypertension for selected character-istics of the national population, have also beenpublished.13- 15
The total sample of 7,710 included 4,211females of which 3,581 were examined. A self-administered medical history, directed largelytowards cardiovascular disease and arthritis, butalso containing questions of diabqes, vision,hearing, and mental health, as well as some mis-cellaneous questions, was completed by eachexaminee prior’ to the examination proper. Areceptionist interviewer showed the examineehow to fill in the questionnaire, which wascompleted in a booth, in p’rivacy, in the clinicalsetting of the examination unit. On request, thereceptionist-interviewer read questions to theexaminee but did not provide any assistance indefinition of terms or other amplification. Mo-tivation of the respondents in completing thehistory form was considered to be high. Formswere reviewed for completeness by the reception-ist -interviewer and for content by the examiningphysician.ll
[formation as to whether or not the exami-nee was pregnant at the time of the examinationwas obtained from the self-administered medicalhistory form, which asked simply “Are you preg-nant now?” and provided three check opt ions:yes, no, and ?. The distribution of answers tothis quest ion among the 3,581 examined femaleswas as follows:
Yes 146
No 3,393
? 40
No entry 2
Total 3,581
2

For this study, the 146 cases with positive re-sponse were ~xcluded from the investigation. aThe study population, therefore, is representedby 3,435 examined women who did not respondaffirmatively to the question “Are you pregnantnow?” on the self-administered medical historyform.
The techniques employed in measurement ofblood pressures for these sample people are fullydescribed in references 13 and 14. The followingsummary of essentials is taken from the formerpublication.
“The blood pressure of each examinee wasmeasured three times during the course ofthe physical examination. The first meas-urement was taken just after the physi-cian met the examinee. The second wastaken midway in the examination, afterauscultation of the heart in the sittingposition and before the arthritis exami-nation. The examinee had just had anelectrocardiogram taken by the nurse andhad been allowed a few moments aftersitting up for the effects of postural hypo-tension to disappear. The third measure-ment was taken at the end of the physicalexamination.
A venipuncture was usually made dur-ing the physical examination, althoughthe specific point at which it was takenvaried from one examinee to another.
Blood pressure measurements were takenon the left arm with the examinee sittingon the examining table. The nurse placedthe middle cuff over the bulge in theupper left arm. The cuff was left on thearm between the first and second meas-urements, was removed after the sec-
%hc 42 questionnaires representing women for whom
a definitive response was not recorded to the “pregnant
now” question, were evaluated on a case-by-case basis by
cx~mination of data for related variables (age, blood pressure
readings, menopausal history, and hypertension diagnosis). The
majority were believed to be almost certainly not pregnant at
the time of examination and, in any case, the relatively small
(statistical) weight of any who might have been, would have no
discernible effect on the results obtained.
end, and returned for the third. b The .physician held the arm at the level ofthe atrium, with the nurse raising theBaumanometer to the physician’s eyelevel. Using the bell of his stethoscope,the physician noted the pressure whenthe sound was first heard, when it firstbecame muffled, and when it disappeared,recording all three measurements . . . tothe nearest even tenth in mm. Hg. . . . .“
The systolic blood pressure for this studyis the arithmetic mean of the three systolicmeasurements taken at the beginning, middle,and end of the physician’s examination. Thediastolic da~a are corresponding means recordedfor disappearance of the Korotkoff sounds or,if the sounds did not disappear, the point ofmuffling was substituted.
The basic reference blood pressure distri-butions for the defined study population areshown in table A; exclusion of the pregnant ex-arninees resulted in a reference distribution forthe study population of slightly higher mean bloodpressures than for the general U.S. population.’
The diagnosis of hypertension was based onmean blood pressure measurements. The criteriaused were as follows:
No~motension. —Both below 140 mm. Hg. systolic
and below 90 mm. Hg. diastolic
Definite lzy#evtension.-Either (1) 160 mm. Hg.or over systolic, or (2)95 mm. Hg. or over dia-stolic
Bovdwline hypertension.— Below 160 mm. Hg.systolic and below 95mm. Hg. diastolic, butnot simultaneously be-low both 140 mm. Hg.systolic and 90 mm.Hg. diastolic
bA” 12 ~m. cuff w= used.
cAhhough tangential with respect to the main study, it is
interesting to note that the differences were statistically
significant in four out of six cases, the standard normal deviates
of the differences between pregnant and nonpregnant means
for the first three age gToups being, respectively:
Systolic — 2.33, .38, 1.16 and Diastolic-4.51, 5.02, and3.29.
3

Table A. Mean systolic and diastolic blood pressures in mm. Hg. and standard errors,by age, study population, and comparisons
IFemale
“4=5=Age
EIr-Systolic pressure
in mm. Hg.
Number]f cases
Ages 18-79 years-
Systolic pressure inmm. Hg.
.86,
1.121.734.19.............
. . . 130.6 .64 L1l.O
L.09.2L1l.4L17.9............
. . .
121.7124.7128.6133.8140.3148.0154.3
18-2425-3435-4445-5455-64;5-;;
111.8 112.2115.6 115.9
.63
.68years ----------years ----------years ----------years ----------years ----------years ----------years ----------
122.8133.8146.6160.2156.6
122.9;::.:
160:2156.6
.921.431.751.972.59
Diastolic pressurein mm. Hg.I Diastolic pressure in mm. Hg.
. . . 78.6 .42 65.5 .72Ages 18-79 years- . . .
71.676.480.783.283.181.079.4
18-2425-3435-44:;-;:
6517475-79
69.472.978.082.084.983.779.3
70.273.378.282.084.983.779.3
.48
.48
.70
.69
.86
.751.65
64.067.066.7
. . .
. . .
. . .
. . .
1.291.153.43
. . .
. . .
. . .
. . .
years ----------years ----------years ----------years ----------years ----------years ----------years ----------
SE = Standard error.
bnly the diastolic mean was used (with thecut-off points specified above) in cases for whichaortic insufficiency was determinedto be pres-ent, or the pulse rate wasunder 60.18
The data on prevalence of hypertension intables B, 8, and 9 of this report refer todefi-nite hypertension plus borderline hypertension.This was done largely for analytical conveniencesince the estimated prevalence rates based onalarger number of cases in the numerator arerelatively more stable than those based onlyondefinite hypertension. Even with the use of this
definition, estimation of prevalenceisgenerally ofa lesser order of precision than that for meanblood pressures as indicated in the followingcomparison of mean systolic with the referencedistribution of prevalence rates.
The inclusion of persons classified asbor-derline hypertensive in the numerators of theprevalence rates, as well as the particular cri-teria used in defining hypertension, are consid-ered to be appropriate for purposes of relatinghypertension to parity state, although differentprevalence levels. would have been obtained for
4
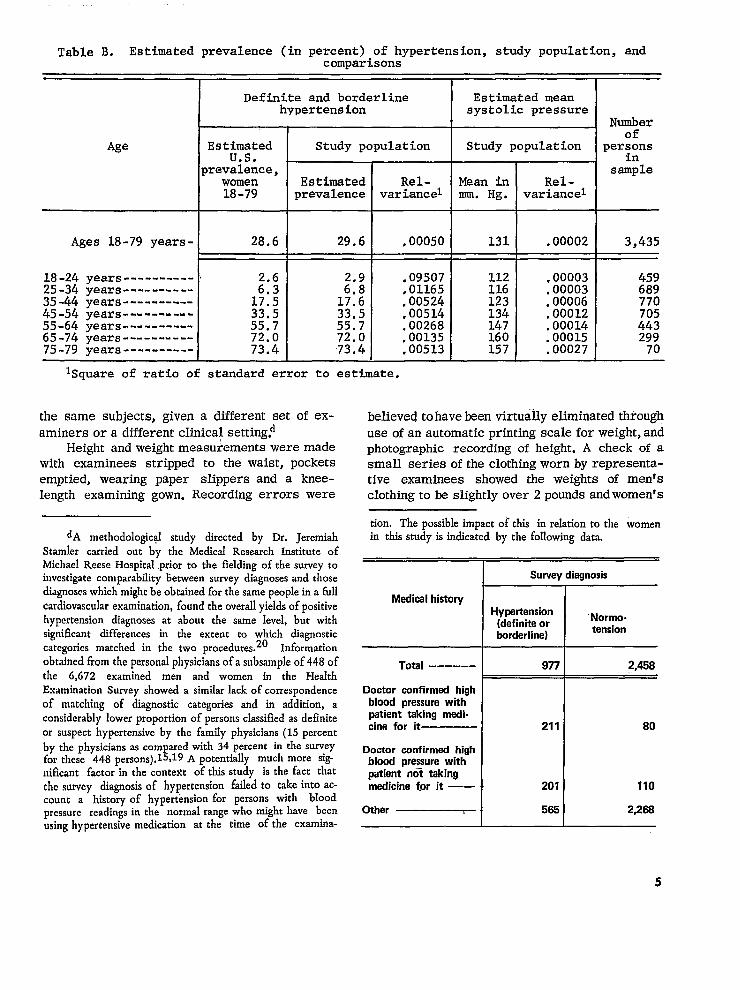
Table B. Estimated prevalence (in percent) of hypertension, study population, and
Age
Ages 18-79 years-
18-2425-3435-44;; -::
65:7475-79
years ----------years ----------years ----------years ----------years ----------years ----------years ----------
comparisons
Definite and borderlinehypertension
EstimatedUs.
prevalence,women18-79
28.6
17:533.555’772.073.4
Study population
Estimatedprevalence
29.6
R17.633.555.772,073.4
Rel-variancel
,00050
,09507,01165,00524,00514,00268,00135.00513
Estimated meansystolic pressure
Study population
Mean inmm. Hg.
131
112116123134147160157
Rel-variancel
.00002
.00003
.00003
.00006
.00012
.00014
.00015
.00027
Numberof
personsin
sample
3,435
459689770705;;;
70
lSquare of ratio of standard error to estimate.
believed tohavebsen virtua~y eliminated throughuse ofan automatic printing scale forweight,andphotographic recording of height. A check of asmall series of the clothing worn by representa-tive examinees showed the weights of men’sclothing tobe slightly over 2pounds andwomen’s
the same subjects, given a different set of ex-aminers or a different clinical setting!
Height and weight measurements were madewith examinees stripped to the waist, pocketsemptied, wearing paper slippers and a knee-length examining gown. Recording errors were
‘A methodologicalstudy directed by Dr. JeremiahStamkr carried out by the Me&cd Research Institute ofMichael Reese Hospital prior to the fielding of the survey toinvestigate comparability between survey dkgnoses and thosediagnoses which might be obtained for the same people in a MIcardiovascular examination, found the overall yields of positivehypertension diagnoses at about the same level, but withsignificant differences in the extent to which diagnosticcategories matched in the two procedures. 20 Informationobtained from the personal physicians of a subsample of 448 ofthe 6,672 examined men and women in the HealthExamination Survey showed asimilar lack ofcorrespondenceof matching of diagnostic categories and in addition, aconsiderably lower proportion of persons classified as definiteor suspect hypertensive by the family physicians (15 percent
by the physicians as compared with 34 percent in the surveyfor these 448 persons),l%lg A potentially much more sig-nificant factor in the context of this study is the fact thatthe survey diagnosis of hypertension failed to take into ac-count a history of hypertension for persons with bloodpressure readings in the normal range who might have beenusing hypertensive medication at the time of the examinat-
ion. The possibleimpactof this in relation to the womenin this study is indicated by the following data.
I Survey diagnosis
Msdiaelhistorv I I.Hypertension
(definiteor“Normo-
borderline)tension
Totel ------ 977 2,458,
Doctor eonfirmad highblood pressure withpatient taking medi-cine for it—--——-- 211 80
Doctor confirmed highblood pressure withpatient n~t takingmedicine for it —-— I 201 110
Other ———––T- 1 585 2288
5
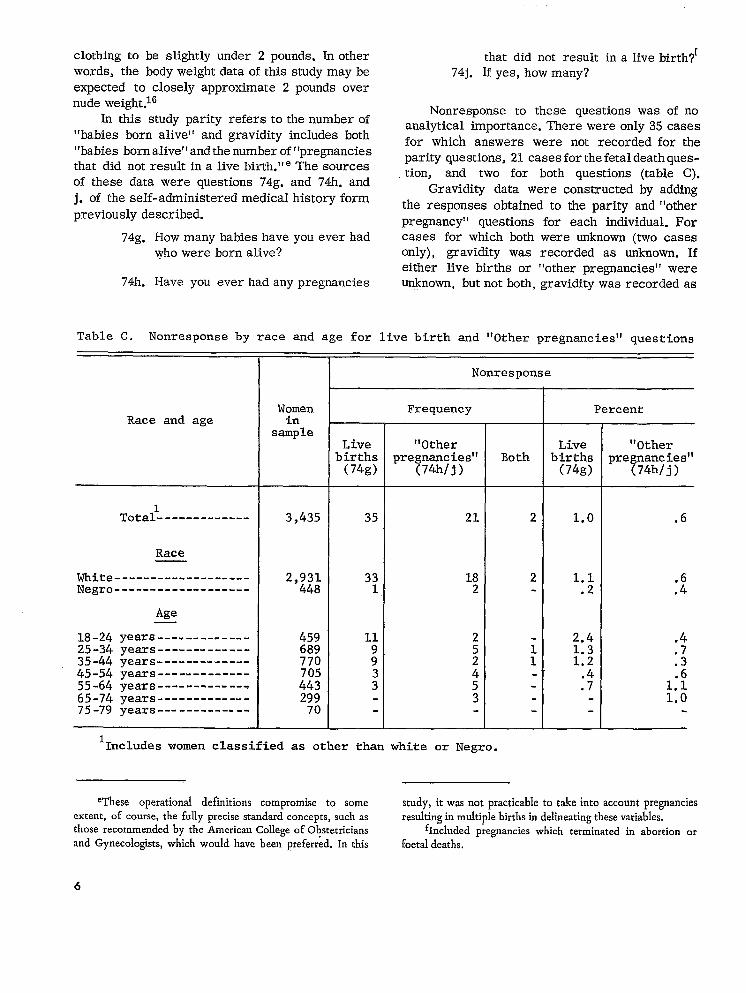
clothing to be slightly under 2 pounds. In otherwords, the body weight data of this study may beexpected to closely approximate 2 pounds overnude weight.~d
In this study parity refers tothe number of“babies born alive” and gravidity incIudes both“babies bornalive’’ andthenumber of f’pregnanciesthat did not result ina live birth.”e The sourcesof these data were questions 74g. and 74h. andj. of theself-administered medical history formpreviously described.
74g. Howmany babies have you ever hadwho were born alive?
74h. Have you ever had any pregnancies
that did not result74j. If yes, how many?
in a live birth?f
Nonresponse to these questions was of noanalytical importance, There were only 35 casesfor which answers were not recorded for theparity questions, 21 cases for the fetal death ques-tion, and two for both questions (table C).
Gravidity data were constructed by addingthe responses obtained to the parity and “otherpregnancy” questions for each individual. Forcases for which both were unknown (two casesonly), gravidity was recorded as unknown. Ifeither live births or “other pregnancies” wereunknown, but not both, gravidity was recorded as
Table C. Nonresponse by race and age for live birth and “other pregnancies” questions
Race and age
Totall -------------
Race
white -------------------Negro -------------------
18-2425-3435-44;; -::
65:7475-79
Age
years -------------years -------------years -------------years -------------years -------------years -------------years -------------
Womenin
sample
3,435
2, ;;;
459689770705443299
70
Nonresponse
Livebirths
(74g)
Frequency
“Otherpregnancies”
(74h/j)
21
182
Both
2
2
i1
Percent
Livebirths
(74g)
“Otherpregnancies”
(74h/j)
.6
.4
.7
.3
1:!1.0
1Includes women classified as other than white or Negro.
eThese operational definitions compromise to some study, it was not practicable to take into account pregnanciesextent, of course, the fully precise standard concepts, such as
.-resul’ting in multiple births in delineating these variables.
those recommended by the American College of Obstetricians fIncluded piew~cies which terminated in abortion or
and Gynecologists, which would have been preferr~d. k this foetal deaths.
6

equal to the entry for the question for which infor-mation was available. g
ANALYTICAL METHODS
Complete detail on numbers of sample womenavailable for analysis for specific age-race cross-classifications is shown in tables 2 and 3. Rea-sonably stable mean blood pressure estimateswere obtained for specific parity classes for allage groups among the “all races” and whitepopulations. With the much smaller number ofNegroes in the sample (448), estimates for thisgroup are naturally subject to much greatersampling variability and only means in the agerange 18-54 were considered appropriate foranalysis for this group.
As previously noted, trends of hypertensionrates with increasing parity and gravidity haveconsiderably higher relative sampling errorsthan the corresponding distributions for means.While the sample size is sufficient for the anal-ysis in general, data for certain cells in tables8 and 9 have been presented as of interest in
~Comparison of the parity distribution resulting from theHealth Examination Survey data with that of the 1960 Censusis of some interest although, in addition to the different
reference point in time (the mid- point of HES data collectionwas ~ctober, 1961), there are several other differences in thetwo populations (see reference 26, table 190).
1960 Census IStudy population
Parity (ages 18(weighted to rep
and over)resent U.S. totals
agts 18.79)
1----------2----------
---------57L-------7 or greetsm---
Pereent
16.618.824.116.69.68.55.8
22.516.621.015.79.88.16.4
The Bureau of the Census data include Alaska, Hawaii, andthe institutional population whale the HES figures excludethese. Also, the HES statistics include “never married’”women while the Census distribution excludes these.
the context of study as a possible trend, but areunderlined to call attention to their larger sam-pling variability.
In this report, a measure or characteristicfor an examinee is weighted by the reciprocalof the- probability of her selection in the sample(adjusted by a nonresponse factor), and the per-cents or means are calculated on the basis ofthese weighted estimates. The data thus relateto the United States population with the specifiedcharacteristics. A standard error, reflecting thevariability due to sampling, is shown for mostestimates.h
In order to evaluate the effect of increasedparity on blood pressure levels and hypertensionrates, the most direct method, that of studyingchanges in these measures with different paritylevels for specific age groups, is the first ap-proach used in this analysis. In addition, adjust-ment is frequently made to approximately equal-ize the effect of age for the various parityclasses by calculation of an age-adjusted rate foreach of them.i Finally, the individual and jointeffects of, not only age and parity but also bodyweight, on mean blood pressure has been eval-uated by standard multiple correlation techniquesusing appropriate independent estimates of thesampling errors of the correlation and regressionstatistics to reflect the complex statistical de-
hBecause of the complex sample design used for thesurvey (to maximise precision at miniium cost), standarderrors have been calculated by a pseudoreplication techniquerather than by using -algebraic relationships between theparameters and the sample size. For details see the appendixand references 21, 22, and 23.
iThe age-adjusted mean or rate simply shows the valuethat would be expected for the statistic if the age-specificvalues of the statistics for all parity @oups pooled applied tothe population for each age group in a specific parity class.Specifically, if there are N, persons in the i“th age group ofwomen with parity 3, the age-adjusted mean systolic pressure
for women of parity 3 is ~ ~ NI X1 where theXi are the mean
systolic blood pressures of women in the i’thage group. (The
N, are, of course, estimated total persons in the United Statesrather than sample persons).
In order to distinguish this figure from the morecommonly calculated “age-adjusted” statistic (which would be
obtained by the inverse procedure of applying the age-specific
rates or means for a particular group to the age-specific
population of all groups), it is sometimes referred to as an“inverse age-adjusted rate” or “expected value. ”
7

160 -
150 -
14Q – Systolic
!30 -*z
E 120 -E~~ 110 -a
i?
g 100 -
:I_AzLd,,,,,,,,,,,,,1 $1111111111,,,,,
16-24 25-34 35-44 45-54 55-64 65-74 75-79
years years years yeors years years years
AGE GROUPS
Figure 1. Mean systolic and diastolic blood pressuresby age, study population.
1160
[J-
—
I 50
140 Systolic
130$
iE
I 20 -
g
w 110 -~g
; 100 -
j90 -
,,,,,,9199-’
D[os!olic,,,,,,
80 - ,,,,,,,1,,,,,,, t,tmm.’””
,,,,,,,,,nslss~’’’’n~ la,,,,,,,ll
70 I I I I I I I I I
01234567 89+
PARITY
sign of the survey to permit imputationfindings to the United States population.]
of the
FINDINGS
Data showing the statistical relationshipsbetween age, parity? and gravidity cm the onehand and blood pressures on the other are pre-sented in tables 4-7 and figures 1-3.
Diastolic blood pressure increases, consist-ently with increasing age through age group 55-64, and then declines for both white and Negrowomen. Systolic blood pressure increases withage at a greater rate over all age groups (withthe exception of the last group—75-79 years-which is easily explainable by sampling vari-ability among women of both races.
Women of parity 5 or more have highersystolic and diastolic blood pressures. Following
jFor details of the adaptations to classical theory see the
wwendixo
160
150
MO
1~-’
Systolic
130=D
hj 120-
Z-g 11o-3In~
ff 100-
:
~ 90- ,,8*,,,,,$,,,,,.
,,,,,,
60Oiastolic
,,,,,,,,,,,88s* s~*e8,*s,,,L,,,,,,,,,,,,,,,,,, asss*t*s*n88**9 sl$a** '`S***`
7ol~,
GRAVIOITY
Figure 2. Meen systol ic and diastol ic blood pressuresby parity, study population.
Figure 3. km systolic and diastolic blood pressuresby gravidity, study population.

parity 3, a consistent increase for diastolic pres-sure occurs at each succeeding parity level witha similar trend evidenced for systolic blood pres-sure. At lower parities, mean systolic pressuresfor Negro women are higher than those for whitewomen, this is somewhat less true at parities4 and over, although the trend of increased sys-tolic pressure with increasing parity holds forboth groups. Mean diastolic blood pressures forNegro women are higher for all parity groups(the one point difference at parity 5 is of nostatistical or practical significance) and paral-leling the trend for systolic, the differences tendto be greater at parities of less than 4.
The distributions of mean systolic and dia-stolic blood pressures by gravidity begin to differfrom the corresponding distributions by paritybeginning at parity and gravidity 3 or 4, afterwhich the gravidity means tend to be lower thanthe corresponding parity means. Women of gravi-dity 6 and over have on the average higher sys-tolic and diastolic blood pressures than womenwith fewer past pregnancies. Mean diastolicblood pressure increases consistently from gra-vidity 4 and mean systolic pressure, from gravid-ity 5. Distributions of mean blood pressurelevels, specific for each age group, by parity andgravidity are shown in tables 4-7.
For females of all races under age 55, thedistributions of systolic blood pressure by parityseem clearly consistent with the hypothesis of noincrease in blood pressure with increasing parity.For ages 55-74 the distributions of means maybesuggestive of an increase in averages ystolic pres-sure after parity 2, but when the sampling vari-ability of the estimates is considered, this can-not be .conclusjvely demonstrated. In examiningthe systolic and diastolic distributions by gravid-it y, gravidit y 11 and over means may be dis-counted as being based on too few cases to bemeaningful. If this is done the pattern of meansystolic pressures by gravidity is essentiallythe same as that by parity.
For the distribution of mean systolic pres-sures by parity, the tests of significance indicatethat the mean for women of parity 6 and over issignificantly higher than the means for otherwomen on an age-adjusted basis. This is nothowever considered as being of much, if any,practical significance since (1) the age adjust-
ment inherent in the significance test is not fullysensitive when applied to a pooled group such asparity 6 and over; (2) none of these parity groupsconsidered individually (6, 7, 8, and 9 and over)are significant; and (3) the standard normal de-viate is 2.02 (2.13 for white women) which mightreasonably be expected to occur among such avery large number of significance tests.
Distributions of systolic pressures by gravid-ity indicate no appreciable change in the patterndescribed above. The suggestion of statisticallysignificantly higher systolic pressure among theparity 6 and over group is reinforced by thepattern of the signs of the differences (l-5, - --- -;6-11, ++++ ++), but the qualifications stated forthe parity distribution apply.
Diastolic blood pressure distributions seemconsistent with the hypothesis of no increase inaverage pressures with inceasing parity and gra-vidit y. The 55-64 age group, which might appearas a possible exception is also found to be consist-ent when sampling variability is considered. Theborderline significance of the higher mean dia-stolic pressure for the parity 3 group is not con-sidered to be of practical importance because astandard normal deviate of 2.08 is not unusualwhen a large number of significance tests is made.
Study of systolic and diastolic distributionsspecific by race, confirms the preceding impres-sions relating to all races pooled. The latter are,as expected, dominated by the statistical weightingof white women. The distributions for Negroes,of course, show much more variability because ofthe smaller numbers of cases on which they arebased. However, the parity and gravidity trendsseem to parallel those for white women quite well.
Estimated hypertension rates (definite plusborderline) by parity and gravidity are shown foreach age and race group in tables 8 and 9. Nosignificant differences in the age-adjusted ratesare observable, nor does examination of thechanges in mean blood pressures with increasingparity and gravidity suggest a conclusion re-gard’fig the possible relationships different thanthose previously reached in considering systolicand diastolic blood pressures.
It is instructive to further examine the re-lationships of these variables through study oftheir multiple correlation constants, which per-
9
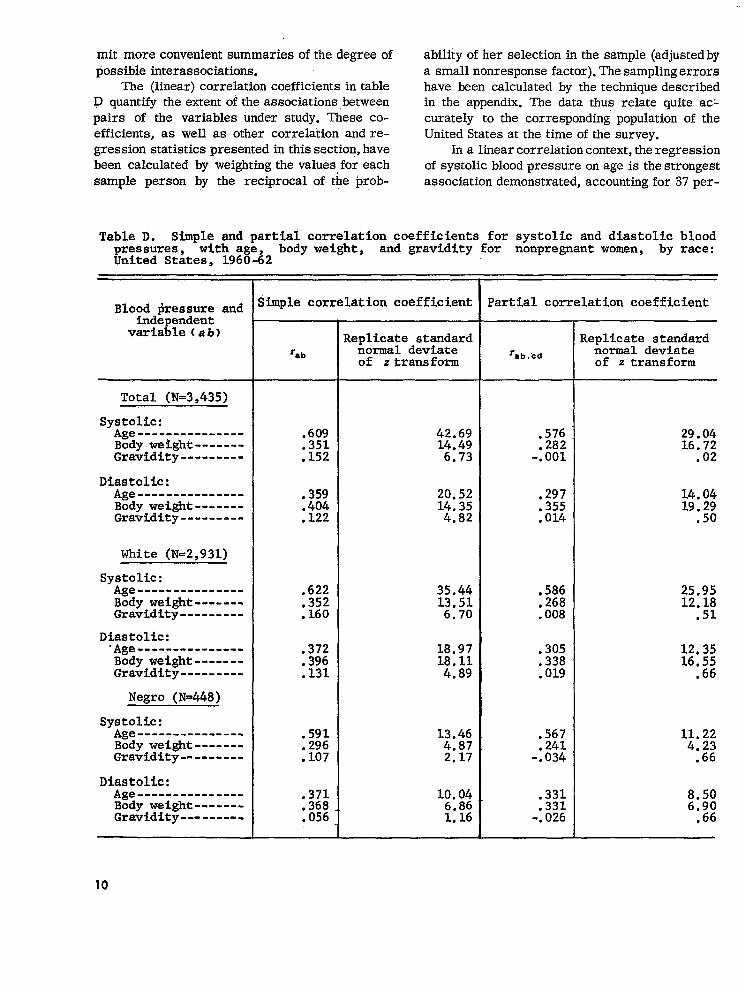
mit more convenient summaries of the degree ofpossible interassociations.
The (linear) correlation coefficients in tableD quantify the extent of the associations ,betweenpairs of the variables under study. These co-efficients, as well as other correlation and re-gression statistics presented in this section, havebeen calculated by weighting the values for eachsample person by the reciprocal of the prob-
ability of her selection in the sample (adjusted bya small nonresponse factor). The sampling errorshave been calculated by the technique describedin the appendix. The data thus relate quite ac~curately to the corresponding’ population of theUnited States at the time of the survey.
In a linear correlation context, the regressionof systolic blood pressure on age is the strongestassociation demonstrated, accounting for 37 per-
Table D. Simple and partial correlation coefficients for systolic and diastolic bloodpressures, w~th age, body weight, and gravidit y for nonpregnant women, by race:united States, 1960-62
Blood $ressure andindependent
variable (ah)
Total (N=3,435)
systolic:Age---------------Body we~ght -------Gravfdity ---------
Diastolic:Age---------------Body weight -------Gravidity ---------
White (N=2,931)
systolic:Age---------------Body weQht -------Gravf.dity ---------
Diastolic:“Age---------------Body wei.ght -------Gravidfty ---------
Negro (N=448)
Sy;:lic:-------- -------
Body wei.ght -------Gravidity ---------
Diastolic:Age---------------Body weight-------Gravidity---------
Simple correlationcoefficient
‘ab
.609
.351
.152
.359
.404
.122
.622
.352
.160
; ;;:
.131
.591
.296
.107
.371
.368
.056
Zeplicatestandardnormal deviateof z transform
42.6914.496.73
::. :;
4:82
35.4413,516.70
18.971:.;;.
13.464.872.17
1:. ())
1:16
Partial correlationcoefficient
‘ab .M
.576
.282-.001
.297
.355
.014
.586
.268
.008
.305
.338
.019
.567
.241-.034
.331
.331-.026
Replicate standardnormal deviateof z transform
29.0416.72.02
25.9512.18.51
12.3516,55.66
8.506.90
●66
10
cent of the observed variability while the corre-
sponding figure for gravidity is only 2 percent.The latter is, however, statistically significantand confirms the widely-held view that such anassociation bet ween gravidit y and systolic blood
k (The slight down-pressure is demonstrable.ward trend of the diastolic pressure curve amongthe older age groups as shown in table 5 is a some-what compromising factor causing the lower lineardiastolic coefficients. A data transformation orcurvilinear technique would have been a betterprocedure for the diastolic readings but was notdone in this analysis.)
The extent to which the positive associationbetween gravidity and blood pressure is notaccountable for by the relation of blood pressurewith age and body weight, is shown by the cor-
kst;ltiStiCill~i~ni~ic~nceof correlations in this report refersto I !l!)-wm.!lt confidence level using Fisher’s transformation
z = aktmh r. ‘TIIcstmdard error of z is estimated using the
‘u; ‘~ where R indicates a replicate estimaterelationship q=q
of variance as detailed in references 21-23,and refers to the
vmianw under simple random sampling assumptions. Thisnpproximatim has been found in empirical studies to bep,cncr:dly satisfactory to three significant figures for both
simple md porti;d correlations for this sample design.21
responding partial correlation coefficients in
table D. The modest but significant associationof gravidit y with systolic blood pressure (r=. 152),almost vanishes when the effects of age andbody weight which contributed to it are accountedfor—the correlation decreases to -.001 and isnot, of course, statistically significant. Table Dshows that these interrelationships are consistentfor both systolic and diastolic blood pressure.
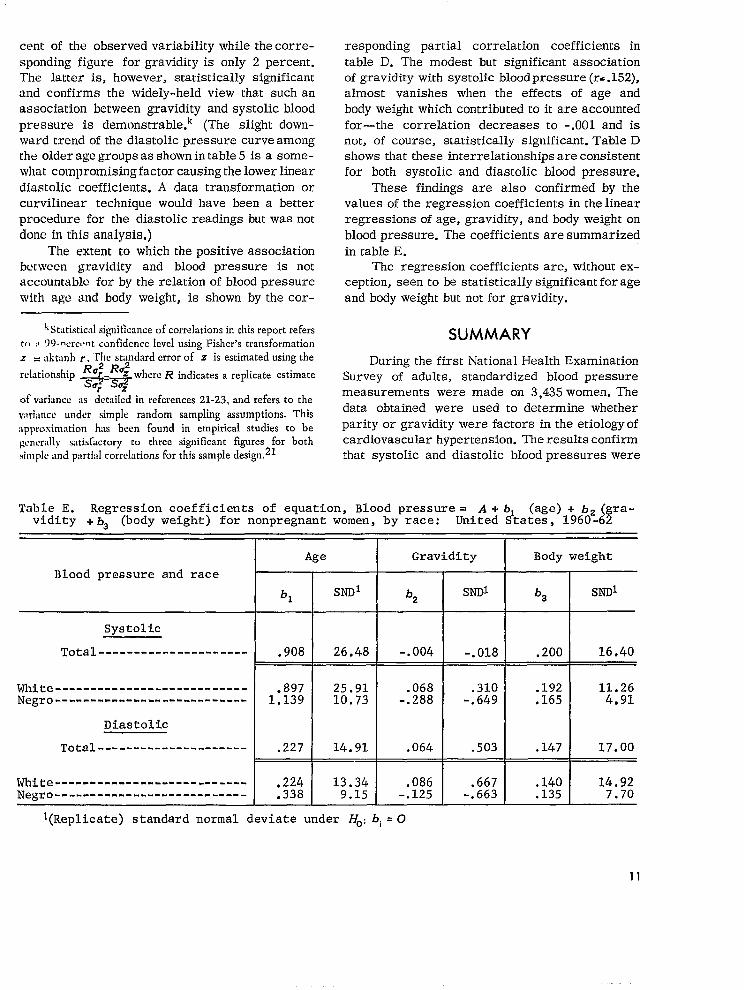
These findings are also confirmed by thevalues of the regression coefficients in the linearregressions of age, gravidity, and body weight on
blood pressure. The coefficients are summarizedin table E.
The regression coefficients are, without ex-ception, seen to be statistically significant forageand body weight but not for gravidity.
SUMMARY
During the first National Health ExaminationSurvey of adults, standardized blood pressuremeasurements were made on 3,435 women. Thedata obtained were used to determine whetherparity or gravidity were factors in the etiology ofcardiovascular hypertension. The results confirmthat systolic and diastolic blood pressures were
Table E. Regression coefficients of equation, Blood pressure = A + bl (age) + b2 (gra -vidity + ba (body weight) for nonpregnant women, by race: United States, 1960-62
Age Gravi.dity Body weight
Blood pressure and race
bl SNN b2 SNDI b3 sJ@
Systolic
Total --------------------- .908 26.48 -.004 -.018 .200 16.40
White -------- -------- -------- --- .897 25.91Negro
.068 .310 .192 11.26------------------------ --- 1.139 10.73 -.288 -.649 .165 4.91
Diastolic
Total --------------------- .227 14.91 .064 .503 .147 17.00
White -------- -------------------Negro
.224 13.34 .086 .667 .140 14.92----------------- -------- --- .338 9.15 -.125 -.663 .135 7.70
‘(Replicate) standard normal deviate under Ho: bi = O
11
proportional by age up to age 55, after whichaslight drop occurred in the case of diastolic.In comparable agegroups there was no evidenceto suggest that either parity or gravidity playeda part in the etiology of cardiovascular hyper-tension.
ACKNOWLEDGEMENTS
The authors gratefully acknowledge the kindassistance and encouragement received fromDr. John H. Smith, Professor of Statistics, TheAmerican University, Washington, who reviewed
the applicability of the correlation and regres-sion models; and to Mr. Walt R. Simmons, As-sistant Director for Research and Scientific De-velopment, National Center for Health Statistics,who provided leadership in the adaptation ofclassical correlation and regression theory topermit imputation of results to the National popu-lation using the half -sample replication techniquefor estimation of sampling variances. Any short-comings in the detail application of theory to thesedata are, of course, the sole responsibility of theauthors.
REFERENCES
Previous Parity-Hypertension Studies
lB~nes, J., and Browne, F.J.: Blood pressure and the
incidence of hypertension in nulhpatous and parous women in
relation to the remote prognosis of the toxaemias ofpregnancy. J.Obst.and Gynec. Brit.Emp. 52:1,1945.
2Browne, F.J,, and Dodds, G.H.: The remote prognosis of
the toxaemias of pregnancy. Obst.and Gynec. Btit,Emp.
46:443, 1939.
3Chesley, L.C.; Annitto, J.E.; and Cosgrove, R.A.:Prognostic significance of recurrent toxemia of pregnancy.Obst.and Gynec. 23:874, 1964.
4Dieckmann, W.J., Smitter, R.C,, and Rynkiewicg, L.:Preeclampsia—eclampsia does not cause permanent vascular
renal disease. Am,J.Obst.and Gynec. 64:850, 1952.
5Gibson, G. B.: Further observation on the prognosis in
toxaemia of late pregnancy. J.Obst.arrd Gynec.Brit.Emp.
63:833, 1956.6Greenhill>s Obstetrics, 13th edition. W.B.. Saunders
Company. Philadelphia and London, 1965.7Isenhour, EOC,E.; ‘KUder,K.; and Dill, L.V.: The effect o f
parity on the average blood pressure and on the incidence ofhypertension. Am.J.MedSci. 5:2,1942,
8Light, F.P.: A nine-yeas follow-up in cases of toxemia of
pregnancy. Am.J.Obst.and Gynec. 55:321, 1948.9Qu~~vm, W.L.G.: Maternal death rates and ~cidence of
abnormalkies in women of parity 6 or more. Obst.and Gynec.
23:451, 1964.
10Quinlivan, W.L,G.: Incidence of abnormalities inwomen of gravidity seven or more. Obst.and Gynec. 23:567,1964.
12
Health Examination Survey-Procedures and Data
I lNationd Center for Health Statistics: Plan and initial
program of thee Health Examination Survey. Vital and Heahh
Statistics. PHS Pub. No. 1000-Series 1-No. 4. Public HealthService. Washington. U.S. Government Printing Office, July1965.
12Nation~ Center for Health Statistics: Cycle I of the
Health Examination Survey, sample and response: UiritedStates, 1960-62. Vital and Health Statistics. PHS pub, No.1000-Series 1l-No. 1. Public Health Service. Washington. U.S.Government Printing Office, Apr. 1964.
13National Center for Health Statistics: Blood pressure of
adults by age and sex; United Statics, 1960-1962. Vital andHeakh Statistics PHS publication No. 1000-Series 1l-No. 4.
public Health Service. Washington. U.S. Government PrintingOffice, June 1964.
14National Center for Heakh Statistics: Blood pressure ofadults, by race and area: United States, 1960-62. Vital andHealth Statistics. PHS pub. No. 1000-Series 1l-No. 5. public
Health Service. Washington. U.S. Government Printing Office,
July 1964.15NationdCenter for Health Statistics: Hypertension and
hypertensive heart disease in adults: United States, 1960-62.Vital and Ifeakh Statistics. PHS Pub. No. 1000-Series 1l-No.13. Public Health Service. Washington, U.S. GovernmentPrinting Office, May 1966.
16Nationd Center for Health Statistics: Weight, height,
and selected body dimensions of adults: United States,
1960-62. Vital and Heahh Statistics, PHS pub. No. 1000-Series11-No. 8. public Health Service. Washington. U.S. GovernmentPrinting Office, June 1965.

17National Center for Health Statistics: Weight by height
and age of adults: United States, 1960-62. Vital and HealthSttstistics, PHS pub. No. 1000-Series 1 l-No. 14. Public Health
Service. Washington. U.S. Government Printing Office, May
1966,18Nation~ Center for He~th stati~tic~: He~t disease in
adults: United States, 1960-62. Vitul and Health Statistics. PHS
Pub. No, 1000-Series 1 l-No. 6. Public Health Service.
Washington. U.S. Government Printing Office, Dec. 1969.~9Nation~ Center for He~th statistics: Three views of
hypertension and heart disease. Vital and Health Statktics. PHS
Pub. No, 1000-Series 2-No. 22. Public Health Service.
Washington. U.S. Government Printing Office, Mar. 1967.20u.s,NationalHealth Survey: Evaluation of a single-visit
cardiovascular examination. Health Statistics. PHS Pub. No.
584-D7. public Health Service. Washington. U.S. Government
Printing Office, Dec. 1961.2 1.Simmons, W, R., and Baird, J.T., Jr.: psersdoreplication
in theNCHS Heaklt Examination Survey. Social Statistics
Section Proceedings of the American Statistical Association,
1968,22Nation~ Center for Health Statistics: Replication: an
approach to the analysis of data from complex surveys. Vitaland Health Statistics,. PHS Pub. No. 1000-Series 2-No. 14.
Public Health Service. Washington. U.S. Government Printing
Office, Apr. 1966.
23 Nation~ Center for Health Statistics: pseudoreplication:
further evaluation and application of the balanced half-sample
technique. Vital and Health Statistics. PHS pub. No.
1000-Series 2-No, 31. public Health Service. Washington. U.S.
Government Printing Office, Jan. 1969.
24 National Center for Health Statistics: Blood Pressure ~ it
relates to physique, blood glucose, and serum chol~sterol. Vitaland Health Statktics. PHS Pub. No. 10OO-Series 1 l-No. 34.
public Health Service. Washington. U.S. Government Printing
Office, Dec. 1969.
25 Nation~ Center for Health Statistics: Quality control in a
Nat ionrd Health Examination Survey. Vital and HealthStatistics. PHS Pub. No. 1000-Series 2-No. 44. Public Health
Service. Washington. U.S. Government Printing Office. In press.
Q&r
26 U.S. Bureau of the Census: U.S. Census of F’opdation,
1960, Detailed Characteristics, United States Summary. Final
Report PC(1)- ID. Washington. U.S. Government Printing
Office, 1963.
27 National Center for Health Statistics: Vital Statistics ofthe United State.r, 1964, VO1. I-Natality. Public Health
Service. Washington. U.S. Government Printing Office, 1965.28 Slone, W.C.; Florey, C. V.; Acheson, R.M.; and Kessner,
D.M.: Epidemiologic methods in the study of blood pressure in
relatives of toxemic primiparae. Am.]. Epidenriol. 91:6, 1970.29 Feinleib, M.; Halperin, M.; and Garrison, R.: Relationship
Between Blood Pressure and Age. Regression Analysis ofLongitudinal Data. Unpublished paper presented at the 97th
annual meeting of the American Public Health Association.
Philadelphia, Pennsylvania. Nov. 1969.
30 Kish, L.: Survey Sampling. New York. John Wiley and
Sons, 1965.
000
13
--- -..
LIST OF DETAILED TABLES
Page
Table 1.
2.
3.
4.
5.
6.
7.
8.
9.
Number of persons, mean blood pressures, mean body weight, and standard errorsfor adult women, by race and age: United States, 1960-62------------------------
Sample frequencies for study population by age, race, and parity----------------
Sample frequencies for study population by age, race, and gravidity-------------
Estimated mean systolic blood pressures and standard errors for women ages 18-79,by parity, race, and age: United States, 1960-62--------------------------------
Estimated mean diastolic blood pressures andstandard errors forwomen ages 18-79,by parity, race, and age: United States, 1960-62--------------------------------
Estimated mean systolic blood pressures and standard errors forwomen ages 18-79,by gravidity, race, and age: United States, 1960-62-----------------------------
Estimated mean diastolic blood pressures and standard errors forwomen ages 18-79,by gravidity, race, and age: United States, 1960-62-----------------------------
Estimated hypertension rates (per 100 women) and standard errors for women ages18-79, by parity, race, and age: United States, 1960-62--- ----------------- -----
Estimated hypertension rates (per 100 women) and standard errors for women ages18-79, by gravidity, race, and age: United States, 1960-62----------------------
15
16
18
20
21
22
23
24
25
14

Table 1. Number of persons,mean blood pressures,mean body weight,and standard errors for adultwomen, by race and age: United States, 1960-62
Study population 2
Body weightin pounds
Us.population
in
Blood pressure in mm. Hg.Race and age Estimated
Us. popwlation inthousands
Numberof
examineesthousands Systolic Diastolic
Mean Mean SE MeanSE SE
Tota13,
Ages 18-79 years- 58,343
8,430
11,291
12,325
10,542
8,120
6,192
1,443
3,435 56,155
7,317
10,450
12,092
10,542
8,120
6,191
1,443
49,330
6,229
8,994
10,532
9,286
7,333
5,685
1,271
5,966
142 .5
1.2
1.3
1.4
1.5
2.0
1.6
4.0
.5
. . .
112
116
123
134
147
160
157
.0.
112
116
122
132
146
159
156
...
. . .
,6
.7
.9
1.4
1.8
2.0
2.6
● ..
. . .
70
73
78
82
85
84
79
..*
70
73
77
81
84
83
79
...
. . .
.5
.5
.7-
.7
.9
.8
1.6
...
18-24 years----------
25-34 years----------
35-44 years----------
45-54 yeara----------
55-64 yeara----------
65-74 years----------
75-79 years----------
459
689
770
705
443
299
70
2,931
374
579
659
601
392
267
59
448
127
135
143
147
152
146
138
141
White
Ages 18-79 years- 51,184
7,230
9,656
10,723
9,286
7,333
5,685
1,271
18-24 years---------- .8
.7
.7
1.4
1.8
2.0
3.2
...
.6
.5
.6
.8
●9
.7
1.6
..0
1.4
1.4
1.4
1.7
126
134
141
146
150
146
141
152
133
146
158
160
1.1
1.2
1.2
1.5
2.3
1.8
3.0
2.6
25-34 yeara----------
35-44 years--------L-
45-54 years----------
55-64 years----------
65-74 years----------
75-79 yeara----------
Nemo
Ages 18-79 years- 6,219
18-24 years----------
25-34 yeara----------
35-44 yeara----------
45-54 years----------
966
1,370
1,391
1,162
868
1,241
1,363
1,162
70
95
99
98
115
120
132
148
1.5
2.0
2.9
4.4
72
78
86
90
4.5
3.9
5.6
3.8
lCivili.an, noninstitutional population of United States estimated at midpoint of data col-lection period—October 1, 1961.
5Civilian, noninstitutional population excluding women stating that they were pregnant atthe time of the health examination.
~1.ncludeswomen classified as other than white or Negro.
15
--

Table 2: Sample frequencies for study population by age, race, and parity
Race and age
18-24
25-34
35-44
45-54
55-64
65-74
75-79
18-24
25-34
35-44
45-54
55-64
65-74
75-79
18-24
25-34
35-44
45-54
Total 1
Ages 18-79 years-----------------------
years----------------------------------
years----------------------------------
years----------------------------------
years----------------------------------
years----------------------------------
years----------------------------------
years----------------------------------
White
Ages 18-79 years-----------------------
yeara----------------------------------
years----------------------------------
years----------------------------------
years----------------------------------
yeara----------------------------------
yeara----------------------------------
years----------------------------------
Negro
Ages 18-79 years-----------------------
years----------------------------------
years----------------------------------
years----------------------------------
years----------------------------------
Allexaminees
3,435
459
689
77C
705
443
299
70
2,931
374
579
659
601
392
267
59
448
70
95
99
98
Nulli-parous
734
230
110
105
123
100
52
14
615
199
88
79
97
90
48
14
107
25
19
25
25
Totalparous
2,666
218
570
656
579
340
247
56
2,283
166
482
571
501
299
219
45
340
44
76
74
73
Parity
1
540
97
95
84
122
88
45
9
445
74
84
65
102
74
41
5
88
19
10
17
20
2
718
69
159
198
146
82
48
16
655
56
142
185
133
79
45
15
56
1013
.13
13
lIncludes 56 examinees classified as other than white Or Negro. This group consists almostentirely of Orientala and American Indians.
16

Table 2. Sample frequencies for study population by age, race, and parity—Con.
Pari~y—Cent inued
3 4 5
172
6 7 8 9 or more 4-5 6 or more Unknown
535 75 118345 112 51 517 356 35
32
142
153
L16
56
29
7
492
13
92
94
71
34
34
7
301
7
43
44
36
20
20
2
140
023
30
26
14
17
2
88
09
17
20
11
17
1
54
03
11
9
8
18
2
39
04
25
33
27
19
10
69
20
135
138
107
54
54
9
441
12
106
120
95
48
51
9
69
039
83
88
60
71
15
250
0
23
58
60
44
55
10
91
11
9
9
3
3
0
0
33
24
127
143
111
54
27
6
36
8
75
82
65
31
33
7
41
4
31
38
30
17
18
2
28
014
24
22
11
15
2
23
05
10
18
7
13
1
17
01
104
7
16
1
9
03
14
16
19
11
6
42
9
9
9
3
3
0
0
1
7
10
10
4
5
17
10
5
3
11
4
6
08
6
4
04
5
1
02
0
5
01
9
15
8
28
14
11
015
20
25
1
000
l~nc~ude~ 56 examinees classified as other than white or Negro. This group consists slmostentirely of Orientals and American Indians.
17
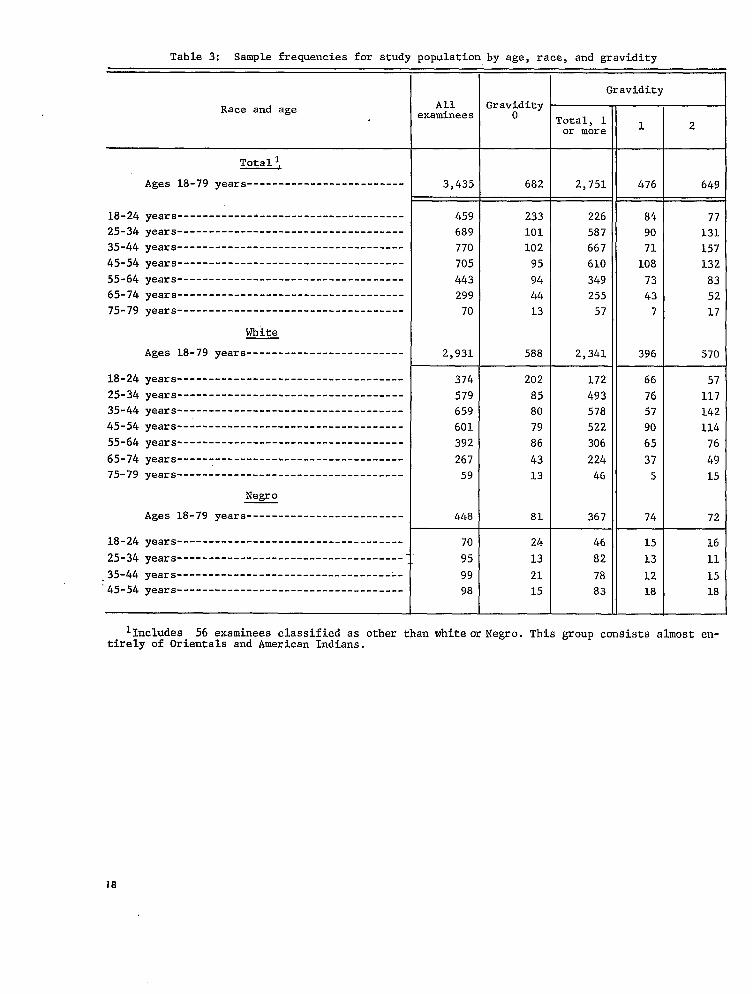
Table 3: Sample frequencies for study populatio
Race and age
18-24
25-34
35-44
45-54
55-64
65-74
75-79
18-24
25-34
35-44
45-54
55-64
65-74
75-79
18-24
25-34
35-44
:45-54
Total 1
Ages 18-79 years-------------------------
years------------------------------------
years------------------------------------
years------------------------------------
yeara------------------------------------
years------------------------------------
years------------------------------------
years------------------------------------
White
Ages 18-79 years-------------------------
yeara------------------------------------
yeara------------------------------------
years------------------------------------
yeara------------------------------------
yeara------------------------------------
years------------------------------------
yeara------------------------------------
Negro
Ages 18-79 years-------------------------
years------------------------------------
years------------------------------------
years------------------------------------
years------------------------------------
A11examineea
3>435
459
689
770
705
443
299
70
2,931
374
579
659
601
392
267
59
448
70
95
99
98
by age, race, and gravidity
Gravidityo
682
233
101
102
95
94
44
13
588
202
85
80
79
86
43
13
81
24
13
21
15
Gravidity
Cotal, 1or more
2,751
226
587
667
610
349
255
57
2,341
172
493
578
522
306
224
46
367
46
82
78
83
1
476
84
90
71
108
73
43
7
396
66
76
57
90
65
37
5
74
15
13
12
18
2
649
77
131
157
132
83
52
17
570
57
117
142
114
76
49
15
72
16
11
15
18
lIncludes 56 examineea classified as other than white or Negro. This group consists almost en-tirely of Orientals and American Indians.
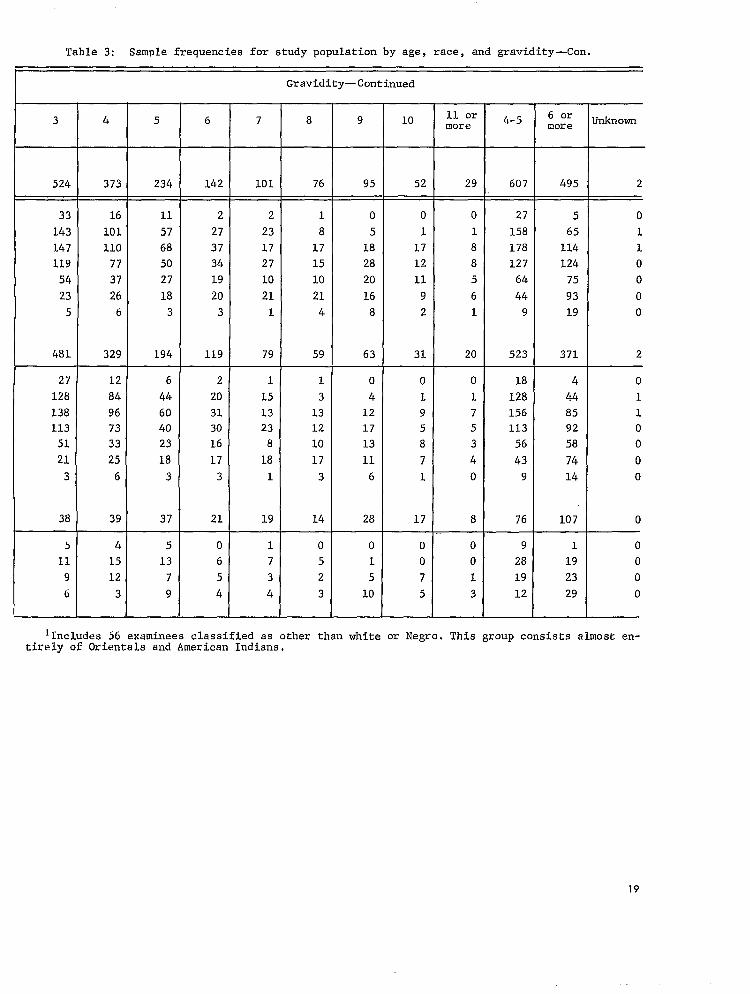
Table 3: Sample frequencies for study population by age, race, and gravidity-Con.
Gravidity—Continued
11 ormore
6 ormore3 lb 5 6 7 8 9 10 4-5 Jnknown
52524 373 234 142 101 76 95 29 607 495 2
0
1
1
0
0
0
0
2
33
143
147
119
54
23
5
481
16
101
110
77
37
26
6
329
11
57
68
50
27
18
3
194
2
27
37
34
19
20
3
119
2
23
17
27
10
21
1
79
1
8
17
15
10
21
4
59
05
18
28
20
16
8
63
01
17
12
11
9
2
31
01
8
8
5
6
1
20
27
158
178
127
64
44
9
523
5
65
114
124
75
93
19
371
27
128
138
113
51
21
3
38
5
11
9
6
12
84
96
73
33
25
6
39
6
44
60
40
23
18
3
37
2
20
31
30
16
17
3
21
1
15
13
23
8
18
1
19
1
7
3
4
1
3
13
12
10
17
3
14
0
5
2
3
04
12
17
13
11
6
28
0
1
5
10
01
9
5
8
7
1
17
0
0
7
5
01
7
5
3
4
0
8
18
128
156
113
56
43
9
76
9
28
19
12
4
44
85
92
58
74
14
107
1
19
23
29
01
1
0000
0
5
13
7
9
06
5
4
001
3
0000
4
15
12
3
llncludes 56 examinees classified as other than white or Negro. This group consists almost en-tirely of Orientals and American Indians,
19

Table 4. Estimated mesn systolic blood pressures and standard errors for womenl agea 18-79, by parity, race, andage: United States, 1960-62
Pari.ty
Total o 1 2 3 4 5 6 7 8 9 or 4-5 6 ormore more
Race and age
Tota 12
Ages 18-79 years------------
Mean systolic blood pressure in mm. Hg.
. . . 128
112 113:116 118123 125134 134147 146160 156157 156... 128... .19
... 128
112 113-115 117-122 122132 133146 144159 154156 156... 128... -.17
... 136
115 117120 123132 134148 138... 135... .41
4= 130
109116122135150153~
-.49
131
136
114115121139150172
M;
137
155
...
12;-142145172
14:1.04
157
144
...118125137157;;;
1392,02
144
...1181241371581651461392.13
146
131=
110114123&
161162131-.27
131
18-24 years-----------------------25-34 years-----------------------35-44 years-----------------------45-54 years-----------------------55-64 years-----------------------65-74 years-----------------------75-79 years-----------------------Expected value--------- ;----------Standard normal deviate -----------
White
Ages 18-79 years------------
18-24 years-----------------------25-34 years-----------------------35-44 years-----------------------45-54 years-----------------------55-64 years-----------------------65-74 years-----------------------75-79 yeara-----------------------Expected value--------------------Standard normal deviate3----------
Negro
Ages 18-79 yeara------------
18-24 yesra-----------------------25-34 years-----------------------35-44 years-----------------------45-54 yeara-----------------------Expected value---------; ----------Standard normal deviate ----------
Total 2
Ages 18-79 years------------
112 111114 117123 121136 129139 144157 160164 +130
-.71 -1.79
. . . 110* 116
136 122140 137159 150169 161139 156141 132
1.41 .50
I......120 11412-1 120129 140149 168160 160* *
135 139-.17 1.19
1281 127 1351 146*
T111 110113 117123 120132 129138 142156 159165129 12;-.94 -1.15
110114120130149161~131-.33
135
109115121135150152~
-.15
1271...110* 115
134 121145 136159 150171 160134 156140 132
1.83 .75
11:122138150170
13;1.03
133
. . . . . .121 116120 118123 138150 176156 160
13: 13;-.20 1.31
. . .
12;
14;176
14;1.10
1481431 134 1351 142 1531 130I
112120133147138‘.67
119 114120 123133 126179135 13:1.07 .14
12!130133130
-.91
11:14;135-.38
. . . . . .117125 13:
713: 147-.55 -.44
. . .*
. . .
14:-.03
8,2=
.,.*
1:::16.010.5
*
9.7
...
7.;
17.;10.9
*
12.6
. . .1171361441.47
-.37
2.0
..*3.21..4
::;3.87.7
2.4
Standard error of mean
1.1 1.41 1.5 1.01 1.2 3.4
5.92.3
:::5.46.2
3.8
2.:2.3
M7.2*
4.7
3.2
...4.52.23.67.77.6*
3.6
...6.3
;:!
8:1*
5.9
3.7=
...6.22.5
1$;
“*
5.2
...5.2
::;24.88.5*
10.4
4.71 1.3. . .
.6
.7
.9
i::2.02.6
...
1.0 1.91.2. .93.6 .8
i:: 2::5.0 6.75.0 4.1
2.0 2.31.4 1.5
1.12:;3.9 :::
3::: 4:::
. . . 2.0* 1.2
5.0 1.14.4 2.110.2 3.44.7 4.37.2 12.4
4.7 1.5
18-24 yeara-----------------------25-34 years-----------------------35-44 yeara-----------------------45-54 years-----------------------55-64 years-----------------------65-74 yeara-----------------------75-79 years-----------------------
.72.42.3
:::
.::2
1.3
White
Agee 18-79 years------------ 1.2 1.4 1.31 1.2
T1.3 1.81.3 .92.42.0 3:;
::: M1.2 5.0 T
... 2.1
5.; 1:;5.2 2.312.8 3.33.4 4.611.4 12.4
6.9 2.7
18-24 yeara-----------------------25-34 years-----------------------35-44 years-----------------------45-54 years-----------------------55-64 years-----------------------65-74 years-----------------------75-79 years-----------------------
.8
.7
.7
i::2.03.2
...
1.5
;::4.4
2.81.4 ::;
1.52:: 2.73.4
:::5;:; 41.4
Negro
Agea 18-79 years------------ 5.0] 7.4 5.01 3.6
18-24 years -----------------------25-34 years-----------------------35-44 years-----------------------45-54 yeara-----------------------
::: 4.;5.6 3.8* 14.1
4.:
9.:
. . . 28.2* 3.6
9.5 2.98.8 8.9
. . .
33.;*
. . .*
. . .52.5
. . .
:::6.0
1Civilian, noninstitutional population. Excludes population represented byhealth examination.
sample women pregnant at time of
2’includeswomen classified as other than white or ~egro.
3Standard normal deviate of difference between (inverse) age-adjusted atatiatic (expected value) for womenclassified according to column heading, and women not so classified.
NOTE: Rel-variancea of underlined estimatea are larger than .0625.
20

Table 5, Estimatedmean diastolicblood preseuresand standarderrors for womenl ages 18-79, by parity,race,and a=e: United States. 1960-62
Parity
Total o 1 2 3 4 5 6 7 8 9 or 4-5 6 ormore more
Race and age
Totals
Ages 18-79 years---
Mean diastolicblood pressurein mm. Hg.
78.
68
;;80
:;8479
-.92
78
79
7071
E
%8079
-.09
78
77
71
;28384827877
.58
77
80
. . .7877
;;81
8;
.08
79
83=
...69
::9884
8;
.98
82
85
...*8086
:;
8;
1.53
85
86
....:
87
::88
::
1.71
86
..&
R7882
X79...
...
...
1?3-24years------------25-34 yeurs------------35-44 years------------45-54 years------------55-64 years------------65-74 years------------75-79 years------------Expectedvalue---------Standardnormaldeviate;{--------------
white
Ages 18-79 years---
. . .7680
:?847781
-2.08I-.53 .08 2.23
79 8377 78
18-24 years------------25-34 years------------35-44 years------------45-54 years------------55-64 vears------------65-74 vears------------75-7’2years------------Expectedvalue---------Standardnormaldeviate:{--------------
;!7781848379...
...
...
%8690...
...
...
.5
.5
:;.9
1::
,,.
71
%
::817877
.14
84
T82888383
.80
,6=
1::
:::1.42.12.9
.7
.,.7876
;:8:
80
-.12
84
,,.71
;:1018:
81
.66
85
. . .
8;878989
;?
1.83
91
-1.32
79
-.28
80
-1,83 .23
Negro
Ages ~ years---
T80 87
~ ...
82 ;;87 8882 87
18-24 years------------25-34 years------------35-44 years------------45-54 years------------Expectedvalue---------Standardnormaldeviate;’--------------
;;869284
-.66
.5~,8
2::
:;
;::
,6
1.0
1:;.8.8
1$;
1.9
;::
:::
;;
1883
1.29
.7=1.6.8
1::1.6
$$
.6
. . .
E.8;
-.24
. . .
8;786
-.11
. . .*
. . .g
.08
1.7
...
;.:
7:92.2*
2.2
. . .
9;8789
.71
2.4-...
3.;
:::3.93.1
2.5
-1.83j .23
Standarderror of meanTotal!
AKes 18-79 years--- .8=:.;
i::1.8
2::2
,9
2.6
$:!1.81.9
2;::
1.7
16.53.2
2:?
1.3
5.41.8
:::3.33.0>k
1,4
2.:2.22.03.93.3>.
2.2
2.:
8.;
1.6
.,.2.82.2
$$2.9*
1.7
...3.5
8:23.62.7*.
3.0
...
;::.~.
1.7=...5.52.42.97.43.6*
2.6
.8
1.6
1::1.31.6
;::
.8
1.0
. . .2.11.1
;:;
;::
1.2
18-2425-3435-44# -;;
65:7475-79
years------------years------------years------------years------------years------------years------------yeare------------
Nhi.te
Ages 18-79 years---
18-24 years------------25-34 years------------35-44 years------------45-54 years------------55-64 years------------65-74 years------------75-79 ycurs------------
::
::.9
1::
...
1.41.41.41.7
1:!
:::1.22,12.9
1.2—
;:?2.62.4
2.3.6
1.1
;:2
::;
1.2
17.52.7
::;
. . .4.8
i::13.53.6*
6.3
...*
?2.5*
. . .
4.:
8.;2.3*
6.2
....:.
...32.9
. . .2.7
i:;3.71.93.1
2.2
...4.43.32.6
Negro
Ages 18-79 years---
18-24 years------------25-34 years------------35-44 years------------45-54 years------------
lCivLlian,noninstitutionalpopulation.Excludespopulationrepresentedby samplewOmen Pregnantat time Ofhca~,thexamination.
-Includeswomen classifiedas other than white or Negro.~lS~andardnormal deviate or differencebetween (inVerse) age adjusted statistic (expectedvalue) for
women classifiedaccordingto column heading,and women not so classified.
NOTE: Rel-variancesof underlinedestimatesare larger than .0625. 21

Table 6. Estimated mean systolic blood pressures and standard errors for womenl ages 18-79, by gravidity, race, andage: United States, 1960-62
Gravidity
Race and age
‘otal o 1 2 3 4 5 6 7 8 9 10 ~:r: 4-5 6 ‘rmcirc,
Tota12
Ages 18-79yeara-----------
Mean systolic blood pressure in nun.Hg.
. . . 128
112 113116 119123 125134 135147 145160 156157 159... 127
... .53
... 128
112 113115 118122 124132 134146 144159 155156 159... 127
... .30
... 134
115 117 I120 123132 132148 140... 132
... .68
It130 126 129
113 109 114115 116 115123 120 123135 130 134139 145 145158 161 162163 *131 13:
t
129 137
106116 11;121 118137 134149 145143 171* *
137 144 146 146
... ...113130 13:138 138154 151175 171138141 13;
..21 1.74
146 147
... ...
12; 13:140 146155 149175 172
14: 13;
!.11 1.51
152 154
... ...
& ““”140158
152 147
-.09 1.17
159 129 142131
18-24 years----------25-34 years----------35-44 years----------45-54 years----------55-64 years ----------65-74 years----------75-79 years----------Expected value-------Standard normaldeviateS-----------
White
Ages 18-79years-----------
18-24 years----------25-34 yeara----------35-44 yeara----------45-54 years----------55-64 years----------65-74 yeara----------75-79 years----------Expected value-------Standard normaldeviate3-----------
Negro
Ages 18-79years-----------
110114123132150’162153132
-.24
131
* 112115122135146155149130
..69
129
~3116126136155166154138
2,51
142
* . . .
13;g
*
14:
1.66
163
113127133158157
13:
118126135+#
131I 135-.50 -1.56 -.32
129 125 130
-.84 .61
129 137
.28 1.11
138 147
IT112 108 116115 116 115122 120 122133 129 134138 143 145156 160 162164131 12; 12;
-.70 -1.42 .12
110113120128150162g
-.53
137
110119135154139
-.22
1.5
103116 11;120 118133 134149 146143 167* *
>k
*112115121133147154149130
..38
129
11;125137156165154138
2.92
145
. . .>:
1309:**
...138
1.98
153
113128132162154
13:
128136&165*
131 I 135 142
-.82 .58 .60 1.62
139 137 126
11;126
13:
133—
11:
139—...122121
14:
139 138
18-24 years----------25-34 years----------35-44 years----------45.54 years----------Expected value-------Standard normaldeviate3-----------
Totalz
Ages 18-79years-----------
118
t
;;$126133 128153 +4+136
11:*14;
$
129157131
..44
11:135139146
-.35
. . .JJ.1
**
144
. . .
. . .*
15;
-.23
134159132
.64 I .03 -1.10 .08 I-.18 -3.3 -1.28
Standard error of mean
d===k-
T3.2 2.5
*2.;
;:$ 9.82.9 4.46.2 11.68.6 5’.7* *
3.8 2.4
11.0 1.2 1.51.0 1.6 2.7 4.0 4.0. . .
18-24 years----------25-34 years----------35-44 years----------45-54 years----------55-64 years----------65-74 years----------75-79 years----------
White
Ages 18-79yeara-----------
18-24 yeara----------25-34 years----------35-44 yeara----------45-54 years----------55-64 years----------65-74 years----------75-79 years----------
Negro
Ages 18-79years-----------
.6
.7
1::1.82.02.6
...
.7
?::2.33.63.51.6
1.3
1.2
k;2.2
$:7.7
1.3
1.9 1.9 4.11.0 1.1
;.; ;::3:: . 3,3
3.1;:; ::!!3.6 41.1 4:;;
1.5 1.1 1.5
2.0 2.21.0 1.3 ;:;1.1 1.4 1.22.9 2.0 3.32.6 2.9 3.55.5 5.25.4 * 4::;
2.81.2
2;;2.2
2:;
*
::;7.4
39.55.2%k
3.2
. . .6.46.23,48,2
J:;
4.9
. . .*
10.439.227.660,4
*
12.8 1.4 1.6
.8
:;1.41.82.03.2
...
1.5
N4.4
.8
:::2.83.7
,?::
3.0
4.7
R3.73.99.6*
6.8.56.43.9
Ii::1**;::J::
3.0 3.77,0 14.0
10.1 4.8* *
8.3 12.8
*...8.8 15.25.6 ** *
3,8
1::2.52.2
::i
*
4.;8,839.56.4*
5.2
...32.2
**
*. . .
6.;4.4
J::13.4
6.7
. . .*
22;;12.410.2
*
5.6
.,.
...12.417.1
. . .
14.:57.9
**
...
10.3 4.73.3
18-24 years----------25-34 years----------35-44 years----------45-54 yeara----------
l~ivilian, nOninstitutiOnal POP~amination.
represented by sample pregnant at time of health ex:
. . .
39.;7.0—
.,,
. . .**
—~tion. Excludes population
‘Includes women classified as other than white or Negro.
3Standard normal deviate of difference between (inverse) age adjusted statistic (expected value) for women clas,sified according to column heading, and women not ao claaaified.
NOTE: Rel-variances of underlined estimatee are larger than .0625.
22

Tablu 7. Estimated mean diaacolic blood pressures and standard errors for womenl agea 18-79, by gravidity, race, andage: United States, 1960-62
Gravidity
rota1 0 1 2 3 4 5 6 7 8 9 10 11 or 4-5 6 or. aior e more
Mean diaatolic blood pressure in mm. Hg.
79 80 81 82 8478
67
;;818684
;;
-.79
78
6772777986
g
1.19
82
79
;!788283868279
-.05
78
6973
;:82868078
-.23
86
78
7173
K8382,,,
79
-.94
78
7172
i;8382*
78
-.44
80
89 7877—
;:
R85818077
.82
77
7174
;;;3
8076
.39
85
77 87. . .
R;:858479...
.,.
...
M-24 years----------25-34 years----------M-44 y~ors----------45-54 years----------55-~4 ~c~~s...-------b5-74 yeL~rs----------75-79 ~~ars.---------Ex~uctud Vi!~UU -------.!!.eandarcl~ormldtiviotu”-----------
w
Ages 18-79 years-
1S-24 ycdrs----------25-34 yusrs ----------35-44 years----------45-54 years----------55-64 years----------65-74 years----------75-7!?years----------Expectcd VSh.lU -------
Stmiuxl pcmmoldeviate,{-----------
6873
;!8278
7;
-.28
79
66
;;838278
7:
-.55
84
~
u83808079
-.89
78
9<
i:
81g
8;
.94
83
. . .
8;89***82
.86
93
707377
::8379...
...
...
;:
8690...
,..
4<
;:
838683,!$.
79
.22
84
6972
:;83808078
-.68
82
. . .
8;
**
...81
1.25
84
Negro
Ages 18-79 yeara-
18-24 years----------25-34 years----------35-44 years-----------45-54 y~~rs...---.-.-
Expwtwl vulut!-------Stondard normal
dLWiJtU;’ ‘----------
Tofui~
69
i:
::
-.92
.6
.9
2::1.0.9
2::
.6
::86
::
1.28
.6
1.7.9
1::1.8
;:$
.6
68
::
::
-.79
.8
1.0,6
1.01.1
::?25.1
.7
7:‘k
8;
-.47
. . .8274
8;
,.50
. . .69T
8:
..68
. . .
. . .90
::
L.23
1.9=...*
N4.85.0*
2.4
. . .
. . .*
8;
-.86
Standard error of mean
. . . .6
.5
.5 1::
.7 1.2
.7 1.2
.9;::
1:: 2.6
... .8
:: l:Z.6 .8
.! :::;.:
l:i .
... 1.2
1.41..4 :::1.41.7 ;:?
AGI.!S18-79 years- .7
2.7
i:?1.6
;:;26.5
.8
.9.7
1.71.01.71.8
::;::
.9
1.1
3.;
i::4.13.6*
1.3
1.6
*
;:;
2::;2.5?<
1.7
8=
. . . 1.9 17.9* .7 1.5
2.6 .8 1.123.5 ;.;49.5 . ;::28.7
* ;:; ;:;
1/3-24yc.<rs----------25-34 years----------35-44 years----------45-54 ycm-s----------55-b& yti.lrs----------b!i-74yL!clrs----------75-79 yc~r~-...------
3.;1.11.6
I;9.
1.1
\ihite
Agus 18-7!3yLWS- 9.61 .61 .6
MI-24 ytiw?ti----------25-34 ytiars----------35-44 ycarY----------45-54 yctirs----------55-64 ywrs----------65-74 years ----------75-79 ycgrs----------
1.2
2:$
1::
13::
1.8
3.22.2
:::
1.81.0.5
:::
4:;
1.7
3.63.43.22.7
1.1
1::1.02.33.59<
4.0
1.62.7
2:::
3.01.11.21.71.2
2:::
1.7
v;4.64.8*
3.91.11.9
::;
.*
3.5
36.61.62.011.6
**
:::23.82.69.
5.2
...20.1
**
1’ 7.LI *2.;1.6
;:;
“*
2.9
...6.52.37’<
3.:4.9
$::3.0‘k
6.1—
9.:**
. . .
3.;
:::3.83.8
2.9
...*
1.584.4
. . . -.—,* .6
1,03$? ;.;
** 1:2
... 2.9 ‘
Ncgru
Ages 18-79 years-
18-24 ye@?s----------25-34 yeara----------35-44 yL,ara----------45-54 ycurs----------
;!l;;l ;j’.,,1CiviLiLIn,noninstitutional population represented by sample women pregnant at time of health examination. ‘\
‘\‘IncLudcs women classified as other than white or Negro. \,
%t.+ndurd normal deviate of difference between (inverse) age adjusted statistic (expected value) for women classified,Iccordfngto column heading, and women not so classified,
NU3W: [email protected] underlined estimates are larger than .0625. ‘\\
23
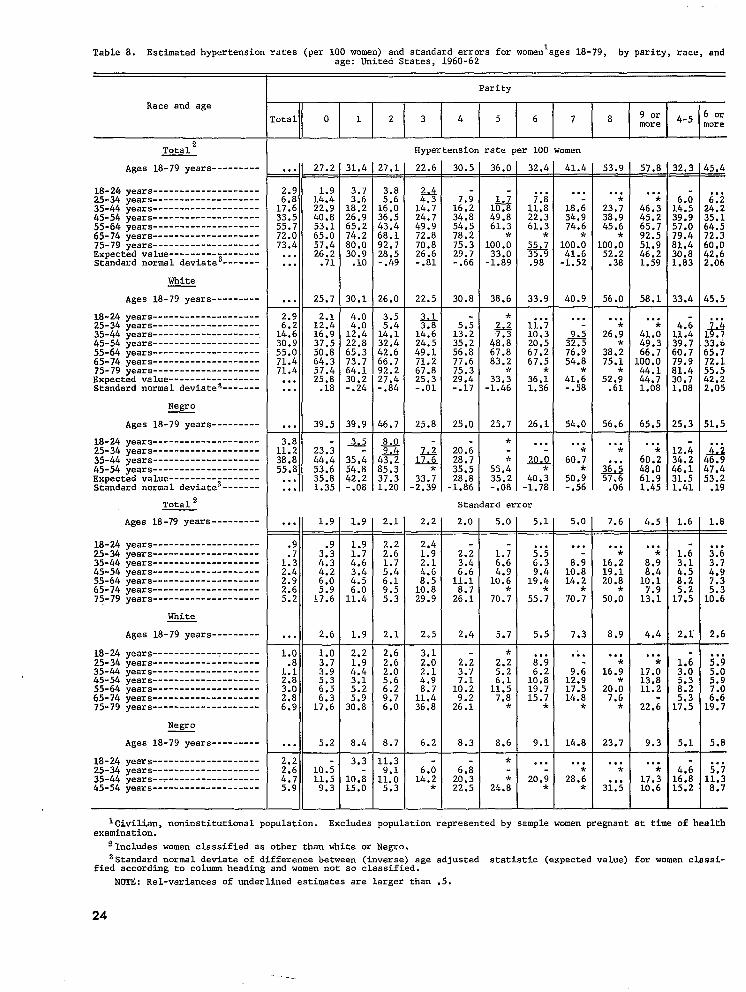
Table 8. Estimated hypertension ratea (per 100 women) and standard errors for womenlagea 18-79, by parity, race, andage: United States, 1960-62
Parity
Race and age
‘otal o 1 2 3 4 5 6 i’ 8 9 or ~-~ 6 ormore more
2Total
Ages 18-79 years---------
Hypertension rate per 100 women
22.6-
2JJ
12:;24.749.972.870.826.6-.81
22.5
~
14:624.549.171.267.825.3-.01
25.8
@
33.7-2.39
2.2
30.5_
11::34.854.578.275.329.7-.66
30.8
1%:35.256.877.675.329.&-.17
25.0
20.;28.735.528.8-1.86
36.0_
1%49.861.3
100.:33.0-1.89
38.6
=4=. . . 27.2
::: 1:::17.6 22.933.5 40,855.7 53.172.0 65,073.4 57.4... 26.2... .71
... 25.7
::: 1;::14.6 16.930.9 37.555.0 50.871.4 64.371.4 57.4... 25.8... .18
... 39.5
1?:: 23.;38.8 44.455.8 53.6... 35.8... 1.35
31.4_
:::18.226.965.274.280.030.9.10
30.1
4.0
1::!22.865.373.764.130.2-.24
39.9
&5
35.;54.8~GJ
1.9
27.1-
;::16.036.543.468.192.728.5-.49
26.0
3.5
1:::32.442.666.792.227.4-.84
46.7
H43.285.337.31.20
2.1.
M
i:i6.19.55.3
2.1
G2.62.05.66.2
:::
8.7
53.9=
...
23.;38.945.6
100.;52.2.38
56.0
57.8_
...
46.;45.265.792.551.9:6;;.
58.1
32.3_
1:::39.957.079.481.430.81.83
33.4
45.4-
...
2i:;35.164.572.360.042.62.06
45.5
18-24 years--------------------25-34 years--------------------35-44 years--------------------45-54 years--------------------55-64 years--------------------65-74 years--------------------75-79 years--------------------Expected value---------;-------Standard normal deviate -------
White
Ages 18-79 years---------
. . . . . .
12: 18.:22.3 34.961.3 74.6
*:. 100.:41.6
.9i -io52
T33.9 40.9
... ...11.7 -10.320.5 3%67.2 76.967.5 54.8
36.; 41.;1.36 -.58
18-24 years--------------------25-34 years--------------------35-44 yeara--------------------45-54 yeara--------------------55-64 years--------------------65-74 years--------------------75-79 years--------------------Expected value-----------------Standard normal deviate3-------
Negro
Ages 18-79 years---------
18-24 years--------------------25-34 years--------------------35-44 years--------------------45-54 yeara--------------------Expected value-----------------Standard normal deviate3-------
Total 2
Agea 18-79 yeara---------
;7.348.867.883.2
33.;-1.46
25.7
*
55.:35.2-.08
1::!39.760.779.981.430.71.08
25.3
. . .
26.;
38.;75.1
52.;.61
56.6
. . .
41.:49.366.7.00.044.144.71.08
65.5
. . .
13-533.b65.772.155.542.22.05
51.5-J--26.1 54.0
-1 ““~. . . . . .
*. . .
WJ
7.6
. . .
60.;48.061.91.45
4.5
12.134.2:;.;
l.il
1.6
. . .u46.947.4S:i$
1.8
2!2$ 60.7
40.3 50.;-1.78 -.56
Standard error
. . . 1.9
.9:;
::;;:: 4.22.9 6.02.65.2 1%:
... 2.6
l.O 1.0.8
1.1 ;:;2.8 5.3
::: :::6.9 17.6
... 5.2
2.2 -10.5
::: 11.55.9 9.3
2.0 5.0 5.1 5.0
18-24 years--------------------25-34 years--------------------35-44 yeara--------------------45-54 years--------------------55-64 years--------------------65-74 yeara--------------------75-79 years--------------------
White
Agea 18-79 years---------
18-24 yeara--------------------25-34 years--------------------35-44 years--------------------45-54 years--------------------55-64 years--------------------65-74 years--------------------75-79 yeara--------------------
Negro
Ages 18-79 yeara---------
2.41.9
;::
1:::29.9
2.5
3.1
;:!4.9
1!::36.8
6.2
;:;
1:::70.;
5.7
2.;5.2
1:::7.8*
8.6
. . .5.56.39.419.4
55.;
5.5
...8.96.210.819.715.7
*
9.1
. . .
8.;10.814.2
70.;
7.3
.:.
1;::17.514.8
*
14.8
. . .
16.;19.120.8
50.:
8.9
...
16.:
20.:7.6*
23.7
,..
8.;6.410.1
1::?
4.4
. . .3,6
::;7.3
1:::
2.6
-1.63.05.38.2
1?:2
5.1
4.;16.815.2
. . .
17.:13.811.2
22.6
9.3
,..
17.:10.6
. . .5.95.05.97.0
1$:?
5.8
...
1?::8.7
18-24 yeara--------------------25-34 years--------------------35-44 yeara--------------------45-54 years--------------------
3.3
10.;15.0
L1.3
L?:;5.3
*
24.;
6.;14.2
*2;:;22.5
. . .
20.9*
. . .
28.;*
. . .*
. . .31.5
Icivilian, noninstitutional population. Excludes population represented by sample women pregnant at time of healthexamination.
‘Includes women claaaified aa other than white or Negro.
3Standard normal deviate of difference between (inverse) age adjustedfied according to column heading and women not ao classified.
statiatic (expected value) for women classi-
NOTE: Rel-variances of underlined estimatea are larger than .5.
24

Tabk! 9, Estimated hypertension rates (per 100 women) and standard errors for womenl ages 18-79, by gravidity, race,and age: United Statea, 1960-62
Gravidity
!ota 1 0 1 2 3 4 5 6 7 8 9 10 11 or ~-5 6 ormore ❑ore
Race and age
Tota12
A&s 18-79years-------
Hypertension rate per 100 women
& 45.124.2
~~
33:854.245.1
29.;
-1.89
23.6
26.5
1::;24.140.253.164.464.925.0
.7L
25.2
31.4=
:::18.424.268.074.350.631.2
.10
30.2
29.0
:::15.836.2;:.:
92:930.0
-.49
27.5
40.7
10.:~51.548.789.3
36.;
.98
42.8
34.5
6.;23.224.171.056.6
37.;
.1.52
35.8
47.2=
19.:18.226.467.073.4
45.;
.38
49.6
53.2
...
41.846.162.485.038.845.6
1.59
50.7
55.6
...
36.;30,163.5100.0
42.;
1.83
53.0
60.8
...
39.;63,179.667.8
44.;
2.03
61.9
25.6
3.614.532.751.469.566.828.4
-1.69
25.7
. . .
6%17.633.555.772.073.4...
...
...
18-24 years------25-34 years------35-44 yesrs------45-54 yeara------55-64 years------b5-?4 years------75-79 years ------Expected value---Standard normal
deviate:i --------
a
Ages 18-79years -------
18-24 years ------25-34 yeare------35-44 years------45-54 yesra------55-64 yeara------b5-74 yeara------75-79 years------Expected value---Standard normaldeviateAl--------
&.$ -
16:2 1:::29.0 32.052.8 49.472.4 84.684.0 48.925.2 27.9
8.;20.940.2:5.:
71:240.7
-.81 -.66
23.5 26.9
2.41
45.4
2.9
1!::30.955.071.471.4
. . .
. . .
. . .
1?:!38.855.8
,..
. . .
. . .
:;
;::2.9
$::
. . .
1.0.8
k:3.0
;:;
. . .
1;::19.835.950.463.864.924,7
.18
40,7
~25.143.263.032.3
1.35
2.1~
:::
M5.7
M
2.6
M4.76.16.3
J::
6.2
4.55.2
13.819.7;;.:
$$$.
-.24
40.4
&o
34.;57.541.1
-.08
t:12.432.343.969.691.929.2
-.84
45.8
2%$45.664.739.0
1.20
&73.;
1!:! 14.228.5 31.054.2 51.774.1 84.4
48.923.; , 27.4
8.:
5~851.091.8
35.;
1.36
30.1
. . .~
43.;
-1.78
G21.923.276.155.5
37.;
-.58
33.8
d*
44.;
-.56
*
18.;26.267.074.0
46.:
.61
48.8—
. . .~
**
$8.2
.06
7.:17.540.462.477.971.139.9
2i3:::57,045.1
29.;
-1.46
31.4
69.;54.432.1
-.08
. . .
31.;47.661.880.540.344.0
1.08
70.4
. . .
100 .;48.461.4
1.15
. . .
30.;+$+
100:0
42.;
1.03
65.8
. . .
. . .38.677.355.1
1.42
. . .
L:81.0
**
. . .39.9
2.05
70.6
. . .
. . .*
67.;
.19
3.511.230.853.869.166.828.0
-1.07
25.1
3;::::.;
.
-.98
-.01 -.17 2.25
!!s5?22Ages 18-79
years -------
18-24 years ------25-34 years ------35-M years ------45-54 yeara ------Expected value---Standard normal
devfate;{--------
Tota12
Ages 18-79yeara -------
*49.8
*~ 11.3
18.7 19.439.6 *39.6 29.2
12.942.545.651.6
.2.39 [ -1.86 -.27
Standard error
1.7 2.0
2.2 1.92.3
::$!3.1 i::4.1 7.6
8.83::; 4.8
1.7 2.0
2.5 2.5
::; ;:;3.2 6.2
::; i;35.6 6.3
8.7 5.7
4.3 5.2- 14.4
18.3 11.714.0 11.9
7.3 1.82.3
::$6.87.0
2::?
2.5
2.;2.37.17.8
2%!
5.1
2.7 4.4
4.?
;::15.1
6.5*
5.1
5.:
:::16.2
6.2*
7.8
2.22.1
2.3
$:4.19.2
3::;
2.4
2.8
$;4.29.09.:
6.1
5.0
*14.210.310.723.7
8.2*
5.8
*
9.:13.223.1
0.0*
9.4
4.8
. . .
15.i
1:::11.017.9
6.2
. . .
17.:11.510.716.821.2
7.8
18-24 yesrs ------25-34 years ------35-44 yeara ------45-54 years ------55-64 years ------65-74 yeara ------75-79 yeara ------
WhLte
Ages 18-79years -------
*4.2
14.98.5
19.65.8
*
3.3
+
. . .1.;
23.;29.2 ;:;;;.; 6.5
“* 1:::
10.7 2.1
. . .
25.; H33.7 5.8
* 6.6*
1?::
2.;
2:;10.011.2
*
3.8
. . .12.;!0.522.1
*
10.1 2.5
*
2::5.0
2:;13.5
18-24 years ------25-34 yeara ------35-44 yeara ------45-54 years ------55-64 yeara ------b5-74 years ------75-79 years ------
Negro
Ages 18-79years -------
18-24 yeara ------25-34 yeara------35-44 years------45-54 years------
*
1:::8.9
22.49.0
*
19.2
2.;
:::10.811.2
*
10.2
. . .*17.926.832.9
*
18.4 5.57.6 6.7
2.2
::;5.9
*
1:::*24.;
**
5.;12.724.3
20.;14.7
. . .18.5
*
. . .25.3
**
. . .*
25.024.4
. . .
. . .22.923.0
. . .
. . .* 1:::* 9.4
9.411.0
7.2
,Icivilian, nOninstitutiOnal pOpulatiOn~ excludes population represented by women pregnant at time of health exami-
nation.
%cludea women classified as’other than white or Negro.Sstandard nomal deviate ~.fdifference between (inverse) by adjuated StatiStiC (expected value) for women Classi-
fied according to column heading and women not so classified. 25NOTE: Rel-variances of underlined estimates are larger than .5.

The sample design of the Health Examination Sur-vey program in which the data for this study were col-lected, embodies a number of features to reduce surveycoats and sampling variability with optimum balance.Sampling was carried out in four distinct operations. Thefirst three involved clusters of sampling units of suc-cessively smaller size—counties or groups of counties(primary sampling units), segments (clusters of house-holds) defined for use in the population census, andhouseholds (which may be thought of as clusters ofadults). The fourth and final step in sampling consistedof selection of sample persons from the sample house-holds. The primary sampling units were highly strati-fied, and were selected with probability proportional tosize by a controlled selection technique.30
In the estimation procedure, a measure (for ex-ample, systolic blood pressure) for a sample personis multiplied by a statistical weight which is the re-ciprocal of the probability of the selection of the personin the sample.
Two weighting adjustments were also made to in-crease the extent to which the national population isrepresented by the sample. The first of these is referredto asothe.’’firs~tage ratio adjustment.” This consistedof adjusting the statistical weight for each sample per-son in each of tbe primary sampling units so that thepopulation in the stratum represented by a particularprimary sampling unit (PSU) was forced to equal thecomplete enumeration indicated by the 1960 populationcensus. The second adjustment was a poststratificationby age and sex. In this procedure, tbe statistical weightfor each person is adjusted so that the final nationalestimates from the survey agree exactly with popula-tion estimates for the country as a whole for 12 age-sex classea based on the 1960 census and projected toOctober 1, 1961 (the mid-point of the survey),
Prior to making the poststratification corrections,a small nonresponse adjustment factor waa applied tothe statistical weight which had the effect of imputingthe characteristics of examined sample persons to the13.5 percent of the selected sample adults who werenot examined. (Details of these procedures are givenin reference 12.)
It is clear from even the above rather summaryand abridged account of the process that the sampledesign and estimation for this survey were “complex”in an operational as well as a statistical sense. Thismeans that certain algebraic relationships of classicalstatistical theory among measures which may be de-rived from the sample cannot be used to evaluatethe precision of the estimates. For example, if asimple random selection of persons had ken madeand a measure of interest (e.g., systolic bloodpressure) recorded for each sample person, meanblood pressure for the population would be estimatedas f. ZWI xl , where WIis the statistical weight of
-zw,
the ith sample person, and the calculated standarderror bf this estimate would be:
[12;
~w, (x,-z)d_ .
x z w,
which in turn would be used to evaluate the extentto which # might reasonably be expected to vary fromthe “true” or population mean systolic blood pressuredue to the fact that a sample was used.
Similarly, in using a regression model it may bepostulated that systolic blood pressure is related toage, parity, and body weight by the relationship
where Y represents systolic blood pressure, and the
~i measures of age, parity, and body weight re-spectively (measured from their mean values). Again,if a simple random selection of persons had kenmade, the parameters ~ may be estimated byb = (XX’~l XY where # is the vector of the threeregression coefficients in the immediately precedingequation, Y is the vector of measures of systolic bloodpressures for the sample persons, X ia the matrixof measures of the other (independent) variables forthe wa~ple persons, X’ is the transpose of X and( XX’) is the inverse of the matrix XX’. For asimple random sample of persons, the measures of
26

precision of t~-l estimates L$may easily be computedas ~p.a~(xx) where$jj is the vector of sampling
variances of # (corresponding to $+ for the estimate ofmet% systolic blood pressure discussed previously),and U2is a (scalar) measure of the variance of thevariable measures.
For the highly complex design of the surveyfrom which the data in this report were based suchstraightforward algebraic relationships for estimationof sampling variability as given in the above examplesare not appropriate. Although a considerable body oftheory is available to permit such estimation for cer-tain situations of clustering of elements, stratification,multiplicity of sampling stages, etc., the extent to whichthese measures were applied in the Health ExaminationSurvey design (to reduce both sampling variability andsurvey costs) was such that it has been impossible,or at least impracticable, to develop such directalgebraic expressions for this sample design.
Instead a simulation type technique was used whichis equally appropriate mathematically and potentiallymore effective than direct algebraic calculation inanalytical applications. The elements of this procedure,which was used to estimate the sampling variabilityof the statistics presented in this report, may beenumerated as follows, using estimation of a simplecorrelation coefficient r12 where the subscripts in-dicate systolic blood pressure and parity, respectively,as an example.
1. The weighting factors described above are includedin the estimator. For the parameter of interest,~12 , the estimator is:l
Zx 1) x2j qA
*12 =
[
2
1(~xli Wj) (Zx; i w,) +
IThc ~ctual ~omPutations were carried out usingtramfonmd data
i.e., with s crmstwrt subtracted from the measure. Basic calculations
were dcme in double precision on an IBM 360-40 computer using a~cntmlimd program written by Mr. Martin Frankel and Mr. Neaf VanEck of the Univwsit y of Michigan Institute of Sociaf Research. Theprogram was written under the direction of Professor Leslie Kish undercantr:~ct with dw National Center for Heafth Statistics. Ancillaryc;llculations (z-transforms, supplementary partial correlationchdaticms, etc. ) were programmed in double precision by the senior.~uthm using the more ~ccessible and flexible Univac 1108 installationIJFthe N;itimr,d Burmu of Standards,
2.
3.
4.
5.
The model is conceptualized as a random selection
of two PSU’S from each of 26 strata.Half-sam~le replicates are delineated. Each half-sample replicate consists of data for one PSU from
each stratum, e.g., about half of the total sample.The total number of possible different half-samplereplicates is 226.
The estimator of interest, #12 is calculated foreach half-sample replicate,m with appropriate modi-fication of statistical weights.The value of the correlation between half-samplesis such that it can be shown that for a part&ularhalf-sample, the expected value E t ~[z - f12) is anestimate of the variance of the estimate $12 fromthe total sample. 92 Therefore the expected Value
of the average of the 28 squared differencess2#12. & =5=1(;112- f12f is an unbiased and su-perior estimate of variance of #12 . Specifically,for the 28 half-samples used for the problems inthis report, if #~, is the correlation coefficientas estimated for i%e ith half-sample replicate andArl p is the corresponding estimate for the total.-sample, the statistic
S2A 1282 (?\2 - 212)2r12 ’28 1-1
is used to estimate the sampling variances of thecorrelation coefficient of interest, ;12
The preceding necessarily rather summary and abridged
account is given as illustrative of the methods appliedto the data presented in this report. Discussion ofdetailed theoretical concepts such as a minor biasaccruing in the balanced half-sample replication methodwhen a nonlinear estimator, e.g., the correlation co-efficient, is used, have been avoided. Also, as pointedout in the text material, a z-transform should be
‘In practice, PSU’S are selected for inclusion in the half-samplesunder a set of constraints which permits use of a much smaffer numberof half-sample replicates. The method W.S developed by McCarthy,Simmons, and Losee; it is referred to as balanced half-samplereplication and gives a result numerically equaf to that which would beobtained by operating with all possible half-sample replicates. (Forthese data, 28 half-sample replicates of the possible 226 suffice.)Detaik of this aspect of the procedure are published in references21-23. The first large-scale use of the method was made by Simmonsand Losee with means and proportions estimated from HeafthExamination Survey data. An account of the theoretical development
and computer program is given in reference 21.
27
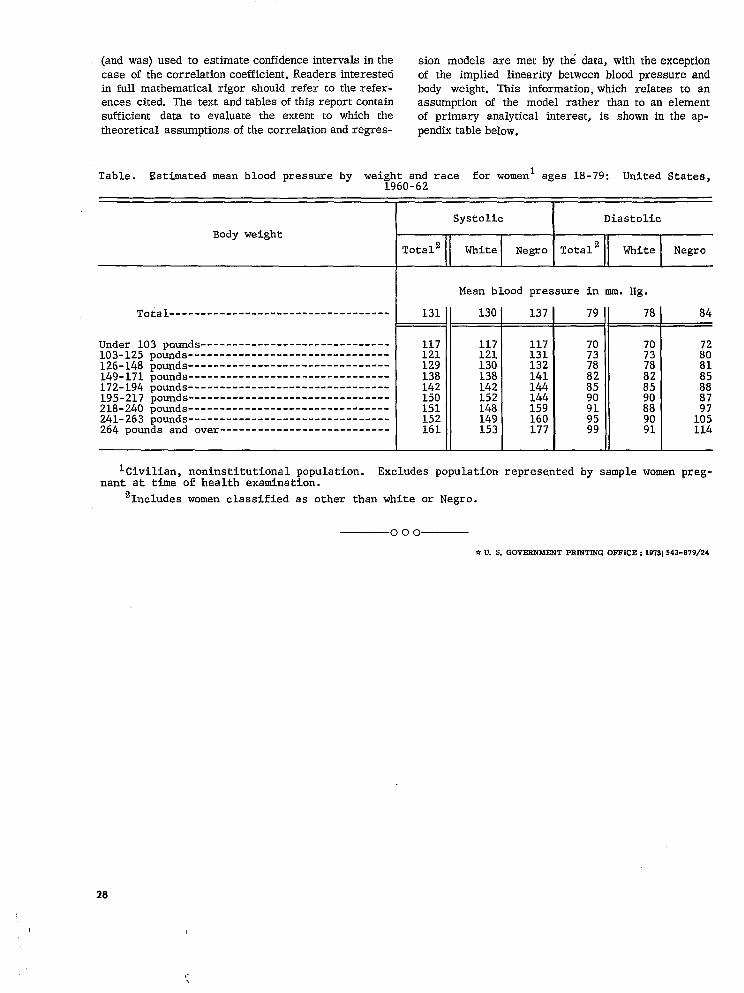
(andwas)usedtoestimateconfidenceintervalsinthe sionmodels are met by thedata,withtheexceptioncaseofthecorrelationcoefficient.Readersinterested of the impliedlinearitybetweenbloodpressureandin full mathematical rigor should refer to the refer- body weight. This information, which relates to anences cited. The text and tables of this report contain assumption of the model rather than to an elementsufficient data to evaluate the extent to which the of primary analytical interest, is shown in the ap-theoretical assumptions of the correlation and regres- pendix table below.
Table. Estimatedmean blood Dressurebv wei.zhtand race for womenl a~es 18-79: United States..i960-62
Body weight
Under
Total-----------------------------------
103 Dounda------------------------------103-125126-148149-171172-194195-217218-240
po&ds --------------------------------pounds--------------------------------pounds--------------------------------pounds--------------------------------pounds--------------------------------Bounds--------------------------------
241-263bounds--------------------------------264 poundsand over---------------------------
Systolic
Tota12II White Negro
!3iaatolic
Tota12 White
Mean blood pressurein mm. Hg.
131II 130
117 117121 121129 130138 138142 142150 152151 148152 149161 153
137
117131132141144144159160177
79
;:
E8590919599
78
Negro
84
Icj-villan,noninstitutionalpopulation. Excludespopulationrepresentedby samplewomen preg-nant at time of health examination.
21ncludeawomen classifiedas other than white or Negro.
000
*U. S. GOVERNMENT PR3NT3NG OFFICE: l’J731543-879/24
28

VITAL AND HEALTH STATISTICS PUBLICATION SERIES
Se?+es 1. Proiyams and collection procedures. — Reports which describe the general programs of the National
Center for Health Statistics and its offices and divisions, data collection methods used, defirdtions,and other material necessary for understanding the data.
Series 2. Datn evaluation and methods research. — Studies of new stati sticai methodology including: experi -mental tests of new survey methods, studies of vital statistics collection methods, new analyticaltechniques, objective evaluations of reliability of collected data, contributions to statistical theory.
Series 3. Analytical studies. —Reports presenting analytical or interpretive studies based on vital and health
stati sncs, carrying the analysis further than the expository types of reports in the othcx series.
Series 4. Documents and committee repovts. — Final reports of major committees concerned WiLb vital and
health statistics, and documents such as recommended model vital registration laws and revisedbirth and death certificates.
Se~ies 10. Data from the Health InteYview Survev. —Statistics on illness, accidental injuries, disability, use
of hospital, medical, dental, and other services, and other health-related topics, based on datacollected in a continuing national household interview survey.
Series 11. Data ~om the Health Examination Survey. —Data from direct examination, testing, and measure-ment of national samples of the civilian, noninstitutional population provide the basis for two typesof reports: (1) estimates of the medically defined prevalence of specific diseases in the United
States and the distributions of the population with respect to physical, physiological, and psycho-
logical characteristics; and (2) analysis of relationships among the various measurements withoutreference to an explicit finite universe of persons.
Series 12. Data from the Institutional Population Surveys — Statistics relating to the health characteristics ofpersons in institutions, and their medical, nursing, and personal care received, based on nationalsamples of establishments providing these services and samples of the residents or patients.
Series 13. Data Porn the Hospital Dischar<e Survey. —Statistics relating to discharged patients in short-stayhospitals, based on a sample of patient records in a national sample of hospitals.
Series 14. Data on health vesources: manpower and facilities. —Statistics on the numbers, geographic distri-bution, and characteristics of health resources including physicians, dentists, nurses, other healthoccupations, hospitals, nursing homes, and outpatient facilities.
Series 20. Data on mortality. — Various statistics on mortality other than as included in regular annual ormontnly reports— special analyses by cause of death, age, and other demographic variables, also
geographic and time series analyses,
Sa+es 21. Data on natality, marriage, and divorce. —Various statistics on natality, marriage, and divorce
other than as included in regular annual or monthly reports-special analyses by demographicvariables, also geographic and Qme series analyses, studies of fertility.
Swies 22. Lkta from the National Natulity and Mortality Surveys. — Statistics on characteristics of birthsand deaths not available from the vital records, based on sample surveys stemming from theserecords, including such topics as mortality by socioeconomic class, hospital experience in thelast year of life, medical care during pregnancy, health insurance coverage, etc.


![BMC Evolutionary Biology BioMed Central · of metazoan gene families. Earlier surveys [6,9] have dem-onstrated unexpected Sox gene diversity in non-Bilateri-ans, some diversification](https://static.fdocuments.in/doc/165x107/60131f5e6c8ec34fa66e351f/bmc-evolutionary-biology-biomed-central-of-metazoan-gene-families-earlier-surveys.jpg)


![Ground-State Equilibrium Thermodynamics and Switching ...tonitrileandthepolymerelectrolytedevices,wehavedem-onstrated[25,27] thattherelaxationkineticsweresensitiveto both molecular](https://static.fdocuments.in/doc/165x107/5f48519ca9aaac50bb3c47c4/ground-state-equilibrium-thermodynamics-and-switching-tonitrileandthepolymerelectrolytedeviceswehavedem-onstrated2527.jpg)