Visualisation and Forecasting on IT Capacity Planning Data-cmgmay13incldemostatics
42
Copyright © 2012, SAS Institute Inc. All rights reserved. ADVANCED VISUALISATION ON MAINFRAME RMF AND SMF DATA (APPLYING BIG DATA SOLUTIONS TO IT SYSTEM UTILISATION DATA) ANDREW GADSBY, MAINFRAME BUSINESS DEVELOPMENT [email protected] MIKE WROOT, MAINFRAME TECHNICAL SPECIALIST [email protected]
description
Much has been written about applying analytics to Big Data problems and how advanced visualisation techniques allow businesses to create new value from Big Data. At SAS we are seeing many customer facing organisations make extensive use of new visualisation techniques to derive significant business value from the mass of data available tothem. IT also suffers from its own Big Data problem with the 4 V’s (volume, velocity, variety and variability) applying to IT systems performance and capacity data. We wondered if it would be possible to apply Big Data visualisation and analytic techniques to mainframe RMF and SMF data. In particular, we wanted to understand if analysis in this way could deliver value back into IT.
Transcript of Visualisation and Forecasting on IT Capacity Planning Data-cmgmay13incldemostatics
Copy r ight © 2012, SAS Insti tute I nc . All r i ghts r eserved.
ADVANCED VISUALISATION ON MAINFRAME
RMF AND SMF DATA
(APPLYING BIG DATA SOLUTIONS TO IT SYSTEM UTILISATION DATA)
ANDREW GADSBY, MAINFRAME BUSINESS [email protected]
MIKE WROOT, MAINFRAME TECHNICAL [email protected]

Copy r ight © 2012, SAS Insti tute I nc . All r i ghts r eserved.
ABSTRACT ANDREW GADSBY and MIKE WROOT
Title:
Advanced Visualisation and Analytics on Mainframe RMF and SMF Data
(Applying Big Data techniques to IT system utilisation data)
Abstract:
Much has been written about applying analytics to Big Data problems and how advanced visualisation techniques allow
businesses to create new value from Big Data. At SAS we are seeing many customer facing organisations make
extensive use of new visualisation techniques to derive significant business value from the mass of data available to
them.
IT also suffers from its own Big Data problem with the 4 V’s (volume, velocity, variety and variability) applying to IT
systems performance and capacity data. We wondered if it would be possible to apply Big Data visualisation and
analytic techniques to mainframe RMF and SMF data. In particular, we wanted to understand if analysis in this way
could deliver value back into IT.
This session will present an overview of the approach we took to analyse and visualise this data, and illustrate some of
the value that could be derived from such analysis. We will also give a live demonstration of our solution.

Copy r ight © 2012, SAS Insti tute I nc . All r i ghts r eserved.
AGENDA ADVANCED VISUALISATION
• Introductions
• How are Your Business Users Looking at their Data?
Demonstration
• How does IT undertake capacity reporting today?
• Linking Visualisation to Capacity Reporting and Forecasting
Demonstration
• Observations and Conclusion

Copy r ight © 2012, SAS Insti tute I nc . All r i ghts r eserved.
ACKNOWLEDGEMENT FROM THE MAGIC CIRCLE….

Copy r ight © 2012, SAS Insti tute I nc . All r i ghts r eserved.
AGENDA ADVANCED VISUALISATION
• Introductions
• How are Your Business Users Looking at their Data?
Demonstration
• How does IT undertake capacity reporting today?
• Linking Visualisation to Capacity Reporting and Forecasting
Demonstration
• Observations and Conclusion

Copy r ight © 2012, SAS Insti tute I nc . All r i ghts r eserved.
“The Greatest Value Of A Picture
Is When It Forces Us To Notice
What We Never Expected To See.”John W. Tukey, Exploratory Data Analysis 1977

Copy r ight © 2012, SAS Insti tute I nc . All r i ghts r eserved.
BUSINESS USERS
VIEWVISUALISATION OF BIG DATA
• Visually Exploring Their Data Using Tablets
• User Self Service is Becoming the Norm
• Speed of Thought Investigation and Discovery
• Building Analytical Data Warehouses (ADW)
• Improved Decision Taking Across the Business
• Static Reports are No Longer Acceptable

Copy r ight © 2012, SAS Insti tute I nc . All r i ghts r eserved.
Central Entry Point Integration Role-Based Views
DELIVERPREPARE EXPLORE DESIGN
• SAS®
Mobile BI - native tablet applications delivering interactive reports
• Web and PDF
• Manage data• Load and join data• Create calculated
columns
• Perform ad-hoc data exploration
• Insights generated through analytic visualizations
• Create dashboard style reports for web or mobile
IN-MEMORY ANALYTICS ENGINE
SAS®VISUAL
ANALYTICSA SOLUTION FOR FASTER, SMARTER DECISIONS
www.sas.com/visualanalytics

Copy r ight © 2012, SAS Insti tute I nc . All r i ghts r eserved.
DEMONSTRATION
SAS® VISUAL ANALYTICS
MEGACORP


Copy r ight © 2012, SAS Insti tute I nc . All r i ghts r eserved.
AGENDA ADVANCED VISUALISATION
• Introductions
• How are Your Business Users Looking at their Data?
Demonstration
• How does IT undertake capacity reporting today?
• Linking Visualisation to Capacity Reporting and Forecasting
Demonstration
• Observations and Conclusion
Copy r ight © 2012, SAS Insti tute I nc . All r i ghts r eserved.
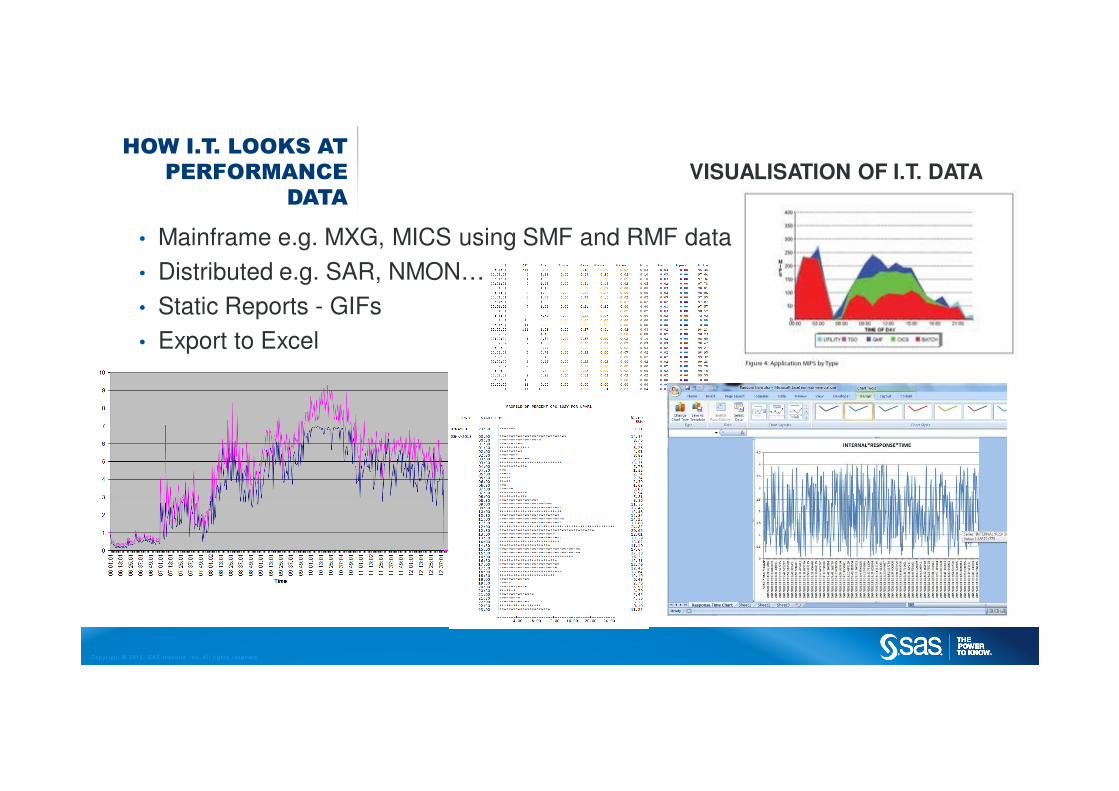
HOW I.T. LOOKS AT
PERFORMANCE
DATA
VISUALISATION OF I.T. DATA
• Mainframe e.g. MXG, MICS using SMF and RMF data
• Distributed e.g. SAR, NMON…
• Static Reports - GIFs
• Export to Excel
Copy r ight © 2012, SAS Insti tute I nc . All r i ghts r eserved.
AGENDA ADVANCED VISUALISATION
• Introductions
• How are Your Business Users Looking at their Data?
Demonstration
• How does IT undertake capacity reporting today?
• Linking Visualisation to Capacity Reporting and Forecasting
Demonstration
• Observations and Conclusion

Copy r ight © 2012, SAS Insti tute I nc . All r i ghts r eserved.
LINKING
VISUALISATION TO
I.T. DATA
EXAMPLE HIGH-LEVEL ARCHITECTURE
SAS® VISUAL ANALYTICS ENVIRONMENT
Desktop
Web
Mobile
SAS VA CLIENTS
SMF/RMF
SAR
OpenView
AWR
Workspace Server
Mid-Tier
VA Server
Co-Located Data Storage
Co-Located Data Storage
Co-Located Data Storage
SAS® LASR Analytic Server
LASR Cluster

Copy r ight © 2012, SAS Insti tute I nc . All r i ghts r eserved.
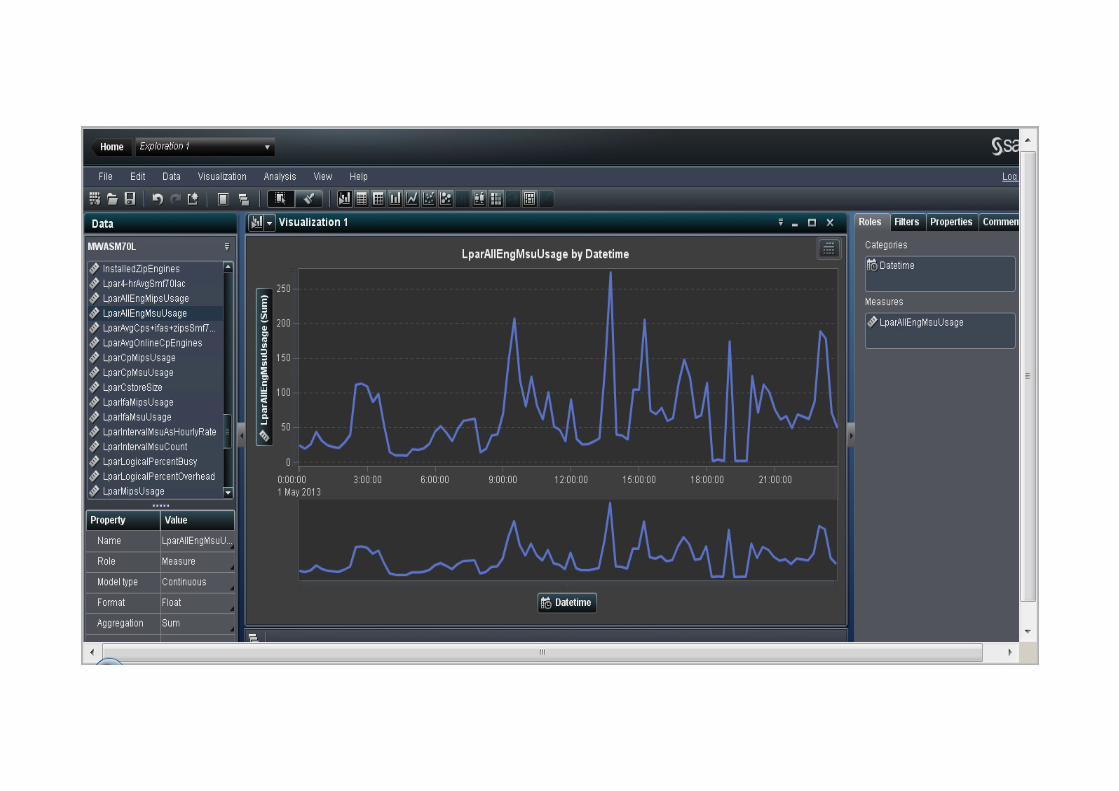
DEMONSTRATION
SAS® VISUAL ANALYTICS FOR I.T.
MEGACORP I.T.


Copy r ight © 2012, SAS Insti tute I nc . All r i ghts r eserved.
OBSERVATIONS &
CONCLUSIONSVISUALISATION OF I.T. DATA
• Loading and Visualisation of the underlying data was the easy bit
• Understanding what the data means is critical
• Just because you can view things a certain way doesn’t mean it makes sense!
• Good news here as a capacity planning expert you will still keep your job
• Correlation is hard
• Drill down from CPU utilisation at point of time to recreate workload/job step view
is difficult
• Resolving this needs effort at data preparation / load time
• Changes way that capacity planning and forecasting is approached
• Could drive significant reduction in static report production on mainframe (CPU saving ? )
• We are Continuing Development of this Technology and Use Case

Copy r ight © 2012, SAS Insti tute I nc . All r i ghts r eserved.
QUESTIONS?
THANK YOU