Visual programming and automatic evaluation of …gerosa/papers/07757621.pdf · Visual programming...
9
Visual programming and automatic evaluation of exercises: an experience with a STEM course Leônidas de Oliveira Brandão Institute of Mathematics and Statistics University of São Paulo, USP São Paulo – Brazil [email protected] Yorah Bosse Department of Computing Federal Univ. of Mato Grosso do Sul, UFMS Ponta Porã – Brazil [email protected] Marco Aurélio Gerosa Institute of Mathematics and Statistics University of São Paulo, USP São Paulo – Brazil [email protected] Abstract—Programming capabilities are important to the new professionals. Although several initiatives all over the world haves been proposed for teaching programming to people at all levels. Many undergraduate students still fail in the programming courses. Proposed strategies have included visual programming and automatic evaluation of exercises. Nevertheless, there is still a lack of knowledge about students’ perceived difficulties in using these strategies in practice: that is, their challenges to learning how to program. In this paper, we report a study aimed at understanding these difficulties and strategies in a STEM course. We used an environment comprising a visual programming tool to introduce algorithms, iVProg with iAssign, and the virtual programming lab (VPL) to introduce programming in C, both with automatic assessment integrated to Moodle. We report quantitative and qualitative results and future directions. Teachers and tool designers can leverage these results to better support programming learning. Keywords—programming; learning; novice; automatic evaluation; difficulty I. INTRODUCTION The software industry achieved 40.1% of the total amount of 2015 investments [1], [2], as pointed out by market researchers, such as MoneyTree 1 . However, many business fail before reaching their potential in the market; one cause is software development failures [1]. Therefore, a major challenge for modern society is preparing new generations of software developers, which means people skilled in algorithms and computer programming. Governments and large companies are attentive to promote initiatives, as in Scotland, Israel, New Zealand and South Korea [3]. These projects aim to encourage students to learn logic and programming since elementary school. However, the area still faces many problems. Most evident is the high failure rates of students in their first programming course, usually during the first year of STEM (Science, Technology, Engineering, and Mathematics) courses. This first programming course comprised about 28% of failures and dropout [4], [5]. In the University of São Paulo (USP) - Brazil, the rate of failure and dropout for the last five years is about 29%. More than 25% of the students try more than once to pass [5]. Students demonstrate difficulty in learning a new and formal syntax and abstractions [6]. While they can understand the syntax and semantics of commands, they cannot combine them into a single program [7]. Beginners 1https://www.pwcmoneytree.com/ tend to have superficial knowledge, and fail when they need to apply it [8]. Another factor that may contribute to this index is the teacher's workload. At the University of São Paulo, in the last 5 years, the average number of students per class has been 59 for the introduction to programming courses [8], which causes delayed feedback. To assist in teaching and learning how to program, several researchers propose the use of visual programming [9], [10] and automatic evaluation systems [11]. With visual programming, students use flowcharts, programming structures blocks, and other visual aids to assist in the algorithm construction process. Automatic evaluation systems give immediate feedback to students about whether their algorithms or programs are working properly. Without such automation, this feedback would be expensive and time-consuming with large classes and many exercises. The goal of this paper is to understand the difficulties perceived by students from a STEM course in learning how to program using visual programming and automated evaluation. These techniques were applied in course for astronomy and geophysics majors. The first research question that guided our study is RQ1: How do students perceive the use of visual programming and automated evaluation? This study was conducted in the second semester of 2015. The class had 46 enrolled students, with 35 effective students going to classes. Of these, 10 (28.6% of the effective) were approved and 9 (25.7%) took the recovery test. Thus, 44.7% of the students failed, even with the use of the visual programming and automatic evaluation techniques. Given this result, we decided to deepen the study, seeking to better understand the difficulties faced by programming students from STEM courses, what strategies they adopted to overcome them and how they use the tools for their studies. Thus, a second research question emerged to guide the second phase of our study: RQ2: What are student’s difficulties, and what strategies do they adopt to overcome them? This second phase was conducted specifically with the students that were not approved in the regular timing. This article contributes to the literature the elicitation of positive and negative aspects of using visual programming and automatic evaluation tools in introductory programming courses for students in STEM courses. Moreover, it also shows the difficulties and strategies used to solve them. 978-1-5090-1790-4/16/$31.00 ©2016 IEEE
Transcript of Visual programming and automatic evaluation of …gerosa/papers/07757621.pdf · Visual programming...

Visual programming and automatic evaluation ofexercises: an experience with a STEM course
Leônidas de Oliveira BrandãoInstitute of Mathematics and Statistics
University of São Paulo, USPSão Paulo – Brazil
Yorah BosseDepartment of Computing
Federal Univ. of Mato Grosso do Sul, UFMSPonta Porã – Brazil
Marco Aurélio GerosaInstitute of Mathematics and Statistics
University of São Paulo, USPSão Paulo – [email protected]
Abstract—Programming capabilities are important to the newprofessionals. Although several initiatives all over the worldhaves been proposed for teaching programming to people at alllevels. Many undergraduate students still fail in theprogramming courses. Proposed strategies have included visualprogramming and automatic evaluation of exercises.Nevertheless, there is still a lack of knowledge about students’perceived difficulties in using these strategies in practice: that is,their challenges to learning how to program. In this paper, wereport a study aimed at understanding these difficulties andstrategies in a STEM course. We used an environmentcomprising a visual programming tool to introduce algorithms,iVProg with iAssign, and the virtual programming lab (VPL) tointroduce programming in C, both with automatic assessmentintegrated to Moodle. We report quantitative and qualitativeresults and future directions. Teachers and tool designers canleverage these results to better support programming learning.
Keywords—programming; learning; novice; automaticevaluation; difficulty
I. INTRODUCTION
The software industry achieved 40.1% of the total amountof 2015 investments [1], [2], as pointed out by marketresearchers, such as MoneyTree1. However, many business failbefore reaching their potential in the market; one cause issoftware development failures [1]. Therefore, a majorchallenge for modern society is preparing new generations ofsoftware developers, which means people skilled in algorithmsand computer programming. Governments and largecompanies are attentive to promote initiatives, as in Scotland,Israel, New Zealand and South Korea [3]. These projects aimto encourage students to learn logic and programming sinceelementary school.
However, the area still faces many problems. Most evidentis the high failure rates of students in their first programmingcourse, usually during the first year of STEM (Science,Technology, Engineering, and Mathematics) courses.
This first programming course comprised about 28% offailures and dropout [4], [5]. In the University of São Paulo(USP) - Brazil, the rate of failure and dropout for the last fiveyears is about 29%. More than 25% of the students try morethan once to pass [5]. Students demonstrate difficulty inlearning a new and formal syntax and abstractions [6]. Whilethey can understand the syntax and semantics of commands,they cannot combine them into a single program [7]. Beginners
1https://www.pwcmoneytree.com/
tend to have superficial knowledge, and fail when they need toapply it [8]. Another factor that may contribute to this index isthe teacher's workload. At the University of São Paulo, in thelast 5 years, the average number of students per class has been59 for the introduction to programming courses [8], whichcauses delayed feedback.
To assist in teaching and learning how to program, severalresearchers propose the use of visual programming [9], [10]and automatic evaluation systems [11]. With visualprogramming, students use flowcharts, programming structuresblocks, and other visual aids to assist in the algorithmconstruction process. Automatic evaluation systems giveimmediate feedback to students about whether their algorithmsor programs are working properly. Without such automation,this feedback would be expensive and time-consuming withlarge classes and many exercises.
The goal of this paper is to understand the difficultiesperceived by students from a STEM course in learning how toprogram using visual programming and automated evaluation.These techniques were applied in course for astronomy andgeophysics majors. The first research question that guided ourstudy is RQ1: How do students perceive the use of visualprogramming and automated evaluation?
This study was conducted in the second semester of 2015.The class had 46 enrolled students, with 35 effective studentsgoing to classes. Of these, 10 (28.6% of the effective) wereapproved and 9 (25.7%) took the recovery test. Thus, 44.7% ofthe students failed, even with the use of the visualprogramming and automatic evaluation techniques.
Given this result, we decided to deepen the study, seekingto better understand the difficulties faced by programmingstudents from STEM courses, what strategies they adopted toovercome them and how they use the tools for their studies.Thus, a second research question emerged to guide the secondphase of our study: RQ2: What are student’s difficulties, andwhat strategies do they adopt to overcome them? This secondphase was conducted specifically with the students that werenot approved in the regular timing.
This article contributes to the literature the elicitation ofpositive and negative aspects of using visual programming andautomatic evaluation tools in introductory programmingcourses for students in STEM courses. Moreover, it also showsthe difficulties and strategies used to solve them.
978-1-5090-1790-4/16/$31.00 ©2016 IEEE

II. RELATED WORK AND TOOLS USED
A. Difficulty in learning how to program
“Programming is a complicated business” [12]. This isevidenced by the high percentage of fail presented in theIntroduction to Programming courses [4], [5]. Beaubourg andMason studied the reasons for high rates, checking, amongother factors, reduced problem resolution skills, use oflaboratories provided for homework, and students enteringdirectly into programming, without going through the analysisand design steps [13]. Initiatives to bring programming toschools help to develop skills needed for better performance. Inhis study, Hagan argues that having program experience beforestarting a programming course helps in better performance[14].
There are several skills needed to learn how to program, themore obvious being the ability to solve problems andfundamental knowledge of math. Besides these, Jenkins says itis necessary to know to use the computer to create the program,compile, test, and correct bugs [12]. However, it is fundamentalto deliver to the market professionals who have these skillsbecause “computers are useless without programs andprogrammers to develop them” [12].
Learning style and motivation are factors that influence theprocess of learning how to program [12]. Understanding theprocess of learning one’s first programming language can helpin the task of creating more effective learning environments[15], thereby reducing the difficulties encountered bybeginners. Several researchers invest time in findinginformation about these difficulties. A study shows that syntaxerror is one of the barriers to programming novices, delayingthe feedback provided to the student about the logic of the codedeveloped [16].
Ribeiro et al. investigated the differences between usingtextual and visual programming environments in theintroduction of computer programming [17]. After analyzingthe data collected from NASA TLX, activity log, and survey,they concluded that visual programming is a good model forteaching algorithms and programming.
Lahtinen et al. conducted a survey at six universities in fivecountries, showing that students are very confident inindependent studies; individualized study was found mosteffective when compared to the exercise sessions and practicalclasses. The result was the opposite when respondents wereteachers [8].
Some support programming learning systems are used bymany teachers to try to ease the difficulties faced by students.Scratch is an example of such systems. It enables the student toprogram with a visual model, presenting programming withblocks [18]. According Malan and Leitner, Scratch puts thefocus on the logical problem and not in the syntax [18]. In astudy with students from 5th grade primary school, who usedScratch, Kalelioglu and Gülbahar found that in the process ofsolving problems, half of the students had difficulties and theother not. Most tried to solve their problems in different ways[19]. Beyond Scratch, there are other systems such as Alice[20], Logo [21] , iVProg [22], among others.
B. iVProg
iVProg is an environment to support learning programmingusing the Visual Programming (VP) paradigm. This projectstarted in 2009 [23]. Figure 1 presents the main interface ofiVProg’s current version (in Java - there is another in HTML5).In the visual programming paradigm, the students mainly usethe mouse to construct the algorithm [24].
Fig. 1. The iVProg screenshot with the code for the calculation of Factorial(A). Request for a new input (B) and the results printing for previous inputs
(C).
The version of iVProg adopted is an applet Java, workingas an interactive Learning Module (iLM). An iLM is aneducational system that can be integrated with any LearningManagement System (LMS) that implements some specialcommunication functions [25]. Moodle is an example of anenvironment prepared to receive iLM [26], [27]. Furthermore,iVProg can be used as an iAssign applet and it has anautomatic evaluator system based on test cases. Basically, theoutputs generated by the algorithm built with iVProg iscompared to the outputs provided by the teacher [17]. Theteacher-author prepares a set of inputs and their correspondentoutputs. When the students submit their solution, the input setis used with the students algorithm and its outputs arecompared against the correspondent test case [17].
In a prior experiment, the use of iVProg increased thepresence in classes by more than 3.3%, and increased students’average grades by more than 0.53 points [27].
C. Virtual Programming Lab – VPL
Virtual Programming Lab (VPL) is also a Moodle plugin,developed at the University of Las Palmas Gran Canaria –ULPGC2. Its main features provide an integrated environmentto teach and learn programming, similar to iAssing/iVprog.VPL offers an editor to the learners entering their program anduse test cases to automatically validate their solutions [28]
VPL is independent of the programming language. It isonly necessary that the server provides the correspondentcompiler. The tool provides syntax highlighting for severallanguages, such as C, Java, and Python [28]. Figure 2 presents
2 Virtual Programming Lab – VPL. URL: http://vpl.dis.ulpgc.es/index.php/about
the VPL editor in a former version (this one as an applet Java).On the figure’s left side, one can see the Java editor with Ccode, and on the right side the evaluation result, indicating thepresence of 3 case tests. The immediate feedback usuallystimulates the learners to keep trying, until they reach theperfect score.
Fig. 2. VPL layout (with Java) - editor with syntax highlighting and theevaluated code.
The teacher-author can limit the time for submission ofsolutions, as well as the number of submissions for the sameexercise. Furthermore, teachers have the option to preventpasting of external texts into the editor area. Anotherinteresting VPL feature allows viewing groups of similarcodes.
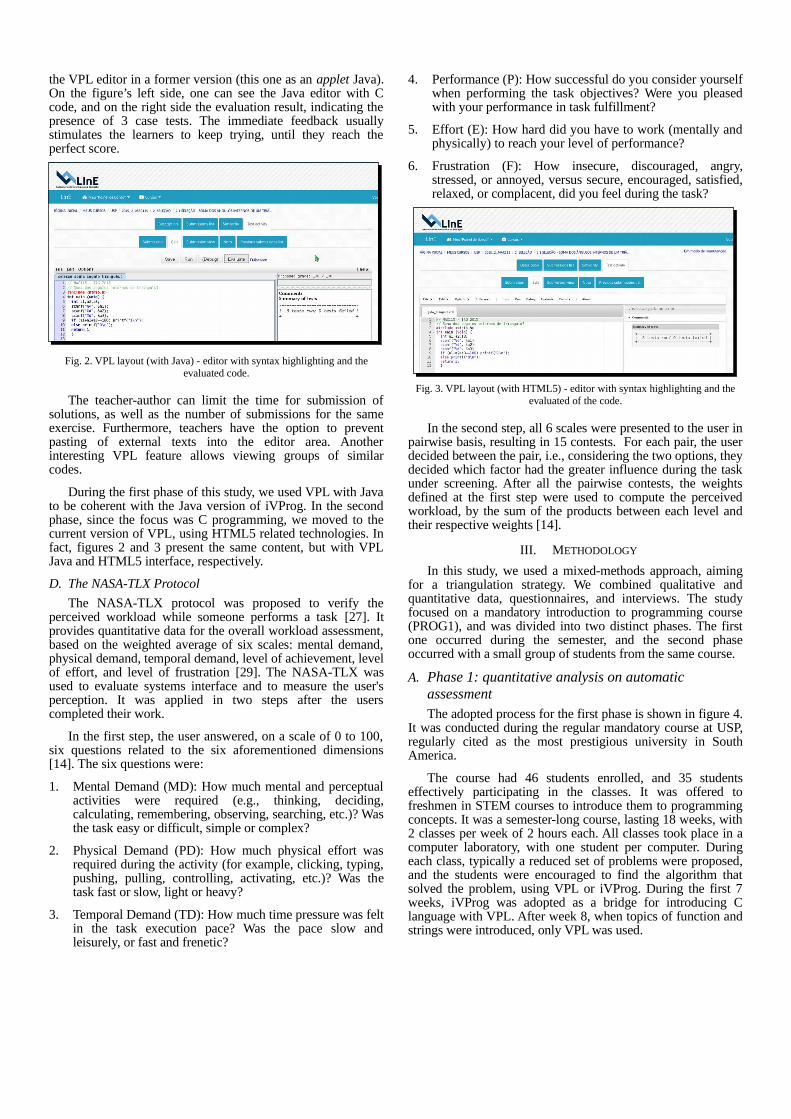
During the first phase of this study, we used VPL with Javato be coherent with the Java version of iVProg. In the secondphase, since the focus was C programming, we moved to thecurrent version of VPL, using HTML5 related technologies. Infact, figures 2 and 3 present the same content, but with VPLJava and HTML5 interface, respectively.
D. The NASA-TLX Protocol
The NASA-TLX protocol was proposed to verify theperceived workload while someone performs a task [27]. Itprovides quantitative data for the overall workload assessment,based on the weighted average of six scales: mental demand,physical demand, temporal demand, level of achievement, levelof effort, and level of frustration [29]. The NASA-TLX wasused to evaluate systems interface and to measure the user'sperception. It was applied in two steps after the userscompleted their work.
In the first step, the user answered, on a scale of 0 to 100,six questions related to the six aforementioned dimensions[14]. The six questions were:
1. Mental Demand (MD): How much mental and perceptualactivities were required (e.g., thinking, deciding,calculating, remembering, observing, searching, etc.)? Wasthe task easy or difficult, simple or complex?
2. Physical Demand (PD): How much physical effort wasrequired during the activity (for example, clicking, typing,pushing, pulling, controlling, activating, etc.)? Was thetask fast or slow, light or heavy?
3. Temporal Demand (TD): How much time pressure was feltin the task execution pace? Was the pace slow andleisurely, or fast and frenetic?
4. Performance (P): How successful do you consider yourselfwhen performing the task objectives? Were you pleasedwith your performance in task fulfillment?
5. Effort (E): How hard did you have to work (mentally andphysically) to reach your level of performance?
6. Frustration (F): How insecure, discouraged, angry,stressed, or annoyed, versus secure, encouraged, satisfied,relaxed, or complacent, did you feel during the task?
Fig. 3. VPL layout (with HTML5) - editor with syntax highlighting and theevaluated of the code.
In the second step, all 6 scales were presented to the user inpairwise basis, resulting in 15 contests. For each pair, the userdecided between the pair, i.e., considering the two options, theydecided which factor had the greater influence during the taskunder screening. After all the pairwise contests, the weightsdefined at the first step were used to compute the perceivedworkload, by the sum of the products between each level andtheir respective weights [14].
III. METHODOLOGY
In this study, we used a mixed-methods approach, aimingfor a triangulation strategy. We combined qualitative andquantitative data, questionnaires, and interviews. The studyfocused on a mandatory introduction to programming course(PROG1), and was divided into two distinct phases. The firstone occurred during the semester, and the second phaseoccurred with a small group of students from the same course.
A. Phase 1: quantitative analysis on automatic assessmentThe adopted process for the first phase is shown in figure 4.
It was conducted during the regular mandatory course at USP,regularly cited as the most prestigious university in SouthAmerica.
The course had 46 students enrolled, and 35 studentseffectively participating in the classes. It was offered tofreshmen in STEM courses to introduce them to programmingconcepts. It was a semester-long course, lasting 18 weeks, with2 classes per week of 2 hours each. All classes took place in acomputer laboratory, with one student per computer. Duringeach class, typically a reduced set of problems were proposed,and the students were encouraged to find the algorithm thatsolved the problem, using VPL or iVProg. During the first 7weeks, iVProg was adopted as a bridge for introducing Clanguage with VPL. After week 8, when topics of function andstrings were introduced, only VPL was used.

Fig 4. The first phase process.
Thirty different exercises were considered, 19 of thembeing presented twice to students: first with iVProg, then underC with the VPL. Since visual programming is considered lessdemanding to students, it was used as bridge to reduce thestudents' difficulties with the C programming language. Theseexercises were not mandatory, but aimed to stimulate them totry hard. Nevertheless, the exercises could add up to 1 point tothe student final grade.
To reduce additional cognitive workload and teacherworkload, Moodle was integrated with the plugins VPL andiAssign [28] [26]. iAssign was used with a particular iLM, theiVProg [17].
In order to better understand the students' perception whileusing iVProg and VPL, the NASA-TLX questionnaires wereapplied to assess the workload when using both iVProg andVPL. This instrument was not to be used as a comparisonbetween both technologies, since iVProg was used at first bythe students to conceive of the algorithm that solves theproblem. With this solution, they used VPL to master the Csyntax. In addition, a final questionnaire containing objectiveand open questions was used to verify the students' perceptionabout the course and the technologies used.
At the end of the semester, the students that failed, couldtake a final exam. If their grade on the exam compensated for(outweighed) the semester's failing grade, they passed. Thisrecuperation option is a common procedure in Brazilianuniversities, usually offered to any student that fails a course.
B. Phase 2: qualitative analysis on a small subsetThe intention of the second phase was the better understand
the students' difficulties in programming. It was designed as ashort course of PROG1 (8 weeks), and before this, weconducted individual interviews with a small set of students.Conveniently, we invited all the students that failed the coursePROG1 (Fig. 5).
There was no reward for students’ participation in phase 2.However, the student could be motivated to get more assistance
to eventually learn “how to program” and, perhaps, succeed onrecuperation. As a result, we achieved the consent of all 9invited students.
The individual interviews occurred before the exam. Weused the Think Aloud Protocol. According to Villanueva, thetechnique consists of observing users performing specific taskswithin a controlled environment [30]. During the interview, thestudents described aloud, in real time, what they were thinking.To capture these spoken aloud thoughts, there are two possibletechniques: (1) recording on video or (2) transcription by amoderator. Although video or audio recording has theadvantage of documenting everything that is done and said, thedisadvantage is that the user may become intimidated and notverbalize everything they are experiencing. In the case of realtime annotation, the moderator writes down everything thathappens and what the interviewed says. The advantage is thatthe environment becomes more relaxed, leading the users tofeel more comfortable exposing everything they think andknow. The disadvantage is that the speed required for suchnote-taking can lead to loss of important research information[30].
Fig. 5. The second phase process.
Genise (apud Renzi et al.) describes the protocolapplication procedure in five steps: (1) Organize a small groupof users, about 4; (2) the researcher meets these users; (3) theresearcher decides which tasks should be carried out and inwhich environment; (4) the researcher explains the method tousers by directing them to verbalize their thoughts; (5) theresearcher notifies the necessary changes in the tool [30]. Asour goal is not the tool but the difficulties of programming,step 5 does not apply to our study.
We performed the Think Aloud interview session with therecording process, and asked the students to solve fourexercises with different degrees of difficulty in VPL with Clanguage. Each interview lasted about one hour, and thestudents were encouraged to talk constantly about what theywere doing and thinking. During the process, the moderatorasked a few questions, such as “What do you think aboutusing the VPL in class?”, in order to seek information beyondwhat the students spontaneously exposed.

The next step in the second phase was the short course,which used the same environment from the semester classes,but with an updated VPL version. In the version used duringthe semester, students faced a lot of problems setting up Javaon their computers. With HTML5, it is not necessary to installanything in the students’ computers.
Every two weeks in this short course, students received aset of exercises to solve. Each set of exercises increased indegree of difficulty. In addition to solving the exercises usingVPL, the students made free record of this process in a textdocument. After solving each set of exercises, there was aface-to-face meeting where doubts were clarified.
IV. MAIN RESULTS
We conducted a two-phase study, the first involving allstudents from the class, and the second involving only thestudents that had failed during the semester. In the first phase,we used quantitative instruments, whereas the second focusedon qualitative analysis.
The research questions for this paper were “RQ1 – How dostudents perceive the use of visual programming and automatedevaluation?” and “RQ2 - What are student’s difficulties, andwhat strategies do they adopt to overcome them?”. To show theresults, we created sub-research questions, as follows.
A. RQ1a – What benefits and difficulties do studentsperceive regarding the use of iVProg and VPL?At the end of PROG1 in the second half of 2015, the
teacher asked students to answer a questionnaire with sevenquestions, designated herein as the Final Questionnaire.Questions can be divided into objective (the first four) anddiscursive (the remaining).
The objective questions obtained 100% of responses.Some results from the answers are that 65% of respondentshad taken this course before, even partially, and had not beenapproved. When asked about their preferences concerningclasses in the laboratory, 47% said they most liked whenclasses take place in a laboratory setting.
Another question checked if the students liked theindividual class activities of solving exercises in the laboratory.Furthermore, it was important to have feedback from studentsabout the number of questions provided for them. The answersshowed that 53% enjoyed solving exercises in class, (Fig 6.),and the same amount considered the amount of exercisesappropriate (Fig. 7). As previously stated, the course lasts forone semester, with 18 weeks and it was used 49 exercises, 19of them under two different technologies, C with VPL andvisual programming with iVProg.
In the two following questions the students were asked toidentify positive and negative aspects about the use ofautomatic evaluation systems such as iVProg and VPL. Theanswers are compiled in TABLE I. Three students from 16declared "I do not see negatives aspects"s1, s2, s3.
At the end of the questionnaire, we asked the students forsuggestions, criticism, and praise for the semester class, usingan automatic evaluation system. Some students praised theclass model, stating sentences like “I loved doing the course inthis model”a9, “I loved having a practical class, I believe thatfor a computer course, it is essential”a6 and “I liked the way the
course was given a lot, the automatic evaluator, the fact ofbeing online, the iVProg, etc.”a7. A suggestion given bystudents was to switch between practical and theoreticalclasses, stating phrases such as "take turns betweenconventional classes and the computer"a4 and “as all classeswere practical, I missed introductory lectures”a6. The studentsasked for “more exercises available to be done at home beforethe assessments.”a3.
Fig. 6. Solve exercise during class.
Fig. 7. Evaluation as the amount of exercises available to students.
Wanting to gather more information about the students andtheir behavior during the studies, using the Think Aloudmethod we conducted interviews with six students, lastingabout one hour each. The students invited to participate in theseinterviews were in the same situation: they did not succeedduring the semester, and needed to take the recovery test to beapproved. During the interviews, they were challenged to solvefour exercises with increasing degree of difficulty. Theirinterview session was documented, including the computerscreen and audio recordings, for future analysis. In this report,the students are numbered from 1 to 6.

TABLE I. POSITIVES AND NEGATIVES ASPECTS IN USE AN AUTOMATICEVALUATION
Positives Aspects Negatives AspectsPresentation of results throughthe test cases lets you know ifyour code is working correctly s8,
s11
Dependence on compilations4, s5, s6 and of the results ofthe test cases s6, making thestudent does not look forerrors alone s5
Easy to view the syntax errors s1,
s9
Missed print messages /instructions to users s7, s8
Immediate feedback to thestudent s2, s6
Show that the automaticevaluation has flaws s9, s10
Saving time for solving exercisess3
Inhibits the practice of howto test the algorithm s11
It gives an idea of your notethrough the percentage ofcorrect answers of the exercisess3
Easy to correct s1
One of the observed attitudes, adopted by 2 of the students,was to take notes while they read the statements (student 1 and3). These 2 had no better results than the others, but one ofthem, when asked by the interview moderator, stated“annotating helps to remember what needs to be done, becauseotherwise I cannot remember”. Analyzing the behavior ofrespondents while running the session, we observed that thisannotation process helped, for example, in the definition ofwhich and how many variables were required to solve the task.One difference between these students and the others was thatthey had less mistakes in declaring the variables and settingtheir types; they practically did not need to return to the code tochange what they had written.
The interview moderator observed in two students areaction while reading the statement. Student 6 had not read theentire statement when he stopped reading to make the comment“I get nervous when I see the word matrix.” Student 1, whenstarting to read the second question, spoke instantly “I do notlike function” and “I have difficulty with function parameters.”During question 6, student 1 said “At a first glance I dislike thisexercise, I like exercises that have numbers.” In these threesituations, the students did not succeed in solving the exercise.This may be a sign that the students create a barrier to thecontent for which they face more difficulty.
We also noticed insecurity in students and some degree ofabsence of thinking. They were used to copying and pasting thecode to read matrix elements, but when faced with compilationerrors, they made comments like “We will see now. Must besomething wrong. There is always something wrong.” Themoderator noted that the commands to which they referredwere correctly written, but with undeclared names. Moreover,in some instances, the students faced problems with intentionand practice. They verbalized something, but wrote somethingdifferent. This situation was detected during interviews, andcan be observed through the comments “I do not know if it'slike this to read an array, but okay,”a1 and “I think something ismissing in this print”a6.
Syntax errors were common in all interviews andresolutions, e.g. opening and closing structures with brackets,
colons, correct spelling of the commands, among others. Someerrors are noteworthy, such as: (A) attempting to read the datain the matrix; (B) creating an unnamed function, besides theincorrect declaration of the variables to receive the parameters,and (C) semi-colons ending a structure of repetition andselection that has not even started (Fig. 8).
Fig. 8. Less common syntax errors.
When semantic errors occurred, students usually becamemore disappointed than with syntax errors. With syntax errors,they seem more accustomed. The semantic errors madestudents drop out of the exercise faster, because this is naturallymore difficult, which they already realized (facing more time tofix semantic errors).
B. RQ1b – What is the perceived effort by the student? The NASA-TLX were applied at the end of the first block
of activities using iVProg and after VPL. The questionnaireevaluated the students’ perceptions of workload concerning 4elementary exercises (related to input-output, comparison, andoperation with the rest of the integer division).
It is worth remembering that the activities were firstreleased for iVProg, and then for VPL. Figure 9 presents theNASA-TLX for iVProg, and Fig. 10 shows the results to VPL.Note that, despite iVProg being used first, the mental demand(MD) for it was smaller than using C language with VPL.
Fig. 9. NASA-TLX for the first block of activities with iVProg.

Fig. 10. NASA-TLX for the first block of activities using VPL with Clanguage
Automatic evaluations
We divided the course into 6 sections, each with a numberof exercises. During the first 9 weeks, the students werechallenged with solving a set of activities (solving a problemwith an algorithm) first using iVProg, then with C, for the sameproblem.
These programming activities had a small impact on thefinal grade, up to 10% of the student’s final grade. Theseexercises were proposed to stimulate students to solve a largenumber of exercises. We used 17 iVProg exercises and 28 ofVPL/C (the first 17 of VPL were the same 17 of iVProg).
The number of answers for VPL was 531, but someactivities had more than 50 submissions for the same exercise,from several students. For iVProg, there were 197 submissions.
Since iVProg was used as a bridge to introduce C, wefocused this analysis in VPL/C. We tested the correlationbetween several measures, considering student performance inVPL activities, compared to their final situation (approved,fail, final grade). The activities measures were (TABLE II. ):the number of activities with maximum score (N10); thenumber of activities with minimum grade (N0); and thenumber of activities with minimum grade for compilationerrors (NC). The student situation was: student approval (1) orfail (0) (AP); student final grade, where 5, or more, meansapproved (FG).
TABLE II. FINAL SITUATION TO EACH STUDENT IN THE COURSE
Student N10 N0 NC AP FG
1 13 0 0 0 0
2 3 2 2 0 1.01
3 11 0 0 1 5.87
4 26 0 0 1 7.52
5 18 0 0 1 9.81
6 10 0 1 0 0.31
7 16 2 0 0 4.21
8 15 0 0 0 0
9 22 0 1 1 5.56
10 22 1 0 1 9.41
11 14 2 3 0 0.73
Student N10 N0 NC AP FG
12 16 0 0 0 4.17
13 9 0 1 0 0
14 13 2 0 0 0.36
15 0 0 2 0 0
16 18 3 2 0 2.92
17 14 0 0 1 5.45
18 6 0 0 0 0
19 0 0 0 0 1.23
20 9 0 0 1 8.28
21 0 0 1 0 0
22 15 0 0 0 4.15
23 21 2 1 1 6.21
24 18 0 2 0 3.41
25 15 0 0 0 4.64
26 15 0 3 0 2.05
27 2 0 0 0 0
28 5 4 1 0 4.39
29 15 0 0 1 7.76
30 5 1 0 0 0
31 10 3 3 0 3.61
32 14 2 3 0 1.3
33 21 0 0 0 1.21
34 5 0 1 0 0
35 26 0 0 1 7.98
C. RQ2a – What are the difficulties in programminglearning using iVProg and VPL? The short course lasted 8 weeks. The average number of
submissions per exercise was 7, and 84% of them had 100%success in the test cases analyzed by the system. The studentssubmitted twice on average until their code was compiled, andthree times until correct results began to appear.
During the analysis of the code, some syntax (TABLE III. )and semantics (TABLE IV. ) errors were detected. In thispaper, we show errors that appeared more than once.
We also noticed syntax errors in which we observe that thestudent was using mathematical commands in the code, such asthe use of point instead of an asterisk for multiplication andwriting condition as follows: "(600 <x <= 1200)" instead of"(x> 600 && x <= 1200)."
TABLE III. SYNTAX ERROR
Amount Description7
Not opened with "{" and closed with "}" any structure or function
3Error in the formatting of the number of decimal places in a float
3 Use of undeclared variables2 Forgot ";" on some lines
2In the statement of the float type variables, separatedthe names with ";" and not ","
2Do not separate the variables with comma within the parentheses of the scanf
2 Use comma rather than dot on real numbers.

TABLE IV. SEMANTIC ERRORS
Amount Description9 They did not pay attention in division by 0 (zero)5 Control variable from "while" not initialized4 Wrong formula2 If..else structure mounted incorrectly2 Used "return" to show -1 instead of printf: return "-1"
These are problems that make the program less effective,such as not using "else" in the selection structures "if." Thisproblem was noticed 11 times, i.e. a high number compared toother problems. Other mistakes include loading unnecessarylibraries and lack of indentation.
D. RQ2b – What study strategies do students use? When students encounter difficulties during their studies
and cannot proceed, they seek help from a classmate or friendwho knows the subject, or seek content from the internet, orsimilar examples of exercises that they are solving.
Another students’ strategy to solve problems was to dividethe code into small portions and check each one, trying toidentify where the error was located.
E. RQ2c – How have they used the tools? Students who participated in the short course reported that
the use of iVProg was very helpful to begin developing logicalthinking, and that continued use of this tool would beinteresting. VPL plays an IDE role. Providing information onsyntax errors shows the student that there are also semanticerrors.
Students said the results of the test cases pointed out byVPL helped to find semantic errors, which they unanimouslyconsidered the most difficult errors to detect and resolve. Testcases, according the students, were not completely analyzed, attimes were analyzed only those by accused of error and othersonly by those who have succeeded. How to use the test cases tohelp resolve the errors would be a good exercise to performwith the students.
V. CONCLUSION AND FUTURE WORKS
In this study, we observed that students see value inautomatic evaluation, even considering students that alreadyhad failed in the programming course. In addition, the systemwith automatic evaluation enabled the teacher to identifystudents with low participation levels. We found correlationbetween the number of correct exercises and overall courseapproval.
For the teacher, it became possible to present a greaternumber of exercises. However, this presents a challenge forusing these tools with a large number of students. Perhaps itcould be used with exercises, but not in formal evaluation thatdemands the presence of the student. This is now underinvestigation. About the preparation of the exercises for thestudents, one difficulty faced by us is how to create good testcases. The first condition is that it test all the important cases,like a sorting problem the presence of unitary sequence,increasing sequence, and decreasing sequence.
In our research, we found that the students approved tolearn programing using automated evaluation with iVProg and
VPL as well as visual programming with iVProg. However, adifficulty mentioned by students is the reduced number oftheoretical classes and one suggestion is to take turns betweenconventional classes and in the laboratory. About using iVProgand VPL, various positives aspects was cited by the studentsand fewer negatives points. In the same time, that knows if thecode working correctly with the presentation of the results oftest cases, the use of this systems create a dependence makingthe student does not look for error alone.
About difficulties and strategies, we find that take noteduring the studies help learners to organize their ideas such asthe amount and types of variables needed to solve the problem.Semantics errors are considered by students most difficult tosolve than syntax errors. To help them in their studies, whenthey don't can proceed, they ask classmates, friends or demandfor similar exercises on the internet.
It is worthy to note that automatic evaluation can promotean important aspect: allow to challenge students with newproblems.
This study pointed some new questions that we areconsidering as future studies. One of them is to deeper thecomparison study presented by Ribeiro et al [16]. This papercompared visual and textual programming, mainly consideringthe cognitive workload. It would be interesting to create a newmethod to compare the final skill of the students to solveproblems by algorithms after a course of each model ofprogramming.
ACKNOWLEDGMENTS
The authors would like to thank all students that participatein this study for their involvement. This work is partiallysupported by grant of São Paulo Research Foundation(FAPESP).
REFERENCES
[1] M. Crowne, “Why software product startups fail and what to do
about it. Evolution of software product development in startup
companies,” in IEEE International Engineering Management
Conference, 2002, vol. 1, pp. 338–343.
[2] T. Reuters, “MoneyTree Report - Q4 2015/Full Year 2015
Summary,” 2016. Online at https://www.pwcmoneytree.com.
[3] S. P. Jones, “Computing at School International comparisons,”
Retrieved May, no. November, pp. 1–12, 2011.
[4] J. Bennedsen and M. E. Caspersen, “Failure rates in introductory
programming,” ACM SIGCSE Bull., vol. 39, no. 2, p. 32, 2007.
[5] Y. Bosse and M. A. Gerosa, “Reprovações e Trancamentos nas
Disciplinas de Introdução à Programação da Universidade de São
Paulo : Um Estudo Preliminar,” Work. sobre Educ. em Comput.
(WEI), pp. 1–10, 2015.
[6] C. M. Lewis, “How Programming Environment Shapes Perception,
Learning and Goals: Logo vs . Scratch,” Sigcse ’10, pp. 346–350,
2010.
[7] L. E. Winslow, “Programming Pedagogy - A Psychological
Overview,” ACM SIGCSE Bull., vol. 28, no. 3, pp. 17–22, 1996.
[8] E. Lahtinen, K. Ala-Mutka, and H.-M. Järvinen, “A study of the
difficulties of novice programmers,” ACM SIGCSE Bull., vol. 37,
no. 3, p. 14, 2005.
[9] M. C. Carlisle, T. A. Wilson, J. W. Humphries, and S. M. Hadfield,
“RAPTOR: Introducing Programming to Non-Majors with
Flowcharts,” J. Comput. Sci. Coll., vol. 19, no. 4, pp. 52–60, 2004.
[10] M. Kölling, “Greenfoot - A Highly Graphical IDE for Learning
Object-Oriented Programming,” ACM SIGCSE Bull., vol. 13, no. 4,
p. 60558, 2008.
[11] C. Reade, “A System for Automatic Evaluation of Programs for
Correctness and Performance,” Web Information Systems and
Technologies, 1997.
[12] T. Jenkins, “On the Difficulty of Learning to Program,” ICS - Int.
Conf. Supercomput., 2002.
[13] T. Beaubouef and J. Mason, “Why the high attrition rate for
computer science students,” ACM SIGCSE Bull., vol. 37, no. 2, p.
103, 2005.
[14] D. Hagan and S. Markham, “Does it help to have some
programming experience before beginning a computing degree
program?,” ACM SIGCSE Bull., vol. 32, no. 3, pp. 25–28, 2000.
[15] S. Garner, P. Haden, and A. Robins, “My program is correct but it
doesn’t run: A preliminary investigation of novice programmers'
problems,” Conf. Res. Pract. Inf. Technol. Ser., vol. 42, pp. 173–
180, 2005.
[16] P. Denny, A. Luxton-Reilly, E. Tempero, and J. Hendrickx,
“Understanding the syntax barrier for novices,” Proc. 16th ACM
Conf. Innov. Technol. Comput. Sci. Educ. - ITiCSE ’11, p. 208, 2011.
[17] R. S. Ribeiro, L. O. Brandão, T. V. M. Faria, and A. A. F. Brandão,
“Programming web-course analysis: how to introduce computer
programming?,” ASEE/IEEE Frontiers in Education Conference
(FIE), 2014, pp. 1–8.
[18] D. J. Malan and H. H. Leitner, “Scratch for budding computer
scientists,” ACM SIGCSE Bull., vol. 39, p. 223, 2007.
[19] F. Kalelioğlu and Y. Gülbahar, “The Effects of Teaching
Programming via Scratch on Problem Solving Skills: A Discussion
from Learners’Perspective,” Informatics Educ. Int. J., vol. 13, no. 1,
pp. 33–50, 2014.
[20] S. Cooper, W. Dann, and R. Pausch, “Alice: a 3-D tool for
introductory programming concepts,” J. Comput. Sci. Coll., vol. 15
no. May 2000, pp. 107–116, 2000.
[21] S. Papert, “Mindstorms: Children, Computers and Powerful Ideas”.
Basic Books, Inc. New York, NY, USA, 1980.
[22] L. O. Brandão, R. S. Ribeiro, and A. A. F. Brandão, “A system to
help teaching and learning algorithms,” ASEE/IEEE Frontiers in
Education Conference (FIE), 2012, pp. 1–6..
[23] R. R. Kamiya and L. O. Brandão, “iVProg - um sistema para
introdução à Programação através de um modelo Visual na
Internet,” XX Simpósio Bras. Informática na Educ., 2009.
[24] E. P. Glinert and S. L. Tanimoto, “Pict: An Interactive Graphical
Programming Environment,” Computer (Long. Beach. Calif)., vol.
17, no. 11, pp. 7–25, Nov. 1984.
[25] J. G. Moura, L. O. Brandão, and A. A. F. Brandão, “A web-based
learning management system with automatic assessment resources,”
ASEE/IEEE Frontiers in Education Conference (FIE), 2007, pp.
F2D–1–F2D–6.
[26] P. A. Rodrigues, L. O. Brandão, and A. A. F. Brandão, “Interactive
Assignment: A moodle component to enrich the learning process,”
ASEE/IEEE Frontiers in Education Conference (FIE), pp. 1–6,
2010.
[27] R. S. Ribeiro, “Construção e uso de ambiente visual para o ensino
de programação introdutória,” Doctoral dissertation, Universidade
de São Paulo, 2015.
[28] J. C. Rodríguez-del-Pino, E. Rubio-Royo, and Z. Hernández-
Figueroa, “A Virtual Programming Lab for Moodle with automatic
assessment and anti-plagiarism features,” Conf. e-Learning, e-
Business, Entrep. Inf. Syst. e-Government, 2012.
[29] B. M. Guimarães, L. B. Martins, L. S. Azevedo, and M. D. A.
Andrade, “Análise da carga de trabalho de analistas de sistemas e
dos distúrbios osteomusculares,” Fisioter. em Mov., vol. 24, no. 1,
pp. 115–124, 2011.
[30] A. B. Renzi, S. Freitas, I. Kuhn, and S. Köhler, “Use of Think-
Aloud Protocol to Verify Usability Problems and Flow During Use
of Entertainment and Personal Journal,” in 12o Congresso
Internacional de Ergonomia e Usabilidade de Interfaces Humano-
Computador, 2012, p. 7.