


Visual Management & 5S - ADDVALUE - Nilesh Arora
38
Best Performing Consulting Organization by “TFM / Visual Management” Adding Value In Totality !!
-
Upload
nileshrarora -
Category
Documents
-
view
63 -
download
7
description
Understand the ideas, goals of Lean Visual Management & 5S. The 4 Phases to Visual Management explained by Nilesh Arora, a founder of AddValue Consulting Inc. - PowerPoint PPT Presentation
Transcript of Visual Management & 5S - ADDVALUE - Nilesh Arora
Best Performing Consulting Organization
by
“TFM / Visual Management”
Adding Value In Totality !!

Visual Management
• Visual management is a workplace that is a self-ordering, self-explaining, self-regulating and self-improving environment where what is suppose to happen does, on time, every time because of visual solutions
What gets measured & displayed gets done• It makes it easy to understand the processes which have been
put into place Basic types1. Shadow boards2. Indicators on various items e.g. gauges3. Heijunka boards – showing the status of daily schedules4. Design pull systems (Kanban)

Visual Management Goals
• Make everyone’s job easier• Give all associates a high degree of ownership in
their work, and pride in their workplace• Increase communication by making information
easier to understand• Improve company overall success

DisplaysTo make staff aware of related data and information – charts, graphs etc
ControlsTo guide the action of staff members – sign boards, dos and don’ts signs
Two Tools of Visual Management

Benefits
• Leads to information sharing.• Facilitates worker autonomy.• Supports elimination of waste.• Continuous improvement.• Exposes abnormalities.• Enables quick response & recovery.• Promotes prevention.

3 BASIC STEPS REQUIRED
• There are three basic steps:1) Organise the workplace using 5S2) Ensure that all required work standards, instruction and
related information are clearly displayed in workplace3) Control workplace processes by exposing and stopping
errors and by preventing future occurrences
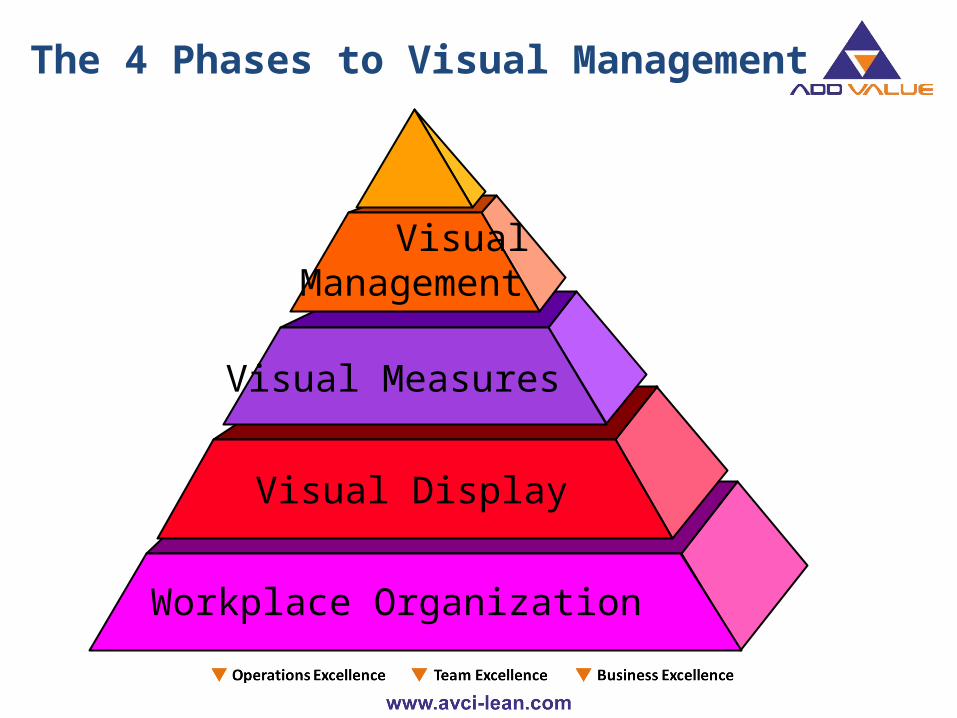
The 4 Phases to Visual Management
Workplace Organization
Visual Display
Visual Measures
VisualManagement

1. Workplace Organization• Includes implementing 5S in an organization
S 5SSSSS

SIERI
Name:
Date: Removal Date
Location:
Reason for X-Tag:
RED TAG Area

SeiketsuA Place For Everything
• Even rags, gloves, and trash

Shitsuke 1/3Visual Ranges Make It Easier
to Sustain
CATEGORY ITEM Yes No OBSERVATIONSHave unnecessary items been X-tagged?Are items neatly arranged?Are walkways/work areas clearly outlined?Are designated areas marked for incoming material?
SORT Are materials located in designated areas?(Organization) Are designated areas marked for outgoing material?
Is outgoing material located in designated area?Are information boards orderly?Is indicated information found?Is information current?Do excess materials have a specific location?Are excess materials in their location?Is there a place for everything?Is everything in its place?
STABALIZE Is it easy to see what belongs where?(Orderliness) Are things put away after use?
Are tools organized and located in specific place?Are only red containers being used for scrap?Is rejected material properly identified?Is rejected material stored in a designated area?Is process scrap located in separate containers?Is defective material located in separate containers?Are sort and stabilize complete?Are work areas clean?Are aisles clear?Are tools clean?Is any material found on the floor?Is equipment clean?
SHINE Do machines show evidence of old oil leaks?(Cleanliness) Is cell inventory correctly identified?
5S checklist

Shitsuke 2/3
Visual Ranges Make It Easier to Sustain

2. Visual DisplayA method to visually communicate important information in the workplaceInformation regarding:• How to do the job (SOP)• Show how things are used• Show where things are stored• Show performance status• Identify hazardous areas

This location is exclusively forfire safety
Components Kanban: What, Where, and How many
Visual Display

Preventive Maintenance through Visual Management

SMED trolley contains all the tools required to perform quick changeover. SMED trolley has been parked only in the right area
Responsibility has been assigned to
Shift Fitter

Product Display Example
Sample
assemblies
are added
to display
every 2 hours
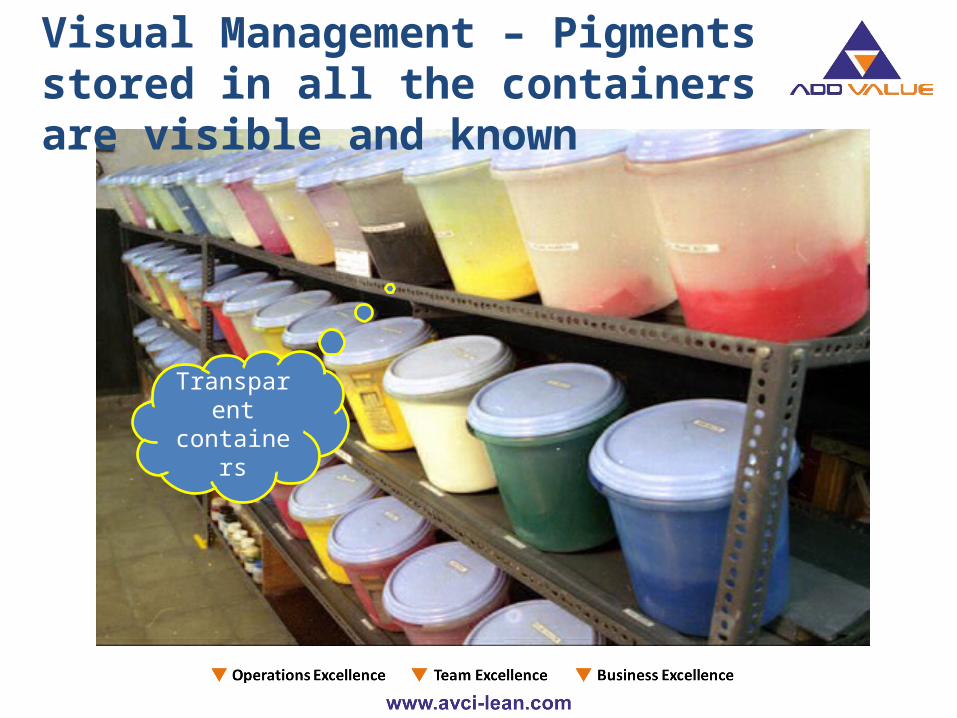
Visual Management – Pigments stored in all the containers are visible and known
Transparent containers
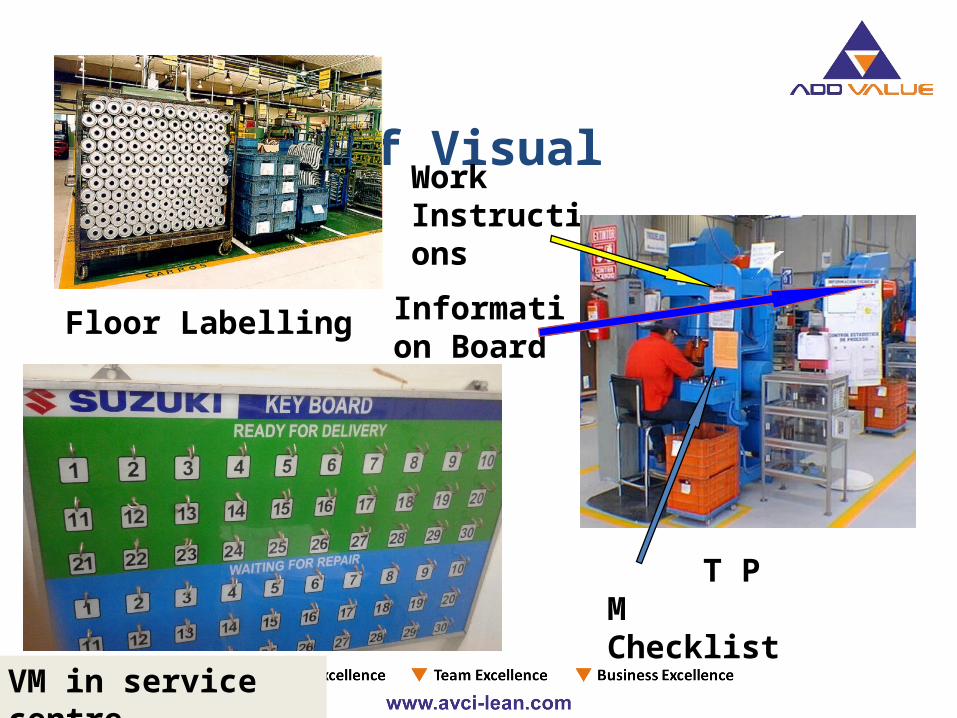
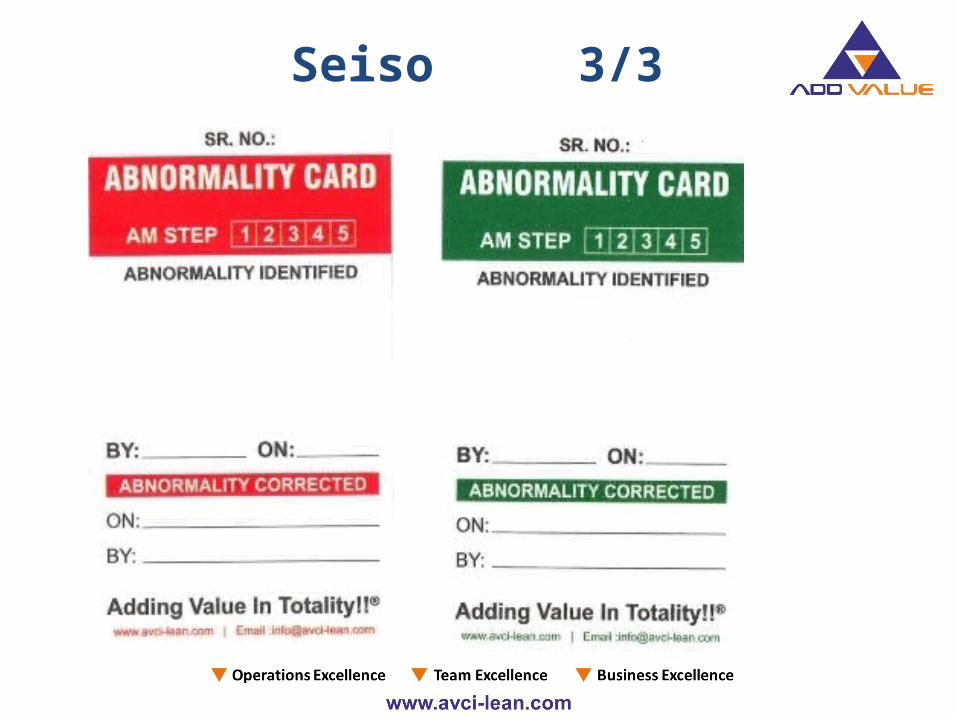
Example of Visual Management
Floor Labelling
Work Instructions
Information Board
T P M Checklist
VM in service centre

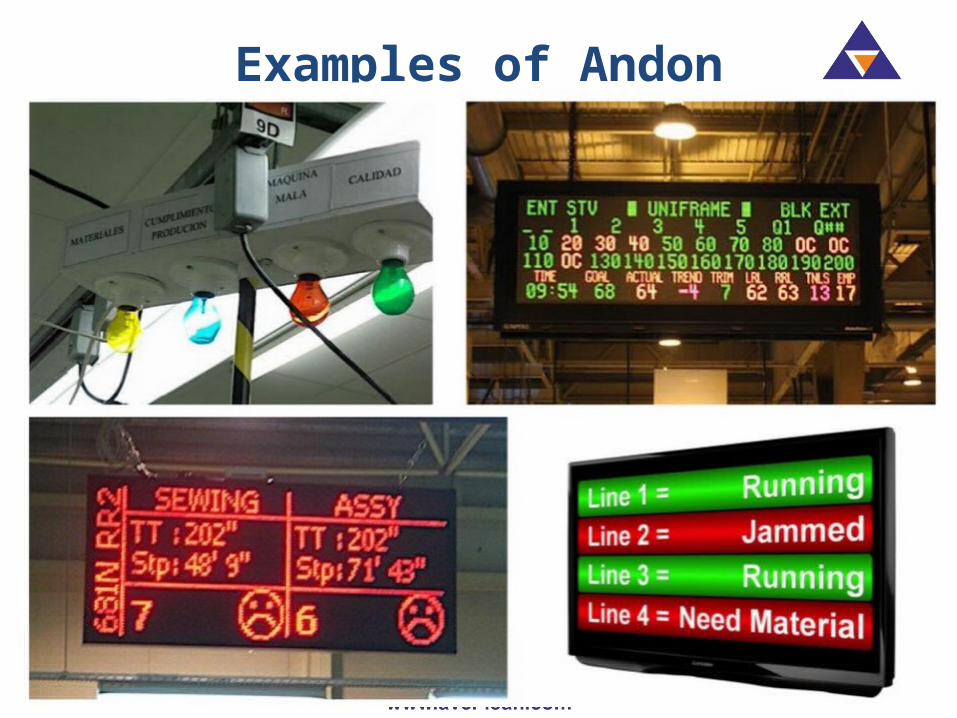
3. Visual Measure
To develop Visual Measures decide . . .
• What needs to be measured ?
• Who is the user / audience ?
• How often do we take the data ?
• Who will do the tracking ?
• How will we display data so that it speaks ?
• Where do we best locate the display ?
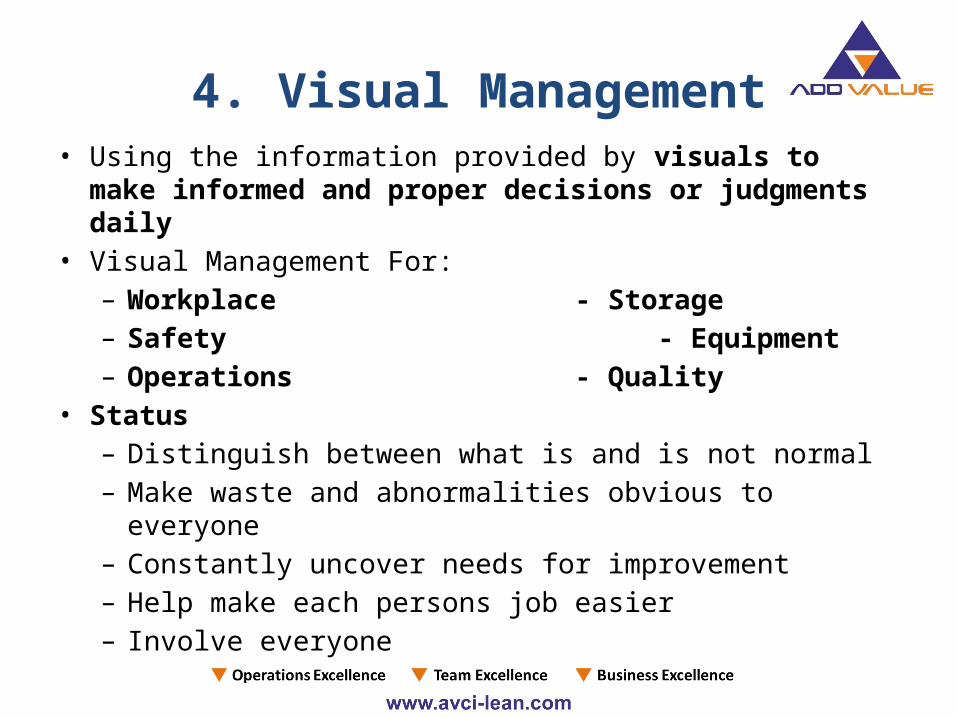
4. Visual Management• Using the information provided by visuals to make informed
and proper decisions or judgments daily• Visual Management For:
– Workplace - Storage– Safety - Equipment– Operations - Quality
• Status– Distinguish between what is and is not normal– Make waste and abnormalities obvious to everyone– Constantly uncover needs for improvement– Help make each persons job easier– Involve everyone

Are WE Hitting the Target?
Do Our Visuals:
• Give you the information needed to make proper decisions?
• Make abnormalities and problems obvious?
• Promote communication and employee involvement?
• Make everyone's jobs easier?• Recognize achievements and
improvements?
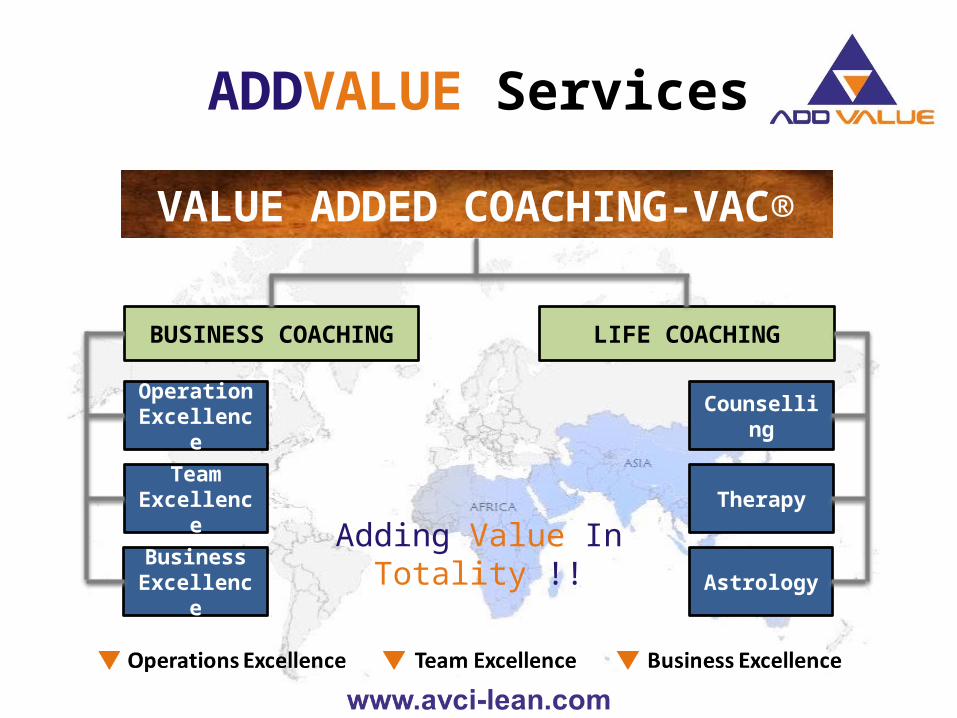
ADDVALUE Services
VALUE ADDED COACHING-VAC®
BUSINESS COACHING
LIFE COACHING
OperationExcellenc
e
TeamExcellenc
e
BusinessExcellenc
e
Counselling
Therapy
Astrology
Adding Value In Totality !!

Best Performing Consulting Organization
AddValue at a glance
Business Coaching Life Coaching

Thank You