VISION...VISION: “To be the leader in the sustainable supply of water in the region.” MISSION:...
276
INTEGRATED ANNUAL REPORT 2015-2016
Transcript of VISION...VISION: “To be the leader in the sustainable supply of water in the region.” MISSION:...
INTEGRATED ANNUAL REPORT 2015-2016

V I S I O N :
“To be the leader in the sustainable supply of water in the region.”
M I S S I O N : “Our mission is to facilitate water security through the planning, financing and implementation of bulk raw
water infrastructure, in the most cost-effective manner that benefits water consumers.”
V A L U E S :
Excellence, Integrity and Respect for one another, whilst promoting Unity of Purpose
and the Growth of the Collective.
“Water is the anchor to life and the economy, TCTA is the anchor
behind its sustainable supply”

STATEMENT BY THE MINISTER OF WATER AND SANITATION
CHAIRPERSON’S FOREWORD AND BOARD COMMITMENT
ABOUT THE INTEGRATED ANNUAL REPORT
PART A: GENERAL INFORMATION
PART B: PERFORMANCE INFORMATION
PART C: SUSTAINABILITY AND TRANSFORMATION
PART D: GOVERNANCE
PART E: INFORMATION AND COMMUNICATION TECHNOLOGY
PART F: FINANCIAL INFORMATION (INCLUDING AUDITORS AND AUDIT COMMITTEE REPORT)
PART G: GLOBAL REPORTING INITIATIVE CONTENT INDEX
2
4
7
8
30
46
66
82
88
260
2
GENERAL INFORMATION
INTEGRATED ANNUAL REPORT 2015-2016
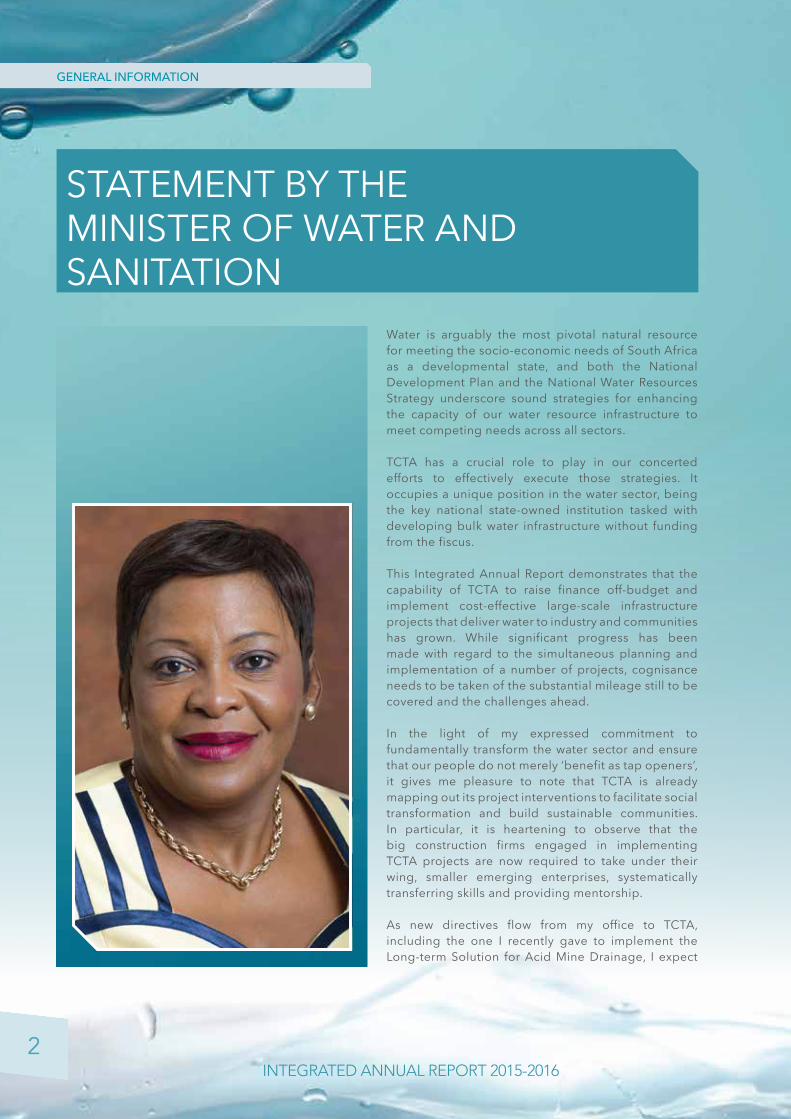
STATEMENT BY THE MINISTER OF WATER AND SANITATION
Water is arguably the most pivotal natural resource for meeting the socio-economic needs of South Africa as a developmental state, and both the National Development Plan and the National Water Resources Strategy underscore sound strategies for enhancing the capacity of our water resource infrastructure to meet competing needs across all sectors.
TCTA has a crucial role to play in our concerted efforts to effectively execute those strategies. It occupies a unique position in the water sector, being the key national state-owned institution tasked with developing bulk water infrastructure without funding from the fiscus.
This Integrated Annual Report demonstrates that the capability of TCTA to raise finance off-budget and implement cost-effective large-scale infrastructure projects that deliver water to industry and communities has grown. While significant progress has been made with regard to the simultaneous planning and implementation of a number of projects, cognisance needs to be taken of the substantial mileage still to be covered and the challenges ahead.
In the light of my expressed commitment to fundamentally transform the water sector and ensure that our people do not merely ‘benefit as tap openers’, it gives me pleasure to note that TCTA is already mapping out its project interventions to facilitate social transformation and build sustainable communities. In particular, it is heartening to observe that the big construction firms engaged in implementing TCTA projects are now required to take under their wing, smaller emerging enterprises, systematically transferring skills and providing mentorship.
As new directives flow from my office to TCTA, including the one I recently gave to implement the Long-term Solution for Acid Mine Drainage, I expect
3 INTEGRATED ANNUAL REPORT 2015-2016
to see an even more influential project trajectory in transformative socio-economic development. Such move should increasingly position TCTA as a stronger catalyst for change in project communities, providing developmental business access for micro, small and medium-size enterprises in the course of planning and developing large-scale infrastructure, and facilitating employment opportunities and skills development to improve entrepreneurial ability.
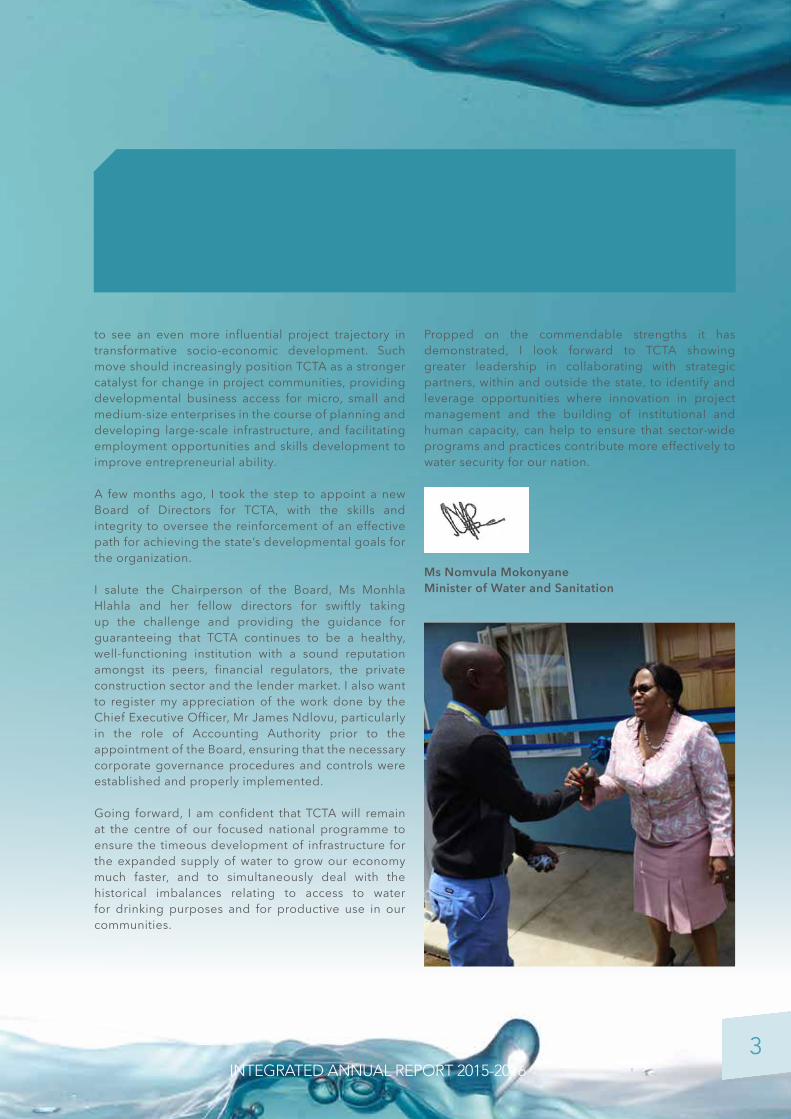
A few months ago, I took the step to appoint a new Board of Directors for TCTA, with the skills and integrity to oversee the reinforcement of an effective path for achieving the state’s developmental goals for the organization.
I salute the Chairperson of the Board, Ms Monhla Hlahla and her fellow directors for swiftly taking up the challenge and providing the guidance for guaranteeing that TCTA continues to be a healthy, well-functioning institution with a sound reputation amongst its peers, financial regulators, the private construction sector and the lender market. I also want to register my appreciation of the work done by the Chief Executive Officer, Mr James Ndlovu, particularly in the role of Accounting Authority prior to the appointment of the Board, ensuring that the necessary corporate governance procedures and controls were established and properly implemented.
Going forward, I am confident that TCTA will remain at the centre of our focused national programme to ensure the timeous development of infrastructure for the expanded supply of water to grow our economy much faster, and to simultaneously deal with the historical imbalances relating to access to water for drinking purposes and for productive use in our communities.
Propped on the commendable strengths it has demonstrated, I look forward to TCTA showing greater leadership in collaborating with strategic partners, within and outside the state, to identify and leverage opportunities where innovation in project management and the building of institutional and human capacity, can help to ensure that sector-wide programs and practices contribute more effectively to water security for our nation.
Ms Nomvula MokonyaneMinister of Water and Sanitation

4
GENERAL INFORMATION
INTEGRATED ANNUAL REPORT 2015-2016
CHAIRPERSON’S FOREWORD AND BOARD COMMITMENT
Our Board of Directors, was appointed in December 2015, thus leaving us with an effective one board meeting to acquaint ourselves with the business of TCTA and to close the financial year ending 31 March 2016. We have, therefore, utilised this short period since February 2016, to ensure that the company meets all statutory requirements of the PFMA and the Companies Act, balanced with our directors’ fiduciary duties and the duty of care. I am, however, pleased that along with the above-mentioned priorities, we were able to establish and operationalise all key Board Committees of Audit, Risk, Human Resources as well as Governance and Sustainability. We are, therefore, confident that the next Integrated Annual Report will reflect a more informed and strategically positioned Board of Directors in alignment with our highly committed Executive Committee.
We are also pleased that the previous TCTA Board of Directors, guided by the urgent need to deploy more innovative solutions to water security for all South Africans had contributed significantly to advancing economic growth, reducing inequality and pushing back the frontiers of poverty. To continue in pursuit of these ideals, we will devote our initial energies to enhance the capacity of TCTA to act more innovatively and proactively in both its project finance and project management roles to meet the increased demand for bulk water supply for South Africa and our regional partners.
This Integrated Annual Report underscores the fact that TCTA is maturing into an organisation capable of more strategic undertakings, beyond the traditional domain of bulk raw water. The recent ministerial directive on the Long-term Solution for Acid Mine Drainage demonstrates, the unique capability of TCTA to manage complex projects across their extended life-cycle; from front-end conceptualisation and structuring involving a multiplex of stakeholders and activists, through innovatively drawing on a cost-competitive

5 INTEGRATED ANNUAL REPORT 2015-2016
mix of financing, to contemporary execution and debt redemption.
Against the backdrop, we are pleased that TCTA has decided to establish a centre of excellence in water desalination, noting the vast and underutilised mining water requiring highly technical solutions to become useful to households and industry.
It is also instructive that, beyond the Lesotho Highlands Water Project which has now progressed into the implementation of its second phase, TCTA is playing a role in the interventions to enhance bi-national cooperation with Zimbabwe, in cross-border water infrastructure planning and development to the benefit of both countries. Such positioning lays the foundation for TCTA to play a far more proactive role in supporting the Department of Water and Sanitation and other strategic partners, manage South Africa’s increased bulk water supply risk as a result of climate change.
In the period ahead, the Board is committed to a fit-for-the future agenda for TCTA, supported by strengthened business and operating models, to create a more agile and responsive institution. We will continue to ensure continuous improvement in all areas of governance, including oversight on infrastructure projects, enhancement of transformation and development impact in all communities where our bulk water projects are located.
I take this opportunity to thank our CEO and his Executive Committee for supporting and leading us from behind during this transition period. Importantly, I wish to thank the Board and the individual directors for their undivided attention and commitment to manage the workload we faced since the beginning. We couldn’t have come this far, without your depth of experiences, attention to detail and personal sacrifice.
On behalf of the Board, I would like to thank the Minister of Water and Sanitation, Ms Nomvula Mokonyane, and the Parliamentary Portfolio Committee on Water and Sanitation under the leadership of Mr Lulu Johnson, for their positive engagement and guidance in exercising their oversight responsibilities.
May I also thank our diligent and devoted Executive team and employees, for making TCTA a reliable delivery vehicle for the country. The last quarter was by far stressful and extraordinary for all of us, and we look forward to a more enjoyable season. Thank you for balancing all the requirements .You are most appreciated.
To my colleagues, the directors of TCTA, I thank you personally for your guidance and support this far. Without your generosity with your time, experiences and skills, we could not have reached this point of concluding the 2016financial year.
Kea leboga!
Ms Monhla HlahlaChairperson of the Board
6
GENERAL INFORMATION
INTEGRATED ANNUAL REPORT 2015-2016
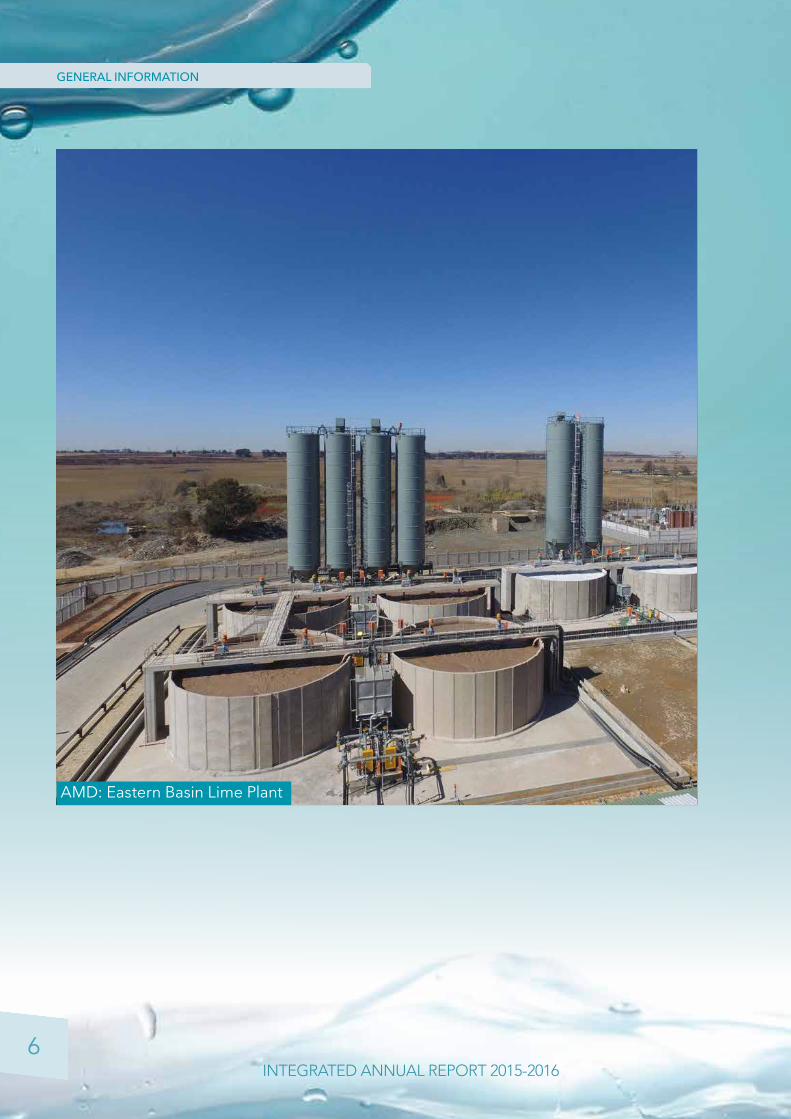
AMD: Eastern Basin Lime Plant
7 INTEGRATED ANNUAL REPORT 2015-2016
The Integrated Annual Report is for the period 1 April 2015 to 31 March 2016.
The primary purpose of the Integrated Annual Report is to give assurance to:1) the Shareholder, represented by the Minster of Water
and Sanitation and overseen by the Parliamentary Portfolio Committee on Water and Sanitation, that TCTA is delivering in accordance with the mandate and directives; and
2) to investors to indicate that: a. the Equator Principles are being applied on the
projects that the investors fund; b. during construction of a project sufficient funds
are available to bring the project to a point where revenue will be generated to repay the debt; and
c. during the debt repayment period sufficient cash flow is being received from the Department of Water and Sanitation to repay the debt so that the tariff remains constant or reduces in real terms, thus remaining affordable to the consumer.
TCTA adds value in the short term by raising funds for projects, ensuring that the infrastructure delivers water when required by the consumers and is built within budget and to specification. In the medium term, TCTA ensures that all the aspects related to the implementation
of the projects, particularly the environmental and social issues, are satisfactorily closed-out and in the long term ensures that the debt is managed in such a manner that the tariff remains constant in real terms, thereby ensuring affordability to the consumer.
The deliverables on the mandate and any current directives are reviewed on a yearly basis. This results in a Shareholders’ Compact between the Minister and the Board of TCTA, which contains the predetermined objectives for the financial year. TCTA is then required to report against these objectives in the Annual Performance Report (refer to Part B). The Shareholders’ Compact and the subsequent Corporate Plan are drawn up in accordance with Treasury Regulations for Departments, Constitutional Institutions and Public Entities as issued in April 2001.
All the current projects under construction and/or where debt is being incurred are being implemented on behalf of the Department of Water and Sanitation; this information on progress and the outstanding liability is incorporated into the Water Trading Account of the Department.
TCTA, therefore, does not trade as other State-owned Companies do (as defined in terms of the Companies Act), but provides services to other organisations of state as and when directed by the Shareholder.
ABOUT THE INTEGRATED ANNUAL REPORT
8
GENERAL INFORMATION
INTEGRATED ANNUAL REPORT 2015-2016
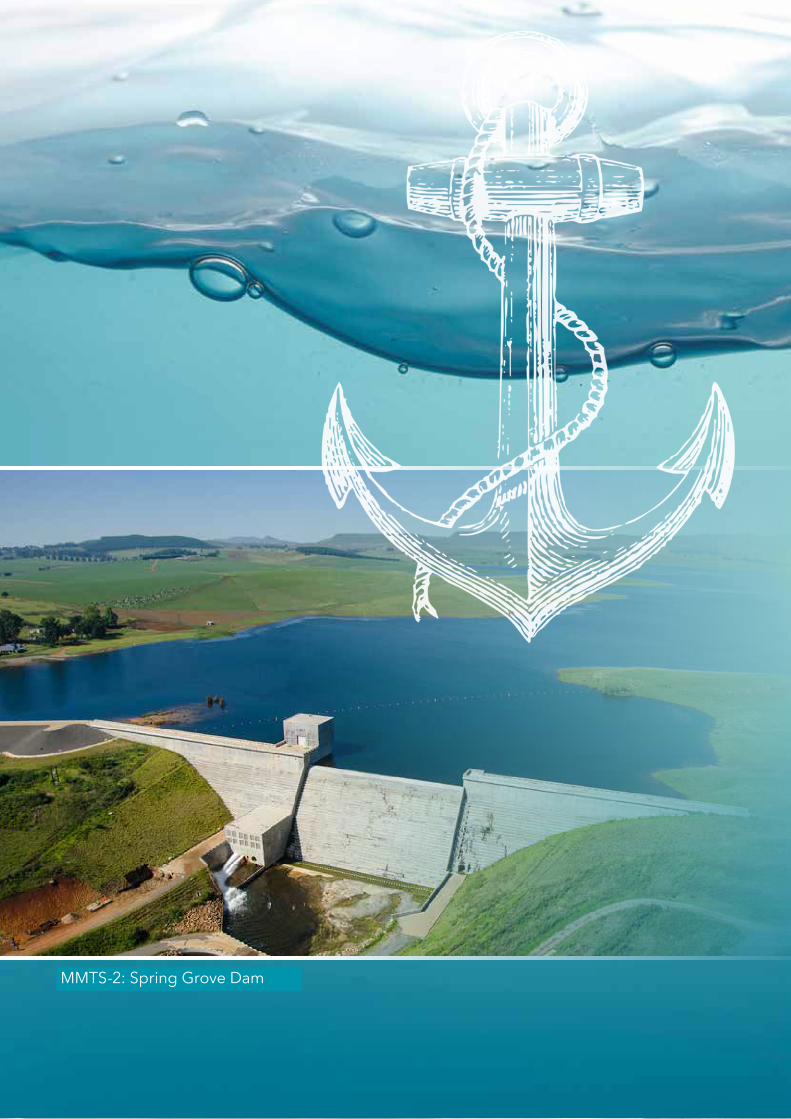
MMTS-2: Spring Grove Dam
9 INTEGRATED ANNUAL REPORT 2015-2016
PART A: GENERAL INFORMATION
10
11
12
14
20
24
26
27
29
PUBLIC ENTITY’S GENERAL INFORMATION
LIST OF ABBREVIATIONS/ ACRONYMS
OVERVIEW BY THE CHIEF EXECUTIVE OFFICER
STRATEGIC OVERVIEW
LESOTHO HIGHLANDS WATER PROJECT
LEGISLATIVE AND OTHER MANDATES
MAJOR PRODUCTS AND SERVICES
STAKEHOLDER RELATIONSHIPS
ORGANISATIONAL STRUCTURE
10
GENERAL INFORMATION
INTEGRATED ANNUAL REPORT 2015-2016
Registered Name of the Public Entity: Trans-Caledon Tunnel Authority
Registered Office Address: Stinkhout Wing, Tuinhof Building, 265 West Avenue, CENTURION
Postal Address: PO Box 10335, CENTURION 0046
Contact Telephone Number: 012 683 1200
Email Address: [email protected]
Website Address: www.tcta.co.za
External Auditor’s Information: Ernst & Young Inc. 102 Rivonia Road SANDTON 2146 Banker’s Information: Standard Bank of South Africa Ltd., 12 Church Square,
PRETORIA, Company Secretary: Ms Lahlane Mnisi, BProc. LLB, Admitted Attorney
PUBLIC ENTITY’S GENERAL INFORMATION
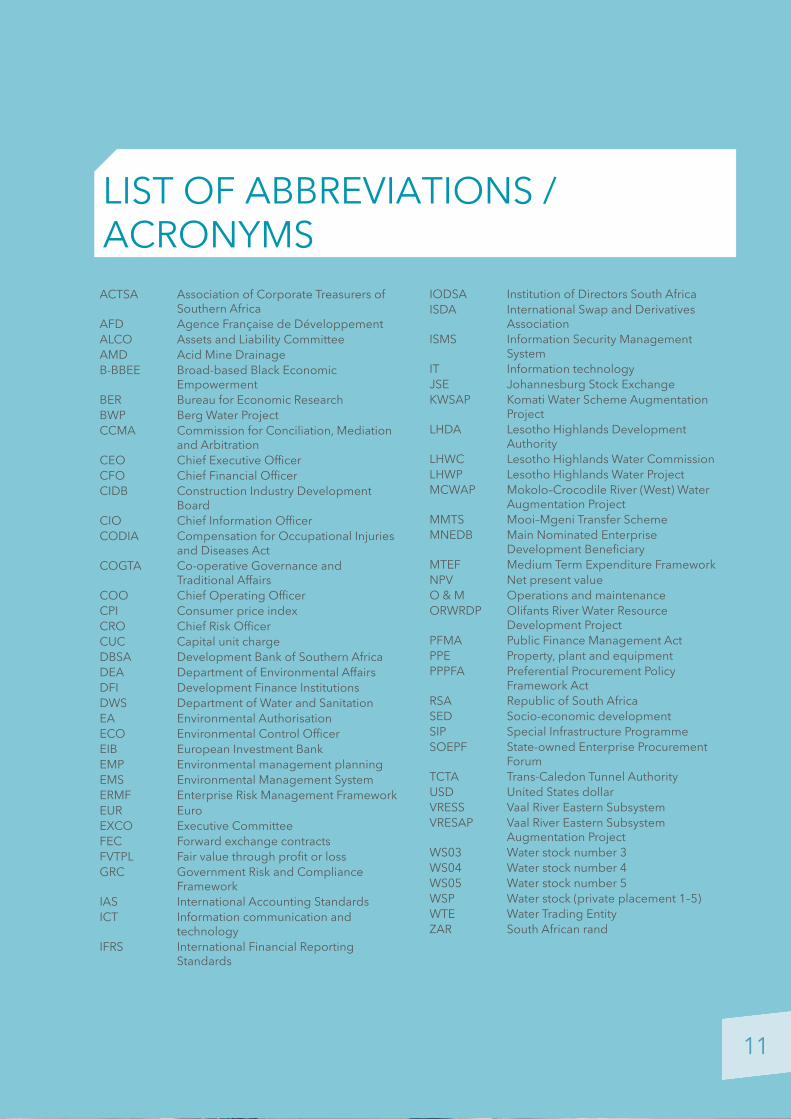
LIST OF ABBREVIATIONS / ACRONYMS
ACTSA Association of Corporate Treasurers of Southern Africa
AFD Agence Française de DéveloppementALCO Assets and Liability CommitteeAMD Acid Mine DrainageB-BBEE Broad-based Black Economic
EmpowermentBER Bureau for Economic ResearchBWP Berg Water ProjectCCMA Commission for Conciliation, Mediation
and ArbitrationCEO Chief Executive OfficerCFO Chief Financial OfficerCIDB Construction Industry Development
BoardCIO Chief Information OfficerCODIA Compensation for Occupational Injuries
and Diseases ActCOGTA Co-operative Governance and
Traditional AffairsCOO Chief Operating OfficerCPI Consumer price indexCRO Chief Risk OfficerCUC Capital unit chargeDBSA Development Bank of Southern AfricaDEA Department of Environmental AffairsDFI Development Finance InstitutionsDWS Department of Water and SanitationEA Environmental AuthorisationECO Environmental Control OfficerEIB European Investment BankEMP Environmental management planningEMS Environmental Management SystemERMF Enterprise Risk Management FrameworkEUR EuroEXCO Executive CommitteeFEC Forward exchange contractsFVTPL Fair value through profit or lossGRC Government Risk and Compliance
FrameworkIAS International Accounting StandardsICT Information communication and
technologyIFRS International Financial Reporting
Standards
IODSA Institution of Directors South AfricaISDA International Swap and Derivatives
AssociationISMS Information Security Management
SystemIT Information technologyJSE Johannesburg Stock ExchangeKWSAP Komati Water Scheme Augmentation
ProjectLHDA Lesotho Highlands Development
AuthorityLHWC Lesotho Highlands Water CommissionLHWP Lesotho Highlands Water ProjectMCWAP Mokolo–Crocodile River (West) Water
Augmentation Project MMTS Mooi–Mgeni Transfer Scheme MNEDB Main Nominated Enterprise
Development BeneficiaryMTEF Medium Term Expenditure FrameworkNPV Net present valueO & M Operations and maintenanceORWRDP Olifants River Water Resource
Development ProjectPFMA Public Finance Management ActPPE Property, plant and equipmentPPPFA Preferential Procurement Policy
Framework ActRSA Republic of South AfricaSED Socio-economic developmentSIP Special Infrastructure ProgrammeSOEPF State-owned Enterprise Procurement
ForumTCTA Trans-Caledon Tunnel AuthorityUSD United States dollarVRESS Vaal River Eastern SubsystemVRESAP Vaal River Eastern Subsystem
Augmentation ProjectWS03 Water stock number 3WS04 Water stock number 4WS05 Water stock number 5WSP Water stock (private placement 1–5)WTE Water Trading EntityZAR South African rand
11

12
GENERAL INFORMATION
INTEGRATED ANNUAL REPORT 2015-2016
OVERVIEW BY THE CHIEF EXECUTIVE OFFICER
It gives me great pleasure to report that, once again, TCTA has performed well against the set targets of the past financial year, in our efforts to fast-track sustainable water supply to all, in continuing support of South Africa’s agenda for more inclusive growth and development.
The past year witnessed our embedded culture of commitment and creativity in taking our water infrastructure projects to the planned point of delivery – in accordance with specification, on time and within budgetary and environmental constraints – as well as in effectively deploying our strategy to redeem debt when it fell due from the project tariffs received.
In terms of the ongoing projects, the accomplishment of the following implementation milestones is worthy of note, side-by-side with the accruing development impacts in different parts of the country:
• Mokolo-Crocodile Water Augmentation Project, Phase 1 (MCWAP-1): The reporting period saw this project move into the critical stage of water delivery, ensuring that Eskom was able to bring into operation, all six of the units at the Medupi Power Station, near Lephalale in the Limpopo province, as well as allowing flue-gas desulphurization on three of the units.
• Mooi-Mgeni Transfer Scheme, Phase 2 (MMTS-2): The planned augmentation of the water transfer scheme was operationalized in the course of last year, which made certain that the full yield of the Mooi River was transferred into the uMgeni System, at the lowest possible cost. This development proved to be of immense benefit to the five municipalities in the Kwa-Zulu Natal province drawing water directly or indirectly from the uMgeni System, in the light of the severe drought they all faced.
• Acid Mine Drainage, Short-term Intervention (AMD-STI): Concerted efforts to address AMD in the Eastern

13 INTEGRATED ANNUAL REPORT 2015-2016
Basin, in the area around Springs in the Gauteng province, took the construction of a new High Density Sludge plant to close to completion, and saw the commencement of the commissioning of the plant. The Eastern Basin plant, with a capacity of about 110 mega litres per day, is the largest of the three plants in the AMD basins and one of the biggest of its kind across the globe. In combination, the short-term interventions have prevented the uncontrolled decant of toxic AMD into the larger environment, including the natural river system. Preliminary treatment of AMD has limited the load of various hazardous metals entering the environment to acceptable levels, lowering salinity in the receiving water body and helping to reduce dilution releases from the Vaal Dam.
During the reporting year, we diligently implemented the approved funding strategies for all our projects, ensuring that debt management occurred in accordance with the approved limits for each project.
In respect of Phase 2 of the Lesotho Highlands Water Project (LHWP-2), we advanced our mandate to fund the water transfer component, institutionalizing our project linkages with both the Lesotho Highlands Water Commission and the Lesotho Highlands Development Authority. In particular, in the initial steps taken with the Department of Water and Sanitation to explore options for cross-border water augmentation from our northern neighbor, Zimbabwe, we drew strongly on the lessons and experiences from the Lesotho project.
As we ramp up project implementation in the coming year, our focus is directed at enhancing our capacity to comprehensively progress three significant projects: the Mokolo-Crocodile Water Augmentation Project, Phase 2A (MCWAP-2A); the Olifants River Water Resources Development Project, Phase 2B (ORWRDP-2B); and the Acid Mine Drainage Long-term Solution (AMD-LTS). We look ahead to resolving implementation challenges
more vigorously, partnering across the board to map out project paths that more effectively respond to the expectations of our key stakeholders, especially in transforming livelihoods, transferring skills and building resilient communities.
On behalf of management and staff, I wish to thank Minister Nomvula Mokonyane and our Parliamentary Portfolio Committee chaired by Mr Lulu Johnson, for their strategic support. I am grateful to our new Board, under the sterling leadership of Ms Monhla Hlahla, for its wise counsel and guidance right from the outset. To my colleagues on the Executive Committee and to our staff as a whole, your unwavering optimism and energy underpin our continuing performance and success in these challenging times.
In the new financial year, we trust in the resolute commitment of our principals, partners and stakeholders as we navigate our way onward towards fresh possibilities, ensuring that we continue to affirm excellence in all our endeavours.
James NdlovuChief Executive Officer
14
GENERAL INFORMATION
INTEGRATED ANNUAL REPORT 2015-2016
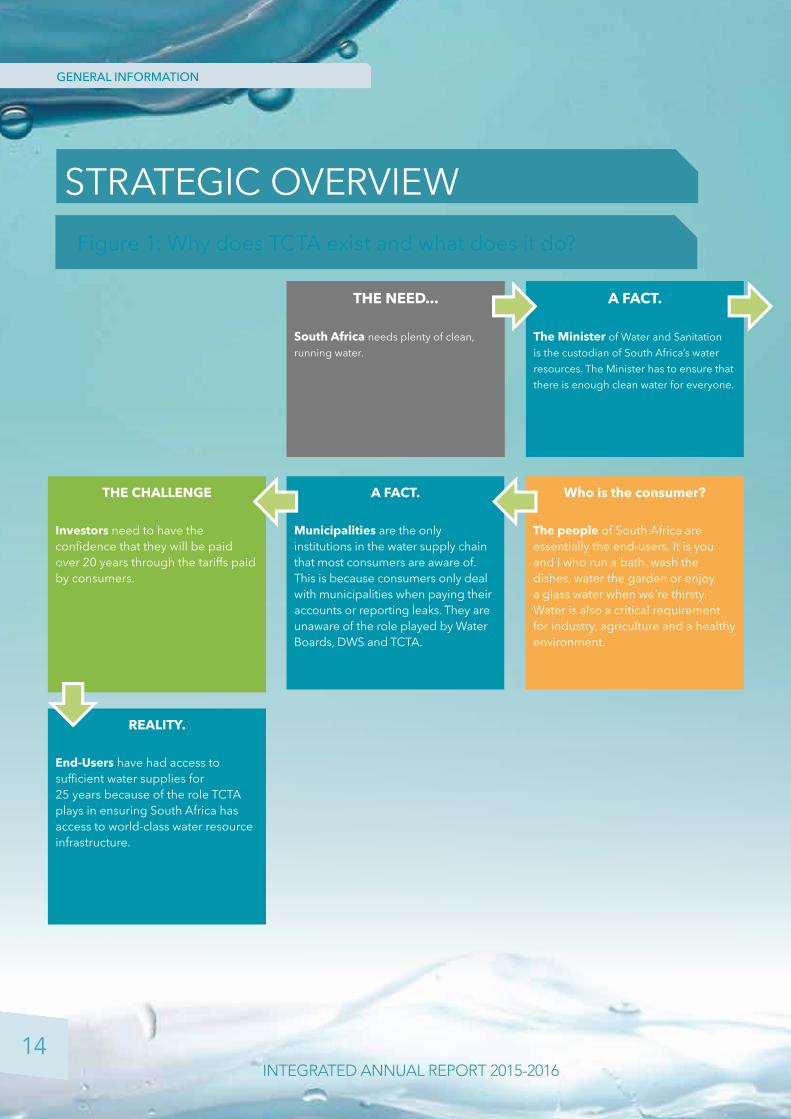
STRATEGIC OVERVIEW
THE NEED...
South Africa needs plenty of clean, running water.
A FACT.
The Minister of Water and Sanitation is the custodian of South Africa’s water resources. The Minister has to ensure that there is enough clean water for everyone.
Who is the consumer?
The people of South Africa are essentially the end-users. It is you and I who run a bath, wash the dishes, water the garden or enjoy a glass water when we’re thirsty. Water is also a critical requirement for industry, agriculture and a healthy environment.
A FACT.
Municipalities are the only institutions in the water supply chain that most consumers are aware of. This is because consumers only deal with municipalities when paying their accounts or reporting leaks. They are unaware of the role played by Water Boards, DWS and TCTA.
THE CHALLENGE
Investors need to have the confidence that they will be paid over 20 years through the tariffs paid by consumers.
REALITY.
End-Users have had access to sufficient water supplies for 25 years because of the role TCTA plays in ensuring South Africa has access to world-class water resource infrastructure.
Figure 1: Why does TCTA exist and what does it do?

15 INTEGRATED ANNUAL REPORT 2015-2016
SOLUTION!
Infrastructure such as dams, boreholes, pipelines and tunnels need to be built by the Department of Water Affairs to ensure there is sufficient water for all.
THE CHALLENGE
Financing such infrastructure is enormously expensive. Because DWS is a national department, it can only use money allocated to it by the National Treasury. This budget is not sufficient to build water resource infrastructure on this scale and DWS cannot raise funding for projects separately.
THE NEED...
A Separate Entity needed to be established by DWS to raise money from investors and project manage the building of the water resource infrastructure required by the country.
SOLUTION!
In 1986 the Trans-Caledon Tunnel Authority (TCTA) was established to meet this need.
Does TCTA own the infrastructure once it is
operational?
TCTA builds the infrastructure on behalf of DWS. It only finances, project manages the implementation and manages the debt over the 20 year repayment period. The infrastructure is owned, operated and maintained by DWS.
Who does TCTA pay?
Investors are paid back by TCTA with interest. Investors require a return on investment. TCTA’s projects offer a safe investment over the debt repayment period.
DWS
TCTA
Water Boards
Municipality End User
Position of TCTA in the water sector
Management of infrastructure and sale of waterLiability and project management

16
GENERAL INFORMATION
INTEGRATED ANNUAL REPORT 2015-2016
1986
—
2002
—
2003
—
2004
—
2005
—
2006
—
2007
—
2008
—
2009
—
2010
—
2011
—
2012
—
2013
—
2014
—
2015
—
2016
—
LHW
P D
eliv
ery
Tunn
el N
orth
21-k
m o
f 4.9
5 di
a. tu
nnel
abl
e to
del
iver
290
0 m
illio
n m
3 per
ann
um (M
m3/
a).
Del
iver
y of
wat
er c
omm
ence
d in
199
7
VRES
AP
121-
km o
f 1.9
dia
. pip
lelin
e in
crea
sing
the
capa
city
of V
aal R
iver
Aug
men
ted
Subs
yste
m b
y 16
0 M
m3/
a.D
eliv
ery
of w
ater
com
men
ced
in 2
009
BWP
A 68
-m h
igh
dam
stor
ey 1
30 M
m3
and
incr
easin
g th
e yi
eld
of th
e W
este
rn
Cape
wat
er su
pply
by
18%
.Co
mm
ence
men
t of s
tora
ge o
f wat
er c
omm
ence
d in
Jul
y 20
07
ORW
RDP-
2CA
40-k
m p
ipel
ine
supp
lyin
g w
ater
to th
e N
ebo
Plat
eau
and
the
min
es a
roun
d St
eelp
oort
and
Burg
ersf
ort i
n Li
mpo
poW
ater
del
iver
y to
the
wat
er tr
eatm
ent w
orks
(fir
st 1
0-km
of p
ipel
ine)
was
po
ssib
le fr
om J
anua
ry 2
014
MM
TS-2
A 37
.7-m
hig
h da
m st
orey
139
.5 M
m3;
and
incr
easin
g th
e yi
eld
of th
e M
ooi-M
geni
Sys
tem
by
18%
and
a 1
4.5-
km p
ipel
ine
to in
crea
se th
e tra
nsfe
r ca
paci
ty o
f the
sche
me
to 4
.5 m
3/s.
Sprin
g G
rove
Dam
: Com
men
cem
ent o
f sto
rage
of w
ater
in M
arch
201
3Au
gmen
tatio
n of
the
wat
er tr
ansf
er sc
hem
e: W
ater
del
iver
y co
mm
ence
d in
Fe
brua
ry 2
016
Not
ice
of e
stab
lishm
ent
Revi
sed
notic
e of
est
ablis
men
t20
01 —
Figu
re 2
: TC
TA p
roje
ct im
plem
enta
tion
timel
ine

17 INTEGRATED ANNUAL REPORT 2015-2016
1986
—
2002
—
2003
—
2004
—
2005
—
2006
—
2007
—
2008
—
2009
—
2010
—
2011
—
2012
—
2013
—
2014
—
2015
—
2016
—
KRI
EL3-
km o
f pip
elin
e an
d up
grad
ing
of th
e w
ater
trea
tmen
t wor
ks.
Und
er c
onst
ruct
ion
AM
D S
hort
-term
Inte
rven
tion
(Con
stru
ctio
n of
Hig
h D
ensi
ty S
ludg
e Tr
eatm
ent P
lant
s)W
este
rn B
asin
: Con
tinuo
us u
pgra
de o
f exi
stin
g pl
ant t
o co
rrect
cap
acity
of..
.
Cent
ral B
asin
: Con
stru
ctio
n of
84
Ml/d
ay p
lant
.Tr
eatm
ent c
omm
ence
d in
May
201
4
East
ern
Basin
: Con
stru
ctio
n of
108
Ml/d
ay p
lant
.Tr
eatm
ent c
omm
ence
d in
May
201
6
MCW
AP
Phas
e 1:
43k
m o
f 1.1
-m d
ia. p
iple
line
incr
easin
g th
e ca
paci
ty o
f the
sche
me
by 3
0 M
m3/
a.W
ater
del
iver
y co
mm
ence
d in
May
201
5
Phas
e 2A
: 160
-km
of p
ipel
ine
from
the
Cro
cdile
Riv
er to
the
Leph
alal
e ar
ea:
In d
esig
n
ORW
RDP-
2B70
-km
pip
elin
e di
strib
utin
g w
ater
to M
ogal
akw
ena
and
the
adja
cent
min
es.
In d
esig
n ph
ase
Bore
hole
Pro
ject
Dril
led
and
equi
pped
85
bore
hole
s ove
r six
pro
vinc
es a
nd c
ompl
eted
the
wor
k in
201
3
KW
SAP
71-k
m o
f 1.1
-m d
ia. p
iple
line
supp
lyin
g M
atla
and
Duv
ha P
ower
Sta
tions
in
Mpu
mal
anga
.W
ater
del
iver
y co
mm
ence
d in
Jun
e 20
13

18
GENERAL INFORMATION
INTEGRATED ANNUAL REPORT 2015-2016
Cape Town
Olifants
Berg
Mokolo-Crocodile River (west) Water Augmentation Project (MCWAP)
Acid Mine Drainage (AMD)
Komati Water Scheme Augmentation Project (KWSAP)
Water off-take to Kriel Town
Lesotho Highlands Water Project (LHWP)
Vaal River Eastern Subsystem Augmentation Project (VRESAP)
Berg Water Project (BWP)
uMzumvubu (MWP)
Olifants River Water Resources Development Project Phase 2C (ORWRDP)
Mooi-Mgeni Transfer Scheme (MMTS)
KEYLocation of projects
LHWP: Katse Dam

19 INTEGRATED ANNUAL REPORT 2015-2016
Wilge
Crocodile
Sand
Olifants
Orange
Orange
Liebenbergsvlei
Free State
North WestMpumalanga
Eastern Cape
Northern Cape
Western Cape
Mog
alak
wen
a
Limpopo
KwaZulu-Natal
Secunda
Kimberley
Mbombela
Mangaung
Vaal Dam
Durban
East London
Port Elizabeth
Cape Town
GautengPretoria
Johannesburg
Polokwane
Bloemhof Dam
Vaal
TugelaMooi
Umgeni
Fish Kei
uMzum
vubuOlifants
Sonderend
Gourits
Coega
Crocodile
Pongola
Caledon
Mokolo
Gariep Dam
Berg
MCWAP
ORWRDP
KWSAP
MMTS-2
MWP
LHWP
Lesotho
BWP
AMDVRESAP
Umgeni Water
Sedibeng Water
Rand Water
Lepelle Northern Water
Vaal River System
Figure 3: Location of TCTA projects

20
GENERAL INFORMATION
INTEGRATED ANNUAL REPORT 2015-2016
Overview
The Lesotho Highlands Water Project (LHWP) is an iconic bi-national water resources development project between the Government of the Republic of South Africa and the Government of the Kingdom of Lesotho. This almost miraculous engineering feat diverts water from the Senqu River System in Lesotho to South Africa’s economic heartland, the water-stressed Gauteng region. The project is formalized through the LHWP Treaty signed in 1986 between South Africa and Lesotho, an agreement which also sets out the institutional arrangements for implementing the project on behalf of the two governments.
Each year, the first phase of the project which was completed in 2003, delivers 780 million cubic metres of water to South Africa. When the second phase is finalized by December 2024, the total cross-border delivery should increase to 1200 million cubic metres per annum.
On an ongoing basis, TCTA is responsible for the funding and debt management of the water transfer portion of the project, as well as the operation and maintenance of the Delivery North Tunnel in South Africa.
Aside from being a lifeline for South Africa’s economic hub, the multi-phase Lesotho Highlands Water Project is a prime example of what can be achieved when neighbouring countries join forces and work towards a common goal. An idea that was born in the deeply-incised valleys of Lesotho has now connected Lesotho and South Africa, not only as a symbol of their inter-dependence, but also of their joint efforts to secure a more prosperous dispensation for both countries.
Project Profile
The project was originally designed to be executed in five phases over a period of 30 years and to transfer about 70 m3/s of water to the Gauteng Province in South Africa. Phase I of the project was split into Phases 1A and
1B. This phase was successfully implemented between 1987 and 2003, with Phase 1B being completed in 2003. However, the actual delivery of water to South Africa commenced in January 1996.
The main infrastructure features of Phase 1A include the Katse dam, an intake tower, a transfer tunnel from Katse to Muela Hydropower station, the Muela hydropower station and appurtenances, as well as the delivery tunnel to the border with South Africa. Additional works include construction of surfaced roads, feeder roads, bridges, camps and health facilities, as well as environmental and social programmes. Beyond Phase I, the LHWP was initially envisaged to encompass the construction of a number of augmentation dams and associated infrastructure, specifically the Mashai, Tsoelike and Ntoahae dams for Phases II, III and IV, respectively. In the particular case of Phase II of the project, which has now progressed into implementation, the Mashai dam has since been replaced by the Polihali dam.
TCTA was responsible for the infrastructure portions under Phase 1A, as well as for the raising of funding for the project, except funding for the Muela hydropower which was borne by Lesotho. The Katse dam is the key feature of LHWP Phase I, comprising a double curvature concrete arch, 185m high and 710m along the crest. The concrete structure allowed water to be impounded at low risk during construction. The dam wall, 60m thick at the base and 9m at the crest, consumed some 2.32 million m3 of concrete. Construction was undertaken by an international consortium comprising firms from Italy, France, Germany, the United Kingdom and South Africa.
The Lesotho Highlands Water Project is a multi-purpose investment that transfers water to South Africa, while generating hydropower through the Muela hydropower station for the needs of Lesotho. Notably, prior to the construction of the LHWP-1, Lesotho depended entirely on South Africa for its power needs. Water is delivered to the Muela hydropower via the transfer tunnel, and subsequently transferred to South Africa through a delivery tunnel.
LESOTHO HIGHLANDS WATER PROJECT

21 INTEGRATED ANNUAL REPORT 2015-2016
Royalties are payable by the South African Government to the Lesotho Government, and are based on the calculated net benefit of construction of the LHWP against a comparable transfer scheme. The benefit is shared between South Africa and Lesotho on a 44:56 ratio basis. The royalties accrued and paid to Lesotho for water transferred amounts to R775 million for the period covered in this report.
In the course of infrastructure construction, the project had a significant impact on Lesotho’s economy, in terms of jobs created, skills acquired, supply of goods and services, and tax revenues. The citizens of Lesotho constituted a vast majority of the workers hired on the construction sites. As a result, more than 16 000 Basotho secured employment on major contracts.
Project Funding
Phase I of the LHWP cost a total of R16 400 million, and the project depends on the revenues generated by water sales from the Vaal River system. The project is bankable and sustainable, and will be fully paid for by water users, although explicitly government guaranteed.
South Africa is responsible for the full water transfer costs incurred by both TCTA and the Lesotho Highlands Development Authority (LHDA), the equivalent state institution on the Lesotho side. The costs are reflected in TCTA’s statement of financial position.
In the reporting year, revenue accruing from DWS for the sale of raw water from the Vaal River System reached R3 216 million, compared to R3 558 million in the preceding year.
The income from water sales is sufficient to redeem all water transfer debt over a 20-year period following the completion of the project, consistent with the national water pricing strategy.
Debt Management
In the year under review, the management of debt related to the Lesotho Highlands Water Project until it is fully redeemed, remained at the core of the treasury activity of TCTA.
Over the years, TCTA has continued to review the debt situation of the project, conducting sensitivity analyses in tandem with changes in inflation, interest rates and water demand, to establish the most optimal capital structure.
Environmental Performance
Globally, construction projects and, particularly, mega-projects such as the LHWP, are required to comply with sound environmental management practices. In the LHWP case, environmental protection and sustainability prescriptions are entrenched in the agreement signed between South Africa and Lesotho. As such, the LHDA and TCTA, supported by the bi-national Lesotho Highlands Water Commission, judiciously implemented environmental measures to protect the river systems and to ensure sustainable development. These efforts were noticed by sector practitioners and subsequently acknowledged for excellence.
The Lesotho Highlands Water Project is accredited by the International Register of Certified Auditors, which also honoured the Muela operations with two regional awards of excellence, as follows:
• Best Overall Safety, Health and Environment System in Category 6 (Water services companies in Southern Africa); and
• Best Overall Safety, Health and Environment Safety Management System in Southern Africa.
Current Status: LHWP Phase II
Following the successful completion of LHWP-I, the Governments of Lesotho and South Africa signed an agreement in August 2011 to implement Phase II of the project. The LHWP-II is intended to build on Phase I, and involves two distinct elements: a water delivery system to augment the supply of water to South Africa and a Lesotho-based hydropower generation component.
A feasibility study of hydropower generation by the Lesotho government is underway, including an assessment of the Kobong pump-storage scheme integration as well as options for developing other smaller hydropower schemes both within and outside the LHWP area.
The water supply portion of LHWP-II entails the construction of a 165m high concrete-face rock-fill Polihali dam, a transfer tunnel from Polihali Dam to Katse Dam, advance infrastructure, as well as environmental and social mitigation programs in Lesotho. Upon completion, the combined Lesotho Highlands Water Project will deliver 1200 million cubic metres of water per year to the Gauteng region.
22
GENERAL INFORMATION
INTEGRATED ANNUAL REPORT 2015-2016
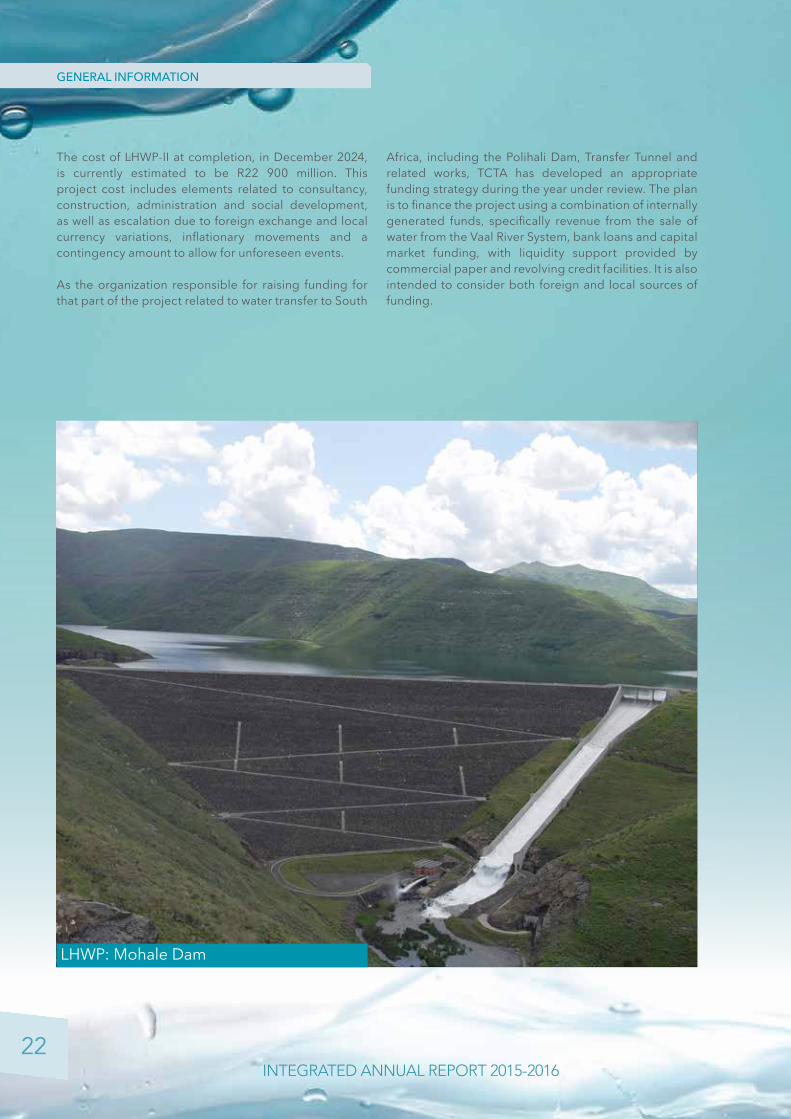
The cost of LHWP-II at completion, in December 2024, is currently estimated to be R22 900 million. This project cost includes elements related to consultancy, construction, administration and social development, as well as escalation due to foreign exchange and local currency variations, inflationary movements and a contingency amount to allow for unforeseen events.
As the organization responsible for raising funding for that part of the project related to water transfer to South
Africa, including the Polihali Dam, Transfer Tunnel and related works, TCTA has developed an appropriate funding strategy during the year under review. The plan is to finance the project using a combination of internally generated funds, specifically revenue from the sale of water from the Vaal River System, bank loans and capital market funding, with liquidity support provided by commercial paper and revolving credit facilities. It is also intended to consider both foreign and local sources of funding.
LHWP: Mohale Dam
23 INTEGRATED ANNUAL REPORT 2015-2016
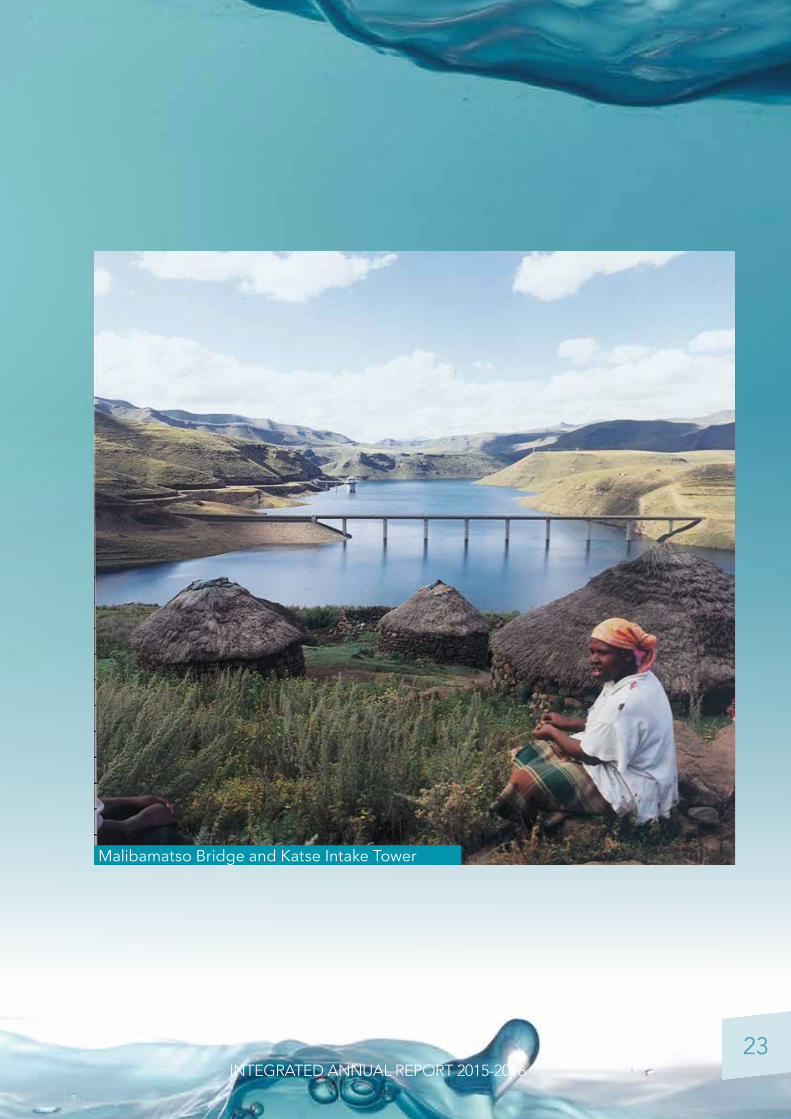
Malibamatso Bridge and Katse Intake Tower

24
GENERAL INFORMATION
INTEGRATED ANNUAL REPORT 2015-2016
LEGISLATIVE AND OTHER MANDATESThe Trans-Caledon Tunnel Authority (TCTA) was established in 1986, by Notice 2631 in Government Gazette No. 10545, dated 12 December 1986, to finance and build the Delivery Tunnel North of the Lesotho Highlands Water Project (LHWP). In 1994 a directive was received to fulfil the financial obligations of the Government of South Africa, in terms of the Treaty, on the water transfer component in Lesotho.
On 24 March 2000, the Notice of Establishment was again amended by Notice 277 in Government Gazette No. 21017, to include the 1994 directive and to allow for the Minister, in terms of Section 24(d) of the notice, to issue directives to TCTA in terms of Section 103(2) of the National Water Act (Act No. 36 of 1998).
In accordance with Section 3 of the Notice of Establishment, the objectives of TCTA are:• to implement, operate and maintain that part of
Phase 1 of the LHWP, situated in the Republic of South Africa, in accordance with the provisions of the Treaty; and
• to perform the functions set out in Clauses 24(a) and (b) and any other additional functions which the Authority may be required to perform in terms of a directive by the Minister under Section 103(2) of the National Water Act.
In doing so, the Minister must be satisfied that such directives will not prejudice the capacity of TCTA to perform the functions for which it was established. The National Water Act allows the Minister to direct a body established under Section 102 of the Act, to perform additional functions which may include, but are not limited to, providing water management institutions, both within the borders and external to the Republic, with:• management services (project implementation);• financial services (structuring and raising project
finance, debt management and tariff setting);• training; and• other support services.
The above makes it clear that TCTA cannot undertake any function outside of its mandate without a directive from the Minister, unlike the Water Boards, which are
given such opportunity in terms of Section 30 of the Water Services Act (Act No. 108 of 1997).
The National Water Act requires that TCTA manages its different functions separately. This is further emphasised in the Notice of Establishment for TCTA, which states in Section 20(1) that TCTA must manage its Treaty functions separately from its non-Treaty functions and account for them separately, as required by Section 105(1) of the National Water Act.
Section 20(2) furthermore states that the Authority’s Treaty responsibilities are not applicable to its non-Treaty functions.
The impact of these provisions on TCTA is that, regarding the LHWP mandate and each directive, there is a separate:• bank account;• borrowing authority from the Department of Water
and Sanitation (DWS)/ National Treasury, government guarantees and funding arrangements;
• general ledger; and• where money is borrowed to finance a project,
separate income/ implementation agreements with DWS, which are backed up with water supply agreements between DWS and the off-takers.
The income/ implementation agreements with DWS determine how costs may be charged on each project. To date, the following four principles have been applied:• a tariff structure per project is applied to ensure break-
even of revenue with regard to costs over a specified period. Key principles applied in determining an appropriate tariff structure for a project include: end-user affordability, predictability, and constancy in real terms;
• no reserves or profit sharing. Any savings or increased cost therefore are transferred to the end-consumers;
• actual costs are charged; and• TCTA manages the cash-flow risk inherent in the
fluctuating water demands from consumers in the system. The managing of the cash-flow risk was transferred to TCTA due to the fact that when LHWP was implemented, DWS was only functioning on a cash basis.

25 INTEGRATED ANNUAL REPORT 2015-2016
Table 1: Since the original mandate, TCTA has received a further 17 directives.
Project Date Type of work
Plan
ning
Fund
ing
Impl
emen
tatio
n
Ope
ratio
n an
d m
aint
enan
ce
Advi
sory
Paym
ent a
genc
y
Lesotho Highlands Water Project: Delivery Tunnel North (Treaty obligations)
12 December 1986√ √ √
Vaal River System: To fulfil all the Republic’s financial obligations in terms of or resulting from the Treaty (non-Treaty functions) on the Lesotho Highlands Water Project and any other obligations on the Vaal River System (Acid Mine Drainage).
3 August 1994 (and incorporated into amended Notice of Establishment, 24 March 2000)
√ √
Umgeni Water 4 July 2001 √
Advisory Services to Water Management Institutions, Water Boards and DWS
17 May 2004 √
Berg Water Project 6 May 2002 √ √ √*
Vaal River Eastern Subsystem Project 6 October 2004 √ √ √*
Mooi–Mgeni Transfer Scheme – Phase 2 29 November 2007 √ √ √*
Olifants River Water Resources Development Project – Phase 2C
17 June 2008 (directive revised 12 March 2012)
√ √*
Komati Water Scheme Augmentation Project 29 September 2008 √ √ √*
Mokolo–Crocodile Water Augmentation Project – Phase 1 19 May 2010 √ √ √*
Metsi Bophelo Borehole Project 2 March 2011 √
Acid Mine Drainage 6 April 2011 √ √ √
Refurbishment of Mooi–Mgeni Transfer Scheme – Phase 1 29 November 2011 √
Special Infrastructure Project 3 10 November 2012 √
Mzimvubu Water Project 10 February 2014(directive revised 17 August 2015)
√ √
Special Infrastructure Project 18 26 February 2104 √
Amendment to MMTS-2 directive to include the construction of a potable water pipeline for Umgeni Water
20 March 2014 √
Olifants River Water Resources Development Project – Phase 2B
25 February 2015(directive revised 22 October 2015)
√ √ √
Water Off-take for Kriel Town 20 June 2015 √
* Institutional arrangements
26
GENERAL INFORMATION
INTEGRATED ANNUAL REPORT 2015-2016
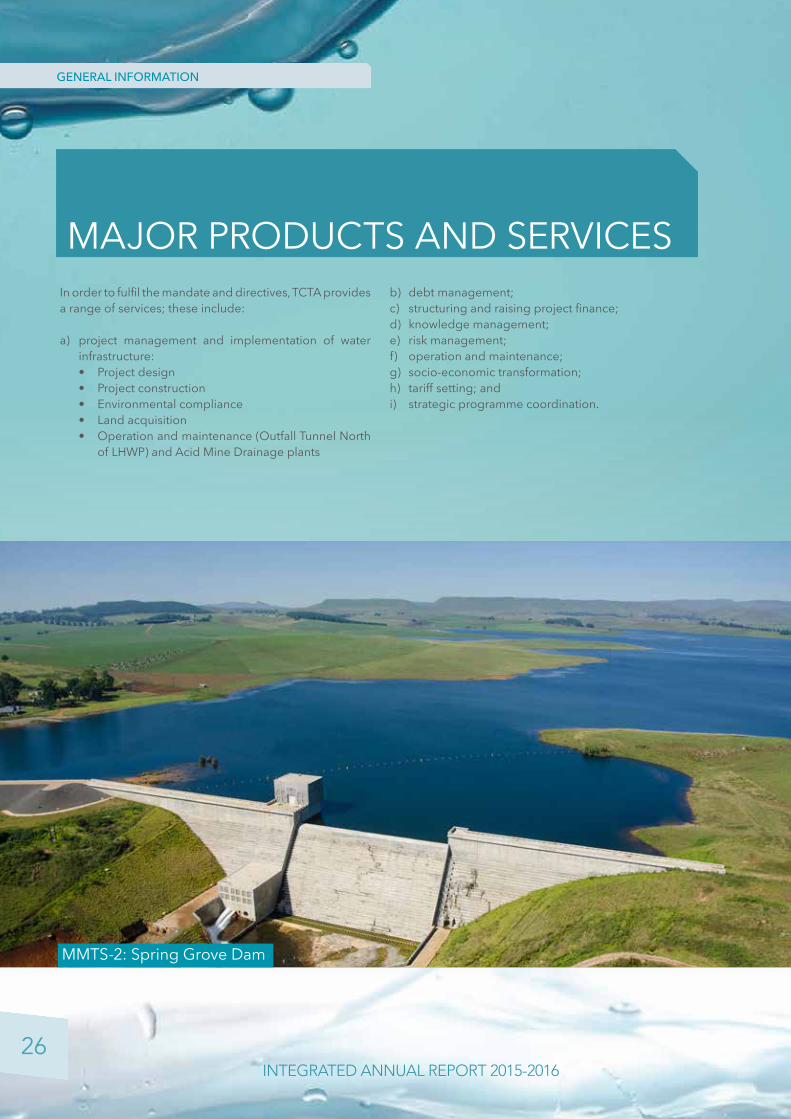
In order to fulfil the mandate and directives, TCTA provides a range of services; these include:
a) project management and implementation of water infrastructure:• Project design• Project construction• Environmental compliance• Land acquisition• Operation and maintenance (Outfall Tunnel North
of LHWP) and Acid Mine Drainage plants
b) debt management;c) structuring and raising project finance;d) knowledge management;e) risk management;f) operation and maintenance;g) socio-economic transformation;h) tariff setting; andi) strategic programme coordination.
MAJOR PRODUCTS AND SERVICES
MMTS-2: Spring Grove Dam
27 INTEGRATED ANNUAL REPORT 2015-2016
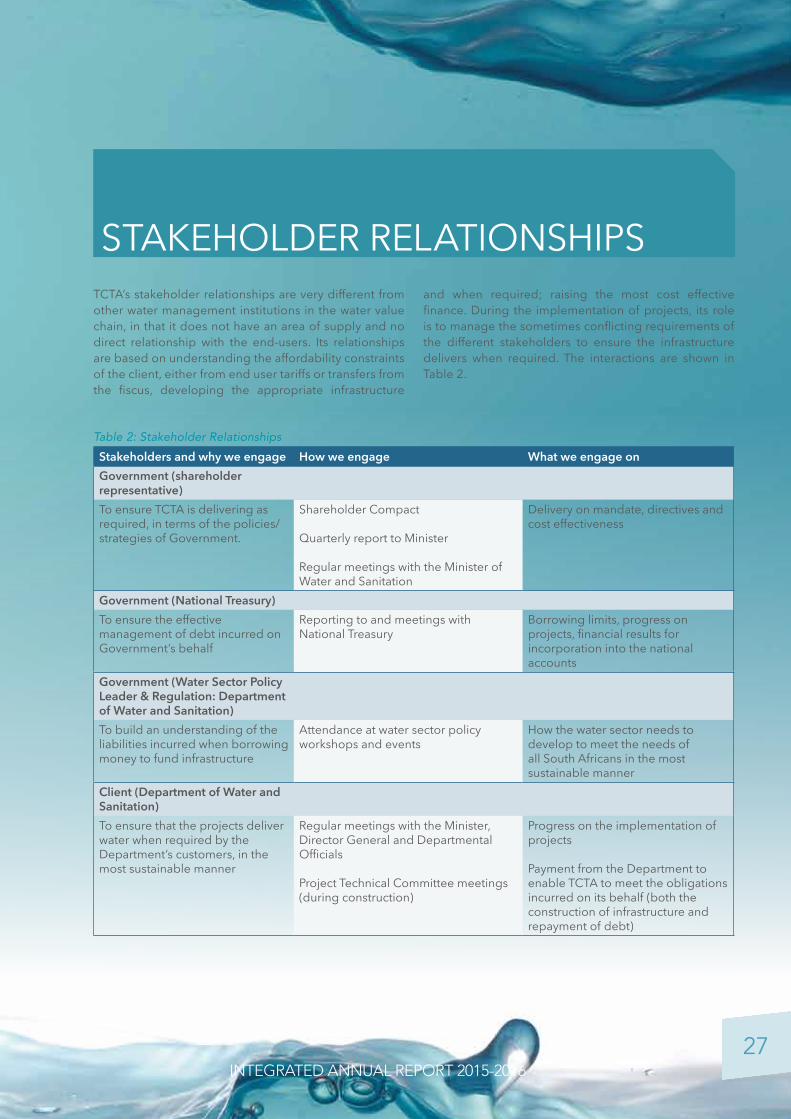
Stakeholders and why we engage How we engage What we engage onGovernment (shareholder representative)To ensure TCTA is delivering as required, in terms of the policies/strategies of Government.
Shareholder Compact
Quarterly report to Minister
Regular meetings with the Minister of Water and Sanitation
Delivery on mandate, directives and cost effectiveness
Government (National Treasury)To ensure the effective management of debt incurred on Government’s behalf
Reporting to and meetings with National Treasury
Borrowing limits, progress on projects, financial results for incorporation into the national accounts
Government (Water Sector Policy Leader & Regulation: Department of Water and Sanitation)To build an understanding of the liabilities incurred when borrowing money to fund infrastructure
Attendance at water sector policy workshops and events
How the water sector needs to develop to meet the needs of all South Africans in the most sustainable manner
Client (Department of Water and Sanitation)To ensure that the projects deliver water when required by the Department’s customers, in the most sustainable manner
Regular meetings with the Minister, Director General and Departmental Officials
Project Technical Committee meetings (during construction)
Progress on the implementation of projects
Payment from the Department to enable TCTA to meet the obligations incurred on its behalf (both the construction of infrastructure and repayment of debt)
Table 2: Stakeholder Relationships
TCTA’s stakeholder relationships are very different from other water management institutions in the water value chain, in that it does not have an area of supply and no direct relationship with the end-users. Its relationships are based on understanding the affordability constraints of the client, either from end user tariffs or transfers from the fiscus, developing the appropriate infrastructure
and when required; raising the most cost effective finance. During the implementation of projects, its role is to manage the sometimes conflicting requirements of the different stakeholders to ensure the infrastructure delivers when required. The interactions are shown in Table 2.
STAKEHOLDER RELATIONSHIPS
28
GENERAL INFORMATION
INTEGRATED ANNUAL REPORT 2015-2016
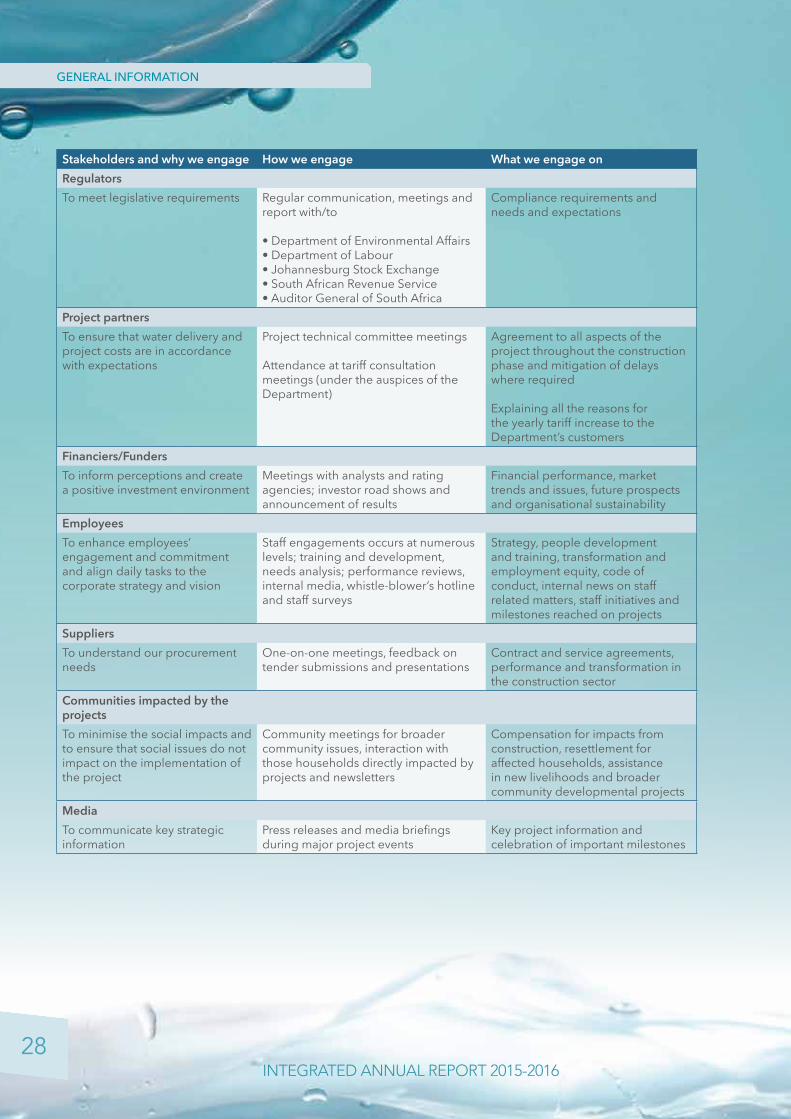
Stakeholders and why we engage How we engage What we engage onRegulatorsTo meet legislative requirements Regular communication, meetings and
report with/to
• Department of Environmental Affairs• Department of Labour• Johannesburg Stock Exchange• South African Revenue Service• Auditor General of South Africa
Compliance requirements and needs and expectations
Project partnersTo ensure that water delivery and project costs are in accordance with expectations
Project technical committee meetings
Attendance at tariff consultation meetings (under the auspices of the Department)
Agreement to all aspects of the project throughout the construction phase and mitigation of delays where required
Explaining all the reasons for the yearly tariff increase to the Department’s customers
Financiers/FundersTo inform perceptions and create a positive investment environment
Meetings with analysts and rating agencies; investor road shows and announcement of results
Financial performance, market trends and issues, future prospects and organisational sustainability
EmployeesTo enhance employees’ engagement and commitment and align daily tasks to the corporate strategy and vision
Staff engagements occurs at numerous levels; training and development, needs analysis; performance reviews, internal media, whistle-blower’s hotline and staff surveys
Strategy, people development and training, transformation and employment equity, code of conduct, internal news on staff related matters, staff initiatives and milestones reached on projects
SuppliersTo understand our procurement needs
One-on-one meetings, feedback on tender submissions and presentations
Contract and service agreements, performance and transformation in the construction sector
Communities impacted by the projectsTo minimise the social impacts and to ensure that social issues do not impact on the implementation of the project
Community meetings for broader community issues, interaction with those households directly impacted by projects and newsletters
Compensation for impacts from construction, resettlement for affected households, assistance in new livelihoods and broader community developmental projects
MediaTo communicate key strategic information
Press releases and media briefings during major project events
Key project information and celebration of important milestones
29 INTEGRATED ANNUAL REPORT 2015-2016
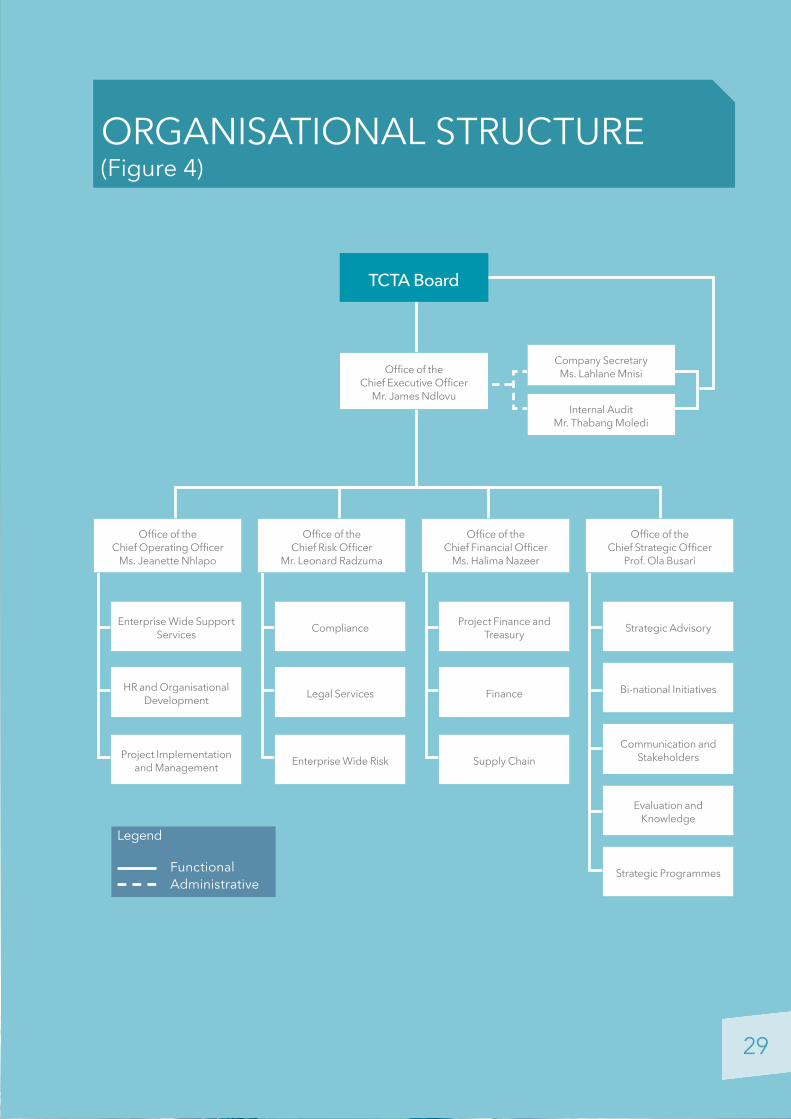
ORGANISATIONAL STRUCTURE(Figure 4)
Office of the Chief Executive Officer
Mr. James Ndlovu
TCTA Board
Strategic Advisory
Bi-national Initiatives
Communication and Stakeholders
Evaluation and Knowledge
Strategic Programmes
Office of the Chief Strategic Officer
Prof. Ola Busari
Project Finance and Treasury
Finance
Supply Chain
Office of the Chief Financial Officer
Ms. Halima Nazeer
Office of the Chief Risk Officer
Mr. Leonard Radzuma
Compliance
Legal Services
Enterprise Wide Risk
Office of the Chief Operating Officer
Ms. Jeanette Nhlapo
Enterprise Wide Support Services
HR and Organisational Development
Project Implementation and Management
Company SecretaryMs. Lahlane Mnisi
Internal AuditMr. Thabang Moledi
Legend
FunctionalAdministrative
29
3030
PERFORMANCE INFORMATION
INTEGRATED ANNUAL REPORT 2015-2016
MCWAP 1: Wolvenfontein Balancing Dam

3131 INTEGRATED ANNUAL REPORT 2015-2016
PART B: PERFORMANCE INFORMATION
32
33
42
EXECUTIVE SUMMARY
PERFORMANCE AGAINST PREDETERMINED OBJECTIVES
FINANCIAL SUMMARY
3232
PERFORMANCE INFORMATION
INTEGRATED ANNUAL REPORT 2015-2016
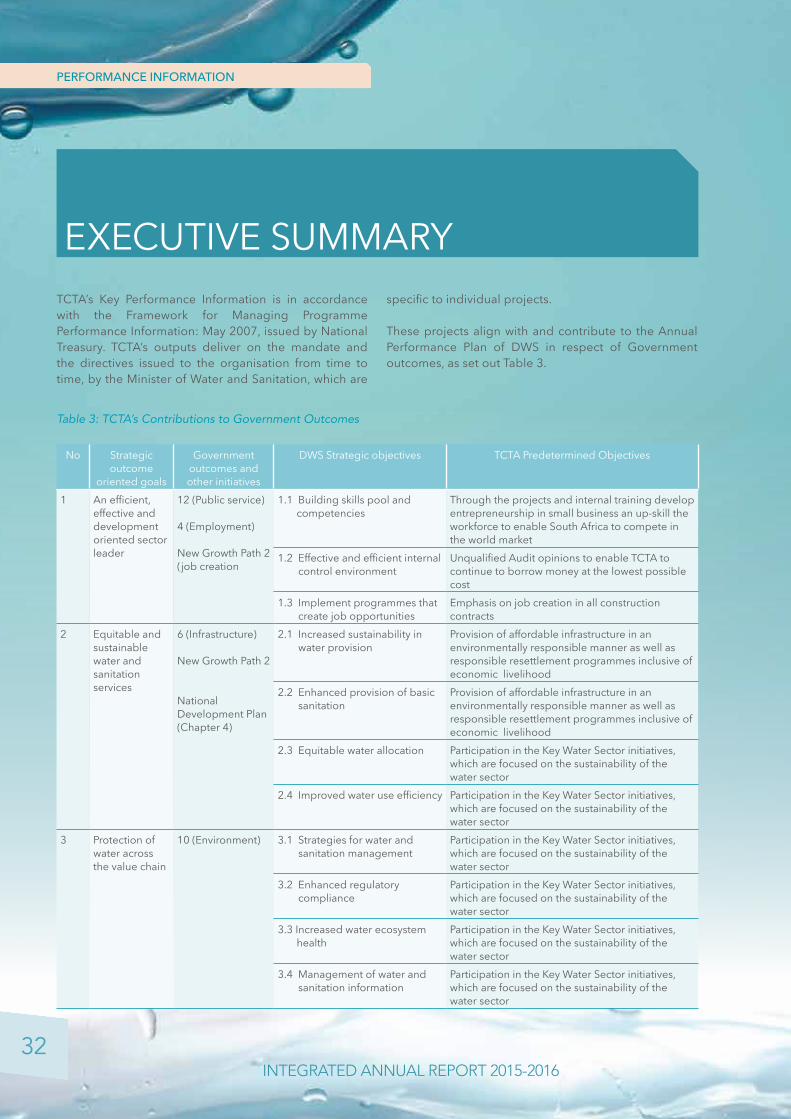
EXECUTIVE SUMMARYTCTA’s Key Performance Information is in accordance with the Framework for Managing Programme Performance Information: May 2007, issued by National Treasury. TCTA’s outputs deliver on the mandate and the directives issued to the organisation from time to time, by the Minister of Water and Sanitation, which are
specific to individual projects.
These projects align with and contribute to the Annual Performance Plan of DWS in respect of Government outcomes, as set out Table 3.
Table 3: TCTA’s Contributions to Government Outcomes
No Strategic outcome
oriented goals
Government outcomes and other initiatives
DWS Strategic objectives TCTA Predetermined Objectives
1 An efficient, effective and development oriented sector leader
12 (Public service)
4 (Employment)
New Growth Path 2 (job creation
1.1 Building skills pool and competencies
Through the projects and internal training develop entrepreneurship in small business an up-skill the workforce to enable South Africa to compete in the world market
1.2 Effective and efficient internal control environment
Unqualified Audit opinions to enable TCTA to continue to borrow money at the lowest possible cost
1.3 Implement programmes that create job opportunities
Emphasis on job creation in all construction contracts
2 Equitable and sustainable water and sanitation services
6 (Infrastructure)
New Growth Path 2
National Development Plan (Chapter 4)
2.1 Increased sustainability in water provision
Provision of affordable infrastructure in an environmentally responsible manner as well as responsible resettlement programmes inclusive of economic livelihood
2.2 Enhanced provision of basic sanitation
Provision of affordable infrastructure in an environmentally responsible manner as well as responsible resettlement programmes inclusive of economic livelihood
2.3 Equitable water allocation Participation in the Key Water Sector initiatives, which are focused on the sustainability of the water sector
2.4 Improved water use efficiency Participation in the Key Water Sector initiatives, which are focused on the sustainability of the water sector
3 Protection of water across the value chain
10 (Environment) 3.1 Strategies for water and sanitation management
Participation in the Key Water Sector initiatives, which are focused on the sustainability of the water sector
3.2 Enhanced regulatory compliance
Participation in the Key Water Sector initiatives, which are focused on the sustainability of the water sector
3.3 Increased water ecosystem health
Participation in the Key Water Sector initiatives, which are focused on the sustainability of the water sector
3.4 Management of water and sanitation information
Participation in the Key Water Sector initiatives, which are focused on the sustainability of the water sector

3333 INTEGRATED ANNUAL REPORT 2015-2016
PERFORMANCE AGAINST THE PREDETERMINED OBJECTIVES
From the contributions that TCTA makes to DWS priorities, four pre-determined objectives have been developed as follows:
1. participation in the Key Water Sector initiatives, which are focused on the sustainability of the water sector;
2. manage the funding and debt on the infrastructure projects in a manner that achieves cost-effective funding, taking into account current and projected market conditions as well as managing risks;
3. construct infrastructure on time, within budget, to the appropriate standards and in a sustainable socio/environmental manner; and
4. Acid Mine Drainage is treated to the correct standard before discharge to the environment.
If the targets, set at the beginning of the financial year, are not met, TCTA is required to explain if the delay will have an influence on service delivery, what that impact is and if any interventions are required to mitigate the impact.
The performance against the predetermined objectives is given in Table 4.
AMD: Central Basin high density treatment plant

3434
PERFORMANCE INFORMATION
INTEGRATED ANNUAL REPORT 2015-2016
Project Date Received Actual progress for 31 March 2015 Actual progress for 31 March 2016 Targeted Progress for 31
March 2016 Variances Reasons for variances and recovery plan
Predetermined Objectives for the Financial Year:Manage the funding and debt on the infrastructure projects in a manner that achieves cost-effective funding, taking into account current and projected market conditions as well as managing risksLesotho Highlands Water Project: To fulfil all the Republic’s financial obligations in terms of or resulting from the Treaty
3 August 1994 (and incorporated into amended Notice of Establishment 24 March 2000)
An outstanding debt of R19 247 million
A debt increase of R283 million resulting an outstanding debt of R19 530 million
Debt repayment remains forecast as 2040
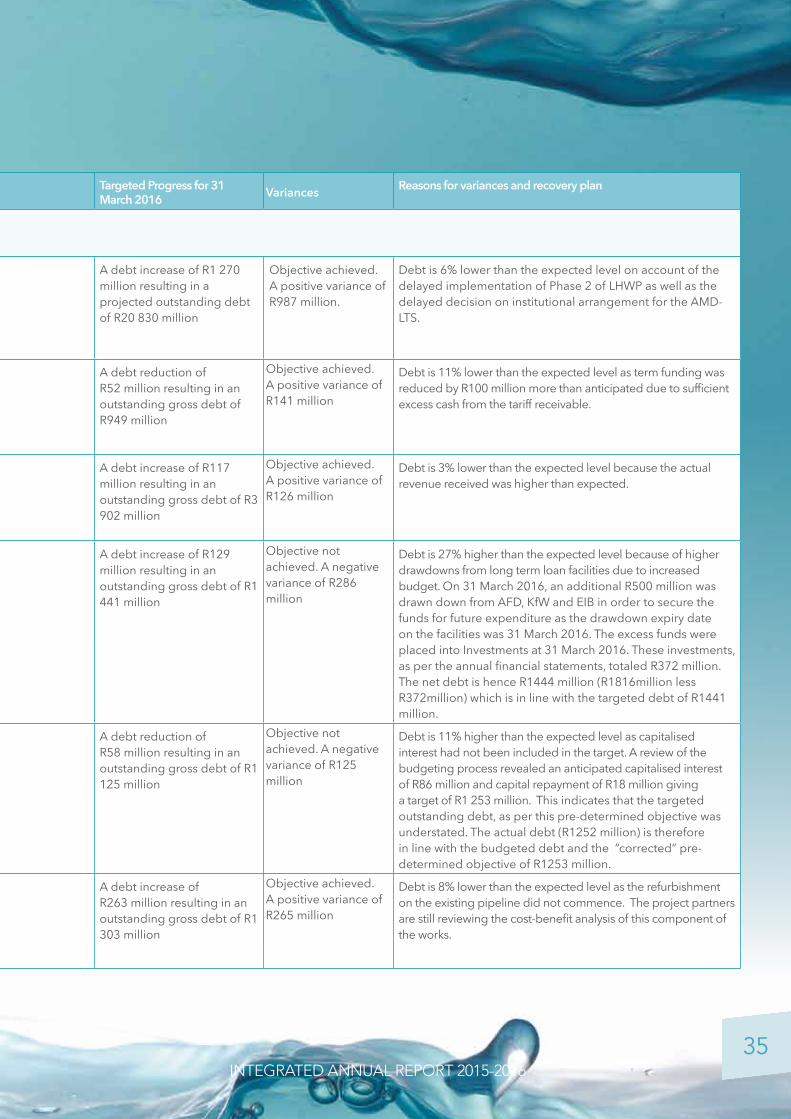
A debt increase of R1 270 million resulting in a projected outstanding debt of R20 830 million
Objective achieved. A positive variance of R987 million.
Debt is 6% lower than the expected level on account of the delayed implementation of Phase 2 of LHWP as well as the delayed decision on institutional arrangement for the AMD-LTS.
Berg Water Project: Dam and Supplementary Scheme
6 May 2002 An outstanding of R1 040 million
A debt reduction of R193 million resulting in an outstanding debt of R847 million
Debt repayment remains forecast as 31 March 2029
A debt reduction of R52 million resulting in an outstanding gross debt of R949 million
Objective achieved. A positive variance of R141 million
Debt is 11% lower than the expected level as term funding was reduced by R100 million more than anticipated due to sufficient excess cash from the tariff receivable.
Vaal River Eastern Subsystem Project: Pump Station and Pipeline
6 October 2004 An outstanding debt of R3 807 million
A debt decrease of R9 million resulting in an outstanding debt of R3 798 million
Debt repayment remains forecast as 31 March 2028
A debt increase of R117 million resulting in an outstanding gross debt of R3 902 million
Objective achieved. A positive variance of R126 million
Debt is 3% lower than the expected level because the actual revenue received was higher than expected.
Mooi-Mgeni Transfer Scheme – Phase 2: Dam, Pump Station and Pipeline
29 November 2007 An outstanding debt of R1 401 million
A debt increase of R415 million resulting in an outstanding debt of R1 816 million
Debt repayment remains forecast as 2034
A debt increase of R129 million resulting in an outstanding gross debt of R1 441 million
Objective not achieved. A negative variance of R286million
Debt is 27% higher than the expected level because of higher drawdowns from long term loan facilities due to increased budget. On 31 March 2016, an additional R500 million was drawn down from AFD, KfW and EIB in order to secure the funds for future expenditure as the drawdown expiry date on the facilities was 31 March 2016. The excess funds were placed into Investments at 31 March 2016. These investments, as per the annual financial statements, totaled R372 million. The net debt is hence R1444 million (R1816million less R372million) which is in line with the targeted debt of R1441 million.
Komati Water Scheme Augmentation Project: Pump Sation and Pipeline
29 September 2008 An outstanding debt of R1 185 million
A debt increase of R67 million resulting in an outstanding debt of R1 252 million
Debt repayment remains forecast as 2033
A debt reduction of R58 million resulting in an outstanding gross debt of R1 125 million
Objective not achieved. A negative variance of R125 million
Debt is 11% higher than the expected level as capitalised interest had not been included in the target. A review of the budgeting process revealed an anticipated capitalised interest of R86 million and capital repayment of R18 million giving a target of R1 253 million. This indicates that the targeted outstanding debt, as per this pre-determined objective was understated. The actual debt (R1252 million) is therefore in line with the budgeted debt and the “corrected” pre-determined objective of R1253 million.
Mokolo and Crocodile River (West) Water Augmentation Project: Pump Station and Pipeline
19 May 2010 An outstanding debt of R1 201 million
A debt decrease of R2 million resulting in an outstanding debt of R1 199 million
Debt repayment remains forecast as 2033
A debt increase of R263 million resulting in an outstanding gross debt of R1 303 million
Objective achieved. A positive variance of R265 million
Debt is 8% lower than the expected level as the refurbishment on the existing pipeline did not commence. The project partners are still reviewing the cost-benefit analysis of this component of the works.
Table 4: Performance on Pre-determined Objectives
3535 INTEGRATED ANNUAL REPORT 2015-2016
Project Date Received Actual progress for 31 March 2015 Actual progress for 31 March 2016 Targeted Progress for 31
March 2016 Variances Reasons for variances and recovery plan
Predetermined Objectives for the Financial Year:Manage the funding and debt on the infrastructure projects in a manner that achieves cost-effective funding, taking into account current and projected market conditions as well as managing risksLesotho Highlands Water Project: To fulfil all the Republic’s financial obligations in terms of or resulting from the Treaty
3 August 1994 (and incorporated into amended Notice of Establishment 24 March 2000)
An outstanding debt of R19 247 million
A debt increase of R283 million resulting an outstanding debt of R19 530 million
Debt repayment remains forecast as 2040
A debt increase of R1 270 million resulting in a projected outstanding debt of R20 830 million
Objective achieved. A positive variance of R987 million.
Debt is 6% lower than the expected level on account of the delayed implementation of Phase 2 of LHWP as well as the delayed decision on institutional arrangement for the AMD-LTS.
Berg Water Project: Dam and Supplementary Scheme
6 May 2002 An outstanding of R1 040 million
A debt reduction of R193 million resulting in an outstanding debt of R847 million
Debt repayment remains forecast as 31 March 2029
A debt reduction of R52 million resulting in an outstanding gross debt of R949 million
Objective achieved. A positive variance of R141 million
Debt is 11% lower than the expected level as term funding was reduced by R100 million more than anticipated due to sufficient excess cash from the tariff receivable.
Vaal River Eastern Subsystem Project: Pump Station and Pipeline
6 October 2004 An outstanding debt of R3 807 million
A debt decrease of R9 million resulting in an outstanding debt of R3 798 million
Debt repayment remains forecast as 31 March 2028
A debt increase of R117 million resulting in an outstanding gross debt of R3 902 million
Objective achieved. A positive variance of R126 million
Debt is 3% lower than the expected level because the actual revenue received was higher than expected.
Mooi-Mgeni Transfer Scheme – Phase 2: Dam, Pump Station and Pipeline
29 November 2007 An outstanding debt of R1 401 million
A debt increase of R415 million resulting in an outstanding debt of R1 816 million
Debt repayment remains forecast as 2034
A debt increase of R129 million resulting in an outstanding gross debt of R1 441 million
Objective not achieved. A negative variance of R286million
Debt is 27% higher than the expected level because of higher drawdowns from long term loan facilities due to increased budget. On 31 March 2016, an additional R500 million was drawn down from AFD, KfW and EIB in order to secure the funds for future expenditure as the drawdown expiry date on the facilities was 31 March 2016. The excess funds were placed into Investments at 31 March 2016. These investments, as per the annual financial statements, totaled R372 million. The net debt is hence R1444 million (R1816million less R372million) which is in line with the targeted debt of R1441 million.
Komati Water Scheme Augmentation Project: Pump Sation and Pipeline
29 September 2008 An outstanding debt of R1 185 million
A debt increase of R67 million resulting in an outstanding debt of R1 252 million
Debt repayment remains forecast as 2033
A debt reduction of R58 million resulting in an outstanding gross debt of R1 125 million
Objective not achieved. A negative variance of R125 million
Debt is 11% higher than the expected level as capitalised interest had not been included in the target. A review of the budgeting process revealed an anticipated capitalised interest of R86 million and capital repayment of R18 million giving a target of R1 253 million. This indicates that the targeted outstanding debt, as per this pre-determined objective was understated. The actual debt (R1252 million) is therefore in line with the budgeted debt and the “corrected” pre-determined objective of R1253 million.
Mokolo and Crocodile River (West) Water Augmentation Project: Pump Station and Pipeline
19 May 2010 An outstanding debt of R1 201 million
A debt decrease of R2 million resulting in an outstanding debt of R1 199 million
Debt repayment remains forecast as 2033
A debt increase of R263 million resulting in an outstanding gross debt of R1 303 million
Objective achieved. A positive variance of R265 million
Debt is 8% lower than the expected level as the refurbishment on the existing pipeline did not commence. The project partners are still reviewing the cost-benefit analysis of this component of the works.
3636
PERFORMANCE INFORMATION
INTEGRATED ANNUAL REPORT 2015-2016
Project Date Received Actual progress for 31 March 2015 Actual progress for 31 March 2016 Targeted Progress for 31
March 2016 Variances Reasons for variances and recovery plan
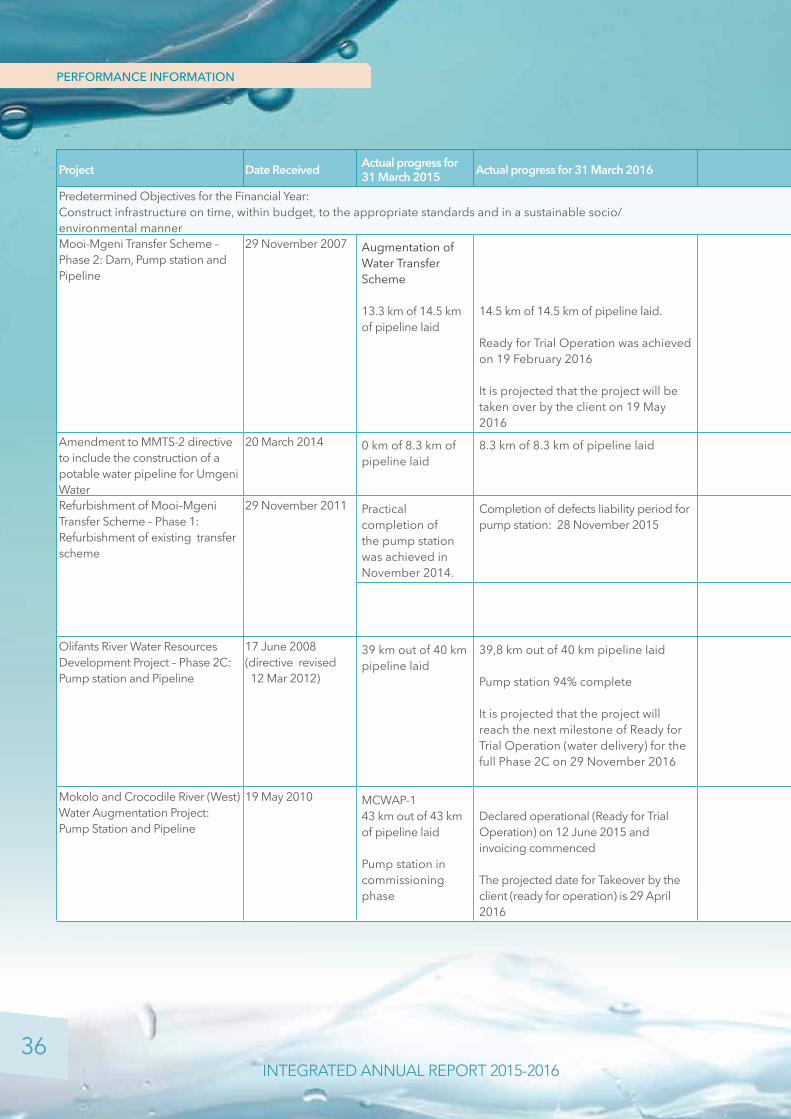
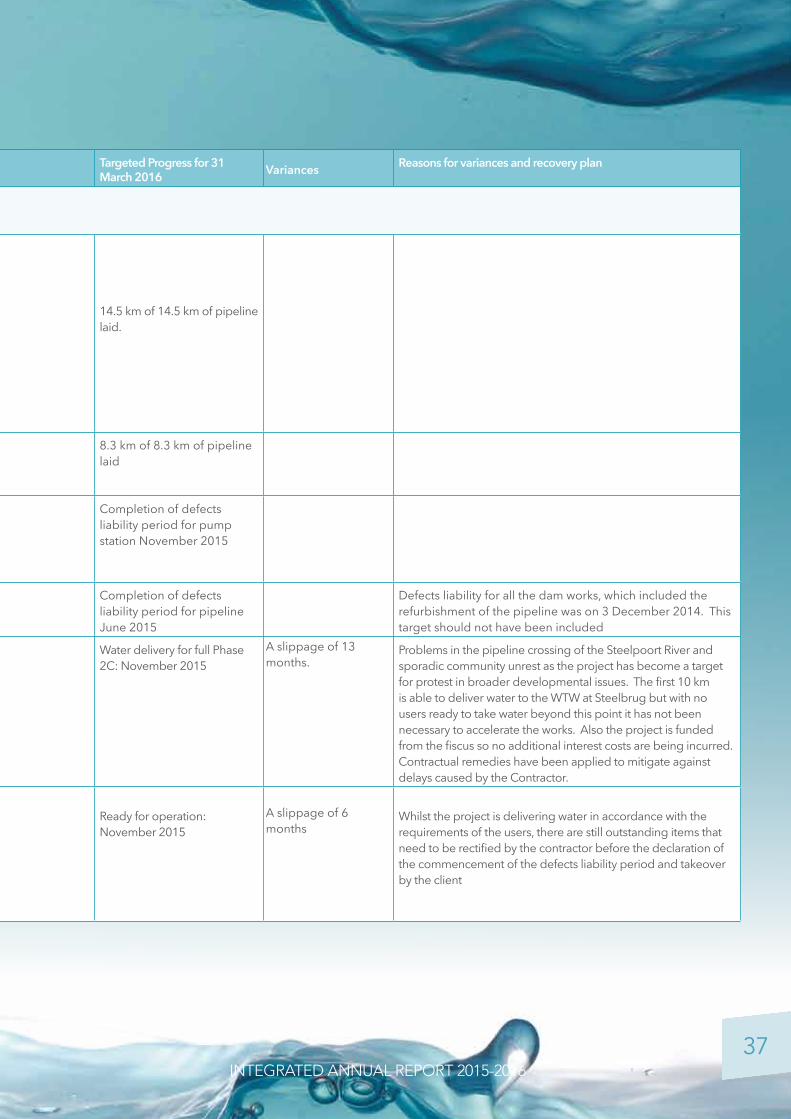
Predetermined Objectives for the Financial Year:Construct infrastructure on time, within budget, to the appropriate standards and in a sustainable socio/environmental mannerMooi-Mgeni Transfer Scheme – Phase 2: Dam, Pump station and Pipeline
29 November 2007 Augmentation of Water Transfer Scheme
13.3 km of 14.5 km of pipeline laid
14.5 km of 14.5 km of pipeline laid.
Ready for Trial Operation was achieved on 19 February 2016
It is projected that the project will be taken over by the client on 19 May 2016
14.5 km of 14.5 km of pipeline laid.
Amendment to MMTS-2 directive to include the construction of a potable water pipeline for Umgeni Water
20 March 2014 0 km of 8.3 km of pipeline laid
8.3 km of 8.3 km of pipeline laid 8.3 km of 8.3 km of pipeline laid
Refurbishment of Mooi–Mgeni Transfer Scheme – Phase 1: Refurbishment of existing transfer scheme
29 November 2011 Practical completion of the pump station was achieved in November 2014.
Completion of defects liability period for pump station: 28 November 2015
Completion of defects liability period for pump station November 2015
Completion of defects liability period for pipeline June 2015
Defects liability for all the dam works, which included the refurbishment of the pipeline was on 3 December 2014. This target should not have been included
Olifants River Water Resources Development Project – Phase 2C: Pump station and Pipeline
17 June 2008 (directive revised 12 Mar 2012)
39 km out of 40 km pipeline laid
39,8 km out of 40 km pipeline laid
Pump station 94% complete
It is projected that the project will reach the next milestone of Ready for Trial Operation (water delivery) for the full Phase 2C on 29 November 2016
Water delivery for full Phase 2C: November 2015
A slippage of 13 months.
Problems in the pipeline crossing of the Steelpoort River and sporadic community unrest as the project has become a target for protest in broader developmental issues. The first 10 km is able to deliver water to the WTW at Steelbrug but with no users ready to take water beyond this point it has not been necessary to accelerate the works. Also the project is funded from the fiscus so no additional interest costs are being incurred. Contractual remedies have been applied to mitigate against delays caused by the Contractor.
Mokolo and Crocodile River (West) Water Augmentation Project: Pump Station and Pipeline
19 May 2010 MCWAP-143 km out of 43 km of pipeline laid
Pump station in commissioning phase
Declared operational (Ready for Trial Operation) on 12 June 2015 and invoicing commenced
The projected date for Takeover by the client (ready for operation) is 29 April 2016
Ready for operation: November 2015
A slippage of 6 months
Whilst the project is delivering water in accordance with the requirements of the users, there are still outstanding items that need to be rectified by the contractor before the declaration of the commencement of the defects liability period and takeover by the client
3737 INTEGRATED ANNUAL REPORT 2015-2016
Project Date Received Actual progress for 31 March 2015 Actual progress for 31 March 2016 Targeted Progress for 31
March 2016 Variances Reasons for variances and recovery plan
Predetermined Objectives for the Financial Year:Construct infrastructure on time, within budget, to the appropriate standards and in a sustainable socio/environmental mannerMooi-Mgeni Transfer Scheme – Phase 2: Dam, Pump station and Pipeline
29 November 2007 Augmentation of Water Transfer Scheme
13.3 km of 14.5 km of pipeline laid
14.5 km of 14.5 km of pipeline laid.
Ready for Trial Operation was achieved on 19 February 2016
It is projected that the project will be taken over by the client on 19 May 2016
14.5 km of 14.5 km of pipeline laid.
Amendment to MMTS-2 directive to include the construction of a potable water pipeline for Umgeni Water
20 March 2014 0 km of 8.3 km of pipeline laid
8.3 km of 8.3 km of pipeline laid 8.3 km of 8.3 km of pipeline laid
Refurbishment of Mooi–Mgeni Transfer Scheme – Phase 1: Refurbishment of existing transfer scheme
29 November 2011 Practical completion of the pump station was achieved in November 2014.
Completion of defects liability period for pump station: 28 November 2015
Completion of defects liability period for pump station November 2015
Completion of defects liability period for pipeline June 2015
Defects liability for all the dam works, which included the refurbishment of the pipeline was on 3 December 2014. This target should not have been included
Olifants River Water Resources Development Project – Phase 2C: Pump station and Pipeline
17 June 2008 (directive revised 12 Mar 2012)
39 km out of 40 km pipeline laid
39,8 km out of 40 km pipeline laid
Pump station 94% complete
It is projected that the project will reach the next milestone of Ready for Trial Operation (water delivery) for the full Phase 2C on 29 November 2016
Water delivery for full Phase 2C: November 2015
A slippage of 13 months.
Problems in the pipeline crossing of the Steelpoort River and sporadic community unrest as the project has become a target for protest in broader developmental issues. The first 10 km is able to deliver water to the WTW at Steelbrug but with no users ready to take water beyond this point it has not been necessary to accelerate the works. Also the project is funded from the fiscus so no additional interest costs are being incurred. Contractual remedies have been applied to mitigate against delays caused by the Contractor.
Mokolo and Crocodile River (West) Water Augmentation Project: Pump Station and Pipeline
19 May 2010 MCWAP-143 km out of 43 km of pipeline laid
Pump station in commissioning phase
Declared operational (Ready for Trial Operation) on 12 June 2015 and invoicing commenced
The projected date for Takeover by the client (ready for operation) is 29 April 2016
Ready for operation: November 2015
A slippage of 6 months
Whilst the project is delivering water in accordance with the requirements of the users, there are still outstanding items that need to be rectified by the contractor before the declaration of the commencement of the defects liability period and takeover by the client

3838
PERFORMANCE INFORMATION
INTEGRATED ANNUAL REPORT 2015-2016
Project Date Received Actual progress for 31 March 2015 Actual progress for 31 March 2016 Targeted Progress for 31
March 2016 Variances Reasons for variances and recovery plan
Refurbishment of Existing Pipeline
The Feasibility study was completed but stakeholders requested further investigations to enable them to undertake a risk assessment on whether to refurbish the pipe or wait until MCWAP-2 is complete to achieve redundancy in the system.
Design and specification finalisation: April 2015
Award of construction contract: November 2015
The original programme is no longer applicable due to change in requirements by the client and stakeholders
The original programme is no longer applicable due to change in requirements by the client and stakeholders
Acid Mine Drainage: Pump Stations and Treatment Plant
6 April 2011 Central BasinPlant declared operational in Dec 2014
Completion of Defects Liability Period: December 2015
Completion of Defects Liability Period: December 2015
Eastern Basin36% completed 93% complete
Ready for trial operations was deferred to 31 March 2016 in terms of the settlement agreement reached with the contractor
The projected date for Ready for Trial Operation is 30 May 2016
Ready for [Trial] Operation January 2016
Slippage of 4 months The deferral of the RFTO date from January until 31 March 2016 was due to a change in the design parameters for the thickener plant. The contractor is working 24 hour shifts to mitigate the risk of further delay. Penalties will be claimed from the contractor, in accordance with the Contract, for every day later than the agreed date.
Predetermined Objectives for the Financial Year:Acid mine drainage is treated to the correct standard before discharge to the environmentAcid Mine Drainage: Pump Stations and Treatment Plant
6 April 2011 Western BasinDischarge of effluent with standards set in directive
98% compliance with discharge standards
The contract to operate and maintain the plant remained between TCTA and Sibanye Gold instead of being transferred to DWS
Sulphate and pH occasionally above the desired parameters
See note 1)
Central BasinThe responsibility for operating and maintain the plant has remained with TCTA instead of being transferred to DWS as anticipated
Sulphate and pH occasionally above the desired limits parameters
See note 1)

3939 INTEGRATED ANNUAL REPORT 2015-2016
Project Date Received Actual progress for 31 March 2015 Actual progress for 31 March 2016 Targeted Progress for 31
March 2016 Variances Reasons for variances and recovery plan
Refurbishment of Existing Pipeline
The Feasibility study was completed but stakeholders requested further investigations to enable them to undertake a risk assessment on whether to refurbish the pipe or wait until MCWAP-2 is complete to achieve redundancy in the system.
Design and specification finalisation: April 2015
Award of construction contract: November 2015
The original programme is no longer applicable due to change in requirements by the client and stakeholders
The original programme is no longer applicable due to change in requirements by the client and stakeholders
Acid Mine Drainage: Pump Stations and Treatment Plant
6 April 2011 Central BasinPlant declared operational in Dec 2014
Completion of Defects Liability Period: December 2015
Completion of Defects Liability Period: December 2015
Eastern Basin36% completed 93% complete
Ready for trial operations was deferred to 31 March 2016 in terms of the settlement agreement reached with the contractor
The projected date for Ready for Trial Operation is 30 May 2016
Ready for [Trial] Operation January 2016
Slippage of 4 months The deferral of the RFTO date from January until 31 March 2016 was due to a change in the design parameters for the thickener plant. The contractor is working 24 hour shifts to mitigate the risk of further delay. Penalties will be claimed from the contractor, in accordance with the Contract, for every day later than the agreed date.
Predetermined Objectives for the Financial Year:Acid mine drainage is treated to the correct standard before discharge to the environmentAcid Mine Drainage: Pump Stations and Treatment Plant
6 April 2011 Western BasinDischarge of effluent with standards set in directive
98% compliance with discharge standards
The contract to operate and maintain the plant remained between TCTA and Sibanye Gold instead of being transferred to DWS
Sulphate and pH occasionally above the desired parameters
See note 1)
Central BasinThe responsibility for operating and maintain the plant has remained with TCTA instead of being transferred to DWS as anticipated
Sulphate and pH occasionally above the desired limits parameters
See note 1)
Notes for the performance objectives 1) A high density treatment plant is a two-step process that first neutralises the acidity and then precipitates the heavy metals.
During the second stage, where the pH is increased further, sulphates are also reduced but this is a secondary objective to the precipitation of the heavy metals. The acceptable pH range for potable water is between 5 and 9.7 and therefore the occasional breaches of 9.5 have no significant effect. Similarly the occasional breaches of the sulphate limit of 3000 mg/l do not significantly impact the total load entering the environment.
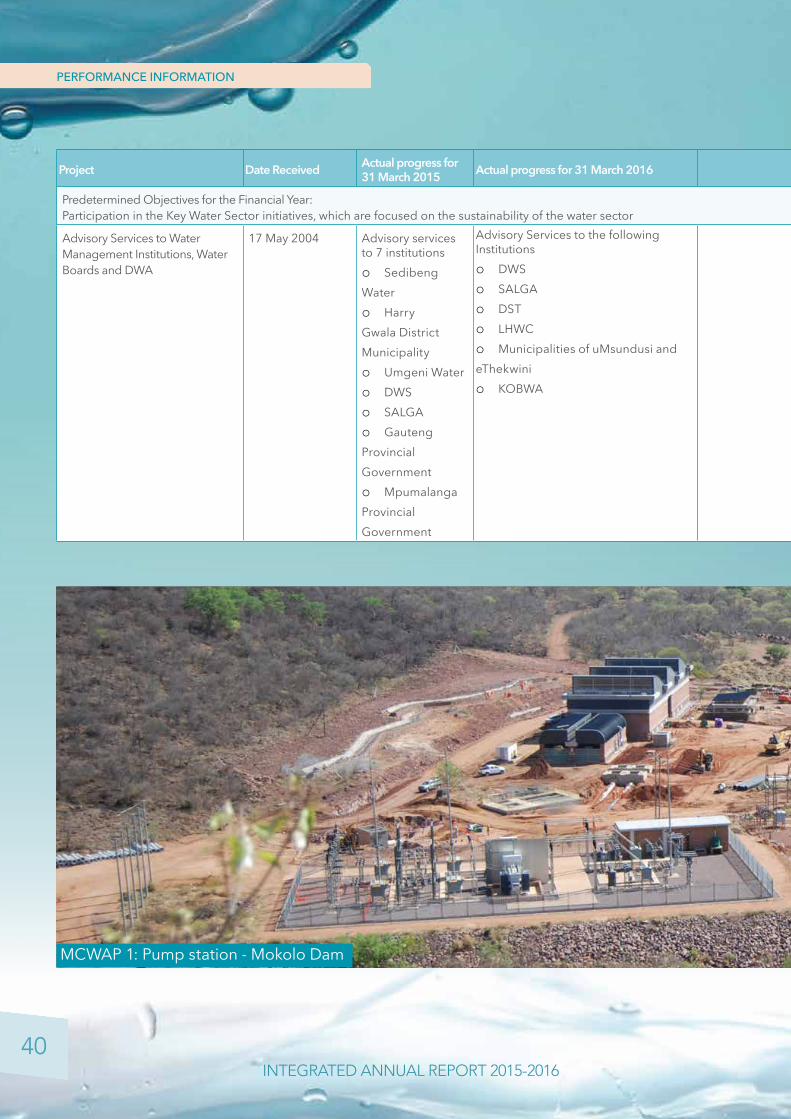
4040
PERFORMANCE INFORMATION
INTEGRATED ANNUAL REPORT 2015-2016
Project Date Received Actual progress for 31 March 2015 Actual progress for 31 March 2016 Targeted Progress for 31
March 2016 Variances Reasons for variances and recovery plan
Predetermined Objectives for the Financial Year:Participation in the Key Water Sector initiatives, which are focused on the sustainability of the water sector
Advisory Services to Water Management Institutions, Water Boards and DWA
17 May 2004 Advisory services to 7 institutionso Sedibeng Watero Harry Gwala District Municipalityo Umgeni Watero DWSo SALGAo Gauteng Provincial Governmento Mpumalanga Provincial Government
Advisory Services to the following Institutionso DWSo SALGAo DSTo LHWCo Municipalities of uMsundusi and eThekwinio KOBWA
Strategic stakeholder engagements with 5 water sector institutions
A positive variance of 1 institutions advised.
The services are undertaken on an ad hoc basis when requested. Such requests were not forthcoming.
MCWAP 1: Pump station - Mokolo Dam
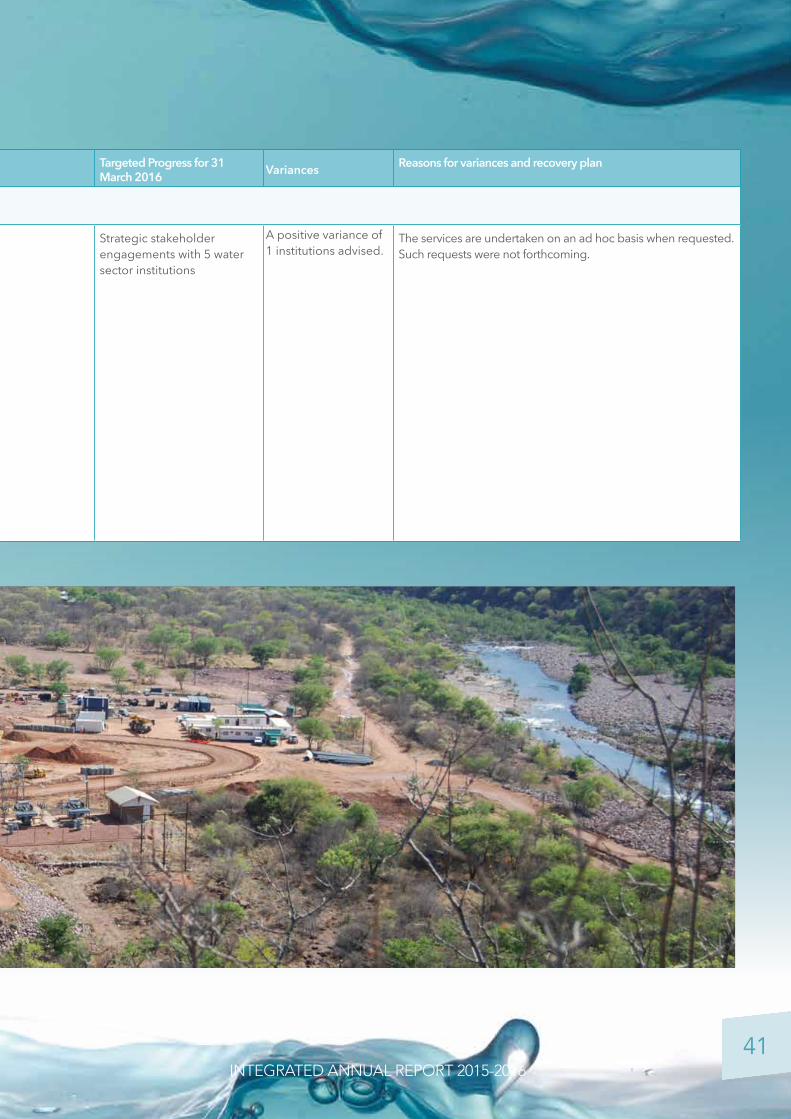
4141 INTEGRATED ANNUAL REPORT 2015-2016
Project Date Received Actual progress for 31 March 2015 Actual progress for 31 March 2016 Targeted Progress for 31
March 2016 Variances Reasons for variances and recovery plan
Predetermined Objectives for the Financial Year:Participation in the Key Water Sector initiatives, which are focused on the sustainability of the water sector
Advisory Services to Water Management Institutions, Water Boards and DWA
17 May 2004 Advisory services to 7 institutionso Sedibeng Watero Harry Gwala District Municipalityo Umgeni Watero DWSo SALGAo Gauteng Provincial Governmento Mpumalanga Provincial Government
Advisory Services to the following Institutionso DWSo SALGAo DSTo LHWCo Municipalities of uMsundusi and eThekwinio KOBWA
Strategic stakeholder engagements with 5 water sector institutions
A positive variance of 1 institutions advised.
The services are undertaken on an ad hoc basis when requested. Such requests were not forthcoming.

4242
PERFORMANCE INFORMATION
INTEGRATED ANNUAL REPORT 2015-2016
Introduction
TCTA has a number of roles from a strategic financial perspective. These are:1) raising finance for projects, on behalf of DWS, that
will be recovered through user tariffs (either partially or fully);
2) if implementing the projects on behalf of DWS, ensuring that sufficient funds are available at all times to meet the requirements during construction. Where long-term funds are utilised TCTA enters into short-term investments to offset costs of these long-term funding; and
3) working with DWS to ensure that the tariff, set in terms of the Pricing Strategy, is sufficient to cover their obligations and the obligations that TCTA has incurred on their behalf. These obligations comprise of interest payable on funding obligations and capital repayments on all projects funded outside the fiscus, operation and maintenance costs on certain projects, and other obligations of the South African Government in respect of the Lesotho Highlands Water Project.
The following main elements in TCTA’s financial statements are discussed in the following sections:
The Tariff Receivable
The Tariff Receivable represents TCTA’s right to recover the project costs incurred for the funding, construction and implementation of national water infrastructure as well as the subsequent management of the debt incurred for the implementation of these projects. The Tariff Receivable relates to the present value of all cash flows that are payable by DWS to TCTA in order to settle construction costs and other expenses incurred for each project.
The amounts received on a monthly basis from DWS decreases the outstanding Tariff Receivable balance
(refer to note 7.4 for details on the calculation of the Tariff Receivable).
The current year saw a change in the Lesotho Highlands Water Project (LHWP), now referred to as Vaal River System (VRS) financial asset as a result of a change in the estimation of future net cash flows.
In the previous financial years costs, incurred on LHWP 1 & 2 and Acid Mine Drainage (AMD) had been separately disclosed due to the recoverability methodology of these costs being different for the two projects. In the 2015/16 year, the Minister approved a tariff for the recovery of costs incurred for the Vaal River System (VRS) which comprises LHWP 1 & 2 and AMD. The aim is to ensure sufficient water resource availability while ensuring affordability to the end user. The impact of introducing the VRS is that a single pool of funding will be utilised for all costs associated with the system and this debt will be repaid using the tariff as computed on an annual basis by TCTA during the debt repayment period.
In alignment with the requirements of IFRS 9 the future net cash flows for the VRS have been taken into consideration in determining the present value of the financial asset. Due to the revised future cash flows being significantly different from the prior year, this has triggered the need to derecognise the initial LHWP asset and recognise a VRS asset with a revised effective interest rate. IFRS 9 requires that the fair value of the asset be determined upon initial recognition of the financial asset. The effective interest rate of the old LHWP financial asset was compared to a market-related discount rate of the new VRS financial asset and this resulted in a loss.
The introduction of the VRS asset, which represents a new reporting segment and replaces the two segments which were previously reported - LHWP and AMD, does not result in a need for prior year restatement but a representation of prior year segmental disclosure had to be made so as to provide appropriate comparatives for the user.
FINANCIAL SUMMARY

4343 INTEGRATED ANNUAL REPORT 2015-2016
The decrease in the Tariff Receivable from R26 456 million at 31 March 2015 to R25 680 million at 31 March 2016 is primarily due to the recognition of the the new VRS asset and the construction costs being incurred in the period being less than the tariff which has been received from DWS.
Cash Inflows
As a non-profit organisation, the aggregate net cash inflows and outflows as shown in Figure 5 and 6 respectively will always balance to nil at the end of each project, once all debt has been repaid.
On aggregate the cash inflows for the year ended 31 March 2016 are higher than for 31 March 2015.
The increase of 9% in the Tariff from DWS is due to payments relating to prior year received in the current year (late payments). Tariff billing for the current year was also higher predominantly due to increased volumes and tariffs. Transfers from DWS, being projects funded through the Government of South Africa, for the ORWRDP and AMD projects, decreased by 5% due to no further payments being made on ORWRDP until depletion of the advance received and the change in recovery mechanism for AMD. During 2015 the AMD project costs were added to the LHWP funding programme.
The drawdowns from loans have decreased by 10% due to the need for drawdowns only arising for MMTS and VRESAP, as detailed in distribution of debt across projects.
Figure 5: Cash inflows
Total = R7 469 million
2016 2015
72%5%
13%
6%4% 2%
Tariff from DWS
Transfers from DWS
Drawdowns from loans
Interest received
Proceeds on the sale of financial assets
Total = R7 068 million
4%
63%10%
23%

4444
PERFORMANCE INFORMATION
INTEGRATED ANNUAL REPORT 2015-2016
Utilisation of Cash Received
Total cash outflows increased due to increased construction costs, investments and the settlement of trade creditors. Construction costs marginally decreased as most of the projects activities are in the winding down stage. The increase in construction costs was mainly in the VRS project.
Interest paid increased by 13% in the current year due to increased payments for MCWAP, KWSAP and ORWRDP for debt servicing.
The Treaty related costs increased by 12% due to increases in Royalties paid and operating costs for works in Lesotho. Remuneration related costs have remained within 5% of total outflows with 2% of total payments made contributing towards remuneration.
Sources of Funding
The total Rand value of Bonds issued as at 31 March 2016 increased from R18 919 million in 2015 to R19 140 million in 2016. This is due to the increase in the CPI which has resulted in a corresponding increase of R391 million in the WS05 CPI-linked bond. However, the composition of the sources of funding has changed slightly as reflected in the graphs depicted in Figure 7. There was an overall
decrease of 2% in the funding from bonds due to the increase in the utilisation of long-term funding from commercial banks.
Funding from commercial banks has increased by 3% in the current year and primarily related to drawdowns on loans, utilised on MMTS-2 and KWSAP.
Figure 6: Cash Outflows
2016 Cash paid to suppliers
Capital repayments
Interest paid
Investments made
Royalties on LHWP LHDA and LHWC costs.
Remuneration related
Additions to property, plant and equipment
Expenditure on construction of new infrastructureTotal cash outflows = R7 468 million
2%
13%
35%
14%
12%24%
2015
Total cash outflows = R7 068 million
2%
23%
39%
11%
14%21%
0%
10%

4545 INTEGRATED ANNUAL REPORT 2015-2016
Distribution of Debt across Projects
In TCTA’s strive to support DWS, debt management is one of its main objectives. The repayment of the funding on LHWP-1 and securing funding for the VRS is TCTA’s largest contribution to the country’s water security. In
the current financial year, the overall debt outstanding had slightly increased by R559 million and as at 31 March 2016 the closing balance was R28 440 million. The increase is the net result of an additional drawdown on MMTS-2 and KWSAP, offset by repayments in VRS and BWP.
Figure 7: Funding instruments
Total debt = R28 440 million
67%
29%
2%2%
2016 2015
Bonds
Commercial Paper Programme (CPP)
Development Finance Institutions (DFI)
Commercial banks
Total debt = R27 881 million
67%3%
28%
1%
Figure 8: Total debt by project
2016 2015
Total debt = R28 000 million
70%3%
13%
6%4% 4%
LHWP
BWP
VRESAP
MMTS
KWSAP
MCWAP
Total debt = R27 881 million
68%4%
14%
6%4% 4%
46
SUSTAINABILITY AND TRANSFORMATION
INTEGRATED ANNUAL REPORT 2015-2016
AMD: Central Basin high density treatment plant

47 INTEGRATED ANNUAL REPORT 2015-2016
PART C: Sustainability and Transformation
48
49
49
51
53
57
59
60
62
64
INTRODUCTION
ENVIRONMENTAL MANAGEMENT
MITIGATION OF ENVIRONMENTAL IMPACTS
MITIGATION OF SOCIAL IMPACTS
SOCIO-ECONOMIC DEVELOPMENT
HEALTH AND SAFETY
EMPLOYMENT AND EMPLOYMENT EQUITY ON PROJECTS
EMPLOYMENT AND EMPLOYMENT EQUITY AT TCTA
HUMAN CAPITAL PRACTICES
TOWARDS A CULTURE OF KNOWLEDGE AND LEARNING
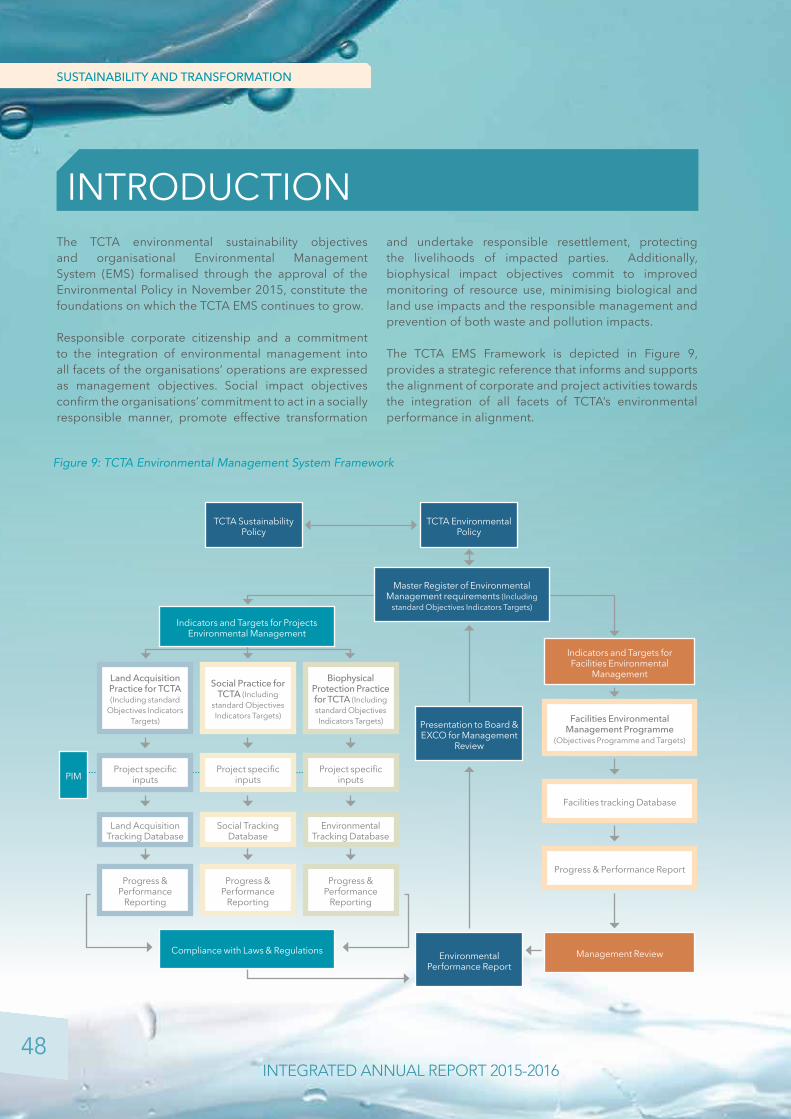
48
SUSTAINABILITY AND TRANSFORMATION
INTEGRATED ANNUAL REPORT 2015-2016
The TCTA environmental sustainability objectives and organisational Environmental Management System (EMS) formalised through the approval of the Environmental Policy in November 2015, constitute the foundations on which the TCTA EMS continues to grow.
Responsible corporate citizenship and a commitment to the integration of environmental management into all facets of the organisations’ operations are expressed as management objectives. Social impact objectives confirm the organisations’ commitment to act in a socially responsible manner, promote effective transformation
and undertake responsible resettlement, protecting the livelihoods of impacted parties. Additionally, biophysical impact objectives commit to improved monitoring of resource use, minimising biological and land use impacts and the responsible management and prevention of both waste and pollution impacts.
The TCTA EMS Framework is depicted in Figure 9, provides a strategic reference that informs and supports the alignment of corporate and project activities towards the integration of all facets of TCTA’s environmental performance in alignment.
INTRODUCTION
TCTA Sustainability Policy
Indicators and Targets for Projects Environmental Management
Indicators and Targets for Facilities Environmental
Management
Facilities Environmental Management Programme
(Objectives Programme and Targets)
Facilities tracking Database
Progress & Performance Report
Management ReviewCompliance with Laws & Regulations
TCTA Environmental Policy
Master Register of Environmental Management requirements (Including
standard Objectives Indicators Targets)
Presentation to Board & EXCO for Management
Review
Land Acquisition Practice for TCTA (Including standard
Objectives Indicators Targets)
Project specific inputs
Land Acquisition Tracking Database
Progress & Performance
Reporting
PIM
Social Practice for TCTA (Including
standard Objectives Indicators Targets)
Project specific inputs
Social Tracking Database
Progress & Performance
Reporting
Biophysical Protection Practice for TCTA (Including standard Objectives Indicators Targets)
Project specific inputs
Environmental Tracking Database
Progress & Performance
Reporting
Environmental Performance Report
Figure 9: TCTA Environmental Management System Framework
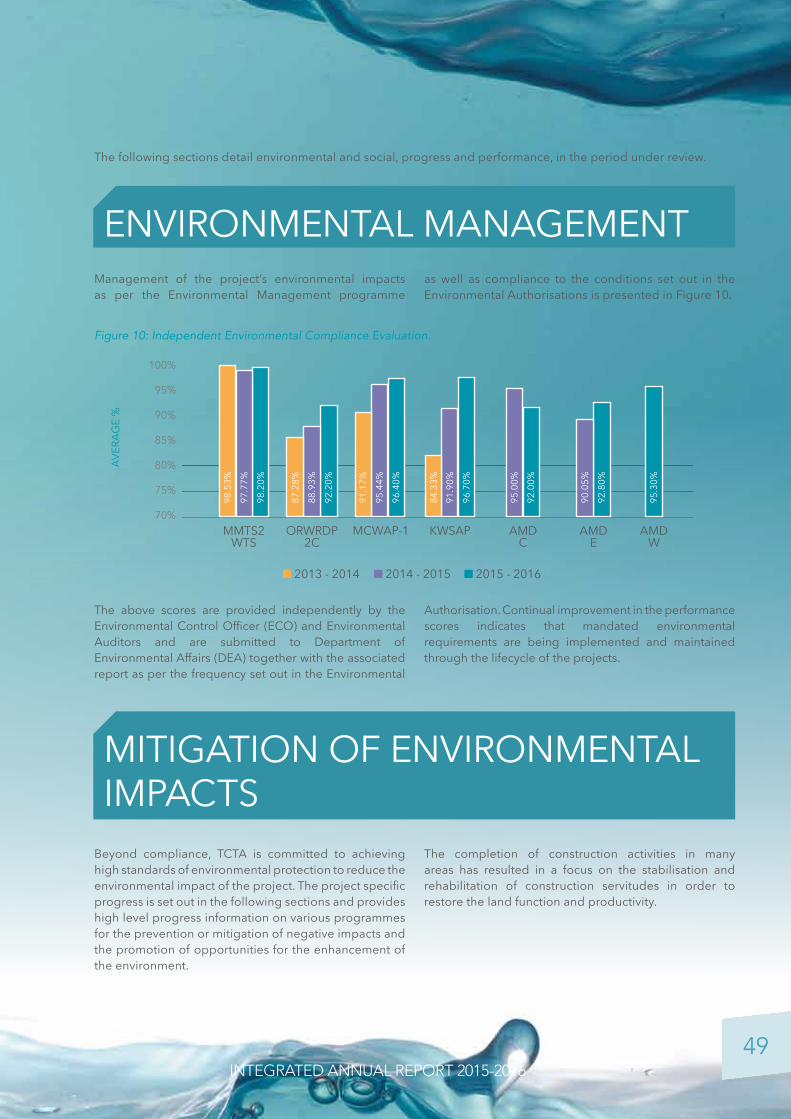
49 INTEGRATED ANNUAL REPORT 2015-2016
Management of the project’s environmental impacts as per the Environmental Management programme
as well as compliance to the conditions set out in the Environmental Authorisations is presented in Figure 10.
The following sections detail environmental and social, progress and performance, in the period under review.
MITIGATION OF ENVIRONMENTAL IMPACTS
Beyond compliance, TCTA is committed to achieving high standards of environmental protection to reduce the environmental impact of the project. The project specific progress is set out in the following sections and provides high level progress information on various programmes for the prevention or mitigation of negative impacts and the promotion of opportunities for the enhancement of the environment.
The completion of construction activities in many areas has resulted in a focus on the stabilisation and rehabilitation of construction servitudes in order to restore the land function and productivity.
The above scores are provided independently by the Environmental Control Officer (ECO) and Environmental Auditors and are submitted to Department of Environmental Affairs (DEA) together with the associated report as per the frequency set out in the Environmental
Authorisation. Continual improvement in the performance scores indicates that mandated environmental requirements are being implemented and maintained through the lifecycle of the projects.
Figure 10: Independent Environmental Compliance Evaluation.
100%
95%
90%
85%
80%
75%
70%
AVER
AGE
%
2015 - 2016 2013 - 2014 2014 - 2015
MMTS2WTS
ORWRDP2C
MCWAP-1 KWSAP AMD C
AMD E
AMD W
98.5
3%
87.2
8%
91.1
7%
84.3
3%
97.7
7%
88.9
3%
95.4
4%
91.9
0%
95.0
0%
90.0
5%
98.2
0%
92.2
0%
96.4
0%
96.7
0%
92.0
0%
92.8
0%
95.3
0%
ENVIRONMENTAL MANAGEMENT
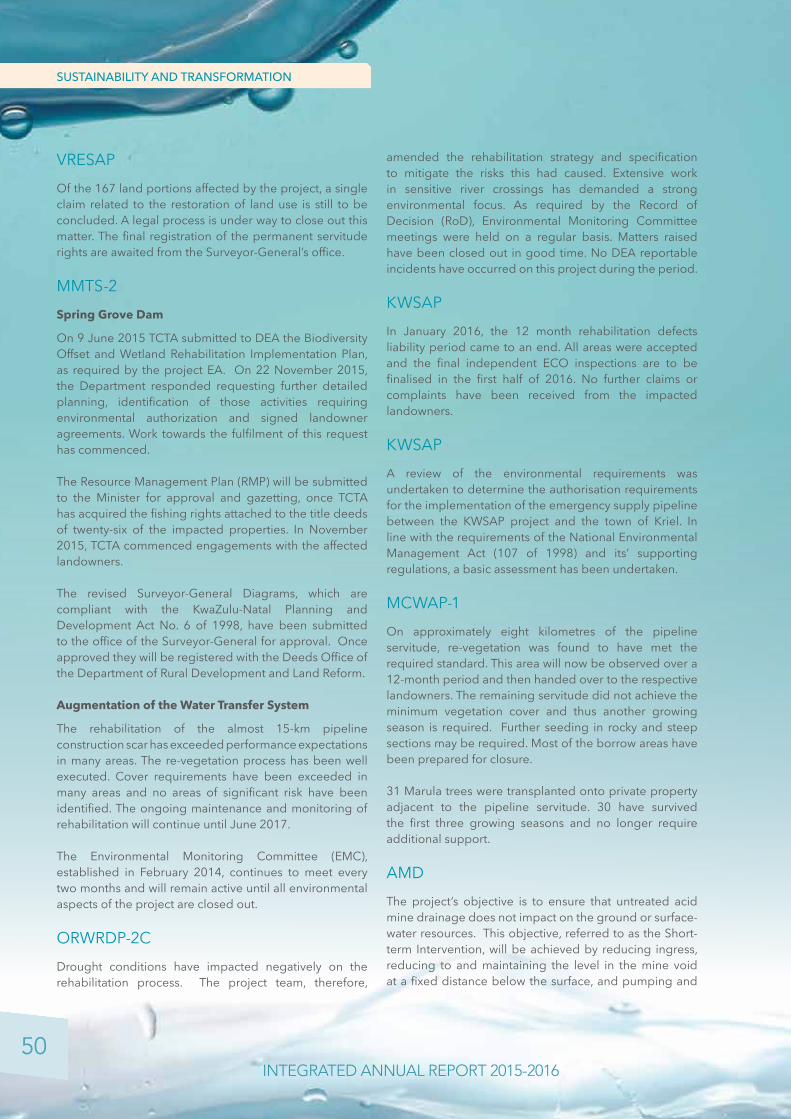
50
SUSTAINABILITY AND TRANSFORMATION
INTEGRATED ANNUAL REPORT 2015-2016
VRESAPOf the 167 land portions affected by the project, a single claim related to the restoration of land use is still to be concluded. A legal process is under way to close out this matter. The final registration of the permanent servitude rights are awaited from the Surveyor-General’s office.
MMTS-2Spring Grove Dam
On 9 June 2015 TCTA submitted to DEA the Biodiversity Offset and Wetland Rehabilitation Implementation Plan, as required by the project EA. On 22 November 2015, the Department responded requesting further detailed planning, identification of those activities requiring environmental authorization and signed landowner agreements. Work towards the fulfilment of this request has commenced.
The Resource Management Plan (RMP) will be submitted to the Minister for approval and gazetting, once TCTA has acquired the fishing rights attached to the title deeds of twenty-six of the impacted properties. In November 2015, TCTA commenced engagements with the affected landowners.
The revised Surveyor-General Diagrams, which are compliant with the KwaZulu-Natal Planning and Development Act No. 6 of 1998, have been submitted to the office of the Surveyor-General for approval. Once approved they will be registered with the Deeds Office of the Department of Rural Development and Land Reform.
Augmentation of the Water Transfer System
The rehabilitation of the almost 15-km pipeline construction scar has exceeded performance expectations in many areas. The re-vegetation process has been well executed. Cover requirements have been exceeded in many areas and no areas of significant risk have been identified. The ongoing maintenance and monitoring of rehabilitation will continue until June 2017.
The Environmental Monitoring Committee (EMC), established in February 2014, continues to meet every two months and will remain active until all environmental aspects of the project are closed out.
ORWRDP-2CDrought conditions have impacted negatively on the rehabilitation process. The project team, therefore,
amended the rehabilitation strategy and specification to mitigate the risks this had caused. Extensive work in sensitive river crossings has demanded a strong environmental focus. As required by the Record of Decision (RoD), Environmental Monitoring Committee meetings were held on a regular basis. Matters raised have been closed out in good time. No DEA reportable incidents have occurred on this project during the period.
KWSAPIn January 2016, the 12 month rehabilitation defects liability period came to an end. All areas were accepted and the final independent ECO inspections are to be finalised in the first half of 2016. No further claims or complaints have been received from the impacted landowners.
KWSAPA review of the environmental requirements was undertaken to determine the authorisation requirements for the implementation of the emergency supply pipeline between the KWSAP project and the town of Kriel. In line with the requirements of the National Environmental Management Act (107 of 1998) and its’ supporting regulations, a basic assessment has been undertaken.
MCWAP-1On approximately eight kilometres of the pipeline servitude, re-vegetation was found to have met the required standard. This area will now be observed over a 12-month period and then handed over to the respective landowners. The remaining servitude did not achieve the minimum vegetation cover and thus another growing season is required. Further seeding in rocky and steep sections may be required. Most of the borrow areas have been prepared for closure.
31 Marula trees were transplanted onto private property adjacent to the pipeline servitude. 30 have survived the first three growing seasons and no longer require additional support.
AMD The project’s objective is to ensure that untreated acid mine drainage does not impact on the ground or surface-water resources. This objective, referred to as the Short-term Intervention, will be achieved by reducing ingress, reducing to and maintaining the level in the mine void at a fixed distance below the surface, and pumping and

51 INTEGRATED ANNUAL REPORT 2015-2016
TCTA takes the impacts of its infrastructure developments very seriously. The consequences of launching these projects include disruptions to people’s daily lives, the need to move graves and in some cases the requirement to transfer people to new homes and to re-establish their livelihoods.
TCTA, together with its project implementation partners, works hard to minimise the negative effects, to address concerns and identify areas of opportunity to make a difference for the better. While the construction lifespan of TCTA projects is short-lived, these initiatives provide the opportunity to interact in a way that makes a lasting positive difference in the lives of individuals and communities.
Through clearly defined communication channels, dedicated project personnel engage with a wide
array of stakeholders to ensure effective information provision, identification and resolution of risks and challenges, and the communication of opportunities. Regular interactions are undertaken with community leaders, government departments, local authorities, directly affected landowners and rights holders. Where appropriate, specialist forums are convened to address particular requirements.
VRESAP TCTA donated ten computers to Dipaleseng Local Municipality for use in public libraries during 2015/2016. This is intended to address the growing need for students and the youth to acquire improved computer skills.
treating, to a level fit for purpose, that volume that cannot be prevented from entering the mine void.
DWS has directed TCTA to undertake certain interventions towards achieving this objective.
Western Basin
In the western basin the immediate objective was to stop decant through the refurbishment of an existing plant. It has not been totally successful as the plant’s capacity is insufficient to cater for the flows and untreated decant has entered the environment.
The first step in the implementation of the short-term intervention has been implemented by building a new pump station that more than doubles the volume that can be abstracted. The plant will now be expanded to treat an increased volume.
The effluent from the plant, however, complied with the discharge specification of 98% of the time.
Central Basin
The construction of the short-term intervention was completed in December 2014. Since then compliance
with the discharge standard has been largely achieved. The sludge is being co-disposed of in DRDGOLD’s Brakpan tailings facility. The plant has demonstrated sufficient capacity to enable the water level in the mine void to be held and drawn down if required.
Despite post construction rehabilitation efforts, the route from the works to the Elsbergspruit remains compromised by the illegal dumping of waste from the surrounding industries.
Eastern Basin
The commencement of works in June 2014 on the Eastern Basin site required special security measures to ensure the safety of employees as the project activities resulted in a disruption to the illegal mining operations that had been in place on the unoccupied mining land.
The Department of Environmental Affairs has issued an Environmental Authorisation (EA) for sludge disposal on the Grootvlei disposal site. The operational phase of the plant is planned for May 2016.
MITIGATION OF SOCIAL IMPACTS

52
SUSTAINABILITY AND TRANSFORMATION
INTEGRATED ANNUAL REPORT 2015-2016
MMTS-2SPRING GROVE DAM
Spring Grove Dam Resettlement Houses
Significant progress has been made to resettle unregistered property rights holders, displaced by the impoundment of the Spring Grove Dam. In line with the project Resettlement Action Plan, measures were adopted to ensure that all families affected, are no worse off than they were before the dam’s development.
On 15 December 2015, The Minister of Water and Sanitation, Ms. Nomvula Mokonyane, officially handed over 36 new houses to families who were relocated from the Spring Grove Dam basin. Minister Mokonyane was joined by KwaZulu-Natal Premier Hon. Mr Senzo Mchunu, MPL for the handover at Bruntville Township in Mooi River.
In her address, Minister Mokonyane said, “This is to demonstrate our commitment that was made by the government on the development of the dam which was officially opened by President Jacob Zuma in the year 2013, that those who were relocated would be assisted in terms of relocation and provision of decent accommodation”.
To date, a total of 40 out of 41 resettlement houses have been provided. TCTA is processing the registrations of title deeds, which will be given to the new homeowners.
Graves
The final elements of the grave relocation process are nearing completion and will conclude with a joint ritual closure ceremony for the exhumed and reburied remains and for where no remains could be found. This will mark the culmination of a transparent and consultative process that saw the registration of 227 potential graves, 157 of which were identified for full investigation and with 107 yielding remains that were exhumed and reburied. All the requirements of the South African Heritage Resources Agency and Amafa aKwaZulu-Natali requirements have been met.
ORWRDP-2CResettlement
The relocation of the ten families that were affected by the pipeline installation, to newly constructed
homes outside of the construction servitude, has been concluded. This process was conducted in line with the ORWRDP Resettlement Action Plan that was independently reviewed. The physical resettlement was appropriate for the nature and scale of the project. Rehabilitation of the disturbed land and its production potential is ongoing to ensure that there are no lasting adverse effects on livelihoods.
Social Projects
Social projects in the ORWRDP project areas are undertaken in collaboration with the local authorities, project service provider and the receiving communities.
Most of the inhabitants of the villages adjacent to the project rely on river water to meet their needs as a result of the lack of working water services infrastructure. With the completion of the feasibility study for “Borehole Project”, being implemented in conjunction with the Sekhukhune District Municipality, the next phase of the work for the refurbishing or re-equipping of existing boreholes and storage facilities, has been implemented. Three communities are benefitting from this project with progress as follows: Mampuru community; the borehole is completed but awaits electrification, Garagopola community; the project is at procurement stage and Magolego community; the project is at planning stage.
The “Passport to Future” project provided a group of 287 job-seeking graduates and matriculants with skills to improve their prospects of securing employment. The project served as a basis for further development of the youth and attracted the interest of potential employers. To date, 82 of the participants have secured employment and 12 have been enrolled for further studies.
MCWAP-1The project keeps the stakeholders, especially affected landowners, abreast of developments via a newsletter. Consultations occur with landowners on a one-on-one basis to address specific individual’s concerns and issues. In this regard discussions were held on extension of access for construction and the compensation payable. The majority of the landowners agreed to the amount proposed by TCTA, whilst three landowners opted for the appointment of professional valuer.
Also, consultations with authorities happen on a regular basis.

53 INTEGRATED ANNUAL REPORT 2015-2016
SOCIO-ECONOMIC DEVELOPMENTTCTA has an enterprise development programme mainly aimed at the enhancement of the capability of black-owned enterprises (BOEs) to execute mega capital infrastructure projects. Identified enterprise development beneficiaries (EDBs) that have a specified minimum CIDB Grading are provided with opportunities to participate on TCTA capital infrastructure projects under the mentorship of a large construction company. The requirement to assist the EDB to double its annual turnover by the completion of the project forms part of the contractual obligation of the large contractor. Evidence of the effectiveness of the program is in the improvement of the CIDB Grading of the enterprise development beneficiary.
The implementation of TCTA projects provides the organisation with opportunities to improve on the long-term and short-term futures of emerging enterprises, historically disadvantaged persons, and the communities most affected.
Transformation targets are incorporated into all construction contracts to act as a means of ensuring that the development of skills and enterprises, preferential procurement and the creation of meaningful short-term employment opportunities are a priority during project implementation. Throughout the project life cycle, progress and performance against agreed targets are managed interactively and are recorded in detailed monthly socio-economic development reports compiled by the various contractors. Independent audit reports verify the achievements and reporting accuracy.
MMTS 2 - Augmentation of Water Transfer SchemeThe Contractor’s enterprise development programme has made good progress with preferential procurement targets being substantially exceeded and ongoing enterprise development initiatives on track to attain the contracted performance target. These beneficiaries have
worked on the housing infrastructure, pump station, break pressure tank and valve chambers. Targets set for skills development have been met.
The Implementation of enterprise development in this scheme has seen the identification of five EDBs. Of the five EDBs, Fikile and Thekwane were engaged as Main Nominated Enterprise Development Beneficiaries (MNEBDs) with the objective of preparing them to be able to undertake bigger multidisciplinary construction projects independently or on joint-venture arrangements in future. Through monitoring contact sessions, TCTA can proudly attest that these MNEDBs have been developed to function in bigger multidisciplinary construction projects either independently or on a joint venture arrangement. The change in CIDB grade of Fikile Construction from 8 GBPE to 9 GBPE bears testimony to this development. Other areas where these MNEDBs have shown improvement through the enterprise development of this scheme are quality assurance (quality management systems), procurement, claims management, OHS, preparation of construction method statement and construction programme management and scheduling.
With respect to preferential procurement programmes of this scheme, TCTA can proudly attest that of the 36 preferential procurement beneficiaries, 19 are Black Women-Owned Enterprises with a commanding cumulative expenditure of R159.8 million. Additionally, Black Owned Local Enterprises (BOEL) and Black Women Owned Local Enterprises (BWOEL) are commanding R70.6 Million and R41.5 million respectively changing lives of local communities in UMgungundlovu Municipality in the Kwazulu-Natal Province.

54
SUSTAINABILITY AND TRANSFORMATION
INTEGRATED ANNUAL REPORT 2015-2016
Table 5: Expenditure on Transformation on MMTS-2 (Augmentation of Water Transfer Scheme) as at the end of the 2015-2016.
MMTS2 WTSCategory Target Expenditure
to date% Progress
Preferential Procurement
R 100 347 188 R 439 728 952 438,2%
Enterprise Development
R 142 000 738 R 136 685 600 96,3%
Skills Development
R 2 336 679 R 2 351 158 100,6%
ORWRDP-2CAll contracted SED targets have been substantially exceeded and demonstrate the projects continues commitment to maximising opportunities to benefit local and emerging enterprises. A total of 324 persons were actively employed on the project at the end of the financial year.
Socio Economic Development on the ORWRDP was implemented successfully with the main contractor exceeding the set targets in all three categories, greatly benefiting the suppliers and contractors and local people through employment and skills development.
Enterprise Development: three black owned contractors took part on the project as main nominated enterprise development beneficiaries and their performance was exceptional. All three contractors went through a rigorous mentorship programme and training that covered contract management, quality assurance, programming, health and safety, materials management etc. and these were beneficial to them as evident by the increment of their original contract amounts.
Anquet Construction Solutions (Pty) Ltd, 100 % black woman owned contractor, was appointed to build the pump station. They were originally allocated R29 million and due to their impressive progress and mentorship offered by the main contractor their final measured scope work was R78 million. Their CIDB grading at the start of project was 6 CEPE and has improved to 7 CEPE.
Makgetsi Construction, 100 % black woman owned contractor, was appointed to build concrete chambers. They were originally allocated R78 million and due to their impressive progress and mentorship offered by the main contractor their final measured scope work was R100 million.
BR Tsima Construction, 85 % black owned contractor, 13 % black woman owned, was appointed to build the pump station. They were originally allocated R34 million and due to their impressive progress and mentorship offered by the main contractor their final measured scope work was R76 million.
Preferential procurement: this programme was implemented successfully and benefited 28 black owned entities, of this number 12 were black women owned entities with a cumulative expenditure of R376 million. An original amount of R274 million was contracted for preferential procurement and at the end of this programme R436 was spent. Part of the R436 million was R90 million spent on local black owned contractors and suppliers.
Skills Development: this programme achieved great success and benefited 918 black people, 908 were local people. A total of 120 were women and 628 were youth. A significant number, 834 was at lower CETA technical skills training and this will greatly improve their chances of securing employment in the mining sector in the area. There were 12 bursaries that were allocated towards studies in the construction sector.
Table 6: Expenditure on Transformation on ORWRDP-2C as at the end of the 2015-2016
OLIFANTSCategory Target Expenditure to
date% Progress
Preferential Procurement
R 301 923 076 R 436 057 453 144,4%
Enterprise Development
R 142 563 076 R 257 481 536 180,6%
Skills Development
R 12 472 850 R 14 247 388 114,2%

55 INTEGRATED ANNUAL REPORT 2015-2016
MCWAP-1The MCWAP Phase 1 SED targets for the project have been significantly exceeded in all areas. An independent audit of the Contractors performance was done and all SED deliverables have been completed.
The Implementation of enterprise development in this scheme has seen engagement of four enterprise development beneficiaries. Of the four enterprise development beneficiaries, Boikamo Civils and Building Construction CC was engaged as MNEBD with the objective of preparing it to be able to undertake bigger multidisciplinary construction projects independently or on joint-venture arrangements in future. Through monitoring, TCTA can proudly attest that Boikamo have been developed to function in bigger multidisciplinary construction projects either independently or on a joint venture arrangement. Areas where Boikamo has shown improvement through the enterprise development of this scheme are quality assurance (quality management systems), procurement, claims management, OHS, Human Resource Management, Labour Relations, preparation of construction method statement and construction programme management and scheduling.
With respect to preferential procurement programme of this scheme, TCTA can proudly attest that of the 11 preferential procurement beneficiaries, five are Black Women-Owned Enterprises with a commanding cumulative expenditure of R37.2 million. Additionally, Black Owned Local Enterprises and Black Women Owned Local Enterprises are commanding R50.7 million and R29.2 million respectively changing lives of local communities in the Liphalale Municipality and Limpopo Province.
Table 7: Expenditure on Transformation as at the end of the 2015-2016
MCWAPCategory Target Expenditure to
date% Progress
Preferential Procurement
R 67 133 987 R 127 708 493 190,2%
Enterprise Development
R 56 250 502 R 64 084 385 113,9%
Skills Development
R 1 820 765 R 2 289 146 125,7%
AMD Eastern Basin Work began on site in June 2014. Three enterprise development beneficiaries have been active on the project over the past year. Enterprise development expenditure and preferential procurement have exceeded their targets whilst skills development expenditure is currently at 83% of target. It is anticipated that all targets will be met by the end of the contract.
Socio Economic Development on the AMD Eastern Basin was implemented successfully with the main contractor exceeding the set targets on enterprise development and preferential procurement, greatly benefiting the suppliers and contractors. The skills development was still on going, however current progress indicates that the target will also be met benefiting local people through employment and skills development.
Enterprise Development: three black owned contractors took part on the project as main nominated enterprise development beneficiaries and their performance was good. All three contractors went through a rigorous mentorship programme and training that covered contract management, quality assurance, programming, Health and Safety, materials management etc.
Redinare construction (Pty) Ltd, 100 % black woman owned entity and 30 % black woman owned, was appointed to build works. They were originally allocated R12 million.
TBM Infrastructure (Pty) Ltd, 100 % black owned entity, was appointed to earthworks and road. They were originally allocated R66 million.
Tecroveer Projects (Pty) Ltd, 51 % black owned contractor, was appointed for electrical work. They were originally allocated R28 million. Their CIDB grading at the start of project was 5 CE and 6 ME and have improved their status to 5 CEPE and 7 ME.
Preferential procurement: This programme was implemented successfully and benefited seven black owned entities, of this number three were black women owned entities, with cumulative spent of R32 million. An original amount of R163 million was contracted for preferential procurement and at the end of this programme R270 million was spent.
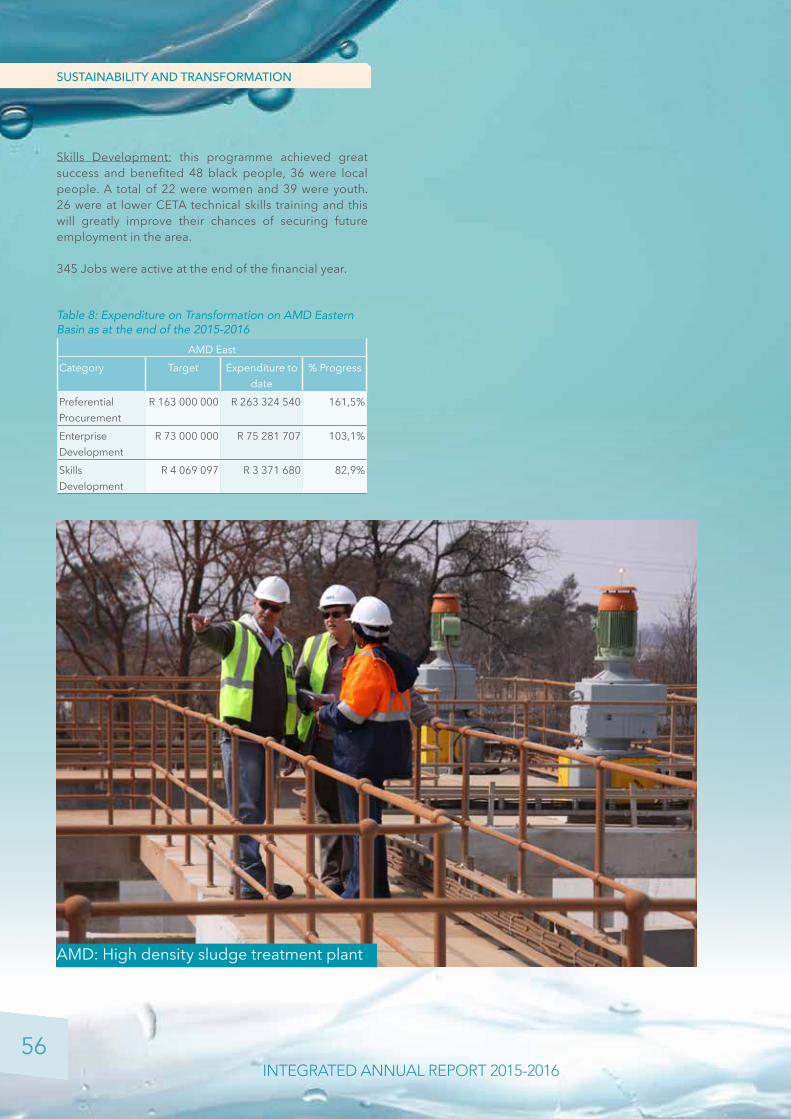
56
SUSTAINABILITY AND TRANSFORMATION
INTEGRATED ANNUAL REPORT 2015-2016
Skills Development: this programme achieved great success and benefited 48 black people, 36 were local people. A total of 22 were women and 39 were youth. 26 were at lower CETA technical skills training and this will greatly improve their chances of securing future employment in the area.
345 Jobs were active at the end of the financial year.
Table 8: Expenditure on Transformation on AMD Eastern Basin as at the end of the 2015-2016
AMD EastCategory Target Expenditure to
date% Progress
Preferential Procurement
R 163 000 000 R 263 324 540 161,5%
Enterprise Development
R 73 000 000 R 75 281 707 103,1%
Skills Development
R 4 069 097 R 3 371 680 82,9%
AMD: High density sludge treatment plant

57 INTEGRATED ANNUAL REPORT 2015-2016
TCTA strives to ensure that it maintains a safe working environment with respect to Health and Safety on its sites.
Measurement of performance on health and safety takes into consideration the requirements and compliance on Occupational Health and Safety Act (Act of 85 of 1993) and the Construction Regulations as well as TCTA’s Projects Health and Safety Specifications. In order to ensure compliance, monthly audits are conducted on each site by using an auditing tool developed from the Act, Regulations and TCTA specifications. The audit process is used to determine the compliance score which is aligned to the principle of prevention of unsafe working
conditions rather than corrective action after incidence occurrences.
A health and safety compliance score of 90% which is in accordance with industrial standards is the minimum acceptable requirement adopted by TCTA. Generally, over the past four financial years, TCTA has shown a significant improvement in compliance performance as depicted in the table below. This consistent improvement is attributable to frequent audits by independent health and safety professionals assigned to all projects as a means of strengthening oversight.
Project Year Recordable cases Recordable case rate/LTIFR
H & S compliance score
MMTS-2 (AWTS) 2013 NA NA NA
2014 1 0.8 84%
2015 0 0.4 98%
2016 0 0.4 99%
ORWRDP-2C 2013 0 0.00 79%
2014 2 0.19 91%
2015 0 0.10 89%
2016 3 0.33 90%
MCWAP-1 2013 1 0.1 86%
2014 5 0.2 92%
2015 0 0.14 90%
2016 0 0.13 93%
AMD 2013 2 0.5 94%
2014 0 0.35 94%
2015 0 0 91%
2016 0 0.29 91%
NB: Recordable Case Rate/LTIFR determined from standard work hour constant of 200,000
Table 9: Recordable Cases
HEALTH AND SAFETY

58
SUSTAINABILITY AND TRANSFORMATION
INTEGRATED ANNUAL REPORT 2015-2016
Over the past financial year, in terms of the recordable cases as required by the OHS Act, AMD, MCWAP-1 and MMTS-2 had zero recordable cases. ORWDPR-2 had three recordable cases of which three were fatalities as a result of a trench excavation collapse. The root cause of the incidence is under investigation.
In enhancing safe working conditions on site TCTA, has appointed additional independent professionals as a measure provided over and above the legislated requirements. With this measure and the following processes, TCTA ensures improved health and safety on site:• Development of a comprehensive OHS particular
specification for Principal Contractors with a site specific OHS plan.
• Placement of the required delegated/mandatory appointments to Principal Contractor in terms of the Occupational Health and Safety Act’s Construction Regulation.
• Appointment of the Engineer as the OHS agent of the client as per the Construction Regulations requirement. These appointments include conducting the mandatory monthly audits.
• Commitment of three OHS meetings at each site on a monthly basis to resolve and keep track of OHS related issues.
• Suspension of work in areas where safety hazards are identified to ensure safety measures are implemented before resuming construction.
ORWRDP: Repair of pipe coating
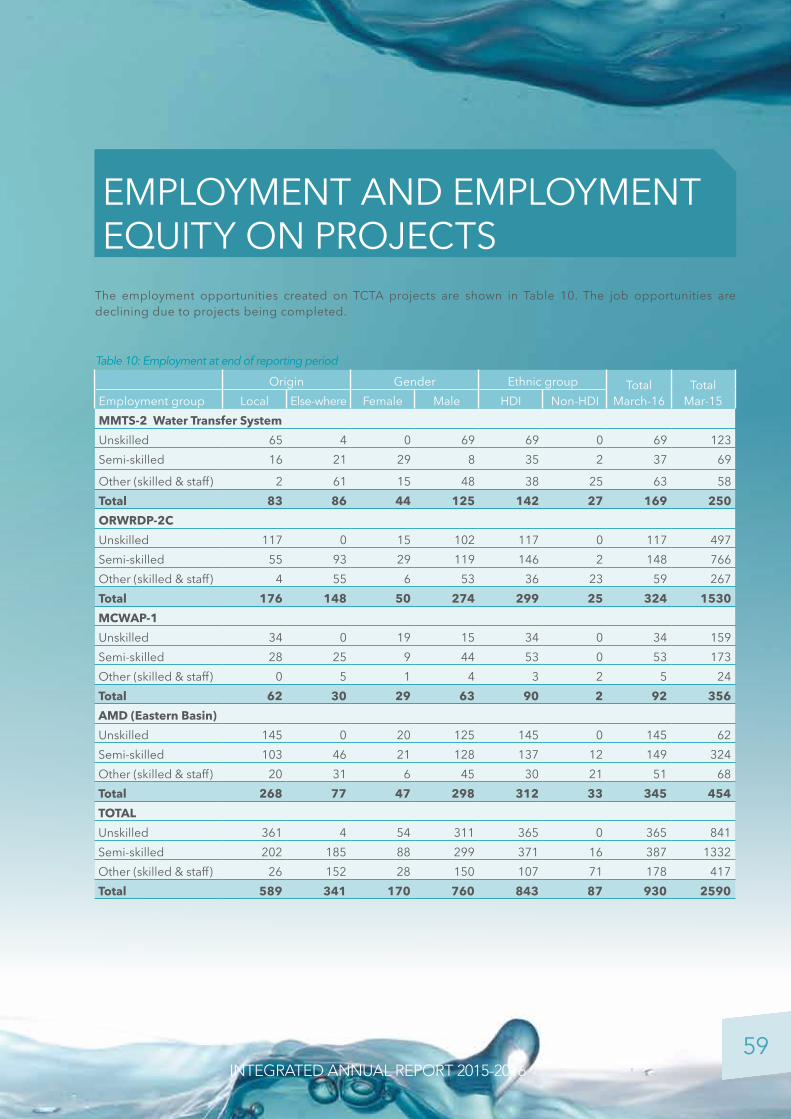
59 INTEGRATED ANNUAL REPORT 2015-2016
EMPLOYMENT AND EMPLOYMENT EQUITY ON PROJECTS
The employment opportunities created on TCTA projects are shown in Table 10. The job opportunities are declining due to projects being completed.
Origin Gender Ethnic group TotalMarch-16
TotalMar-15Employment group Local Else-where Female Male HDI Non-HDI
MMTS-2 Water Transfer SystemUnskilled 65 4 0 69 69 0 69 123Semi-skilled 16 21 29 8 35 2 37 69
Other (skilled & staff) 2 61 15 48 38 25 63 58Total 83 86 44 125 142 27 169 250ORWRDP-2CUnskilled 117 0 15 102 117 0 117 497Semi-skilled 55 93 29 119 146 2 148 766Other (skilled & staff) 4 55 6 53 36 23 59 267Total 176 148 50 274 299 25 324 1530MCWAP-1Unskilled 34 0 19 15 34 0 34 159Semi-skilled 28 25 9 44 53 0 53 173Other (skilled & staff) 0 5 1 4 3 2 5 24Total 62 30 29 63 90 2 92 356AMD (Eastern Basin)Unskilled 145 0 20 125 145 0 145 62Semi-skilled 103 46 21 128 137 12 149 324Other (skilled & staff) 20 31 6 45 30 21 51 68Total 268 77 47 298 312 33 345 454TOTAL Unskilled 361 4 54 311 365 0 365 841Semi-skilled 202 185 88 299 371 16 387 1332Other (skilled & staff) 26 152 28 150 107 71 178 417Total 589 341 170 760 843 87 930 2590
Table 10: Employment at end of reporting period
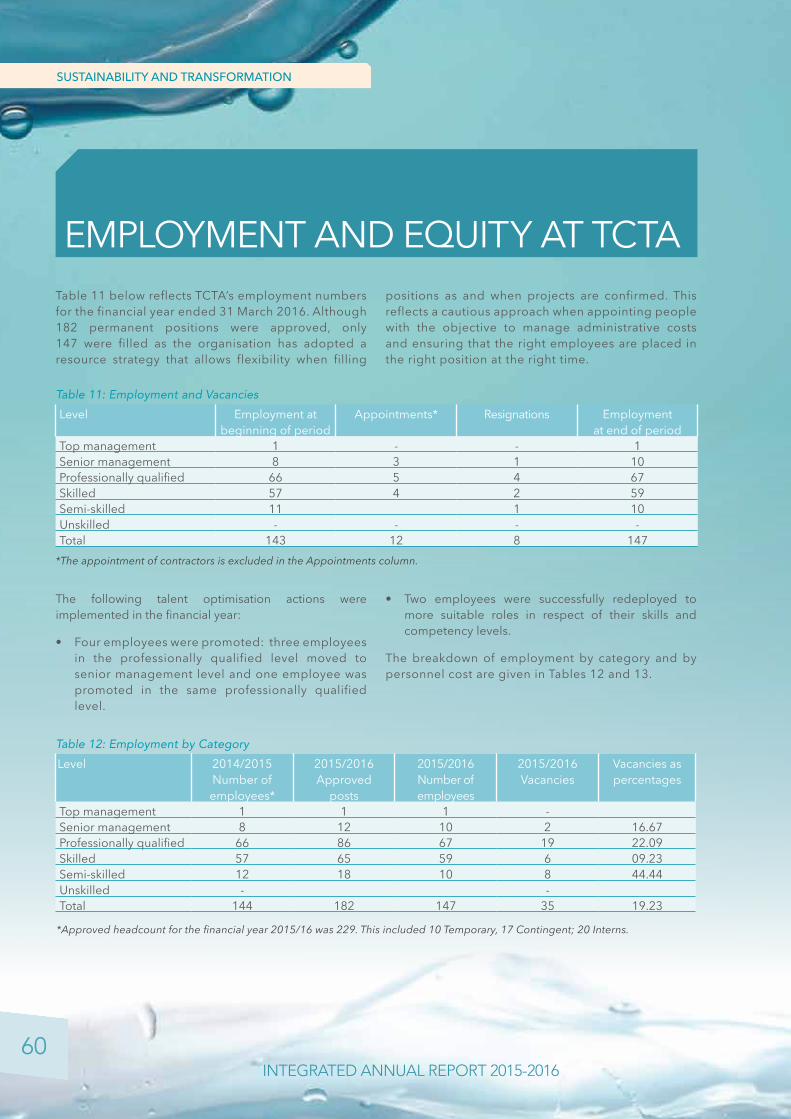
60
SUSTAINABILITY AND TRANSFORMATION
INTEGRATED ANNUAL REPORT 2015-2016
EMPLOYMENT AND EQUITY AT TCTATable 11 below reflects TCTA’s employment numbers for the financial year ended 31 March 2016. Although 182 permanent positions were approved, only 147 were filled as the organisation has adopted a resource strategy that allows flexibility when filling
positions as and when projects are confirmed. This reflects a cautious approach when appointing people with the objective to manage administrative costs and ensuring that the right employees are placed in the right position at the right time.
The following talent optimisation actions were implemented in the financial year:
• Four employees were promoted: three employees in the professionally qualified level moved to senior management level and one employee was promoted in the same professionally qualified level.
• Two employees were successfully redeployed to more suitable roles in respect of their skills and competency levels.
The breakdown of employment by category and by personnel cost are given in Tables 12 and 13.
Level Employment at beginning of period
Appointments* Resignations Employmentat end of period
Top management 1 - - 1 Senior management 8 3 1 10Professionally qualified 66 5 4 67Skilled 57 4 2 59Semi-skilled 11 1 10Unskilled - - - -Total 143 12 8 147
Table 11: Employment and Vacancies
*The appointment of contractors is excluded in the Appointments column.
Level 2014/2015 Number of employees*
2015/2016Approved
posts
2015/2016Number of employees
2015/2016Vacancies
Vacancies as percentages
Top management 1 1 1 -Senior management 8 12 10 2 16.67Professionally qualified 66 86 67 19 22.09Skilled 57 65 59 6 09.23Semi-skilled 12 18 10 8 44.44Unskilled - -Total 144 182 147 35 19.23
Table 12: Employment by Category
*Approved headcount for the financial year 2015/16 was 229. This included 10 Temporary, 17 Contingent; 20 Interns.
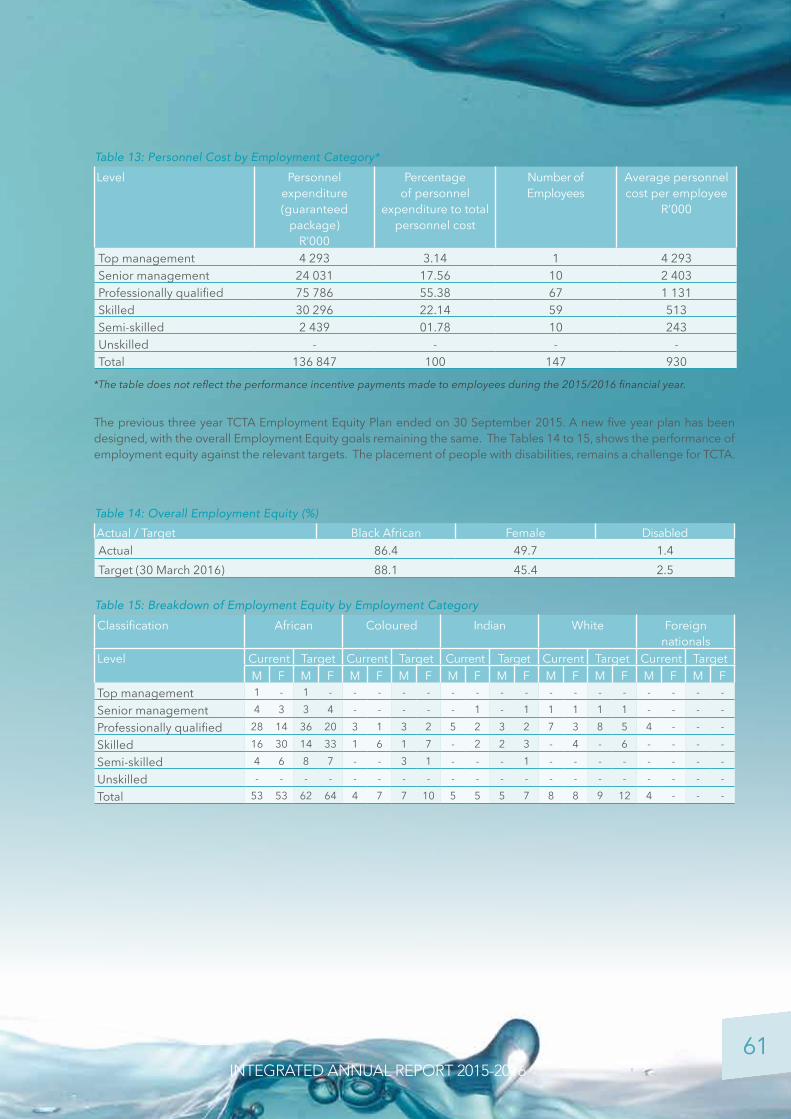
61 INTEGRATED ANNUAL REPORT 2015-2016
The previous three year TCTA Employment Equity Plan ended on 30 September 2015. A new five year plan has been designed, with the overall Employment Equity goals remaining the same. The Tables 14 to 15, shows the performance of employment equity against the relevant targets. The placement of people with disabilities, remains a challenge for TCTA.
Level Personnel expenditure (guaranteed
package)R’000
Percentage of personnel
expenditure to total personnel cost
Number of Employees
Average personnel cost per employee
R’000
Top management 4 293 3.14 1 4 293Senior management 24 031 17.56 10 2 403Professionally qualified 75 786 55.38 67 1 131Skilled 30 296 22.14 59 513Semi-skilled 2 439 01.78 10 243Unskilled - - - -Total 136 847 100 147 930
Classification African Coloured Indian White Foreign nationals
Level Current Target Current Target Current Target Current Target Current TargetM F M F M F M F M F M F M F M F M F M F
Top management 1 - 1 - - - - - - - - - - - - - - - - -Senior management 4 3 3 4 - - - - - 1 - 1 1 1 1 1 - - - -Professionally qualified 28 14 36 20 3 1 3 2 5 2 3 2 7 3 8 5 4 - - -Skilled 16 30 14 33 1 6 1 7 - 2 2 3 - 4 - 6 - - - -Semi-skilled 4 6 8 7 - - 3 1 - - - 1 - - - - - - - -Unskilled - - - - - - - - - - - - - - - - - - - -Total 53 53 62 64 4 7 7 10 5 5 5 7 8 8 9 12 4 - - -
Table 13: Personnel Cost by Employment Category*
Table 15: Breakdown of Employment Equity by Employment Category
*The table does not reflect the performance incentive payments made to employees during the 2015/2016 financial year.
Actual / Target Black African Female DisabledActual 86.4 49.7 1.4Target (30 March 2016) 88.1 45.4 2.5
Table 14: Overall Employment Equity (%)

62
SUSTAINABILITY AND TRANSFORMATION
INTEGRATED ANNUAL REPORT 2015-2016
Level Current: 2015/2016 Target: 2015/2016Top management - -Senior management - -Professionally qualified 1 2Skilled 1 2Semi-skilled - 2Unskilled - -Total 2 6
Table 16: People Living with Disabilities
TCTA values its employees and continues to employ human resource and organisational development strategies, which position it as an employer of choice. The organisation focuses on strategic human resources activities that have a direct impact on the productivity and performance levels. Its Human Resource and Organisational Development value proposition is as follows: • the optimal design of the organisational structure with
a strategic resource plan to accompany it;• the attraction and selection of new talent which will be
a fit for the desired culture;• the ongoing performance management at
organisational, team and individual levels, towards ensuring TCTA achieve its overall goals;
• the implementation of an appropriate rewards and recognition programme; and
• employee learning and development activities which complement the skills base required for the realization of TCTA’s mission.
In the 2015/16 financial year the organisation focused its energies on the following human capital priorities:
• designing and implementing a suitable TCTA competency framework which articulates the TCTA persona;
• the strategic optimisation of resources;• implementing a fit for purpose, total rewards framework
with an increased focus on the implementation of employee benefits;
• capacitating employees through targeted learning and development programmes; and
• implementing targeted employee engagement programmes as part of change management towards a healthy work climate.
Following detailed research, TCTA approved an in-house designed TCTA competency framework, positioned to respond to its vision of being the leader in the sustainable supply of water in the region. Assessments against this set of competencies were piloted in the financial year under review, with significant success. 98% of the pilot group participated with 77% of the pilot group providing feedback that the project adds significant value to talent management in TCTA.
The result of the pilot showed TCTA is strongly positioned with regards to technical competencies, with room for improvement in its ability to build mutually satisfying strategic relationships. Following the pilot, management gave approval to implement the project amongst the entire organisation in 2016/2017.
The financial year saw the embedding of the approved employee benefits, as part of the total rewards framework. This offering marks a very positive contribution, in positioning the organisation as a responsible employer.
In December 2013, the Board approved a learning and development strategy supported by a three-year implementation plan. Implementation started in January 2014 and the continued implementation of the training plan, has been a priority for TCTA. Training interventions
HUMAN CAPITAL PRACTICES
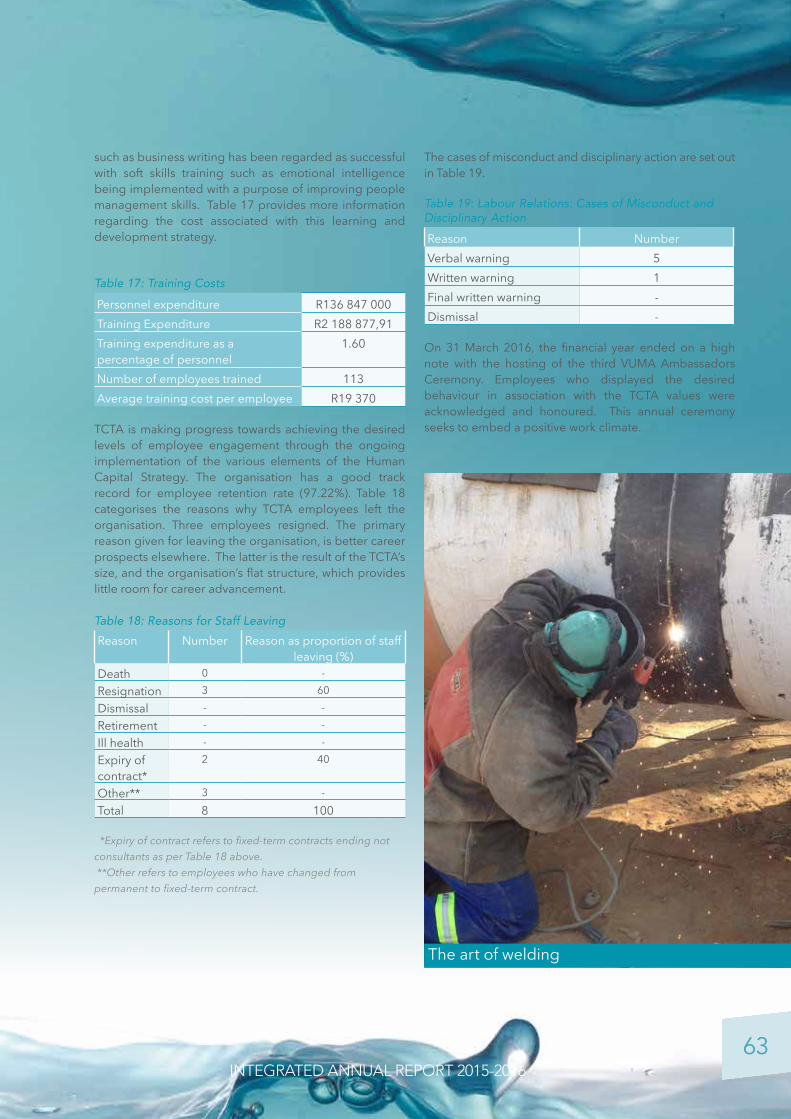
63 INTEGRATED ANNUAL REPORT 2015-2016
such as business writing has been regarded as successful with soft skills training such as emotional intelligence being implemented with a purpose of improving people management skills. Table 17 provides more information regarding the cost associated with this learning and development strategy.
Table 17: Training Costs
Personnel expenditure R136 847 000Training Expenditure R2 188 877,91Training expenditure as a percentage of personnel
1.60
Number of employees trained 113Average training cost per employee R19 370
TCTA is making progress towards achieving the desired levels of employee engagement through the ongoing implementation of the various elements of the Human Capital Strategy. The organisation has a good track record for employee retention rate (97.22%). Table 18 categorises the reasons why TCTA employees left the organisation. Three employees resigned. The primary reason given for leaving the organisation, is better career prospects elsewhere. The latter is the result of the TCTA’s size, and the organisation’s flat structure, which provides little room for career advancement.
Table 18: Reasons for Staff Leaving
Reason Number Reason as proportion of staff leaving (%)
Death 0 -Resignation 3 60Dismissal - -Retirement - -Ill health - -Expiry of contract*
2 40
Other** 3 -Total 8 100
*Expiry of contract refers to fixed-term contracts ending not consultants as per Table 18 above. **Other refers to employees who have changed from permanent to fixed-term contract.
The cases of misconduct and disciplinary action are set out in Table 19.
Table 19: Labour Relations: Cases of Misconduct and Disciplinary Action
Reason NumberVerbal warning 5Written warning 1Final written warning -Dismissal -
On 31 March 2016, the financial year ended on a high note with the hosting of the third VUMA Ambassadors Ceremony. Employees who displayed the desired behaviour in association with the TCTA values were acknowledged and honoured. This annual ceremony seeks to embed a positive work climate.
The art of welding

64
SUSTAINABILITY AND TRANSFORMATION
INTEGRATED ANNUAL REPORT 2015-2016
TOWARDS A CULTURE OF KNOWLEDGE AND LEARNING
Refocusing the Knowledge Agenda
The year under review witnessed the expanded implementation of an organisational agenda for knowledge that stretched into the new responsibility for strategic cross-sector initiatives on critical infrastructure, requiring continuing value-adding advisory in several areas directly interfacing with the core business and its future pipeline.
The pre-existing dimensions of knowledge and learning remained important, emphasizing the following aspects: thought leadership in the development of infrastructure for improving access to water, sanitation and other services; wide-ranging research and partnership platforms for advancing solutions to water sector challenges; and organisational learning through a more systematic generation and sharing of evaluative knowledge in the context of communities of practice.
Research, Publications and Partnerships
During the reporting period, TCTA continued to contribute to water management excellence through sector-related research, delivering presentations at local and international forums, and publishing thought-provoking papers. Specifically, the organization’s research spanned across six strategic themes, leading to publications on water conservation and its impact on national economic growth; water demand management and drought mitigation; and the performance of infrastructure services. Other areas of research and publication included the process of taking infrastructure projects to bankability; the financing of infrastructure on a commercial basis; and the use of the boundary spanning and dynamic capability framework as an inclusive learning model. Ongoing contributions of such variety of articles in local and international publications enrich the infrastructure and water bodies of knowledge, as well as setting TCTA apart as a knowledge organization.
Building on the flagship work of the previous year, on institutional partnerships for advancing desalination projects in the near future, the organisation made significant strides in formally establishing project-based collaboration and the sharing of subject-matter knowledge amongst six pivotal institutions. The partners in the synergistic knowledge-sharing forum for the planning and implementation of large-scale desalination projects include the Council for Scientific and Industrial Research, Water Research Commission, Umgeni Water, City of Cape Town, Department of Science and Technology and the Department of Water and Sanitation. In anchoring such a platform bringing together industry experts, potential future project sponsors and subject-matter enthusiasts around a subject crucial to the country’s long-term water security, TCTA has demonstrated its commitment to the development of local capacity for large-scale desalination, especially in the context of the ongoing drought. Thought Leadership in the Water Sector
In the past year, TCTA reinforced its pursuit of thought leadership in the water sector, through broadening the stakeholder base for its regular sector-wide forums that address key challenges to the sustainable management of water, and through strengthening specialized advisory inputs to the effective coordination and integration of strategic infrastructure projects.
The year under review witnessed the planning and convening of focused dialogues at four well-attended Community of Practice forums, under their broad themes of strategic infrastructure, large-scale desalination and the framework of learning organizations. The specific issues explored, consistently generating exciting debate amongst participants, revolved around the challenges of bringing off-budget infrastructure projects to implementation readiness; the performance of construction projects; the prospects for scaling-up desalination going

65 INTEGRATED ANNUAL REPORT 2015-2016
forward and the dynamics of learning and knowledge diffusion among state-owned enterprises.
Further, during the course of the year, TCTA continued to provide coordination and thought leadership for ensuring the fast-tracking of two pivotal national infrastructure programmes: SIP-18, which focuses on the country-wide Water and Sanitation Infrastructure, and SIP-3, which deals with the South-Eastern Node and Corridor Development. Successful coordination of these programs has significant catalytic effects on both national economic growth and social development.
Building a Learning Organisation
During the reporting year, TCTA extended its pursuit of continuous evaluation-for-learning across the business,
unpacking key lessons from three intervention areas and drawing management attention to new entry points for improvement in programming and implementation. Evaluative work selectively focussed on the following internal programmes: the graduate internship on environmental management; corporate social investments around the Olifants project communities; and the organizational policy landscape.
Going forward, the mainstreaming of evaluative work, including the systematic review of significant programmes and operations, will increasingly provide TCTA with strong windows for reinforcing learning and knowledge flows amongst employees and stakeholders, for promoting the effective management of results, and for embedding overall accountability.
Clarens: Community meeting on transfer of ownership of houses
66
GOVERNANCE
INTEGRATED ANNUAL REPORT 2015-2016
67 INTEGRATED ANNUAL REPORT 2015-2016
PART D: Governance
68
68
68
68
71
72
76
80
81
INTRODUCTION
PORTFOLIO COMMITTEE
EXECUTIVE AUTHORITY
ACCOUNTING AUTHORITY/ THE BOARD
THE ROLE OF THE COMPANY SECRETARY
THE BOARD
RISK MANAGEMENT
INTERNAL AUDIT
COMPLIANCE (with Applicable Legislation and Adherence to Non-binding Rules, Codes and Standards)
68
GOVERNANCE
INTEGRATED ANNUAL REPORT 2015-2016
Governance Framework
TCTA is committed to applying sound corporate governance principles in accordance with the King III Report as applicable to State-owned Enterprises. The Accounting Authority is fully committed to applying these principles in accordance with sound corporate governance and the highest corporate governance standards. To this end, the Accounting Authority continuously updates its governance frameworks. These include the Board Charter, Delegation of Authority, the Conflict of Interest and Declaration of Interests Framework, and Strategic Policies.
Governance Structure
In line with the ‘apply or explain’ approach set out in the King III Report, the Accounting Authority will continue to state the extent to which good corporate governance principles are applied in the organisation. The Accounting Authority does not consider this a static responsibility and will endeavour to ensure ongoing compliance in accordance with developments in corporate governance in South Africa and internationally.
The Parliamentary Portfolio Committee on Water and Sanitation, through the Minister of Water and Sanitation, has oversight.
The Minister of Water and Sanitation is the Executive Authority.
In terms of the PMFA, TCTA is a Schedule 2 entity.
The Accounting Authority, reports to the Minister of Water and Sanitation, who is the Executive Authority and
has ultimate responsibility for TCTA. The Accounting Authority regulates its strategic deliverables and performance with the Minister of Water and Sanitation by way of a Shareholder’s Compact. The Corporate Plan
INTRODUCTION
PORTFOLIO COMMITTEE
EXECUTIVE AUTHORITY
ACCOUNTING AUTHORITY/ THE BOARD
69 INTEGRATED ANNUAL REPORT 2015-2016
and Budget for the year is also submitted to the Minister of Water and Sanitation and National Treasury annually, whereas the organisational performance is reported on a quarterly basis.
The Minister appointed the Chief Executive Officer (CEO), Mr James Ndlovu, to serve as the TCTA’s Accounting Authority for the period 1 September 2014 until 30 November 2015. The appointment was made in terms of section 49 (2) (b) of the PFMA.
The Minister appointed the new Board of Directors effective from 1 December 2015. The new Board consists of nine directors; comprising seven independent non-executive directors, one non-executive director from National Treasury, and the CEO as an executive director.
Ms Monhla Hlahla and Mr Jacob Modise were appointed independent Chairperson and Deputy Chairperson of the Board, respectively.
During the period 1 December 2015 to March 2016, the role’s of the Chairperson and Chief Executive Officer were separate. However, during the preceding eight months, these roles were fulfilled by the CEO.
The Role of the Board of Directors
The Board manages and has authority to exercise all the powers and perform any of the functions of the organisation except to the extent that the notice of establishment, PFMA and Shareholder Compact directs otherwise.
In performing its duties, the Board approves a business and funding model that is sustainable and viable for the organisation including the best interests of the organisation, the shareholders and in the public interest.
To achieve these goals; the Board considers a framework of corporate strategy and corporate governance wherein the corporate strategy addresses the strategic decisions of choice of business model, funding structure and having
a strategic plan that ensures the long-term sustainability of the organisation.
Corporate governance on the other hand addresses the implementation and execution of the corporate strategy as managed by the Board in terms of conformance and performance standards in the best interests of the Minister, key stakeholders and the organisation.
Directors’ Liability Insurance
Board members’ Liability Insurance is in place to protect directors against the risk of personal liability. Directors’ liability is limited to non-negligence or a breach of duty or trust in relation to the business of the organisation.
Board Remuneration
TCTA remunerates its Board members in line with the Non-executive Directors’ Remuneration Policy and Procedure approved by the then Minister of Water and Environmental Affairs, Minister Edna Molewa, in 2008.
This policy ensures that directors’ remuneration is appropriate to the level, skill and expertise required and in accordance with current market practice and the guidelines of state-owned entities. (The notes to the annual financial statements provide more information about director’s remuneration).
The organisation remunerates non-executive directors through a monthly retainer, quarterly fee, meeting and attendance fee and ad hoc fee for extra work undertaken at the Board’s request.
Minimising Conflict of Interest
All directors, the CEO, the Company Secretary and executive managers disclose any conflict or potential conflict of interest annually and should a conflict arise at Board and Committee meetings.
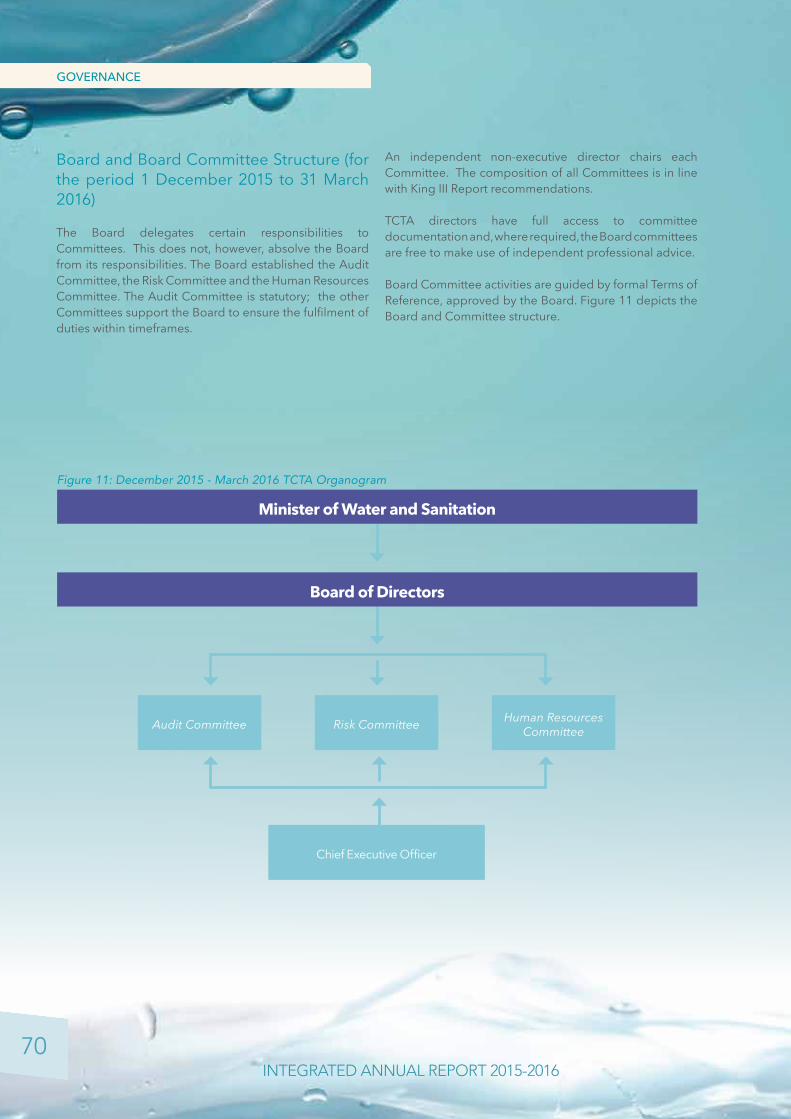
70
GOVERNANCE
INTEGRATED ANNUAL REPORT 2015-2016
Audit Committee
Chief Executive Officer
Risk Committee Human Resources Committee
Minister of Water and Sanitation
Board of Directors
Figure 11: December 2015 - March 2016 TCTA Organogram
Board and Board Committee Structure (for the period 1 December 2015 to 31 March 2016)
The Board delegates certain responsibilities to Committees. This does not, however, absolve the Board from its responsibilities. The Board established the Audit Committee, the Risk Committee and the Human Resources Committee. The Audit Committee is statutory; the other Committees support the Board to ensure the fulfilment of duties within timeframes.
An independent non-executive director chairs each Committee. The composition of all Committees is in line with King III Report recommendations.
TCTA directors have full access to committee documentation and, where required, the Board committees are free to make use of independent professional advice.
Board Committee activities are guided by formal Terms of Reference, approved by the Board. Figure 11 depicts the Board and Committee structure.
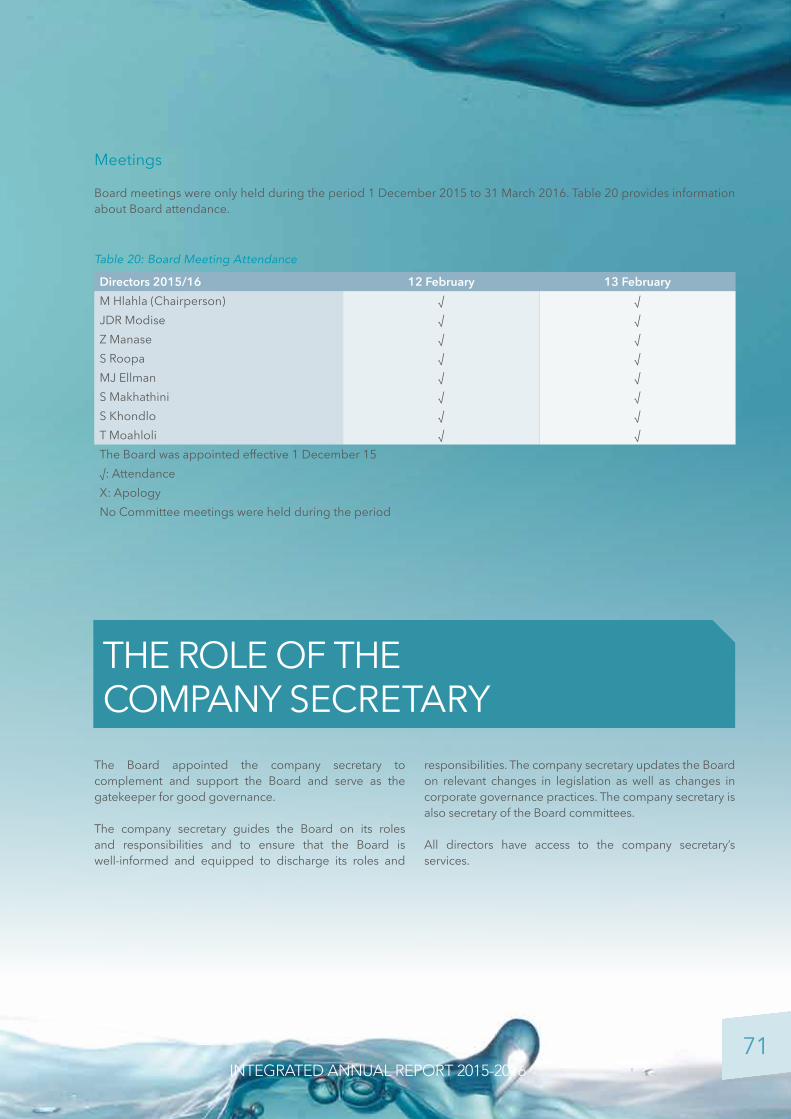
71 INTEGRATED ANNUAL REPORT 2015-2016
Meetings
Board meetings were only held during the period 1 December 2015 to 31 March 2016. Table 20 provides information about Board attendance.
Table 20: Board Meeting Attendance
Directors 2015/16 12 February 13 FebruaryM Hlahla (Chairperson) √ √JDR Modise √ √Z Manase √ √S Roopa √ √MJ Ellman √ √S Makhathini √ √S Khondlo √ √T Moahloli √ √The Board was appointed effective 1 December 15√: AttendanceX: ApologyNo Committee meetings were held during the period
THE ROLE OF THE COMPANY SECRETARY
The Board appointed the company secretary to complement and support the Board and serve as the gatekeeper for good governance.
The company secretary guides the Board on its roles and responsibilities and to ensure that the Board is well-informed and equipped to discharge its roles and
responsibilities. The company secretary updates the Board on relevant changes in legislation as well as changes in corporate governance practices. The company secretary is also secretary of the Board committees.
All directors have access to the company secretary’s services.

72
GOVERNANCE
INTEGRATED ANNUAL REPORT 2015-2016
THE BOARD Ms Monhla Hlahla
(Chairperson)Mr Jacob Modise
(Deputy Chairperson)
Dr Michael John Ellman Mr Satish Roopa
Ms Zodwa Manase

73 INTEGRATED ANNUAL REPORT 2015-2016
Ms Monhla Hlahla Academic Qualification• BA majored in Economics (Pomona College,
California USA)• MSc Urban Planning, UCLA School of Architecture
and Planning• Advanced Management Program (AMP), INSEAD,
France• Certificate in Accounting and Finance, WITS Business
School Current Position• NoneTCTA Board Committee Memberships: • Human Resources CommitteeOther Directorships/Trustees/ Committee Membership: • Royal Bafokeng Holdings• Liberty Holdings and Stanlib Limited
Mr Jacob Modise
Academic Qualification• Bachelor of Commerce, WITS • Bachelor of Accountancy, WITS• CA (SA), SAICA • MBA, WITS• Advanced Management Program, Sanford Business:
Global Utilities Institute, USA - 1997• Advanced Management Program, Harvard Business
School Current Position:• Executive Chairman (Batsomi Investments)TCTA Board Committee Memberships: • Audit Committee (Chairperson)Other Directorships: • NERSA• ArcelorMittal • Altron• Batsomi subsidiaries and associated companies• Trustee – Nelson Mandela Children’s Fund
Ms Zodwa Manase
Academic Qualification• B.Com, UNISA• B Compt (Hons), UNISA• Higher Dip Tax, University of Natal• CA (SA), SAICA Current Position• CEO (Manase & Associate)TCTA Board Committee Memberships: • Risk Committee (Chairperson)• Audit CommitteeOther Directorships/Trustees/ Committee Membership: • Nelson Mandela Children Hospital Trust Fund
(Trustee)• PRASA• State Diamond Trader• Department of International Relations and
Cooperation (Audit Committee Chairperson)
Dr Michael John Ellman
Academic Qualification• MBA, WITS• Doctorate of INPL, Ecole Nationale Superieure des
Industries Chimques, Nancy France • Master in Chemical Engineering, Netherlands • BSc in Chemical Engineering, University of Cape
Town Current Position• Managing Director (Siyadingana Consulting (Pty) Ltd• Managing Director (Siyadingana Properties (Pty) LtdTCTA Board Committee Memberships: • Audit Committee• Risk CommitteeOther Directorships/Trustees/ Committee Membership: • Bloem Water o Capital Projects and Fixed Assets Committee o HR and Corporate Services o Audit Committee• South African Bureau of Standards o HR and Remuneration o Audit and Risk Committee o Social and Ethics Committee• Advisory Board - Departmental Chemical
Engineering University of Pretoria (Honorary Membership)
Mr Satish Roopa
Academic Qualification• B.Luris, UNISA• LLB, UNISA• M.Phil, University of Stellenbosch• Cert in Executive program for Leaders in
Government, Harvard University• Cert in Negotiating International Contracts &
Development Finance, University of Cape Town• Cert in Transformation of Institutes of Higher
Education, University of Stellenbosch• Cert Global Housing Trends, WITS School of Public
and Development ManagementCurrent Position• Owner ( S Roopa Consultants)TCTA Board Committee Memberships: • Human Resources Committee (Chairperson)• Risk CommitteeOther Directorships/Trustee/Committee Memberships: • Gautrain Management Agency o Audit and Risk Committee o Social and Ethics Committee o HR and Remuneration Committee • iSimangaliso Wetland Park Authority o Audit and Risk Committee
73

74
GOVERNANCE
INTEGRATED ANNUAL REPORT 2015-2016
THE BOARDMr Simphiwe Khondlo
Ms Tshepiso Moahloli
Ms Sijabulile Makhathini
Mr James Ndlovu

75 INTEGRATED ANNUAL REPORT 2015-2016
Mr Simphiwe Khondlo
Academic Qualification• Masters in Engineering Management, Pretoria
University • BSC Agric. Engineering, Natal University • Dip Civil Engineering, M L Sultan Technikon, Durban• Diploma in Project Management, Executive
Education• Cert Property Practitioner Practice, SAPOA, Pretoria
University Current Position• CEO ( East London Industrial Development Zone) TCTA Board Committee Memberships: • Human Resources Committee• Audit CommitteeOther Directorships/Trustees/ Committee Membership: • Buffalo City Development Agency• Johannesburg Water
Ms Sijabulile Makhathini
Academic Qualification• B Com Accounting, WITS• Post Grad. Diploma – Accounting Sciences, UNISA• Hons, Bachelor of Accounting Sciences, with Cert of
Theory in Accountancy, UNISA • SAICA Articles, TIPP Auditing• CA (SA), SAICA Current Position• Director Business Methodologies: Ubamboh
Consulting (Pty) LtdTCTA Board Committee Memberships: • Human Resources Committee• Risk CommitteeOther Directorships/Trustees/ Committee Membership: • HPCSA – Professional Board: Dietetics and Nutrition• National Library of South Africa – Audit and Risk
Committee• Provincial Department of Health – Audit and Risk
Committee• DRKKDM & DRKKDM Economic Development
Agency – Audit and Risk Committee
Ms Tshepiso Moahloli
Academic Qualification• Master of Economic Science, WITS• BA Economics Science with Honours, WITS• Bsc. WITS Current Position• Chief Director: Liability Management - National
TreasuryTCTA Board Committee Memberships: • Risk Committee• Audit CommitteeOther Directorships/Trustees/ Committee Membership: • None
Mr James Ndlovu
Academic Qualification• BA, Wits • MSc Development Planning, Wits • Short course in Micro Computing Options in
Monitoring and Evaluation, Univ. East Anglia, UK • Short course- Monitoring and Evaluation of Public
Sector Projects and Programmes, Univ. East Anglia, UK
Current Position:• Chief Executive OfficerOther Board Committee Memberships: • None Other Directorships/Trustees/ Committee Membership: • Ndlovu Family Trust
75
76
GOVERNANCE
INTEGRATED ANNUAL REPORT 2015-2016
RISK MANAGEMENTRisk Governance Statement A sound risk governance structure provides a solid foundation for embedding an effective risk management culture within an organisation. Risk governance entails the creation of an enabling environment for the structured management, oversight and reporting of risks. The TCTA Board is ultimately accountable for the effective management of risks within the organisation. TCTA recognises that risk management requires a team-based approach for effective application across the organisation. The organisational structure provides the framework to plan, execute, control and monitor risk management activities.
In terms of the PFMA and King III code of conduct, the Board is responsible for the governance of risks within TCTA. It delegates the responsibility to design and implement the risk management plan to management. The Board exercises its oversight responsibility through the Risk Committee of the Board.
In its endeavour to manage organisational risks, TCTA has adopted an enterprise risk management (ERM) framework as an approach to managing exposures. .The ERM framework and approach is based on ISO 31000, King III, Public Sector Management and Committee of Sponsoring Organisations (COSO). The organisation’s risk management services provide risk policies, strategies and best practice standards for TCTA as a whole in order to mitigate the main risk exposures. The risk management policies, frameworks, procedures in place ensure effective and efficient implementation of projects, raising of funding and management thereof.
The Risk Committee provides oversight and governance in fund raising, implementation and debt management for all projects. This includes approval of project charters, design of the projects, and procurement of funding and construction service providers. The oversight responsibility extends to monitoring the implementation, budgets and risks associated with each projects.
Legal risks that emanates from the implementation of projects are proactively managed through conclusion of implementation, water supply and offtake agreements with DWS and different institutions. Compliance with loan covenants that are in place with different funders are critical and monitored regularly/quarterly both by the Risk and Audit Committees of the Board.
The Compliance framework supports the active management of compliance risks which entails a four phase cyclical approach to identify, assess, manage and monitor compliance risk.
The Audit Committee reviews effectiveness of the risk management through the independent assessment of risk processes by Internal Audit. A combined approach has been adopted to ensure effective provision of assurance to the Board and Management.
The CEO and Management remain accountable for the implementation and maintenance of an effective, transparent risk management and compliance process as first and second line of defence.
Risk AppetiteDue to the nature of TCTA’s operations and its strategic objectives, TCTA has a conservative appetite for risk. This approach guides decision-making through supporting decision-making, the approval processes, consistency of business decisions and risk culture.
In order to achieve effective monitoring of the risk profile, the risk appetite incorporates impact in terms of both quantitative and qualitative measures as follows:
Quantitative measures
This refers to the impact on TCTA’s financial well-being as affected by cost-effectiveness, water income volatility, liability management, fund raising ability and projects credit rating.
77 INTEGRATED ANNUAL REPORT 2015-2016
Qualitative measures
These are informed by factors such as:• regulatory compliance;• reputational standing;• service delivery;• environmental, health and safety concerns; and• key stakeholder relations.
Approach to Risk ManagementA continuous, proactive and systematic way of identifying potential events that may affect the organisation to manage such risks within acceptable risk tolerance levels is in place and embedded in the ERM processes. The approach enables TCTA to manage risks within acceptable tolerance levels, to ensure that organisational goals are achieved.
Risk CategoriesTCTA’s core business comprises implementation of projects, management of environmental components of project implementation and funding and liability management. In executing its activities, TCTA is exposed to various risks.
Risks fall into the following categories:• strategic risks which originate from the possibility of
a variance in the outcome of the decisions and the choices made in setting strategic goals from what is expected to be achieved;
• operational and project risks which arise from the possibility of variance between the expected and the actual performance, reliability, quality and efficiencies of the TCTA’s internal operations and systems; and
• financial risks associated with funding and liability management.
The broad categories are further subcategorised into the following spectrum of risks:
Project Implementation Risks
These risks emanate from the project implementation, which by their nature, are inherent in construction projects. These risks may cause delays in completion of projects which might have an adverse impact on the ability to deliver water, to the stakeholders, on time.
Key project risks include:
• engineering risk: This risk emanates largely from deficiencies or flaws in project design which may
adversely affect project costs, quality and time;• environmental risk: This risk relates to the potential
threat of adverse effects on living organisms and the environment by effluents, emissions, wastes, resource depletion etc., arising out of construction activities;
• health and safety risk: This risk relates to hazards which have the potential to cause harm, injury to or death of people; and
• project management risk: This risk emanates from project management processes, contractor performance, contractual arrangements, skills availability and procurement of service providers and contractors.
TCTA manages risk on a continual basis through the implementation of comprehensive internal controls. Contractual agreements are in place with contractors to provide remedies for delays and ensure compliance with legislative requirements for construction projects. The status of the projects are closely monitored by the Project Committee.
Treasury-related Risks
Debt management activities expose the organisation to financial risks, which have implications for the organisation’s asset and liability management strategies. The Risk Committee monitors the organisation’s exposure to treasury risks to ensure that controls are working effectively and in line with the approved Risk Management Framework and Treasury Risk Management Policy.
Key Treasury risks include:
• liquidity risk: This relates to the risk that TCTA could fail to secure sufficient funds, in the right currency at the right time to meet financial obligations. The risk is managed by, amongst others, maintaining sufficient government-guaranteed facilities with domestic banks to act as a liquidity buffer, regular cash-flow forecasting, as well as conducting repos and reverse repo transactions. Liquidity risk management is intended to ensure that TCTA has the appropriate funds and contingency plans to meet maturing obligations;
• interest rate risk: This relates to the impact of fluctuations in interest rates due to volatile market conditions resulting in increased funding costs and unpredictable interest cash-flows. TCTA manages this risk by complying with a predetermined Board-approved optimal capital structure of fixed to floating rate debt and effective debt management strategies;
• foreign currency risk: This relates to the risk of financial loss arising from adverse movements in the exchange

78
GOVERNANCE
INTEGRATED ANNUAL REPORT 2015-2016
rate of the Rand against foreign currencies which TCTA is exposed to. This risk is mitigated through the use of appropriate hedging strategies; and
• counterparty risk: The potential for financial loss due to counterparty default on obligations on redemption or maturity or presentation of paper for settlement. This risk arises from investment or cash management activities within the Treasury function. This risk is managed through a careful selection of counterparties and allocation of concentration limits to ensure adequate diversification of investments.
Project Funding Risk
This risk is associated with the impact on a project’s cash-flow from higher funding costs or lack of availability of funds to finance the project. The strategy put in place to mitigate this risk includes appropriate and sound project institutional arrangements to secure good credit ratings and build strong relationships with local and international lenders.
Operational Risk
This risk may emanate from potential loss caused by fraud, error or systems failure that may arise due to a breakdown in internal controls. The risks are managed by policies and procedures and a comprehensive system of internal controls, such as segregation of duties and proper Delegation of Authority.
Information Technology Risk
To mitigate risk of failure and to protect information and information systems from unauthorised access, use, disclosure, disruption and modification or destruction, TCTA has IT policies and frameworks in place which enhance business continuity and minimise business damage by preventing or limiting the impact of security breaches.
During the year TCTA embarked on a process to implement new Treasury Management and Enterprise
Resource Planning (ERP) systems. The risks associated with the implementation of these systems were identified and regularly monitored. Implementation of both systems is expected to be completed during the 2016/17 financial year.
Business Continuity Management
TCTA maintains an approved Business Continuity Policy, framework and plans to manage unforeseen business interruptions. The disaster recovery plan is tested on a periodic basis to determine its effectiveness.
RISK FINANCE (INSURANCE)Insurance cover is in place to mitigate exposures emanating from the construction activities, financial loss associated with damage or loss to property and injury to employees and independent contractors. In addition, TCTA has Directors and Officers Liability insurance.
Strategic Risks The heat map below provides the movement of strategic risks identified based on the approved risk framework.
1Almost Certain
Likely
Moderate
Unlikely
Remote
Insignifica
ntMinor
Moderate
Major
Catastr
ophic
23-61
5
2-4,6
Like
lihoo
d
Impact
Inherent Risk
Residual Risk
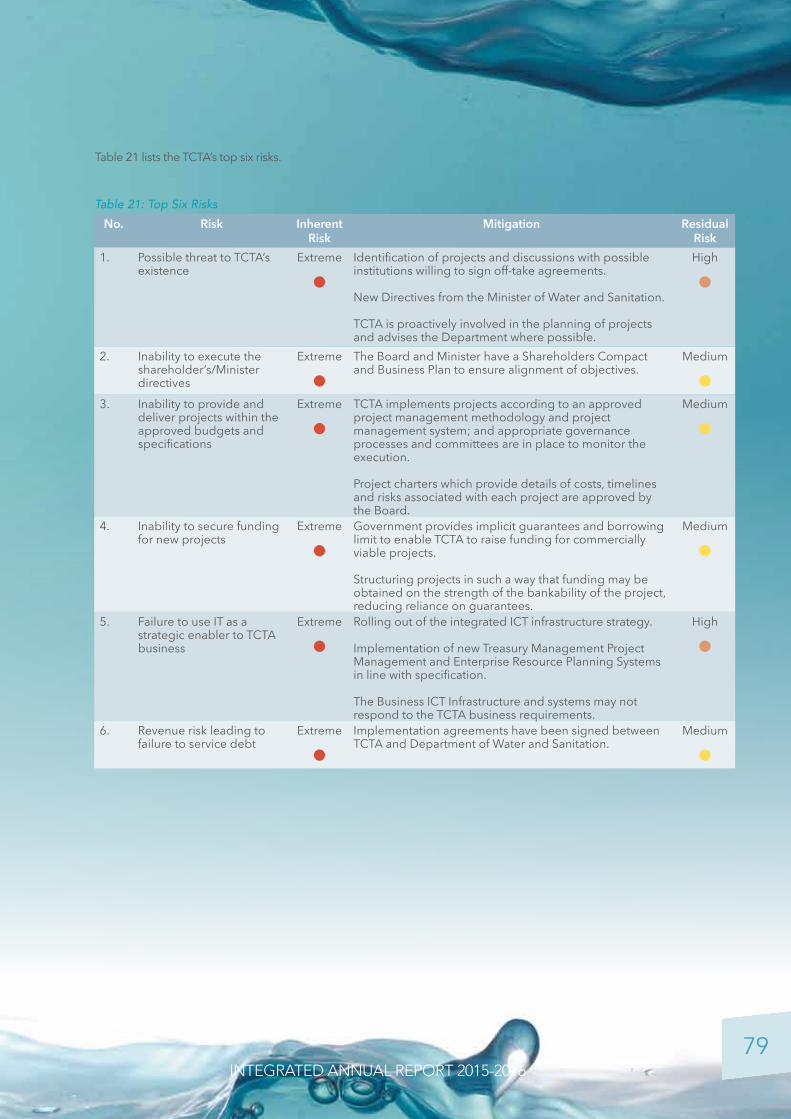
79 INTEGRATED ANNUAL REPORT 2015-2016
Table 21: Top Six Risks
No. Risk Inherent Risk
Mitigation Residual Risk
1. Possible threat to TCTA’s existence
Extreme
•Identification of projects and discussions with possible institutions willing to sign off-take agreements.
New Directives from the Minister of Water and Sanitation.
TCTA is proactively involved in the planning of projects and advises the Department where possible.
High
•
2. Inability to execute the shareholder’s/Minister directives
Extreme
•The Board and Minister have a Shareholders Compact and Business Plan to ensure alignment of objectives.
Medium
•3. Inability to provide and
deliver projects within the approved budgets and specifications
Extreme
•TCTA implements projects according to an approved project management methodology and project management system; and appropriate governance processes and committees are in place to monitor the execution.
Project charters which provide details of costs, timelines and risks associated with each project are approved by the Board.
Medium
•
4. Inability to secure funding for new projects
Extreme
•Government provides implicit guarantees and borrowing limit to enable TCTA to raise funding for commercially viable projects.
Structuring projects in such a way that funding may be obtained on the strength of the bankability of the project, reducing reliance on guarantees.
Medium
•
5. Failure to use IT as a strategic enabler to TCTA business
Extreme
•Rolling out of the integrated ICT infrastructure strategy.
Implementation of new Treasury Management Project Management and Enterprise Resource Planning Systems in line with specification.
The Business ICT Infrastructure and systems may not respond to the TCTA business requirements.
High
•
6. Revenue risk leading to failure to service debt
Extreme
•Implementation agreements have been signed between TCTA and Department of Water and Sanitation.
Medium
•
Table 21 lists the TCTA’s top six risks.
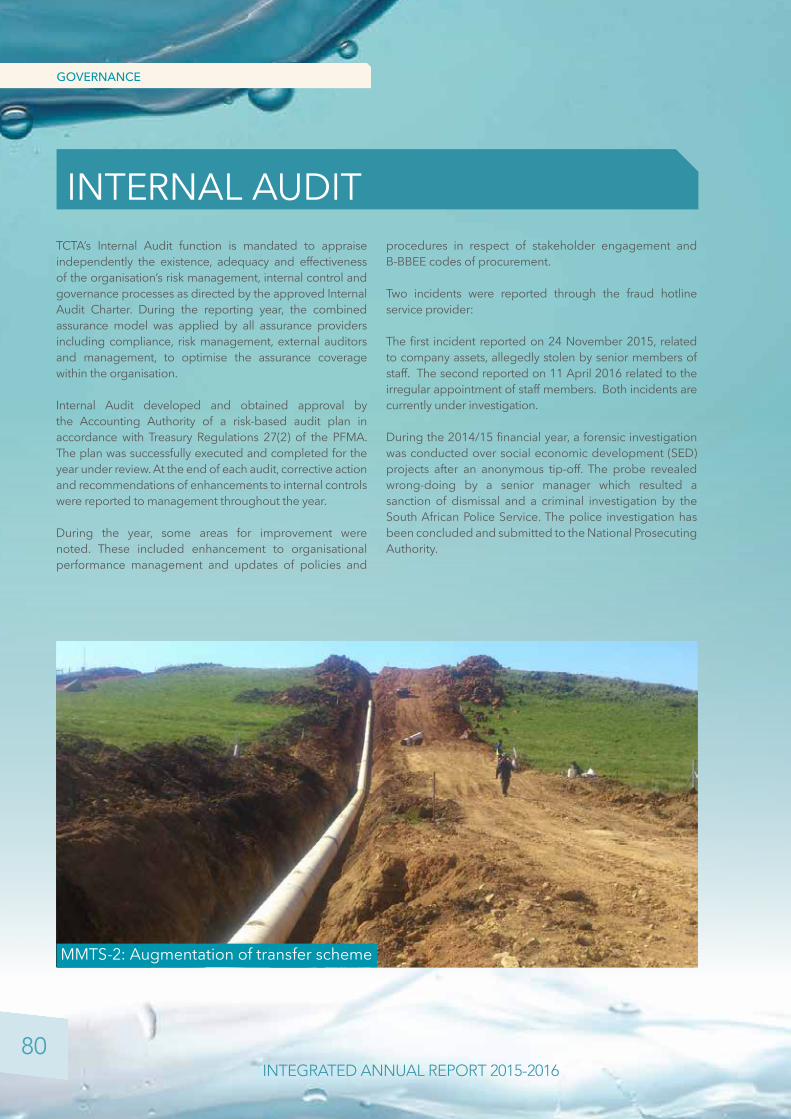
80
GOVERNANCE
INTEGRATED ANNUAL REPORT 2015-2016
TCTA’s Internal Audit function is mandated to appraise independently the existence, adequacy and effectiveness of the organisation’s risk management, internal control and governance processes as directed by the approved Internal Audit Charter. During the reporting year, the combined assurance model was applied by all assurance providers including compliance, risk management, external auditors and management, to optimise the assurance coverage within the organisation. Internal Audit developed and obtained approval by the Accounting Authority of a risk-based audit plan in accordance with Treasury Regulations 27(2) of the PFMA. The plan was successfully executed and completed for the year under review. At the end of each audit, corrective action and recommendations of enhancements to internal controls were reported to management throughout the year.
During the year, some areas for improvement were noted. These included enhancement to organisational performance management and updates of policies and
procedures in respect of stakeholder engagement and B-BBEE codes of procurement.
Two incidents were reported through the fraud hotline service provider:
The first incident reported on 24 November 2015, related to company assets, allegedly stolen by senior members of staff. The second reported on 11 April 2016 related to the irregular appointment of staff members. Both incidents are currently under investigation.
During the 2014/15 financial year, a forensic investigation was conducted over social economic development (SED) projects after an anonymous tip-off. The probe revealed wrong-doing by a senior manager which resulted a sanction of dismissal and a criminal investigation by the South African Police Service. The police investigation has been concluded and submitted to the National Prosecuting Authority.
INTERNAL AUDIT
MMTS-2: Augmentation of transfer scheme
81 INTEGRATED ANNUAL REPORT 2015-2016
Legislative compliance remains one of the critical elements of risks in TCTA’s operations. Despite the complexity and challenges of legislative obligations, TCTA commits to complying with all applicable legislation as well as non-binding codes and standards such as the King III Code, to the extent possible by a public entity given other applicable legislation.
In addition to complying with its core legislation and standards applicable to the construction industry, TCTA has always endeavoured to comply with founding legislation such as the National Water Act, the PFMA and its Regulations, and the Constitution of the Republic of South Africa. TCTA’s views adherence to legislation, regulations and non-binding good governance codes and standards as critical in managing its risks and upholding its operational values of integrity, unity, respect, excellence and growth.
TCTA supports government initiatives to strengthen public sector governance and deter any form of negative impact on stakeholders and financial management due to legislative non-compliance. The organisation seeks to maintain transparent and honest relationships with all stakeholders, including relevant regulatory authorities and project funders. TCTA conducts its business operations in line with all applicable legislations, regulations, good governance, non-binding codes and standards.
The TCTA Board is accountable for ensuring compliance with laws, regulations, policies and procedures and any adopted standards applicable to the organisation. The compliance function assists management in discharging its responsibility to comply with statutory, regulatory and supervisory requirements by facilitating the development, establishment and maintenance of an efficient and effective compliance risk management process. Compliance continues to monitor key controls implemented by management. Compliance has found the control environment satisfactory.
Over and above the ongoing advisory and monitoring responsibilities, the changing regulatory landscape
remained a key focus area for the Compliance function. During the year under review, the Accounting Authority approved the new Compliance Regulatory Universe. The revised Compliance Regulatory Universe contains a list of 87 Acts applicable to the organisation. The Acts are risk-rated based on probability and impact of non-compliance.
TCTA has adopted the Generally Accepted Compliance Practice principles, standards and guidelines developed by the Compliance Institute of South Africa in identifying, assessing, managing and reporting on legislative risks within TCTA.
The Compliance Policy and Risk Management Framework, Compliance Universe and the Compliance Programme were reviewed in line the Compliance Institute standards and approved by the Audit Committee. The Compliance Universe highlights the primary, secondary and topical legislation to assist in prioritising business areas that needs more attention. The Compliance Programme, on the other hand, guides the monitoring activities to be conducted for the financial year in relation to all primary and secondary legislation.
TCTA complies with the PFMA and its Treasury Regulations, the Financial Markets Act 19 of 2012, money laundering-related legislation, environmental-related legislation, the National Water Act and the Notice of Establishment. The organisation monitors compliance with its obligations in terms of the loan covenants concluded with the individual funders of its projects. During the reporting year, TCTA has fairly complied with its applicable legislation and loan covenants.
As far as compliance with the PFMA is concerned, non-compliance was detected, with respect to irregular, fruitless and wasteful expenditure. Non-compliance was the result of a failure to comply with operational, delegation of authority and supply chain management policies. Some fruitless and wasteful expenditure emanated from noncompliance with the National Treasury Instruction on Cost Containment.
COMPLIANCE (with Applicable Legislation and Adherence to Non-binding Rules, Codes and Standards)

82
INFORMATION COMMUNICATION AND TECHNOLOGY
INTEGRATED ANNUAL REPORT 2015-2016
MMTS-2 Resettlement Houses
83 INTEGRATED ANNUAL REPORT 2015-2016
PART E: Information Communication and Technology
84
84
87
87
ICT GOVERNANCE, RISK AND COMPLIANCE FRAMEWORK
COMPLIANCE
STRATEGIC RISKS
STRATEGIC OBJECTIVES

84
INFORMATION COMMUNICATION AND TECHNOLOGY
INTEGRATED ANNUAL REPORT 2015-2016
Target
2015/16
Stage 4:Best Practice
Stage 3: Consistent
Stage 2: Fragmented
Stage 1: Ad hoc
Implementation and monitoring of the approved ICT Governance, Risk and Compliance (GRC) Framework continued during the period under review. The framework
is reviewed every three years in order to align it with best practice and changing business environment.
The governance framework provides a formal and documented process by which decisions on ICT investments are made, how risks associated with those investments are managed, and what legislation, best practices and standards TCTA must comply with. It provides a solid platform on which to build an ICT strategy that proactively responds to the changing business and technology environment.
A multi-pronged and complementary governance approach is in place, in which ICT project steering committees reporting to EXCO, ensure that ‘the right things” are performed correctly while the Accounting Authority, and later Board, provided strategic leadership.
As was the case in previous years, TCTA applied the Institute of Directors’ Governance Assessment Instrument to determine the extent of compliance with the King III Report, as one of the key compliance requirements adopted in the ICT GRC Framework. The output of this assessment assists in
identifying appropriate controls for reducing or eliminating risks in the ICT environment. Table 22 gives an assessment of the results for the period under review, comparing it to the previous period.
Figure 12: Forrester’s IT Governance Maturity Model
ICT GOVERNANCE, RISK AND COMPLIANCE FRAMEWORK
COMPLIANCE

85 INTEGRATED ANNUAL REPORT 2015-2016
Table 22: IoDSA Governance Assessment Instrument
Board role and duties ResponsesRequirement
Com
plia
nt
Parti
ally
C
ompl
iant
Non
-C
ompl
iant 2014/2015
StatusMeans of verification
F. IT Governance1. The Board assumes responsibility for
the governance of IT and places it on the Board agenda
√ Partially Compliant
No Board in place during the first three quarters of 2015/2016, however, the Accounting Authority (AA) fulfilled this responsibility
2. The entity has an IT governance framework that supports effective and efficient management of its IT resources
√ Compliant ICT Governance, Risk and Compliance (GRC) Framework approved in August 2014 and still in place
3. The IT governance framework includes the structures, processes and mechanisms that will enable the delivery of value to the business and reduce IT risk
√ Compliant Approved ICT GRC Framework includes governance structures and processes
4. The Board ensures that an effective IT charter and policies are established and implemented
√ Partially Compliant
No Board in place during the first three-quarters of 2015/2016, however, the AA fulfilled this responsibility. Approved ICT Strategy and policies in place
5. The Board receives independent assurance on the effectiveness of the IT internal controls, including on outsourced IT services
√ Partially Compliant
No Board in place during the first three quarters of 2015/2016, however, the AA fulfilled this responsibility. Internal and external audit reports were submitted to the AA
6. The Board ensures that IT strategy is effectively integrated with the entity’s strategic and business processes
√ Partially Compliant
No Board in place during the first three quarters of 2015/2016, however, the AA fulfilled this responsibility. Approved ICT Strategy in place and aligned to corporate strategic goals and processes
7. The Board ensures that there is an effective process in place to identify and exploit opportunities to improve the performance and sustainability of the entity through the use of IT
√ Partially Compliant
No Board in place during the first three quarters of 2015/2016, however, the AA fulfilled this responsibility. Quarterly reports; internal audit report on ICT Strategy and performance
8. Management is responsible for the implementation of all the structures, processes and mechanisms of the IT governance framework
√ Compliant The Executive Manager: Enterprise Support Services, Senior Manager: IT and IT GRC Specialist drive implementation in a coordinated manner; quarterly ICT dashboard tracking progress

86
INFORMATION COMMUNICATION AND TECHNOLOGY
INTEGRATED ANNUAL REPORT 2015-2016
Board role and duties ResponsesRequirement
Com
plia
nt
Parti
ally
C
ompl
iant
Non
-C
ompl
iant 2014/2015
StatusMeans of verification
F. IT Governance9. A Chief Information Officer (CIO) or
other senior employee responsible for IT has been appointed and meets both the following requirements: the CIO or senior employee is a suitably experienced person; and the CIO or senior employee has access to and regular interaction on strategic matters with the Board or appropriate Board committee, and executive management
√ Compliant The Executive Manager: Enterprise Support Services is designated as the CIO and is a member of the Executive Committee
10. The Board both oversees the value delivery of IT, and monitors the return on investment from significant IT projects
√ Partially Compliant
No Board in place during the first three quarters of 2015/2016, however, the AA fulfilled this responsibility. Quarterly reports submitted to AA
11. The role of IT in achieving business strategies and objectives is clear
√ Compliant The role of IT is clearly defined in the approved ICT Strategy
12. Good governance principles apply to all parties in the supply chain or channel for the acquisition and disposal of IT goods or services
√ Compliant ICT GRC Framework; Delegation Matrix; SCM Policy; records of tender processes
13. IT risks form an integral part of the entity’s risk management process
√ Compliant Risk register; agenda and minutes of the Risk Forum
14. Management regularly demonstrates to the Board that the entity has adequate business resilience arrangements in place for IT disaster recovery
√ Partially Compliant
No Board in place during the first three quarters of 2015/2016, however, the AA fulfilled this responsibility. Quarterly reports submitted to the AA; disaster recovery plan in place and regular testing
15. The Board ensures that the entity complies with IT laws and that IT-related rules, codes and standards are considered
√ Partially Compliant
No Board in place during the first three quarters of 2015/2016, however, the AA fulfilled this responsibility. ICT GRC Framework; compliance reports; quarterly reports submitted to the AA
16. The Board ensures that the entity identifies all personal information and treats it as an important business asset
√ Partially Compliant
No Board in place during the first three quarters of 2015/2016, however, the AA fulfilled this responsibility. Compliance reports; audit reports submitted and reviewed
17. The following two statements are correct: The Board ensures that an Information Security Management System is developed, recorded and implemented; and- the Information Security Management System ensures security, confidentiality, integrity and availability of information
√ Partially Compliant
21 Information Security Management Policies that comply with ISO 27000 and approved by the ICT Committee and EXCO

87 INTEGRATED ANNUAL REPORT 2015-2016
RISK COMMENT MITIGATING MEASURES1. ICT infrastructure
and systems may not respond to the TCTA business requirements
This risk arises from the fact that TCTA is currently going through a complete overhaul of its ICT infrastructure and systems architecture. This is a multiyear project to be completed in 2016/2017
The following mitigating measures are in place and active:• the business case and procurement strategies are
interrogated and approved by EXCO, where-after the Bid Specification Committee ensures that tender specifications are aligned with business requirements;
• each project is implemented according to the approved project implementation and management methodology;
• each project is governed by a steering committee constituted by at least three executive managers; and
• regular reports are submitted for noting.
Table 23: Strategic Risks
Key strategic objective Progress reportTo have an Integrated infrastructure to provide for predictability, agility and scalability
A new Integrated ICT Infrastructure Strategy was approved by the Accounting Authority in October 2015, and as at the end of the reporting period a tender for the appointment of a service provider to implement the integrated infrastructure solution was at the technical evaluation stage. It is envisaged that a service provider will be appointed during the first quarter of 2016/2017
Build new efficient solutions that seamlessly integrate with existing solutions
The major achievement was the finalisation of a single systems architecture based on a single platform, which is a move away from multiple systems based on different technologies. Implementation of two major systems commenced during the period under review:• Treasury Management System – this system will replace the current outdated system
and ensure automation of all treasury processes, eliminating the need for manual intervention using spreadsheets, thereby improving management of treasury risks. System implementation commenced in July 2015 and 53% complete by the end of the reporting period; and
• Enterprise Resource Planning (Fin, SCM & HRM) – this will replace the current outdated accounting and payroll systems; and more importantly fully automate the supply chain management process which is currently manual. The system will further provide for seamless integration between Finance, SCM and Human Resources business processes. Implementation commenced in February 2016 and by the end of the reporting period progress was 20%.
In addition to the above, a tender process to appoint a service provider to implement a new project management system (for bulk raw water infrastructure projects) is currently underway, at the technical evaluation stage
Table 24 presents a status report on progress made, during the reporting period, towards the achievement of the following two key strategic objectives.
Table 24: Strategic Objectives
STRATEGIC RISKS
STRATEGIC OBJECTIVES
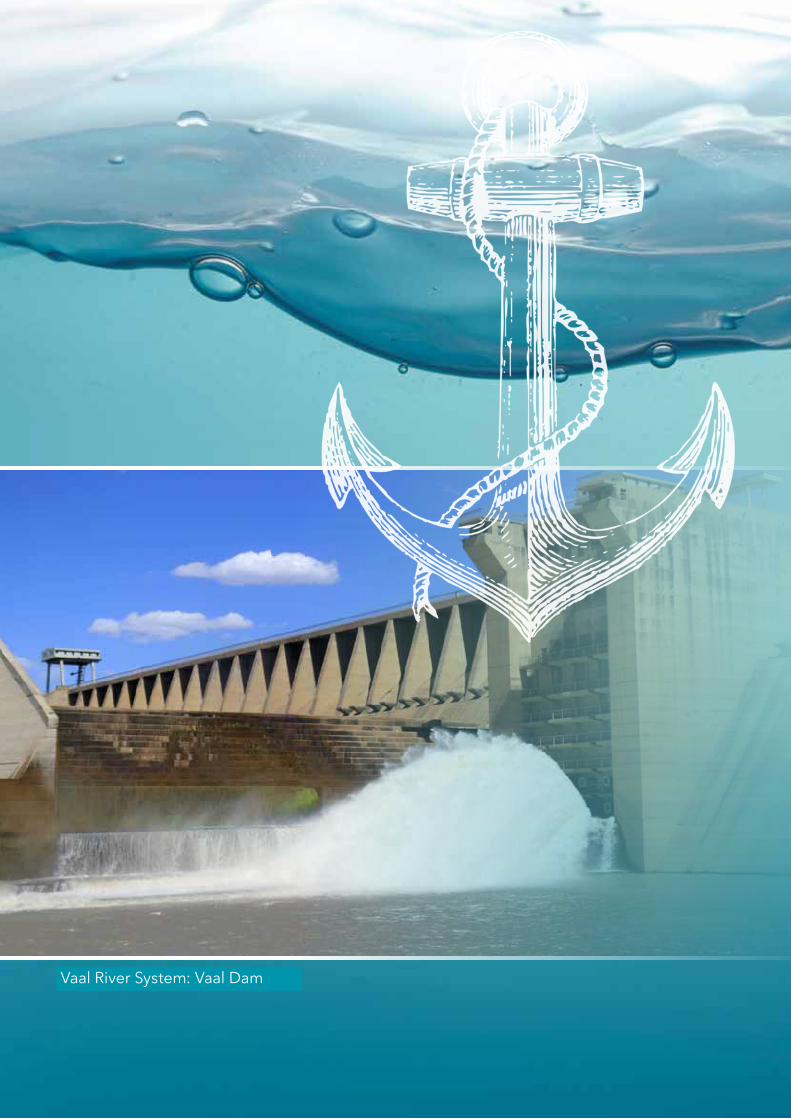
Vaal River System: Vaal Dam
PART F: FINANCIAL INFORMATION
INDEPENDENT AUDITOR’S REPORT (to Parliament on the Trans-Caledon Tunnel Authority)
AUDIT COMMITTEE REPORT
AGGREGATED STATEMENT OF FINANCIAL POSITION
AGGREGATED STATEMENT OF COMPREHENSIVE INCOME
AGGREGATED STATEMENT OF CHANGES IN EQUITY
AGGREGATED STATEMENT OF CASH FLOWS
NOTES TO THE ANNUAL FINANCIAL STATEMENTS
ANNEXURE A: SEGMENTAL STATEMENT OF CASH FLOWS
ANNEXURE B: UNAUDITED SEGMENTAL STATEMENT OF COMPREHENSIVE INCOME
90
94
96
97
98
99
100
244
256

90INTEGRATED ANNUAL REPORT 2015-2016
INDEPENDENT AUDITOR’S REPORT (to Parliament on the Trans-Caledon Tunnel Authority)
REPORT ON THE FINANCIAL STATEMENTS
Introduction
We have audited the financial statements of the Trans-Caledon Tunnel Authority set out on pages 96 to 255 which comprise the aggregated statement of financial position as at 31 March 2016, and the aggregated statement of comprehensive income, aggregated statement of changes in equity and aggregated statement of cash flows for the year then ended, and the notes, comprising a summary of significant accounting policies and other explanatory information.
Accounting Authority’s Responsibility for the Financial Statements
The accounting authority is responsible for the preparation and fair presentation of these financial statements in accordance with International Financial Reporting Standards and the requirements of the Public Finance Management Act of South Africa, 1999 (Act No. 1 of 1999) and for such internal control as the accounting authority determine is necessary to enable the preparation of financial statements that are free from material misstatement, whether due to fraud or error.
Auditor’s Responsibility
Our responsibility is to express an opinion on these financial statements based on our audit. We conducted our audit in accordance with International Standards on Auditing. Those standards require that we comply with ethical requirements and plan and perform the audit to obtain reasonable assurance about whether the financial statements are free from material misstatement.
An audit involves performing procedures to obtain audit evidence about the amounts and disclosures in the financial statements. The procedures selected depend on the auditor’s judgement, including the assessment of the risks of material misstatement of the financial statements, whether due to fraud or error. In making those risk assessments, the auditor considers internal control
relevant to the entity’s preparation and fair presentation of the financial statements in order to design audit procedures that are appropriate in the circumstances, but not for the purpose of expressing an opinion on the effectiveness of the entity’s internal control. An audit also includes evaluating the appropriateness of accounting policies used and the reasonableness of accounting estimates made by management, as well as evaluating the overall presentation of the financial statements.
We believe that the audit evidence we have obtained is sufficient and appropriate to provide a basis for our audit opinion.
Opinion
In our opinion, the financial statements present fairly, in all material respects, the financial position of the Trans-Caledon Tunnel Authority as at 31 March 2016, and its financial performance and cash flows for the year then ended in accordance with International Financial Reporting Standards and the requirements of the Public Finance Management Act of South Africa.
REPORT ON OTHER LEGAL AND REGULATORY REQUIREMENTS
Public Audit Act Requirements (PAA)
In accordance with the Public Audit Act of South Africa, 2004 (Act No. 25 of 2004) (PAA) and the general notice issued in terms thereof, we have a responsibility to report findings on the reported performance information against predetermined objectives for the selected objectives presented in the annual report, non-compliance with legislation and internal control. We performed tests to identify reportable findings as described under each subheading but not to gather evidence to express assurance on these matters. Accordingly, we do not express an opinion or conclusion on these matters.
91 INTEGRATED ANNUAL REPORT 2015-2016
Predetermined objectives
We performed procedures to obtain evidence about the usefulness and reliability of the reported performance information for the following selected objectives presented in the annual performance report of the entity for the year ended 31 March 2016:
• Manage the funding and debt on the infrastructure projects in a manner that achieves cost-effective funding, taking into account current and projected market conditions as well as managing risks on pages 34 to 35.
• Construct infrastructure on time, within budget, to the appropriate standard and in a sustainable socio/environmental manner on pages 36 to 39.
• Acid mine drainage is treated to the correct standard before discharging to the environment on pages 38 to 39.
We evaluated the usefulness of the reported performance information to determine whether it was presented in accordance with the National Treasury’s annual reporting principles and whether the reported performance was consistent with the planned objectives. We further performed tests to determine whether indicators and targets were well defined, verifiable, specific, measurable, time bound and relevant, as required by National Treasury’s Framework for managing programme performance information (FMPPI).
We assessed the reliability of the reported performance information to determine whether it was valid, accurate and complete.
We did not identify any material findings on the usefulness and reliability of the reported performance information for the selected objectives.
Additional matter
Although we identified no material findings on the usefulness and reliability of the reported performance information for the selected objectives, we draw attention to the following matter:
Achievement of planned targets
Refer to the annual report on pages 33 to 41 for information on the achievement of planned targets for the year.
Compliance with legislation
We performed procedures to obtain evidence that the entity had complied with legislation regarding financial matters, financial management and other related matters. Our findings on material non-compliance with specific matters in key legislation, as set out in the general notice issued in terms of the PAA, are as follows:
Value Added Tax Act 89 of 1991
Value Added Tax (VAT) was not declared timeously based on an incorrect management interpretation of when VAT was due on advance payments, resulting in contravention of section 9(3)(b) of the VAT Act 89 of 1991 (‘the VAT Act”). An amount of R36.4 million is provided in the accounts for possible interest charges the South African Revenue Services may levy. The amount is disclosed in Note 22 as Fruitless and Wasteful Expenditure in terms of Section 55(2)(b)(i) of the Public Finance Management Act.
Internal control
We considered internal control relevant to our audit of the financial statements, annual performance report and compliance with laws and regulations but not to gather evidence to express an opinion or conclusion on the effectiveness of the entity’s internal control. The matters reported below are limited to the significant internal control deficiencies that resulted in the findings on non-compliance with legislation included in this report.
Financial and performance management
The monitoring process over compliance with VAT legislation and regulation was not updated to ensure compliance with the VAT Act.

92INTEGRATED ANNUAL REPORT 2015-2016
Other reports
We draw attention to the following engagements that are either in progress or have been completed. Our opinion is not modified in respect of these engagements.
Audit Related Services and Special audits
National Treasury reporting template
As requested by the Trans-Caledon Tunnel Authority, an audit engagement was conducted concerning the Trans-Caledon Tunnel Authority’s completion of the National Treasury reporting template.
Report on Other Legal and Regulatory Requirements
In terms of the IRBA Rule published in Government Gazette Number 39475 dated 04 December 2015, we report that Ernst & Young Inc. has been the auditor of the Trans-Caledon Tunnel Authority for 3 years.
Ernst & Young Inc. Partner – Ernest van Rooyen Registered Auditor Chartered Accountant (SA)31 August 2016
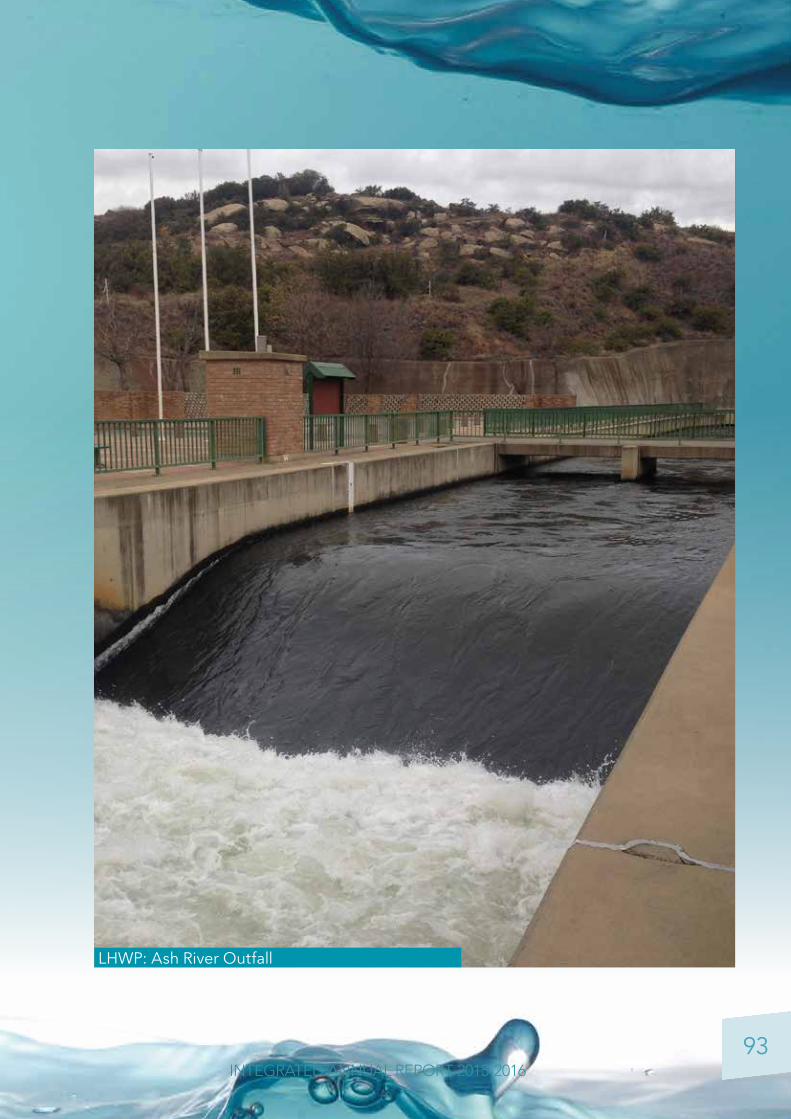
93 INTEGRATED ANNUAL REPORT 2015-2016
LHWP: Ash River Outfall

94INTEGRATED ANNUAL REPORT 2015-2016
AUDIT COMMITTEE’S REPORT
We are pleased to present our report for the financial year ended 31 March 2016.
Audit Committee Responsibility
TCTA did not have an Audit Committee for 11 months of the financial year ending 31 March 2016.
On the 31 August 2014, when the term of office of the previous Board expired, the Minister of Water and Sanitation appointed the Chief Executive Officer as the Accounting Authority in terms of Section 49(2) (b) of the PFMA. This appointment lasted until 1 December 2015 when the new Board was appointed. The Board met for the first time on the 12 and 13 February 2016 and the Audit Committee was approved on 13 February 2016. The Audit Committee was therefore in existence for only one month during the financial year ending 31 March 2016.
During the period when the CEO was the Accounting Authority, no formal Audit Committee meetings were held. Some of the functions that would otherwise be conducted by an Audit Committee were undertaken the CEO acting as the Accounting Authority.
The Audit Committee has been informed by the CEO that:
• TCTA abided by the requirements of the Public Finance Management Act 1 of 1999 (PFMA) and King Code of Governance Principles 2009 (King III);
• TCTA’s external audit was performed by an independent auditing firm, Ernst & Young Inc.;
• TCTA had an Internal Audit function which exercised its audit responsibilities as set out in the approved audit charter;
• The Accounting Authority (CEO) discharged its responsibilities in terms of sections 51 and 76(4) (d) of the PFMA and Treasury Regulations 27.1.7 in conjunction with Principle 3 of King III.
Effectiveness of Internal Control
Section 51 (1) (a) (i) of the PFMA requires the Board to ensure that TCTA has and maintains effective, efficient
and transparent system of financial management, risk management and internal control. An Audit Committee is an integral component of the risk management process within TCTA as it provides strategic leadership to Management, oversees the Internal Audit, Compliance and Legal functions.
During the period when TCTA did not have an Audit Committee, we are informed that the CEO acting as Accounting Authority, provided this function.
The Audit Committee has been informed that the following areas of improvement are required to strengthen the control environment:
• governance;• organisational disciplines;• policies; and• compliance with legislation and treasury regulations.
Quality Management
The Audit Committee has been informed by the Accounting Authority (CEO) that the management reporting disciplines were in place, which included the preparation of an annual corporate plan and the budget which was approved by the Accounting Authority (CEO) for the year under review. The quarterly results were reported against the approved budget to the Minister for oversight review. Projections and forecast cash flows were updated monthly, whilst working capital and borrowing limits were monitored on an on-going basis by the Accounting Authority (CEO). Management met regularly throughout the year, to consider day to day issues pertaining to TCTA business.
Evaluation of the Financial Statements
In respect of the annual financial statements, the Audit Committee undertook the following:
• confirmed the going concern as the basis of preparation of the annual financial statements;
• examined and reviewed the annual financial statements, as well as all financial information disclosed to the public prior to submission and approval by the Board;
95 INTEGRATED ANNUAL REPORT 2015-2016
• ensured that the annual financial statements fairly present the financial position of TCTA as at the end of the financial year and the results of operations and cash flows for the financial year; and
• considered accounting treatments, significant unusual transactions and accounting judgements;
Furthermore, the Audit Committee was advised by the Accounting Authority (CEO) that compliance with the financial conditions of the loan covenants were reviewed.
Evaluation of the Annual Performance Report
In respect of the Annual Performance Report, the Audit Committee, amongst others:
• noted the performance in respect of the predetermined objectives, as set out in the Shareholders Compact; and
• noted the audit reports issued by the External and Internal Auditors on the Performance Against Pre-determined Objectives.
Approval of Annual Financial Statements and Annual Performance Report
On the 25 July 2016, the Audit Committee recommended approval of the Annual Financial Statements and the Annual Performance Report.
Conclusion
The Audit Committee notes and accepts the conclusions and audit opinion of the External Auditors, Ernst & Young Inc. on the annual financial statements and recommends that the audited financial statements be accepted.
Mr Jacob ModiseChairman: Audit Committee

96INTEGRATED ANNUAL REPORT 2015-2016
A S A T 3 1 M A R C H 2 0 1 6
AGGREGATED STATEMENT OF FINANCIAL POSITION
Financial statements are rounded to the nearest million. Where balances are zero, the amount is less than R500 000.
Notes
TotalMarch 2016
R million
TotalMarch 2015
R millionASSETSNon-current assets 24 941 23 423 Property, plant and equipment 6 12 13 Tariff receivable 7.4 24 929 23 104 Long-term financial market investments 7.5 - 306
Current assets 5 759 9 636 Tariff receivable 7.4 751 3 352 Loans and other receivables 8 86 2 320 Short-term financial market investments 7.5 4 705 3 705 Prepaid expenditure 9 175 211 Non-contractual amounts 11 41 48 Cash and cash equivalents 13 1 -
TOTAL ASSETS 30 700 33 059
EQUITY AND LIABILITIESReserves 362 2 084 Non-distributable reservesAccumulated surplus 362 2 084
TOTAL EQUITY 362 2 084
LIABILITIESNon-current liabilities 27 192 27 180 Long-term financial market liabilities 7.6 26 908 26 861 Provision 12 284 319
Current liabilities 3 146 3 795 Trade and other payables 10 1 451 2 618 Non-contractual amounts 11 101 109 Provisions 12 59 48 Derivative financial instruments 7.11 3 - Short-term financial market liabilities 7.6 1 532 1 020
TOTAL LIABILITIES 30 338 30 975
TOTAL EQUITY AND LIABILITIES 30 700 33 059

97 INTEGRATED ANNUAL REPORT 2015-2016
F O R T H E Y E A R E N D E D 3 1 M A R C H 2 0 1 6
AGGREGATED STATEMENT OF COMPREHENSIVE INCOME
Notes
TotalMarch 2016
R million
TotalMarch 2015
R million
CONSTRUCTION REVENUE 14 1 892 1 748
CONSTRUCTION COSTS 14 (1 892) (1 748)
OTHER INCOME 15 1 013 799
EXPENSES (1 013) (799)Legal fees and litigation costs - (1)Depreciation (6) (11)Operating costs for the work in Lesotho 16 (140) (99)Lesotho Highlands Water Commission costs (9) (18)Staff costs (76) (146)Directors' emoluments (1) (4)Royalties paid 18 (775) (612)Other operating expenses 19 (6) 92
OPERATING SURPLUS/(DEFICIT) - -
NET FINANCE COSTS (1 722) (190)Finance income 17.1 2 520 2 906 Finance costs 17.2 (4 242) (3 096)
DEFICIT FOR THE YEAR (1 722) (190)
OTHER COMPREHENSIVE INCOME - -
TOTAL COMPREHENSIVE DEFICIT FOR THE YEAR (1 722) (190)
Financial statements are rounded to the nearest million. Where balances are zero, the amount is less than R500 000.
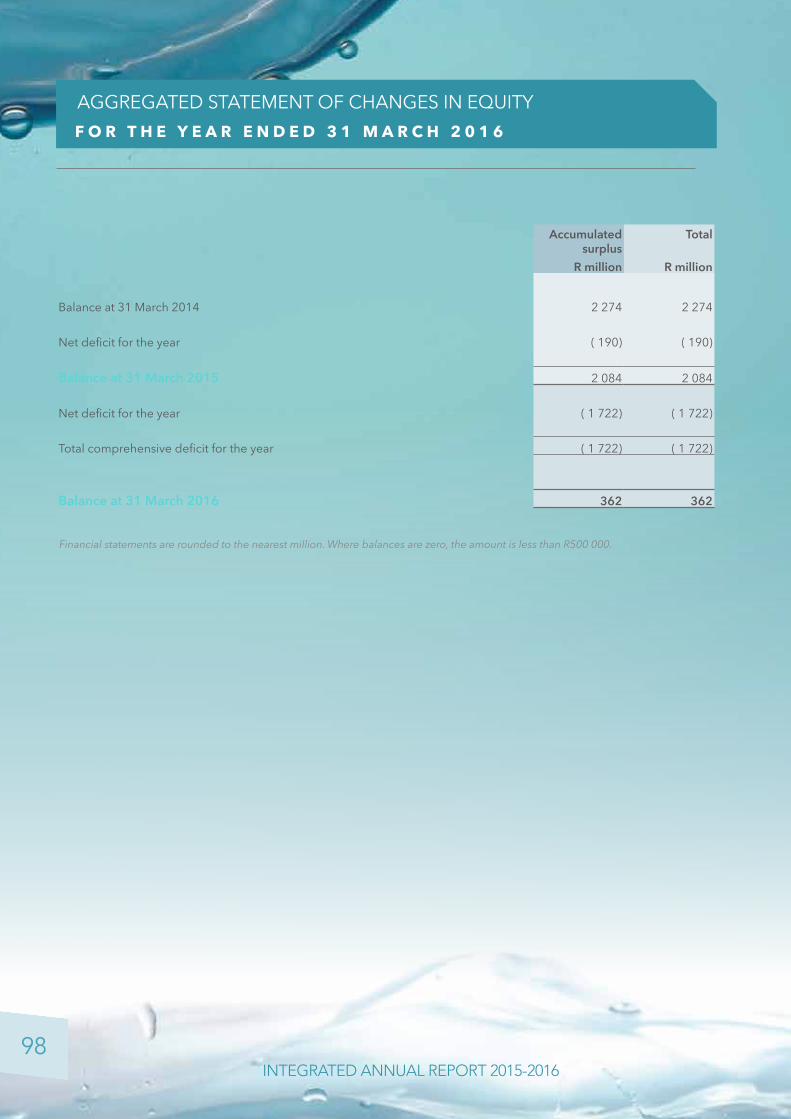
98INTEGRATED ANNUAL REPORT 2015-2016
F O R T H E Y E A R E N D E D 3 1 M A R C H 2 0 1 6
AGGREGATED STATEMENT OF CHANGES IN EQUITY
Accumulated surplus
Total
R million R million
Balance at 31 March 2014 2 274 2 274
Net deficit for the year ( 190) ( 190)
Balance at 31 March 2015 2 084 2 084
Net deficit for the year ( 1 722) ( 1 722)
Total comprehensive deficit for the year ( 1 722) ( 1 722)
Balance at 31 March 2016 362 362
Financial statements are rounded to the nearest million. Where balances are zero, the amount is less than R500 000.
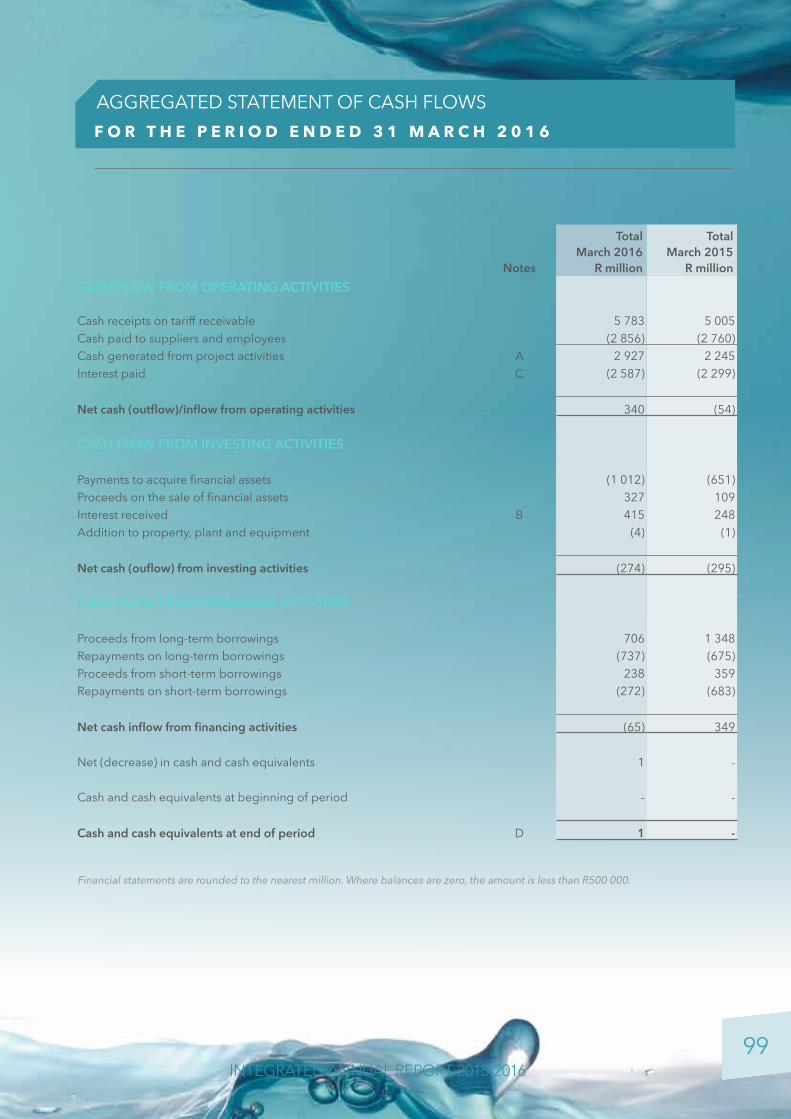
99 INTEGRATED ANNUAL REPORT 2015-2016
F O R T H E P E R I O D E N D E D 3 1 M A R C H 2 0 1 6
AGGREGATED STATEMENT OF CASH FLOWS
Notes
TotalMarch 2016
R million
TotalMarch 2015
R millionCASH FLOW FROM OPERATING ACTIVITIES
Cash receipts on tariff receivable 5 783 5 005 Cash paid to suppliers and employees (2 856) (2 760)Cash generated from project activities A 2 927 2 245 Interest paid C (2 587) (2 299)
Net cash (outflow)/inflow from operating activities 340 (54)
CASH FLOW FROM INVESTING ACTIVITIES
Payments to acquire financial assets (1 012) (651)Proceeds on the sale of financial assets 327 109 Interest received B 415 248 Addition to property, plant and equipment (4) (1)
Net cash (ouflow) from investing activities (274) (295)
CASH FLOW FROM FINANCING ACTIVITIES
Proceeds from long-term borrowings 706 1 348 Repayments on long-term borrowings (737) (675)Proceeds from short-term borrowings 238 359 Repayments on short-term borrowings (272) (683)
Net cash inflow from financing activities (65) 349
Net (decrease) in cash and cash equivalents 1 -
Cash and cash equivalents at beginning of period - -
Cash and cash equivalents at end of period D 1 -
Financial statements are rounded to the nearest million. Where balances are zero, the amount is less than R500 000.
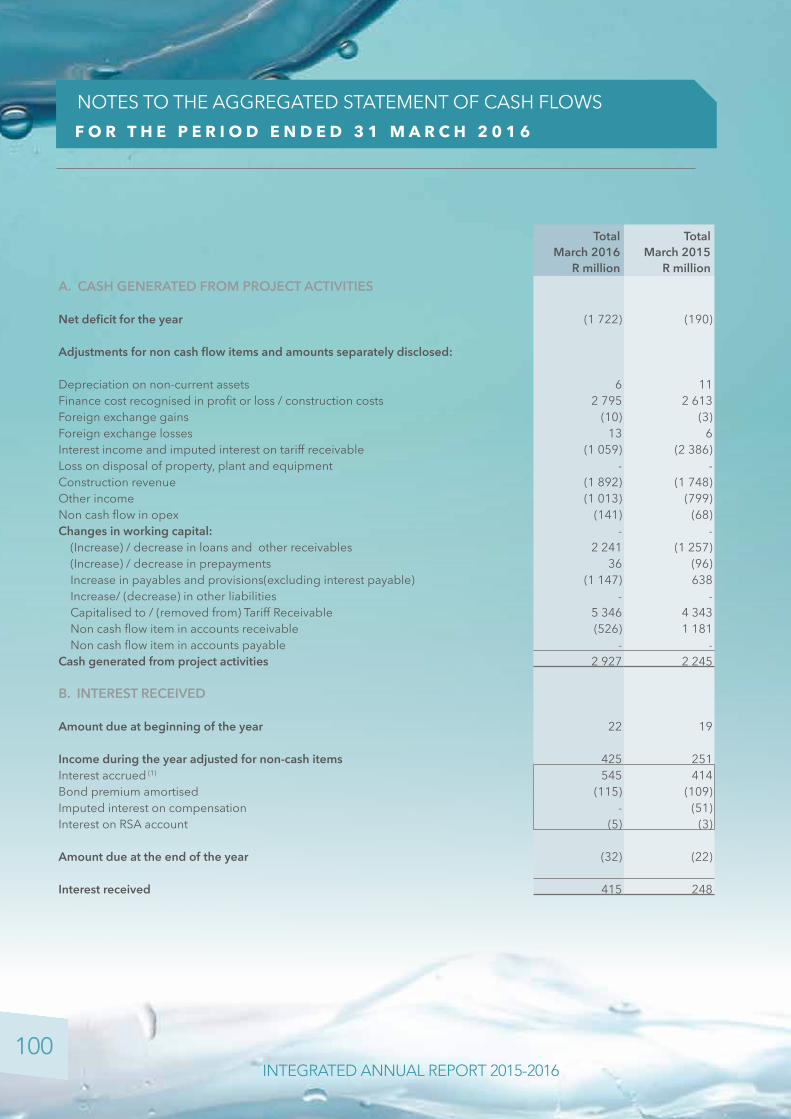
100INTEGRATED ANNUAL REPORT 2015-2016
F O R T H E P E R I O D E N D E D 3 1 M A R C H 2 0 1 6
NOTES TO THE AGGREGATED STATEMENT OF CASH FLOWS
TotalMarch 2016
R million
TotalMarch 2015
R millionA. CASH GENERATED FROM PROJECT ACTIVITIES
Net deficit for the year (1 722) (190)
Adjustments for non cash flow items and amounts separately disclosed:
Depreciation on non-current assets 6 11 Finance cost recognised in profit or loss / construction costs 2 795 2 613 Foreign exchange gains (10) (3)Foreign exchange losses 13 6 Interest income and imputed interest on tariff receivable (1 059) (2 386)Loss on disposal of property, plant and equipment - - Construction revenue (1 892) (1 748)Other income (1 013) (799)Non cash flow in opex (141) (68)Changes in working capital: - -
(Increase) / decrease in loans and other receivables 2 241 (1 257)(Increase) / decrease in prepayments 36 (96)Increase in payables and provisions(excluding interest payable) (1 147) 638 Increase/ (decrease) in other liabilities - - Capitalised to / (removed from) Tariff Receivable 5 346 4 343 Non cash flow item in accounts receivable (526) 1 181 Non cash flow item in accounts payable - -
Cash generated from project activities 2 927 2 245
B. INTEREST RECEIVED
Amount due at beginning of the year 22 19
Income during the year adjusted for non-cash items 425 251 Interest accrued (1) 545 414 Bond premium amortised (115) (109)Imputed interest on compensation - (51)Interest on RSA account (5) (3)
Amount due at the end of the year (32) (22)
Interest received 415 248

101 INTEGRATED ANNUAL REPORT 2015-2016
F O R T H E P E R I O D E N D E D 3 1 M A R C H 2 0 1 6
NOTES TO THE AGGREGATED STATEMENT OF CASH FLOWS
TotalMarch 2016
R million
TotalMarch 2015
R millionC. INTEREST PAID
Amount not paid at beginning of the year (558) (548)
Expensed during the year adjusted for non-cash items (2 571) (2 308)Amount expensed (3 340) (3 027)Less: Bond discount amortised 1 2 Foreign loan payments - (1) Loss on switch auction 42 1 Capital adjustment to inflation-linked liability 544 438 Prepaid interest on EIB loan 1 1 Interest on compensation 34 37 Interest on umgeni 2 - Interest capitalised to the principal amount (2) 110 241 Accrued interest on switched bonds 35 -
Amount not paid at the end of the year 542 557 -
Interest paid (2 587) (2 299)
D. CASH AND CASH EQUIVALENTS AT END OF PERIOD
Cash and cash equivalents consist of cash on hand and balances with banks 1 -
The cash flow movement in Tariff receivable is shown under operating activities, as projects are exceeding the standard one year cycle.
(1) Interest accrued excludes imputed interest on the tariff receivable.(2) This relates to interest accrued but not due for payment.

102INTEGRATED ANNUAL REPORT 2015-2016
1. GENERAL INFORMATION
The Trans-Caledon Tunnel Authority (TCTA) is a specialised liability management body, established in terms of Government Notice No 2631 in Government Gazette No 10545, dated 12 December 1986. The Notice was replaced by Government Notice No 277 in Government Gazette No 21017, dated 24 March 2000. The entity is domiciled in South Africa. The address of the registered office is 265 West Avenue, Tuinhof Building, 1st Floor, Centurion.
2. APPLICATION OF NEW AND REVISED STANDARDS AND INTERPRETATIONS
TCTA is required to disclose the potential impact of new and revised IFRSs that have been issued but are not effective yet. The disclosures in note 2.1 summarises the new and revised IFRSs that have been issued but are not effective yet which TCTA has elected to early adopt. TCTA has not applied some of the new IFRSs that have been issued but are not yet effective, disclosed in note 2.2. The note also summarises any known or reasonably estimable information relevant to assessing the possible impact that application of the new IFRS will have on TCTA’s financial statements in the period of initial application.
2.1 Early adoption of new and revised IFRSs that have been issued but are not yet effective or which have no impact on TCTA but where disclosure is included for completeness
New or revised standards or pronouncements:IFRS 14 Regulatory Deferral AccountsEffective for annual periods beginning on or after 1 January 2016Impact:IFRS 14 permits an entity, whose activities are subject to rate regulation, to continue applying most of its existing accounting policies in accordance with their previous GAAP, for regulatory deferral account balances upon first time adoption of IFRS. Entities that adopt IFRS 14 must present the regulatory deferral accounts as separate line items on the statement of financial position and present movements in these account balances as separate line items in the statement of profit or loss and other comprehensive income to enhance comparability with entities that apply IFRS and do not recognise such amounts. The standard requires disclosure of the nature of, and risks associated with, the entity’s rate regulation and the effects of that rate regulation on its financial statements. As TCTA currently presents Financial Statements in accordance with IFRS it is not eligible to apply IFRS 14.
New or revised standards or pronouncements:IAS 12 Recognition of Deferred Tax Assets for Unrealised Losses – Amendments to IAS 12Effective for annual periods beginning on or after 1 January 2017Impact:The IASB issued the amendments to IAS 12 Income Taxes to clarify the accounting for deferred tax assets for unrealised losses on debt instruments measured at fair value. The amendments clarify that an entity needs to consider whether tax law restricts the sources of taxable profits against which it may make deductions on the reversal of that deductible temporary difference. Furthermore, the amendments provide guidance on how an entity should determine future taxable profits and explains in which circumstances taxable profit may include the recovery of some assets for more than their carrying amount. This will have no effect on TCTA as it is a tax exempt entity.
F O R T H E P E R I O D E N D E D 3 1 M A R C H 2 0 1 6
NOTES TO THE ANNUAL FINANCIAL STATEMENTS

103 INTEGRATED ANNUAL REPORT 2015-2016
2.2 Standards in issue but not yet applied
New or revised standards or pronouncements:IFRS 9 - Financial InstrumentsEffective for annual periods beginning on or after 1 January 2018Impact:IFRS 9 introduces a single classification and measurement model for financial assets, dependent on both:• The entity’s business model objective for managing financial assets.• The contractual cash flow characteristics of financial assets.
The completed IFRS 9 (revised 2014) contains the requirements for a) the classification and measurement of financial assets and financial liabilities; b) impairment methodology and c) general hedge accounting.
a) The classification and measurement of financial assets and financial liabilities;‘Initial recognition and measurement of financial assets and financial liabilities’At fair value plus directly attributable transaction costs for when the financial assets and liabilities are not classified at fair value through profit or loss.• Fair value - is the price that would be received to sell an asset or paid to transfer a liability in an orderly
transaction between market participants at the measurement date• Directly attributable transaction costs - incremental costs that are directly attributable to the acquisition, issue
or disposal of a financial asset or financial liability.
Classification and measurement of financial assetsFinancial Assets are subsequently classified as either: (1) Amortised Cost, (2) Fair value through profit or loss (FVTPL). There is a new third optional category (3) Fair Value through other comprehensive income (FVOCI) (investments in equity instruments).This fair value option
(FVO) that allows financial assets on initial recognition to be designated as FVTPL if that eliminates or significantly reduces an accounting mismatch. Equity instruments are generally measured at FVTPL. However, entities have an irrevocable option on an instrument-by-instrument basis to present changes in the fair value of non-trading instruments in other comprehensive income (OCI) (without subsequent reclassification to profit or loss).
Subsequent classification and measurement of financial liabilitiesThe requirements for financial liabilities are mostly carried forward unchanged from IAS 39. Financial Liabilities are classified as either: (1) Amortised Cost, (2) Fair value through profit or loss. In addition, IFRS 9 gives specific guidance for: (i) Financial guarantee contracts, and (ii) Commitments to provide a loan at a below market interest rate (iii) Financial Liabilities that arise when the transfer of a financial asset either does not qualify for derecognition
or where there is continuing involvement.
F O R T H E P E R I O D E N D E D 3 1 M A R C H 2 0 1 6
NOTES TO THE ANNUAL FINANCIAL STATEMENTS
104
F O R T H E P E R I O D E N D E D 3 1 M A R C H 2 0 1 6
NOTES TO THE ANNUAL FINANCIAL STATEMENTS
INTEGRATED ANNUAL REPORT 2015-2016
New or revised standards or pronouncements (continued):IFRS 9 - Financial InstrumentsEffective for annual periods beginning on or after 1 January 2018Impact:b) Impairment methodologyImpairment under IAS 39 was based on an incurred loss model whereby credit losses were only recognised once it had occurred. IFRS 9 introduces a single impairment model being applied to all financial instruments, which is based on an “expected credit loss” (ECL) model for the measurement of financial assets. Under this new approach, it is no longer necessary for a credit event to have occurred before the credit losses are recognised. The expected credit loss model applies to debt instruments (such as bank deposits, loans, debt securities and trade receivables) recorded at amortised cost or at fair value through other comprehensive income, plus lease receivables, contract assets and loan commitments and financial guarantee contracts that are not measured at fair value through profit or loss. Entities are generally required to recognise either 12-months’ or lifetime ECL, depending on whether there has been a significant increase in credit risk since initial recognition (or when the commitment or guarantee was entered into). For some trade receivables, the simplified approach may be applied whereby the lifetime expected credit losses are always recognised.
c) Hedge accountingIFRS 9 contains a new model for hedge accounting that aligns the accounting treatment with the risk management activities of an entity, in addition enhanced disclosures will provide better information about risk management and the effect of hedge accounting on the financial statements. Hedge effectiveness testing is prospective, without the 80% to 125% bright line test in IAS 39, and, depending on the hedge complexity, can be qualitative. A risk component of a financial or non-financial instrument may be designated as the hedged item if the risk component is separately identifiable and reliably measureable. The time value of an option, any forward element of a forward contract and any foreign currency basis spread, can be excluded from the designation as the hedging instrument and accounted for as costs of hedging. More designations of groups of items as the hedged item are possible, including layer designations and some net positions.
DerecognitionIFRS 9 carries forward the derecognition requirements of financial assets and liabilities from IAS 39.
TCTA will assess the impact of the standard on the financial reporting in the near future. The effective date is 1 January 2018.
New or revised standards or pronouncements:IFRS 15 - Revenue from Contracts with CustomersEffective for annual periods beginning on or after 1 January 2018Impact:IFRS 15 provides a single, principles based five step model to be applied to all contracts with customers and will replace all existing revenue Standards and Interpretations. It also provides a model for the recognition and measurement of disposal of non-financial assets such as property plant and equipment and intangible assets. The core principle in the standard is that the entity will recognise revenue that reflects the consideration to which the entity expects to be entitled for transferring goods or services to the customer.
2.2 Standards in issue but not yet applied (continued)

105
F O R T H E P E R I O D E N D E D 3 1 M A R C H 2 0 1 6
NOTES TO THE ANNUAL FINANCIAL STATEMENTS
INTEGRATED ANNUAL REPORT 2015-2016
New or revised standards or pronouncements:IFRS 15 - Revenue from Contracts with CustomersEffective for annual periods beginning on or after 1 January 2018Impact:The five steps in the model are as follows:• Identify the contract with the customer.• Identify the performance obligations in the contract.• Determine the transaction price.• Allocate the transaction price to the performance obligations in the contracts.• Recognise revenue when (or as) the entity satisfies a performance obligation.
Guidance is provided on topics such as the point in which revenue is recognised, accounting for variable consideration, costs of fulfilling and obtaining a contract and various related matters. New disclosures about revenue are also introduced. TCTA will assess the impact of this Standard on the financial reporting in the near future.
New or revised standards or pronouncements:IFRS 16 LeasesEffective for annual periods beginning on or after 1 January 2019Impact:IFRS 16 introduces a single accounting model for lessees to recognise lease assets and liabilities with a term of more than 12 months, unless the underlying asset is of low value. At the commencement date of a lease, a lessee will recognise a liability to make lease payments (i.e., the lease liability) and an asset representing the right to use the underlying asset during the lease term (i.e., the right-of-use asset). Lessees will be required to separately recognise the interest expense on the lease liability and the depreciation expense on the right-of-use asset. Upon the occurrence of certain events (e.g., a change in the lease term, a change in future lease payments resulting from a change in an index or rate used to determine those payments) lessees will be required to remeasure the lease liability . The lessee will generally recognise the amount of the remeasurement of the lease liability as an adjustment to the right-of-use asset. Lessor accounting is substantially unchanged and carried forward from IAS 17. Lessors will continue to classify all leases using the same classification principle as in IAS 17 and distinguish between two types of leases: operating and finance leases.A lessee can choose to apply the standard using either a full retrospective or a modified retrospective transition approach. Early application is permitted, provided the entity applies IFRS 15. Key balance sheet and income statement metrics such as leverage ratios, debt covenants, earnings before interest, taxes, depreciation and amortisation (EBITDA), could be impacted. Also, the cash flow statement of the lessees could be affected as payments for the principal portion of the lease liability will be presented within financing activities. TCTA will assess the impact of this Standard on the financial reporting in the near future.
New or revised standards or pronouncements:IAS 7 Disclosure Initiative – Amendments to IAS 7Effective for annual periods beginning on or after 1 January 2017Impact:The amendments to IAS 7 Statement of Cash Flows are part of the IASB’s Disclosure Initiative and require an entity to provide disclosures that enable users of financial statements to evaluate changes in liabilities arising from financing activities, including both changes arising from cash flows and non-cash changes. TCTA will assess the impact of this Standard on the financial reporting in the near future.
106
F O R T H E P E R I O D E N D E D 3 1 M A R C H 2 0 1 6
NOTES TO THE ANNUAL FINANCIAL STATEMENTS
INTEGRATED ANNUAL REPORT 2015-2016
3. SIGNIFICANT ACCOUNTING POLICIES
The principal accounting policies applied in the preparation of these financial statements are set out below. These accounting policies have been consistently applied to all years presented.
3.1 Statement of compliance
The financial statements have been prepared in accordance with International Financial Reporting Standards (IFRS) as issued by the International Accounting Standards Board (IASB).
3.2 Basis of preparation
The financial statements have been prepared on the accrual and historical cost convention, except for certain financial instruments which are stated at fair value. Historical cost is generally based on the fair value of the consideration given in exchange for assets. The preparation of financial statements in conformity with IFRS, requires the use of certain critical accounting estimates and judgements. It also requires management to exercise its judgement in the process of applying TCTA’s accounting policies. The areas involving a higher degree of judgement or complexity, or areas where assumptions and estimates are significant to the financial statements are disclosed in note 23. TCTA presents financial information on an individual project basis about the financial position, financial performance and cash flows of TCTA which will be useful to the users of these financial statements.
3.3 Summary of significant accounting policies
3.3.1 Property, plant and equipment3.3.1.1 Recognition and measurement
On initial recognition property, plant and equipment is measured at cost. An item can only be recognised as property, plant and equipment if it is probable that:• Future economic benefits associated with the item will flow to TCTA,• The cost of the item can be reliably measured, and• The item is expected be used during more than one accounting period.
3.3.1.2 Subsequent costs
The costs of day-to-day servicing of assets are not recognised as property, plant and equipment, but are expensed as repairs and maintenance in the year incurred.
Costs of replacing or upgrading components of an asset can be capitalised, provided that the recognition criteria have been met. The costs of replacement/upgrading are capitalised to the carrying amount of the component of property, plant and equipment when that cost is incurred, while the carrying amounts of components replaced, are derecognised. Cost of improvements are also capitalised when it meets the recognition criteria.
TCTA applies the cost model for all classes of assets by recognising it at cost, adjusted for accumulated depreciation and accumulated impairment losses.

107
F O R T H E P E R I O D E N D E D 3 1 M A R C H 2 0 1 6
NOTES TO THE ANNUAL FINANCIAL STATEMENTS
INTEGRATED ANNUAL REPORT 2015-2016
3.3.1.3 Furniture, vehicles, computer and office equipmentDepreciation is recognised so as to write off the cost of assets less their residual values over their useful lives, using the straight-line method.
• Furniture 4 years• Vehicles 4 years• Computer hardware, software and office equipment 2 years• Networking equipment 2 years• Video conferencing equipment 2 years
The estimated useful lives, residual values and depreciation method are reviewed at the end of the reporting period in terms of the property, plant and equipment policy, with the effect of any changes in estimate accounted for on a prospective basis.
3.3.1.4 Assets held under finance leasesAssets held under finance leases are depreciated over the shorter of their expected useful lives or the lease term. There are currently no assets held under finance leases.
3.3.1.5 Leasehold improvementsThese are stated at cost less accumulated depreciation and accumulated impairment. Depreciation is calculated on the straight-line basis over the shorter of the remaining period of the lease and the useful life of the asset. The useful life of the asset will be assessed at least on an annual basis and will depend on an extension of the current lease agreement.
3.3.1.6 Disposals of property, plant and equipmentGains and losses on disposals are determined by comparing proceeds with the carrying amount at the date of sale. These are included in surplus or deficit when the asset is derecognised.
3.3.1.7 ImpairmentIAS 36: Impairment of assets, is applied to all property, plant and equipment. At each reporting date, TCTA reviews the carrying amounts of its assets to determine whether there is any indication that those assets may be impaired. An asset’s recoverable amount is the higher of an asset’s or cash-generating unit’s (CGU) fair value less costs of disposal and its value in use. The impairment losses are recognised in surplus or deficit. A reversal of an impairment loss for an asset is recognised immediately in surplus or deficit. This occurs if there has been a change in the estimates used to determine the asset’s recoverable amount since the last impairment loss was recognised.
Recoverable amountRecoverable amount is determined for an individual asset, unless the asset does not generate cash inflows that are largely independent of those from other assets or groups of assets. When the carrying amount of an asset or CGU exceeds its recoverable amount, the asset is considered impaired and is written down to its recoverable amount. The recoverable amount is determined as being the higher of fair value less cost of disposal and value in use.
Fair value less costs of disposalThis is the price that would be received to sell an asset less any incremental costs directly attributable to the disposal of an asset or cash-generating unit, excluding finance costs and income tax expense. In determining fair value less costs of disposal, recent market transactions are taken into account. Where it is not possible to determine the fair value less costs of disposal because there is no basis for making a reliable estimate of the amount obtainable from the sale of the asset in an arm’s length transaction between knowledgeable and willing parties, the value in use is deemed to be its recoverable amount.
3.3 Summary of significant accounting policies (continued)
108
F O R T H E P E R I O D E N D E D 3 1 M A R C H 2 0 1 6
NOTES TO THE ANNUAL FINANCIAL STATEMENTS
INTEGRATED ANNUAL REPORT 2015-2016
Value in useValue in use is the present value of the future cash flows expected to be derived from an asset/cash-generating unit. The discount rate utilised is the weighted average cost of capital applicable to the cash-generating unit/asset. In instances where the recoverable amount is determined based on present value techniques, the discount rates used to determine the fair value less the cost of disposal and key assumptions and valuation techniques are disclosed.
3.3.2 Foreign currency translation
3.3.2.1 Functional and presentation currencyThe functional currency of TCTA is the currency of the primary economic environment in which it operates. The financial statements are presented in South African Rand, which is TCTA’s functional and presentation currency.
3.3.2.2 Transactions and balancesTransactions in foreign currencies are accounted for at the rates of exchange ruling on the date of the transactions. Foreign exchange gains and losses arising from the settlement of such transactions and from translation at year-end exchange rates of monetary assets and liabilities denominated in foreign currencies are recognised in surplus or deficit, except when deferred in OCI as qualifying cash flow hedges. Unrealised differences on monetary assets and liabilities are recognised in surplus or deficit in the year in which they occur.
Foreign currency monetary items, such as the foreign denominated loans entered into, are translated using the closing rates at year end.
3.3.3 Financial assets
3.3.3.1 ClassificationTCTA recognises a financial asset in its statement of financial position when, and only when, it becomes party to the contractual provisions of the instrument. Financial assets are classified based on TCTA’s business model. (IFRS 9, (2009, 2010)). TCTA considers if it holds the financial assets to collect contractual cash flows or to sell it prior to maturity to realise fair value changes. TCTA holds its’ financial assets to maturity and thus elected to collect the cash flows from holding the asset. TCTA considers the characteristics of the contractual cash flows of the financial assets to determine whether the conditions for amortised cost have been met as detailed below. Assets are initially measured at fair value plus, in the case of a financial asset not at fair value through profit or loss, particular transaction costs. Assets are subsequently measured at amortised cost or fair value.
TCTA measures financial assets at amortised cost when the following conditions for measurement at amortised cost have been met:(a) The assets are held within the TCTA business model where the objective is to hold assets in order to collect
contractual cash flows; and(b) The contractual terms of the financial assets result in cash flows on specific dates that are solely payments
of principal and interest on the principal amount outstanding.
TCTA’s financial assets mainly consist of the redemption assets, the tariff receivable and derivative instruments.
3.3.3.2 Redemption assetsRedemption assets consist of an investment portfolio, aggregated for the redemption of the bonds as and when they mature. TCTA currently makes investments in order to smooth the refinancing of its mega bond issues. There have been fundamental changes in the approach to investing following the credit crisis. Credit evaluation is first categorised relative to two other considerations i.e. liquidity and price.
3.3 Summary of significant accounting policies (continued)
109
F O R T H E P E R I O D E N D E D 3 1 M A R C H 2 0 1 6
NOTES TO THE ANNUAL FINANCIAL STATEMENTS
INTEGRATED ANNUAL REPORT 2015-2016
For any counterparty to be considered for investments, TCTA will have to evaluate them from three perspectives:
1) The first is externally, where the counterparty’s credit rating is considered, country of origin, their expertise in investments and the track record of the organisation is taken into account.
2) The second aspect is the internally generated assessment, which deals with liquidity and credit of the organisation. This is to allow TCTA to set clearly defined limits that ensures spreading of risk and limits exposure to particular assets or industry.
3) The last aspect is the product, similar to the first aspect, the product should be rated by a reputable credit rating agency in line with money market products and hence would normally hold assets that are short to medium term duration. They also must subscribe to industry organisations for similar type instruments with clearly defined benchmarks.
Redemption assets are carried at amortised cost, using the effective interest method.
The redemption assets are not reflected seperately, but part of financial investments. All fixed investments are held to maturity.
3.3.3.3 Tariff receivableThe tariff receivable is a non-derivative financial asset with determinable receipts based either on costs to be reimbursed or a tariff determined to enable TCTA to repay the project debt over approximately a twenty year period. This category is made up of the right to receive cash from the Department of Water and Sanitation (DWS) with respect to construction work completed on DWS projects or services rendered by TCTA in managing debt on each project. The tariff receivable arises as a result of TCTA incurring costs in terms of the directive from the Minister of Water and Sanitation in each project.
The tariff receivable arises as the contra to the construction revenue earned in each project, and is measured at amortised cost using the effective interest method.
TCTA revises its estimates of costs and water tariff annually and adjusts the carrying amount of the tariff receivable to reflect actual and revised estimated cash flows. TCTA recalculates the carrying amount by computing the present value of estimated future cash flows at the financial instrument’s original effective interest rate calculated in accordance with paragraph AG8 of IAS 39. The adjustment is recognised in surplus or deficit. The critical accounting estimates and judgements from management is included in note 23.2.
3.3.3.4 Derivative instruments Derivative assets and liabilities are initially classified at fair value through profit or loss on the date a derivative contract is entered into and are subsequently remeasured at fair value. Derivatives are classified as current and non-current on the basis of their settlement dates.
110
F O R T H E P E R I O D E N D E D 3 1 M A R C H 2 0 1 6
NOTES TO THE ANNUAL FINANCIAL STATEMENTS
INTEGRATED ANNUAL REPORT 2015-2016
3.3.3.5 Impairment of financial assetsFinancial assets, other than those at ‘at fair value through profit or loss (FVTPL)’, are individually assessed for indicators of impairment at each reporting date. Financial assets are impaired where there is objective evidence that, as a result of one or more events that occurred after the initial recognition of the financial asset, the estimated future cash flows of the financial assets have been impacted.
Objective evidence of impairment could include:• significant financial difficulty of the issuer or counterparty; or• default or delinquency in interest or principal payments; or• it becoming probable that the borrower will enter bankruptcy or financial reorganisation. For certain categories of financial assets, such as trade receivables, assets that are assessed not to be impaired individually are subsequently assessed for impairment on a collective basis. Objective evidence of impairment for a portfolio of receivables could include TCTA’s past experience of collecting payments, an increase in the number of delayed payments in the portfolio past the average credit period, as well as observable changes in national or local economic conditions that correlate with default on receivables. The amount of the impairment loss recognised is the difference between the asset’s carrying amount and the present value of estimated future cash flows, reflecting the impact of collateral and guarantees, discounted at the financial asset’s original effective interest rate. Loans and receivables comprise amounts due by DWS on projects funded from the fiscus. TCTA’s business model includes the securing of income agreements with DWS to guarantee the future cash flow streams on each project. There are no set payment terms of repayment with the DWS. Due to this there is a limited probability of impairment and assessing when the DWS is in arrears would not be accurate.
3.3.3.6 Derecognition of financial assetsTCTA derecognises a financial asset only when the contractual rights to the cash flows from the asset expire; or it transfers the financial asset and substantially all the risks and rewards of ownership of the asset to another entity. If TCTA neither transfers nor retains substantially all the risks and rewards of ownership and continues to control the transferred asset, TCTA recognises its retained interest in the asset and an associated liability for amounts it may have to pay. If TCTA retains substantially all the risks and rewards of ownership of a transferred financial asset, TCTA continues to recognise the financial asset and also recognises a collateralised borrowing for the proceeds received. A transfer occurs when the entity transfers the contractual rights to receive the cash flows of the financial asset or assumes a contractual obligation to pay cash flows to one or more recipients in terms of an arrangement that meets the requirements of IFRS 9 3.2.5.
3.3.3.7 Effective interest methodThe effective interest method is the method used to calculate the amortised cost of a financial instrument and of allocating interest income or expense over the relevant period. The effective interest rate is the rate that exactly discounts estimated future cash receipts through the expected life of the financial instrument, or, where appropriate, a shorter period, to the net carrying amount on initial recognition.
3.3.3.8 Cash and short-term depositsCash and short-term deposits in the statement of financial position comprise cash at banks and on hand. Call deposits are included in short term financial assets. For the purpose of the consolidated statement of cash flows, cash and cash equivalents consist of bank balances and cash on hand and is measured at amortised cost.
3.3 Summary of significant accounting policies (continued)

111
F O R T H E P E R I O D E N D E D 3 1 M A R C H 2 0 1 6
NOTES TO THE ANNUAL FINANCIAL STATEMENTS
INTEGRATED ANNUAL REPORT 2015-2016
3.3.4 Financial liabilitiesFinancial liabilities are classified as either financial liabilities ‘at fair value through profit or loss (FVTPL)’ or ‘other financial liabilities’ at amortised cost.
3.3.4.1 Financial liabilities at FVTPLA financial liability may be designated as at FVTPL upon initial recognition if:• such designation eliminates or significantly reduces a measurement or recognition inconsistency that would
otherwise arise; or• the financial liability forms part of a group of financial assets or financial liabilities or both, which is managed
and its performance is evaluated on a fair value basis, in accordance with TCTA’s documented risk management or investment strategy, and information about the financial liability is provided internally on that basis; or
• it forms part of a contract containing one or more embedded derivatives which permits the entire combined contract (asset or liability) to be designated as at FVTPL.
Financial liabilities at FVTPL are stated at fair value, with any resultant gain or loss recognised in surplus or deficit.
3.3.4.2 Short-term financial market liabilitiesFunding portfolioThe short-term funding portfolio comprises short-term commercial paper classified as “other liabilities” and are held at amortised cost, using the effective interest method.
Strategic portfolioThe strategic portfolio is a trading portfolio established for interest rate risk management purposes.
Locally registered bonds held -for- trading purposes are carried at fair value, which is determined with reference to exchange rate quoted prices at the close of business on the reporting date. Resultant gains or losses on the subsequent measurement are included in surplus or deficit for the year in which they arise. At present, no such instruments are held by TCTA. Refer to note 5 for information relating to the management of interest rate risk.
TCTA engages in repurchase agreements in locally registered bonds, within limits, with the panel of market-makers to enhance the marketability of the bonds in issue. The repurchase agreements are recognised at transaction value and are classified as “other liabilities” at amortised cost.
3.3.4.3 Other financial liabilitiesOther financial liabilities, including borrowings, are initially measured at fair value.
Other financial liabilities are subsequently measured at amortised cost using the effective interest method, with interest expense recognised on an effective interest basis.

112
F O R T H E P E R I O D E N D E D 3 1 M A R C H 2 0 1 6
NOTES TO THE ANNUAL FINANCIAL STATEMENTS
INTEGRATED ANNUAL REPORT 2015-2016
3.3.4.4 Long-term financial market liabilitiesFunding portfolioThe funding portfolio comprises the long-term funding for the specific projects as detailed below.
• Locally registered bonds in issue are classified as “other liabilities” and are hence carried at amortised cost, applying the effective interest rate method.
• Local loans are stated at amortised cost and classified as “other liabilities”. At reporting date, foreign loans are stated at amortised cost and restated at the rates of exchange ruling at that date. Gains or losses are recognised in surplus or deficit.
• Long term commercial paper (more than twelve months to maturity), classified as “other liabilities”, is held at amortised cost, using the effective interest method.
3.3.4.5 Trade and other payablesPayables are classified as “other liabilities” and are stated at amortised cost, using the effective interest method.
3.3.4.6 Derecognition of financial liabilitiesTCTA derecognises financial liabilities when, and only when, TCTA’s obligations are discharged, cancelled or they expire.
3.3.4.7 Gains and losses on subsequent measurement of financial instrumentsGains and losses arising from a change in the fair value of financial instruments are included in surplus or deficit for the year in which they arise.
3.3.5 Fair value estimation IFRS 13 defines fair value as the price that would be received to sell an asset or paid to transfer a liability in an orderly transaction between market participants at the measurement date (i.e. an exit price). This transaction is assumed to take place either in the principal market for the asset or liability; or in the absence of a principal market, in the most advantageous market for the asset or liability. The market in which the entity would normally enter into a transaction to sell the asset or to transfer the liability is presumed to be the principal market or, in the absence of a principal market, the most advantageous market.
The fair values of the listed bonds are the closing rate of the Johannesburg Securities Exchange Limited’s bond market closing rate as at the reporting date.
The fair value of financial instruments that are not traded in an active market (for example, over-the-counter derivatives) is determined by using valuation techniques. TCTA uses a variety of methods and makes assumptions that are based on market conditions existing at each reporting date.
Quoted market prices or dealer quotes for similar instruments are used for long-term debt. Other techniques, such as estimated discounted cash flows, are used to determine fair value for the remaining financial instruments. The fair value of forward foreign exchange contracts is determined using forward exchange market rates at the reporting date.
In certain instances the carrying value of a financial instrument approximates its fair value.
3.3 Summary of significant accounting policies (continued)

113
F O R T H E P E R I O D E N D E D 3 1 M A R C H 2 0 1 6
NOTES TO THE ANNUAL FINANCIAL STATEMENTS
INTEGRATED ANNUAL REPORT 2015-2016
3.3.6 OffsettingFinancial assets and financial liabilities are offset, and the net amount reported in the statement of financial position where there is a current legally enforceable right to set off the recognised amounts and there is an intention to settle on a net basis, or to realise the asset and settle the liability simultaneously.
3.3.7 Borrowing costsBorrowing costs are expensed in the period in which they occur. Borrowing costs consist of interest and other costs that an entity incurs in connection with the borrowing of funds.
3.3.8 Employee benefits
3.3.8.1 Short term employee benefitsThe cost of all short term employee benefits is recognised during the period in which the employee renders the related services.
Leave benefitsAnnual leave is granted pro rata in accordance with the number of full calendar months worked and is subject to a cap.
3.3.8.2 Termination benefitsTermination benefits are employee benefits provided in exchange for the termination of an employee’s employment as a result of either:1. An entity’s decision to terminate an employee’s employment before the normal retirement date or;2. An employee’s decision to accept an offer of benefits in exchange for the termination of employment
3.3.9 ProvisionsProvisions are recognised when TCTA has a legal or constructive present obligation as a result of a past event and it is probable that an outflow of resources will be required to settle the obligation, and a reliable estimate can be made of the amount of the obligation.Provisions are reviewed at each reporting date and adjusted to reflect the current best estimate. If it is no longer probable that an outflow of resources will be required to settle the obligation, the provision is reversed.
Provisions are only used for those expenditures for which the provision was initially recognised.
3.3.9.1 CompensationThe provision relates to compensation payments being paid on the Lesotho Highlands Water Project (LHWP) over a fifty year period. The recipients have the option to receive compensation as a lump sum, annual payments made in cash or a set amount of maize grain. The LHDA is directly responsible for the management and payment of the underlying contracts. TCTA annually receive estimates of the future cash flows payable on these contracts.
The annual cash flows are increased by the forecast Lesotho CPI rate. These cash flows are considered managements’ best estimate of the obligation payable to the LHDA and are discounted at a market-related discount rate reflective of the appropriate time value of money.
114
F O R T H E P E R I O D E N D E D 3 1 M A R C H 2 0 1 6
NOTES TO THE ANNUAL FINANCIAL STATEMENTS
INTEGRATED ANNUAL REPORT 2015-2016
3.3.10 Liabilities of the water delivery component of the project in LesothoThe Lesotho Highlands Water project was designed to augment the water supply to South Africa and to generate hydro-electrical power for Lesotho. In terms of the provisions of the Treaty between the Government of the Republic of South Africa (RSA) and the Government of the Kingdom of Lesotho (GOL), the RSA is responsible for all costs relating to the water transfer component of the project and the GOL is responsible for the total cost of the components relating to the generation of hydro-electrical power. The initial arrangements included that the Lesotho Highlands Development Authority (LHDA) will raise the funding for the construction of that part of the project situated in Lesotho. In terms of Article 10(1) of the Treaty, TCTA (on behalf of RSA) is responsible for all costs incurred relating to the water delivery component of the project. This include borrowings and the related finance costs incurred by the LHDA with respect to the water delivery component of the project (refer to note 7.1.2). As a result, TCTA is responsible for making payments to the LHDA and its lenders on behalf of the RSA in respect of such obligations.
3.3.11 Construction contractsTCTA construction contracts relate to infrastructure projects which TCTA is directed to implement by the Minister of Water and Sanitation from time to time. These infrastructure projects are accounted for in terms of IAS 11: Construction Contracts and deal with the construction of a single asset such as a dam or pipeline, and in some instances a number of assets which are closely interrelated or interdependent in terms of their design, technology and function or ultimate purpose or use. TCTA applies IAS 11: Construction Contracts separately for each construction contract as required in the directive from the Minister of Water and Sanitation.
When the outcome of a construction contract can be estimated reliably, TCTA recognises contract revenue and contract costs associated with the construction contract as revenue and expenses respectively by reference to the stage of completion of the contract activity at the end of the reporting period.
3.3.11.1 Contract costsContract costs comprise:a) costs that relate directly to the specific contract;b) costs that are attributable to contract activity in general and can be allocated to the contract; andc) such other costs as are specifically chargeable to the customer under the terms of the contract.
Costs that are included as part of contract activity in general can be allocated to specific projects and includea) insurance;b) costs of design and technical assistance that are not directly related to a specific project; andc) construction overheads.Such costs are allocated using appropriate methods that best reflect project utilisation and are applied consistently to all costs having similar characteristics. This allocation is based on all costs being absorbed by the projects, in a ratio that reflects a normal level of construction activity in each project.
Costs that are specifically chargeable to DWS under the terms of each project contract are included in the construction costs. These costs may include general administrative costs during construction and development costs for which reimbursement is specified in terms of the Implementation Agreement or any other relevant contract relating to a project.
3.3 Summary of significant accounting policies (continued)

115
F O R T H E P E R I O D E N D E D 3 1 M A R C H 2 0 1 6
NOTES TO THE ANNUAL FINANCIAL STATEMENTS
INTEGRATED ANNUAL REPORT 2015-2016
3.3.11.2 Contract revenueContract revenue comprises:a) the initial amount of revenue agreed in the contract; andb) variations in contract work, and claims:(i) to the extent that is probable that they will result in revenue; and(ii) they are capable of being reliably measured.
Contract revenue is measured at the fair value of the consideration received or receivable. Contract Revenue for all project implementation performed on behalf of DWS as directed by the Minister of Water and Sanitation will always reflect the extent to which DWS underwrites expenditure and commitments in terms of the directive.
The stage of completion is determined by the proportion that contract costs incurred for work performed to date bear to the estimated total contract cost.
3.3.12 RoyaltiesRoyalties, as defined in the Treaty, are paid to the Government of Lesotho for the benefit of receiving South Africa’s share of the yield from the Orange River through the Lesotho Highlands Water Project, a gravity scheme, rather than through the least cost Orange-Vaal Transfer Scheme (OVTS), a pumping scheme wholly located within South Africa.
In terms of Article 12, Paragraph (10) of The Treaty between Governments of the Republic of South Africa and the Kingdom of Lesotho, royalties comprise of a fixed and a variable component.
The fixed component relating to the investment element of the net benefit of LHWP compared to the OVTS and adjusted on a monthly basis in accordance with the Production Price Index (PPI) published in the Republic of South Africa. The compensation will be for fifty years and commenced from January 1995.
The variable component is based on the volume of water delivered to South Africa and is made up of the net benefit on being able to gravitate from LHWP rather than pumping from OVTS. It comprises of:1) The difference in electricity costs. This component is adjusted on a monthly basis in accordance with
the Producer Price Index. (PPI) and corrected on a yearly basis when the Eskom selling price of electricity becomes available (usually in October of every year), and
2) The difference in operation and maintenance costs, which is also adjusted on a monthly basis in accordance with the PPI.
Royalties are recognised in surplus or deficit in the period it is incurred.
3.3.13 Interest incomeInterest income comprises interest receivable on loans, advances, trade receivables and income from financial market investments. Interest is only recognised where it is probable that the economic benefits associated with the transaction will flow to TCTA. The total interest income (calculated using the effective interest method) for financial assets that are measured at amortised cost are recognised in surplus or deficit.
3.3.14 LeasingLeases are classified as finance leases whenever the terms of the lease transfer substantially all the risks and rewards of ownership to the lessee. All other leases are classified as operating leases.

116
F O R T H E P E R I O D E N D E D 3 1 M A R C H 2 0 1 6
NOTES TO THE ANNUAL FINANCIAL STATEMENTS
INTEGRATED ANNUAL REPORT 2015-2016
3.3.14.1 Finance leasesAssets held under finance leases are recognised at inception of the lease at the lower of the fair value of the leased assets at commencement of the lease or the present value of the minimum lease payments. A corresponding finance lease obligation is included in the statement of financial position. Lease payments consists of finance costs and the repayment of the lease obligation in such a manner as to achieve a constant rate of interest on the remaining balance of the liability. Finance costs are directly recognised in surplus or deficit.
3.3.14.2 Operating leasesLeases of assets to TCTA under which all the risks and benefits of ownership are effectively retained by the lessor, are classified as operating leases. Payments made under operating leases are charged against surplus or deficit on a straight-line basis over the period of the lease.
3.3.15 Related party transactionsTCTA has applied the government-related entities exemption in terms of IAS 24: Related Party Disclosures, and has only disclosed significant transactions with entities controlled by the Government of South Africa in note 20.
3.3.16 Fruitless and wasteful and irregular expenditureFruitless and wasteful expenditure is defined as expenditure which was made in vain and would have been avoided had reasonable care been exercised.
Irregular expenditure means expenditure, other than unauthorised expenditure, incurred in contravention of or that is not in accordance with a requirement of any applicable legislation, including the PFMA, or any regulations made in terms of that Act.
Both fruitless and wasteful expenditure and irregular expenditure are recognised as expenditure in the aggregated statement of comprehensive income.
3.3 Summary of significant accounting policies (continued)

117
F O R T H E P E R I O D E N D E D 3 1 M A R C H 2 0 1 6
NOTES TO THE ANNUAL FINANCIAL STATEMENTS
INTEGRATED ANNUAL REPORT 2015-2016
4. SEGMENTAL INFORMATION
TCTA is required to disclose segmental information as required by IFRS 8 Operating Segments as TCTA’s debt instruments are traded in a public market. This information aims to assist in evaluating the nature and financial effects of TCTA’s business activities and the economic environments in which TCTA operates. The Standard has specific disclosure requirements about TCTA’s services, the geographical areas in which it operates, and major customers.
4.1 Operating segments
Each segment is identified in terms of separate directives received from the Minister of Water and Sanitation. Each of these segments (projects) meets the criteria as an identifiable component of TCTA’s business as(a) it may earn revenues and incur expenses; (b) each segment’s operating results are regularly reviewed by the entity’s Chief Operating Decision Maker
(CODM) to determine the allocation of resources and assess its performance, and (c) discrete financial information for it is available. The function of CODM is fulfilled by the Chief Executive
Officer and EXCO members who review the financial results of TCTA on a monthly basis. Presently the operating segments of TCTA are aligned to the project orientated model of the organisation.
4.2 Identification of operating segments
An important criterion for identifying operating segments is that the operating results are regularly reviewed by the entity’s CODM to make decisions about resources to be allocated to the segment and assess its performance. TCTA considers monthly reporting to be ‘regularly’. TCTA provides various services to its customers such as liability management, treasury management services as well as project implementation. TCTA is required to report and account separately for each project and reports to the CODM (on a monthly basis), government (as determined by legislation) as well as external stakeholders (as determined in individual agreements) on the performance and financial position of each project as directed by the Minister of Water and Sanitation.
The mandate and directives are funded by government or TCTA arranges commercial funding and manages the debt repayment. In the second instance, TCTA receives revenue streams for the repayment of the liabilities incurred.
In terms of IFRS two or more operating segments may be aggregated into a single operating segment if aggregation is consistent with the core principle of the standard, have similar economic characteristics, and if the segments are similar in certain aspects. TCTA does not aggregate segments together as is defined in this IFRS for reporting purposes. The aggregated financial statements are merely a sum total of TCTA’s assets, liabilities, income and expenses. TCTA therefore includes a full statement of position and statement of comprehensive income in Note 4.4 below as well as the segmental cash flows as an annexure to these financial statements to fulfil its obligation of separate reporting.
118
F O R T H E P E R I O D E N D E D 3 1 M A R C H 2 0 1 6
NOTES TO THE ANNUAL FINANCIAL STATEMENTS
INTEGRATED ANNUAL REPORT 2015-2016
4.3 Entity-wide disclosures
TCTA’s total revenues are from the Government of South Africa as either direct transfers from the fiscus or from tariffs received by the Government over the debt repayment period. The table below gives a description of each segment:
ACRONYM DESCRIPTION OF THE SEGMENT CURRENT WORK VRS Vaal River System
The Income Agreement, signed in 2001 between DWS and TCTA, established the principle of using water use charges on the Vaal River System (VRS) to enable TCTA to meet its financial obligations incurred when carrying out a directive of the Minister, where no alternative source of income was provided (transfers or separate income streams). TCTA, separately accounts for the expenses incurred on each project, in accordance with the Notice of Establishment, and recovers these costs through the water use charges on the VRS.
For the current financial year, disclosure relating to AMD has been amalgamated with LHWP and hence is included as part of the VRS project. This is a result of the Minister having approved a tariff for cost recovery which includes both the LHWP 1&2 as well as AMD.
The VRS projects comprises LHWP 1&2 and AMD, which is aimed at ensuring sufficient water resource availability while ensuring affordability to the end user. The impact of introducing VRS is that a single pool of funding will be utilised for all costs associated with the system and this debt will be repaid using the tariff computed on an annual basis by TCTA during the debt repayment period.

119
F O R T H E P E R I O D E N D E D 3 1 M A R C H 2 0 1 6
NOTES TO THE ANNUAL FINANCIAL STATEMENTS
INTEGRATED ANNUAL REPORT 2015-2016
ACRONYM DESCRIPTION OF THE SEGMENT CURRENT WORKLHWP Lesotho Highlands Water Project
Phase I comprised the water transfer component in Lesotho (Katse and Mohale Dams and the transfer tunnel) and the delivery tunnel in South Africa from the Caledon River to the Ash River outfall north of Clarens.
Management of debt
Phase II comprises Polihali Dam in Lesotho and a water conveyance tunnel connecting Polihali Reservoir with Katse Reservoir. 1. Phase 1 Delivery Tunnel North. Operations and maintenance2. To fulfil the RSA financial obligations in terms of or resulting from the Treaty.
Royalty paymentsFunding of:- the operation and maintenance of
the water transfer component in Lesotho undertaken by LHDA,
- funding of Phase II and - funding of Lesotho Highlands
Water Commission (LHWC) costsAdvisory servicesAdvice to institutions on various matters pertaining to the construction of infrastructure and the viability of the water sector.
Advisory services to two institutions
AMD Acid Mine DrainageThe installation of pumps to extract water from the Western, Central and Eastern Basins in the Witwatersrand gold fields, neutralisation and removal of heavy metals before discharge into the river system.
Implementation, funding andoperation & maintenance
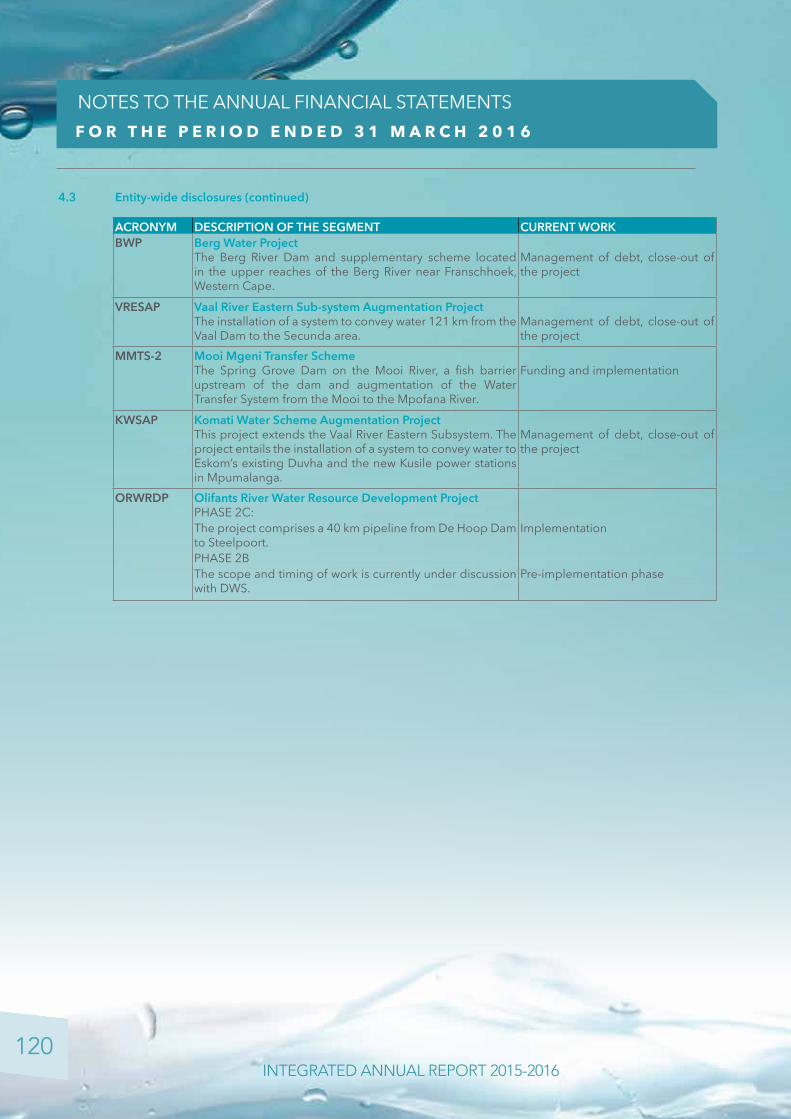
120
F O R T H E P E R I O D E N D E D 3 1 M A R C H 2 0 1 6
NOTES TO THE ANNUAL FINANCIAL STATEMENTS
INTEGRATED ANNUAL REPORT 2015-2016
ACRONYM DESCRIPTION OF THE SEGMENT CURRENT WORKBWP Berg Water Project
The Berg River Dam and supplementary scheme located in the upper reaches of the Berg River near Franschhoek, Western Cape.
Management of debt, close-out of the project
VRESAP Vaal River Eastern Sub-system Augmentation ProjectThe installation of a system to convey water 121 km from the Vaal Dam to the Secunda area.
Management of debt, close-out of the project
MMTS-2 Mooi Mgeni Transfer Scheme The Spring Grove Dam on the Mooi River, a fish barrier upstream of the dam and augmentation of the Water Transfer System from the Mooi to the Mpofana River.
Funding and implementation
KWSAP Komati Water Scheme Augmentation Project This project extends the Vaal River Eastern Subsystem. The project entails the installation of a system to convey water to Eskom’s existing Duvha and the new Kusile power stations in Mpumalanga.
Management of debt, close-out of the project
ORWRDP Olifants River Water Resource Development ProjectPHASE 2C:The project comprises a 40 km pipeline from De Hoop Dam to Steelpoort.
Implementation
PHASE 2BThe scope and timing of work is currently under discussion with DWS.
Pre-implementation phase
4.3 Entity-wide disclosures (continued)

121
F O R T H E P E R I O D E N D E D 3 1 M A R C H 2 0 1 6
NOTES TO THE ANNUAL FINANCIAL STATEMENTS
INTEGRATED ANNUAL REPORT 2015-2016
ACRONYM DESCRIPTION OF THE SEGMENT CURRENT WORKMCWAP Mokolo - Crocodile Water Augmentation Project
Phase 1The project will deliver an additional 30 million m3 water per year from the Mokolo Dam to the Lephalale area.
Management of debt, close-out of the project
Phase 2AComprises an abstraction weir, pump stations and a 160 km pipe line to transfer water from the Crocodile River to the Lephalale area.
Pre-implementation phase
MMTS-1 Mooi Mgeni Transfer Scheme (Phase I) This project comprises the refurbishment of the existing transfer scheme from Mearns Weir into the Mgeni system.
Implementation
Umgeni UmgeniThe MMTS-2 directive was amended on 20 March 2014 to include the construction of a potable water pipeline for Umgeni Water as part of the water transfer project.
Implementation
Mzimvubu Water Project (1) Support to DWS in planning and implementation of the project.
Advisory
Offtake to the town of Kriel A 3 km pipeline from the KWSAP to Kriel Water treatment works and the upgrading of the works.
Implementation
BOREHOLE Metsi Bophelo Borehole Water Supply Project The BOREHOLE projected has been winded down and there are no balances for the project in the current year.
Close-out of the project
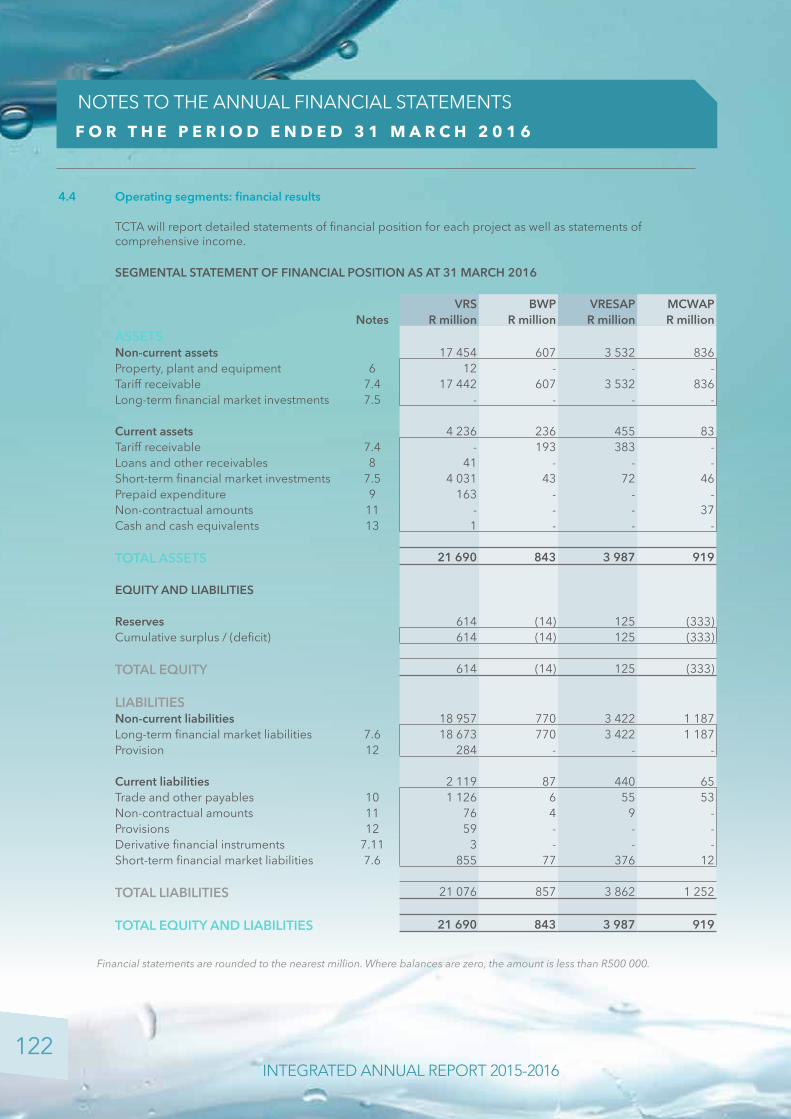
122
F O R T H E P E R I O D E N D E D 3 1 M A R C H 2 0 1 6
NOTES TO THE ANNUAL FINANCIAL STATEMENTS
INTEGRATED ANNUAL REPORT 2015-2016
4.4 Operating segments: financial results
TCTA will report detailed statements of financial position for each project as well as statements of comprehensive income.
SEGMENTAL STATEMENT OF FINANCIAL POSITION AS AT 31 MARCH 2016
VRS BWP VRESAP MCWAP MMTS-2 ORWRDP KWSAP BOREHOLE MMTS-1 UMGENI KRIEL TotalNotes R million R million R million R million R million R million R million R million R million R million R million R million
ASSETSNon-current assets 17 454 607 3 532 836 1 467 - 1 045 - - - - 24 941 Property, plant and equipment 6 12 - - - - - - - - - - 12 Tariff receivable 7.4 17 442 607 3 532 836 1 467 - 1 045 - - - - 24 929 Long-term financial market investments 7.5 - - - - - - - - - - - -
Current assets 4 236 236 455 83 450 81 192 - - 8 18 5 759 Tariff receivable 7.4 - 193 383 - 72 - 103 - - - - 751 Loans and other receivables 8 41 - - - - 19 - - - 8 18 86 Short-term financial market investments 7.5 4 031 43 72 46 372 52 89 - - - - 4 705 Prepaid expenditure 9 163 - - - 2 10 - - - - - 175 Non-contractual amounts 11 - - - 37 4 - - - - - - 41 Cash and cash equivalents 13 1 - - - - - - - - - - 1
TOTAL ASSETS 21 690 843 3 987 919 1 917 81 1 237 - - 8 18 30 700
EQUITY AND LIABILITIES
Reserves 614 (14) 125 (333) 6 - (40) - - 4 - 362 Cumulative surplus / (deficit) 614 (14) 125 (333) 6 - (40) - - 4 - 362
TOTAL EQUITY 614 (14) 125 (333) 6 - (40) - - 4 - 362
LIABILITIESNon-current liabilities 18 957 770 3 422 1 187 1 627 - 1 229 - - - - 27 192 Long-term financial market liabilities 7.6 18 673 770 3 422 1 187 1 627 - 1 229 - - - - 26 908 Provision 12 284 - - - - - - - - - - 284
Current liabilities 2 119 87 440 65 284 81 48 - - 4 18 3 146 Trade and other payables 10 1 126 6 55 53 95 72 22 - - 4 18 1 451 Non-contractual amounts 11 76 4 9 - - 9 3 - - - - 101 Provisions 12 59 - - - - - - - - - - 59 Derivative financial instruments 7.11 3 - - - - - - - - - - 3 Short-term financial market liabilities 7.6 855 77 376 12 189 - 23 - - - - 1 532
TOTAL LIABILITIES 21 076 857 3 862 1 252 1 911 81 1 277 - - 4 18 30 338
TOTAL EQUITY AND LIABILITIES 21 690 843 3 987 919 1 917 81 1 237 - - 8 18 30 700 -
Financial statements are rounded to the nearest million. Where balances are zero, the amount is less than R500 000.
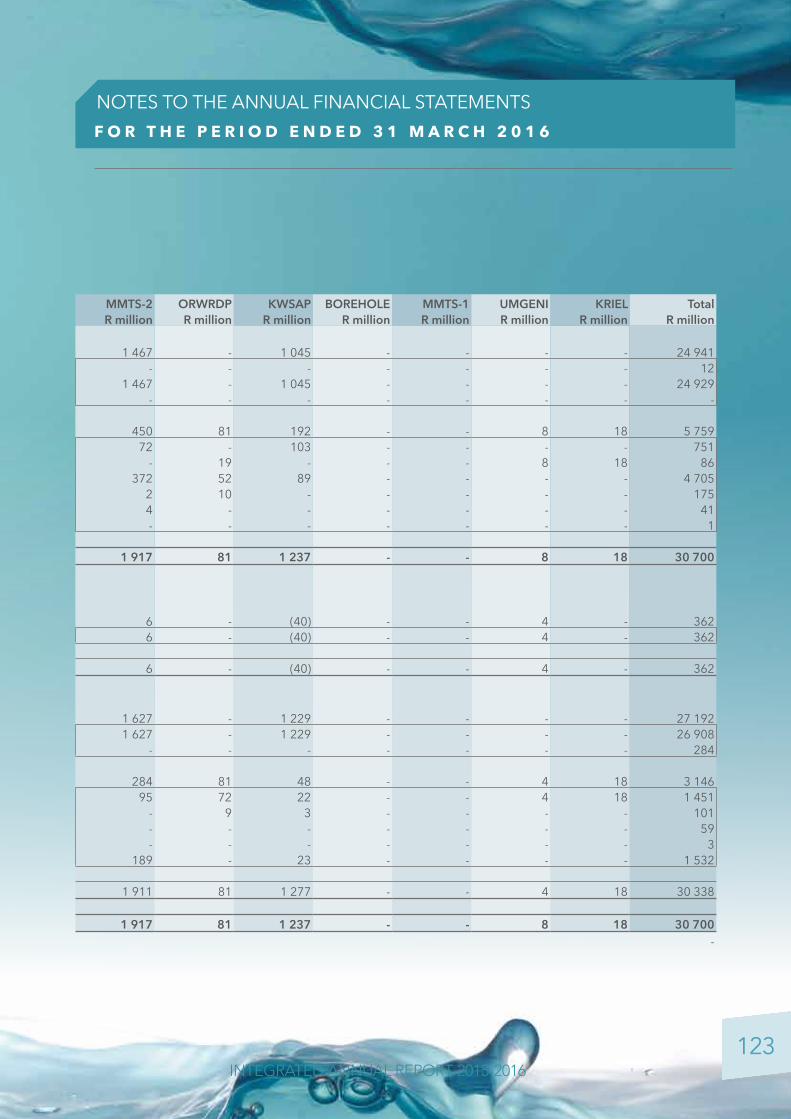
123
F O R T H E P E R I O D E N D E D 3 1 M A R C H 2 0 1 6
NOTES TO THE ANNUAL FINANCIAL STATEMENTS
INTEGRATED ANNUAL REPORT 2015-2016
4.4 Operating segments: financial results
TCTA will report detailed statements of financial position for each project as well as statements of comprehensive income.
SEGMENTAL STATEMENT OF FINANCIAL POSITION AS AT 31 MARCH 2016
VRS BWP VRESAP MCWAP MMTS-2 ORWRDP KWSAP BOREHOLE MMTS-1 UMGENI KRIEL TotalNotes R million R million R million R million R million R million R million R million R million R million R million R million
ASSETSNon-current assets 17 454 607 3 532 836 1 467 - 1 045 - - - - 24 941 Property, plant and equipment 6 12 - - - - - - - - - - 12 Tariff receivable 7.4 17 442 607 3 532 836 1 467 - 1 045 - - - - 24 929 Long-term financial market investments 7.5 - - - - - - - - - - - -
Current assets 4 236 236 455 83 450 81 192 - - 8 18 5 759 Tariff receivable 7.4 - 193 383 - 72 - 103 - - - - 751 Loans and other receivables 8 41 - - - - 19 - - - 8 18 86 Short-term financial market investments 7.5 4 031 43 72 46 372 52 89 - - - - 4 705 Prepaid expenditure 9 163 - - - 2 10 - - - - - 175 Non-contractual amounts 11 - - - 37 4 - - - - - - 41 Cash and cash equivalents 13 1 - - - - - - - - - - 1
TOTAL ASSETS 21 690 843 3 987 919 1 917 81 1 237 - - 8 18 30 700
EQUITY AND LIABILITIES
Reserves 614 (14) 125 (333) 6 - (40) - - 4 - 362 Cumulative surplus / (deficit) 614 (14) 125 (333) 6 - (40) - - 4 - 362
TOTAL EQUITY 614 (14) 125 (333) 6 - (40) - - 4 - 362
LIABILITIESNon-current liabilities 18 957 770 3 422 1 187 1 627 - 1 229 - - - - 27 192 Long-term financial market liabilities 7.6 18 673 770 3 422 1 187 1 627 - 1 229 - - - - 26 908 Provision 12 284 - - - - - - - - - - 284
Current liabilities 2 119 87 440 65 284 81 48 - - 4 18 3 146 Trade and other payables 10 1 126 6 55 53 95 72 22 - - 4 18 1 451 Non-contractual amounts 11 76 4 9 - - 9 3 - - - - 101 Provisions 12 59 - - - - - - - - - - 59 Derivative financial instruments 7.11 3 - - - - - - - - - - 3 Short-term financial market liabilities 7.6 855 77 376 12 189 - 23 - - - - 1 532
TOTAL LIABILITIES 21 076 857 3 862 1 252 1 911 81 1 277 - - 4 18 30 338
TOTAL EQUITY AND LIABILITIES 21 690 843 3 987 919 1 917 81 1 237 - - 8 18 30 700 -
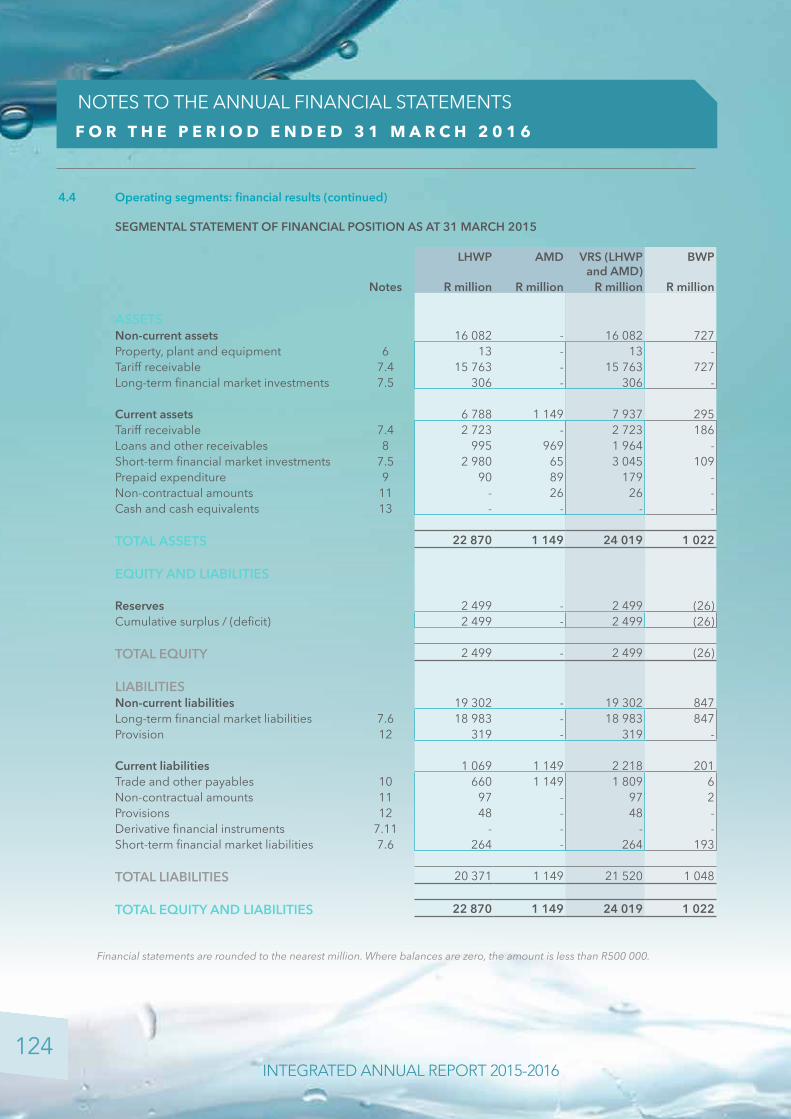
124
F O R T H E P E R I O D E N D E D 3 1 M A R C H 2 0 1 6
NOTES TO THE ANNUAL FINANCIAL STATEMENTS
INTEGRATED ANNUAL REPORT 2015-2016
SEGMENTAL STATEMENT OF FINANCIAL POSITION AS AT 31 MARCH 2015
LHWP AMD VRS (LHWP and AMD)
BWP VRESAP MCWAP MMTS-2 ORWRDP KWSAP BOREHOLE MMTS-1 UMGENI Total
Notes R million R million R million R million R million R million R million R million R million R million R million R million R million
ASSETSNon-current assets 16 082 - 16 082 727 3 546 874 1 323 - 871 - - - 23 423 Property, plant and equipment 6 13 - 13 - - - - - - - - - 13 Tariff receivable 7.4 15 763 - 15 763 727 3 546 874 1 323 - 871 - - - 23 104 Long-term financial market investments 7.5 306 - 306 - - - - - - - - - 306
Current assets 6 788 1 149 7 937 295 376 176 223 469 96 1 2 61 9 636 Tariff receivable 7.4 2 723 - 2 723 186 354 - - - 89 - - - 3 352 Loans and other receivables 8 995 969 1 964 - - - 33 260 - - 2 61 2 320 Short-term financial market investments 7.5 2 980 65 3 045 109 22 169 162 190 7 1 - - 3 705 Prepaid expenditure 9 90 89 179 - - 1 21 10 - - - - 211 Non-contractual amounts 11 - 26 26 - - 6 7 9 - - - - 48 Cash and cash equivalents 13 - - - - - - - - - - - - -
TOTAL ASSETS 22 870 1 149 24 019 1 022 3 922 1 050 1 546 469 967 1 2 61 33 059
EQUITY AND LIABILITIES
Reserves 2 499 - 2 499 (26) 65 (203) (29) - (224) 1 - 1 2 084 Cumulative surplus / (deficit) 2 499 - 2 499 (26) 65 (203) (29) - (224) 1 - 1 2 084
TOTAL EQUITY 2 499 - 2 499 (26) 65 (203) (29) - (224) 1 - 1 2 084
LIABILITIESNon-current liabilities 19 302 - 19 302 847 3 426 1 193 1 244 - 1 168 - - - 27 180 Long-term financial market liabilities 7.6 18 983 - 18 983 847 3 426 1 193 1 244 - 1 168 - - - 26 861 Provision 12 319 - 319 - - - - - - - - - 319
Current liabilities 1 069 1 149 2 218 201 431 60 331 469 23 - 2 60 3 795 Trade and other payables 10 660 1 149 1 809 6 42 52 174 469 4 - 2 60 2 618 Non-contractual amounts 11 97 - 97 2 8 - - - 2 - - - 109 Provisions 12 48 - 48 - - - - - - - - - 48 Derivative financial instruments 7.11 - - - - - - - - - - - - - Short-term financial market liabilities 7.6 264 - 264 193 381 8 157 - 17 - - - 1 020
TOTAL LIABILITIES 20 371 1 149 21 520 1 048 3 857 1 253 1 575 469 1 191 - 2 60 30 975
TOTAL EQUITY AND LIABILITIES 22 870 1 149 24 019 1 022 3 922 1 050 1 546 469 967 1 2 61 33 059
4.4 Operating segments: financial results (continued)
Financial statements are rounded to the nearest million. Where balances are zero, the amount is less than R500 000.

125
F O R T H E P E R I O D E N D E D 3 1 M A R C H 2 0 1 6
NOTES TO THE ANNUAL FINANCIAL STATEMENTS
INTEGRATED ANNUAL REPORT 2015-2016
SEGMENTAL STATEMENT OF FINANCIAL POSITION AS AT 31 MARCH 2015
LHWP AMD VRS (LHWP and AMD)
BWP VRESAP MCWAP MMTS-2 ORWRDP KWSAP BOREHOLE MMTS-1 UMGENI Total
Notes R million R million R million R million R million R million R million R million R million R million R million R million R million
ASSETSNon-current assets 16 082 - 16 082 727 3 546 874 1 323 - 871 - - - 23 423 Property, plant and equipment 6 13 - 13 - - - - - - - - - 13 Tariff receivable 7.4 15 763 - 15 763 727 3 546 874 1 323 - 871 - - - 23 104 Long-term financial market investments 7.5 306 - 306 - - - - - - - - - 306
Current assets 6 788 1 149 7 937 295 376 176 223 469 96 1 2 61 9 636 Tariff receivable 7.4 2 723 - 2 723 186 354 - - - 89 - - - 3 352 Loans and other receivables 8 995 969 1 964 - - - 33 260 - - 2 61 2 320 Short-term financial market investments 7.5 2 980 65 3 045 109 22 169 162 190 7 1 - - 3 705 Prepaid expenditure 9 90 89 179 - - 1 21 10 - - - - 211 Non-contractual amounts 11 - 26 26 - - 6 7 9 - - - - 48 Cash and cash equivalents 13 - - - - - - - - - - - - -
TOTAL ASSETS 22 870 1 149 24 019 1 022 3 922 1 050 1 546 469 967 1 2 61 33 059
EQUITY AND LIABILITIES
Reserves 2 499 - 2 499 (26) 65 (203) (29) - (224) 1 - 1 2 084 Cumulative surplus / (deficit) 2 499 - 2 499 (26) 65 (203) (29) - (224) 1 - 1 2 084
TOTAL EQUITY 2 499 - 2 499 (26) 65 (203) (29) - (224) 1 - 1 2 084
LIABILITIESNon-current liabilities 19 302 - 19 302 847 3 426 1 193 1 244 - 1 168 - - - 27 180 Long-term financial market liabilities 7.6 18 983 - 18 983 847 3 426 1 193 1 244 - 1 168 - - - 26 861 Provision 12 319 - 319 - - - - - - - - - 319
Current liabilities 1 069 1 149 2 218 201 431 60 331 469 23 - 2 60 3 795 Trade and other payables 10 660 1 149 1 809 6 42 52 174 469 4 - 2 60 2 618 Non-contractual amounts 11 97 - 97 2 8 - - - 2 - - - 109 Provisions 12 48 - 48 - - - - - - - - - 48 Derivative financial instruments 7.11 - - - - - - - - - - - - - Short-term financial market liabilities 7.6 264 - 264 193 381 8 157 - 17 - - - 1 020
TOTAL LIABILITIES 20 371 1 149 21 520 1 048 3 857 1 253 1 575 469 1 191 - 2 60 30 975
TOTAL EQUITY AND LIABILITIES 22 870 1 149 24 019 1 022 3 922 1 050 1 546 469 967 1 2 61 33 059

126
F O R T H E P E R I O D E N D E D 3 1 M A R C H 2 0 1 6
NOTES TO THE ANNUAL FINANCIAL STATEMENTS
INTEGRATED ANNUAL REPORT 2015-2016
SEGMENTAL STATEMENT OF COMPREHENSIVE INCOME FOR THE PERIOD ENDED 31 MARCH 2016
VRS BWP VRESAP MCWAP MMTS-2 ORWRDP KWSAP BOREHOLE MMTS-1 UMGENI KRIEL TotalNotes R million R million R million R million R million R million R million R million R million R million R million R million
CONSTRUCTION REVENUE 14 1 078 - 13 172 260 304 3 - 4 56 2 1 892
CONSTRUCTION COSTS 14 (1 078) - (13) (172) (260) (304) (3) - (4) (56) (2) (1 892)
OTHER INCOME 15 997 5 6 - - - 5 - - - - 1 013
EXPENSES (997) (5) (6) - - - (5) - - - - (1 013)Legal fees and litigation costs - - - - - - - - - - - -Depreciation (6) - - - - - - - - - - (6)Operating costs for the works in Lesotho (140) - - - - - - - - - - (140)Lesotho Highlands Water Commission costs 16 (9) - - - - - - - - - - (9)Staff costs (76) - - - - - - - - - - (76)Directors’ emoluments (1) - - - - - - - - - - (1)Royalties paid 18 (775) - - - - - - - - - - (775)Other operating expenses 19 10 (5) (6) - - - (5) - - - - (6)
OPERATING SURPLUS / (DEFICIT) - - - - - - - - - - - -
NET FINANCE COSTS (1 885) 12 60 (130) 35 - 184 - - 2 - (1 722)Finance income 17.1 1 392 95 425 118 188 - 300 - - 2 - 2 520 Finance costs 17.2 (3 277) (83) (365) (248) (153) - (116) - - - - (4 242)
SURPLUS / (DEFICIT) FOR THE YEAR (1 885) 12 60 (130) 35 - 184 - - 2 - (1 722)
OTHER COMPREHENSIVE INCOME - - - - - - - - - - - -
TOTAL COMPREHENSIVE SURPLUS /(DEFICIT) FOR THE YEAR
(1 885) 12 60 (130) 35 - 184 - - 2 - (1 722)
4.4 Operating segments: financial results (continued)
Financial statements are rounded to the nearest million. Where balances are zero, the amount is less than R500 000.
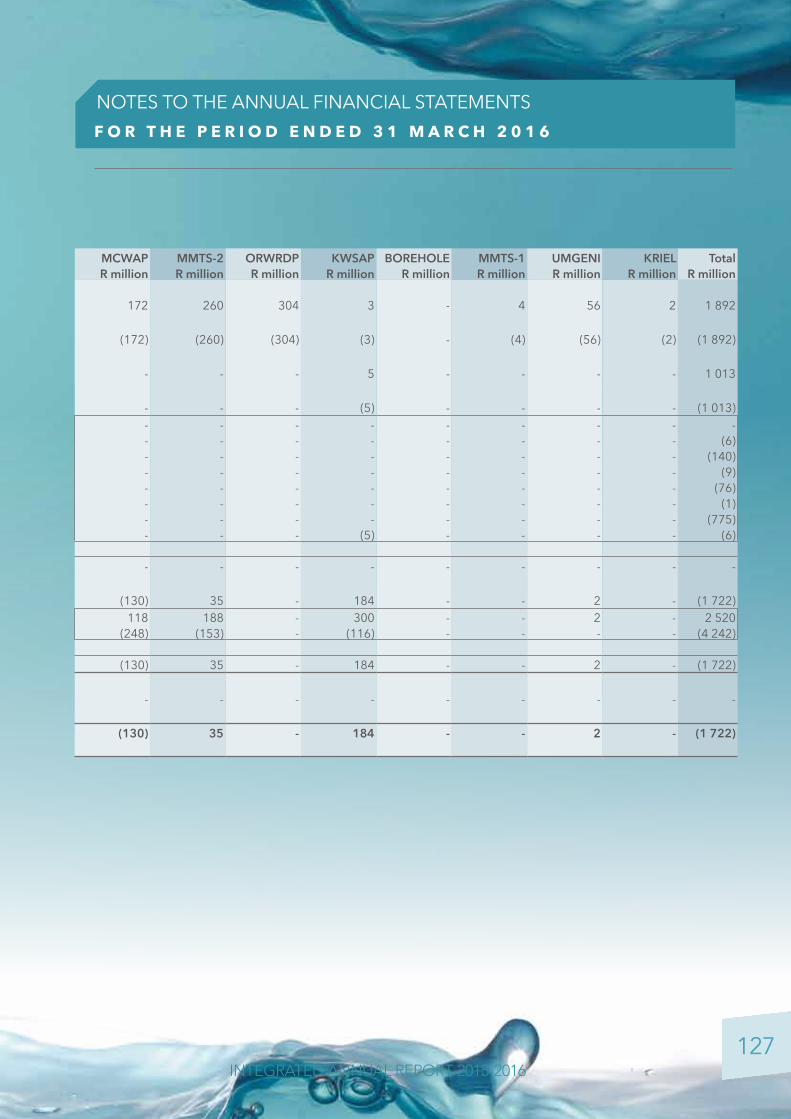
127
F O R T H E P E R I O D E N D E D 3 1 M A R C H 2 0 1 6
NOTES TO THE ANNUAL FINANCIAL STATEMENTS
INTEGRATED ANNUAL REPORT 2015-2016
SEGMENTAL STATEMENT OF COMPREHENSIVE INCOME FOR THE PERIOD ENDED 31 MARCH 2016
VRS BWP VRESAP MCWAP MMTS-2 ORWRDP KWSAP BOREHOLE MMTS-1 UMGENI KRIEL TotalNotes R million R million R million R million R million R million R million R million R million R million R million R million
CONSTRUCTION REVENUE 14 1 078 - 13 172 260 304 3 - 4 56 2 1 892
CONSTRUCTION COSTS 14 (1 078) - (13) (172) (260) (304) (3) - (4) (56) (2) (1 892)
OTHER INCOME 15 997 5 6 - - - 5 - - - - 1 013
EXPENSES (997) (5) (6) - - - (5) - - - - (1 013)Legal fees and litigation costs - - - - - - - - - - - -Depreciation (6) - - - - - - - - - - (6)Operating costs for the works in Lesotho (140) - - - - - - - - - - (140)Lesotho Highlands Water Commission costs 16 (9) - - - - - - - - - - (9)Staff costs (76) - - - - - - - - - - (76)Directors’ emoluments (1) - - - - - - - - - - (1)Royalties paid 18 (775) - - - - - - - - - - (775)Other operating expenses 19 10 (5) (6) - - - (5) - - - - (6)
OPERATING SURPLUS / (DEFICIT) - - - - - - - - - - - -
NET FINANCE COSTS (1 885) 12 60 (130) 35 - 184 - - 2 - (1 722)Finance income 17.1 1 392 95 425 118 188 - 300 - - 2 - 2 520 Finance costs 17.2 (3 277) (83) (365) (248) (153) - (116) - - - - (4 242)
SURPLUS / (DEFICIT) FOR THE YEAR (1 885) 12 60 (130) 35 - 184 - - 2 - (1 722)
OTHER COMPREHENSIVE INCOME - - - - - - - - - - - -
TOTAL COMPREHENSIVE SURPLUS /(DEFICIT) FOR THE YEAR
(1 885) 12 60 (130) 35 - 184 - - 2 - (1 722)
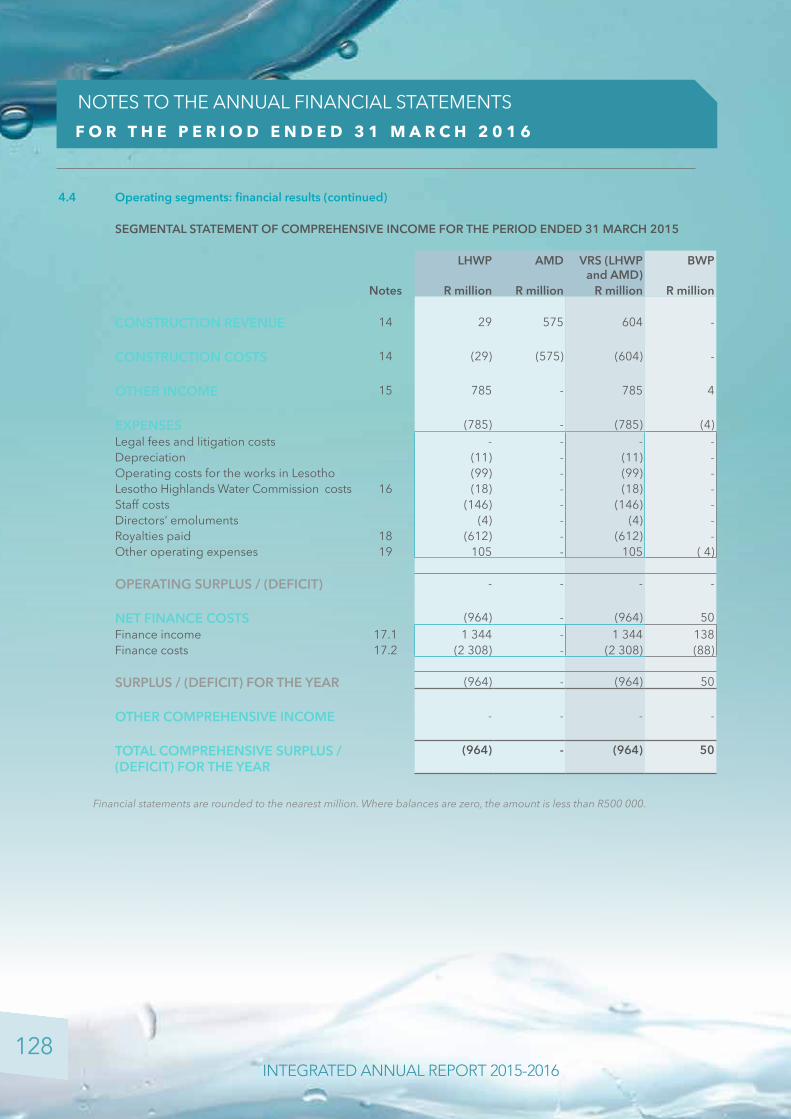
128
F O R T H E P E R I O D E N D E D 3 1 M A R C H 2 0 1 6
NOTES TO THE ANNUAL FINANCIAL STATEMENTS
INTEGRATED ANNUAL REPORT 2015-2016
SEGMENTAL STATEMENT OF COMPREHENSIVE INCOME FOR THE PERIOD ENDED 31 MARCH 2015
LHWP AMD VRS (LHWP and AMD)
BWP VRESAP MCWAP MMTS-2 ORWRDP KWSAP BOREHOLE MMTS-1 UMGENI Total
Notes R million R million R million R million R million R million R million R million R million R million R million R million R million
CONSTRUCTION REVENUE 14 29 575 604 - 2 171 411 514 8 - 31 7 1 748
CONSTRUCTION COSTS 14 (29) (575) (604) - (2) (171) (411) (514) (8) - (31) (7) (1 748)
OTHER INCOME 15 785 - 785 4 6 - - - 4 - - - 799
EXPENSES (785) - (785) (4) (6) - - - (4) - - - (799)Legal fees and litigation costs - - - - (1) - - - - - - - (1)Depreciation (11) - (11) - - - - - - - - - (11)Operating costs for the works in Lesotho (99) - (99) - - - - - - - - - (99)Lesotho Highlands Water Commission costs 16 (18) - (18) - - - - - - - - - (18)Staff costs (146) - (146) - - - - - - - - - (146)Directors’ emoluments (4) - (4) - - - - - - - - - (4)Royalties paid 18 (612) - (612) - - - - - - - - - (612)Other operating expenses 19 105 - 105 ( 4) (5) - - - (4) - - - 92
OPERATING SURPLUS / (DEFICIT) - - - - - - - - - - - - -
NET FINANCE COSTS (964) - (964) 50 73 140 527 - (17) - - 1 (190)Finance income 17.1 1 344 - 1 344 138 433 243 644 - 103 - - 1 2 906 Finance costs 17.2 (2 308) - (2 308) (88) (360) (103) (117) - (120) - - - (3 096)
SURPLUS / (DEFICIT) FOR THE YEAR (964) - (964) 50 73 140 527 - (17) - - 1 (190)
OTHER COMPREHENSIVE INCOME - - - - - - - - - - - - -
TOTAL COMPREHENSIVE SURPLUS / (DEFICIT) FOR THE YEAR
(964) - (964) 50 73 140 527 - (17) - - 1 (190)
4.4 Operating segments: financial results (continued)
Financial statements are rounded to the nearest million. Where balances are zero, the amount is less than R500 000.

129
F O R T H E P E R I O D E N D E D 3 1 M A R C H 2 0 1 6
NOTES TO THE ANNUAL FINANCIAL STATEMENTS
INTEGRATED ANNUAL REPORT 2015-2016
SEGMENTAL STATEMENT OF COMPREHENSIVE INCOME FOR THE PERIOD ENDED 31 MARCH 2015
LHWP AMD VRS (LHWP and AMD)
BWP VRESAP MCWAP MMTS-2 ORWRDP KWSAP BOREHOLE MMTS-1 UMGENI Total
Notes R million R million R million R million R million R million R million R million R million R million R million R million R million
CONSTRUCTION REVENUE 14 29 575 604 - 2 171 411 514 8 - 31 7 1 748
CONSTRUCTION COSTS 14 (29) (575) (604) - (2) (171) (411) (514) (8) - (31) (7) (1 748)
OTHER INCOME 15 785 - 785 4 6 - - - 4 - - - 799
EXPENSES (785) - (785) (4) (6) - - - (4) - - - (799)Legal fees and litigation costs - - - - (1) - - - - - - - (1)Depreciation (11) - (11) - - - - - - - - - (11)Operating costs for the works in Lesotho (99) - (99) - - - - - - - - - (99)Lesotho Highlands Water Commission costs 16 (18) - (18) - - - - - - - - - (18)Staff costs (146) - (146) - - - - - - - - - (146)Directors’ emoluments (4) - (4) - - - - - - - - - (4)Royalties paid 18 (612) - (612) - - - - - - - - - (612)Other operating expenses 19 105 - 105 ( 4) (5) - - - (4) - - - 92
OPERATING SURPLUS / (DEFICIT) - - - - - - - - - - - - -
NET FINANCE COSTS (964) - (964) 50 73 140 527 - (17) - - 1 (190)Finance income 17.1 1 344 - 1 344 138 433 243 644 - 103 - - 1 2 906 Finance costs 17.2 (2 308) - (2 308) (88) (360) (103) (117) - (120) - - - (3 096)
SURPLUS / (DEFICIT) FOR THE YEAR (964) - (964) 50 73 140 527 - (17) - - 1 (190)
OTHER COMPREHENSIVE INCOME - - - - - - - - - - - - -
TOTAL COMPREHENSIVE SURPLUS / (DEFICIT) FOR THE YEAR
(964) - (964) 50 73 140 527 - (17) - - 1 (190)

130
F O R T H E P E R I O D E N D E D 3 1 M A R C H 2 0 1 6
NOTES TO THE ANNUAL FINANCIAL STATEMENTS
INTEGRATED ANNUAL REPORT 2015-2016
5. FINANCIAL INSTRUMENT RISK MANAGEMENT
5.1 Capital management
TCTA manages its capital to ensure that projects will be able to continue as a going concern while optimising the debt for each project. The capital structure of TCTA consists of short-, medium and long- term debt (borrowings as detailed in Note 7.6) and equity (comprising accumulated surpluses or deficits). TCTA is not subject to any externally imposed capital requirements except for adherence to the debt ceiling as approved by DWS with concurrence from the Minister of Finance. TCTA’s Risk Committee reviews each project’s capital structure on a quarterly basis. As part of this review, the committee considers the cost of capital and the risks associated with each class of debt. TCTA’s borrowing limits per project is reviewed on an annual basis by the Minister of Water and Sanitation, with the concurrence of the Minister of Finance. The borrowing limits are based on TCTA’s borrowing requirements in order to fulfil the Republic of South Africa’s financial obligations in terms of, or resulting from, the Treaty and other directives received from the Minister. Refer to note 5.2.1. Optimal capital structure: In principle, TCTA prefers to maintain a capital structure of a minimum 70% fixed rate debt to 30% floating rate debt ratio after construction of the infrastructure. This ensures that there is less volatility on the debt curve and furthermore there is a high predictability of cash flows, thus minimising the associated interest rate risk to each project.
5.2 Financial risk management objectives
The Board has overall responsibility for the establishment and oversight of risk management within the organisation and approves all risk management policies. Risk management in TCTA is carried out through a central risk management function. The Risk Department identifies, assesses and mitigates financial risks in close co-operation with other Operational Units. The Risk Committee, comprising of at least three non-executive directors, the CFO and the CEO, assists management and the Board in this regard. It oversees how management monitors compliance to funding and risk management policies and reviews the adequacy of the risk management framework in relation to the risks that TCTA is exposed to. TCTA Treasury activities are comprised of raising financing and managing investments (e.g. liquidity and treasury investment portfolios). TCTA’s treasury management activities expose the organisation to financial risks which have implications on the organisation’s asset and liability management strategies. In line with the approved Risk Management Framework and Treasury Risk Management policy, the Risk Management Department monitors treasury risks on a daily, weekly and monthly basis, in order to ensure that controls in place are working effectively to reduce financial losses to the organisation. TCTA’s market activities expose it to market risk (including currency risk, interest rate risk, etc.) credit risk and liquidity risk (Refer notes 5.2.1-5.2.3). TCTA seeks to minimise the effects of these risks by using derivative financial instruments to hedge risk exposures where possible and appropriate within Board approved policies. The various types of financial, treasury and operational risks pertaining to each of the projects are identified, assessed, managed and monitored in a prudent manner, within a Board-approved risk tolerance framework.

131
F O R T H E P E R I O D E N D E D 3 1 M A R C H 2 0 1 6
NOTES TO THE ANNUAL FINANCIAL STATEMENTS
INTEGRATED ANNUAL REPORT 2015-2016
The liability is managed in a very prudent and conservative manner, which is further underscored by the adoption of the following portfolio approach and objectives: Asset and liability matching: TCTA strives to minimise both refinancing and repricing risks associated with maturing debt by matching the maturity dates of debt issued with free cash generated by the project. Refinancing and repricing risks are further managed by the creation of redemption portfolios. TCTA runs redemption portfolios at minimum of three years prior to maturity of a bond or bullet payment. TCTA has taken a more proactive approach to short-term cash management than in prior years. All future financing requirements are tabled for the next three months and funds are raised to match those maturities. Furthermore, in order to promote interest in the commercial paper program, funds are raised ahead of any financing requirement and invested until the specific need for funding arises. Consequently, TCTA has maintained a strong presence in the Commercial Paper Market and has been able to secure funding at competitive prices. The set guiding principles and objectives have been applied consistently over the years.
5.2.1 Liquidity riskUltimate responsibility for liquidity risk management rests with the Board, which has established an appropriate liquidity risk management framework for the management of TCTA’s short-, medium- and long-term funding and liquidity management requirements. TCTA manages liquidity risk by maintaining adequate reserves, banking facilities and reserve borrowing facilities, by continuously monitoring forecast and actual cash flows, and by matching the maturity profiles of financial assets and liabilities. The notes below set out details of additional undrawn facilities for each of the projects that TCTA has at its disposal to further reduce liquidity risk.
Liquidity risk is the risk that TCTA will encounter difficulty in meeting obligations associated with financial liabilities that are settled by delivering cash or another financial asset. It is managed through the following:• Market making via a panel of at least four banks in all water bond issues, thereby improving market liquidity,
funding rates and demand for water stock.• Conducting repurchase transactions in water stock bonds.• Ensuring sufficient banking facilities with large, reputable institutions.• Maintaining sufficient government-guaranteed facilities with a selection of domestic banks to provide a
liquidity buffer.• Effective marketing of TCTA in order to raise its profile.• Obtaining the required borrowing authority from National Treasury in a timely manner.• Detailed and regular cash flow forecasting.• Each project is supported by committed bank facilities and/or commercial paper. • Participation in the offshore loan market and maintaining sufficient facilities in the required currencies to
ensure that the projects are funded efficiently and effectively.• Availability and management of commercial paper, capital market programmes as well as long-term market
facilities.
To further manage liquidity risk, counterparty limits have been set on the basis that a single counterparty should not provide more than 40% of callable borrowings. The aim of this is to prevent a concentration of borrowings with a single counterparty.

132
F O R T H E P E R I O D E N D E D 3 1 M A R C H 2 0 1 6
NOTES TO THE ANNUAL FINANCIAL STATEMENTS
INTEGRATED ANNUAL REPORT 2015-2016
5.2.1.1 VRS / LHWPa. Financing facilitiesFunding sources and utilisation at 31 March:
2016 2015Total borrowing authority R million R millionVRS: Global limit (1) 22 900 22 200 LHWP: Global limit (1) 22 200
VRS: Utilisation (20 823) (20 677)LHWP: Utilisation (20 677)
VRS: Available 2 077 1 523 LHWP: Available 1 523
The table above includes the total utilisation of all facilities, including both local and foreign loans, against the borrowing limit.
(1) The Global limit is as set by National Treasury and governs the total limit of gross liabilities of the project. The individual limit is set internally from time to time when markets are suitable to move from one instrument to the other.
Total utilisation of capital market and commercial paper facilities The following tables reflect the bonds and commercial paper and excludes local and foreign loans as the latter do not have authorised limits.Each year the Risk Committee reviews and approves facility utilisation for the financial year.
2016 Individual limit
Issued Available CPI adjusted value (2)
Outstanding debt (3)
Approved facilities R million R million R million R million R millionTotal issued to dateCommercial Paper Programme (including Term Paper)
4 000 202 3 798 - 202
Capital Market - WS04 (1) 3 231 652 2 579 - 652 Capital Market - WS05 7 000 3 525 3 475 7 876 6 612 Capital Market - WSP1 1 000 - 1 000 - - Capital Market - WSP2 (1) 2 270 2 270 - - 2 274 Capital Market - WSP3 1 000 41 959 - 40 Capital Market - WSP4 1 000 97 903 - 94 Capital Market - WSP5 (1) 9 499 9 499 - - 9 468
16 286 12 714 7 876 19 342 RepurchasesRepurchases for the year 1 000 - 1 000 - -
(1) The borrowing limits for bonds is as approved from time to time by the Risk Committee. The borrowing limits for the bonds is governed by the total acceptable issuance limit of R21 billion.
(2) This includes the nominal at the CPI rate.(3) This includes unrealised discount/premium.
5.2 Financial risk management objectives (continued)
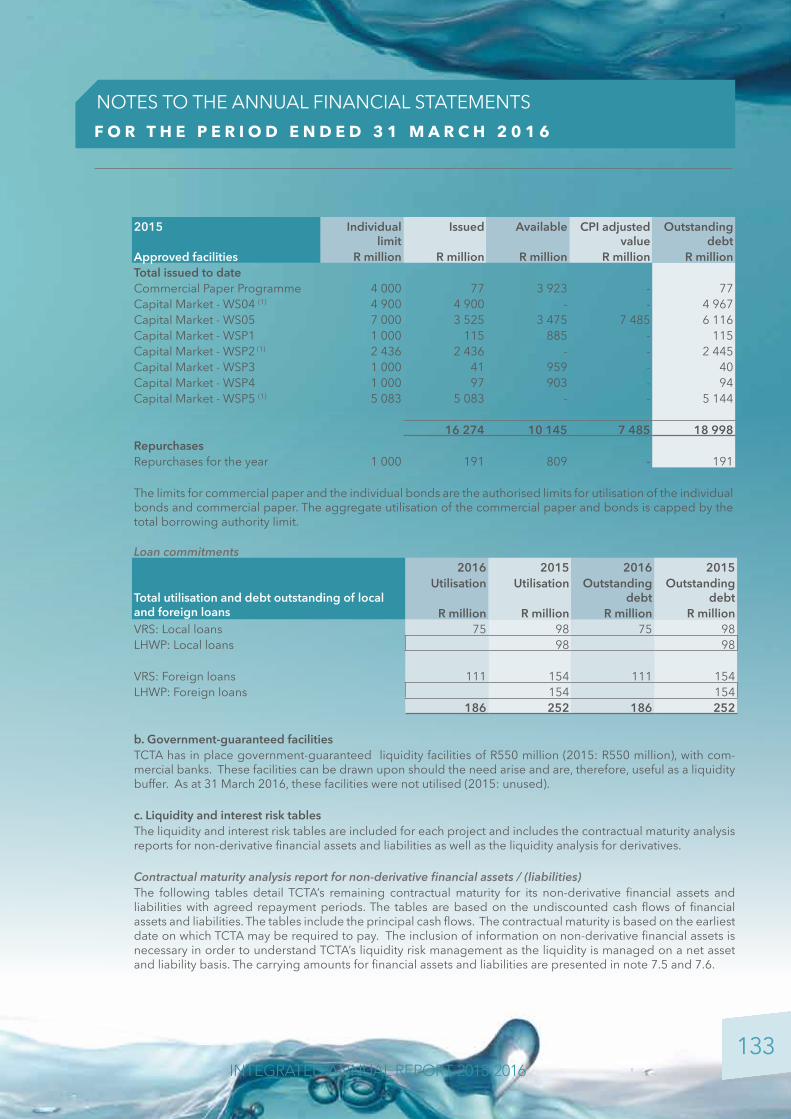
133
F O R T H E P E R I O D E N D E D 3 1 M A R C H 2 0 1 6
NOTES TO THE ANNUAL FINANCIAL STATEMENTS
INTEGRATED ANNUAL REPORT 2015-2016
2015 Individual limit
Issued Available CPI adjusted value
Outstanding debt
Approved facilities R million R million R million R million R millionTotal issued to dateCommercial Paper Programme 4 000 77 3 923 - 77 Capital Market - WS04 (1) 4 900 4 900 - - 4 967 Capital Market - WS05 7 000 3 525 3 475 7 485 6 116 Capital Market - WSP1 1 000 115 885 - 115 Capital Market - WSP2 (1) 2 436 2 436 - - 2 445 Capital Market - WSP3 1 000 41 959 - 40 Capital Market - WSP4 1 000 97 903 - 94 Capital Market - WSP5 (1) 5 083 5 083 - - 5 144
16 274 10 145 7 485 18 998 RepurchasesRepurchases for the year 1 000 191 809 - 191
The limits for commercial paper and the individual bonds are the authorised limits for utilisation of the individual bonds and commercial paper. The aggregate utilisation of the commercial paper and bonds is capped by the total borrowing authority limit.
Loan commitments2016 2015 2016 2015
Total utilisation and debt outstanding of local and foreign loans
Utilisation Utilisation Outstanding debt
Outstanding debt
R million R million R million R millionVRS: Local loans 75 98 75 98LHWP: Local loans 98 98
VRS: Foreign loans 111 154 111 154LHWP: Foreign loans 154 154
186 252 186 252
b. Government-guaranteed facilitiesTCTA has in place government-guaranteed liquidity facilities of R550 million (2015: R550 million), with com-mercial banks. These facilities can be drawn upon should the need arise and are, therefore, useful as a liquidity buffer. As at 31 March 2016, these facilities were not utilised (2015: unused).
c. Liquidity and interest risk tablesThe liquidity and interest risk tables are included for each project and includes the contractual maturity analysis reports for non-derivative financial assets and liabilities as well as the liquidity analysis for derivatives.
Contractual maturity analysis report for non-derivative financial assets / (liabilities)The following tables detail TCTA’s remaining contractual maturity for its non-derivative financial assets and liabilities with agreed repayment periods. The tables are based on the undiscounted cash flows of financial assets and liabilities. The tables include the principal cash flows. The contractual maturity is based on the earliest date on which TCTA may be required to pay. The inclusion of information on non-derivative financial assets is necessary in order to understand TCTA’s liquidity risk management as the liquidity is managed on a net asset and liability basis. The carrying amounts for financial assets and liabilities are presented in note 7.5 and 7.6.

134
F O R T H E P E R I O D E N D E D 3 1 M A R C H 2 0 1 6
NOTES TO THE ANNUAL FINANCIAL STATEMENTS
INTEGRATED ANNUAL REPORT 2015-2016
As at 31 March, VRS/LHWP had contractual maturities as summarised below:
2016 Weighted average effective
interest rate
Total un-discounted
current financial assets /
(liabilities)
Non-current financial assets / (liabilities)
Total un-discounted non-current
financial assets /
(liabilities)
Total un-discounted
financial assets /
(liabilities)
1-5 years >5 years
Non-derivative financial assets / (liabilities) % R million R million R million R million R million
Financial assetsTariff receivable 9,95% - - 69 760 69 760 69 760 Loans and receivables Not applicable 41 - - - 41 Fixed term investments 6,91% 1 295 - - - 1 295 Variable interest rate investments (1)
7,36% 2 749 - - - 2 749
Cash and cash equivalents Not applicable 1 - - - 1 Repo borrows 0,00% - - - - -
Financial asset maturities 4 086 - 69 760 69 760 73 846
Financial liabilitiesBonds 9,20% (1 805) (5 962) (9 926) (15 888) (17 693)CPI-linked bonds 11,54% (420) (9 758) - (9 758) (10 178)Commercial paper 6,87% (77) - - - (77)Term paper 8,23% (50) (75) - (75) (125)Fixed rate loans: Local 10,16% (12) (40) (9) (49) (61)Fixed rate loans: Foreign 3,00% (15) (15) - (15) (30)Variable rate loans: local (1) 7,21% (61) (60) - (60) (121)Trade and other payables (excluding interest payable)(2)
Not applicable (668) - - - (668)
Financial liabilities maturities (3 108) (15 910) (9 935) (25 845) (28 953)
Net financial asset/ (liabilities) 978 (15 910) 59 825 43 915 44 893
(1) The amounts included above for variable interest rate instruments for both non-derivative assets and liabilities is subject to change if changes in variable interest rates differ to those estimates of interest rates determined at the end of the reporting period. The variable interest rate investments are on demand.(2) Accrued interest has been included with the applicable instruments in the table.
5.2 Financial risk management objectives (continued)
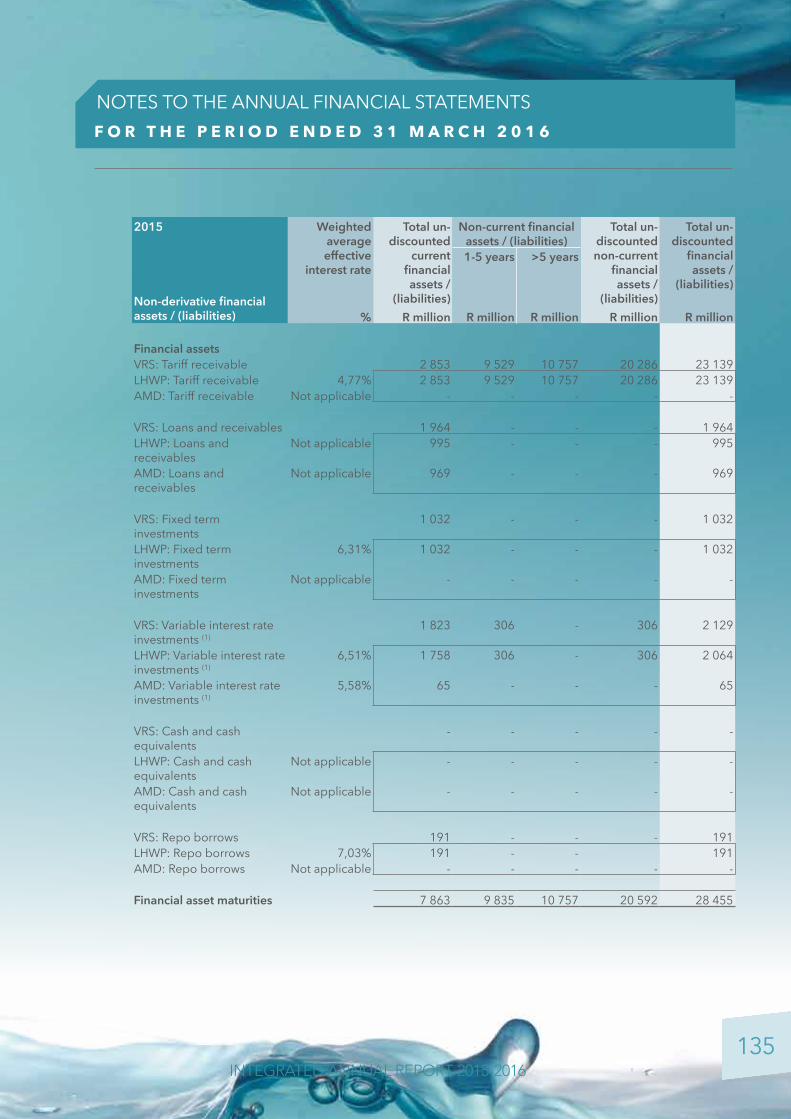
135
F O R T H E P E R I O D E N D E D 3 1 M A R C H 2 0 1 6
NOTES TO THE ANNUAL FINANCIAL STATEMENTS
INTEGRATED ANNUAL REPORT 2015-2016
2015 Weighted average effective
interest rate
Total un-discounted
current financial assets /
(liabilities)
Non-current financial assets / (liabilities)
Total un-discounted non-current
financial assets /
(liabilities)
Total un-discounted
financial assets /
(liabilities)
1-5 years >5 years
Non-derivative financial assets / (liabilities) % R million R million R million R million R million
Financial assetsVRS: Tariff receivable 2 853 9 529 10 757 20 286 23 139 LHWP: Tariff receivable 4,77% 2 853 9 529 10 757 20 286 23 139 AMD: Tariff receivable Not applicable - - - - -
VRS: Loans and receivables 1 964 - - - 1 964 LHWP: Loans and receivables
Not applicable 995 - - - 995
AMD: Loans and receivables
Not applicable 969 - - - 969
VRS: Fixed term investments
1 032 - - - 1 032
LHWP: Fixed term investments
6,31% 1 032 - - - 1 032
AMD: Fixed term investments
Not applicable - - - - -
VRS: Variable interest rate investments (1)
1 823 306 - 306 2 129
LHWP: Variable interest rate investments (1)
6,51% 1 758 306 - 306 2 064
AMD: Variable interest rate investments (1)
5,58% 65 - - - 65
VRS: Cash and cash equivalents
- - - - -
LHWP: Cash and cash equivalents
Not applicable - - - - -
AMD: Cash and cash equivalents
Not applicable - - - - -
VRS: Repo borrows 191 - - - 191 LHWP: Repo borrows 7,03% 191 - - 191 AMD: Repo borrows Not applicable - - - - -
Financial asset maturities 7 863 9 835 10 757 20 592 28 455
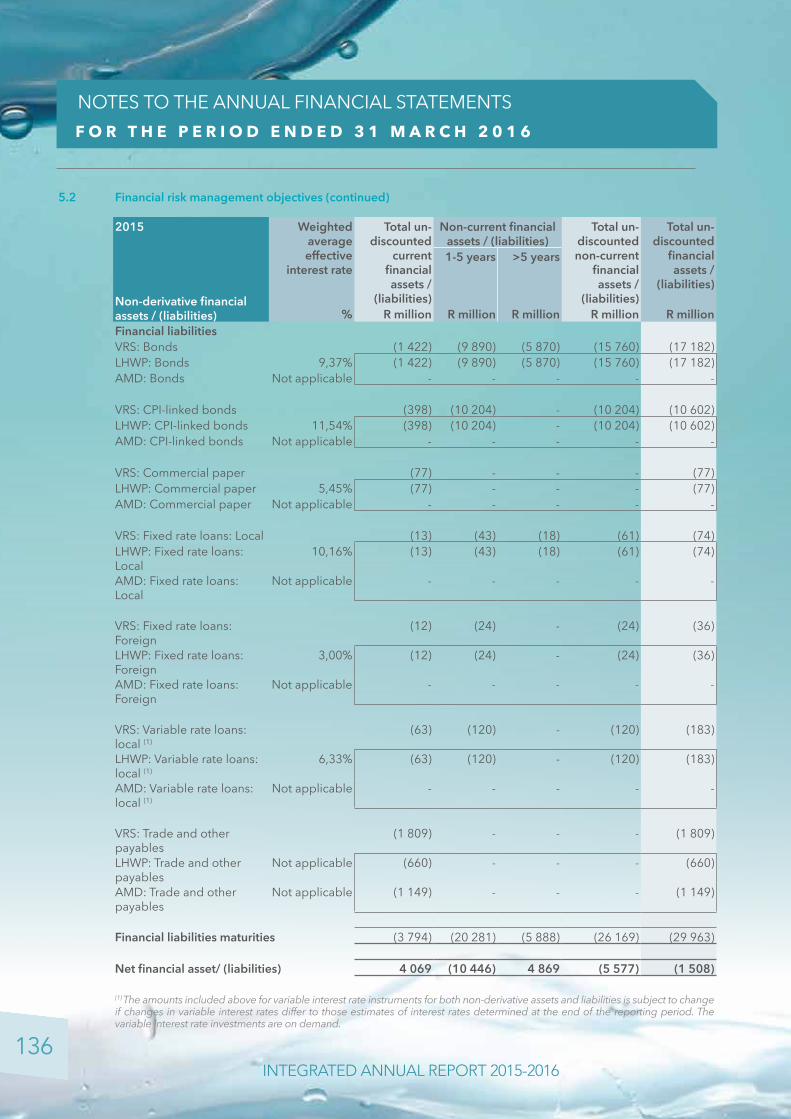
136
F O R T H E P E R I O D E N D E D 3 1 M A R C H 2 0 1 6
NOTES TO THE ANNUAL FINANCIAL STATEMENTS
INTEGRATED ANNUAL REPORT 2015-2016
2015 Weighted average effective
interest rate
Total un-discounted
current financial assets /
(liabilities)
Non-current financial assets / (liabilities)
Total un-discounted non-current
financial assets /
(liabilities)
Total un-discounted
financial assets /
(liabilities)
1-5 years >5 years
Non-derivative financial assets / (liabilities) % R million R million R million R million R millionFinancial liabilitiesVRS: Bonds (1 422) (9 890) (5 870) (15 760) (17 182)LHWP: Bonds 9,37% (1 422) (9 890) (5 870) (15 760) (17 182)AMD: Bonds Not applicable - - - - -
VRS: CPI-linked bonds (398) (10 204) - (10 204) (10 602)LHWP: CPI-linked bonds 11,54% (398) (10 204) - (10 204) (10 602)AMD: CPI-linked bonds Not applicable - - - - -
VRS: Commercial paper (77) - - - (77)LHWP: Commercial paper 5,45% (77) - - - (77)AMD: Commercial paper Not applicable - - - - -
VRS: Fixed rate loans: Local (13) (43) (18) (61) (74)LHWP: Fixed rate loans: Local
10,16% (13) (43) (18) (61) (74)
AMD: Fixed rate loans: Local
Not applicable - - - - -
VRS: Fixed rate loans: Foreign
(12) (24) - (24) (36)
LHWP: Fixed rate loans: Foreign
3,00% (12) (24) - (24) (36)
AMD: Fixed rate loans: Foreign
Not applicable - - - - -
VRS: Variable rate loans: local (1)
(63) (120) - (120) (183)
LHWP: Variable rate loans: local (1)
6,33% (63) (120) - (120) (183)
AMD: Variable rate loans: local (1)
Not applicable - - - - -
VRS: Trade and other payables
(1 809) - - - (1 809)
LHWP: Trade and other payables
Not applicable (660) - - - (660)
AMD: Trade and other payables
Not applicable (1 149) - - - (1 149)
Financial liabilities maturities (3 794) (20 281) (5 888) (26 169) (29 963)
Net financial asset/ (liabilities) 4 069 (10 446) 4 869 (5 577) (1 508)
(1) The amounts included above for variable interest rate instruments for both non-derivative assets and liabilities is subject to change if changes in variable interest rates differ to those estimates of interest rates determined at the end of the reporting period. The variable interest rate investments are on demand.
5.2 Financial risk management objectives (continued)
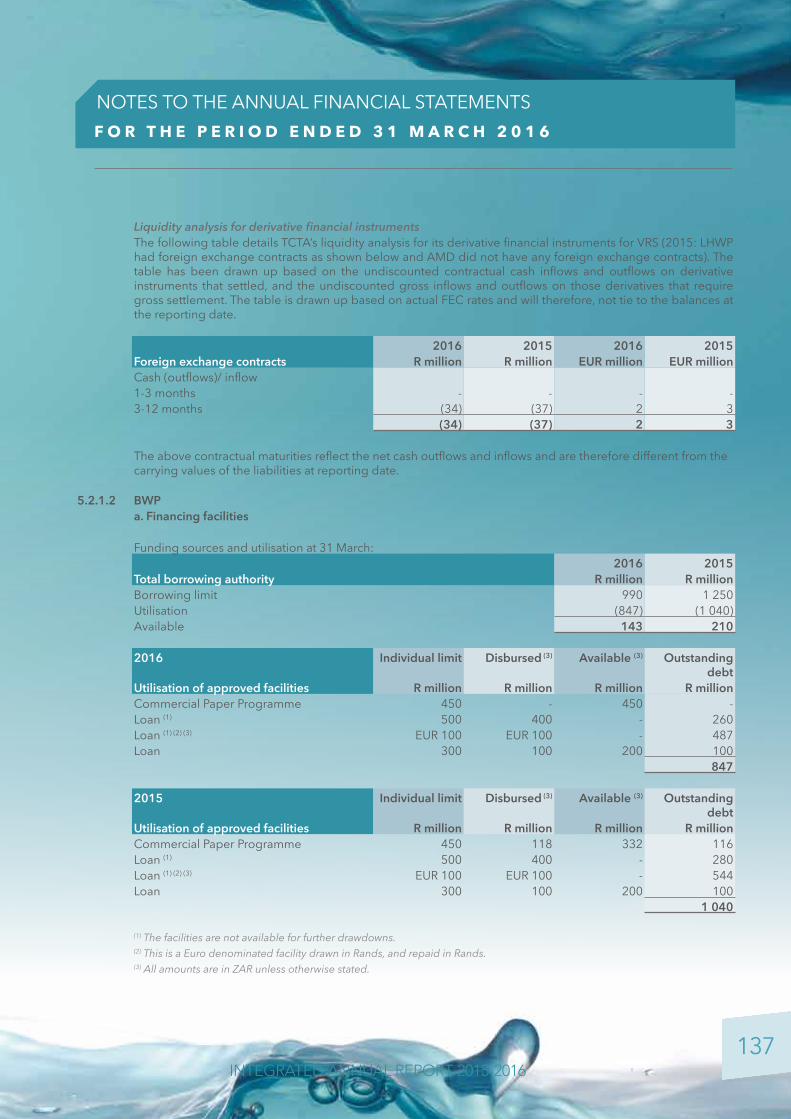
137
F O R T H E P E R I O D E N D E D 3 1 M A R C H 2 0 1 6
NOTES TO THE ANNUAL FINANCIAL STATEMENTS
INTEGRATED ANNUAL REPORT 2015-2016
Liquidity analysis for derivative financial instrumentsThe following table details TCTA’s liquidity analysis for its derivative financial instruments for VRS (2015: LHWP had foreign exchange contracts as shown below and AMD did not have any foreign exchange contracts). The table has been drawn up based on the undiscounted contractual cash inflows and outflows on derivative instruments that settled, and the undiscounted gross inflows and outflows on those derivatives that require gross settlement. The table is drawn up based on actual FEC rates and will therefore, not tie to the balances at the reporting date.
2016 2015 2016 2015Foreign exchange contracts R million R million EUR million EUR millionCash (outflows)/ inflow1-3 months - - - - 3-12 months (34) (37) 2 3
(34) (37) 2 3
The above contractual maturities reflect the net cash outflows and inflows and are therefore different from the carrying values of the liabilities at reporting date.
5.2.1.2 BWPa. Financing facilities
Funding sources and utilisation at 31 March: 2016 2015
Total borrowing authority R million R millionBorrowing limit 990 1 250 Utilisation (847) (1 040)Available 143 210
2016 Individual limit Disbursed (3) Available (3) Outstanding debt
Utilisation of approved facilities R million R million R million R millionCommercial Paper Programme 450 - 450 - Loan (1) 500 400 - 260 Loan (1) (2) (3) EUR 100 EUR 100 - 487 Loan 300 100 200 100
847
2015 Individual limit Disbursed (3) Available (3) Outstanding debt
Utilisation of approved facilities R million R million R million R millionCommercial Paper Programme 450 118 332 116 Loan (1) 500 400 - 280 Loan (1) (2) (3) EUR 100 EUR 100 - 544 Loan 300 100 200 100
1 040
(1) The facilities are not available for further drawdowns.(2) This is a Euro denominated facility drawn in Rands, and repaid in Rands.(3) All amounts are in ZAR unless otherwise stated.

138
F O R T H E P E R I O D E N D E D 3 1 M A R C H 2 0 1 6
NOTES TO THE ANNUAL FINANCIAL STATEMENTS
INTEGRATED ANNUAL REPORT 2015-2016
b. Liquidity and interest risk tablesThe liquidity and interest risk tables are included for each project and includes the contractual maturity analysis reports for non-derivative financial assets and liabilities. There is no liquidity analysis for derivatives as there were no derivative instruments in BWP.
Contractual maturity analysis report for non-derivative financial assets / (liabilities)The following tables detail BWP’s remaining contractual maturity for its non-derivative financial assets and liabilities with agreed repayment periods. The tables are based on the undiscounted cash flows of financial assets and liabilities .The tables include the principal cash flows. The contractual maturity is based on the earliest date on which TCTA may be required to pay. The inclusion of information on non-derivative financial assets is necessary in order to understand TCTA’s liquidity risk management as the liquidity is managed on a net asset and liability basis. The carrying amounts for financial assets and liabilities are presented in note 7.5 and 7.6.
As at 31 March, BWP had contractual maturities as summarised below:
2016 Weighted average effective
interest rate
Total un-discounted
current financial assets /
(liabilities)
Non-current financial assets / (liabilities)
Total un-discounted non-current
financial assets /
(liabilities)
Total un-discounted
financial assets /
(liabilities)
1-5 years >5 years
Non-derivative financial assets / (liabilities) % R million R million R million R million R million
Financial assetsTariff receivable 9,93% 212 515 511 1 026 1 238 Variable interest rate investments (1)
6,88% 43 - - - 43
Financial asset maturities 255 515 511 1 026 1 281
Financial liabilitiesCommercial paper 0,00% - - - - - Term paper 0,00% - - - - - Fixed rate loans (2) 8,31% (138) (488) (453) (941) (1 079)Variable rate loans (1) (2) 9,21% (9) (42) (186) (228) (237)Trade and other payables (excluding interest payable) (3)
Not applicable (4) - - - (4)
Financial liabilities maturities (151) (530) (639) (1 169) (1 320)
Net financial asset/ (liabilities) 104 (15) (128) (143) (39)
(1) The amounts included above for variable interest rate instruments for both non-derivative assets and liabilities is subject to change if changes in variable interest rates differ to those estimates of interest rates determined at the end of the reporting period. The variable interest rate investments are on demand.(2) Loan repayments are made periodically as per the respective agreements.(3) Accrued interest has been included with the applicable instruments in the table.
5.2 Financial risk management objectives (continued)

139
F O R T H E P E R I O D E N D E D 3 1 M A R C H 2 0 1 6
NOTES TO THE ANNUAL FINANCIAL STATEMENTS
INTEGRATED ANNUAL REPORT 2015-2016
2015 Weighted average effective
interest rate
Total un-discounted
current financial assets /
(liabilities)
Non-current financial assets / (liabilities)
Total un-discounted non-current
financial assets /
(liabilities)
Total un-discounted
financial assets /
(liabilities)
1-5 years >5 years
Non-derivative financial assets / (liabilities) % R million R million R million R million R million
Financial assetsTariff receivable 9,93% 205 676 569 1 245 1 450 Variable interest rate investments (1)
5,45% 109 - - - 109
Financial asset maturities 314 676 569 1 245 1 559
Financial liabilitiesCommercial paper 5,50% (18) - - - (18)Term paper 6,58% (100) - - - (100)Fixed rate loans (2) 8,30% (144) (512) (565) (1 077) (1 221)Variable rate loans (1) (2) 8,08% (8) (38) (194) (232) (240)Trade and other payables Not applicable (6) - - - (6)
Financial liabilities maturities (276) (550) (759) (1 309) (1 585)
Net financial asset/ (liabilities) 38 126 (190) (64) (26)
(1) The amounts included above for variable interest rate instruments for both non-derivative assets and liabilities is subject to change if changes in variable interest rates differ to those estimates of interest rates determined at the end of the reporting period. The variable interest rate investments are on demand.(2) Loan repayments are made periodically as per the respective agreements.

140
F O R T H E P E R I O D E N D E D 3 1 M A R C H 2 0 1 6
NOTES TO THE ANNUAL FINANCIAL STATEMENTS
INTEGRATED ANNUAL REPORT 2015-2016
5.2.1.3 VRESAPa. Financing facilitiesFunding sources and utilisation at 31 March :
2016 2015Total borrowing authority R million R millionBorrowing limit 4 190 4 210 Utilisation (3 799) (3 807)Available 391 403
2016 Individual limit Disbursed (2) Available (2) Outstanding debt
Utilisation of approved facilities R million R million R million R millionCommercial Paper Programme 300 210 90 210 Loan (1) (2) EUR 85 EUR 85 - 746 Loan 1 350 1 350 - 1 489 Loan 1 000 676 324 744 Loan 155 155 - 143 Loan 350 350 - 467
3 799
2015 Individual limit Disbursed (2) Available (2) Outstanding debt
Utilisation of approved facilities R million R million R million R millionCommercial Paper Programme 300 228 72 222 Loan (1) (2) EUR 85 EUR 85 - 794 Loan 1 350 1 350 - 1 547 Loan 1 000 526 474 588 Loan 155 155 - 149 Loan 350 350 - 507
3 807
(1) This is a Euro denominated facility drawn in Rands and repaid in Rands.(2) All amounts are in ZAR unless otherwise stated.
5.2 Financial risk management objectives (continued)
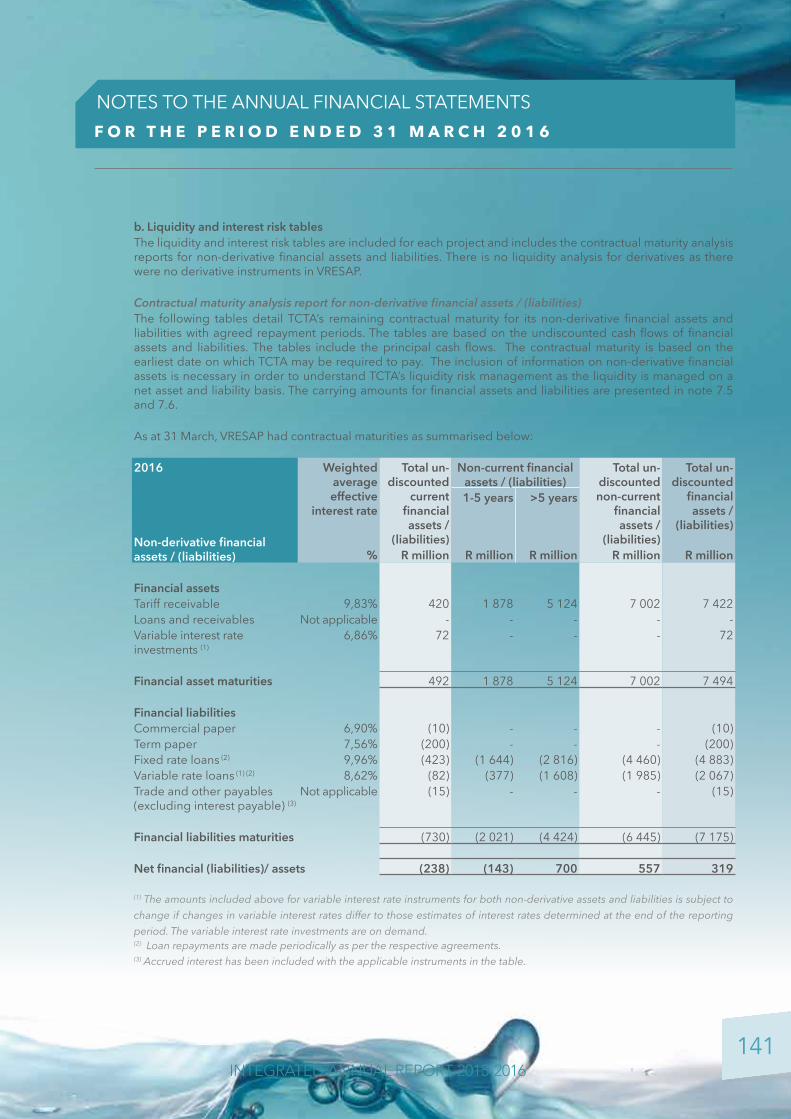
141
F O R T H E P E R I O D E N D E D 3 1 M A R C H 2 0 1 6
NOTES TO THE ANNUAL FINANCIAL STATEMENTS
INTEGRATED ANNUAL REPORT 2015-2016
b. Liquidity and interest risk tablesThe liquidity and interest risk tables are included for each project and includes the contractual maturity analysis reports for non-derivative financial assets and liabilities. There is no liquidity analysis for derivatives as there were no derivative instruments in VRESAP.
Contractual maturity analysis report for non-derivative financial assets / (liabilities)The following tables detail TCTA’s remaining contractual maturity for its non-derivative financial assets and liabilities with agreed repayment periods. The tables are based on the undiscounted cash flows of financial assets and liabilities. The tables include the principal cash flows. The contractual maturity is based on the earliest date on which TCTA may be required to pay. The inclusion of information on non-derivative financial assets is necessary in order to understand TCTA’s liquidity risk management as the liquidity is managed on a net asset and liability basis. The carrying amounts for financial assets and liabilities are presented in note 7.5 and 7.6.
As at 31 March, VRESAP had contractual maturities as summarised below:
2016 Weighted average effective
interest rate
Total un-discounted
current financial assets /
(liabilities)
Non-current financial assets / (liabilities)
Total un-discounted non-current
financial assets /
(liabilities)
Total un-discounted
financial assets /
(liabilities)
1-5 years >5 years
Non-derivative financial assets / (liabilities) % R million R million R million R million R million
Financial assetsTariff receivable 9,83% 420 1 878 5 124 7 002 7 422 Loans and receivables Not applicable - - - - - Variable interest rate investments (1)
6,86% 72 - - - 72
Financial asset maturities 492 1 878 5 124 7 002 7 494
Financial liabilitiesCommercial paper 6,90% (10) - - - (10)Term paper 7,56% (200) - - - (200)Fixed rate loans (2) 9,96% (423) (1 644) (2 816) (4 460) (4 883)Variable rate loans (1) (2) 8,62% (82) (377) (1 608) (1 985) (2 067)Trade and other payables (excluding interest payable) (3)
Not applicable (15) - - - (15)
Financial liabilities maturities (730) (2 021) (4 424) (6 445) (7 175)
Net financial (liabilities)/ assets (238) (143) 700 557 319
(1) The amounts included above for variable interest rate instruments for both non-derivative assets and liabilities is subject to change if changes in variable interest rates differ to those estimates of interest rates determined at the end of the reporting period. The variable interest rate investments are on demand.(2) Loan repayments are made periodically as per the respective agreements.(3) Accrued interest has been included with the applicable instruments in the table.
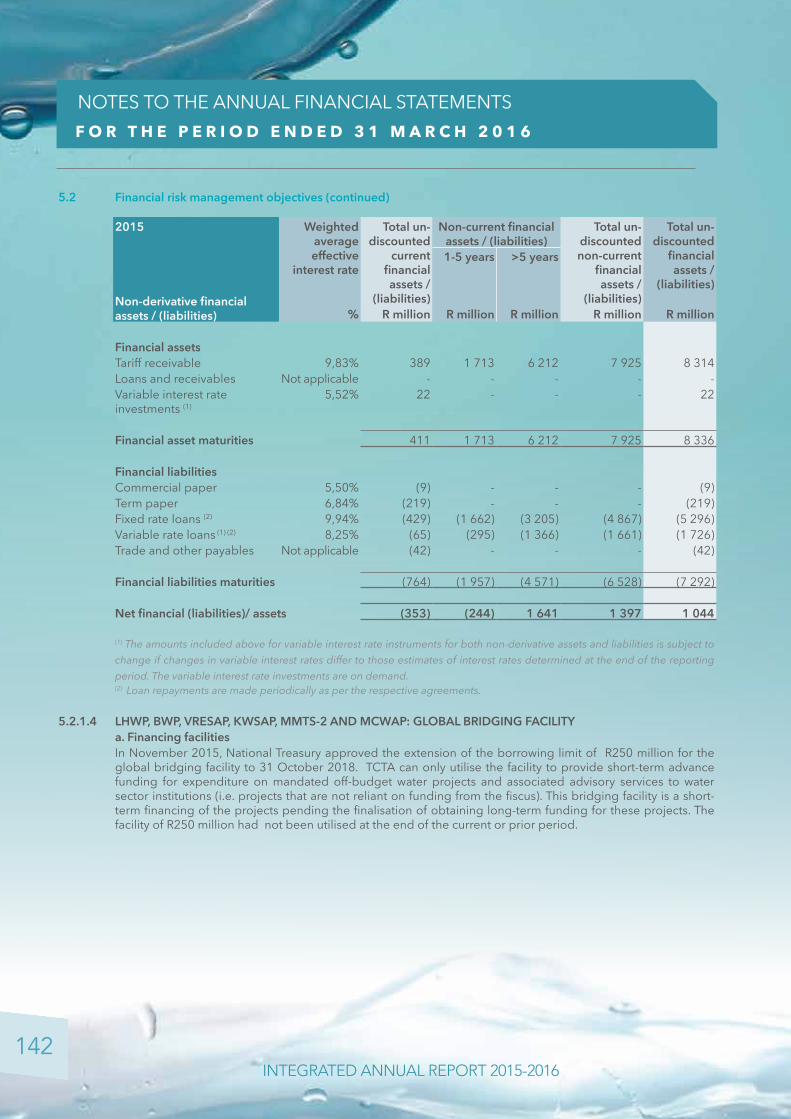
142
F O R T H E P E R I O D E N D E D 3 1 M A R C H 2 0 1 6
NOTES TO THE ANNUAL FINANCIAL STATEMENTS
INTEGRATED ANNUAL REPORT 2015-2016
2015 Weighted average effective
interest rate
Total un-discounted
current financial assets /
(liabilities)
Non-current financial assets / (liabilities)
Total un-discounted non-current
financial assets /
(liabilities)
Total un-discounted
financial assets /
(liabilities)
1-5 years >5 years
Non-derivative financial assets / (liabilities) % R million R million R million R million R million
Financial assetsTariff receivable 9,83% 389 1 713 6 212 7 925 8 314 Loans and receivables Not applicable - - - - - Variable interest rate investments (1)
5,52% 22 - - - 22
Financial asset maturities 411 1 713 6 212 7 925 8 336
Financial liabilitiesCommercial paper 5,50% (9) - - - (9)Term paper 6,84% (219) - - - (219)Fixed rate loans (2) 9,94% (429) (1 662) (3 205) (4 867) (5 296)Variable rate loans (1) (2) 8,25% (65) (295) (1 366) (1 661) (1 726)Trade and other payables Not applicable (42) - - - (42)
Financial liabilities maturities (764) (1 957) (4 571) (6 528) (7 292)
Net financial (liabilities)/ assets (353) (244) 1 641 1 397 1 044
(1) The amounts included above for variable interest rate instruments for both non-derivative assets and liabilities is subject to change if changes in variable interest rates differ to those estimates of interest rates determined at the end of the reporting period. The variable interest rate investments are on demand.(2) Loan repayments are made periodically as per the respective agreements.
5.2.1.4 LHWP, BWP, VRESAP, KWSAP, MMTS-2 AND MCWAP: GLOBAL BRIDGING FACILITYa. Financing facilitiesIn November 2015, National Treasury approved the extension of the borrowing limit of R250 million for the global bridging facility to 31 October 2018. TCTA can only utilise the facility to provide short-term advance funding for expenditure on mandated off-budget water projects and associated advisory services to water sector institutions (i.e. projects that are not reliant on funding from the fiscus). This bridging facility is a short-term financing of the projects pending the finalisation of obtaining long-term funding for these projects. The facility of R250 million had not been utilised at the end of the current or prior period.
5.2 Financial risk management objectives (continued)

143
F O R T H E P E R I O D E N D E D 3 1 M A R C H 2 0 1 6
NOTES TO THE ANNUAL FINANCIAL STATEMENTS
INTEGRATED ANNUAL REPORT 2015-2016
5.2.1.5 MCWAPa. Financing facilitiesFunding sources and utilisation at 31 March:
2016 2015Total borrowing authority R million R millionBorrowing limit 2 000 2 000 Utilisation (1 199) (1 201)Available 801 799
2016 Individual limit Disbursed Available Outstanding debt
Utilisation of approved facilities R million R million R million R millionLoan 700 381 319 381 Loan 200 - 200 - Loan 600 - 600 - Loan 700 700 - 818 Global Facility (1) 250 - 250 -
1 199
2015 Individual limit Disbursed Available Outstanding debt
Utilisation of approved facilities R million R million R million R millionLoan 700 389 311 389 Loan 200 - 200 - Loan 600 - 600 - Loan 700 700 - 812 Global Facility (1) 250 - 250 -
1 201
(1) Global facility utilised to provide short-term advance funding for expenditure on mandated off-budget water projects and associated advisory services (Refer note 5.2.1.4).

144
F O R T H E P E R I O D E N D E D 3 1 M A R C H 2 0 1 6
NOTES TO THE ANNUAL FINANCIAL STATEMENTS
INTEGRATED ANNUAL REPORT 2015-2016
b. Liquidity and interest risk tablesThe liquidity and interest risk tables are included for each project and includes the contractual maturity analysis reports for non-derivative financial assets and liabilities. There is no liquidity analysis for derivatives as there was no derivative instruments in MCWAP.
Contractual maturity analysis report for non-derivative financial assets / (liabilities)The following tables detail TCTA’s remaining contractual maturity for its non-derivative financial assets and liabilities with agreed repayment periods. The tables are based on the undiscounted cash flows of financial assets and liabilities. The tables include the principal cash flows. The contractual maturity is based on the earliest date on which TCTA may be required to pay. The inclusion of information on non-derivative financial assets is necessary in order to understand TCTA’s liquidity risk management as the liquidity is managed on a net asset and liability basis. The carrying amounts for financial assets and liabilities are presented in note 7.5 and 7.6.
As at 31 March, MCWAP had contractual maturities as summarised below:
2016 Weighted average effective
interest rate
Total un-discounted
current financial assets /
(liabilities)
Non-current financial assets / (liabilities)
Total un-discounted non-current
financial assets /
(liabilities)
Total un-discounted
financial assets /
(liabilities)
1-5 years >5 years
Non-derivative financial assets / (liabilities) % R million R million R million R million R million
Financial assetsTariff receivable 13,03% - 529 1 910 2 439 2 439 Variable interest rate investments (1)
7,19% 46 - - - 46
Financial asset maturities 46 529 1 910 2 439 2 485
Financial liabilities
Fixed rate loans (2) 9,46% (108) (464) (1 632) (2 096) (2 204)Variable rate loans (1) (2) 8,98% (17) (81) (282) (363) (380)Trade and other payables (excluding interest payable) (3)
Not applicable (40) - - - (40)
Financial liabilities maturities (165) (545) (1 914) (2 459) (2 624)
Net financial asset/ (liabilities) (119) (16) (4) (20) (139)
(1) The amounts included above for variable interest rate instruments for both non-derivative assets and liabilities is subject to change if changes in variable interest rates differ to those estimates of interest rates determined at the end of the reporting period. The variable interest rate investments are on demand.(2) Loan repayments are made periodically as per the respective agreements.(3) Accrued interest has been included with the applicable instruments in the table.
5.2 Financial risk management objectives (continued)

145
F O R T H E P E R I O D E N D E D 3 1 M A R C H 2 0 1 6
NOTES TO THE ANNUAL FINANCIAL STATEMENTS
INTEGRATED ANNUAL REPORT 2015-2016
2015 Weighted average effective
interest rate
Total un discounted
current financial assets /
(liabilities)
Non-current financial assets / (liabilities)
Total un-discounted non-current
financial assets /
(liabilities)
Total un discounted
financial assets /
(liabilities)
1-5 years >5 years
Non-derivative financial assets / (liabilities) % R million R million R million R million R million
Financial assetsTariff receivable 13,03% - 367 2 851 3 218 3 218 Variable interest rate investments (1)
5,85% 169 - - - 169
Financial asset maturities 169 367 2 851 3 218 3 387
Financial liabilities
Fixed rate loans (2) 9,46% (41) (337) (1 737) (2 074) (2 115)Variable rate loans (1) (2) 8,01% (5) (105) (701) (806) (811)Trade and other payables Not applicable (53) - - - (53)
Financial liabilities maturities (99) (442) (2 438) (2 880) (2 979)
Net financial asset/ (liabilities) 70 (75) 413 338 408
(1) The amounts included above for variable interest rate instruments for both non-derivative assets and liabilities is subject to change if changes in variable interest rates differ to those estimates of interest rates determined at the end of the reporting period. The variable interest rate investments are on demand.(2) Loan repayments are made periodically as per the respective agreements.
5.2.1.6 MMTS-2a. Financing facilitiesFunding sources and utilisation at 31 March :
2016 2015Total borrowing authority R million R millionBorrowing limit 1 832 1 590 Utilisation (1 816) (1 401)Available (4) 16 189
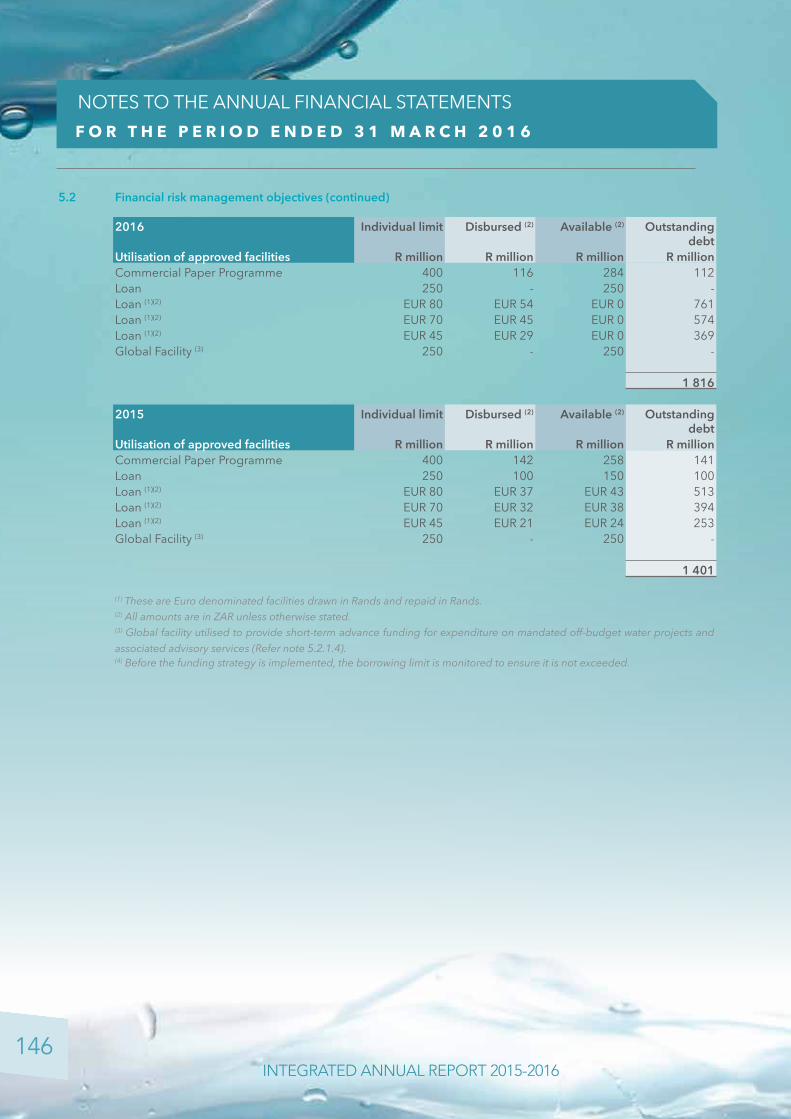
146
F O R T H E P E R I O D E N D E D 3 1 M A R C H 2 0 1 6
NOTES TO THE ANNUAL FINANCIAL STATEMENTS
INTEGRATED ANNUAL REPORT 2015-2016
2016 Individual limit Disbursed (2) Available (2) Outstanding debt
Utilisation of approved facilities R million R million R million R millionCommercial Paper Programme 400 116 284 112 Loan 250 - 250 - Loan (1)(2) EUR 80 EUR 54 EUR 0 761 Loan (1)(2) EUR 70 EUR 45 EUR 0 574 Loan (1)(2) EUR 45 EUR 29 EUR 0 369 Global Facility (3) 250 - 250 -
1 816
2015 Individual limit Disbursed (2) Available (2) Outstanding debt
Utilisation of approved facilities R million R million R million R millionCommercial Paper Programme 400 142 258 141 Loan 250 100 150 100 Loan (1)(2) EUR 80 EUR 37 EUR 43 513 Loan (1)(2) EUR 70 EUR 32 EUR 38 394 Loan (1)(2) EUR 45 EUR 21 EUR 24 253 Global Facility (3) 250 - 250 -
1 401
(1) These are Euro denominated facilities drawn in Rands and repaid in Rands.(2) All amounts are in ZAR unless otherwise stated. (3) Global facility utilised to provide short-term advance funding for expenditure on mandated off-budget water projects and associated advisory services (Refer note 5.2.1.4).(4) Before the funding strategy is implemented, the borrowing limit is monitored to ensure it is not exceeded.
5.2 Financial risk management objectives (continued)
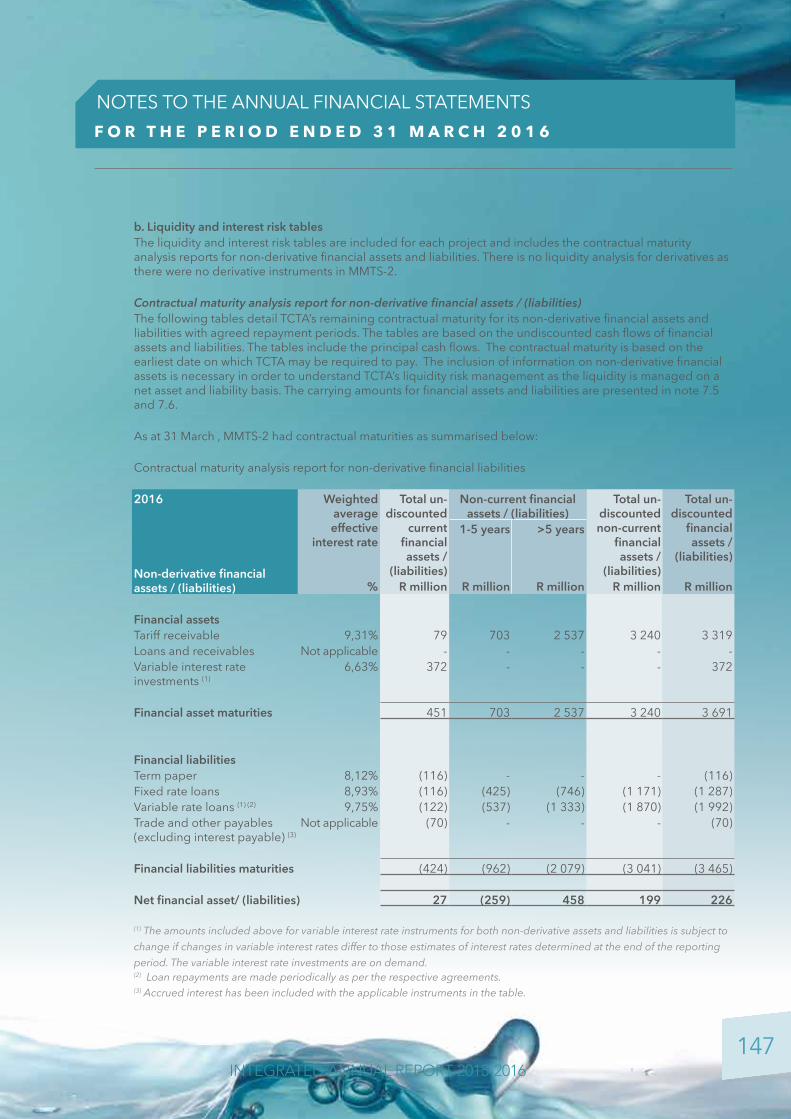
147
F O R T H E P E R I O D E N D E D 3 1 M A R C H 2 0 1 6
NOTES TO THE ANNUAL FINANCIAL STATEMENTS
INTEGRATED ANNUAL REPORT 2015-2016
b. Liquidity and interest risk tablesThe liquidity and interest risk tables are included for each project and includes the contractual maturity analysis reports for non-derivative financial assets and liabilities. There is no liquidity analysis for derivatives as there were no derivative instruments in MMTS-2.
Contractual maturity analysis report for non-derivative financial assets / (liabilities)The following tables detail TCTA’s remaining contractual maturity for its non-derivative financial assets and liabilities with agreed repayment periods. The tables are based on the undiscounted cash flows of financial assets and liabilities. The tables include the principal cash flows. The contractual maturity is based on the earliest date on which TCTA may be required to pay. The inclusion of information on non-derivative financial assets is necessary in order to understand TCTA’s liquidity risk management as the liquidity is managed on a net asset and liability basis. The carrying amounts for financial assets and liabilities are presented in note 7.5 and 7.6.
As at 31 March , MMTS-2 had contractual maturities as summarised below:
Contractual maturity analysis report for non-derivative financial liabilities
2016 Weighted average effective
interest rate
Total un-discounted
current financial assets /
(liabilities)
Non-current financial assets / (liabilities)
Total un-discounted non-current
financial assets /
(liabilities)
Total un-discounted
financial assets /
(liabilities)
1-5 years >5 years
Non-derivative financial assets / (liabilities) % R million R million R million R million R million
Financial assetsTariff receivable 9,31% 79 703 2 537 3 240 3 319 Loans and receivables Not applicable - - - - - Variable interest rate investments (1)
6,63% 372 - - - 372
Financial asset maturities 451 703 2 537 3 240 3 691
Financial liabilitiesTerm paper 8,12% (116) - - - (116)Fixed rate loans 8,93% (116) (425) (746) (1 171) (1 287)Variable rate loans (1) (2) 9,75% (122) (537) (1 333) (1 870) (1 992)Trade and other payables (excluding interest payable) (3)
Not applicable (70) - - - (70)
Financial liabilities maturities (424) (962) (2 079) (3 041) (3 465)
Net financial asset/ (liabilities) 27 (259) 458 199 226
(1) The amounts included above for variable interest rate instruments for both non-derivative assets and liabilities is subject to change if changes in variable interest rates differ to those estimates of interest rates determined at the end of the reporting period. The variable interest rate investments are on demand.(2) Loan repayments are made periodically as per the respective agreements.(3) Accrued interest has been included with the applicable instruments in the table.
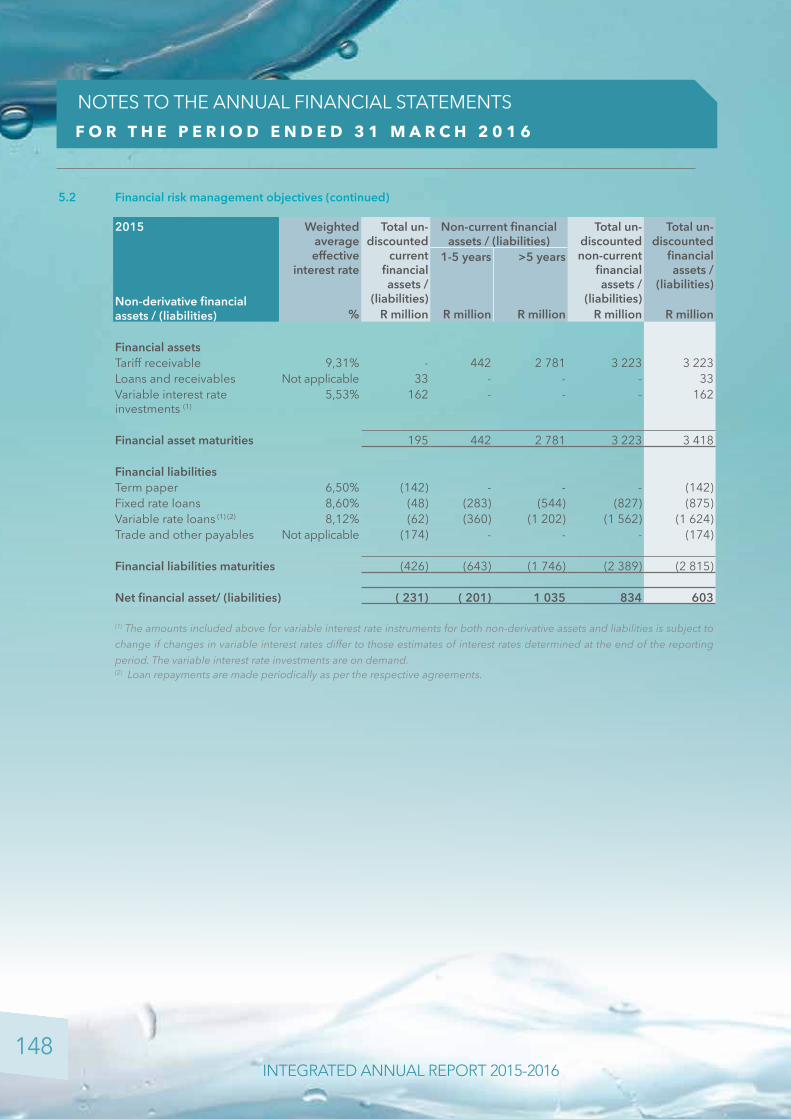
148
F O R T H E P E R I O D E N D E D 3 1 M A R C H 2 0 1 6
NOTES TO THE ANNUAL FINANCIAL STATEMENTS
INTEGRATED ANNUAL REPORT 2015-2016
2015 Weighted average effective
interest rate
Total un-discounted
current financial assets /
(liabilities)
Non-current financial assets / (liabilities)
Total un-discounted non-current
financial assets /
(liabilities)
Total un-discounted
financial assets /
(liabilities)
1-5 years >5 years
Non-derivative financial assets / (liabilities) % R million R million R million R million R million
Financial assetsTariff receivable 9,31% - 442 2 781 3 223 3 223 Loans and receivables Not applicable 33 - - - 33 Variable interest rate investments (1)
5,53% 162 - - - 162
Financial asset maturities 195 442 2 781 3 223 3 418
Financial liabilitiesTerm paper 6,50% (142) - - - (142)Fixed rate loans 8,60% (48) (283) (544) (827) (875)Variable rate loans (1) (2) 8,12% (62) (360) (1 202) (1 562) (1 624)Trade and other payables Not applicable (174) - - - (174)
Financial liabilities maturities (426) (643) (1 746) (2 389) (2 815)
Net financial asset/ (liabilities) ( 231) ( 201) 1 035 834 603
(1) The amounts included above for variable interest rate instruments for both non-derivative assets and liabilities is subject to change if changes in variable interest rates differ to those estimates of interest rates determined at the end of the reporting period. The variable interest rate investments are on demand.(2) Loan repayments are made periodically as per the respective agreements.
5.2 Financial risk management objectives (continued)
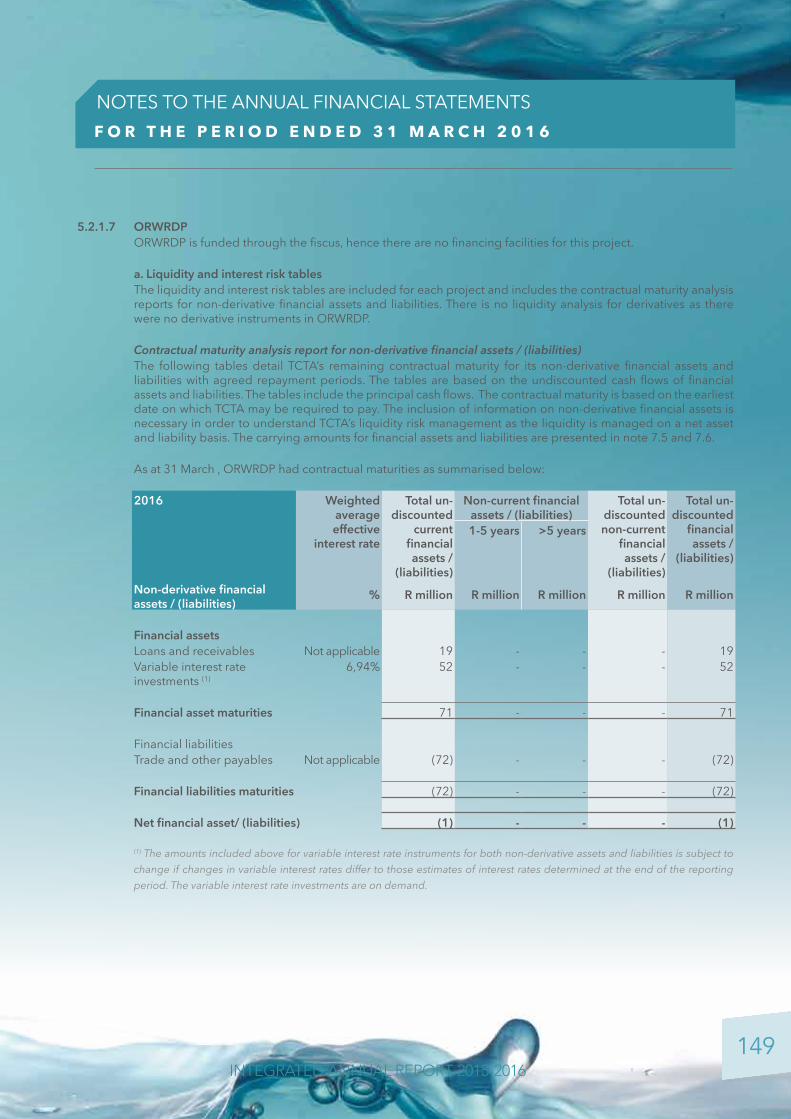
149
F O R T H E P E R I O D E N D E D 3 1 M A R C H 2 0 1 6
NOTES TO THE ANNUAL FINANCIAL STATEMENTS
INTEGRATED ANNUAL REPORT 2015-2016
5.2.1.7 ORWRDPORWRDP is funded through the fiscus, hence there are no financing facilities for this project.
a. Liquidity and interest risk tablesThe liquidity and interest risk tables are included for each project and includes the contractual maturity analysis reports for non-derivative financial assets and liabilities. There is no liquidity analysis for derivatives as there were no derivative instruments in ORWRDP.
Contractual maturity analysis report for non-derivative financial assets / (liabilities)The following tables detail TCTA’s remaining contractual maturity for its non-derivative financial assets and liabilities with agreed repayment periods. The tables are based on the undiscounted cash flows of financial assets and liabilities. The tables include the principal cash flows. The contractual maturity is based on the earliest date on which TCTA may be required to pay. The inclusion of information on non-derivative financial assets is necessary in order to understand TCTA’s liquidity risk management as the liquidity is managed on a net asset and liability basis. The carrying amounts for financial assets and liabilities are presented in note 7.5 and 7.6.
As at 31 March , ORWRDP had contractual maturities as summarised below:
2016 Weighted average effective
interest rate
Total un-discounted
current financial assets /
(liabilities)
Non-current financial assets / (liabilities)
Total un-discounted non-current
financial assets /
(liabilities)
Total un-discounted
financial assets /
(liabilities)
1-5 years >5 years
Non-derivative financial assets / (liabilities)
% R million R million R million R million R million
Financial assetsLoans and receivables Not applicable 19 - - - 19 Variable interest rate investments (1)
6,94% 52 - - - 52
Financial asset maturities 71 - - - 71
Financial liabilitiesTrade and other payables Not applicable (72) - - - (72)
Financial liabilities maturities (72) - - - (72)
Net financial asset/ (liabilities) (1) - - - (1)
(1) The amounts included above for variable interest rate instruments for both non-derivative assets and liabilities is subject to change if changes in variable interest rates differ to those estimates of interest rates determined at the end of the reporting period. The variable interest rate investments are on demand.

150
F O R T H E P E R I O D E N D E D 3 1 M A R C H 2 0 1 6
NOTES TO THE ANNUAL FINANCIAL STATEMENTS
INTEGRATED ANNUAL REPORT 2015-2016
2015 Weighted average effective
interest rate
Total un-discounted
current financial assets /
(liabilities)
Non-current financial assets / (liabilities)
Total un-discounted non-current
financial assets /
(liabilities)
Total un-discounted
financial assets /
(liabilities)
1-5 years >5 years
Non-derivative financial assets / (liabilities) % R million R million R million R million R million
Financial assetsLoans and receivables Not applicable 260 - - - 260 Variable interest rate investments (1)
5,88% 190 - - - 190
Financial asset maturities 450 - - - 450
Financial liabilitiesTrade and other payables Not applicable (469) - - - (469)
Financial liabilities maturities (469) - - - (469)
Net financial asset/ (liabilities) (19) - - - (19)
(1) The amounts included above for variable interest rate instruments for both non-derivative assets and liabilities is subject to change if changes in variable interest rates differ to those estimates of interest rates determined at the end of the reporting period. The variable interest rate investments are on demand.
5.2 Financial risk management objectives (continued)

151
F O R T H E P E R I O D E N D E D 3 1 M A R C H 2 0 1 6
NOTES TO THE ANNUAL FINANCIAL STATEMENTS
INTEGRATED ANNUAL REPORT 2015-2016
5.2.1.8 KWSAPa. Financing facilitiesFunding sources and utilisation at 31 March :
2016 2015Total borrowing authority R million R millionBorrowing limit 1 955 2 140 Utilisation (1 252) (1 185)Available 703 955
2016 Individual limit Disbursed Available Outstanding debt
Utilisation of approved facilities R million R million R million R millionCommercial Paper Programme 500 - 500 - Loan 400 393 - 393 Loan 911 600 311 859 Loan 250 - 250 -
1 252
2015 Individual limit Disbursed Available Outstanding debt
Utilisation of approved facilities R million R million R million R millionCommercial Paper Programme 500 - 500 - Loan 400 401 (1) 401 Loan 911 600 311 784 Loan 250 - 250 -
1 185

152
F O R T H E P E R I O D E N D E D 3 1 M A R C H 2 0 1 6
NOTES TO THE ANNUAL FINANCIAL STATEMENTS
INTEGRATED ANNUAL REPORT 2015-2016
b. Liquidity and interest risk tablesThe liquidity and interest risk tables are included for each project and includes the contractual maturity analysis reports for non-derivative financial assets and liabilities. There is no liquidity analysis for derivatives as there were no derivative instruments in KWSAP.
Contractual maturity analysis report for non-derivative financial assets / (liabilities)The following tables detail TCTA’s remaining contractual maturity for its non-derivative financial assets and liabilities with agreed repayment periods. The tables are based on the undiscounted cash flows of financial assets and liabilities. The tables include the principal cash flows. The contractual maturity is based on the earliest date on which TCTA may be required to pay. The inclusion of information on non-derivative financial assets is necessary in order to understand TCTA’s liquidity risk management as the liquidity is managed on a net asset and liability basis.
As at 31 March , KWSAP had contractual maturities as summarised below:
2016 Weighted average effective
interest rate
Total un-discounted
current financial assets /
(liabilities)
Non-current financial assets / (liabilities)
Total un-discounted non-current
financial assets /
(liabilities)
Total un-discounted
financial assets /
(liabilities)
1-5 years >5 years
Non-derivative financial assets / (liabilities) % R million R million R million R million R million
Financial assetsTariff receivable 10,51% 114 552 1 884 2 436 2 550 Variable interest rate investments (1)
6,93% 89 - - - 89
Financial asset maturities 203 552 1 884 2 436 2 639
Financial liabilitiesTerm paper - - Fixed rate loans (2) 9,59% (60) (392) (1 462) (1 854) (1 914)Variable rate loans (1) (2) 9,18% - (150) (881) (1 031) (1 031)Trade and other payables (excluding interest payable) (3)
Not applicable (20) - - - (20)
Financial liabilities maturities (80) (542) (2 343) (2 885) (2 965)
Net financial asset/ (liabilities) 123 10 (459) (449) (326)
(1) The amounts included above for variable interest rate instruments for both non-derivative assets and liabilities is subject to change if changes in variable interest rates differ to those estimates of interest rates determined at the end of the reporting period. The variable interest rate investments are on demand.(2) Loan repayments are made periodically as per the respective agreements.(3) Accrued interest has been included with the applicable instruments in the table.
5.2 Financial risk management objectives (continued)

153
F O R T H E P E R I O D E N D E D 3 1 M A R C H 2 0 1 6
NOTES TO THE ANNUAL FINANCIAL STATEMENTS
INTEGRATED ANNUAL REPORT 2015-2016
2015 Weighted average effective
interest rate
Total un-discounted
current financial assets /
(liabilities)
Non-current financial assets / (liabilities)
Total un-discounted non-current
financial assets /
(liabilities)
Total un-discounted
financial assets /
(liabilities)
1-5 years >5 years
Non-derivative financial assets / (liabilities) % R million R million R million R million R million
Financial assetsTariff receivable 10,51% 99 462 1 625 2 087 2 186 Variable interest rate investments (1)
5,46% 7 - - - 7
Financial asset maturities 106 462 1 625 2 087 2 193
Financial liabilitiesTerm paper - - - - - Fixed rate loans (2) 9,59% (47) (335) (1 576) (1 911) (1 958)Variable rate loans (1) (2) 8,06% - (85) (924) (1 009) (1 009)Trade and other payables Not applicable (4) - - - (4)
Financial liabilities maturities (51) (420) (2 500) (2 920) (2 971)
Net financial asset/ (liabilities) 55 42 (875) (833) (778)
(1) The amounts included above for variable interest rate instruments for both non-derivative assets and liabilities is subject to change if changes in variable interest rates differ to those estimates of interest rates determined at the end of the reporting period. The variable interest rate investments are on demand.(2) Loan repayments are made periodically as per the respective agreements.

154
F O R T H E P E R I O D E N D E D 3 1 M A R C H 2 0 1 6
NOTES TO THE ANNUAL FINANCIAL STATEMENTS
INTEGRATED ANNUAL REPORT 2015-2016
5.2.1.9 BOREHOLEThere are no financing facilities for BOREHOLE as the project was funded from the fiscus.
a. Liquidity and interest risk tablesThe liquidity and interest risk tables are included for each project and includes the contractual maturity analysis reports for non-derivative financial assets and liabilities. There is no liquidity analysis for derivatives as there was no derivative instruments in BOREHOLE project.
Contractual maturity analysis report for non-derivative financial assets / (liabilities)The following tables detail TCTA’s remaining contractual maturity for its non-derivative financial assets and liabilities with agreed repayment periods. The tables are based on the undiscounted cash flows of financial assets and liabilities. The tables include the principal cash flows. The contractual maturity is based on the earliest date on which TCTA may be required to pay. The inclusion of information on non-derivative financial assets is necessary in order to understand TCTA’s liquidity risk management as the liquidity is managed on a net asset and liability basis. The carrying amounts for financial assets and liabilities are presented in note 7.5 and 7.6.
As at 31 March , BOREHOLE project had contractual maturities as summarised below:
2016 Weighted average effective
interest rate
Total un-discounted
current financial assets /
(liabilities)
Non-current financial assets / (liabilities)
Total un-discounted non-current
financial assets /
(liabilities)
Total un-discounted
financial assets /
(liabilities)
1-5 years >5 years
Non-derivative financial assets / (liabilities) % R million R million R million R million R million
Financial assetsLoans and receivables Not applicable - - - - -Variable interest rate investments (1)
0,00% - - - - -
Financial asset maturities - - - - -
Financial liabilitiesTrade and other payables Not applicable - - - - -
Financial liabilities maturities - - - - -
Net financial asset/ (liabilities) - - - - -
(1) The amounts included above for variable interest rate instruments for both non-derivative assets and liabilities is subject to change if changes in variable interest rates differ to those estimates of interest rates determined at the end of the reporting period. The variable interest rate investments are on demand.
5.2 Financial risk management objectives (continued)
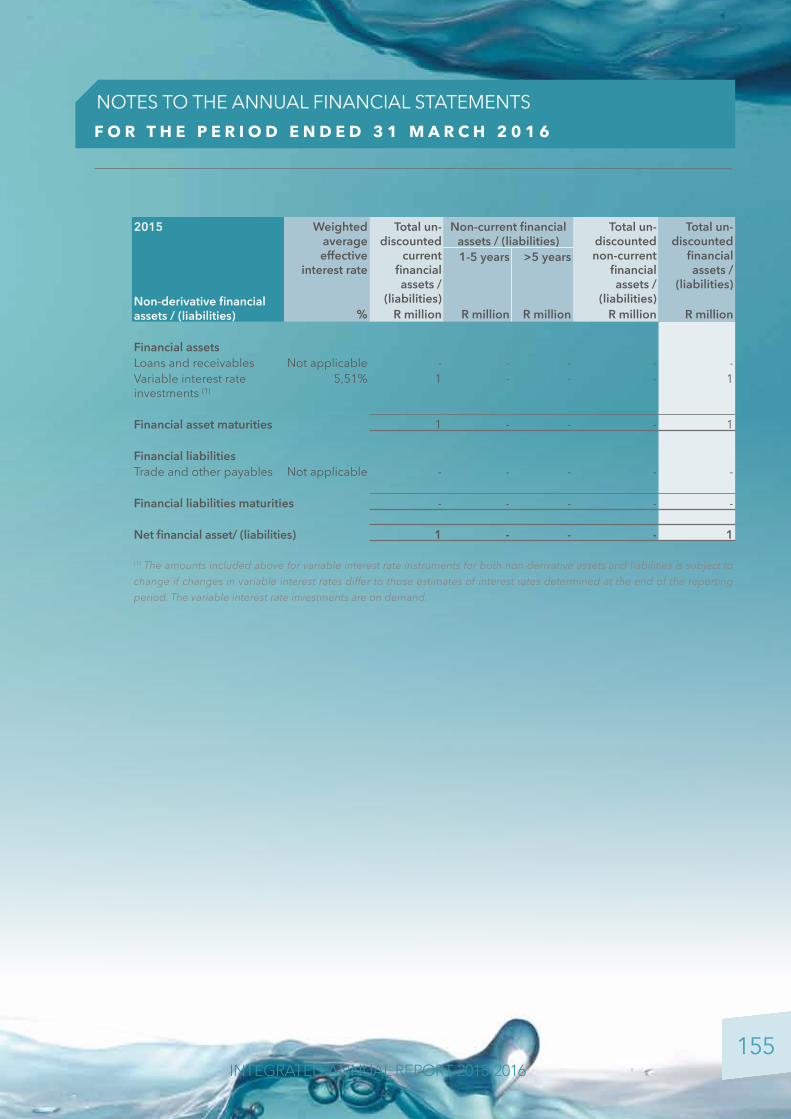
155
F O R T H E P E R I O D E N D E D 3 1 M A R C H 2 0 1 6
NOTES TO THE ANNUAL FINANCIAL STATEMENTS
INTEGRATED ANNUAL REPORT 2015-2016
2015 Weighted average effective
interest rate
Total un-discounted
current financial assets /
(liabilities)
Non-current financial assets / (liabilities)
Total un-discounted non-current
financial assets /
(liabilities)
Total un-discounted
financial assets /
(liabilities)
1-5 years >5 years
Non-derivative financial assets / (liabilities) % R million R million R million R million R million
Financial assetsLoans and receivables Not applicable - - - - -Variable interest rate investments (1)
5,51% 1 - - - 1
Financial asset maturities 1 - - - 1
Financial liabilitiesTrade and other payables Not applicable - - - - -
Financial liabilities maturities - - - - -
Net financial asset/ (liabilities) 1 - - - 1
(1) The amounts included above for variable interest rate instruments for both non-derivative assets and liabilities is subject to change if changes in variable interest rates differ to those estimates of interest rates determined at the end of the reporting period. The variable interest rate investments are on demand.

156
F O R T H E P E R I O D E N D E D 3 1 M A R C H 2 0 1 6
NOTES TO THE ANNUAL FINANCIAL STATEMENTS
INTEGRATED ANNUAL REPORT 2015-2016
5.2.1.10 MMTS- 1a. Liquidity and interest risk tablesThis project comprises the refurbishment of the existing transfer scheme from Mearns Weir into the Mgeni system and the project is funded from the fiscus.
Contractual maturity analysis report for non-derivative financial assets / (liabilities)The following tables detail TCTA’s remaining contractual maturity for its non-derivative financial assets and liabilities with agreed repayment periods. The tables are based on the undiscounted cash flows of financial assets and liabilities. The tables include the principal cash flows. The contractual maturity is based on the earliest date on which TCTA may be required to pay. The inclusion of information on non-derivative financial assets is necessary in order to understand TCTA’s liquidity risk management as the liquidity is managed on a net asset and liability basis. The carrying amounts for financial assets and liabilities are presented in note 7.5 and 7.6.
As at 31 March , MMTS-1 had contractual maturities as summarised below:
2016 Weighted average effective
interest rate
Total un-discounted
current financial assets /
(liabilities)
Non-current financial assets / (liabilities)
Total un-discounted non-current
financial assets /
(liabilities)
Total un-discounted
financial assets /
(liabilities)
1-5 years >5 years
Non-derivative financial assets / (liabilities) % R million R million R million R million R million
Financial assetsLoans and receivables Not applicable - - - - -
Financial asset maturities - - - - -
Financial liabilitiesTrade and other payables Not applicable - - - - -
Financial liabilities maturities - - - - -
Net financial asset/ (liabilities) - - - - -
5.2 Financial risk management objectives (continued)
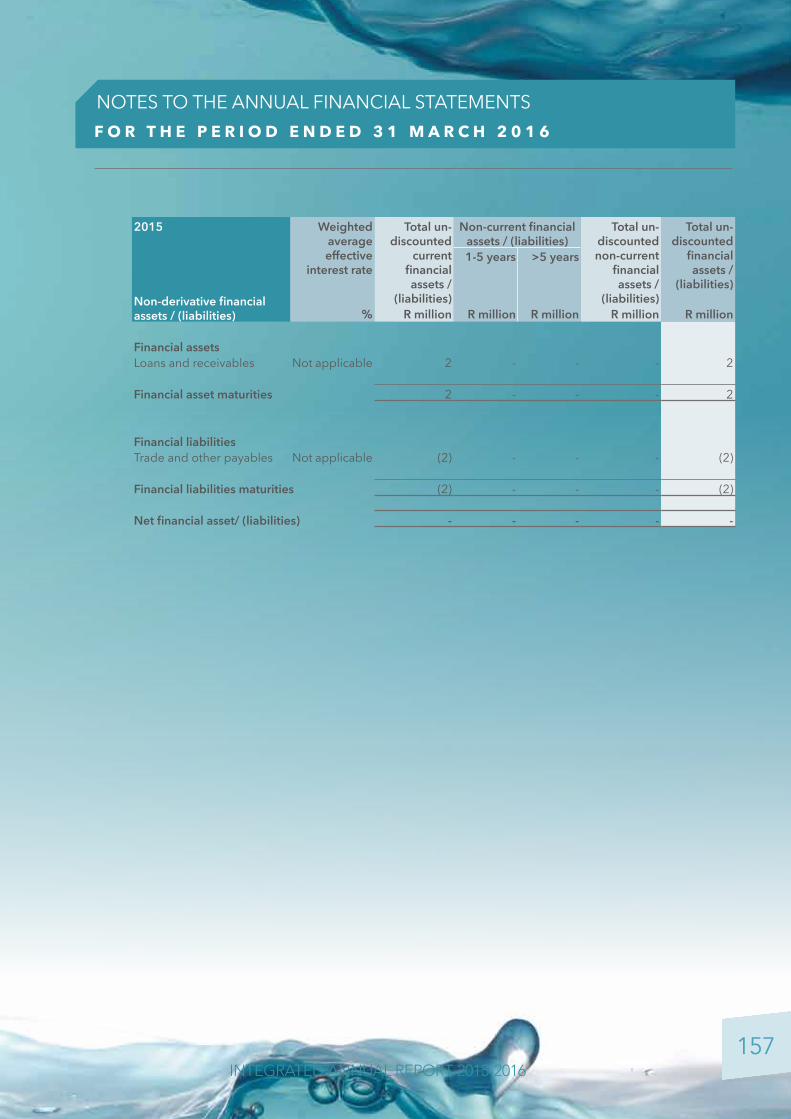
157
F O R T H E P E R I O D E N D E D 3 1 M A R C H 2 0 1 6
NOTES TO THE ANNUAL FINANCIAL STATEMENTS
INTEGRATED ANNUAL REPORT 2015-2016
2015 Weighted average effective
interest rate
Total un-discounted
current financial assets /
(liabilities)
Non-current financial assets / (liabilities)
Total un-discounted non-current
financial assets /
(liabilities)
Total un-discounted
financial assets /
(liabilities)
1-5 years >5 years
Non-derivative financial assets / (liabilities) % R million R million R million R million R million
Financial assetsLoans and receivables Not applicable 2 - - - 2
Financial asset maturities 2 - - - 2
Financial liabilitiesTrade and other payables Not applicable (2) - - - (2)
Financial liabilities maturities (2) - - - (2)
Net financial asset/ (liabilities) - - - - -

158
F O R T H E P E R I O D E N D E D 3 1 M A R C H 2 0 1 6
NOTES TO THE ANNUAL FINANCIAL STATEMENTS
INTEGRATED ANNUAL REPORT 2015-2016
5.2.1.11 UMGENIa. Liquidity and interest risk tablesThis project comprises the construction of a potable water pipeline from the water treatment works at the Spring Grove Dam to a terminal reservoir at Nottingham Road and the project is funded by Umgeni Water.
Contractual maturity analysis report for non-derivative financial assets / (liabilities)The following tables detail TCTA’s remaining contractual maturity for its non-derivative financial assets and liabilities with agreed repayment periods. The tables are based on the undiscounted cash flows of financial assets and liabilities. The tables include the principal cash flows. The contractual maturity is based on the earliest date on which TCTA may be required to pay. The inclusion of information on non-derivative financial assets is necessary in order to understand TCTA’s liquidity risk management as the liquidity is managed on a net asset and liability basis. The carrying amounts for financial assets and liabilities are presented in note 7.5 and 7.6.
As at 31 March 2016, UMGENI had contractual maturities as summarised below:
2016 Weighted average effective
interest rate
Total un-discounted
current financial assets /
(liabilities)
Non-current financial assets / (liabilities)
Total un-discounted non-current
financial assets /
(liabilities)
Total un-discounted
financial assets /
(liabilities)
1-5 years >5 years
Non-derivative financial assets / (liabilities) % R million R million R million R million R million
Financial assetsLoans and receivables Not applicable 8 - - - 8
Financial asset maturities 8 - - - 8
Financial liabilitiesTrade and other payables Not applicable (4) - - - (4)
Financial liabilities maturities (4) - - - (4)
Net financial asset/ (liabilities) 4 - - - 4
5.2 Financial risk management objectives (continued)

159
F O R T H E P E R I O D E N D E D 3 1 M A R C H 2 0 1 6
NOTES TO THE ANNUAL FINANCIAL STATEMENTS
INTEGRATED ANNUAL REPORT 2015-2016
2015 Weighted average effective
interest rate
Total un-discounted
current financial assets /
(liabilities)
Non-current financial assets / (liabilities)
Total un-discounted non-current
financial assets /
(liabilities)
Total un-discounted
financial assets /
(liabilities)
1-5 years >5 years
Non-derivative financial assets / (liabilities) % R million R million R million R million R million
Financial assetsLoans and receivables Not applicable 61 - - - 61
Financial asset maturities 61 - - - 61
Financial liabilitiesTrade and other payables Not applicable (60) - - - (60)
Financial liabilities maturities (60) - - - (60)
Net financial asset/ (liabilities) 1 - - - 1

160
F O R T H E P E R I O D E N D E D 3 1 M A R C H 2 0 1 6
NOTES TO THE ANNUAL FINANCIAL STATEMENTS
INTEGRATED ANNUAL REPORT 2015-2016
5.2.1.12 KRIELa. Liquidity and interest risk tablesThis project comprises the construction of a 3 km pipeline from the KWSAP to Kriel Water treatment works and the upgrading of the works.
Contractual maturity analysis report for non-derivative financial assets / (liabilities)The following tables detail TCTA’s remaining contractual maturity for its non-derivative financial assets and liabilities with agreed repayment periods. The tables are based on the undiscounted cash flows of financial assets and liabilities. The tables include the principal cash flows. The contractual maturity is based on the earliest date on which TCTA may be required to pay. The inclusion of information on non-derivative financial assets is necessary in order to understand TCTA’s liquidity risk management as the liquidity is managed on a net asset and liability basis. The carrying amounts for financial assets and liabilities are presented in note 7.5 and 7.6.
As at 31 March 2016, KRIEL had contractual maturities as summarised below:
2016 Weighted average effective
interest rate
Total un-discounted
current financial assets /
(liabilities)
Non-current financial assets / (liabilities)
Total un-discounted non-current
financial assets /
(liabilities)
Total un-discounted
financial assets /
(liabilities)
1-5 years >5 years
Non-derivative financial assets / (liabilities) % R million R million R million R million R million
Financial assetsLoans and receivables Not applicable 18 - - - 18
Financial asset maturities 18 - - - 18
Financial liabilitiesTrade and other payables Not applicable (18) - - - (18)
Financial liabilities maturities (18) - - - (18)
Net financial asset/ (liabilities) - - - - -
2015No comparative information for the 2015 financial year end as Kriel commenced in the current financial year.
5.2 Financial risk management objectives (continued)
161
F O R T H E P E R I O D E N D E D 3 1 M A R C H 2 0 1 6
NOTES TO THE ANNUAL FINANCIAL STATEMENTS
INTEGRATED ANNUAL REPORT 2015-2016
5.2.2 Credit risk
Credit risk refers to the risk that a counterparty will default on its contractual obligations resulting in financial loss to TCTA. This section relates to the credit risk on financial market investments and derivatives as disclosed in the statement of financial position. Refer to note 7.4 for the assessment of the credit quality of the tariff receivable and note 8.2 for loans and other receivables. TCTA has adopted a policy of only dealing with creditworthy counterparties and obtaining sufficient collateral, where appropriate, as a means of mitigating the risk of financial loss from defaults. TCTA only transacts with entities that are rated the equivalent of investment grade and above. This information is supplied by independent rating agencies where available and, if not available, TCTA uses other publicly available financial information and its own trading records to rate its major customers. TCTA’s exposure and the credit ratings of its counterparties are continuously monitored and the aggregate value of transactions concluded is spread amongst approved counterparties. Credit exposure is controlled by counterparty limits that are reviewed and approved by the Risk Committee annually.
This is the risk of loss resulting from the failure of a counterparty to honour its obligations. The risk is managed by:• Ensuring that TCTA deals with reputable counterparties. • Allocating counterparty investment limits. • Liaison with credit-rating agencies. • Continuous monitoring of the financial status of counterparties. • Review of credit limits on a semi-annual basis. • Monitoring of counterparty limit utilisation daily.
Credit limits are allocated based on the following: • Limits are allocated to counterparties with a minimum credit rating of F1 and A. • The allocated limits should not exceed 5% of the counterparty’s shareholders’ funds. • The maximum limit allocated to each counterparty is R1 500 million and limited to counterparties where 5%
of shareholders’ funds exceed R100 million.• The credit limit consumption of forward exchange contracts (FECs) with commercial banks is determined
according to the Risk Policy whereby the maximum of a calculated risk weighting value or the mark-to-market value of an instrument will be used as the consumption against the credit limit of a specific counterparty.
To further mitigate against the credit risk associated with derivative instruments, TCTA has negotiated International Swap and Derivatives Association Master Agreement (ISDA) agreements with the various market-makers.
The credit limit per counterparty refers to the overall limit for all TCTA projects. Refer to note 5.2.2 for further detail.
Concentration riskConcentration risk in TCTA is measured per counterparty and per project. According to TCTA policy, the utilisation of a counterparty limit is subject to a 30% concentration limit per counterparty. The concentration limit is further extended to projects whereby investment to a single counterparty should not exceed 30% of project funds. This ensures that the portfolio is sufficiently diversified and is exposed to acceptable levels of risk. For each project, the amount of risk exposure to counterparties varies on a day to day basis depends on volumes of trades done. TCTA determines this exposure daily and report before any dealing is performed. Exception to the limits requires an approval through exception reporting to the risk department. Similar credit ratings in the notes below, refer to different counterparties and are therefore not combined.

162
F O R T H E P E R I O D E N D E D 3 1 M A R C H 2 0 1 6
NOTES TO THE ANNUAL FINANCIAL STATEMENTS
INTEGRATED ANNUAL REPORT 2015-2016
5.2.2.1 VRS / LHWPFinancial instruments and cash depositsThe table below reflects the utilisation per counterparty against the credit limit at 31 March:
Fitch Ratings: VRS VRSLHWP AMD
2016 2015 2015
Short term
Long term
Credit limit
Total utilisation
(1)
Available Credit limit
Total utilisation
(1)
Available Credit limit
Total utilisation
(1)
Available
R million R million R million R million R million R million R million R million R millionF1+ AA 1 500 306 1 194 1 500 3 1 497 F1+ AA+ 1500 453 1 047 F1 A+ 1500 374 1 126 1 500 386 1 114 1 500 16 1 484 F1+ AA 1500 291 1 209 1 500 417 1 083 1 500 13 1 487 F1 AA - 1 500 369 1 131 1 500 13 1 487 F1+ AA 341 102 239 F1+ AA- 1500 282 1 218 F1+ AA 1000 3 997 F1+ AA 1500 495 1 005 1 000 3 997 F1+ AA+ - 307 102 205 F1+ AAA - 1 500 545 955 1 500 14 1 486
AA+ * 889 - * 167 - * 6 - AAA ** 1 - ** 653 - AA+ * 667 - * 100 - AA+ * 507 - * 84 -
F1+ AA- 500 1 499 500 1 499
(1) The total utilisation includes derivatives.
* These three counterparties in total are subject to a maximum of 30% of the project funds.** This is subject to a maximum of 50% of the project funds.
5.2 Financial risk management objectives (continued)

163
F O R T H E P E R I O D E N D E D 3 1 M A R C H 2 0 1 6
NOTES TO THE ANNUAL FINANCIAL STATEMENTS
INTEGRATED ANNUAL REPORT 2015-2016
5.2.2.2 BWPFinancial instruments and cash depositsThe table below reflects the utilisation per counterparty against the credit limit at 31 March:
Fitch Ratings: 2016 2015
Short term Long term
Credit limit Total utilisation
Available Credit limit Total utilisation
Available
R million R million R million R million R million R millionF1+ AA 1 500 9 1 491 - - - F1 A+ - 1 500 9 1 491 F1+ AA+ 1 500 9 1 491 F1+ AA 1 500 12 1 488 1 500 17 1 483
AA+ * 5 - * 22 - AAA ** 0 - ** 19 - AA+ * 2 - * 7 -
F1 AA+ * - - * 2 - F1 AA 1 500 17 1 483 F1+ AA- 1 500 7 1 493 - - - F1+ AAA - 1500 16 1 484
* These three counterparties in total are subject to a maximum of 30% of the project funds.** This is subject to a maximum of 50% of the project funds.
5.2.2.3 VRESAPFinancial instruments and cash depositsThe table below reflects the utilisation per counterparty against the credit limit at 31 March:
Fitch Ratings: 2016 2015
Short term Long term
Credit limit Total utilisation
Available Credit limit Total utilisation
Available
R million R million R million R million R million R millionF1+ AA 1 500 15 1 485 1 500 6 1 494 F1+ AA- 1 500 15 1 485 F1+ AA+ 1 500 16 1 484 F1+ AA 1 500 16 1 484 1 500 6 1 494 F1 A+ 1 500 4 1 496
AA+ * 10 * - - AAA ** - - ** - - AA+ * - - * - - AA+ * - - * - -
F1 AA 1 500 6 1 494
* These three counterparties in total are subject to a maximum of 30% of the project funds.** This is subject to a maximum of 50% of the project funds.

164
F O R T H E P E R I O D E N D E D 3 1 M A R C H 2 0 1 6
NOTES TO THE ANNUAL FINANCIAL STATEMENTS
INTEGRATED ANNUAL REPORT 2015-2016
5.2 Financial risk management objectives (continued)
5.2.2.4 MCWAPFinancial instruments and cash depositsThe table below reflects the utilisation per counterparty against the credit limit at 31 March:
Fitch Ratings: 2016 2015
Short term Long term
Credit limit Total utilisation
Available Credit limit Total utilisation
Available
R million R million R million R million R million R millionF1+ AA 1 500 5 1 495 1 500 2 1 498 F1+ AA- 1 500 2 1 498 F1+ AA+ 1 500 5 1 495 F1+ AAA 1 500 11 1 489 F1+ AA 1 500 6 1 494 1 500 11 1 489
AA+ * 5 - * 25 - AA+ * 12 - * 67 - AA+ * 11 - * 23 -
F1 A+ 1 500 12 1 488 F1 AA 1 500 18 1 482
* These three counterparties in total are subject to a maximum of 30% of the project funds.** This is subject to a maximum of 50% of the project funds.
5.2.2.5 MMTS-2Financial instruments and cash depositsThe table below reflects the utilisation per counterparty against the credit limit at 31 March:
Fitch Ratings: 2016 2015
Short term Long term
Credit limit Total utilisation
Available Credit limit Total utilisation
Available
R million R million R million R million R million R millionF1+ AA 1 500 33 1 467 1 500 159 1 341 F1+ AA- 1 500 5 1 495 F1+ AA+ 1 500 245 1 255 F1+ AA+ 1 500 33 1 467
AA+ * 15 - AA+ * 9 -
F1+ AA 1 500 32 1 468 1 500 1 1 499 F1 AA 1 500 1 1 499 F1 A+ 1 500 1 1 499 F1+ AAA - 1 500 - 1 500
*The three counterparties in total are subject to a maximum of 30% of the project funds.

165
F O R T H E P E R I O D E N D E D 3 1 M A R C H 2 0 1 6
NOTES TO THE ANNUAL FINANCIAL STATEMENTS
INTEGRATED ANNUAL REPORT 2015-2016
5.2.2.6 ORWRDPFinancial instruments and cash depositsThe table below reflects the utilisation per counterparty against the credit limit at 31 March:
Fitch Ratings: 2016 2015
Short term Long term
Credit limit Total utilisation
Available Credit limit Total utilisation
Available
R million R million R million R million R million R millionF1+ AA 1 500 12 1 488 1 500 14 1 486 F1+ AA- 1 500 9 1 491 F1 A+ - 1 500 10 1 490 F1+ AA+ 1 500 7 1 493 F1+ AA 1 500 9 1 491 - - -
AA+ * 9 - * 20 - AAA ** - - ** 86 - AA+ * 3 - * 14 - AA+ * 2 - * 18 -
F1+ AA- 500 1 499 500 1 499 F1 AA - 1 500 15 1 485 F1+ AAA - 1 500 12 1 488
* These three counterparties in total are subject to a maximum of 30% of the project funds.** This is subject to a maximum of 50% of the project funds.
5.2.2.7 KWSAPFinancial instruments and cash depositsThe table below reflects the utilisation per counterparty against the credit limit at 31 March:
Fitch Ratings: 2016 2015
Short term Long term
Credit limit Total utilisation
Available Credit limit Total utilisation
Available
R million R million R million R million R million R millionF1+ AA 1 500 18 1 482 1 500 2 1 498 F1+ AA- 1 500 10 1 490 F1+ AA+ 1 500 16 1 484 F1 A+ 1 500 2 1 498 F1+ AA 1 500 22 1 478 - - -
AA+ * 14 - * - - AAA ** - - ** - - AA+ * 8 - * - - AA+ * - - * - -
F1 AA 1 500 1 1 499 F1+ AAA 1 500 2 1 498
* These three counterparties in total are subject to a maximum of 30% of the project funds.** This is subject to a maximum of 50% of the project funds.

166
F O R T H E P E R I O D E N D E D 3 1 M A R C H 2 0 1 6
NOTES TO THE ANNUAL FINANCIAL STATEMENTS
INTEGRATED ANNUAL REPORT 2015-2016
5.2 Financial risk management objectives (continued)
5.2.2.8 BOREHOLEFinancial instruments and cash depositsThe table below reflects the utilisation per counterparty against the credit limit at 31 March:
Fitch Ratings: 2016 2015
Short term Long term
Credit limit Total utilisation
Available Credit limit Total utilisation
Available
R million R million R million R million R million R millionF1+ AA - - - 1 500 1 1 499
5.2.2.9 MMTS-1There are no investments for the current year (2015: none).
5.2.2.10 UMGENIThere are no investments for the current year (2015: none).
5.2.2.11 KRIELThere are no investments for the current year.
5.2.3 Market riskMarket risk is the risk that the fair value or cash flows of a financial instrument will fluctuate due to change in market prices. Market risk reflects currency risk, interest rate risk, and other price risks.
TCTA’s activities expose it primarily to the financial risks of changes in foreign currency exchange rates and interest rates. TCTA enters into derivative financial instruments to manage its exposure to foreign currency risk and interest rate risk, including: FECs to hedge the exchange rate risk arising on the repayment of foreign loans.
5.2.3.1 Foreign currency risk managementTCTA undertakes transactions denominated in foreign currencies; consequently, exposures to exchange rate fluctuations arise. Exchange rate exposures are managed within approved policy parameters utilising FECs.
VRS / LHWPForeign currency risk arises from the impact of exchange rate fluctuations on the project’s foreign currency loan liabilities.
TCTA is currently exposed to Euro exchange rate fluctuations. TCTA has a policy to cover 100% of its foreign capital commitments and 75% of interest and fees.
TCTA makes use of FECs for economic hedging purposes. The table below shows the foreign exchange cover as at 31 March for VRS (2015: LHWP had foreign exchange contracts as shown below and AMD did not have any foreign exchange contracts):
2016 2015EUR EUR
Foreign exchange contracts maturity profile million millionLiabilities< 1 year 2 3
2 3

167
F O R T H E P E R I O D E N D E D 3 1 M A R C H 2 0 1 6
NOTES TO THE ANNUAL FINANCIAL STATEMENTS
INTEGRATED ANNUAL REPORT 2015-2016
Foreign currency sensitivityThe following table illustrates the sensitivity of the net result for the year in regard to the financial liabilities and financial assets and the EUR/ZAR exchange rates.
It assumes a 15% change of the EUR/ZAR exchange rate for the year ended 31 March 2016 (2015: 15%). The sensitivity analysis is based on foreign currency financial instruments held at each reporting date and also takes into account FECs that offset effects from changes in currency exchange rates.
If the rand had weakened against the Euro 15% (2015: 15%) then this would have had the following impact:
Financial asset and financial liabilities: sensitivity analysis
2016 2015Change in
EuroChange in
EuroR million R million
Weakening of RandSurplus / (deficit) - - (1)
Strengthening of RandSurplus / (deficit) - - (1)
(1) Where the numbers are reflected as zero, the movements are less than R500 000.
BWP, VRESAP, MMTS-2, KWSAP, ORWRDP, MCWAP, BOREHOLE, AMD, MMTS-1 and UMGENIThese projects do not have any foreign currency exposures.
5.2.3.2 Interest rate riskInterest rate risk is the risk of adverse interest rate fluctuations negatively impacting debt exposures, including the repricing of TCTA’s floating rate debt obligations and the short-term rollover of maturing debt.
TCTA Risk Committee approved a optimal capital structure of a minimum of 70% fixed for all project post construction. In addition, TCTA management strives to achieve a minimum of 70% fixed on all projects post construction and/or operational declaration, when opportunity arises, taking advantage of financial market opportunities to better manage interest rates risks. Currently most of the projects are above the approved capital structure and envisaged limits preferred by TCTA management, which is positive.
TCTA does not have any derivatives hedging interest rate risk, instead attainment of the optimal capital structure and the proactive interest rate risk management strategies are applied.
a. VRS / LHWPFixed vs. variable rate loansThe following table details the interest rate exposure for VRS (2015: LHWP had borrowings as shown below and AMD did not have any borrowings). The optimal capital structure based on the sensitivity simulation is 70% fixed (2015:70%) and 30% floating (2015:30%). This ensures limited fluctuation of the cumulative debt curve. The ratio of fixed to floating debt as at 31 March 2016 was 65% (2015: 67%) fixed and 35% (2015: 33%) floating.

168
F O R T H E P E R I O D E N D E D 3 1 M A R C H 2 0 1 6
NOTES TO THE ANNUAL FINANCIAL STATEMENTS
INTEGRATED ANNUAL REPORT 2015-2016
5.2 Financial risk management objectives (continued)
The proportional interest-rate exposures on total outstanding debt of the project can be summarised as follows:
2016 2015Borrowings
at fixed rates
Borrowings at variable
rates
Fixed rate borrowings
as % of total debt
book
Variable rate
borrowings as % of
total debt book
Borrowings at fixed
rates
Borrowings at variable
rates
Fixed rate borrowings
as % of total debt
book
Variable rate
borrowings as % of
total debt book
Interest -rate exposure on borrowings R million R million R million R million
Borrowings 12 603 6 928 65% 35% 12 889 6 358 67% 33%
Interest rate sensitivityThe following table illustrates the sensitivity of the net result for the year to a reasonably possible change in interest rates of +100bps and -100bps (2015: +/- 100bps) and +200bps and -200bps (2015: +/- 200bps), with effect from the beginning of the year. These changes are considered to be reasonably possible based on observation of current market conditions. The calculations are based on LHWP’s financial instruments held at the reporting date. All other variables are held constant.
VRS VRSLHWP AMD
2016 2015 2015Sensitivity analysis: Impact on surplus / (deficit) R million R million R millionFinancial liabilitiesChange in interest rates of -100bps 6 3 - Change in interest rates of +100bps (6) (3) - Change in interest rates of -200bps 12 6 - Change in interest rates of +200bps (12) (6) -
Financial assetsChange in interest rates of -100bps (19) (18) - (1)
Change in interest rates of +100bps 19 18 - (1)
Change in interest rates of -200bps (38) (36) (1)Change in interest rates of +200bps 39 36 1
The table above excludes the Tariff receivable.
Currently TCTA does not have any derivatives hedging interest rate risk. Interest rate risk is managed through achievement of optimal capital structure, and continuous monitoring of short-, medium- and long-term interest rates’ exposures.A change in interest rates will not have an impact on equity (2015: no impact).
(1) Where the numbers are reflected as zero, the movements are less than R500 000.

169
F O R T H E P E R I O D E N D E D 3 1 M A R C H 2 0 1 6
NOTES TO THE ANNUAL FINANCIAL STATEMENTS
INTEGRATED ANNUAL REPORT 2015-2016
b. BWPFixed vs. variable rate loansThe ratio of fixed to floating debt as at 31 March 2016 was 88% (2015: 79%) fixed and 12% (2015: 21%) floating.
2016 2015Borrowings
at fixed rates
Borrowings at variable
rates
Fixed rate borrowings
as % of total debt
book
Variable rate
borrowings as % of
total debt book
Borrowings at fixed
rates
Borrowings at variable
rates
Fixed rate borrowings
as % of total debt
book
Variable rate
borrowings as % of
total debt book
Interest -rate exposure on borrowings R million R million R million R million
Borrowings 747 100 88% 12% 824 216 79% 21%
Interest rate sensitivityThe following table illustrates the sensitivity of the net result for the year to a reasonably possible change in interest rates of +100bps and -100bps (2015: +/- 100bps) and +200bps and -200bps (2015: +/- 200bps), with effect from the beginning of the year. These changes are considered to be reasonably possible based on observation of current market conditions. The calculations are based on BWP’s financial instruments held at the reporting date. All other variables are held constant.
2016 2015Sensitivity analysis: Impact on surplus / (deficit) R million R millionFinancial liabilitiesChange in interest rates of -100bps 1 1 Change in interest rates of +100bps (1) (1)Change in interest rates of -200bps 2 3 Change in interest rates of +200bps (2) (3)
Financial assetsChange in interest rates of -100bps (1) (1)Change in interest rates of +100bps 1 1 Change in interest rates of -200bps (2) (1)Change in interest rates of +200bps 2 1
The table above excludes the Tariff receivable.
(1) Where the numbers are reflected as zero, the movements are less than R500 000.
A change in interest rates will not have an impact on equity (2015: no impact).

170
F O R T H E P E R I O D E N D E D 3 1 M A R C H 2 0 1 6
NOTES TO THE ANNUAL FINANCIAL STATEMENTS
INTEGRATED ANNUAL REPORT 2015-2016
5.2 Financial risk management objectives (continued)
c. VRESAPFixed vs. variable rate loansThe ratio of fixed to floating debt as at 31 March 2016 rates was 74% (2015: 77%) fixed and 26% (2015: 23%) floating.
2016 2015Borrowings
at fixed rates
Borrowings at variable
rates
Fixed rate borrowings
as % of total debt
book
Variable rate
borrowings as % of
total debt book
Borrowings at fixed
rates
Borrowings at variable
rates
Fixed rate borrowings
as % of total debt
book
Variable rate
borrowings as % of
total debt book
Interest -rate exposure on borrowings R million R million R million R million
Borrowings 2 796 1 002 74% 26% 2 939 868 77% 23%
Interest rate sensitivityThe following table illustrates the sensitivity of the net result for the year to a reasonably possible change in interest rates of +100bps and -100bps (2015: +/- 100bps) and +200bps and -200bps (2015: +/- 200bps), with effect from the beginning of the year. These changes are considered to be reasonably possible based on observation of current market conditions. The calculations are based on VRESAP’s financial instruments held at the reporting date. All other variables are held constant.
2016 2015Sensitivity analysis: Impact on surplus / (deficit) R million R millionFinancial liabilitiesChange in interest rates of -100bps 9 8 Change in interest rates of +100bps (9) (7)Change in interest rates of -200bps 19 15 Change in interest rates of +200bps (19) (15)
Financial assetsChange in interest rates of -100bps - -(1)
Change in interest rates of +100bps - -(1)
Change in interest rates of -200bps (1) (1)Change in interest rates of +200bps 1 1
The table above excludes the Tariff receivable.
(1) Where the numbers are reflected as zero, the movements are less than R500 000.
A change in interest rates will not have an impact on equity (2015: no impact).

171
F O R T H E P E R I O D E N D E D 3 1 M A R C H 2 0 1 6
NOTES TO THE ANNUAL FINANCIAL STATEMENTS
INTEGRATED ANNUAL REPORT 2015-2016
d. MCWAPFixed vs. variable rate loansThe ratio of fixed to floating debt as at 31 March 2016 was 86% (2015: 87%) fixed and 14% (2015: 13%) floating.
2016 2015Borrowings
at fixed rates
Borrowings at variable
rates
Fixed rate borrowings
as % of total debt
book
Variable rate
borrowings as % of
total debt book
Borrowings at fixed
rates
Borrowings at variable
rates
Fixed rate borrowings
as % of total debt
book
Variable rate
borrowings as % of
total debt book
Interest -rate exposure on borrowings R million R million R million R million
Borrowings 1 033 166 86% 14% 1 040 161 87% 13%
Interest rate sensitivityThe following table illustrates the sensitivity of the net result for the year to a reasonably possible change in interest rates of +100bps and -100bps (2015: +/- 100bps) and +200bps and -200bps (2015: +/- 200bps), with effect from the beginning of the year. These changes are considered to be reasonably possible based on observation of current market conditions. The calculations are based on MCWAP’s financial instruments held at each reporting date. All other variables are held constant.
2016 2015Sensitivity analysis: Impact on surplus / (deficit) R million R millionFinancial liabilitiesChange in interest rates of -100bps 2 1 Change in interest rates of +100bps (2) (1)Change in interest rates of -200bps 4 3 Change in interest rates of +200bps (4) (3)
Financial assetsChange in interest rates of -100bps (1) (3)Change in interest rates of +100bps 1 3 Change in interest rates of -200bps (2) (5)Change in interest rates of +200bps 2 5
The table above excludes the Tariff receivable.
A change in interest rates will not have an impact on equity (2015: no impact).

172
F O R T H E P E R I O D E N D E D 3 1 M A R C H 2 0 1 6
NOTES TO THE ANNUAL FINANCIAL STATEMENTS
INTEGRATED ANNUAL REPORT 2015-2016
5.2 Financial risk management objectives (continued)
e. MMTS-2Fixed vs. variable rate loansThe ratio of fixed to floating debt as at 31 March 2016 was 42% (2015:37%) fixed and 58% (2015:63%) floating. The project is still under construction.
2016 2015Borrowings
at fixed rates
Borrowings at variable
rates
Fixed rate borrowings
as % of total debt
book
Variable rate
borrowings as % of
total debt book
Borrowings at fixed
rates
Borrowings at variable
rates
Fixed rate borrowings
as % of total debt
book
Variable rate
borrowings as % of
total debt book
Interest -rate exposure on borrowings R million R million R million R million
Borrowings 762 1 054 42% 58% 513 888 37% 63%
Interest rate sensitivityThe following table illustrates the sensitivity of the net result for the year to a reasonably possible change in interest rates of +100bps and -100bps (2015: +/- 100bps) and +200bps and -200bps (2015: +/- 200bps), with effect from the beginning of the year. These changes are considered to be reasonably possible based on observation of current market conditions. The calculations are based on MMTS 2’s financial instruments held at the reporting date. All other variables are held constant.
2016 2015Sensitivity analysis: Impact on surplus / (deficit) R million R millionFinancial liabilitiesChange in interest rates of -100bps 10 9 Change in interest rates of +100bps (10) (9)Change in interest rates of -200bps 20 18 Change in interest rates of +200bps (20) (18)
Financial assetsChange in interest rates of -100bps (2) (2)Change in interest rates of +100bps 2 2 Change in interest rates of -200bps (3) (5)Change in interest rates of +200bps 3 5
The table above excludes the Tariff receivable.
A change in interest rates will not have an impact on equity (2015: no impact).

173
F O R T H E P E R I O D E N D E D 3 1 M A R C H 2 0 1 6
NOTES TO THE ANNUAL FINANCIAL STATEMENTS
INTEGRATED ANNUAL REPORT 2015-2016
f. ORWRDPFixed vs. variable rate loansThere are no borrowings in this project for the current and 2015 financial year as this project is funded from the fiscus.
Interest rate sensitivityThe following table illustrates the sensitivity of the net result for the year to a reasonably possible change in interest rates of +100bps and -100bps (2015: +/- 100bps) and +200bps and -200bps (2015: +/- 200bps), with effect from the beginning of the year. These changes are considered to be reasonably possible based on observation of current market conditions. The calculations are based on ORWRDP’s financial instruments held at the reporting date. All other variables are held constant.
2016 2015Sensitivity analysis: Impact on surplus / (deficit) R million R millionFinancial assetsChange in interest rates of -100bps (3) (3)Change in interest rates of +100bps 3 3 Change in interest rates of -200bps (6) (7)Change in interest rates of +200bps 6 7
The table above excludes the Tariff receivable.
A change in interest rates will not have an impact on equity (2015: no impact).

174
F O R T H E P E R I O D E N D E D 3 1 M A R C H 2 0 1 6
NOTES TO THE ANNUAL FINANCIAL STATEMENTS
INTEGRATED ANNUAL REPORT 2015-2016
5.2 Financial risk management objectives (continued)
g. KWSAPFixed vs. variable rate loansThe ratio of fixed to floating debt as at 31 March 2016 was 79% (2015: 84%) fixed and 21% (2015:16%) floating.
2016 2015Borrowings
at fixed rates
Borrowings at variable
rates
Fixed rate borrowings
as % of total debt
book
Variable rate
borrowings as % of
total debt book
Borrowings at fixed
rates
Borrowings at variable
rates
Fixed rate borrowings
as % of total debt
book
Variable rate
borrowings as % of
total debt book
Interest -rate exposure on borrowings R million R million R million R million
Borrowings 992 259 79% 21% 1 001 184 84% 16%
Interest rate sensitivityThe following table illustrates the sensitivity of the net result for the year to a reasonably possible change in interest rates of +100bps and -100bps and +200bps and -200bps, with effect from the beginning of the year. These changes are considered to be reasonably possible based on observation of current market conditions. The calculations are based on KWSAP’s financial instruments held at each reporting date. All other variables are held constant.
2016 2015Sensitivity analysis: Impact on surplus / (deficit) R million R millionFinancial liabilitiesChange in interest rates of -100bps 2 2 Change in interest rates of +100bps (2) (2)Change in interest rates of -200bps 4 4 Change in interest rates of +200bps (4) (4)
Financial assetsChange in interest rates of -100bps - -(1)
Change in interest rates of +100bps - -(1)
Change in interest rates of -200bps (1) (1)Change in interest rates of +200bps 1 1
(1) Where the numbers are reflected as zero, the movements are less than R500 000.
The table above excludes the Tariff receivable.
A change in interest rates will not have an impact on equity (2015: no impact).

175
F O R T H E P E R I O D E N D E D 3 1 M A R C H 2 0 1 6
NOTES TO THE ANNUAL FINANCIAL STATEMENTS
INTEGRATED ANNUAL REPORT 2015-2016
h. BOREHOLEFixed vs. variable rate loansThere are no borrowings in this project for the current and 2015 financial year as this project was funded from the fiscus.
Interest rate sensitivityThe following table illustrates the sensitivity of the net result for the year to a reasonably possible change in interest rates of +100bps and -100bps and +200bps and -200bps, with effect from the beginning of the year. These changes are considered to be reasonably possible based on observation of current market conditions. The calculations are based on Borehole’s financial instruments held at each reporting date. All other variables are held constant.
2016 2015Sensitivity analysis: Impact on surplus / (deficit) R million R millionFinancial assetsChange in interest rates of -100bps - -(1)
Change in interest rates of +100bps - -(1)
Change in interest rates of -200bps - -(1)
Change in interest rates of +200bps - -(1)
(1) Where the numbers are reflected as zero, the movements are less than R500 000.The table above excludes the Tariff receivable.
A change in interest rates will not have an impact on equity (2015: no impact).
i. MMTS-1, UMGENI and KRIELThese projects do not carry interest rate risk as they are being funded from the fiscus.
5.2.4 Refinancing risk Refinancing risk is the possibility that TCTA cannot refinance by borrowing to repay its existing debt. The duration of liabilities can be viewed as the rate at which liabilities will reprice when refinanced. In terms of duration analysis, liabilities with short duration stand to gain by repricing at lower levels on refinancing date in a downward trending environment. But, since managing interest rate risk is more complex than increasing or decreasing the duration mismatch, duration matching is used as a guiding principle. In TCTA, duration is used in conjunction with other interest rate risk mitigation measures such as the sensitivity of the debt curve to changes in the capital structure, water demand, inflation and interest rates.

176
F O R T H E P E R I O D E N D E D 3 1 M A R C H 2 0 1 6
NOTES TO THE ANNUAL FINANCIAL STATEMENTS
INTEGRATED ANNUAL REPORT 2015-2016
5.2 Financial risk management objectives (continued)
a. VRS / LHWPThe table below shows the duration of bonds issued by TCTA as at 31 March :The following table details the bonds for VRS (2015: LHWP had bonds as shown below and AMD did not have any bonds).
2016 Maturity Amount issued
Duration
Bonds Date R million YearsWS04* 30/05/2016 652 0,15WS05 01/08/2018 3 525 2,21WSP2 28/05/2017 2 270 1,08WSP3 28/05/2019 41 2,72WSP4 28/05/2020 97 3,44WSP5* 28/05/2021 9 499 4,09
16 084 3,09
2015 Maturity Amount issued
Duration
Bonds Date R million YearsWS04 30/05/2016 4 900 1,06WS05 01/08/2018 3 525 3,09WSP1 28/05/2015 115 0,14WSP2 28/05/2017 2 436 1,94WSP3 28/05/2019 41 3,46WSP4 28/05/2020 97 4,13WSP5 28/05/2021 5 083 4,74
16 197 2,81
* The movement is due to switch auctions of WS04 bonds into WSP5 bonds.
b. BWPAs at 31 March 2016 BWP had no term paper and no call paper in issue (2015: R100 million term paper and R18 million call paper).
c. VRESAPAs at 31 March 2016 VRESAP had R200 million term paper and R10 million call paper in issue (2015: R219.4 million term paper and R9 million call paper).
d. MMTS-2As at 31 March 2016, MMTS-2 had R116 million term paper and no call paper in issue (2015: R142 million term paper and no call paper).
e. KWSAPAs at 31 March 2016, KWSAP had no term paper and no call paper in issue (2015: no term paper and no call paper).
There is no commercial paper programme for MCWAP, ORWRDP, Borehole, AMD, MMTS-1, Umgeni and Kriel.

177
F O R T H E P E R I O D E N D E D 3 1 M A R C H 2 0 1 6
NOTES TO THE ANNUAL FINANCIAL STATEMENTS
INTEGRATED ANNUAL REPORT 2015-2016
6 PROPERTY, PLANT AND EQUIPMENT
6.1 Carrying amounts of property, plant and equipment
6.1.1 VRS / LHWP 2016 2015R million R million
Plant and equipmentOffice furniture 2 2 Computer equipment - -Networking equipment - -Office equipment 2 -Computer software - 1 Motor vehicles - -Video conferencing equipment - -Leasehold improvements 8 10 Equipment under finance lease - -Balance at 31 March 12 13

178
F O R T H E P E R I O D E N D E D 3 1 M A R C H 2 0 1 6
NOTES TO THE ANNUAL FINANCIAL STATEMENTS
INTEGRATED ANNUAL REPORT 2015-2016
6.2
6.2.1
Cost reconciliation
VRS / LHWP
Office furniture
Computer equipment
Networking equipment
Office equipment
Computer software
Motor vehicles Video conferencing
equipment
Leasehold improvements
Equipment under finance
lease at cost
Total
Cost R million R million R million R million R million R million R million R million R million R million
Balance at 31 March 2014 4 6 10 4 16 1 2 17 2 62
During the year:Additions - - - - 1 - - - - 1 Disposals - - - - - - - - - -
Balance at 31 March 2015 4 6 10 4 17 1 2 17 2 63
During the year:Additions 1 - - 2 - - - 1 - 4 Disposals - - - - - - - - - -
Balance at 31 March 2016 5 6 10 6 17 1 2 18 2 67
6.3
6.3.1
Accumulated depreciation reconciliation
VRS / LHWP
Office furniture
Computer equipment
Networking equipment
Office equipment
Computer software
Motor vehicles Video conferencing
equipment
Leasehold improvements
Equipment under finance
lease at cost
Total
Accumulatd depreciation R million R million R million R million R million R million R million R million R million R million
Balance at 31 March 2014 (1) (5) (9) (2) (14) (1) (2) (3) (2) (39)
During the year:Accumulated depreciation eliminated on disposal
- - - - - - - - - -
Depreciation expense for the year (1) (1) (1) (2) (2) - - (4) - (11)
Balance at 31 March 2015 (2) (6) (10) (4) (16) (1) (2) (7) (2) (50)
During the year:Accumulated depreciation eliminated on disposal
- - - - - - - - - -
Depreciation expense for the year (1) - - - (1) - - (3) - (5)
Balance at 31 March 2016 (3) (6) (10) (4) (17) (1) (2) (10) (2) (55)

179
F O R T H E P E R I O D E N D E D 3 1 M A R C H 2 0 1 6
NOTES TO THE ANNUAL FINANCIAL STATEMENTS
INTEGRATED ANNUAL REPORT 2015-2016
6.2
6.2.1
Cost reconciliation
VRS / LHWP
Office furniture
Computer equipment
Networking equipment
Office equipment
Computer software
Motor vehicles Video conferencing
equipment
Leasehold improvements
Equipment under finance
lease at cost
Total
Cost R million R million R million R million R million R million R million R million R million R million
Balance at 31 March 2014 4 6 10 4 16 1 2 17 2 62
During the year:Additions - - - - 1 - - - - 1 Disposals - - - - - - - - - -
Balance at 31 March 2015 4 6 10 4 17 1 2 17 2 63
During the year:Additions 1 - - 2 - - - 1 - 4 Disposals - - - - - - - - - -
Balance at 31 March 2016 5 6 10 6 17 1 2 18 2 67
6.3
6.3.1
Accumulated depreciation reconciliation
VRS / LHWP
Office furniture
Computer equipment
Networking equipment
Office equipment
Computer software
Motor vehicles Video conferencing
equipment
Leasehold improvements
Equipment under finance
lease at cost
Total
Accumulatd depreciation R million R million R million R million R million R million R million R million R million R million
Balance at 31 March 2014 (1) (5) (9) (2) (14) (1) (2) (3) (2) (39)
During the year:Accumulated depreciation eliminated on disposal
- - - - - - - - - -
Depreciation expense for the year (1) (1) (1) (2) (2) - - (4) - (11)
Balance at 31 March 2015 (2) (6) (10) (4) (16) (1) (2) (7) (2) (50)
During the year:Accumulated depreciation eliminated on disposal
- - - - - - - - - -
Depreciation expense for the year (1) - - - (1) - - (3) - (5)
Balance at 31 March 2016 (3) (6) (10) (4) (17) (1) (2) (10) (2) (55)

180
F O R T H E P E R I O D E N D E D 3 1 M A R C H 2 0 1 6
NOTES TO THE ANNUAL FINANCIAL STATEMENTS
INTEGRATED ANNUAL REPORT 2015-2016
7 FINANCIAL INSTRUMENTS
7.1 Financial instruments by category
The accounting policies for financial instruments have been applied to the line items below:
The carrying values of financial assets and liabilities not carried at fair value approximate their respective fair values.
7.1.1 Accounting classifications of financial assets
Financial assets as per statement of financial position at 31 March 2016
2016 Carrying amount Total carrying amountAt fair value
through profit or loss
Financial assets at amortised
costFinancial assets Note R million R million R millionFinancial assets not measured at fair valueNon-current financial assetsTariff receivable 7.4 - 24 929 24 929
Financial market investments 7.5 - - - JIBAR-linked investments - - -
Current financial assetsTariff receivable 7.4 - 751 751 Loans and other receivables 8 - 86 86
Financial market investments 7.5 - 4 705 4 705 Fixed term investments and investments on
call - 4 705 4 705
Repo borrowings - - -
Cash and cash equivalents 13 - 1 1
Total financial assets - 30 472 30 472
Current/ Non-current financial assets - 30 472 30 472 Non-current - 24 929 24 929 Current - 5 543 5 543

181
F O R T H E P E R I O D E N D E D 3 1 M A R C H 2 0 1 6
NOTES TO THE ANNUAL FINANCIAL STATEMENTS
INTEGRATED ANNUAL REPORT 2015-2016
Financial assets as per statement of financial position at 31 March 2015
2015 Carrying amount Total carrying amountAt fair value
through profit or loss
Financial assets at amortised
costFinancial assets Note R million R million R millionFinancial assets not measured at fair valueNon-current financial assetsTariff receivable 7.4 - 23 104 23 104
Financial market investments 7.5 - 306 306 JIBAR-linked investments - 306 306
Current financial assetsTariff receivable 7.4 - 3 352 3 352 Loans and other receivables 8 - 2 320 2 320
Financial market investments 7.5 - 3 705 3 705 Fixed term investments and investments on
call - 3 514 3 514
Repo borrowings - 191 191
Cash and cash equivalents 13 - - -
Total financial assets - 32 787 32 787
Current/ Non-current financial assets - 32 787 32 787 Non-current - 23 410 23 410 Current - 9 377 9 377

182
F O R T H E P E R I O D E N D E D 3 1 M A R C H 2 0 1 6
NOTES TO THE ANNUAL FINANCIAL STATEMENTS
INTEGRATED ANNUAL REPORT 2015-2016
7.1.2 Accounting classifications of financial liabilitiesLiabilities per statement of financial position at 31 March 2016
2016 Carrying amount Total carrying amountAt fair value
through profit or loss
Other financial liabilities
Financial liabilities Note R million R million R millionFinancial liabilities measured at fair valueCurrent financial liabilities 7.6.2Derivative financial instruments 7.11 3 - 3
Total financial liabilities measured at fair value 3 - 3
Financial liabilities not measured at fair valueNon-current financial liabilitiesLocal debt 7.6.3 Bonds - 18 488 18 488 CPI-linked bonds - 6 612 6 612 Other bonds - 11 876 11 876
Other borrowings Other borrowings by TCTA - 8 349 8 349 Fixed rate loans - 6 020 6 020 Variable rate loans - 2 030 2 030 CPI rate loans - 299 299
Other commitments (LHDA) - 56 56 Fixed rate loans - 38 38 Variable rate loans - 18 18
Foreign loans 7.6.3 Other commitments (LHDA) - 15 15
Current financial liabilities 7.6.2Local debt 7.6.3 Bonds - 652 652 CPI-linked bonds - - - Other bonds - 652 652
Other borrowings 7.6.2 Other borrowings by TCTA - 844 844 Fixed rate loans - 311 311 Variable rate loans - 524 524 CPI rate loans - 9 9
Other commitments (LHDA) - 22 22 Fixed rate loans - 7 7 Variable rate loans - 15 15
7.1 Financial instruments by category (continued)

183
F O R T H E P E R I O D E N D E D 3 1 M A R C H 2 0 1 6
NOTES TO THE ANNUAL FINANCIAL STATEMENTS
INTEGRATED ANNUAL REPORT 2015-2016
2016 Carrying amount Total carrying amountAt fair value
through profit or loss
Other financial liabilities
Financial liabilities Note R million R million R millionForeign loans 7.6.2 Other commitments (LHDA) - 14 14
Total financial market liabilities not measured at fair value
- 28 440 28 440
Trade and other payables - 1 451 1 451
Total financial liabilities 3 29 891 29 894
Current/ Non-current financial liabilities 3 29 891 29 894 Non-current - 26 908 26 908 Current 3 2 983 2 986
2015 Carrying amount Total carrying amountAt fair value
through profit or loss
Other financial liabilities
Financial liabilities Note R million R million R millionFinancial liabilities measured at fair valueCurrent financial liabilities 7.6.2Derivative financial instruments 7.11 - - -
Total financial liabilities measured at fair value - - -
Financial liabilities not measured at fair valueNon-current financial liabilities 7.6.3Local debt 7.6.3 Bonds - 18 804 18 804 CPI-linked bonds - 6 116 6 116 Other bonds - 12 688 12 688
Other borrowings 7.6.3 Other borrowings by TCTA - 7 957 7 957 Fixed rate loans - 6 056 6 056 Variable rate loans - 1 601 1 601 CPI rate loans - 300 300
Other commitments (LHDA) - 77 77 Fixed rate loans - 45 45 Variable rate loans - 32 32

184
F O R T H E P E R I O D E N D E D 3 1 M A R C H 2 0 1 6
NOTES TO THE ANNUAL FINANCIAL STATEMENTS
INTEGRATED ANNUAL REPORT 2015-2016
2015 Carrying amount Total carrying amountAt fair value
through profit or loss
Other financial liabilities
Financial liabilities Note R million R million R millionForeign loans 7.6.3 Other commitments (LHDA) - 23 23
Current financial liabilities 7.6.2Local debt 7.6.3 Bonds - 115 115 CPI-linked bonds - - - Other bonds - 115 115
Other borrowings 7.6.2 Other borrowings by TCTA - 872 872 Fixed rate loans - 260 260 Variable rate loans - 604 604 CPI rate loans - 8 8
Other commitments (LHDA) - 22 22 Fixed rate loans - 7 7 Variable rate loans - 15 15
Foreign loans 7.6.2 Other commitments (LHDA) - 11 11
Total financial market liabilities not measured at fair value
- 27 881 27 881
Trade and other payables - 2 618 2 618
Total financial liabilities - 30 499 30 499
Current/ Non-current financial liabilities - 30 499 30 499 Non-current - 26 861 26 861 Current - 3 638 3 638
7.1 Financial instruments by category (continued)

185
F O R T H E P E R I O D E N D E D 3 1 M A R C H 2 0 1 6
NOTES TO THE ANNUAL FINANCIAL STATEMENTS
INTEGRATED ANNUAL REPORT 2015-2016
7.2 Significance of financial instruments
7.2.1 Financial assetsDetails on the components of the Tariff receivable are in Note 7.4.The interest earned on the Tariff receivable to compensate for the time value of money, is disclosed as “Finance Income” on the Statement of Performance and details provided in Note 17.1.
7.2.2 Financial liabilitiesThe most significant Financial liability is the bonds issued by TCTA. Note 7.9 provides detail on the respective redemption dates , the interest rate, the value of the issued bonds. Interest is paid semi-annually to bond holders.
7.3 Fair value measurement
Fair value is the price that would be received to sell an asset or paid to transfer a liability in an orderly transaction between market participants at the measurement date. As part of the disclosure requirements for fair value measurements, TCTA classifies fair value measurements using a ‘fair value hierarchy’ that reflects the significance of the inputs used in making the measurements.
Fair value measurements are categorised into a three-level hierarchy, based on the type of inputs to the valuation techniques used, as follows:• Level1 inputs are quoted prices in active markets for items identical to the asset or liability being measured;• Level 2 inputs are other observable inputs other than quoted market prices included in level 1 that are
observable either directly or indirectly; and• Level 3 inputs are unobservable inputs which management has developed to reflect the assumptions that
market participants would use when determining an appropriate price for the asset or liability.
The categorisation of the fair value measurement into one of the three different levels is determined on the basis of the lowest level input that is significant to the fair value measurement in its entirety. The significance of an input is assessed against the fair value measurement in its entirety. Assessing the significance of a particular input to the fair value measurement in its entirety requires judgement, considering factors specific to the asset or liability.
The carrying value of financial assets and liabilities not carried at fair value approximate their respective fair values, except for the bonds issued by LHWP. Disclosed in note 7.3.1.
There have been no transfers between level 1 and level 2 during the year.

186
F O R T H E P E R I O D E N D E D 3 1 M A R C H 2 0 1 6
NOTES TO THE ANNUAL FINANCIAL STATEMENTS
INTEGRATED ANNUAL REPORT 2015-2016
7.3.1 Financial liabilities The fair value of financial liabilities for disclosure purposes is estimated by discounting the contractual future cash flows at the current market interest rate that is available to TCTA for similar financial instruments.
PROJECT 2016
R million
2015
R million
Fair value hierarchy
Valuation technique(s) and key input(s)
Significant unobservable
inputs (1)
Relations of unobservable
inputs to fair value (1)
7.3.1.1 CPI- linked bonds
Level 1 Not applicable Not applicable
Not applicable
VRS 8 649 8 284 LHWP - 8 284
7.3.1.2 Other bondsVRS 12 833 13 653 Level 1 Not applicable Not
applicableNot applicable
LHWP - 13 653
7.3.1.3 Forward exchange contractsVRS 3 - Level 2 • Discounted Cash Flow
method is utilised. o Future Cash flows are estimated based on forward exchange rates (from observable forward exchange rates at the end of the reporting period) and contract forward rates, discounted at a rate that reflects the credit risk of various counterparties. • These are quoted amounts Fair value is the current mark-to-market value of all the derivatives at the reporting date.
Not applicable
Not applicable
LHWP - -
Total financial liabilities at fair value 21 485 21 937
7.3 Fair value measurement (continued)

187
F O R T H E P E R I O D E N D E D 3 1 M A R C H 2 0 1 6
NOTES TO THE ANNUAL FINANCIAL STATEMENTS
INTEGRATED ANNUAL REPORT 2015-2016
7.4 Tariff receivables
7.4.1 Totals 2016 2015Long Term Short term Tariff
receivableLong Term Short term Tariff
receivablePROJECT R million R million R million R million R million R millionVRS 17 442 - 17 442 15 763 2 723 18 486 LHWP - - - 15 763 2 723 18 486 AMD - - - - - - BWP 607 193 800 727 186 913 VRESAP 3 532 383 3 915 3 546 354 3 900 MCWAP 836 - 836 874 - 874 MMTS-2 1 467 72 1 539 1 323 - 1 323 KWSAP 1 045 103 1 148 871 89 960 KRIEL - - - - TOTAL 24 929 751 25 680 23 104 3 352 26 456

188
F O R T H E P E R I O D E N D E D 3 1 M A R C H 2 0 1 6
NOTES TO THE ANNUAL FINANCIAL STATEMENTS
INTEGRATED ANNUAL REPORT 2015-2016
7.4.2 Reconciliation of movements in the tariff receivableThe Tariff receivable arises as the contra to the construction revenue earned in each project, and is measured at amortised cost using the effective interest method.
Opening Balance 1
April 2015
Construction revenue earned
Other income
Tariffs or transfers received
from DWS
Interest income
earned on the Tariff
receivable
Imputed interest on
the Tariff receivable (1)
Closing Balance
31 March 2016
2016 R million R million R million R million R million R million R million VRS (3) 18 486 1 078 997 (3 216) 881 (784) 17 442 BWP 913 - 5 (203) 91 ( 6) 800 VRESAP 3 900 13 6 (426) 383 39 3 915 MCWAP (2) 874 172 - (196) 114 (128) 836 MMTS-2 1 323 260 - (216) 123 49 1 539 KWSAP 960 3 5 (117) 101 196 1 148
Total 26 456 1 526 1 013 (4 374) 1 693 (634) 25 680
Opening Balance 1
April 2014
Construction revenue earned
Other income
Tariffs or transfers received
from DWS
Interest income
earned on the Tariff
receivable
Imputed interest on
the Tariff receivable (1)
Closing Balance
31 March 2015
2015 R million R million R million R million R million R million R million VRS 20 368 29 785 (3 558) 971 (109) 18 486 LHWP 20 368 29 785 (3 558) 971 (109) 18 486 AMD - - - - - - - BWP 960 - 4 (187) 96 40 913 VRESAP 3 788 2 6 (327) 373 58 3 900 MCWAP (2) 469 171 - - 61 173 874 MMTS-2 442 411 - (162) 41 591 1 323 KWSAP 966 8 4 (110) 101 (9) 960
Total 26 993 621 799 (4 343) 1 643 744 26 456
(1 ) TCTA revises its estimates of payments or receipts on an annual basis, then adjusts the carrying amount of the Tariff receivable to reflect actual and revised estimated cash flows. TCTA recalculates the carrying amount by computing the present value of estimated future cash flows at the Tariff receivables’ original effective interest rate for each project. The adjustment is recognised in net finance cost.(2) MCWAP is partially funded from the fiscus.(3) Included in the VRS “imputed interest on tariff receivable” amount is a loss of R784 million on the re-recognition of the tariff in the current year.
7.4 Tariff receivables (continued)

189
F O R T H E P E R I O D E N D E D 3 1 M A R C H 2 0 1 6
NOTES TO THE ANNUAL FINANCIAL STATEMENTS
INTEGRATED ANNUAL REPORT 2015-2016
7.4.2.1 Credit quality of financial assets that are neither past due nor impairedThe bulk of revenue is earned during the time that the project is being constructed, and the costs of construction will match the revenue. All costs incurred will be included in the financial asset against DWS, which will be repaid by DWS through water tariffs or transfers where the project is funded by DWS. After construction there will be operating expenses and finance costs charged against the income statement, and finance income earned from unwinding the financial assets, and income earned from DWS paying TCTA for the administrative expenses. The revenue earned from DWS then gives rise to TCTA having a right to receive money from DWS (to pay the costs incurred) which is recognised as a financial asset. The Tariff receivable amounts are neither past due nor impaired.
ORWRDP, BOREHOLE, AMD and MMTS-1 are funded from the fiscus. The customer is the Department of Water and Sanitation and the credit risk is deemed limited even though DWS is the sole customer.
7.5 Financial assets: current versus non-current2016 2015
Financial market investments Current Non-current Current Non-currentR million R million R million R million
VRS 4 031 - 3 045 306 LHWP - - 2 980 306 AMD - - 65 - BWP (1) 43 - 109 - VRESAP (1) 72 - 22 - MCWAP (1) 46 - 169 - MMTS-2 (1) 372 - 162 - ORWRDP (1) 52 - 190 - KWSAP (1) 89 - 7 - Borehole (1) - - 1 - Balance on statement of financial position 4 705 - 3 705 306
7.5.1 Balances per projectThe following are the total current and non-current financial assets disclosed on the statement of financial position.
2016 2015Current Non-current Current Non-current
R million R million R million R millionVRS 4 073 17 442 7 732 16 069 LHWP - - 6 698 16 069 AMD (1) - - 1 034 - BWP 236 607 295 727 VRESAP 455 3 532 376 3 546 MCWAP 46 836 169 874 MMTS-2 444 1 467 195 1 323 ORWRDP (1) 71 - 450 - KWSAP 192 1 045 96 871 Borehole (1) - - 1 - MMTS-1 (1) - - 2 - UMGENI (1) 8 - 61 - KRIEL (1) 18 - - - Balance on statement of financial position 5 543 24 929 9 377 23 410
(1) There are no non-current financial assets for these projects during the financial periods presented.

190
F O R T H E P E R I O D E N D E D 3 1 M A R C H 2 0 1 6
NOTES TO THE ANNUAL FINANCIAL STATEMENTS
INTEGRATED ANNUAL REPORT 2015-2016
Reconciliation of current and non-current financial assets disclosed on the statement of financial position:
2016 2015 2016 2015Current Non-current
Balances on statement of financial position R million R million R million R millionTariff receivable 751 3 352 24 929 23 104 Loans and other receivables 86 2 320 - - Derivative financial instruments - - - - Financial market investments 4 705 3 705 - 306 Cash and cash equivalents 1 - - -
Total financial assets 5 543 9 377 24 929 23 410
7.5.2 Current financial assets per project2016 2015
Current financial assets R million R million7.5.2.1 VRS / LHWP
VRS: Tariff receivable - 2 723 LHWP: Tariff receivable 2 723 AMD: Tariff receivable -
VRS: Loans and other receivables 41 1 964 LHWP: Loans and other receivables 995 AMD: Loans and other receivables 969
VRS: Derivative financial instruments - - LHWP: Derivative financial instruments - AMD: Derivative financial instruments -
VRS: Financial market investments 4 031 3 045 LHWP: Financial market investments 2 980 AMD: Financial market investments 65
VRS: Cash and cash equivalents 1 - LHWP: Cash and cash equivalents -AMD: Cash and cash equivalents -Total per project 4 073 7 732
7.5.2.2 BWPTariff receivable 193 186 Loans and other receivables - -Financial market investments 43 109 Cash and cash equivalents - -Total per project 236 295
7.5 Financial assets: current versus non-current (continued)

191
F O R T H E P E R I O D E N D E D 3 1 M A R C H 2 0 1 6
NOTES TO THE ANNUAL FINANCIAL STATEMENTS
INTEGRATED ANNUAL REPORT 2015-2016
2016 2015R million R million
7.5.2.3 VRESAPTariff receivable 383 354 Loans and other receivables - -Financial market investments 72 22 Cash and cash equivalents - -Total per project 455 376
7.5.2.4 MCWAPTariff receivable - - Loans and other receivables - - Financial market investments 46 169 Cash and cash equivalents - -Total per project 46 169
7.5.2.5 MMTS-2Tariff receivable 72 - Loans and other receivables - 33 Financial market investments 372 162 Cash and cash equivalents - -Total per project 444 195
7.5.2.6 ORWRDPLoans and other receivables 19 260 Financial market investments 52 190 Cash and cash equivalents - -Total per project 71 450
7.5.2.7 KWSAPTariff receivable 103 89 Loans and other receivables - - Financial market investments 89 7 Cash and cash equivalents - -Total per project 192 96
7.5.2.8 BoreholeLoans and other receivables - -Financial market investments - 1 Cash and cash equivalents - -Total per project - 1
7.5.2.9 MMTS-1Loans and other receivables - 2 Financial market investments - - Total per project - 2

192
F O R T H E P E R I O D E N D E D 3 1 M A R C H 2 0 1 6
NOTES TO THE ANNUAL FINANCIAL STATEMENTS
INTEGRATED ANNUAL REPORT 2015-2016
2016 2015R million R million
7.5.2.10 UMGENILoans and other receivables 8 61 Total per project 8 61
7.5.2.11 KRIELLoans and other receivables 18 - Total per project 18 -
Total current financial assets 5 543 9 377
7.5.3 Non- current financial assets per project
2016 Total non-current
financial assets
2015 Total non-current
financial assets
1 to 5 years >5 years 1 to 5 years >5 years
Non-current financial assets R million R million R million R million R million R million7.5.3.1 VRS / LHWP
VRS: Tariff receivable - 17 442 17 442 5 978 9 785 15 763 LHWP: Tariff receivable - - - 5 978 9 785 15 763 AMD: Tariff receivable - - - - - - Financial market investments - - - 306 - 306 Total per project - 17 442 17 442 6 284 9 785 16 069
7.5.3.2 BWPTariff receivable 247 360 607 351 376 727 Total per project 247 360 607 351 376 727
7.5.3.3 VRESAPTariff receivable 26 3 506 3 532 - 3 546 3 546 Total per project 26 3 506 3 532 - 3 546 3 546
7.5.3.4 MCWAPTariff receivable - 836 836 - 874 874 Total per project - 836 836 - 874 874
7.5.3.5 MMTS-2Tariff receivable - 1 467 1 467 - 1 323 1 323 Total per project - 1 467 1 467 - 1 323 1 323
7.5.3.6 KWSAPTariff receivable - 1 045 1 045 - 871 871 Total per project - 1 045 1 045 - 871 871
Total non-current financial assets
273 24 656 24 929 6 635 16 775 23 410
7.5 Financial assets: current versus non-current (continued)

193
F O R T H E P E R I O D E N D E D 3 1 M A R C H 2 0 1 6
NOTES TO THE ANNUAL FINANCIAL STATEMENTS
INTEGRATED ANNUAL REPORT 2015-2016
7.6 Financial liabilities: current versus non-current
7.6.1 Totals
2016 2015Current Non-current Current Non-current
Project R million R million R million R millionVRS 1 984 18 673 2 073 18 983 LHWP - - 924 18 983 AMD (1) - - 1 149 - BWP 83 770 199 847 VRESAP 431 3 422 423 3 426 MCWAP 65 1 187 60 1 193 MMTS-2 284 1 627 331 1 244 ORWRDP (1) 72 - 469 - KWSAP 45 1 229 21 1 168 Borehole (1) - - - - MMTS-1 (1) - - 2 - UMGENI (1) 4 - 60 - KRIEL (1) 18 - - - Balance on statement of financial position 2 986 26 908 3 638 26 861
(1) There are no non-current financial liabilities for these projects during the financial periods presented.
Reconciliation of current and non-current financial liabilities disclosed on the statement of financial position:
2016 2015 2016 2015Current Non-current
Balances on statement of financial position R million R million R million R millionFinancial market liabilities 1 532 1 020 26 908 26 861 Derivative financial instruments 3 - - -Trade and other payables 1 451 2 618 - -
Total financial liabilities 2 986 3 638 26 908 26 861

194
F O R T H E P E R I O D E N D E D 3 1 M A R C H 2 0 1 6
NOTES TO THE ANNUAL FINANCIAL STATEMENTS
INTEGRATED ANNUAL REPORT 2015-2016
7.6.2 Current financial market liabilities
2016 2015Project R million R millionA: Financial liabilities measured at fair value
7.6.2.1 VRS / LHWPVRS: Derivative financial instruments 3 -LHWP: Derivative financial instruments - -AMD: Derivative financial instruments - -Total financial liabilities measured at fair value 3 -
B: Financial liabilities not measured at fair value
Other borrowingsVRS: Other borrowings by TCTA 819 231 LHWP: Other borrowings by TCTA - 231 AMD: Other borrowings by TCTA - -
VRS: Other commitments (LHDA) 22 22 LHWP: Other commitments (LHDA) - 22 AMD: Other commitments (LHDA) - -
Foreign loansVRS: Other commitments (LHDA) 14 11 LHWP: Other commitments (LHDA) - 11 AMD: Other commitments (LHDA) - -
VRS: Trade and other payables 1 126 1 809 LHWP: Trade and other payables - 660 AMD: Trade and other payables - 1 149
Total per project 1 981 2 073
7.6.2.2 BWPBorrowings 77 193 Trade and other payables 6 6 Total per project 83 199
7.6.2.3 VRESAPBorrowings 376 381 Trade and other payables 55 42 Total per project 431 423
7.6.2.4 MCWAPBorrowings 12 8 Trade and other payables 53 52 Total per project 65 60
7.6 Financial liabilities: current versus non-current (continued)

195
F O R T H E P E R I O D E N D E D 3 1 M A R C H 2 0 1 6
NOTES TO THE ANNUAL FINANCIAL STATEMENTS
INTEGRATED ANNUAL REPORT 2015-2016
2016 2015Project R million R million
7.6.2.5 MMTS-2Borrowings 189 157 Trade and other payables 95 174 Total per project 284 331
7.6.2.6 ORWRDPBorrowings - - Trade and other payables 72 469 Total per project 72 469
7.6.2.7 KWSAPBorrowings 23 17 Trade and other payables 22 4 Total per project 45 21
7.6.2.8 BoreholeBorrowings - - Trade and other payables - -Total per project - -
7.6.2.9 MMTS-1Borrowings - - Trade and other payables - 2 Total per project - 2
7.6.2.10 UMGENITrade and other payables 4 60 Total per project 4 60
7.6.2.11 KRIELTrade and other payables 18 - Total per project 18 -
Total financial liabilities not measured at fair value 2 983 3 638
Total current financial liabilities 2 986 3 638

196
F O R T H E P E R I O D E N D E D 3 1 M A R C H 2 0 1 6
NOTES TO THE ANNUAL FINANCIAL STATEMENTS
INTEGRATED ANNUAL REPORT 2015-2016
7.6.3 Non-current financial liabilities
2016 2015(1 to 5 years)
(5 to 10 years)
Total non-current
financial liabilities
(1 to 5 years)
(5 to 10 years)
Total non-current
financial liabilities
Project R million R million R million R million R million R millionFinancial liabilities not measured at fair value
7.6.3.1 VRS / LHWPLocal debtVRS: Bonds 9 020 9 469 18 489 13 567 5 237 18 804 LHWP: Bonds - - - 13 567 5 237 18 804 AMD: Bonds - - - - - -
Other borrowingsVRS: Other borrowings by TCTA 114 - 114 79 - 79 LHWP: Other borrowings by TCTA 79 - 79 AMD: Other borrowings by TCTA - - -
VRS: Other commitments (LHDA) 47 8 55 61 16 77 LHWP: Other commitments (LHDA) - - - 61 16 77 AMD: Other commitments (LHDA) - - - - - -
Foreign loansVRS: Other commitments (LHDA) 15 - 15 23 - 23 LHWP: Other commitments (LHDA) - - - 23 - 23 AMD: Other commitments (LHDA) - - - - - -
Total per project 9 196 9 477 18 673 13 730 5 253 18 983
7.6.3.2 BWPBorrowings 309 461 770 309 538 847 Total per project 309 461 770 309 538 847
7.6.3.3 VRESAPBorrowings 769 2 653 3 422 725 2 701 3 426 Total per project 769 2 653 3 422 725 2 701 3 426
7.6.3.4 MCWAPBorrowings 104 1 083 1 187 80 1 113 1 193 Total per project 104 1 083 1 187 80 1 113 1 193
7.6.3.5 MMTS-2Borrowings 354 1 273 1 627 228 1 016 1 244 Total per project 354 1 273 1 627 228 1 016 1 244
7.6 Financial liabilities: current versus non-current (continued)

197
F O R T H E P E R I O D E N D E D 3 1 M A R C H 2 0 1 6
NOTES TO THE ANNUAL FINANCIAL STATEMENTS
INTEGRATED ANNUAL REPORT 2015-2016
2016 2015(1 to 5 years)
(5 to 10 years)
Total non-current
financial liabilities
(1 to 5 years)
(5 to 10 years)
Total non-current
financial liabilities
Project R million R million R million R million R million R million7.6.3.6 KWSAP
Borrowings 118 1 111 1 229 102 1 066 1 168 Total per project 118 1 111 1 229 102 1 066 1 168
Total financial liabilities not measured at fair value
10 850 16 058 26 908 15 175 11 687 26 861
7.7 Interest rates
2016 2015Project % %VRS / LHWP
Loans bare effective interest at rates ranging from *5.0 to 20.8 *4.3 to 20.7TCTA funded at a weighted average rate of 9,74 10,01 Project funded at a weighted average rate of 9,72 10,06
* The interest rate applicable to one of the development funding foreign loans is 3.0%. This is a Euro loan facility drawn as ZAR funding. The 20.8% relates to a EIB loan, valued at spot at R30 million (2015: R34 million). The interest rate applicable to this loan is 3.0%, however, due to forward exchange contract costs, the overall effective interest rate on this loan amounts to 20.8% (2015: 20.7%).
The project funded at a weighted average rate of:
2016 2015Project % %BWP 8,42 8,08 VRESAP 9,55 9,47 MMTS-2 9,30 8,33 KWSAP 9,51 9,71 MCWAP 9,39 9,46
ORWRDP and MMTS-1 are funded from the fiscus and the weighted average cost of capital is therefore not applicable.

198
F O R T H E P E R I O D E N D E D 3 1 M A R C H 2 0 1 6
NOTES TO THE ANNUAL FINANCIAL STATEMENTS
INTEGRATED ANNUAL REPORT 2015-2016
7.8 Exchange rates (closing rates)
The following are exchange rates utilised by TCTA as at 31 March:
2016 2015Bid Offer Bid Offer
Foreign currency Rand Rand Rand RandEuros 16,771 16,828 13,024 13,029
7.9 Bonds
TCTA is the legal issuer of the following LHWP local registered bonds:
Loan No
Type Redemption date
Interest rate Authorised Nominal/ capital
indexed issued
nominal/ principal
valueR million R million
WS04 Nominal 30/05/2016 12,50% 4 231 652WS05 Inflation
indexed01/08/2018 5,00% 7 000 * 7 876
WSP2 Nominal 28/05/2017 9,00% 2 270 ** 2 270WSP3 Nominal 28/05/2019 9,00% 1 000 41WSP4 Nominal 28/05/2020 9,00% 1 000 97WSP5 Nominal 28/05/2021 9,00% 9 499 ** 9 499
* Inflation indexed bond reflected at CPI value. ** The limit for WSP2 and WSP5 are offset by the available limit on the WS04 bonds as approved by the ALCO as at 25 November 2010.
2016 2015Fair value Nominal
valueFair value Nominal
valueValue of bonds R million R million R million R millionAuthorised 29 500 29 500
Issued 21 483* 19 140** 22 056* 18 919**
Unrealised premium to be amortised over the life of the loan
206 343
Unrealised discount to be amortised over the life of the loan
(117) (44)
Unrealised amortisation of CPI upliftment for WS05
(1 382) (1 536)
* The fair value of the locally registered bonds issued is measured at the market price at financial year-end.** The amounts in issue may not exceed the consolidated capital market guarantee of R21 billion.

199
F O R T H E P E R I O D E N D E D 3 1 M A R C H 2 0 1 6
NOTES TO THE ANNUAL FINANCIAL STATEMENTS
INTEGRATED ANNUAL REPORT 2015-2016
7.10 Offsetting financial assets and financial liabilities
TCTA enters into derivative transactions under International Swaps and Derivatives Association (ISDA) master netting agreements. These agreements generally allows the aggregation of all transactions in a single net amount for amounts in the same currency, owed by each counterparty on a single day, to be paid by the one party to the other. Derivative agreements are settled net in terms of these ISDA agreements. International Securities Market Association (ISMA) netting agreements govern net settlement between counterparties in relation to certain capital market transactions and balances owing, such as repurchase agreements and are therefore not netted off in the statement of financial position. The right to offset is enforceable on the occurrence of future events such as default on loan agreements or other credit events.
The following table sets out the carrying amounts of recognised financial instruments that are subject to the ISDA agreements.

200
F O R T H E P E R I O D E N D E D 3 1 M A R C H 2 0 1 6
NOTES TO THE ANNUAL FINANCIAL STATEMENTS
INTEGRATED ANNUAL REPORT 2015-2016
7.10.1 Financial assets/ (liabilities)subject to offsetting, enforceable master netting arrangements and similar agreements
2016 Gross amounts of recognised
financial assets/ (liabilities) (A)
Gross amounts of recognised
financial assets / (liabilities) set off
in the statement of financial position (B)
Net amounts of financial assets /
(liabilities) presented in the statement of
financial position (C-A-B)
Related amounts not set off in the statement of financial position (D) Amounts not subject to enforceable netting
arrangements (1)
Total per statement of financial position (2)
(D)(i), (D)(ii)Financial instruments
(D)(ii)Cash collateral received
Net amount (E)=(C)-(D)
Description R million R million R million R million R million R million R million R million
Derivatives (3) (3) - - - - (3)Reverse repurchase, securities borrowing and similar agreements
- - - - - - -
Other financial instruments - - - - - - -
Total (3) (3) (3)
2015 Gross amounts of recognised
financial assets/ (liabilities) (A)
Gross amounts of recognised
financial assets / (liabilities) set off
in the statement of financial position (B)
Net amounts of financial assets /
(liabilities) presented in the statement of
financial position (C-A-B)
Related amounts not set off in the statement of financial position (D) Amounts not subject to enforceable netting
arrangements (1)
Total per statement of financial position (2)
(D)(i), (D)(ii)Financial instruments
(D)(ii)Cash collateral received
Net amount (E)=(C)-(D)
Description R million R million R million R million R million R million R million R million
Derivatives - - - - - - - - Reverse repurchase, securities borrowing and similar agreements
164 - 164 - - - 26 190
Other financial instruments - - - - - - - -
Total 164 - 164 - - - 26 190
(1) This relates to amounts that are not subject to legally enforceable netting arrangements.(2) Total per statement of financial position is the sum of “Net amounts of financial assets / (liabilities) presented in the statement of financial position” and which are subject to enforceable netting arrangements and “Amounts not subject to enforceable netting arrangements“.

201
F O R T H E P E R I O D E N D E D 3 1 M A R C H 2 0 1 6
NOTES TO THE ANNUAL FINANCIAL STATEMENTS
INTEGRATED ANNUAL REPORT 2015-2016
7.10.1 Financial assets/ (liabilities)subject to offsetting, enforceable master netting arrangements and similar agreements
2016 Gross amounts of recognised
financial assets/ (liabilities) (A)
Gross amounts of recognised
financial assets / (liabilities) set off
in the statement of financial position (B)
Net amounts of financial assets /
(liabilities) presented in the statement of
financial position (C-A-B)
Related amounts not set off in the statement of financial position (D) Amounts not subject to enforceable netting
arrangements (1)
Total per statement of financial position (2)
(D)(i), (D)(ii)Financial instruments
(D)(ii)Cash collateral received
Net amount (E)=(C)-(D)
Description R million R million R million R million R million R million R million R million
Derivatives (3) (3) - - - - (3)Reverse repurchase, securities borrowing and similar agreements
- - - - - - -
Other financial instruments - - - - - - -
Total (3) (3) (3)
2015 Gross amounts of recognised
financial assets/ (liabilities) (A)
Gross amounts of recognised
financial assets / (liabilities) set off
in the statement of financial position (B)
Net amounts of financial assets /
(liabilities) presented in the statement of
financial position (C-A-B)
Related amounts not set off in the statement of financial position (D) Amounts not subject to enforceable netting
arrangements (1)
Total per statement of financial position (2)
(D)(i), (D)(ii)Financial instruments
(D)(ii)Cash collateral received
Net amount (E)=(C)-(D)
Description R million R million R million R million R million R million R million R million
Derivatives - - - - - - - - Reverse repurchase, securities borrowing and similar agreements
164 - 164 - - - 26 190
Other financial instruments - - - - - - - -
Total 164 - 164 - - - 26 190
(1) This relates to amounts that are not subject to legally enforceable netting arrangements.(2) Total per statement of financial position is the sum of “Net amounts of financial assets / (liabilities) presented in the statement of financial position” and which are subject to enforceable netting arrangements and “Amounts not subject to enforceable netting arrangements“.

202
F O R T H E P E R I O D E N D E D 3 1 M A R C H 2 0 1 6
NOTES TO THE ANNUAL FINANCIAL STATEMENTS
INTEGRATED ANNUAL REPORT 2015-2016
7.11 Derivative exposures
VRS / LHWPThe table below details derivative values:
2016 2015 2016 2015Current Non-current
Forward exchange contracts R million R million R million R millionLIABILITIESFair value amount 3 - - -
2016 2015Foreign Amount
Rand amount Foreign Amount
Rand amount
Forward exchange contracts (*) million million million millionNotional amounts on EUR contracts 2 34 3 37
Net foreign exchange contracts are stated at fair value. This derivative contract has been entered into to economically hedge specific underlying commitments recorded on the statement of financial position at the reporting date.Derivatives are used to hedge currency exposures.
(*) The notional amount of a financial instrument is the nominal or face value that is used to calculate payments made on that instrument.Fair value is the current mark-to-market value of all the derivatives at the reporting date.

203
F O R T H E P E R I O D E N D E D 3 1 M A R C H 2 0 1 6
NOTES TO THE ANNUAL FINANCIAL STATEMENTS
INTEGRATED ANNUAL REPORT 2015-2016
7.12 Long-term liability maturity profile
The tables below indicate TCTA’s exposure to fixed and floating interest rates:
7.12.1 Exposure to floating interest rates: Liabilities
2016 Total exposure
to floating interest rates
2015 Total exposure
to floating interest
rates
<1 year 1-5 years >5 years <1 year 1-5 years >5 years
Project R million R million R million R million R million R million R million R millionVRS 184 6 744 - 6 928 131 6 227 - 6 358 LHWP 131 6 227 - 6 358 AMD - - - - BWP - - 100 100 116 - 100 216 VRESAP 227 74 701 1 002 239 72 557 868 MCWAP 1 14 151 166 1 10 150 161 MMTS-2 138 151 765 1 054 140 96 652 888 KWSAP - 7 252 259 - 2 182 184
Total 550 6 990 1 969 9 509 627 6 407 1 641 8 675
7.12.2 Exposure to fixed interest rates: Liabilities
2016 Total exposure to
fixed interest rates
2015 Total exposure
to fixed interest
rates
<1 year 1-5 years >5 years <1 year 1-5 years >5 years
Project R million R million R million R million R million R million R million R millionVRS 674 2 452 9 477 12 603 133 7 503 5 253 12 889 LHWP 133 7 503 5 253 12 889 AMD - - - - BWP 77 309 361 747 77 309 438 824 VRESAP 149 695 1 952 2 796 142 654 2 143 2 939 MCWAP 10 90 933 1 033 7 69 964 1 040 MMTS-2 51 203 508 762 17 132 364 513 KWSAP 23 111 858 992 17 100 884 1 001
Total 984 3 860 14 089 18 933 393 8 767 10 046 19 206

204
F O R T H E P E R I O D E N D E D 3 1 M A R C H 2 0 1 6
NOTES TO THE ANNUAL FINANCIAL STATEMENTS
INTEGRATED ANNUAL REPORT 2015-2016
7.12.3 Exposure to floating interest rates: Assets
2016 Total exposure
to floating interest rates
2015 Total exposure
to floating interest
rates
<1 year 1-5 years >5 years <1 year 1-5 years >5 years
Project R million R million R million R million R million R million R million R millionVRS 2 749 - - 2 749 2 013 306 - 2 319 LHWP 1 948 306 - 2 254 AMD 65 - - 65 BWP 43 - - 43 109 - - 109 VRESAP 72 - - 72 22 - - 22 MCWAP 46 - - 46 169 - - 169 MMTS-2 372 - - 372 162 - - 162 ORWRDP 52 - - 52 190 - - 190 KWSAP 89 - - 89 7 - - 7 BOREHOLE - - - - 1 - - 1
Total 3 423 - - 3 423 2 673 306 - 2 979
The table above excludes the maturity periods for loans and other receivables and cash and equivalents.
7.12.4 Exposure to fixed interest rates: Assets
2016 Total exposure to
fixed interest rates
2015 Total exposure
to fixed interest
rates
<1 year 1-5 years >5 years <1 year 1-5 years >5 years
Project R million R million R million R million R million R million R million R millionVRS 1 281 - - 1 281 1 032 - - 1 032 LHWP 1 032 - - 1 032 AMD - - - - BWP - - - - - - - - VRESAP - - - - - - - - MCWAP - - - - - - - - MMTS-2 - - - - - - - - ORWRDP - - - - - - - - KWSAP - - - - - - - - BOREHOLE - - - - - - - -
Total 1 281 - - 1 281 1 032 - - 1 032
The table above excludes the maturity periods for loans and other receivables and cash and equivalents.
7.12 Long-term liability maturity profile (continued)

205
F O R T H E P E R I O D E N D E D 3 1 M A R C H 2 0 1 6
NOTES TO THE ANNUAL FINANCIAL STATEMENTS
INTEGRATED ANNUAL REPORT 2015-2016
8 LOANS AND OTHER RECEIVABLES
The total includes receivables for ORWRDP, BOREHOLE, AMD and MMTS-1, which have been disclosed as part of current loans and receivables. These projects are funded from the fiscus. UMGENI is funded by Umgeni Water. Loans and other receivables also includes inter-project loan accounts with LHWP.
2016 2015 2016 2015 2016 2015Other debtors DWS Debtor Total
Current Notes R million R million R million R million R million R millionVRS (1) 8.1 41 995 - 969 41 1 964 LHWP 995 - 995 AMD - 969 969 MMTS-2 - 33 - - - 33 ORWRDP - - 19 260 19 260 MMTS-1 - - - 2 - 2 UMGENI 8 61 - - 8 61 KRIEL 18 - - - 18 - Total 67 1 089 19 1 231 86 2 320
BWP, VRESAP, MCWAP, MMTS-2, KWSAP and Borehole have zero balances for the current and prior period.
(1) Included in the other debtors amount is the interproject receivables.
8.1 VRS / LHWP Loan accounts reconciliation
The table below is a reconciliation of the inter-project loan accounts with VRS/ LHWP. The balances mainly consists of recoveries of overhead costs based on an approved recovery model to allocate overhead administration costs to all projects. These balances are settled on a monthly basis and amounts outstanding are due to timing differences. These balances are settled on a monthly basis and balances are subject to interest charged at the WACC rate of VRS/LHWP at the end of each month.
2016 2015Project R million R millionBWP 1 1 VRESAP 2 2 MCWAP 9 16 MMTS-2 6 6 ORWRDP 5 6 KWSAP 1 1 Borehole - -AMD (1) - 917 Other 15 46 Loan accounts advisory services 2 -
Total 41 995
(1) TCTA was directed by the Minister of Water and Sanitation to implement the short-term AMD solution with funding from DWS. The financing of AMD project costs from the LHWP account amounted to R 917 million. This loan has been included in the tariff receivable from DWS as from April 2016 and is recovered through the tariffs received on the Vaal River System.

206
F O R T H E P E R I O D E N D E D 3 1 M A R C H 2 0 1 6
NOTES TO THE ANNUAL FINANCIAL STATEMENTS
INTEGRATED ANNUAL REPORT 2015-2016
8.2 Credit quality of financial assets that are neither past due nor impaired
When a counterparty fails to make a payment when it is contractually due, that financial asset is past due , even though this does not mean that the counterparty will never pay. This does however, mean that it can trigger various actions such as renegotiation, enforcement of covenants, or legal proceedings. ORWRDP, BOREHOLE, AMD and MMTS-1 are funded from the fiscus. The customer is the Department of Water and Sanitation and the credit risk is deemed limited even though DWS is the sole customer.
8.3 Ageing of loans and receivables
As at 31 March, the ageing analysis of loans and other receivables are as follows:
Neither past due nor
impaired
Past due but not impaired 2016 30-60 days 61-90 days >90 days
Project R million R million R million R million R millionVRS 41 41 - - -ORWRDP 19 19 - - -MMTS-1 - - - - -UMGENI 8 8 - - -KRIEL 18 18 - - -Balance at end of year 86 86 - - -
Neither past due nor
impaired
Past due but not impaired 2015 30-60 days 61-90 days >90 days
Project R million R million R million R million R millionVRS 1 964 1 584 - - 380 LHWP 995 995 - - -AMD 969 589 - - 380 MMTS-2 33 33 - - -ORWRDP 260 69 112 75 4 MMTS-1 2 2 - - -UMGENI 61 61 - - - Balance at end of year 2 320 1 749 112 75 384

207
F O R T H E P E R I O D E N D E D 3 1 M A R C H 2 0 1 6
NOTES TO THE ANNUAL FINANCIAL STATEMENTS
INTEGRATED ANNUAL REPORT 2015-2016
9 PREPAID EXPENDITURE
Prepaid expenditure includes advance payments made to contractors, annual insurance and treasury related licence fees. The advance payments are recouped from future payment certificates. Other prepaid expenditure are amortised to the income statement in the periods that the expenses are incurred.
2016 2015Project R million R millionVRS 163 179 LHWP - 90 AMD - 89 BWP - -VRESAP - -MCWAP (1) - 1 MMTS-2 2 21 ORWRDP 10 10 KWSAP - -BOREHOLE - - MMTS-1 - - UMGENI - - KRIEL - - Balance at end of year 175 211
(1) 2015: Prepaid financial compensation relating to the expropriation of land, was re-allocated to prepaid expenditure (from note 8) to more accurately reflect the nature of asset.

208
F O R T H E P E R I O D E N D E D 3 1 M A R C H 2 0 1 6
NOTES TO THE ANNUAL FINANCIAL STATEMENTS
INTEGRATED ANNUAL REPORT 2015-2016
10. TRADE AND OTHER PAYABLES
Interest payable:
Other borrowings
by TCTA
Loan account:
LHWP
Loan account: MMTS-1
Loan account: UMGENI
Other creditors
Operations and
Mainten-ance:
Advance from DWS
Working Capital
Advance
Balance per
project
2016 R million R million R million R million R million R million R million R millionVRS 458 - - - 479 189 - 1 126 BWP 2 1 - - 3 - - 6 VRESAP 40 1 - - 14 - - 55 MCWAP 13 9 - - 31 - - 53 MMTS-2 25 6 - - 64 - - 95 ORWRDP - 5 - - 67 - - 72 KWSAP 2 1 - - 19 - - 22 BOREHOLE (1) - - - - - - - - MMTS-1 - - - - - - - - UMGENI (2) - - - 4 - - - 4 KRIEL - - - - 2 - 16 18 Balance at end of year
540 23 - 4 679 189 16 1 451
(1) The BOREHOLE project has been winded down and there are no balances for the project in the current year(2) The loan account comprise funds received from Umgeni Water (in terms of the Addendum to the MOA, November 2014) for the construction of the potable water pipeline from the water treatment works at the Spring Grove Dam to a terminal reservoir at Nottingham Road.

209
F O R T H E P E R I O D E N D E D 3 1 M A R C H 2 0 1 6
NOTES TO THE ANNUAL FINANCIAL STATEMENTS
INTEGRATED ANNUAL REPORT 2015-2016
Interest payable: Other borrowings by
TCTA
Loan account:
LHWP
Loan account: MMTS-1
Loan account: UMGENI
Other creditors
Balance per project
2015 R million R million R million R million R millionVRS 501 917 - - 391 1 809 LHWP 501 - - - 159 660 AMD - 917 - - 232 1 149 BWP 2 1 - - 3 6 VRESAP 40 2 - - - 42 MCWAP - 16 - - 36 52 MMTS-2 15 6 - - 153 174 ORWRDP - 6 - - 463 469 KWSAP - 1 - - 3 4 BOREHOLE - - - - - - MMTS-1 - - 2 - - 2 UMGENI (1) - - - 60 - 60
Balance at end of year 558 949 2 60 1 049 2 618
(1) The loan account comprise funds received from Umgeni Water (in terms of the Addendum to the MOA, November 2014) for the construction of the potable water pipeline from the water treatment works at the Spring Grove Dam to a terminal reservoir at Nottingham Road.The payment terms for creditors vary depending on the contract terms.
11. NON-CONTRACTUAL AMOUNTS
Non-contractual amounts relate to liabilities and/ or assets arising from legislation. This includes payments to the South African Revenue Service (SARS) relating to Value Added Tax (VAT), Skills Development Levy (SDL) and to the Unemployment Insurance Fund (UIF).
TCTA manages its projects separately and record the VAT payable or VAT receivable for each project. The net VAT payable is paid over to SARS. As at year end there were no balances outstanding for SDL and UIF.

210
F O R T H E P E R I O D E N D E D 3 1 M A R C H 2 0 1 6
NOTES TO THE ANNUAL FINANCIAL STATEMENTS
INTEGRATED ANNUAL REPORT 2015-2016
11.1 Value Added Tax
The table below indicate the net amount payable to SARS at the end of March:
2016 2015Net non-contractual amount R million R millionAsset 41 48 Liability (101) (109)
Net payable (60) (61)
The tables below indicate the non-contractual assets and non-contractual liabilities, per project, as disclosed in the Statement of Financial Position:
Value Added Tax2016 2015
Non-contractual assets R million R millionVRS - 26 LHWP - - AMD - 26 BWP - - VRESAP - - MCWAP 37 6 MMTS-2 4 7 ORWRDP - 9 KWSAP - - BOREHOLE - - MMTS-1 - - UMGENI - - KRIEL - Balance at end of year 41 48
Value Added Tax2016 2015
Non-contractual liabilities R million R millionVRS (76) (97)LHWP (97)AMD - BWP (4) (2)VRESAP (9) (8)MCWAP - - MMTS-2 - - ORWRDP (9) - KWSAP (3) (2)BOREHOLE - - MMTS-1 - - UMGENI - - KRIEL - Balance at end of year (101) (109)

211
F O R T H E P E R I O D E N D E D 3 1 M A R C H 2 0 1 6
NOTES TO THE ANNUAL FINANCIAL STATEMENTS
INTEGRATED ANNUAL REPORT 2015-2016
11.2 Income Tax
TCTA is a not for profit organisation established by DWS (Government) to raise off-budget funding and implement projects (both on and off-budget) on its behalf. By allowing non-profit organisations preferential tax treatment, Government assist by augmenting their financial resources. TCTA applied for this preferential tax treatment as prescribed and its application for tax exemption in terms of the Income Tax Act, 1962, was approved. TCTA is exempted from Income tax as it is a Institution, Board, or Body established by or under any law as defined in the Income Tax Act, 1962.
12 PROVISIONS
12.1 Total provisionsThe following provisions are the current and non-current provisions for the year:
2016 2015Current Note R million R millionProvision for leave pay 12.2 9 9 Provision for compensation 12.3 20 20 Provision for incentives 12.4 30 19 Total current provisions 59 48
2016 2015Non-current Note R million R millionProvision for compensation 12.3 284 319 Total non-current provisions 284 319
12.2 Provision for leave pay
2016 2015Leave Pay R million R millionReconciliationBalance at 1 April 9 8 Leave accrued during the year 12 11 Leave utilised (12) (10)Leave provision as at 31 March 9 9
In terms of TCTA’s policy, employees are entitled to accumulate annual leave not taken to a maximum of 40 working days. Accumulated annual leave exceeding the maximum of 40 working days is forfeited on 30 June of the succeeding year.

212
F O R T H E P E R I O D E N D E D 3 1 M A R C H 2 0 1 6
NOTES TO THE ANNUAL FINANCIAL STATEMENTS
INTEGRATED ANNUAL REPORT 2015-2016
12.3 Compensation liability reconciliation
2016 2015Reconciliation Note R million R million
Balance at 1 April 339 369 - Long-term portion of future compensation 319 350 - Short-term portion of future compensation 20 19
Payment in current year (1) (42) (16)Interest expense 17.2 34 37 (Decrease) in provision (27) (51)Adjustment for the change in the WACC used in determining the present value of the provision
Balance at 31 March 304 339 - Long-term portion of future compensation 284 319 - Short-term portion of future compensation 20 20
The provision for compensation payments are paid annually in cash to the LHDA for subsequent distribution to individuals affected by loss of income as a result of reappropriation of land in respect of the LHWP project in Lesotho.
12.4 Provision for incentives2016 2015
Reconciliation R million R millionBalance at 1 April 19 10 Incentive provision raised in the year 30 19 Incentive paid in the year (19) (10)
Incentive provision as at 31 March 30 19
The TCTA remuneration policy allows for a performance bonus to be paid annually based on a formal assessment of each individuals job-related performance during the year. The 2015 incentive was finalised and allocated to individuals during the 2016 financial year.

213
F O R T H E P E R I O D E N D E D 3 1 M A R C H 2 0 1 6
NOTES TO THE ANNUAL FINANCIAL STATEMENTS
INTEGRATED ANNUAL REPORT 2015-2016
13. CASH AND CASH EQUIVALENTS
Cash and cash equivalents consists of bank balances and petty cash. TCTA’s cash management practice is to maintain a minimum amount of cash on hand.
2016 2015Project R million R millionVRS 1 -LHWP -AMD - BWP - -VRESAP - - MCWAP - -MMTS-2 - -ORWRDP - -KWSAP - - BOREHOLE - - MMTS-1 - - UMGENI - - KRIEL - - Balance at end of year 1 -
Cash and bank balances were less than R500 000 as at the end of March 2015.

214
F O R T H E P E R I O D E N D E D 3 1 M A R C H 2 0 1 6
NOTES TO THE ANNUAL FINANCIAL STATEMENTS
INTEGRATED ANNUAL REPORT 2015-2016
14. CONSTRUCTION REVENUE AND COSTS
TCTA constructs infrastructure on behalf of DWS and treats the cost of the construction in terms of IAS 11 Construction Contracts, as costs through the statement of comprehensive income. Under the percentage of completion method, contract revenue is recognised as revenue in profit or loss in the accounting periods in which the work is performed. Contract costs include all capital, funding and administrative costs incurred by TCTA in relation to each project. The contra for the recognition of revenue will be the initial recognition of a financial asset. (Refer to note 7.4.1 for information on construction revenue earned and tariffs or transfers received from DWS during the period). DWS pays in full for the costs incurred resulting in revenue earned by TCTA equal to the costs incurred. All these costs include staff costs.
2016 2015Construction revenue R million R millionVRS (1) 1 078 603 LHWP 86 29 AMD 992 575 BWP - -VRESAP 13 2 MCWAP 172 171 MMTS-2 260 411 ORWRDP 304 514 KWSAP 3 8 BOREHOLE - -MMTS-1 4 31 UMGENI 56 7 KRIEL 2 -
Balance at end of year 1 892 1 748
2016 2015Construction cost R million R millionVRS (1) (Note 14.1) (1 078) (603)LHWP (Note 14.1) (86) (29)AMD (992) (575)BWP - -VRESAP (13) (2)MCWAP (172) (171)MMTS-2 (260) (411)ORWRDP (304) (514)KWSAP (3) (8)BOREHOLE - -MMTS-1 (4) (31)UMGENI (56) (7)KRIEL (2) -
Balance at end of year (1 892) (1 748)
(1) Although the construction revenue/costs have been identified separately for LHWP and AMD, all remaining operating costs and funding costs have not been allocated to LHWP and AMD as these projects are managed on a combined basis with a single tariff recovery model, being the VRS tariff receivable.

215
F O R T H E P E R I O D E N D E D 3 1 M A R C H 2 0 1 6
NOTES TO THE ANNUAL FINANCIAL STATEMENTS
INTEGRATED ANNUAL REPORT 2015-2016
14.1 VRS / LHWP: Construction costs
Construction costs for LHWP relates to cost related payments made to the LHDA for Phase 2 of the Project and AMD.
2016 2015Reconciliation R million R million
LHWP phase 2 construction costs for the year (86) (29)
15. OTHER INCOME
Other income relates to services rendered and cost recoveries from Department of Water and Sanitation.
2016 2015Other income R million R million
VRS 997 785 LHWP 785 AMD - BWP 5 4 VRESAP 6 6 KWSAP 5 4
Total other income 1 013 799
All other projects have not earned other income during the year (2015: none).
16. OPERATING COSTS FOR THE WORK IN LESOTHO
In accordance with the Treaty, the Government of the Republic of South Africa is responsible for the payment of all costs related to the operation and maintenance of the water transfer component of the LHWP. In Lesotho this work is carried out by the LHDA, with oversight by the LHWC. TCTA makes payments on a weekly cash flow schedule to enable this work to be undertaken.
2016 2015Total costs R million R million
VRS (140) (99)LHWP (99)AMD -
Total operating costs (140) (99)

216
F O R T H E P E R I O D E N D E D 3 1 M A R C H 2 0 1 6
NOTES TO THE ANNUAL FINANCIAL STATEMENTS
INTEGRATED ANNUAL REPORT 2015-2016
17. FINANCE INCOME AND COSTS
17.1 Finance income
2016 Interest income for financial assets at amortised cost
Total: Interest income for
financial assets at
amortised cost
Interest on compensation
Fair value gain or loss
on derivatives
Finance income per
projectInterest
income on other financial
assets
Interest income on
the tariff receivable
R million R million R million R million R million R millionVRS 502 881 1 383 - 9 1 392 BWP 4 91 95 - - 95 VRESAP 3 422 425 - - 425 MCWAP 4 114 118 - - 118 MMTS-2 16 172 188 - - 188 KWSAP 3 297 300 - - 300 UMGENI 2 - 2 - - 2 Finance income 534 1 977 2 511 - 9 2 520
2015 Interest income for financial assets at amortised cost
Total: Interest income for
financial assets at
amortised cost
Interest on compensation
(1)
Fair value gain or loss
on derivatives
Finance income per
projectInterest
income on other financial
assets
Interest income on
the tariff receivable
R million R million R million R million R million R millionVRS 319 971 1 290 51 3 1 344 LHWP 319 971 1 290 51 3 1 344 AMD - - - - - - BWP 3 135 138 - - 138 VRESAP 3 430 433 - - 433 MCWAP 9 234 243 - - 243 MMTS-2 12 632 644 - - 644 KWSAP 2 101 103 - - 103 UMGENI 1 - 1 - - 1 Finance income 349 2 503 2 852 51 3 2 906
(1) The interest on compensation has been reclassified from fair value through profit or loss to reflect the interest on the compensation provision separately.

217
F O R T H E P E R I O D E N D E D 3 1 M A R C H 2 0 1 6
NOTES TO THE ANNUAL FINANCIAL STATEMENTS
INTEGRATED ANNUAL REPORT 2015-2016
17.2 Finance costs
Finance costs for the year ended are analysed as follows:
2016 Interest expense for borrowings at amortised cost
Total: Interest
expense for borrowings
at amortised
cost
Interest on compen-
sation
Fair value gain or loss on
derivatives
Finance cost per project
Locally issued bonds
Other local debt
Foreign debt
Imputed interest
on the financial
asset
Fair value loss on
re-recognition of financial
assetR million R million R million R million R million R million R million R million R million
VRS 2 267 171 8 - 784 3 230 34 13 3 277 BWP - 77 - 6 - 83 - - 83 VRESAP - 365 - - - 365 - - 365 MCWAP - 120 - 128 - 248 - - 248 MMTS-2 - 153 - - - 153 - - 153 KWSAP - 116 - - - 116 - - 116 ORWRDP - - - - - - - - - Finance costs
2 267 1 002 8 134 784 4 195 34 13 4 242
2015 Interest expense for borrowings at amortised cost
Total: Interest
expense for borrowings
at amortised
cost
Interest on compen-sation (1)
Fair value gain or loss on
derivatives
Finance cost per projectLocally
issued bonds
Other local
debt (1)
Foreign debt
Imputed interest
on the financial
assetR million R million R million R million R million R million R million R million
VRS 2 126 20 10 109 2 265 37 6 2 308 LHWP 2 126 20 10 109 2 265 37 6 2 308 AMD - - - - - - - - BWP - 88 - - 88 - - 88 VRESAP - 360 - - 360 - - 360 MCWAP - 103 - - 103 - - 103 MMTS-2 - 117 - - 117 - - 117 KWSAP - 111 - 9 120 - - 120
Finance costs 2 126 799 10 118 3 053 37 6 3 096 (1) The interest expense on the compensation provision has been reclassified from “Fair value through profit or loss” to “Interest on compensation provision” to reflect the interest on the compensation provision separately.

218
F O R T H E P E R I O D E N D E D 3 1 M A R C H 2 0 1 6
NOTES TO THE ANNUAL FINANCIAL STATEMENTS
INTEGRATED ANNUAL REPORT 2015-2016
18. ROYALTIES PAID
Royalties are paid to the Government of Lesotho in accordance with the Treaty for the benefit of receiving water from the LHWP. The royalties are based on the calculated net benefit of the construction of LHWP compared to a transfer scheme based entirely inside South Africa. The royalties comprise a fixed component and a variable component. The variable royalties are based on 771 million m³ (2015: 773 million m³) of water delivered adjusted for the increase in the Producer Price Index and the Eskom selling Price of electricity (ESI). Variable royalties in this financial year include the expected ESI (Eskom selling price) adjustment for the year that is expected to be settled in October 2016. The water volume delivered in this financial year is slightly lower than the agreed upon delivery of 780 million m³. In terms of the treaty, any differences will be adjusted in the following year.
2016 2015Royalties paid R million R million
Fixed royalties (232) (219)Variable royalties (543) (393)Royalties (775) (612)
19. OTHER OPERATING EXPENSES
All construction costs including general administration costs that can be considered as construction overheads (specifically contracted to by DWS) are taken to surplus or deficit as part of project costs. Construction revenues will include this amount (Note 14). After construction, all administration / overhead expenses are expensed as operating expenses in the statement of comprehensive income. The projects listed below are in the post construction phase, and operating expenses are recognised in the statement of comprehensive income; all other projects are still in the construction phase. Other operating expenses include the following:
2016 Operating lease
payments
Audit Fees Other expenditure (1)
Total other operating
expenditureVRS (8) (3) 21 10 BWP - - (5) (5)VRESAP - - (6) (6)KWSAP - - (5) (5)
- - Operating expenses recognised in profit and loss
(8) (3) 5 (6)

219
F O R T H E P E R I O D E N D E D 3 1 M A R C H 2 0 1 6
NOTES TO THE ANNUAL FINANCIAL STATEMENTS
INTEGRATED ANNUAL REPORT 2015-2016
2015 Operating lease
payments
Audit Fees Other expenditure (1)
Total other operating
expenditureVRS (8) (1) 114 105 LHWP (8) (1) 114 105 AMD - - - - BWP - - (4) (4)VRESAP - - (5) (5)KWSAP - - (4) (4)Operating expenses recognised in profit and loss
(8) (1) 101 92
(1) Other operating expenditure includes the benefit of R27 million from the reduction in the compensation provision, as disclosed in note 12.3. Other costs incurred are in relation to insurance, non-audit services, repairs and maintenance, stationery and printing, the operating and maintenance costs incurred in terms of Protocol VI. In the TCTA model, administration costs are determined by aggregating the expected time to be spent on each project to determine the overall ratio of allocating overhead and administrative costs amongst our projects. During construction this recovery is included in the construction costs. Post-construction these costs are recognised in profit and loss.
19.1 Operating leases
19.1.1 Leasing arrangementsThe operating lease relates to a lease agreement for the office building with a lease term of 55 months. Lease payments escalate with 7.5% compounded with the first escalation taking effect on 1 January 2015.
19.1.2 Payments recognised as an expense
2016 2015Expensed R million R millionMinimum lease payments 7 7 Total minimum lease payments 7 7
19.1.3 Non-cancellable operating lease commitments19.1.3.1 VRS / LHWP
2016 2015Period R million R millionLess than one year 7 7 Between one and five years 6 13 More than five yearsTotal non-cancellable operating lease commitments 13 20
19.2 Operation and maintenance costs in terms of Protocol VI
Included in VRS / LHWP operating expenditure is the income and expenses relating to operations and maintenance for the works on South African soil. In terms of Protocol VI to the Treaty, signed on 4 June 1999, these amounts are separately identified and reported on.
19. OTHER OPERATING EXPENSES (continued)

220
F O R T H E P E R I O D E N D E D 3 1 M A R C H 2 0 1 6
NOTES TO THE ANNUAL FINANCIAL STATEMENTS
INTEGRATED ANNUAL REPORT 2015-2016
19.2.1 VRS / LHWP
Details2016 2015
R’000 R’000Revenue 966 926 Operating costs (966) (926)Net operating and maintenance costs - -
20. RELATED PARTIES
TCTA is a state-owned entity established under the National Water Act. As such, TCTA is a government-related entity and has applied the exemption in paragraph 25 of IAS 24 in the disclosure of related parties. These related parties are either controlled, jointly controlled or significantly influenced by the government of the Republic of South Africa. The significant transactions below are as a result of contractual agreements entered into between TCTA and the related parties in fulfilling TCTA’s mandate in terms of directives issue in various projects.
20.1 Trading transactions
20.1.1 DWSFor related party transactions and balances with DWS refer to note 7.4.
20.1.2 DBSAA government-related entity is an entity that is controlled, jointly controlled or significantly influenced by a government. TCTA and DBSA are both schedule 2 Major Public Entities in terms of the PFMA and report to National Government.
Borrowings Opening balance
1 April 2015 R million
Drawdowns Repayments Closing balance
31 March 2016
Interest incurred
for the period
Interest outstanding at 31 March
2016
2016
Project R million R million R million R million R million R millionVRS / LHWP 46 - (15) 31 2 - VRS / LHWP - LHDA Loans
52 - (7) 45 5 -
BWP 280 - (20) 260 24 -
MMTS-2 100 - (100) - 3 -
Borrowings Opening balance
1 April 2014 R million
Drawdowns Repayments Closing balance
31 March 2015
Interest incurred
for the period
Interest outstanding at 31 March
2015
2015
Project R million R million R million R million R million R millionVRS / LHWP 61 - (15) 46 1 - VRS / LHWP - LHDA Loans
59 - (7) 52 6 -
BWP 300 - (20) 280 26 -
MMTS-2 150 200 (250) 100 4 -
19.2 Operation and maintenance costs in terms of Protocol VI (continued)

221
F O R T H E P E R I O D E N D E D 3 1 M A R C H 2 0 1 6
NOTES TO THE ANNUAL FINANCIAL STATEMENTS
INTEGRATED ANNUAL REPORT 2015-2016
20.2 Other transactions
20.2.1 LHWC Costs
The Government of South Africa and the Government of Lesotho entered into a Treaty with the purpose to provide for the establishment, implementation, operation and maintenance of the LHWP. The LHWC is the body overseeing the two vehicles (TCTA and LHDA) mandated with the execution of the Treaty functions on behalf of the two governments. The LHWC is responsible and accountable for the project, acts on behalf of, advises the governments and is the channel of all government inputs relating to the project. The running costs of the LHWC, is shared by the governments of the Republic of South Africa and the Kingdom of Lesotho. Each party is liable for the costs of its own delegation and all other costs are met by the parties on an equal basis.
The following amounts represents the costs relating to the LHWC paid for by TCTA:
2016 2015Payments made to related party R million R millionLHWPLHWC Costs: RSA contribution and delegation costs (9) (18)
Total (9) (18)
20.3 Compensation of directors and executive management
Short term employee benefitsTCTA does not contribute to any defined retirement or medical aid fund. It does not have a liability for the provision of retirement funding. The emoluments paid to management include a sum for the provision of their own medical aid and pension benefits.
2016 2015Total compensation to directors and executive management R million R millionNon-executive Directors 1 3 Executive Director 5 4 Executive Management 20 182014 Incentive paid in 2015 financial year - 2 2015 Incentive paid in 2016 financial year 5 -Total compensation paid for the year 31 27

222
F O R T H E P E R I O D E N D E D 3 1 M A R C H 2 0 1 6
NOTES TO THE ANNUAL FINANCIAL STATEMENTS
INTEGRATED ANNUAL REPORT 2015-2016
20.3.1 Non-executive directors
2016 Board fees Ad hoc fees (*) Travel expenses REMCO Risk Committee
Audit & Risk Committee
ICT & Knowledge
Management Committee
Human Resources and Transformation
Committee
Technical Committees
VRESAP Technical
Committee
Grand total
Directors (1) R’000 R’000 R’000 R’000 R’000 R’000 R’000 R’000 R’000 R’000 R’000Board 01/12/2015 to 31/03/2016M Hlahla 359 - - - - - - - - - 359 JRD Modise 287 - - - - - - - - - 287 Z Manase 103 7 - - - - - - - - 110 S Makhathini 103 - - - - - - - - - 103 S Roopa 103 - - - - - - - - - 103 S Khondlo 107 22 - - - - - - - - 129 MJ Ellman 103 - - - - - - - - - 103 Total non-executive directors
1 165 29 - - - - - - - - 1 194
(*)Ad Hoc Fees comprise all additional TCTA related work done outside scheduled engagements, in line with the Directors’ Remuneration Policy(1) Following the expiry of the previous Board on 31 August 2014, the appointment process by the Minister was completed in Novemeber 2015 and the current Board tenure commenced on 1 December 2015.
2015 Board fees Ad hoc fees (*) Travel expenses REMCO ALCO Audit & Risk Committee
ICT & Knowledge
Management Committee
Human Resources and Transformation
Committee
Technical Committees
VRESAP Technical
Committee
Grand total
Directors (1) R’000 R’000 R’000 R’000 R’000 R’000 R’000 R’000 R’000 R’000 R’000Board 01/04/2014 to 31/08/2014S Kondlo 431 20 1 29 - - - - - 14 495 L Thotanyana 136 59 11 29 29 9 - - - - 273 G White 125 35 5 29 - - 14 20 - - 228 J Geenen 121 3 - - 20 - - - - - 144 M Mosidi 336 43 - 41 - - 14 - 43 - 477 D Dondur (2) 72 13 - - 14 14 - 14 - - 127 S Sekgobela 121 40 - 14 - - 20 - 1 - 196 S Sono 121 49 - - 35 26 - - 29 14 274 M Furumele 121 19 - 29 - - - - 61 20 250 T James 103 17 - - - - - - - - 120 B Hollingworth - - - - - - - - 60 - 60 Total non-executive directors
1 687 298 17 171 98 49 48 34 194 48 2 644
(*)Ad Hoc Fees comprise all additional TCTA related work done outside scheduled engagements, in line with the Directors’ Remuneration Policy.(1) The Boards tenure ended on the 31 August 2014.(2) Resigned in June 2014.
20.3 Compensation of directors and executive management (continued)

223
F O R T H E P E R I O D E N D E D 3 1 M A R C H 2 0 1 6
NOTES TO THE ANNUAL FINANCIAL STATEMENTS
INTEGRATED ANNUAL REPORT 2015-2016
20.3.1 Non-executive directors
2016 Board fees Ad hoc fees (*) Travel expenses REMCO Risk Committee
Audit & Risk Committee
ICT & Knowledge
Management Committee
Human Resources and Transformation
Committee
Technical Committees
VRESAP Technical
Committee
Grand total
Directors (1) R’000 R’000 R’000 R’000 R’000 R’000 R’000 R’000 R’000 R’000 R’000Board 01/12/2015 to 31/03/2016M Hlahla 359 - - - - - - - - - 359 JRD Modise 287 - - - - - - - - - 287 Z Manase 103 7 - - - - - - - - 110 S Makhathini 103 - - - - - - - - - 103 S Roopa 103 - - - - - - - - - 103 S Khondlo 107 22 - - - - - - - - 129 MJ Ellman 103 - - - - - - - - - 103 Total non-executive directors
1 165 29 - - - - - - - - 1 194
(*)Ad Hoc Fees comprise all additional TCTA related work done outside scheduled engagements, in line with the Directors’ Remuneration Policy(1) Following the expiry of the previous Board on 31 August 2014, the appointment process by the Minister was completed in Novemeber 2015 and the current Board tenure commenced on 1 December 2015.
2015 Board fees Ad hoc fees (*) Travel expenses REMCO ALCO Audit & Risk Committee
ICT & Knowledge
Management Committee
Human Resources and Transformation
Committee
Technical Committees
VRESAP Technical
Committee
Grand total
Directors (1) R’000 R’000 R’000 R’000 R’000 R’000 R’000 R’000 R’000 R’000 R’000Board 01/04/2014 to 31/08/2014S Kondlo 431 20 1 29 - - - - - 14 495 L Thotanyana 136 59 11 29 29 9 - - - - 273 G White 125 35 5 29 - - 14 20 - - 228 J Geenen 121 3 - - 20 - - - - - 144 M Mosidi 336 43 - 41 - - 14 - 43 - 477 D Dondur (2) 72 13 - - 14 14 - 14 - - 127 S Sekgobela 121 40 - 14 - - 20 - 1 - 196 S Sono 121 49 - - 35 26 - - 29 14 274 M Furumele 121 19 - 29 - - - - 61 20 250 T James 103 17 - - - - - - - - 120 B Hollingworth - - - - - - - - 60 - 60 Total non-executive directors
1 687 298 17 171 98 49 48 34 194 48 2 644
(*)Ad Hoc Fees comprise all additional TCTA related work done outside scheduled engagements, in line with the Directors’ Remuneration Policy.(1) The Boards tenure ended on the 31 August 2014.(2) Resigned in June 2014.

224
F O R T H E P E R I O D E N D E D 3 1 M A R C H 2 0 1 6
NOTES TO THE ANNUAL FINANCIAL STATEMENTS
INTEGRATED ANNUAL REPORT 2015-2016
20.3.2 Executive director
2016Date
appointedCTC (1) MEDICAL AID Sums paid
by way of expense (2)
Other Total
Director R’000 R’000 R’000 R’000 R’000J Ndlovu 01/11/2008 4 797 24 - - 4 821 (Chief executive officer)Total executive director
4 797 24 - - 4 821
(1) This amount refers to guaranteed portion of the executives remuneration.(2) This amount refers to travel reimbursement.
2015Date
appointedCTC (1) MEDICAL
AIDSums paid by way of
expense (2)
Other Total 2015 Incentive
paid in 2016
Director R’000 R’000 R’000 R’000 R’000 R’000J Ndlovu 01/11/2008 4 013 - - - 4 013 1 888 (Chief executive officer)Total executive director
4 013 - - - 4 013 1 888
(1) This amount refers to guaranteed portion of the executives remuneration.(2) This amount refers to travel reimbursement.
20.3 Compensation of directors and executive management (continued)

225
F O R T H E P E R I O D E N D E D 3 1 M A R C H 2 0 1 6
NOTES TO THE ANNUAL FINANCIAL STATEMENTS
INTEGRATED ANNUAL REPORT 2015-2016
20.3.3 Executive management
The remuneration of directors and key executives is determined by REMCO having regard to the performance of individuals and market trends.
2016Position Date
appointed or resigned
CTC (1) MEDICAL AID
Sums paid by way of
expense (7)
Other (2)
Total
Executive Manager R’000 R’000 R’000 R’000 R’000J Nhlapo Chief Operations Officer 06/08/2007 3 495 24 - - 3 519 H Nazeer Chief Financial Officer 01/09/2007 2 904 24 95 - 3 023 J Claassens Executive: Project
Management and Implementation
01/04/2007 2 801 24 53 - 2 878
C Bleeker (3) Executive: Enterprise-wide Support Services
01/09/2010 1 307 11 - - 1 318
L Radzuma Chief Risk Officer 01/07/2010 2 387 24 - 5 2 416 L Mnisi Executive: Company
Secretariat and Company Secretary
01/11/2008 1 941 24 - - 1 965
Prof O Busari Executive: Knowledge Management
01/11/2009 2 797 24 - - 2 821
N Nkabinde (4) Executive: Project Finance and Treasury
01/09/2015 1 232 15 - 5 1 252
L Gumede(5) Executive: Enterprise Wide Support Services
01/02/2016 292 5 - - 297
H Botha(6) Executive: Human Resources and Organisational
Development
01/02/2016 317 5 - - 322
Total Executive Management remuneration 19 473 180 148 10 19 811
(1) This amount refers to guaranteed portion of the Executives remuneration.(2) This amount refers to long service award.(3) Ms C Bleeker’s contract came to an end on 30 September 2015.(4) Mr N Nkabinde was appointed as an Executive: Project Finance and Treasury on 01 September 2015.(5) Mr L Gumede acted as the Executive: Enterprise Wide Support Services from 01 October 2015 and was appointed to this position on 01 February 2016.(6) Ms H Botha acted as the Executive: Human Resources and Organisational Development from 22 October 2015 and was appointed to this position on 01 February 2016.(7) This amount refers to travel reimbursement.

226
F O R T H E P E R I O D E N D E D 3 1 M A R C H 2 0 1 6
NOTES TO THE ANNUAL FINANCIAL STATEMENTS
INTEGRATED ANNUAL REPORT 2015-2016
2015Position Date
appointed or resigned
CTC (1) MEDICAL AID
Sums paid by way of
expense (3)
Other (2)
Total 2015 Incentive
paid in 2016
Executive Manager R’000 R’000 R’000 R’000 R’000 R’000
J Nhlapho Chief Operations Officer
06/08/2007 3 266 - - - 3 266 217
H Nazeer Chief Financial Officer
01/09/2007 2 709 - 95 - 2 804 759
L Radzuma Chief Risk Officer 01/07/2010 2 175 - 2 - 2 177 393 J Claassens Executive: Project
Management and Implementation
01/04/2007 2 616 - 57 20 2 693 823
C Bleeker Executive: Enterprise Wide Support Services
01/09/2010 2 066 - 3 - 2 069 -
L Mnisi Executive: Governance and Company Secretary
01/11/2008 1 815 - 4 - 1 819 121
Prof O Busari Executive: Knowledge Management
01/11/2009 2 730 - 9 5 2 744 810
Total Executive Management remuneration
17 377 - 170 25 17 572 3 123
(1) This amount refers to guaranteed portion of the executive’s remuneration.(2) This amount relates to acting allowances and long service awards that were paid to the Executives during the year.(3) This amount refers to travel reimbursement.
20.3 Compensation of directors and executive management (continued)

227
F O R T H E P E R I O D E N D E D 3 1 M A R C H 2 0 1 6
NOTES TO THE ANNUAL FINANCIAL STATEMENTS
INTEGRATED ANNUAL REPORT 2015-2016
21. CAPITAL COMMITMENTS
2016 ≤ 1 Year 1-2 Years 2-3 Years 3-4 Years >4 years Total per project
Project R million R million R million R million R million R millionBWP (1) 4 - - - - 4 VRESAP (1) - - - - - - MCWAP (1) (2) 262 153 45 15 3 478 ORWRDP (2) 124 2 - - - 126 KWSAP (1) 2 - - - - 2 MMTS-2 (1) 78 3 - - - 81 MMTS-1 - - - - - - VRS (1)(2) 4 062 4 785 5 413 6 141 7 241 27 642 MCWAP 2 (1)(2) 206 1 227 1 718 2 621 3 775 9 547 Total per period 4 738 6 170 7 176 8 777 11 019 37 880
2015 ≤ 1 Year 1-2 Years 2-3 Years 3-4 Years >4 years Total per project
Project R million R million R million R million R million R millionVRS 1 570 2 068 2 651 3 961 7 241 17 491 LHWP 795 2 065 2 651 3 961 7 241 16 713 AMD (1) 775 3 - - - 778 BWP (1) 3 - - - - 3 VRESAP (1) 1 - - - - 1 MCWAP (1) (2) 346 147 108 - - 601 ORWRDP (2) 348 4 1 - - 353 KWSAP (1) 9 - - - - 9 MMTS-2 (1) (3) 107 10 8 9 9 143 MCWAP 2 (1) (2) 277 1 019 2 019 2 479 3 667 9 461 Total per period 2 661 3 248 4 787 6 449 10 917 28 062
(1) These capital commitments will be funded through loans. (2) These capital commitments are funded through on-budget transfers from the Department of Water and Sanitation.(3) Included in the project costs for MMTS-2 are the capital cost for the refurbishment project (MMTS-1),which is undertaken on behalf of Department of Water and Sanitation and the construction of a potable water pipeline on behalf of Umgeni Water (and funded by Umgeni Water).

228
F O R T H E P E R I O D E N D E D 3 1 M A R C H 2 0 1 6
NOTES TO THE ANNUAL FINANCIAL STATEMENTS
INTEGRATED ANNUAL REPORT 2015-2016
22. COMPLIANCE WITH THE PUBLIC FINANCE MANAGEMENT ACT, ACT NO. 1 of 1999, AND TREASURY REGULATIONS
22.1 Irregular, fruitless and wasteful expenditure
Section 55(2)(b)(i) of the PFMA requires that a public entity disclose particulars of any material losses through criminal conduct and any irregular expenditure and fruitless and wasteful expenditure that occurred during the financial year.
Irregular expenditure that was incurred during the year under review is included in “Other operating expenses” in the aggregated statement of comprehensive income.
22.1.1 Irregular expenditure
“Irregular expenditure” means expenditure, other than unauthorised expenditure, incurred in contravention of or that is not in accordance with a requirement of any applicable legislation, including the PFMA or the State Tender Board Act, 1968 (Act No. 86 of 1968), or any regulations made in terms of that Act; or any provincial legislation providing for procurement procedures in that provincial government. Irregular expenditure, the non-compliance must be linked to a financial transaction and it is incurred when a transaction, condition or an event linked to non-compliance is recognised as expenditure in the Statement of Financial Performance in accordance with International Financial Reporting Standards (IFRS).
Other operating expenses in the aggregated statement of comprehensive income includes irregular expenditure that was incurred during the year under review.
2016 2015Reconciliation of irregular expenditure Rand RandOpening balance 890 603 - Irregular expenditure current year 1 064 269 11 023 067 Condoned or written off (997 338) (10 132 464)
Irregular expenditure (957 534) 890 603

229
F O R T H E P E R I O D E N D E D 3 1 M A R C H 2 0 1 6
NOTES TO THE ANNUAL FINANCIAL STATEMENTS
INTEGRATED ANNUAL REPORT 2015-2016
2016Incident Authorisation Amount Action taken Reason for condonationThe extension of the Disaster Recovery Contract beyond two terms of contracting in contravention with the TCTA policy/procedures.
The CEO condoned the expenditure
310 345 A process to procure a service provider to provide disaster recovery services is in progress.
On two occasions TCTA had to cancel tenders for the appointment of a service provider to supply it with a disaster recovery site, firstly due to price change during negotiations and secondly due to tender price being higher than approved budget. As a result, TCTA had no option but extend the current contract with Continuity SA (Pty) Ltd, while a new tender process was underway, in order to ensure compliance with the requirement to “regularly demonstrate to the board that the company has adequate business resilience arrangements in place for disaster recovery” (King Report III).
International trip to USA
The CEO has not condoned the expenditure
66 931 A verbal warning was issued to the employee for non compliance with TCTA delegation of Authority.
Two employees undertook an all-expenses-paid international trip to the United States of America (USA) in May 2015 to attend a one-month long training programme on cybercrime. Although the trip was fully funded by a third party, TCTA paid a daily allowance (totaling R66 931 for both employees) in line with its policy to cover incidental expenses. The trip was authorised by the erstwhile Executive Manager: Enterprise-Wide Support Services in contravention of the Travel Policy which states that all international trips must be authorised by the CEO.
Contract irregularities (BroadsWord, Lubanzi Business Solution and Squarefane trading)
The CEO condoned the expenditure
509 118 Management is in the process of aligning the Delegation of Authority to the Supply Chain Policy.
During the audit of the 2014/15 financial year by external auditors, a discrepancy between the Delegation of Authority Matrix and the procedures on the procurement of items with a value of less than R200 000 was discovered. The Delegation of Authority Matrix then indicated that “Three written quotations must be obtained”. The practice was to issue requests for quotations to at least three potential suppliers. However, if less than three quotations were received, SCM would proceed with evaluation and award. The external auditors made an audit finding indicating that the spirit of the Delegation of Authority is that irrespective of the number of requests issued, no award can be made unless three written quotations have been obtained. The SCM team had interpreted the word “obtained” to mean the same as “request”.

230
F O R T H E P E R I O D E N D E D 3 1 M A R C H 2 0 1 6
NOTES TO THE ANNUAL FINANCIAL STATEMENTS
INTEGRATED ANNUAL REPORT 2015-2016
2016Incident Authorisation Amount Action taken Reason for condonationContract irregularities (BroadsWord, Lubanzi Business Solution and Squarefane trading)(continued)
Since the finding by the external auditors on this matter, the procedure has been changed to accommodate the recommendation of the external auditors. The current procedure is that if a request for quotation is issued and less than three (3) quotations are received, the process is cancelled. The request for quotation is then re-issued with more service providers. Should again less than three (3) quotations be received, then a request for an exception is sent to the CEO for approval before an award can be made. The deviation of the other three items was therefore as a result of an incorrect interpretation of the Delegation of Authority requirements and neither as a result of negligence nor deliberate disregard of the delegation.
Appoitnment of a service provider without full compliance with the Delegation of Authority to organize the annual report launch, Ideahub Group
The CEO condoned the expenditure
177 875 A verbal warning was issued to the employee for non compliance with TCTA delegation of Authority.
Ideahub Group is one of two service providers on the preferred provider database for Ideahub. (This database had been created following an open tender process) The SCM manager had hence interpreted this as being compliant to open and fair transparent procurement. The CFO discussed the matter with the SCM manager and accepted the mis-interpretation. However, he was cautioned that going forward, the correct procedure needed to be adhered to.
Total irregular expenditure current year
1 064 269
22.1 Irregular, fruitless and wasteful expenditure (continued)

231
F O R T H E P E R I O D E N D E D 3 1 M A R C H 2 0 1 6
NOTES TO THE ANNUAL FINANCIAL STATEMENTS
INTEGRATED ANNUAL REPORT 2015-2016
2015Incident Authorisation Amount Reason for condonationDeviation from Procurement Process (Placement of Advert in the Sunday Times Newspaper)
Condoned by the CEO
100 000 This was an urgent operational matter for TCTA, irregular expenditure incurred as a result of placing an advert in a newspaper for Celebrating TCTA’s 20 years of democracy, without following a proper Supply Chain Process.
AccPac condonation of irregular expenditure incurred as a result of using the services of the service provider after the contract has expired.
Condoned by the CEO
18 100 The contract expired with the service provider and additional technical support on the installed system was sought in order to avoid the business process disruption and the out of contract service provider.
Extension of Photocopier Contract – Gecko Technical Services
Condoned by the CEO
2 059 954 The contract with the service provider for on-going maintenance and support expired whilst the tender for the procurement of the new service provider was in the process but not finalised.
AMD Griffiths Valuation, expenditure exceeded the approved amount.
Condoned by the CEO
29 638 The deviation was a result of overspending on the approved contract value as a result of additional work that had to be done on the AMD Central Basin project which was more than what was anticipated when the contract was concluded with the service provider.
Cell phone Data Roaming Usage (COO)
Condoned by the CEO
2 057 The COO travelled abroad and the roaming was activated for her to conduct necessary business activities whilst away from office. However, due to the size of certain documents and emails the monthly limit was exceeded.
Cell phone Data Roaming Usage (CEO)
- 1 755 The CEO travelled abroad and the roaming was activated for him to conduct necessary business activities whilst away from office. However, due to the size of certain documents and emails the monthly limit was exceeded.
Contract 006 – 084 Ecologes condonation of irregular expenditure incurred as a result of using the services of the service provider after the contract has expired.
Condoned by the CEO
336 849 The service provider was appointed to conduct independent environmental audit, due to delays and time extension on the project, expenditure was incurred beyond the contract validity period.
Contract 006 -141 KWSAP Occupational Health and Safety Monitor Contract expired in May 2013, work continued on site without following procedure to seek approval for additional work.
Condoned by the CEO
44 000 The service provider was appointed to conduct Occupational Health and Safety monitoring, due to delays and time extension on the project, expenditure was incurred beyond the contract validity period.
Contract 008-002 rand Uranium - Services for maintenance of AMD Western Basin plan undertaken without approval for extension of expired contract
Condoned by the CEO
7 528 735 AMD is an emergency project which requires immediate instructions to proceed with certain emergency work, in this instance critical maintenance was needed and was undertaken without extension of expired contract.

232
F O R T H E P E R I O D E N D E D 3 1 M A R C H 2 0 1 6
NOTES TO THE ANNUAL FINANCIAL STATEMENTS
INTEGRATED ANNUAL REPORT 2015-2016
2015Incident Authorisation Amount Reason for condonationContract 007-128 Appraisal Corporation Work was done onsite which was later found to have exceeded the contact.
Condoned by the CEO
13 130 The service provider contract did not make a provision for disbursements, i.e. travelling and accommodation costs. The service provider travelled from Cape Town to MCWAP to conduct independent land valuation services, when the invoice was presented to TCTA the amount was in excess of the approved contract amount.
Contract for the appointment of Saacosh to provide for Occupational Health and Safety training to TCTA.
- 44 859 This irregular expenditure was discovered during the audit, which revealed that TCTA followed its procedures which are in conflict with the Delegation of Authority Matrix (DOA), which states “obtain a minimum of three quotes” whereas the procedures state “three quotes required”, the latter being the intent of the organisation. However, the wording of the DOA was effected differently, unintentionally, resulting in three quotes being requested instead of being obtained for the purposes of this reporting, the condonation from the Chief Executive Officer will be processed later.
Contract for the acquisition of the fraud hotline from the service provider Whistle Blowers.
- 3 950 This irregular expenditure was discovered during the audit, which revealed that TCTA followed its procedures which are in conflict with the Delegation of Authority Matrix (DOA), which states “obtain a minimum of three quotes” whereas the procedures state “three quotes required”, the latter being the intent of the organisation. However, the wording of the DOA was effected differently, unintentionally, resulting in three quotes being requested instead of being obtained for the purposes of this reporting, the condonation from the Chief Executive Officer will be processed later.
Contract for placing tender adverts with Broadsword service provider
- 49 698 This irregular expenditure was discovered during the audit, which revealed that TCTA followed its procedures which are in conflict with the Delegation of Authority Matrix (DOA), which states “obtain a minimum of three quotes” whereas the procedures state “three quotes required”, the latter being the intent of the organisation. However, the wording of the DOA was effected differently, unintentionally, resulting in three quotes being requested instead of being obtained for the purposes of this reporting, the condonation from the Chief Executive Officer will be processed later.
22.1 Irregular, fruitless and wasteful expenditure (continued)

233
F O R T H E P E R I O D E N D E D 3 1 M A R C H 2 0 1 6
NOTES TO THE ANNUAL FINANCIAL STATEMENTS
INTEGRATED ANNUAL REPORT 2015-2016
2015Incident Authorisation Amount Reason for condonationContract for the painting of storerooms by Mfiso Brothers Construction
- 115 675 This irregular expenditure was discovered during the audit, which revealed that TCTA followed its procedures which are in conflict with the Delegation of Authority Matrix (DOA), which states “obtain a minimum of three quotes” whereas the procedures state “three quotes required”, the latter being the intent of the organisation. However, the wording of the DOA was effected differently, unintentionally, resulting in three quotes being requested instead of being obtained for the purposes of this reporting, the condonation from the Chief Executive Officer will be processed later.
Contract for placing adverts for the events management company with Broadsword service provider
- 70 256 This irregular expenditure was discovered during the audit, which revealed that TCTA followed its procedures which are in conflict with the Delegation of Authority Matrix (DOA), which states “obtain a minimum of three quotes” whereas the procedures state “three quotes required”, the latter being the intent of the organisation. However, the wording of the DOA was effected differently, unintentionally, resulting in three quotes being requested instead of being obtained for the purposes of this reporting, the condonation from the Chief Executive Officer will be processed later.
Contract for the appointment of the service provider to provide massage services – Kura- Bahati Consulting
- 94 392 This irregular expenditure was discovered during the audit, which revealed that TCTA followed its procedures which are in conflict with the Delegation of Authority Matrix (DOA), which states “obtain a minimum of three quotes” whereas the procedures state “three quotes required”, the latter being the intent of the organisation. However, the wording of the DOA was effected differently, unintentionally, resulting in three quotes being requested instead of being obtained for the purposes of this reporting, the condonation from the Chief Executive Officer will be processed later.
Contract for placing career adverts in the newspaper with Blackmoon service provider
- 56 663 This irregular expenditure was discovered during the audit, which revealed that TCTA followed its procedures which are in conflict with the Delegation of Authority Matrix (DOA), which states “obtain a minimum of three quotes” whereas the procedures state “three quotes required”, the latter being the intent of the organisation. However, the wording of the DOA was effected differently, unintentionally, resulting in three quotes being requested instead of being obtained for the purposes of this reporting, the condonation from the Chief Executive Officer will be processed later.

234
F O R T H E P E R I O D E N D E D 3 1 M A R C H 2 0 1 6
NOTES TO THE ANNUAL FINANCIAL STATEMENTS
INTEGRATED ANNUAL REPORT 2015-2016
2015Incident Authorisation Amount Reason for condonationContract procurement of blade centre and active directory : Sona Sha
- 95 475 This irregular expenditure was discovered during the audit, which revealed that TCTA followed its procedures which are in conflict with the Delegation of Authority Matrix (DOA), which states “obtain a minimum of three quotes” whereas the procedures state “three quotes required”, the latter being the intent of the organisation. However, the wording of the DOA was effected differently, unintentionally, resulting in three quotes being requested instead of being obtained for the purposes of this reporting, the condonation from the Chief Executive Officer will be processed later.
Contract for the appointment of laptop encryption service provider: Dynamic Recovery
- 159 331 This irregular expenditure was discovered during the audit, which revealed that TCTA followed its procedures which are in conflict with the Delegation of Authority Matrix (DOA), which states “obtain a minimum of three quotes” whereas the procedures state “three quotes required”, the latter being the intent of the organisation. However, the wording of the DOA was effected differently, unintentionally, resulting in three quotes being requested instead of being obtained for the purposes of this reporting, the condonation from the Chief Executive Officer will be processed later.
Contract for the appointment of a service provider to supply twenty desktop computers; Dynalogic Computers
- 198 550 This irregular expenditure was discovered during the audit, which revealed that TCTA followed its procedures which are in conflict with the Delegation of Authority Matrix (DOA), which states “obtain a minimum of three quotes” whereas the procedures state “three quotes required”, the latter being the intent of the organisation. However, the wording of the DOA was effected differently, unintentionally, resulting in three quotes being requested instead of being obtained for the purposes of this reporting, the condonation from the Chief Executive Officer will be processed later.
Total irregular expenditure prior period
11 023 067
22.1 Irregular, fruitless and wasteful expenditure (continued)

235
F O R T H E P E R I O D E N D E D 3 1 M A R C H 2 0 1 6
NOTES TO THE ANNUAL FINANCIAL STATEMENTS
INTEGRATED ANNUAL REPORT 2015-2016
22.1.2 Fruitless and wasteful expenditure
“Fruitless and wasteful expenditure” is defined as expenditure which was made in vain and would have been avoided had reasonable care been exercised. Fruitless and wasteful expenditure means an expenditure which was undertaken without a value or substance and which did not yield any desired results or outcome, and reasonable care to be exercised in order to avoid fruitless and wasteful expenditure is defined as, applying due diligence (careful application, attentiveness, caution) to ensure that the probability of a transaction, event or condition not being achieved as planned is being managed to an acceptable level.
2016 2015Reconciliation of fruitless and wasteful expenditure Rand Rand
Opening balance - 2 334 144 61 438 Fruitless and wasteful expenditure current year 36 430 758 2 272 706 To be recovered – contingent assetFruitless and wasteful expenditure 38 764 902 2 334 144
2016Incident Amount Action taken
Non attendance of scheduled training and workshop by employees.
17 556 Management Issued Verbal Warnings to Employees who failed to attend scheduled training and Workshops.
Penalty levied for late cancellation of accommodation and shuttle service
1 470 The accommodation matter could not be concluded due to conflicting version between the service provider and employee. A verbal warning was issued to the employees responsible for the shuttle service.
Interest on late payment of VAT on advance received 36 411 732 This matter relates to VAT on advance payments received, being paid at the time of supply and not on receipt. Management took a conservative decision to adjust for this. This arose due to a different interpretation on the treatment of VAT on advance payments.
Fruitless and wasteful expenditure 36 430 758

236
F O R T H E P E R I O D E N D E D 3 1 M A R C H 2 0 1 6
NOTES TO THE ANNUAL FINANCIAL STATEMENTS
INTEGRATED ANNUAL REPORT 2015-2016
2015 Incident Amount Remedial
ActionReason for not taking action
Specialised Software Development (Synthesis), the service provider had an open ended contract with TCTA and they continued to invoice TCTA even though support was no longer offered and the system not in use.
71 506 None It was an oversight on the management of the contract with the service provider as a result the service provider continued invoicing TCTA even though there was no support for the Front Integrator and Treasury department was no longer using Bond Exchange Connector.
Training Paid for and not attended (SHE Training) Project Assurance Manager
2 850 None The Project Assurance Manager received a call to attend to urgent project matter and also due to this involvement with OHS matters in project, Facilities Manager concurred that he can be excused from attending the training.
Training not attended due to unplanned EXCO Strategy session (Penalty for Cancellation) CFO
2 750 None The CFO had to attend an unplanned EXCO Strategy session and she was therefore unable to attend the scheduled SAICA training.
Sage 300 ERP, the software was bought with an intention to be used during the implementation of Sage X3 to TCTA and the project was cancelled after the expenditure had been incurred
321 715 None The project was cancelled and the software had already been procured before the problems that led to the cancellation of the project were experienced.
MTN Cellphone Contracts, fees paid for subscription on corporate cellphone contracts as a result of overlap during a transition from MTN to Vodacom.
65 168 None The expenditure was incurred as a result of the transition from MTN to Vodacom as a service provider for mobile devices to TCTA, even though the notice of termination was given on time to MTN, MTN delayed the process of terminating and migrating cellphone lines from contract to pre-paid.
Accommodation in excess of Treasury Stipulation of R1300
6 320 None The expenditure was incurred as a result of the fact that accommodation in some establishments is above the prescribed limit and there is no alternative accommodation less or equal to the prescribed amount in those specific areas, more especially in remote areas of the country where TCTA projects are located.
Board’s Chairman cell phone, three months subscription and early contract termination costs paid to MTN after the expiry of his term of office.
2 495 None The term of office for the Chairman came to an end and expenditure was incurred when TCTA was busy with the cancellation process with MTN and the cost includes the early termination fee.
22.1 Irregular, fruitless and wasteful expenditure (continued)

237
F O R T H E P E R I O D E N D E D 3 1 M A R C H 2 0 1 6
NOTES TO THE ANNUAL FINANCIAL STATEMENTS
INTEGRATED ANNUAL REPORT 2015-2016
2015 Incident Amount Remedial
ActionReason for not taking action
Agisana Licenses and Maintenance (2013/14), money paid to Eskom for maintenance and licence fees of Primavera software as a result of the provisions of the contract.
1 382 755 None The Agisana (ESKOM and TCTA) contract is unilateral and contains a deeming provision which backdates the contract despite the contracting date, which results in retrospective liability with regards to licencing costs. The expenditure incurred was unavoidable.
Agisana Licenses and Maintenance (2013/14), money paid to Eskom for maintenance and licence fees of Primavera software as a result of the provisions of the contract.
367 499 None The Agisana contract (ESKOM and TCTA) is unilateral and contains a deeming provision which backdates the contract despite the contracting date, which results in retrospective liability with regards to licencing costs. The expenditure incurred was unavoidable.
Penalties paid for trading outside the “trading window”.
25 000 None This was an operational matter, due to the fact that a deal had already occurred between TCTA and Nedbank. The settlement occurred after 15:30 and attracted a penalty of R25 000.00 for dealing outside the window time.
SARS outstanding PAYE payment including additional interest for late payment.
10 339 None SARS did a reconciliation of TCTA’s 2011 financial year and concluded that there is money due by TCTA in respect of that financial year. The expenditure incurred as a result of such outstanding PAYE plus daily interest from the date of notification by SARS.
Workmen’s Compensation Fund late payment interest and penalties.
14 310 None TCTA requested a letter of good standing and it was only then that the Workmen’s Compensation Fund informed TCTA that there is an outstanding amount that needs to be settled first before a letter is issued. TCTA had maintained all the payments and was not aware any outstanding amount and had not received any notification to pay from Workmen’s Compensation Fund.
Total Fruitless and wasteful expenditure
2 272 706

238
F O R T H E P E R I O D E N D E D 3 1 M A R C H 2 0 1 6
NOTES TO THE ANNUAL FINANCIAL STATEMENTS
INTEGRATED ANNUAL REPORT 2015-2016
22.2 Losses resulting from criminal conduct
Reconciliation of losses resulting from criminal conduct
2016 2015Rand Rand
Opening balance - 585 000 - Losses resulting from criminal conduct current year
- 585 000
To be recovered – contingent asset - - Losses resulting from criminal conduct 585 000 585 000
2016: No losses incurred as a result of criminal conduct.
2015
Incident Amount Disciplinary steps/criminal proceedingsFraud committed by a Senior Manager on SED Projects.
585 000 Internal Disciplinary Action and Dismissal. The matter has been reported to the police in terms of section 34 of Prevention and Combatting of Corrupt Activities Act, Act No. 12 of 2004 and currently being investigated by South African Police Service.
Total 585 000
23. CRITICAL ACCOUNTING ESTIMATES AND JUDGEMENTS
In the process of applying TCTA’s accounting policies, management makes various estimates and judgements based on past experience, expectations of the future and other information. The key sources of estimation uncertainty and the critical judgements that can significantly affect the amounts recognised in the financial statements are disclosed below:
Estimates and assumptionsThe following key assumptions and other key sources of estimation uncertainty have a significant risk of causing a material adjustment to the carrying amounts of assets and liabilities, as presented in these financial statements, within the next financial year. TCTA based its assumptions and estimates on parameters available when the financial statements were prepared. Any changes to existing conditions, such as market changes or circumstances beyond TCTA’s control, are reflected in the assumptions when they occur.
23.1 Provision for compensation
This provision relates to compensation payments being paid on the LHWP over a fifty-year period.
TCTA is reliant on the LHDA for information relating to the compensation provision at year end, as well as payments made to the respective recipients. The provision has been based on the expected payments for the water transfer contracts, derived from the information obtained from the LHDA, adjusted for expected future increases in CPI in Lesotho as obtained from BER (Bureau for Economic Research). The future cash flows are present valued at a year-end rate representative of appropriate time value of money for the underlying cash flows. Refer to note 12.3 for the reconciliation of the compensation provision and note 3.3.9.1 for the accounting policy.

239
F O R T H E P E R I O D E N D E D 3 1 M A R C H 2 0 1 6
NOTES TO THE ANNUAL FINANCIAL STATEMENTS
INTEGRATED ANNUAL REPORT 2015-2016
23.2 Estimates of cash flows imputed in the tariff receivable financial asset
At the inception of each project, TCTA estimates the construction costs to be incurred and tariffs to be received over the debt repayment period. The projected costs are based on the estimates of timing and cost as approved by the TCTA Board and the respective project off-takers in the project charters. At each reporting date, these estimates are revised to take into account changes in the timing of the contract, costs due to escalation and variation orders.
TCTA estimates the future receipt of tariffs from DWS using projected demand consumption as forecast by DWS, to arrive at a tariff that will repay all debt and operating costs when the long-term facilities expire. The estimated tariff will also include the forecasting of inflation where the project water supply agreement with DWS allows for inflationary increases in the tariff over the life of the project. Water demand consumption and inflation are revised on an annual basis using the best estimates available from DWS and reputable economic research agencies respectively. Refer to note 7.4.
23.3 Operating segments
IFRS 8 requires that the results and information with regards to identified segments are regularly reviewed by the entity’s CODM to make decisions about resources to be allocated to the segment and assess its performance. TCTA considers the monthly reporting to and review by the CODM as “regular”. Refer to Note 4 for further disclosures.

240
F O R T H E P E R I O D E N D E D 3 1 M A R C H 2 0 1 6
NOTES TO THE ANNUAL FINANCIAL STATEMENTS
INTEGRATED ANNUAL REPORT 2015-2016
23.4 Property Plant and Equipment estimation of useful lives
The useful life of an asset is defined in terms of the asset’s expected utility to TCTA. The asset management policy of TCTA may specify the disposal of assets after a specified time or after consumption of a specified proportion of the future economic benefits embodied in the asset.
Thus, the useful life of an asset may be shorter than its economic life and the estimation of the useful life of the asset is a matter of judgement based on the experience of TCTA with similar assets.
Useful life represents: (a) the period over which an asset is expected to be available for use by TCTA; or(b) the number of production or similar units expected to be obtained from the asset by TCTA. Consequently, all the following factors are considered in determining the useful life of an asset: (a) expected usage of the asset. Usage is assessed by reference to the asset’s expected capacity or physical output.(b) expected physical wear and tear, which depends on operational factors such as the number of shifts for
which the asset is to be used and the repair and maintenance programme, and the care and maintenance of the asset while idle.
(c) technical or commercial obsolescence arising from changes or improvements in production, or from a change in the market demand for the product or service output of the asset.
(d) legal or similar limits on the use of the asset, such as the expiry dates of related leases. Useful life may differ from division to division and may differ from asset to asset. if there are two similar machines, but the one machine runs at a higher capacity than the other, the useful life of the machine running at the higher capacity will probably be shorter than the other machine. If circumstances relating to the usage of an asset change, this may necessitate a change in the useful life of that asset. The useful lives of assets are assessed as follows: - annually for assets with a value above R100 000, at the time of initial recognition; and- when there is an indication of impairment for all assets below R100 000 at the time of initial recognition. The carrying amount of Property, Plant and Equipment can be found in note 6.
23. 5 Modification to the LHWP tariff receivable During the year the Minister approved a tariff for cost recovery which includes both the LHWP 1&2 as well as AMD. AMD was therefore amalgamated with LHWP, as the funding and recovery of the projects have been combined to form the new VRS project. Phase 2 of LHWP started during the current year. As a result of the amalgamation of the projects and the introduction of Phase 2, the cash flows related to the LHWP tariff receivable have changed substantially. Management is of the view that this change in the contractual cash flows of the original LHWP tariff receivable represents a substantial modification i.e. that TCTA has exchanged or modified the cash flows of the original tariff receivable, for a new tariff receivable having significantly different future cash flows of the tariff receivable. This results in derecognition of the original LHWP receivable and recognition of a new tariff receivable (VRS) at fair value. The difference between the carrying amount of the original receivable and the new tariff receivable (which is recognised at fair value) is recognised in profit or loss (refer to note 17.2 for the loss on rerecognition of the tariff receivable).
23. 6 Provision for incentives
The incentive provision is estimated at the end of each financial year. The total incentive pool is based on the total actual salaries incurred for the year, multiplied by a factor based on the performance rating of the entity. The performance rating is determined with reference to the expected organisational score and the resulting amount of the final pool is approved at the discretion of the Board of Directors .

241
F O R T H E P E R I O D E N D E D 3 1 M A R C H 2 0 1 6
NOTES TO THE ANNUAL FINANCIAL STATEMENTS
INTEGRATED ANNUAL REPORT 2015-2016
24 CONTINGENT LIABILITY
24.1 Litigation and claims against TCTA
In the ordinary course of business, TCTA is involved in various legal actions and claims, including those related to contract awards, and property expropriation required to execute its directives. Although the outcome of the legal proceedings cannot be predicted with certainty, TCTA believes it will succeed in its action and that adequate provisions have been made for such matters. The litigation matters have been detailed below:
24.1.1 Vaal River Eastern Sub-system Augmentation Project - VRESAPA summons was served on TCTA claiming R11 million for damages suffered by the claimant arising out of land acquisition activities in the implementation of the VRESAP. TCTA instructed its attorneys to enter appearance to defend on TCTA’s behalf. TCTA agreed with the claimants attorneys to explore the possibility of settling the matter by 31 July 2014 and consulted with Senior Counsel and attended a site visit to the claimants farm in order for the Senior Counsel to draft TCTA’s plea on the summons. This matter is progressing.
24.1.2 Acid Mine Drainage (AMD)An urgent application for an interdict was served to TCTA on 19 April 2013 by the landowner of a property adjacent to the proposed AMD treatment plant in the Central Basin, on which TCTA served an expropriation notice for the expropriation of land rights as part of its project implementation activities. The claim is valued at R43 million. The application is two-fold: i) An application for an urgent interdict to stop the continued construction of the AMD treatment plant, the
construction of pipelines and ancillary works at the proposed construction site; and an interdict against the decision of TCTA to expropriate a right of servitude over the Applicant’s property to construct three underground pipelines as part of the Central Basin treatment plant. This part has been successfully opposed and the application for interdict was refused.
ii) Secondly, the application request the review of: • the decision of the Minister of Water and Sanitation on 6 April 2011 directing TCTA in terms of Section
103(2) of the National Water Act to undertake certain emergency works to treat acid mine drainage on the Witwatersrand Goldfields,
• the decision to declare the project as an emergency project; • the decision of the Minister of Water and Environmental that the works required to discharge the neutralised
acid mine drainage into the receiving rivers is of a temporary nature of less than 5 years and not subject to an environmental impact assessment process;
• requesting that the decision of the Department of Environmental Affairs to grant the Department of Water and Sanitation authorisation for the immediate and short term interventions for the treatment of acid mine drainage and for the construction of an AMD treatment plant in the Central Basin and ancillary works;
• and set aside of the decision of TCTA and the Minster of Water and Environmental Affairs to expropriate a right of servitude over the Applicant’s property.
TCTA is required to file opposition to the review application launched by the applicant, including disclosure of a record of all decisions which are sought to be reviewed and set aside together with reasons which it is required by law to give and to notify the applicant that it has done so. Extensive liaison will be required with the legal representatives acting on behalf of the Minster, DWS, Group Five and DEA, who are cited as co-respondents in the matter. The record of decisions was finalised and disclosed to the applicant. TCTA attended consultations with Counsel regarding the drafting and re-drafting of Supplementary Affidavit. Following the above consultations, TCTA finalised all Supplementary Answering Affidavits and lodged same in the High Court. TCTA has good grounds not to settle this matter. TCTA has expropriated servitudes and has tendered payment of R36 410, being the value of the servitudes expropriated and no additonal payments are expected to be made. The matter is proceeding.

242
F O R T H E P E R I O D E N D E D 3 1 M A R C H 2 0 1 6
NOTES TO THE ANNUAL FINANCIAL STATEMENTS
INTEGRATED ANNUAL REPORT 2015-2016
24.1.3 Phase II of the Mooi-Mgeni Transfer Scheme - MMTS-2Summons was served at TCTA’s premises and DWS on 30 July 2013 following expropriation of the land by TCTA. The landowner is claiming higher compensation but sued DWS instead of TCTA and subsequently brought an application to join TCTA into the proceedings. TCTA consented to the joinder application. TCTA filed its special plea on the basis that the claim prescribed in terms of the Expropriation Act. The onus is on the plaintiff to set down the matter for trial. The matter is still pending.
24.1.4 Acid Mine Drainage (AMD)TCTA was served with a summons by the landowner on 27 November 2015. TCTA and Minister of Water and Sanitation are cited as the first and second defendants respectively. TCTA expropriated 4 servitudes over properties belonging to the landowner for purposes of implementing the AMD project in the Central Basin. The claim is as follows regarding the expropriated servitudes: Claim A : The landowner claims an amount of R4 million, together with interest and costs thereon on the basis that TCTA had accepted the offer, alternatively; Claim B: The landowner claims an amount of R3.6 million, together with interest and costs thereon, for suffering an actual financial loss as a result of expropriation of each of the 4 servitudes. Following TCTA entering an appearance to defend the matter, the landowner brought an application for summary judgment based primarily on Part A of its claim i.e. that TCTA had accepted its offer. TCTA filed its opposing affidavits and shortly before the matter was due to be heard on 18 March 2016, the plaintiff’s attorneys elected to withdraw the application for summary judgment. TCTA has expropriated servitudes and has tendered payment of an amount of R366 773, being the value of the servitudes expropriated and no additional payments are expected to be made. The matter is being defended and TCTA will be filing its plea in the matter shortly.
24.1.5 Acid Mine Drainage (AMD)A contractor lodged a claim of approximately R7 million against TCTA, arising out of the purchase of pumps by TCTA in an amount of R119 million. The contractor claims that the additional amount of R7 million is due as a result of fluctuations in the exchange rate that occurred from the time the contract was concluded and the time that payment was made in various tranches to the contractor. TCTA has taken legal advice on the merits of its defence and has indicated to the contractor that the matter will be defended. The matter has progressed to the stage where TCTA made a settlement offer to the contractor which is considering the offer and has approached TCTA to discuss same. The matter is being monitored in the event that the contractor elects to proceed to arbitration.
24.1.6 Human resource related mattersThere is I (one) arbitration matter relating to a previously employed executive manager claiming for non-payment of an incentive bonus and the extension of her contract of employment. The matter was heard at the CCMA and an arbitration award was issued in June 2016, in favour of the employee. On 30 June 2016, TCTA submitted its founding affidavit which calls for a review of the case. The CCMA’s arbitration award was for approximately R3 million.
24.1 Litigation and claims against TCTA (continued)

243
F O R T H E P E R I O D E N D E D 3 1 M A R C H 2 0 1 6
NOTES TO THE ANNUAL FINANCIAL STATEMENTS
INTEGRATED ANNUAL REPORT 2015-2016
25. EMPLOYEE BENEFITS
25.1 Short term employee benefits
TCTA does not contribute to any defined retirement or medical aid fund. It does not have a liability for the provision of retirement funding. The emoluments paid to individuals include a sum for the provision of their own medical aid and pension benefits.
26. EVENTS AFTER THE REPORTING PERIOD
No material facts or circumstances have arisen between the year end and the date of the signing of these financial statements.
27. GOING CONCERN
The underlying operating model for TCTA has remained the same as it has been in previous years, and continues to assure the long-term solvency of TCTA, as well as the ability to meet all its obligations as they fall due. TCTA’s solvency is secured by the tariff methodology, income agreements and guarantees (explicit and implicit), that provide certainty that all costs incurred by TCTA will be fully funded either through user tariffs as the debt is repaid or through direct cost-recovery payments from the Department of Water and Sanitation. TCTA’s management is certain that TCTA will have sufficient resources to continue in operational existence for the foreseeable future and for this reason the going concern basis continues to be adopted in preparing the financial statements for the year ended 31 March 2016. Furthermore, no material uncertainties related to events or conditions that may cast a significant doubt on the ability of TCTA to continue as a going concern have been identified.

244INTEGRATED ANNUAL REPORT 2015-2016
VRS BWP VRESAP MCWAP MMTS ORWRDP KWSAP BOREHOLE MMTS-1 UMGENI KRIEL TOTAL Notes R million R million R million R million R million R million R million R million R million R million R million R million CASH FLOW FROM OPERATING ACTIVITIES Cash receipts on tariff receivable 4 375 203 427 197 253 191 117 - - - 20 5 783 Cash paid to suppliers and employees (1 979) (3) (6) (214) (331) (311) 10 - - (2) (20) (2 856)Cash generated from project activities A 2 396 200 421 (17) (78) (120) 127 - - (2) - 2 927 Interest paid C (1 865) (77) (346) (101) (129) (29) (40) - - - - (2 587) Net cash (outflow)/inflow from operating activities 531 123 75 (118) (207) (149) 87 - - (2) - 340 CASH FLOW FROM INVESTING ACTIVITIES Payments to acquire financial assets (670) - (50) - (210) - (82) - - - - (1 012)Proceeds on the sale of financial assets - 66 - 123 - 138 - - - - - 327 Interest received B 373 4 3 4 15 11 3 - - 2 - 415 Addition to property, plant and equipment (4) - - - - - - - - - - (4) - Net cash (ouflow) from investing activities (301) 70 (47) 127 (195) 149 (79) - - 2 - (274) CASH FLOW FROM FINANCING ACTIVITIES Proceeds from long-term borrowings - - 150 - 556 - - - - - - 706 Repayments on long-term borrowings (354) (77) (165) (9) (124) - (8) - - - - (737)Proceeds from short-term borrowings 125 - 101 - 12 - - - - - - 238 Repayments on short-term borrowings - (116) (114) - (42) - - - - - - (272) Net cash inflow from financing activities (229) (193) (28) (9) 402 - (8) - - - - (65) Net (decrease) in cash and cash equivalents 1 - - - - - - - - - - 1 Cash and cash equivalents at beginning of period - - - - - - - - - - - - Cash and cash equivalents at end of period D 1 - - - - - - - - - - 1
ANNEXURE AF O R T H E Y E A R E N D E D 3 1 M A R C H 2 0 1 6
SEGMENTAL STATEMENT OF CASH FLOWS

245 INTEGRATED ANNUAL REPORT 2015-2016
VRS BWP VRESAP MCWAP MMTS ORWRDP KWSAP BOREHOLE MMTS-1 UMGENI KRIEL TOTAL Notes R million R million R million R million R million R million R million R million R million R million R million R million CASH FLOW FROM OPERATING ACTIVITIES Cash receipts on tariff receivable 4 375 203 427 197 253 191 117 - - - 20 5 783 Cash paid to suppliers and employees (1 979) (3) (6) (214) (331) (311) 10 - - (2) (20) (2 856)Cash generated from project activities A 2 396 200 421 (17) (78) (120) 127 - - (2) - 2 927 Interest paid C (1 865) (77) (346) (101) (129) (29) (40) - - - - (2 587) Net cash (outflow)/inflow from operating activities 531 123 75 (118) (207) (149) 87 - - (2) - 340 CASH FLOW FROM INVESTING ACTIVITIES Payments to acquire financial assets (670) - (50) - (210) - (82) - - - - (1 012)Proceeds on the sale of financial assets - 66 - 123 - 138 - - - - - 327 Interest received B 373 4 3 4 15 11 3 - - 2 - 415 Addition to property, plant and equipment (4) - - - - - - - - - - (4) - Net cash (ouflow) from investing activities (301) 70 (47) 127 (195) 149 (79) - - 2 - (274) CASH FLOW FROM FINANCING ACTIVITIES Proceeds from long-term borrowings - - 150 - 556 - - - - - - 706 Repayments on long-term borrowings (354) (77) (165) (9) (124) - (8) - - - - (737)Proceeds from short-term borrowings 125 - 101 - 12 - - - - - - 238 Repayments on short-term borrowings - (116) (114) - (42) - - - - - - (272) Net cash inflow from financing activities (229) (193) (28) (9) 402 - (8) - - - - (65) Net (decrease) in cash and cash equivalents 1 - - - - - - - - - - 1 Cash and cash equivalents at beginning of period - - - - - - - - - - - - Cash and cash equivalents at end of period D 1 - - - - - - - - - - 1

246INTEGRATED ANNUAL REPORT 2015-2016
VRS BWP VRESAP MCWAP MMTS ORWRDP KWSAP BOREHOLE MMTS-1 UMGENI KRIEL TOTAL Notes R million R million R million R million R million R million R million R million R million R million R million R million A. CASH GENERATED FROM PROJECT
ACTIVITIES
Net surplus / (deficit) for the year (1 885) 12 60 (130) 35 - 184 - - 2 - (1 722) Adjustments for non cash flow items and amounts separately disclosed:
Depreciation on non-current assets 6 - - - - - - - - - - 6 Net interest income/(expense) excluding tariff receivable
1 978 73 362 116 137 18 113 - - (2) - 2 795
Foreign exchange gains (10) - - - - - - - - - - (10)Foreign exchange losses 13 - - - - - - - - - - 13 Interest income and imputed interest on tariff receivable
(97) (85) (422) 14 (172) - (297) - - - - (1 059)
Construction revenue (1 078) (0) (13) (172) (260) (304) (3) - (4) (56) (2) (1 892)Other income (997) (5) (6) - - - (5) - (1 013)Non cash flow in operating expenses (139) - - - (3) - - - - 1 - (141)Changes in working capital: - (Increase) / decrease in loans and other receivables 1 949 - - (31) 36 250 - - 2 53 (18) 2 241 (Increase) / decrease in prepayments 16 - - 1 19 - - - - - 36 (Decrease)/ increase in payables and
provisions(excluding interest payable) (651) 2 13 (12) (89) (388) 18 - (2) (56) 18 (1 147)
Capitalised to / (removed from) Tariff Receivable 4 186 203 427 197 216 - 117 - - - - 5 346 Non cash flow item in accounts receivable (895) - - - 3 304 - - 4 56 2 (526) Non cash flow item in accounts payable - - - - - - - - - - - Cash generated from project activities 2 396 200 421 (17) (78) (120) 127 - - (2) - 2 927 B. INTEREST RECEIVED Amount due at beginning of the year 21 - - - 1 - - - - - - 22 Income during the year adjusted for non-cash items 382 4 3 4 16 11 3 - - 2 - 425 Interest accrued (1) 502 4 3 4 16 11 3 - - 2 - 545 Bond premium amortised (115) - - - - - - - - - - (115)Imputed interest on compensation - Interest on RSA account (5) - - - - (5)Amount due at the end of the year (30) - - - (2) - - - - - - (32) Interest received 373 4 3 4 15 11 3 - - 2 - 415
(1) Interest accrued excludes imputed interest on the tariff receivable
ANNEXURE AF O R T H E Y E A R E N D E D 3 1 M A R C H 2 0 1 6
NOTES TO THE SEGMENTAL STATEMENT OF CASH FLOWS

247 INTEGRATED ANNUAL REPORT 2015-2016
VRS BWP VRESAP MCWAP MMTS ORWRDP KWSAP BOREHOLE MMTS-1 UMGENI KRIEL TOTAL Notes R million R million R million R million R million R million R million R million R million R million R million R million A. CASH GENERATED FROM PROJECT
ACTIVITIES
Net surplus / (deficit) for the year (1 885) 12 60 (130) 35 - 184 - - 2 - (1 722) Adjustments for non cash flow items and amounts separately disclosed:
Depreciation on non-current assets 6 - - - - - - - - - - 6 Net interest income/(expense) excluding tariff receivable
1 978 73 362 116 137 18 113 - - (2) - 2 795
Foreign exchange gains (10) - - - - - - - - - - (10)Foreign exchange losses 13 - - - - - - - - - - 13 Interest income and imputed interest on tariff receivable
(97) (85) (422) 14 (172) - (297) - - - - (1 059)
Construction revenue (1 078) (0) (13) (172) (260) (304) (3) - (4) (56) (2) (1 892)Other income (997) (5) (6) - - - (5) - (1 013)Non cash flow in operating expenses (139) - - - (3) - - - - 1 - (141)Changes in working capital: - (Increase) / decrease in loans and other receivables 1 949 - - (31) 36 250 - - 2 53 (18) 2 241 (Increase) / decrease in prepayments 16 - - 1 19 - - - - - 36 (Decrease)/ increase in payables and
provisions(excluding interest payable) (651) 2 13 (12) (89) (388) 18 - (2) (56) 18 (1 147)
Capitalised to / (removed from) Tariff Receivable 4 186 203 427 197 216 - 117 - - - - 5 346 Non cash flow item in accounts receivable (895) - - - 3 304 - - 4 56 2 (526) Non cash flow item in accounts payable - - - - - - - - - - - Cash generated from project activities 2 396 200 421 (17) (78) (120) 127 - - (2) - 2 927 B. INTEREST RECEIVED Amount due at beginning of the year 21 - - - 1 - - - - - - 22 Income during the year adjusted for non-cash items 382 4 3 4 16 11 3 - - 2 - 425 Interest accrued (1) 502 4 3 4 16 11 3 - - 2 - 545 Bond premium amortised (115) - - - - - - - - - - (115)Imputed interest on compensation - Interest on RSA account (5) - - - - (5)Amount due at the end of the year (30) - - - (2) - - - - - - (32) Interest received 373 4 3 4 15 11 3 - - 2 - 415
(1) Interest accrued excludes imputed interest on the tariff receivable

248INTEGRATED ANNUAL REPORT 2015-2016
VRS BWP VRESAP MCWAP MMTS ORWRDP KWSAP BOREHOLE MMTS-1 UMGENI KRIEL TOTAL Notes R million R million R million R million R million R million R million R million R million R million R million R million C. INTEREST PAID Amount not paid at beginning of the year (501) (2) (40) - (15) - - - - - - (558) Expensed during the year adjusted for non-cash items
(1 823) (77) (347) (114) (139) (29) (42) - - - - (2 571)
Amount expensed (excluding imputed interest) (2 480) (77) (365) (120) (153) (29) (116) - - - - (3 340)Less: Bond discount amortised 1 - - - - - - - - - - 1 Foreign loan payments - - - - - - - - - - - - Loss on switch auction 42 - - - - - - - - - - 42 Capital adjustment to inflation-linked liability 544 - - - - - - - - - - 544 Prepaid interest on EIB loan 1 - - - - - - - - - - 1 Interest on compensation 34 - - - - - - - - - - 34 Interest on umgeni - - - - 2 - - - - - - 2 Interest capitalised to the principal amount (2) - - 18 6 12 - 74 - - - - 110 Accrued interest on switched bonds 35 - - - - - - - - - - 35 Amount not paid at the end of the year 459 2 41 13 25 - 2 - - - - 542 Interest paid (1 865) (77) (346) (101) (129) (29) (40) - - - - (2 587) D. CASH AND CASH EQUIVALENTS AT END
OF PERIOD
Cash and cash equivalents consist of cash on hand and balances with banks.
1 - - - - - - - - - - 1
The cash flow movement in Tariff receivable is shown under operating activities, as projects are exceeding the standard one year cycle.
(1) - Interest accrued excludes imputed interest on the tariff receivable.(2) - This relates to interest accrued but not due for payment.
ANNEXURE AF O R T H E Y E A R E N D E D 3 1 M A R C H 2 0 1 6
NOTES TO THE SEGMENTAL STATEMENT OF CASH FLOWS

249 INTEGRATED ANNUAL REPORT 2015-2016
VRS BWP VRESAP MCWAP MMTS ORWRDP KWSAP BOREHOLE MMTS-1 UMGENI KRIEL TOTAL Notes R million R million R million R million R million R million R million R million R million R million R million R million C. INTEREST PAID Amount not paid at beginning of the year (501) (2) (40) - (15) - - - - - - (558) Expensed during the year adjusted for non-cash items
(1 823) (77) (347) (114) (139) (29) (42) - - - - (2 571)
Amount expensed (excluding imputed interest) (2 480) (77) (365) (120) (153) (29) (116) - - - - (3 340)Less: Bond discount amortised 1 - - - - - - - - - - 1 Foreign loan payments - - - - - - - - - - - - Loss on switch auction 42 - - - - - - - - - - 42 Capital adjustment to inflation-linked liability 544 - - - - - - - - - - 544 Prepaid interest on EIB loan 1 - - - - - - - - - - 1 Interest on compensation 34 - - - - - - - - - - 34 Interest on umgeni - - - - 2 - - - - - - 2 Interest capitalised to the principal amount (2) - - 18 6 12 - 74 - - - - 110 Accrued interest on switched bonds 35 - - - - - - - - - - 35 Amount not paid at the end of the year 459 2 41 13 25 - 2 - - - - 542 Interest paid (1 865) (77) (346) (101) (129) (29) (40) - - - - (2 587) D. CASH AND CASH EQUIVALENTS AT END
OF PERIOD
Cash and cash equivalents consist of cash on hand and balances with banks.
1 - - - - - - - - - - 1
The cash flow movement in Tariff receivable is shown under operating activities, as projects are exceeding the standard one year cycle.
(1) - Interest accrued excludes imputed interest on the tariff receivable.(2) - This relates to interest accrued but not due for payment.

250INTEGRATED ANNUAL REPORT 2015-2016
ANNEXURE AF O R T H E Y E A R E N D E D 3 1 M A R C H 2 0 1 5
SEGMENTAL STATEMENT OF CASH FLOWS
LHWP AMD VRS (LHWP and AMD)
BWP VRESAP MCWAP MMTS ORWRDP KWSAP BOREHOLE MMTS-1 UMGENI TOTAL
Notes R million R million R million R million R million R million R million R million R million R million R million R million R million CASH FLOW FROM OPERATING ACTIVITIES Cash receipts on tariff receivable 3 557 112 3 669 187 327 - 162 550 110 - - - 5 005 Cash paid to suppliers and employees (1 561) 7 (1 554) 3 (109) (243) (286) (535) (35) - - (1) (2 760)Cash generated from project activities A 1 996 119 2 115 190 218 (243) (124) 15 75 - - (1) 2 245 Interest paid C (1 714) (57) (1 771) (88) (341) (9) (84) - (6) - - - (2 299) Net cash (outflow)/inflow from operating activities 282 62 344 102 (123) (252) (208) 15 69 - - (1) (54) CASH FLOW FROM INVESTING ACTIVITIES Payments to acquire financial assets (340) (64) (404) (65) - (155) - (27) - - - - (651)Proceeds on the sale of financial assets - - - - 22 - 10 - 77 - - - 109 Interest received B 205 2 207 2 3 9 12 12 2 - - 1 248 Addition to property, plant and equipment (1) - (1) - - - - - - - - - (1) Net cash (ouflow) from investing activities (136) (62) (198) (63) 25 (146) 22 (15) 79 - - 1 (295) CASH FLOW FROM FINANCING ACTIVITIES Proceeds from long-term borrowings - - - - 150 500 698 - - - - - 1 348 Repayments on long-term borrowings (96) - (96) (78) (143) (102) (256) - - - - - (675)Proceeds from short-term borrowings - - - 98 116 - 144 - 1 - - - 359 Repayments on short-term borrowings (50) - (50) (59) (25) - (400) - (149) - - - (683) Net cash inflow from financing activities (146) - (146) (39) 98 398 (186) - (148) 398 - - 349 Net (decrease) in cash and cash equivalents - - - - - - - - - - - - - Cash and cash equivalents at beginning of period - - - - - - - - - - - - - Cash and cash equivalents at end of period D - - - - - - - - - - - - -

251 INTEGRATED ANNUAL REPORT 2015-2016
LHWP AMD VRS (LHWP and AMD)
BWP VRESAP MCWAP MMTS ORWRDP KWSAP BOREHOLE MMTS-1 UMGENI TOTAL
Notes R million R million R million R million R million R million R million R million R million R million R million R million R million CASH FLOW FROM OPERATING ACTIVITIES Cash receipts on tariff receivable 3 557 112 3 669 187 327 - 162 550 110 - - - 5 005 Cash paid to suppliers and employees (1 561) 7 (1 554) 3 (109) (243) (286) (535) (35) - - (1) (2 760)Cash generated from project activities A 1 996 119 2 115 190 218 (243) (124) 15 75 - - (1) 2 245 Interest paid C (1 714) (57) (1 771) (88) (341) (9) (84) - (6) - - - (2 299) Net cash (outflow)/inflow from operating activities 282 62 344 102 (123) (252) (208) 15 69 - - (1) (54) CASH FLOW FROM INVESTING ACTIVITIES Payments to acquire financial assets (340) (64) (404) (65) - (155) - (27) - - - - (651)Proceeds on the sale of financial assets - - - - 22 - 10 - 77 - - - 109 Interest received B 205 2 207 2 3 9 12 12 2 - - 1 248 Addition to property, plant and equipment (1) - (1) - - - - - - - - - (1) Net cash (ouflow) from investing activities (136) (62) (198) (63) 25 (146) 22 (15) 79 - - 1 (295) CASH FLOW FROM FINANCING ACTIVITIES Proceeds from long-term borrowings - - - - 150 500 698 - - - - - 1 348 Repayments on long-term borrowings (96) - (96) (78) (143) (102) (256) - - - - - (675)Proceeds from short-term borrowings - - - 98 116 - 144 - 1 - - - 359 Repayments on short-term borrowings (50) - (50) (59) (25) - (400) - (149) - - - (683) Net cash inflow from financing activities (146) - (146) (39) 98 398 (186) - (148) 398 - - 349 Net (decrease) in cash and cash equivalents - - - - - - - - - - - - - Cash and cash equivalents at beginning of period - - - - - - - - - - - - - Cash and cash equivalents at end of period D - - - - - - - - - - - - -

252INTEGRATED ANNUAL REPORT 2015-2016
ANNEXURE AF O R T H E Y E A R E N D E D 3 1 M A R C H 2 0 1 5
NOTES TO THE SEGMENTAL STATEMENT OF CASH FLOWS
LHWP AMD VRS (LHWP and AMD)
BWP VRESAP MCWAP MMTS ORWRDP KWSAP BOREHOLE MMTS-1 UMGENI TOTAL
Notes R million R million R million R million R million R million R million R million R million R million R million R million R million A. CASH GENERATED FROM PROJECT
ACTIVITIES
Net surplus / (deficit) for the year (964) - (964) 50 73 140 527 - (17) - - 1 (190) Adjustments for non cash flow items and amounts separately disclosed:
Depreciation on non-current assets 11 - 11 - - - - - - - - - 11 Net interest income/(expense) excluding tariff receivable
1 821 55 1 876 86 357 93 105 (12) 109 - - (1) 2 613
Foreign exchange gains (3) - (3) - - - - - - - - - (3)Foreign exchange losses 6 - 6 - - - - - - - - - 6 Interest income and imputed interest on tariff receivable
(862) - (862) (135) (430) (234) (632) - (93) - - - (2 386)
Construction revenue (29) (575) (604) - (2) (171) (411) (514) (8) - (31) (7) (1 748)Other income (785) - (785) (4) (6) - - - (4) - - - (799)Non cash flow in operating expenses (68) - (68) - - - - - - - - - (68)Changes in working capital: (Increase) / decrease in loans and other receivables (665) (477) (1 142) 1 6 3 (28) (38) - - 3 (62) (1 257) (Increase) / decrease in prepayments (54) (89) (143) - - - 29 14 - - 4 - (96) (Decrease)/ increase in payables and
provisions(excluding interest payable) (23) 630 607 5 (107) (74) 124 51 (22) - (7) 61 638
Capitalised to / (removed from) Tariff Receivable 3 557 - 3 557 187 327 - 162 - 110 - - - 4 343 Non cash flow item in accounts receivable 54 575 629 - - - - 514 - - 31 7 1 181 Non cash flow item in accounts payable - - - - - - - - - - - - -Cash generated from project activities 1 996 119 2 115 190 218 (243) (124) 15 75 - - (1) 2 245 B. INTEREST RECEIVED Amount due at beginning of the year 18 - 18 - - - 1 - - - - - 19 Income during the year adjusted for non-cash items 208 2 210 2 3 9 12 12 2 - 1 251 Interest accrued (1) 371 2 373 2 3 9 12 12 2 - - 1 414 Bond premium amortised (109) - (109) - - - - - - - - - (109)Imputed interest on compensation (51) - (51) - - - - - - - - - (51)Interest on RSA account (3) - (3) - - - - - - - - - (3)Amount due at the end of the year (21) - (210) - - - (1) - - - - - (22) Interest received 205 2 207 2 3 9 12 12 2 - - 1 248
(1) Interest accrued excludes imputed interest on the tariff receivable.

253 INTEGRATED ANNUAL REPORT 2015-2016
LHWP AMD VRS (LHWP and AMD)
BWP VRESAP MCWAP MMTS ORWRDP KWSAP BOREHOLE MMTS-1 UMGENI TOTAL
Notes R million R million R million R million R million R million R million R million R million R million R million R million R million A. CASH GENERATED FROM PROJECT
ACTIVITIES
Net surplus / (deficit) for the year (964) - (964) 50 73 140 527 - (17) - - 1 (190) Adjustments for non cash flow items and amounts separately disclosed:
Depreciation on non-current assets 11 - 11 - - - - - - - - - 11 Net interest income/(expense) excluding tariff receivable
1 821 55 1 876 86 357 93 105 (12) 109 - - (1) 2 613
Foreign exchange gains (3) - (3) - - - - - - - - - (3)Foreign exchange losses 6 - 6 - - - - - - - - - 6 Interest income and imputed interest on tariff receivable
(862) - (862) (135) (430) (234) (632) - (93) - - - (2 386)
Construction revenue (29) (575) (604) - (2) (171) (411) (514) (8) - (31) (7) (1 748)Other income (785) - (785) (4) (6) - - - (4) - - - (799)Non cash flow in operating expenses (68) - (68) - - - - - - - - - (68)Changes in working capital: (Increase) / decrease in loans and other receivables (665) (477) (1 142) 1 6 3 (28) (38) - - 3 (62) (1 257) (Increase) / decrease in prepayments (54) (89) (143) - - - 29 14 - - 4 - (96) (Decrease)/ increase in payables and
provisions(excluding interest payable) (23) 630 607 5 (107) (74) 124 51 (22) - (7) 61 638
Capitalised to / (removed from) Tariff Receivable 3 557 - 3 557 187 327 - 162 - 110 - - - 4 343 Non cash flow item in accounts receivable 54 575 629 - - - - 514 - - 31 7 1 181 Non cash flow item in accounts payable - - - - - - - - - - - - -Cash generated from project activities 1 996 119 2 115 190 218 (243) (124) 15 75 - - (1) 2 245 B. INTEREST RECEIVED Amount due at beginning of the year 18 - 18 - - - 1 - - - - - 19 Income during the year adjusted for non-cash items 208 2 210 2 3 9 12 12 2 - 1 251 Interest accrued (1) 371 2 373 2 3 9 12 12 2 - - 1 414 Bond premium amortised (109) - (109) - - - - - - - - - (109)Imputed interest on compensation (51) - (51) - - - - - - - - - (51)Interest on RSA account (3) - (3) - - - - - - - - - (3)Amount due at the end of the year (21) - (210) - - - (1) - - - - - (22) Interest received 205 2 207 2 3 9 12 12 2 - - 1 248
(1) Interest accrued excludes imputed interest on the tariff receivable.

254INTEGRATED ANNUAL REPORT 2015-2016
LHWP AMD VRS (LHWP and AMD)
BWP VRESAP MCWAP MMTS ORWRDP KWSAP BOREHOLE MMTS-1 UMGENI TOTAL
Notes R million R million R million R million R million R million R million R million R million R million R million R million R million C. INTEREST PAID Amount not paid at beginning of the year (501) - (501) (2) (39) - (6) - - - - - (548) Expensed during the year adjusted for non-cash items
(1 714) (57) (1 771) (88) (342) (9) (92) - (6) - - - (2 308)
Amount expensed (excluding imputed interest) (2 192) (57) (2 249) (88) (360) (102) (117) - (111) - - - (3 027)Less: Bond discount amortised 2 - 2 - - - - - - - - - 2 Foreign loan payments (1) - (1) - - - - - - - - - (1) Loss on switch auction 1 - 1 - - - - - - - - - 1 Capital adjustment to inflation-linked liability 438 - 438 - - - - - - - - - 438 Prepaid interest on EIB loan 1 - 1 - - - - - - - - - 1 Interest on compensation 37 - 37 - - - - - - - - - 37 Interest on umgeni - - - - - - - - - - - - - Interest capitalised to the principal amount (2) - - - - 18 93 25 - 105 - - - 241 Accrued interest on switched bonds - - - - - - - - - - - - - Amount not paid at the end of the year 501 - 501 2 40 - 14 - - - - - 557 Interest paid (1 714) (57) (1 771) (88) (341) (9) (84) - (6) - - - (2 299) D. CASH AND CASH EQUIVALENTS AT END
OF PERIOD
Cash and cash equivalents consist of cash on hand and balances with banks.
- - - - - - - - - - - -
The cash flow movement in Tariff receivable is shown under operating activities, as projects are exceeding the standard one year cycle.
(1) Interest accrued excludes imputed interest on the tariff receivable.(2) This relates to interest accrued but not due for payment.
ANNEXURE AF O R T H E Y E A R E N D E D 3 1 M A R C H 2 0 1 5
NOTES TO THE SEGMENTAL STATEMENT OF CASH FLOWS

255 INTEGRATED ANNUAL REPORT 2015-2016
LHWP AMD VRS (LHWP and AMD)
BWP VRESAP MCWAP MMTS ORWRDP KWSAP BOREHOLE MMTS-1 UMGENI TOTAL
Notes R million R million R million R million R million R million R million R million R million R million R million R million R million C. INTEREST PAID Amount not paid at beginning of the year (501) - (501) (2) (39) - (6) - - - - - (548) Expensed during the year adjusted for non-cash items
(1 714) (57) (1 771) (88) (342) (9) (92) - (6) - - - (2 308)
Amount expensed (excluding imputed interest) (2 192) (57) (2 249) (88) (360) (102) (117) - (111) - - - (3 027)Less: Bond discount amortised 2 - 2 - - - - - - - - - 2 Foreign loan payments (1) - (1) - - - - - - - - - (1) Loss on switch auction 1 - 1 - - - - - - - - - 1 Capital adjustment to inflation-linked liability 438 - 438 - - - - - - - - - 438 Prepaid interest on EIB loan 1 - 1 - - - - - - - - - 1 Interest on compensation 37 - 37 - - - - - - - - - 37 Interest on umgeni - - - - - - - - - - - - - Interest capitalised to the principal amount (2) - - - - 18 93 25 - 105 - - - 241 Accrued interest on switched bonds - - - - - - - - - - - - - Amount not paid at the end of the year 501 - 501 2 40 - 14 - - - - - 557 Interest paid (1 714) (57) (1 771) (88) (341) (9) (84) - (6) - - - (2 299) D. CASH AND CASH EQUIVALENTS AT END
OF PERIOD
Cash and cash equivalents consist of cash on hand and balances with banks.
- - - - - - - - - - - -
The cash flow movement in Tariff receivable is shown under operating activities, as projects are exceeding the standard one year cycle.
(1) Interest accrued excludes imputed interest on the tariff receivable.(2) This relates to interest accrued but not due for payment.

256INTEGRATED ANNUAL REPORT 2015-2016
ANNEXURE BF O R T H E P E R I O D E N D E D 3 1 M A R C H 2 0 1 6
UNAUDITED SEGMENTAL STATEMENT OF COMPREHENSIVE INCOME
VRS BWP VRESAP MCWAP MMTS ORWRDP KWSAP BOREHOLE MMTS-1 UMGENI KRIEL TOTAL R million R million R million R million R million R million R million R million R million R million R million R million CONSTRUCTION REVENUE 1 078 - 13 172 260 304 3 - 4 56 2 1 892
CONSTRUCTION COSTS (1 078) - (13) (172) (260) (304) (3) - (4) (56) (2) (1 892)
OTHER INCOME 997 5 6 - - - 5 - - - - 1 013
EXPENSES (997) (5) (6) - - - (5) - - - - (1 013)Legal fees and litigation costs - - - - - - - - - - - -Depreciation (6) - - - - - - - - - - (6)Operating costs for the work in Lesotho (140) - - - - - - - - - - (140)Lesotho Highlands Water Commission (LHWC) costs (9) - - - - - - - - - - (9)Staff costs (172) - - - - - - - - - - (172)Directors' emoluments (1) - - - - - - - - - - (1)Royalties paid (775) - - - - - - - - - - (775)Other operating expenses 106 (5) (6) - - - (5) - - - - 90 OPERATING SURPLUS/(DEFICIT) - - - - - - - - - - - -
NET FINANCE COSTS (1 885) 12 60 (130) 35 - 184 - - 2 - (1 722)Finance income 1 392 95 425 118 188 - 300 - - 2 - 2 520 Finance costs (3 277) (83) (365) (248) (153) - (116) - - - - (4 242) SURPLUS/(DEFICIT) FOR THE YEAR (1 885) 12 60 (130) 35 - 184 - - 2 - (1 722)
OTHER COMPREHENSIVE INCOME - - - - - - - - - - - -
TOTAL COMPREHENSIVE INCOME/(DEFICIT) FOR THE YEAR
(1 885) 12 60 (130) 35 - 184 - - 2 - (1 722)
Financial statements are rounded to the nearest million. Where balances are zero, the amount is less than R500 000.

257 INTEGRATED ANNUAL REPORT 2015-2016
VRS BWP VRESAP MCWAP MMTS ORWRDP KWSAP BOREHOLE MMTS-1 UMGENI KRIEL TOTAL R million R million R million R million R million R million R million R million R million R million R million R million CONSTRUCTION REVENUE 1 078 - 13 172 260 304 3 - 4 56 2 1 892
CONSTRUCTION COSTS (1 078) - (13) (172) (260) (304) (3) - (4) (56) (2) (1 892)
OTHER INCOME 997 5 6 - - - 5 - - - - 1 013
EXPENSES (997) (5) (6) - - - (5) - - - - (1 013)Legal fees and litigation costs - - - - - - - - - - - -Depreciation (6) - - - - - - - - - - (6)Operating costs for the work in Lesotho (140) - - - - - - - - - - (140)Lesotho Highlands Water Commission (LHWC) costs (9) - - - - - - - - - - (9)Staff costs (172) - - - - - - - - - - (172)Directors' emoluments (1) - - - - - - - - - - (1)Royalties paid (775) - - - - - - - - - - (775)Other operating expenses 106 (5) (6) - - - (5) - - - - 90 OPERATING SURPLUS/(DEFICIT) - - - - - - - - - - - -
NET FINANCE COSTS (1 885) 12 60 (130) 35 - 184 - - 2 - (1 722)Finance income 1 392 95 425 118 188 - 300 - - 2 - 2 520 Finance costs (3 277) (83) (365) (248) (153) - (116) - - - - (4 242) SURPLUS/(DEFICIT) FOR THE YEAR (1 885) 12 60 (130) 35 - 184 - - 2 - (1 722)
OTHER COMPREHENSIVE INCOME - - - - - - - - - - - -
TOTAL COMPREHENSIVE INCOME/(DEFICIT) FOR THE YEAR
(1 885) 12 60 (130) 35 - 184 - - 2 - (1 722)
Financial statements are rounded to the nearest million. Where balances are zero, the amount is less than R500 000.

258INTEGRATED ANNUAL REPORT 2015-2016
LHWP AMD VRS (LHWP and AMD)
BWP VRESAP MCWAP MMTS ORWRDP KWSAP BOREHOLE MMTS-1 UMGENI TOTAL
R million R million R million R million R million R million R million R million R million R million R million R million R million CONSTRUCTION REVENUE 29 575 604 - 2 171 411 514 8 - 31 7 1 748
CONSTRUCTION COSTS (29) (575) (604) - (2) (171) (411) (514) (8) - (31) (7) (1 748)
OTHER INCOME 785 - 785 4 6 - - - 4 - - - 799
EXPENSES (785) - (785) (4) (6) - - - ( 4) - - - (799)Legal fees and litigation costs - - - - (1) - - - - - - - (1)Depreciation (11) - (11) - - - - - - - - - (11)Operating costs for the work in Lesotho (99) - (99) - - - - - - - - - (99)Lesotho Highlands Water Commission (LHWC) costs (18) - (18) - - - - - - - - - (18)Staff costs (146) - (146) - - - - - - - - - (146)Directors' emoluments (4) - (4) - - - - - - - - - (4)Royalties paid (612) - (612) - - - - - - - - - (612)Other operating expenses 105 - 105 (4) ( 5) - - - ( 4) - - - 92 OPERATING SURPLUS/(DEFICIT) - - - - - - - - - - - - -
NET FINANCE COSTS (964) - (964) 50 73 140 527 - ( 17) - - 1 (190)Finance income 1 344 - 1 344 138 433 243 644 - 103 - - 1 2 906 Finance costs (2 308) - (2 308) (88) (360) (103) (117) - (120) - - - (3 096) SURPLUS/(DEFICIT) FOR THE YEAR (964) - (964) 50 73 140 527 - (17) - - 1 (190)
OTHER COMPREHENSIVE INCOME - - - - - - - - - - - - -
TOTAL COMPREHENSIVE INCOME/(DEFICIT) FOR THE YEAR
(964) - (964) 50 73 140 527 - (17) - - 1 (190)
Financial statements are rounded to the nearest million. Where balances are zero, the amount is less than R500 000. Financial statements are rounded to the nearest million. Where balances are zero, the amount is less than R500 000.
ANNEXURE BF O R T H E P E R I O D E N D E D 3 1 M A R C H 2 0 1 6
UNAUDITED SEGMENTAL STATEMENT OF COMPREHENSIVE INCOME

259 INTEGRATED ANNUAL REPORT 2015-2016
LHWP AMD VRS (LHWP and AMD)
BWP VRESAP MCWAP MMTS ORWRDP KWSAP BOREHOLE MMTS-1 UMGENI TOTAL
R million R million R million R million R million R million R million R million R million R million R million R million R million CONSTRUCTION REVENUE 29 575 604 - 2 171 411 514 8 - 31 7 1 748
CONSTRUCTION COSTS (29) (575) (604) - (2) (171) (411) (514) (8) - (31) (7) (1 748)
OTHER INCOME 785 - 785 4 6 - - - 4 - - - 799
EXPENSES (785) - (785) (4) (6) - - - ( 4) - - - (799)Legal fees and litigation costs - - - - (1) - - - - - - - (1)Depreciation (11) - (11) - - - - - - - - - (11)Operating costs for the work in Lesotho (99) - (99) - - - - - - - - - (99)Lesotho Highlands Water Commission (LHWC) costs (18) - (18) - - - - - - - - - (18)Staff costs (146) - (146) - - - - - - - - - (146)Directors' emoluments (4) - (4) - - - - - - - - - (4)Royalties paid (612) - (612) - - - - - - - - - (612)Other operating expenses 105 - 105 (4) ( 5) - - - ( 4) - - - 92 OPERATING SURPLUS/(DEFICIT) - - - - - - - - - - - - -
NET FINANCE COSTS (964) - (964) 50 73 140 527 - ( 17) - - 1 (190)Finance income 1 344 - 1 344 138 433 243 644 - 103 - - 1 2 906 Finance costs (2 308) - (2 308) (88) (360) (103) (117) - (120) - - - (3 096) SURPLUS/(DEFICIT) FOR THE YEAR (964) - (964) 50 73 140 527 - (17) - - 1 (190)
OTHER COMPREHENSIVE INCOME - - - - - - - - - - - - -
TOTAL COMPREHENSIVE INCOME/(DEFICIT) FOR THE YEAR
(964) - (964) 50 73 140 527 - (17) - - 1 (190)
Financial statements are rounded to the nearest million. Where balances are zero, the amount is less than R500 000. Financial statements are rounded to the nearest million. Where balances are zero, the amount is less than R500 000.

260INTEGRATED ANNUAL REPORT 2015-2016

261 INTEGRATED ANNUAL REPORT 2015-2016
PART G: GLOBAL REPORTINGINITIATIVE CONTENT INDEX

262INTEGRATED ANNUAL REPORT 2015-2016
No Description Compliance Notes
1. Strategy and analysis1.1 Statement from the most senior decision-
maker of the organisationFully Refer to pages 4 and 12
1.2 Description of key impacts, risks and opportunities
Fully Refer to page 76
2. Organisational profile2.1 Name of the organisation Fully Trans-Caledon Tunnel Authority2.2 Primary brands, products and/or services Fully Refer to page 262.3 Operational structure of the organisation,
including main divisions, operating companies, subsidiaries and joint ventures
Fully Refer to page 29
2.4 Location of organisation’s headquarters Fully TCTA operates from its offices in Centurion, Gauteng, South Africa
2.5 Number of countries where the organisation operates, and names of countries with either major operations or that are specifically relevant to the sustainability issues covered in the report
Fully TCTA is only active in South Africa. On the Phase 2 of the Lesotho Highlands Water Project it raises the money in South Africa for the water transfer component and pays it over to the Lesotho Highlands Development Authority for the implementation
2.6 Nature of ownership and legal form Fully Refer to page 242.7 Markets served (including geographic
breakdown, sectors served, and types of customers and beneficiaries)
Fully Not applicable
2.8 Scale of the reporting organisation Fully Refer to page 30: Part B: Performance Information
2.9 Significant changes during the reporting period regarding size, structure or ownership
Fully None
2.10 Awards received in the reporting period Fully None3. Report parameters3.1 Reporting period (e.g. fiscal or calendar year)
for information providedFully This report relates to the financial year from
1 April 2015 to 31 March 20163.2 Date of most recent previous report (if any) Fully 31 March 20153.3 Reporting cycle (annual, biennial, etc.) Fully Annual3.4 Contact point for questions regarding the
report or its contentsFully Feedback on the report is welcome. The Chief
Operating Officer may be contacted in this regard
3.5 Process for defining report content Fully Refer to page 7: About the Integrated Annual Report
3.6 Boundary of the report (e.g. countries, divisions, subsidiaries, leased facilities, joint ventures, suppliers)
Fully The report covers the activities of TCTA, with regard to the mandate and the directives received from the Minister and associated activities.
3.7State any specific limitations on the scope or boundary of the report (see completeness principle for explanation of scope)
Fully There were no specific limitations on the scope or boundary of the report
3.8 Basis for reporting on joint ventures, subsidiaries, leased facilities, outsourced operations, and other entities that can significantly affect comparability from period to period and/or between organisations
Fully None
GRI CONTENT INDEX

263 INTEGRATED ANNUAL REPORT 2015-2016
No Description Compliance Notes
3.9 Data measurement techniques and the bases of calculations, including assumptions and techniques underlying estimations applied to the compilation of the Indicators and other information in the report. Explain any decisions not to apply, or to substantially diverge from, the Global Reporting Initiative Indicator Protocols
Fully Refer to page 30
3.10 Explanation of the effect of any restatements of information provided in earlier reports, and the reasons for such restatement (e.g. mergers and acquisitions, change of base years or periods, nature of business, measurement methods)
Fully Not applicable, as no information was restated
3.11 Significant changes from previous reporting periods in the scope, boundary, or measurement methods applied in the report
Fully No significant changes were identified from the previous reporting period
3.12 Table identifying the location of the Standard Disclosures in the report
Fully Refer to pages Global Reporting Initiative content index
3.13 Policy and current practice with regard to seeking external assurance for the report
Fully The predetermined objectives and the Annual Financial Statements are assured in line with the requirements of the Auditor-General.
4. Governance, commitments and engagement4.1 Governance structure of the organisation,
including committees under the highest governance body responsible for specific tasks, such as setting strategy or organisational oversight
Fully Refer to Section D, pages 68 to 81
4.2 Indicate whether the Chair of the highest governance body is also an executive officer
Fully The Chairman of the TCTA Board is an Independent Non-executive Director
4.3 For organisations that have a unitary board structure, state the number and gender of members of the highest governance body that are independent and/or Non-executive members
Fully Refer to pages 72 to 75
4.4 Mechanisms for shareholders and employees to provide recommendations or direction to the highest governance body
Fully In line with Treasury Regulations shareholder input is received through the Shareholder Compact
4.5 Linkage between compensation for members of the highest governance body, senior managers, and executives (including departure arrangements), and the organisation’s performance (including social and environmental performance)
None
4.6 Processes in place for the highest governance body to ensure conflicts of interest are avoided
Fully Refer to page 69
4.7 Process for determining the composition, qualifications, and expertise of the members of the highest governance body and its committees, including any consideration of gender and other indicators of diversity
Fully Refer to pages 72 to 75 for details of Board. Process of determining composition is the prerogative of the Minister and occurs when the Board is appointed.

264INTEGRATED ANNUAL REPORT 2015-2016
No Description Compliance Notes
4.8 Internally developed statements of mission or values, codes of conduct, and principles relevant to economic, environmental, and social performance and the status of their implementation
Fully Refer to page 46 Section C: Sustainability and Transformation
4.9 Procedures of the highest governance body for overseeing the organisation’s identification and management of economic, environmental, and social and labour performance, including relevant risks and opportunities, and adherence or compliance with internationally agreed standards, codes of conduct and principles
Fully Refer to Section C: Sustainability and Transformation, page 46
4.10 Processes for evaluating the highest governance body’s own performance, particularly with respect to economic, environmental and social performance
None Board was only approved in 1 December 2015
4.11 Explanation of whether and how the precautionary approach or principle is addressed by the organisation
None
4.12 Externally developed economic, environmental and social charters, principles or other initiatives to which the organisation subscribes or endorses
Fully In the implementation of its projects TCTA subscribes to the principles contained in the Construction Sector Charter
4.13 Memberships in associations Fully Institute of Internal Auditors, South African National Committee on Large Dams. World Economic Forum, Water Institute of Southern Africa, Association of Corporate Treasurers of Southern Africa and Corporate Executive Board
4.14 List of stakeholder groups engaged by the organisation
Fully Refer to page 27
4.15 Basis for identification and selection of stakeholders with whom to engage
Fully TCTA implements projects on behalf of the Department of Water and Sanitation. Engagement with offtakers is through the Department’s structures.
4.16 Approaches to stakeholder engagement, including frequency of engagement by type and by stakeholder group
Fully Refer to page 27
4.17 Key topics and concerns that have been raised through stakeholder engagement
Fully Refer to page 51 and 241
DMA EC Disclosure on management approach: EconomicAspects Economic performance Fully Refer to page 53
Market presence Fully Refer to pages 18 and 19Indirect economic impacts Fully Refer to page 32. TCTA delivers in support of
the Government Outcomes

265 INTEGRATED ANNUAL REPORT 2015-2016
No Description Compliance Notes
DMA EN Disclosure on management approach: EnvironmentalAspects Materials None In line with other major organisations TCTA
does not report on the materials consumed in capital projects.
Energy None In line with other major organisations TCTA does not report on the energy consumed in capital projects
Water None In line with other major organisations TCTA does not report on the water consumed in capital projects
Biodiversity Fully Refer to page 49Emissions, effluents and waste None In line with other major organisations TCTA
does not report on the emissions, effluent and waste produced in capital projects
Products and services Fully Refer to page 26Compliance Partially Refer to page 57 for Health and Safety on
site and page 49 for compliance against the Environmental Management Plan
Transport None In line with other major organisations TCTA does not report on the transport requirement in capital projects
Overall Partially Each element reported separatelyDMA LA Disclosure on management approach: LabourAspects Employment Fully Refer to page 59
Labour/management relations NoneOccupational health and safety Partially Refer to page 57 (for project sites)Training and education Fully Refer to pages 53 to 56 and 63Diversity and equal opportunity Fully Refer to pages 61 and 62Equal remuneration for women and men None
DMA HRAspects Investment and procurement practices Fully TCTA procures in accordance with National
Treasury RegulationsNon-discrimination Fully Refer to Employment Equity as reflected on
pages 61 and 62Freedom of association and collective bargaining
None
Child labour Fully All project sites comply with South African legislation
Prevention of forced and compulsory labour Fully All project sites comply with South African legislation
Security practices Fully All project sites comply with South African legislation
Indigenous rights Fully TCTA complies with South African legislation in terms of Employment Equity
Assessment Fully Not requiredRemediation Fully Not required

266INTEGRATED ANNUAL REPORT 2015-2016
No Description Compliance Notes
DMA SOAspects Local communities Fully Refer to page 51
Corruption Partially Refer to page 238Public policy Fully Refer to page 40 for other water management
institutions that were engaged with. As a SOE, TCTA regularly engages with DWS in the development of policy for the water sector
Anti-competitive behaviour Fully Not applicableComp-liance
Fully TCTA seeks to create sustainable value for shareholder and establish itself as a leader in water infrastructure development. TCTA is committed to responsible business conduct and best practice. An ethical governance framework and a commitment to legal compliance guide all its organisational activities. The Bank upholds the principles expressed in the King III Code that good governance combines both regulatory requirements and voluntary standards of excellence
DMA PR Disclosure on management approach: Product responsibilityAspects Customer health and safety Fully Not applicable
Product and service labelling Fully Not applicableMarketing communications Fully Not applicableCustomer privacy Fully Not applicableCompliance Fully Not applicable
Performance indicatorsEconomicEC1 Direct economic value generated and
distributedFully Not applicable. TCTA is a non-profit
organisation and does not create a surplus or loss. Refer to page 24
EC3 Coverage of the organisation’s defined benefit plan obligations
Fully Not applicable.
EC4 Significant financial assistance received from the government
Fully Where TCTA is directed by the Minister to implement on-budget (ORWRDP-2C) , or partially on budget projects (MCWAP), transfers are received from the Department of Water and Sanitation to enable it to implement the project
Market presenceEC6 Policy, practices and proportion of spending
on locally based suppliers at significant locations of operation
Partially TCTA subscribes to the Construction Sector Charter, which stipulates employment, preferential procurement and enterprise development targets for local development on each project site
EC7 Procedures for local hiring and proportion of senior management hired from the local community at significant locations of operation
Fully TCTA is only South African based and all staff are hired locally

267 INTEGRATED ANNUAL REPORT 2015-2016
No Description Compliance Notes
Indirect economic impactsEC8 Development and impact of infrastructure
investments and services provided primarily for public benefit through commercial, in-kind, or pro bono engagement
Fully Refer to page 51
EC9 Understanding and describing significant indirect economic impacts, including the extent of impacts
Fully Refer to page 32
EnvironmentalMaterialsEN1 Materials used by weight or volume None In line with other major organisations TCTA
does not report on the materials consumed in capital projects.
EN3 Percentage of materials used that are recycled input materials
None In line with other major organisations TCTA does not report on recycled materials consumed in capital projects.
EnergyEN3 Direct energy consumption by primary energy
sourceNone In line with other major organisations TCTA
does not report on direct energy consumption by primary energy source in capital projects.
EN4 Indirect energy consumption by primary source
None In line with other major organisations TCTA does not report on indirect energy consumption by primary energy source in capital projects
EN5 Energy saved due to conservation and efficiency improvements
None
EN6 Initiatives to provide energy-efficient or renewable energy-based products and services, and reductions in energy requirements as a result of these initiatives
None On once off capital projects, each of which is unique in nature and of limited lifespan it is difficult to institute programmes which record reduction in consumption of energy
EN7 Initiatives to reduce indirect energy consumption and reductions achieved (internal)
Fully On once off capital projects, each of which is unique in nature and of limited lifespan it is difficult to institute programmes which record reduction in consumption of energy
WaterEN8 Total water withdrawal by source None Each project withdraws from the adjacent
source and the head office draws water from the Vaal River System through Rand Water and Tshwane Metropolitan Municipality.
BiodiversityEN11 Location and size of land owned, leased,
managed in, or adjacent to, protected areas and areas of high biodiversity value outside protected areas
Fully Refer to Section C: Mitigation of Environmental Impacts page 49
EN13 Habitats protected or restored Fully Refer to Section C: Mitigation of Environmental Impacts page 49
EN14 Strategies, current actions and future plans for managing impacts on biodiversity
Fully Refer to Section C: Mitigation of Environmental Impacts page 49

268INTEGRATED ANNUAL REPORT 2015-2016
No Description Compliance Notes
Emissions, effluents and wasteEN16 Total direct and indirect greenhouse gas
emissions by weightNone Not applicable
EN18 Initiatives to reduce greenhouse gas emissions and reductions achieved
None Not applicable
EN22 Total weight of waste by type and disposal method
None Not applicable
EN23 Total number and volume of significant spills Partially Refer to page 49Products and servicesEN26 Initiatives to mitigate environmental impacts
of products and services, and extent of impact mitigation
Fully Not applicable
EN27 Percentage of products sold and their packaging materials that are reclaimed by category
Fully Not applicable
ComplianceEN28 Monetary value of significant fines and total
number of non-monetary sanctions for noncompliance with environmental laws and regulations
Fully No significant non-compliance with environmental laws and regulations was identified
TransportEN29 Significant environmental impacts of
transporting products and other goods and materials used for the organisation’s operations, and transporting members of the workforce
None In line with other major organisations TCTA does not report on significant environmental impacts of transporting products and other goods and materials used for the organisation’s capital projects
Social: Labour practices and decent workEmploymentLA1 Total workforce by employment type,
employment contract and region, broken down by gender
Fully Refer to page 61
LA2 Total number and rate of new employee hires and employee turnover by age group, gender and region
Fully Refer to page 61
Labour/management relationsLA4 Percentage of employees covered by
collective bargaining agreementsNone
Occupational health and safetyLA6 Percentage of total workforce represented
in formal joint management-worker health and safety committees that help monitor and advise on occupational health and safety programmes
None
LA7 Rates of injury, occupational diseases, lost days and absenteeism, and number of work-related fatalities by region and by gender
None

269 INTEGRATED ANNUAL REPORT 2015-2016
No Description Compliance Notes
Training and educationLA10 Average hours of training per year per
employee by gender and by employee category
Partially Refer to page 63
LA11 Programmes for skills management and lifelong learning that support the continued employability of employees and assist them in managing career endings
Partially Refer to pages 62 and 63
LA12 Percentage of employees receiving regular performance and career development reviews, by gender
Fully All TCTA employees receive regular performance reviews and are required to submit a Personal Development Plan each year.
Diversity and equal opportunityLA13 Composition of governance bodies and
breakdown of employees per employee category according to gender, age group, minority group membership and other indicators of diversity
Fully Refer to pages 61 and 73 to 75
Equal remuneration for women and menLA14 Ratio of basic salary and remuneration of
women to men (internal)None
Social: Human rightsNon-discriminationHR4 Total number of incidents of discrimination and actions taken
Fully No incidents of discrimination were reported during the period under review
Freedom of association and collective bargainingHR5 Operations and significant suppliers identified in which the right to exercise freedom of association and collective bargaining may be violated or at significant risk, and actions taken to support these rights
Fully No violations were identified
Child labourHR6 Measures taken to contribute to the effective abolition of child labour
Fully No violations were identified
Forced and compulsory labourHR7 Measures to contribute to the elimination of all forms of forced or compulsory labour
Fully No violations were identified
Indigenous rightsHR9 Total number of incidents of violations involving rights of indigenous people and actions taken
Fully No violations were identified
AssessmentHR10 Percentage and total number of operations that have been subject to human rights reviews and/ or impact assessments
Fully None

270INTEGRATED ANNUAL REPORT 2015-2016
No Description Compliance Notes
RemediationHR11 Number of grievances related to human rights filed, addressed and resolved through formal grievance mechanisms
Fully None
Social: SocietyLocal communitiesSO1 Percentage of operations with implemented local community engagement, impact assessments and development programmes
Partially Refer to Section C: Mitigation of Social Impact, page 51
Public policySO5 Public policy positions and participation in public policy development and lobbying
Fully As a government Institution, TCTA does not take any policy positions but works with Government in the development of policy to ensure a financially sustainable water sector.
SO6 Total value of financial and in-kind contributions to political parties, politicians and related institutions by country
Fully None
Anti-competitive behaviourSO7 Total The number of legal actions for anti-competitive behaviour, anti-trust and monopoly practices and their outcomes
Fully Not applicable
ComplianceSO8 Montary value of significant fines and total number of non-monetary sanctions for noncompliance with laws and regulations
Fully No significant fines were incurred for non-compliance with laws and regulations
Social: Product responsibilityCustomer health and safetyPR1 Life cycle stages in which health and safetyimpacts of products and services are assessed for improvement, and percentage of significant products and services categories subject to such procedures
Fully Not applicable
Product and service labellingPR3 Type of product and service information required by procedures and percentage of significant products and services subject to such information requirements
Fully Not applicable
Marketing communicationsPR6 Programmes for adherence to laws, standards and voluntary codes related to marketing communications, including advertising, promotion and sponsorship
Fully Not applicable
PR7 Total number of incidents of non-compliance with regulations and voluntary codes concerning marketing communications, including advertising, promotion and sponsorship by type of outcomes
Fully Not applicable

271 INTEGRATED ANNUAL REPORT 2015-2016
No Description Compliance Notes
Customer privacyPR8 Total number of substantiated complaints regarding breaches of customer privacy and losses of customer data
Fully Not applicable
CompliancePR9 Monetary value of significant fines for non-compliance with laws and regulations concerning the provision and use of products and services
Fully Not applicable

272INTEGRATED ANNUAL REPORT 2015-2016
NOTES


1st Floor, Stinkhout Wing
Tuinhof Building
265 West Road
Centurion
RP: 304/2016
ISBN: 978-0-621-44892-4
Tel: +27 12 683 1200
Fax: +27 12 683 1300
Email: [email protected]
Web: www.tcta.co.za