Visibility and Analytics Networks - rhsupplies.org · • Data driven optimization studies. ......
28
Visibility and Analytics Networks Moderator: Gregory Roche, Senior Technical Advisor, JSI Logistics Services Tuesday, March 20, 2018 Brussels, Belgium
Transcript of Visibility and Analytics Networks - rhsupplies.org · • Data driven optimization studies. ......

Visibility and Analytics NetworksModerator: Gregory Roche, Senior Technical Advisor, JSI Logistics ServicesTuesday, March 20, 2018Brussels, Belgium

2
• Provide an introduction to the concept of visibility and analytics networks (VAN)
• Present country examples of VAN implementation and how to overcome information-sharing and coordination barriers
• Present examples of the work of CARhs and CSP members
Session Objectives

3
• Overview of VAN concept and application• Global and country levels
• Fireside chat with CARhs and CSP members• Country examples of VAN
• Indonesia: Dr. Dwi Listyawardani• Guinea: Dr. Sano Nagnouma• Kenya: Dennis Ndwiga
• Question/Answer/Discussion
Session Agenda

4
Introduction to Visibility and Analytics Networks

5
The Visibility and Analytics Network...
End-to-End Supply Chain Visibility
Team of Supply Chain Professionals
Analysis and Insights
Continuous Improvement

6
What is VAN?
• A group of supply chain experts empowered by policy, process, technology and end to end visibility with an objective to make the supply chain more collaborative, aligned, agile and demand-driven.
• Whose central strategic objective is to ensure the availability of the right health commodities when and where the beneficiary needs them.
Source: VAN Project, Blueprint Reference Model

7
VAN Ideal State
Visibility: Specialized supply chain management roles require visibility of stock on hand, consumption data, delivery data, cold chain data, and much more as VAN matures
Analytics: Analytical processes and IT to make planning recommendations, report and review KPIs, inform decisions based on risk analysis, optimisation studies and simulation
Network: The network of interlocking roles and responsibilities, links National, County, Districts and Facilities in clear terms of what individuals are responsible for, and what technology links support them

8
• Resolving issues in response to alerts• Supply Chain Planning processes – Demand,
Supply & Distribution planning• Analyzing KPIs and Root Causes of issues
Updating ‘Master Data’, Policies, KPIs• Data driven optimization studies
Analytical processes with clear purpose…
9
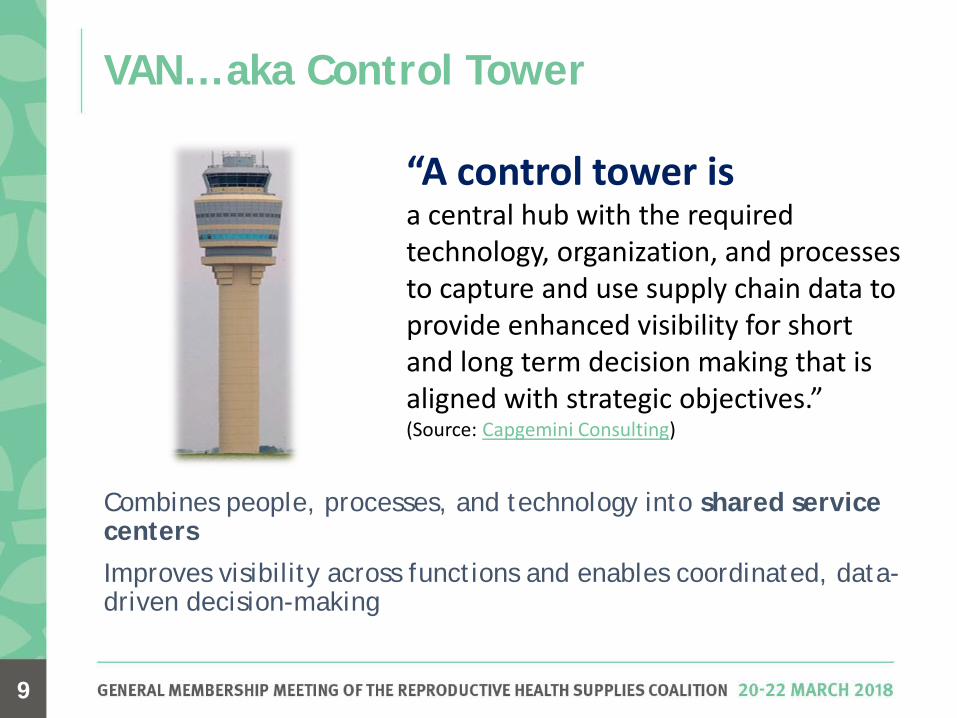
VAN… aka Control Tower
“A control tower isa central hub with the required technology, organization, and processes to capture and use supply chain data to provide enhanced visibility for short and long term decision making that is aligned with strategic objectives.”(Source: Capgemini Consulting)
Combines people, processes, and technology into shared service centers
Improves visibility across functions and enables coordinated, data-driven decision-making

10
VAN Services • Demand Planning
• Supply Planning & Inventory Management
• Distribution & Transportation Management
• Cold Chain Management

11
Strengthening Family Planning Supply Chain Systems in IndonesiaDr. Dwi ListyawardaniDeputy of Family Planning & Reproductive HealthNational Population and Family Planning Board (BKKBN)

12
Background
34 Province Warehouses
514 District Warehouses
17,000 Health Centers & Hospitals
CENTRAL
64,000 Private midwives & FBOs
Data AvailabilityOver 90% reporting rateLarge no. of indicators
Easily available
Data SystemsLimited visualizationsCumbersome formsInconsistent quality
Data UseWeak culture
Not used for decision making
Limited monitoring & feedback
Logistics DataNot used consistently for resupply decisionsSeparate system for warehouses and SDPs

13
Overview of Implementation
• Equipping stakeholders with SOPs and tools• Defining roles and responsibilities• Facilitating multi level/division collaboration• Routine mentorship and on-the-job training
ORGANIZATION
DATA
VISIBILITY• Simplified excel based inventory management tools• Mobile app that collects data during mentor visits• Tracking key performance indicators
• Strengthening record management and reporting
• Data ownership• Linkages with commodity
availability
QUALITY• Informed resupply• Standardizing trigger points• Quality Improvement Teams• Feedback and recognition
USE

14
Outcomes and results• Reduced stock imbalances and
wastage• Strengthened collaboration and
customer service through routine QITs
• Improvement in record and report accuracy
• Increased ownership to improve data quality and outcomes
• Routine mentorship and feedback has improved motivation and accountability
• Improved storage practices
Sep-17

15
Key considerations
Simplified
• Familiar low cost platforms. Minimal training• User friendly. Simple indicators
Purposeful
• Comprehensive. User centric• Facilitates local action. Result oriented
Linkages
• Monitoring and feedback mechanism• Ownership and motivation
Culture
• Policy. Accountability• Continuous improvement

16
• Tendency to switch back to old practices• Trusting data to make decisions• Managing different levels of capacity• Breaking silos within the organization structure• Emphasizing the importance of supply chain
management within the FP program
Challenges

Terima Kasih

18
GuineaDr. Sano Nagnouma, Ministère de la Santé, Unité de GestionLogistique

19
• Equipes IMPACT au niveau de six districts (2 pilotes + 2) et au niveau central• Identification des districts pilotes• Identification des membres des équipes• Formation des membres des équipes, y compris
la conception des procédures des équipes• Sélection des indicateurs à suivre/évaluer• Calendrier des réunions• Ordre du jour standard des réunions• Réunion de préparation des réunions• Outils
• 5 mois pour mettre en œuvre ces activités
Aperçu de la Mise en Oeuvre du VAN

20
• Nouveau système d’information pour la gestion logistique en place depuis début 2017
• Nouveau système de traitement des données informatisé en cours de mise en œuvre
• Existence d’autres comités de gestion existants, mais pas focalisés sur la gestion des produits
• Soutien technique et financier des partenaires• L’Unité de Gestion Logistique en train d’être
mise en place
Considérations clés

21
• Meilleure qualité et visibilité des données
• Identification et résolution des problèmes dans la chaîne d’approaux niveaux local et central• Des actions de
redéploiement de stock ont été effectuées
• Mise en place des équipes IMPACT dans tous les districts comme élément du plan stratégique pour la chaîne d’approvisionnement
Résultats

22
• Mise en place d’un système de suivi efficace pilote par UGL et impliquant les acteurs du niveau intermédiaire pour garantir la transmission régulière des données logistique de routine
• Equipes IMPACT dans six districts sur 38; impact limite pour le moment
• Mise en place des équipes en même temps que le personnel s’habitue au nouveau système d’information intégré
• Equipe au niveau central; défis pour la tenue régulière des réunions
Défis

Merci

Kemsa explores using the IBM Watson Artificial Intelligence (AI) EngineDennis Ndwiga, Senior Business AnalystKenya Medical Supplies Authority (KEMSA)

25
What if the Kemsa supply chain used artificial intelligence (AI) to aid in decision making?• Goal: Could a concept like this work in our community now? Or later?
• Vision: Kemsa will have an AI trusted advisor to share insights on causes of stock-outs, preventative measures and identification of relevant resources to improve availability of product by 50%
• Dec/Jan2018: Successful IBM Watson Supply Chain proof of concept with Kemsa sample supply chain data across 24 facilities
IBM Supply Chain Insights / Watson Supply Chain

26
• Supply Chain Insights provides various user interaction methods• Designing for connectivity and hardware challenges
Key Considerations
26
Resolution Room
Voice over Mobile Device
26
Question: How much Acetazolamide do we have in Nairobi?
Watson Answer: No Inventory for Acetazolamide is found in Nairobi but the nearest locations with inventory are provided in Watson’s response
SMS

27
Todays AI technology allows us to leverage cognitive capabilities to create a transparent, intelligent and predictive supply chain for Kemsa.The successful proof of concept has resulted in an expanded focus to pilot with real data at a select set of facilities.
Moving forward we expect to be able to:
Key Outcomes and Results
Lack of visibility and transparency is the greatest hurdle in achieving the supply chain organization’s objectives. - IBM IBV Global Chief Supply Chain Officer (CSCO) Study of 400 supply chain leaders
Analyze both structured and unstructured data for greater insight
Empower people with cognitive knowledge for faster, better actions
Enable comprehensive visibility across the ecosystem with the VAN platform
Enhance existing systems, eLMIS, with cognitive understanding and learning

28
In the near term, Watson will require: • Connecting Kemsa supply chain data to Watson using a VAN platform
to collect and aggregate at a small number of facilities • Training the cognitive engine• A successful pilot using real data • A sustainable business model
At scale, Watson will require:• Using all possible data collection methods to obtain last mile data• Connecting Kemsa supply chain data to Watson using a VAN platform
to collect and aggregate data from many sources of data across the 47 counties and ~6000 facilities (for a full roll out)
• Training and maintaining the cognitive engine over time so that it continually generates the best responses to users questions
Challenges Encountered