Linking Standards, Assessments, and Instruction in Mathematics

Virginia Standards of Learning Assessments Technical Report 2013–2014 Administration Cycle
ii
Table of Contents
Table of Contents ............................................................................................................................ ii List of Tables and Figures................................................................................................................v PART I: HISTORICAL OVERVIEW AND SUMMARY OF PROGRAMS ................................1
1. INTRODUCTION .................................................................................................................. 1 2. STUDENT ASSESSMENTS IN VIRGINIA ......................................................................... 1
2.1 Historical Overview of SOL Assessments ........................................................................ 1 2.1.1 High Academic Standards.......................................................................................... 1 2.1.2 Tests to Measure Student Progress on the SOL ......................................................... 1 2.1.3 Accountability for Student Achievement................................................................... 2
2.2 Overview of Current Virginia SOL Assessments ............................................................. 2
2.2.1 Online Testing in Virginia ......................................................................................... 3 2.2.2 Current SOL Assessments ......................................................................................... 3
3. DEVELOPMENT OF SOL ASSESSMENTS ....................................................................... 4 3.1 Content Standards, Curriculum Frameworks, and Test Blueprints .................................. 4
3.1.1 Standards of Learning (SOL) ..................................................................................... 4 3.1.2 Curriculum Frameworks ............................................................................................ 4
3.1.3 Test Blueprints ........................................................................................................... 4 3.2 Item Development ............................................................................................................. 5
3.2.1 Specifications and Development................................................................................ 5
3.2.2 New Item Content Review Committees .................................................................... 6 3.3 New Writing Prompt Development .................................................................................. 7
3.3.1 Specifications and Development................................................................................ 7 3.3.2 New Writing Prompt Review Committees ................................................................ 7
3.4 Field Testing ..................................................................................................................... 7
3.4.1 Embedded Field Testing of MC and TEIs ................................................................. 7
3.4.2 Stand-Alone Field Testing of Writing Prompts ......................................................... 8 3.4.3 Sampling .................................................................................................................... 8 3.4.4 Data Review Committees .......................................................................................... 9
3.4.5 Statistics Reviewed During Data Review Meetings .................................................. 9 3.5 Test Construction ............................................................................................................ 10
3.5.1 Procedures ................................................................................................................ 10 3.5.2 Test Form Review Committees ............................................................................... 11
4. TEST ADMINISTRATION ................................................................................................. 12 4.1 Training and Materials .................................................................................................... 12
4.2 Testing Windows ............................................................................................................ 12 4.3 Test Security Procedures................................................................................................. 12 4.4 Testing Accommodations ............................................................................................... 13
4.4.1 Testing Accommodations for Students with Disabilities ........................................ 13 4.4.2 Testing Accommodations for LEP Students ............................................................ 15
5. WRITING SCORING ........................................................................................................... 16 5.1 Human Scorer Recruitment and Qualifications .............................................................. 16
5.2 Rangefinding ................................................................................................................... 16 5.3 Scorer Training and Qualifying Procedures ................................................................... 17
5.3.1 Anchor Sets .............................................................................................................. 17
5.3.2 Practice Sets ............................................................................................................. 17

Virginia Standards of Learning Assessments Technical Report 2013–2014 Administration Cycle
iii
5.3.3 Qualifying Sets......................................................................................................... 17
5.4 Scoring Procedures ......................................................................................................... 18 5.4.1 Two Raters with Resolution for Nonadjacent Scores .............................................. 18 5.4.2 Backreading ............................................................................................................. 18
5.4.3 Validity Checks ........................................................................................................ 18 5.4.4 General Calibration Sets .......................................................................................... 19 5.4.5 Targeted Calibration Sets ......................................................................................... 19
5.5 Rescore Process .............................................................................................................. 19 5.5.1 Automatic Rescores ................................................................................................. 19
5.5.2 Rescore Requested by School Divisions.................................................................. 19 6. SCORES ............................................................................................................................... 20
6.1 Raw Scores...................................................................................................................... 20 6.2 Total Scale Scores ........................................................................................................... 20
6.3 Reporting Category Scale Scores.................................................................................... 21 6.4 Performance Levels ........................................................................................................ 21
7. PERFORMANCE STANDARDS ........................................................................................ 22 7.1 Standard Setting .............................................................................................................. 22
7.1.1 Performance Level Descriptors (PLDs) ................................................................... 22 7.1.2 Selecting Standard Setting Committees ................................................................... 22 7.1.3 Standard Setting Process .......................................................................................... 23
7.2 Standard Setting Schedule .............................................................................................. 24 8. CALIBRATION, SCALING, AND EQUATING ................................................................ 24
8.1 Rasch Partial Credit Model (RPCM) .............................................................................. 24 8.2 Scaling............................................................................................................................. 27
8.2.1 Scale Scores for the Total Test ................................................................................ 27
8.2.2 Scale Scores for Reporting Categories .................................................................... 28
8.3 Equating .......................................................................................................................... 29 8.3.1 Field-Test Equating .................................................................................................. 29 8.3.2 Pre-Equating ............................................................................................................ 30
8.3.3 Post-Equating ........................................................................................................... 30 9. RELIABILITY ...................................................................................................................... 31
9.1 Internal Consistency........................................................................................................ 32 9.2 Inter-Rater Reliability ..................................................................................................... 32
9.3 Measurement Error ......................................................................................................... 33 9.3.1 Standard Error of Measurement ............................................................................... 33 9.3.2 Conditional Standard Error of Measurement ........................................................... 33
9.4 Decision Accuracy and Consistency ............................................................................... 34 10. VALIDITY ......................................................................................................................... 34
10.1 Validity Evidence Based on Test Content .................................................................... 35 10.1.1 Relation to Content Standards ............................................................................... 35
10.1.2 Educator Input on Item Development .................................................................... 36 10.1.3 SOL Assessment Alignment Studies ..................................................................... 36
10.2 Validity Evidence Based on Response Processes ......................................................... 36 10.2.1 Item Development .................................................................................................. 37 10.2.2 Technology Enhanced Items (TEIs) ...................................................................... 38
10.3 Validity Evidence Based on Internal Structure ............................................................. 38 10.3.1 Internal Consistency ............................................................................................... 38

Virginia Standards of Learning Assessments Technical Report 2013–2014 Administration Cycle
iv
10.3.2 Differential Item Functioning (DIF) ...................................................................... 38
10.3.3 Unidimensionality Evaluation ............................................................................... 38 10.4 Validity Evidence Based on Relationships to Other Variables .................................... 39
11. ALTERNATE AND ALTERNATIVE ASSESSMENTS .................................................. 39
12. RESOURCES ..................................................................................................................... 40 PART II: STATISTICAL SUMMARIES FOR SPRING 2014 ....................................................41
1. OVERVIEW OF STATISTICAL SUMMARIES ................................................................ 41 1.1 Administration Results.................................................................................................... 41 1.2 Reliability Estimates for Non-Writing Assessments ...................................................... 41
1.3 Reliability Estimates for Writing Assessments............................................................... 41 1.4 Decision Consistency and Accuracy Indices .................................................................. 41 1.5 Raw Score-to-Scale Score Conversion Tables and Conditional SEMs .......................... 42 1.6 VMAST Results .............................................................................................................. 42
2. SPRING 2014 STATISTICAL SUMMARY ....................................................................... 42 2.1 Administration Results.................................................................................................... 42
2.1.1 Participation by Mode of Administration ................................................................ 42 2.1.2 Percent of Students in each Performance Level ...................................................... 44
2.1.3 Raw Score Summary Statistics ................................................................................ 46 2.2 Reliability Estimates for Multiple-Choice/Technology Enhanced Item Assessments ... 50
2.2.1 Overall Reliability Estimates ................................................................................... 50
2.2.2 Reliability Estimates by Gender .............................................................................. 54 2.2.3 Reliability Estimates by Ethnic Group .................................................................... 57
2.3 Reliability Estimates for Writing Assessments............................................................... 60 2.3.1 Stratified Alpha ........................................................................................................ 60 2.3.2 Inter-Rater Reliability .............................................................................................. 66
2.4 Decision Consistency and Accuracy Indices .................................................................. 68
2.5 Raw Score to Scale Score (RSSS) Conversion Tables and Conditional SEM ............... 73 REFERENCES ............................................................................................................................132

Virginia Standards of Learning Assessments Technical Report 2013–2014 Administration Cycle
v
List of Tables and Figures
PART I: HISTORICAL OVERVIEW AND SUMMARY OF PROGRAMS ................................1 Table 2.2.2.1 Virginia Standards of Learning Assessments at Each Grade Level ..................... 3 Table 7.2.1 Virginia SOL Standard Setting Schedule .............................................................. 24 Figure 8.1.1 Sample Item Characteristic Curve for a Dichotomous Item ................................ 26 Figure 8.1.2 Sample Category Response Curves for a Polytomous Item ................................. 27
Figure 8.3.3.1 Linking Process for the SOL Assessments ........................................................ 31 PART II: STATISTICAL SUMMARIES FOR SPRING 2014 ....................................................41
Table 2.1.1.1 Percentage of Tests Taken by Mode: Grades 3–8 .............................................. 42 Table 2.1.1.2 Percentage of Tests Taken by Mode: Content-Specific History ......................... 43 Table 2.1.1.3 Percentage of Tests Taken by Mode: End-of-Course ......................................... 43
Table 2.1.1.4 Percentage of Tests Taken by Mode: VMAST Mathematics and Reading ........ 44
Table 2.1.2.1 Grades 3–8 Passing Rates ................................................................................... 44
Table 2.1.2.2 Content-Specific History Passing Rates ............................................................. 45 Table 2.1.2.3 End-of-Course Passing Rates .............................................................................. 45
Table 2.1.2.4 VMAST Grades 3–8 & End-of-Course Passing Rates ....................................... 45 Table 2.1.3.1 Summary Statistics for Grades 3–8 Reading and Mathematics Online .............. 46
Table 2.1.3.2 Summary Statistics for Grades 3, 5, and 8 History and Science Online ............. 47 Table 2.1.3.3 Summary Statistics for Content-Specific History Online ................................... 47 Table 2.1.3.4 Summary Statistics for High School End-of-Course Online .............................. 47
Table 2.1.3.5 Summary Statistics for VMAST Grades 3–8 & End-of-Course Online ............. 48 Table 2.1.3.6 Summary Statistics for Grades 5, 8, and End-of-Course Writing Tests ............. 49
Table 2.2.1.1 Cronbach’s Alpha for Grades 3–8 Reading ........................................................ 51 Table 2.2.1.2 Cronbach’s Alpha for Grades 3–8 Mathematics................................................. 51
Table 2.2.1.3 Cronbach’s Alpha for Grades 3, 5, and 8 History and Science .......................... 51 Table 2.2.1.4 Cronbach’s Alpha for Content-Specific History Tests ....................................... 52
Table 2.2.1.5 Cronbach’s Alpha for High School End-of-Course Tests .................................. 52 Table 2.2.1.6 Cronbach’s Alpha for VMAST Grades 3–8 & End-of-Course Mathematics and
Reading ..................................................................................................................................... 53
Table 2.2.2.1 Cronbach’s Alpha for Grades 3–8 Reading by Gender ...................................... 54 Table 2.2.2.2 Cronbach’s Alpha for Grades 3–8 Mathematics by Gender ............................... 54
Table 2.2.2.3 Cronbach’s Alpha for Grade 3 History and Grades 3, 5, and 8 Science by Gender
................................................................................................................................................... 55 Table 2.2.2.4 Cronbach’s Alpha for Content-Specific History Tests by Gender ..................... 55 Table 2.2.2.5 Cronbach’s Alpha for High School End-of-Course Tests by Gender ................ 56 Table 2.2.2.6 Cronbach’s Alpha for VMAST Grades 3–8 & End-of-Course by Gender ......... 57
Table 2.2.3.1 Cronbach’s Alpha for Grades 3–8 Reading by Ethnic Group ............................ 57
Table 2.2.3.2 Cronbach’s Alpha for Grades 3–8 Mathematics by Ethnic Group ..................... 58
Table 2.2.3.3 Cronbach’s Alpha for Grade 3 History and Grades 3, 5, and 8 Science by Ethnic
Group ........................................................................................................................................ 58 Table 2.2.3.4 Cronbach’s Alpha for Content-Specific History Tests by Ethnic Group ........... 59 Table 2.2.3.5 Cronbach’s Alpha for High School End-of-Course Tests by Ethnic Group....... 59 Table 2.2.3.6 Cronbach’s Alpha for VMAST Grades 3–8 & End-of-Course by Ethnic Group60 Table 2.3.1.1 Stratified Alpha for Grades 5, 8, and End-of-Course Writing ............................ 61 Table 2.3.1.2 Stratified Alpha for Grades 5, 8, and End-of-Course Writing by Gender .......... 63

Virginia Standards of Learning Assessments Technical Report 2013–2014 Administration Cycle
vi
Table 2.3.1.3 Stratified Alpha for Grades 5, 8, and End-of-Course Writing by Ethnic Group 64
Table 2.3.2.1 Inter-Rater Reliability for Grade 5 Writing Assessment: Prompts 2502, 2509,
2510, 2519, 2522, 2532, and 2549 ............................................................................................ 66 Table 2.3.2.2 Inter-Rater Reliability for Grade 8 Writing Assessment: Prompts 2806, 2810,
2812, 2813, 2819, 2849, and 2852 ............................................................................................ 67 Table 2.3.2.3 Inter-Rater Reliability for End-of-Course Writing Assessment: Prompts 2101,
2102, 2107, 2115, 2121, 2122, and 2126 .................................................................................. 67 Table 2.4.1 Decision Consistency and Accuracy Indices for Grades 3–8 Reading and
Mathematics Online Tests......................................................................................................... 68
Table 2.4.2 Decision Consistency and Accuracy Indices for Grade 3 History and Grades 3, 5,
and 8 Science Online Tests ....................................................................................................... 69 Table 2.4.3 Decision Consistency and Accuracy Indices for Content-Specific History Online
Tests .......................................................................................................................................... 69
Table 2.4.4 Decision Consistency and Accuracy Indices for High School End-of-Course
Online Tests .............................................................................................................................. 70
Table 2.4.5 Decision Consistency and Accuracy Indices for VMAST Grades 3–8 and End-of-
Course Mathematics and Reading ............................................................................................ 71
Table 2.4.6 Decision Consistency and Accuracy Indices for Grades 5, 8, and End-of-Course
Writing Tests ............................................................................................................................. 71 Table 2.5.1 RSSS Conversions for Grade 3 Reading ............................................................... 73
Table 2.5.2 RSSS Conversions for Grade 3 Mathematics ........................................................ 75 Table 2.5.3 RSSS Conversions for Grade 3 Science ................................................................ 76
Table 2.5.4 RSSS Conversions for Grade 3 History and Social Studies .................................. 77 Table 2.5.5 RSSS Conversions for Grade 4 Reading ............................................................... 78 Table 2.5.6 RSSS Conversions for Grade 4 Mathematics ........................................................ 79
Table 2.5.7 RSSS Conversions for Grade 5 Reading ............................................................... 80
Table 2.5.8 RSSS Conversions for Grade 5 Mathematics ........................................................ 81 Table 2.5.9 RSSS Conversions for Grade 5 Science ................................................................ 82 Table 2.5.10 RSSS Conversions for Grade 6 Reading ............................................................. 83
Table 2.5.11 RSSS Conversions for Grade 6 Mathematics ...................................................... 84 Table 2.5.12 RSSS Conversions for Grade 7 Reading ............................................................. 85
Table 2.5.13 RSSS Conversions for Grade 7 Mathematics ...................................................... 86 Table 2.5.14 RSSS Conversions for Grade 8 Reading ............................................................. 87
Table 2.5.15 RSSS Conversions for Grade 8 Mathematics ...................................................... 88 Table 2.5.16 RSSS Conversions for Grade 8 Science .............................................................. 89 Table 2.5.17 RSSS Conversions for United States History to 1865 ......................................... 90 Table 2.5.18 RSSS Conversions for United States History 1865 to the Present ...................... 91 Table 2.5.19 RSSS Conversions for Civics and Economics ..................................................... 92
Table 2.5.20 RSSS Conversions for Virginia Studies .............................................................. 93 Table 2.5.21 RSSS Conversions for EOC Reading .................................................................. 94
Table 2.5.22 RSSS Conversions for EOC Earth Science ......................................................... 95 Table 2.5.23 RSSS Conversions for EOC Biology................................................................... 96 Table 2.5.24 RSSS Conversions for EOC Chemistry ............................................................... 97 Table 2.5.25 RSSS Conversions for EOC Algebra I ................................................................ 98 Table 2.5.26 RSSS Conversions for EOC Geometry ............................................................... 99 Table 2.5.27 RSSS Conversions for EOC Algebra II ............................................................. 100 Table 2.5.28 RSSS Conversions for EOC Virginia and U.S. History .................................... 101

Virginia Standards of Learning Assessments Technical Report 2013–2014 Administration Cycle
vii
Table 2.5.29 RSSS Conversions for EOC World History I .................................................... 103
Table 2.5.30 RSSS Conversions for EOC World History II................................................... 105 Table 2.5.31 RSSS Conversions for EOC World Geography ................................................ 107 Table 2.5.32 RSSS Conversions for Grade 3 VMAST Reading ............................................ 109
Table 2.5.33 RSSS Conversions for Grade 3 VMAST Mathematics ..................................... 110 Table 2.5.34 RSSS Conversions for Grade 4 VMAST Reading ............................................ 111 Table 2.5.35 RSSS Conversions for Grade 4 VMAST Mathematics ..................................... 112 Table 2.5.36 RSSS Conversions for Grade 5 VMAST Reading ............................................ 113 Table 2.5.37 RSSS Conversions for Grade 5 VMAST Mathematics ..................................... 114
Table 2.5.38 RSSS Conversions for Grade 6 VMAST Reading ............................................ 115 Table 2.5.39 RSSS Conversions for Grade 6 VMAST Mathematics ..................................... 116 Table 2.5.40 RSSS Conversions for Grade 7 VMAST Reading ............................................ 117 Table 2.5.41 RSSS Conversions for Grade 7 VMAST Mathematics ..................................... 118
Table 2.5.42 RSSS Conversions for Grade 8 VMAST Reading ............................................ 119 Table 2.5.43 RSSS Conversions for Grade 8 VMAST Mathematics ..................................... 120
Table 2.5.44 RSSS Conversions for EOC VMAST Reading ................................................. 121 Table 2.5.45 RSSS Conversions for EOC VMAST Algebra I ............................................... 122
Table 2.5.46 RSSS Conversions for Grade 5 Writing Core 1 ................................................ 123 Table 2.5.47 RSSS Conversions for Grade 5 Writing Core 2 ................................................ 124 Table 2.5.48 RSSS Conversions for Grade 5 Writing Core 3 ................................................ 125
Table 2.5.49 RSSS Conversions for Grade 8 Writing Core 1 ................................................ 126 Table 2.5.50 RSSS Conversions for Grade 8 Writing Core 2 ................................................ 127
Table 2.5.51 RSSS Conversions for Grade 8 Writing Core 3 ................................................ 128 Table 2.5.52 RSSS Conversions for EOC Writing Core 1 ..................................................... 129 Table 2.5.53 RSSS Conversions for EOC Writing Core 2 ..................................................... 130
Table 2.5.54 RSSS Conversions for EOC Writing Core 3 ..................................................... 131

Virginia Standards of Learning Assessments Technical Report 2013–2014 Administration Cycle
1
PART I: HISTORICAL OVERVIEW AND SUMMARY OF PROGRAMS
1. INTRODUCTION
The Virginia Standards of Learning (SOL) Assessment Program Technical Report provides
information for users and other interested parties about the development and technical
characteristics of the assessments within the Virginia Assessment Program. The SOL technical
report is divided into two parts. Part I presents a summary of the components of the Virginia
SOL assessment program from the 2013–2014 administration cycle. Part II provides statistical
information based on results from Spring 2014.
2. STUDENT ASSESSMENTS IN VIRGINIA
2.1 Historical Overview of SOL Assessments
In 1994, Virginia initiated significant reform of its K–12 educational system. This reform, which
has evolved over the last 20 years, consists of several major elements discussed in the following
sections: high academic standards, tests to measure progress, and accountability.
2.1.1 High Academic Standards
In 1995, the Virginia Board of Education adopted a set of statewide standards: the Virginia SOL.
The Virginia SOL set forth minimum learning standards for every child from K–12 in English,
mathematics, science, and history/social science. Over time, the SOL were expanded to include
the areas of family life, economics and personal finance, fine arts, foreign language, computer
technology, health and physical education, and driver education.
The board recognized the need for regular review and evaluation of the SOL; therefore, in
September 2000, it approved a cyclical schedule for the review of the standards. This has
resulted in each subject area undergoing a review and potential revision every seven years1.
2.1.2 Tests to Measure Student Progress on the SOL
Development of tests to measure the SOL began in 1996 with heavy involvement of classroom
teachers, curriculum specialists, and other local educators throughout Virginia. A statewide
census field test of the new SOL test items took place in the spring of 1997. The first
administration of SOL tests took place in the spring of 1998, and the program has expanded
significantly since that time.
The SOL assessment program is the cornerstone of Virginia’s system of accountability for public
schools and is authorized in Virginia law and administrative rules (see Article I, Section 15 and
1 The review cycle can be accessed at the following website:
http://www.doe.virginia.gov/testing/assessment_committees/review_schedule.pdf

Virginia Standards of Learning Assessments Technical Report 2013–2014 Administration Cycle
2
Article VIII of the Constitution of Virginia and Title 22.1 Chapter 13.2 § 22.1-253.13:3C, Code
of Virginia). The purposes of the assessment program are to
establish and communicate high levels of achievement on the SOL for Virginia public
school students;
provide communication that indicates the progress of students and schools toward
meeting achievement levels on the SOL;
provide information that can be used to improve instructional programs; and
provide assurance of the quality of public education.
The federally enacted No Child Left Behind Act of 2001 (NCLB) reinforced many strategies
already present in Virginia’s public education system. For a number of years, public educators
throughout the commonwealth have focused on instructional standards, student assessment,
reporting of results, and continuous improvement. To respond to NCLB, Virginia has maintained
its rigorous academic content standards, measuring students against defined academic
performance standards, added grade-level assessments in various subjects, and reported on the
progress of student subgroups at the school, the division, and the state levels. The Virginia
Assessment Program has been used to meet state and federal educational requirements including:
monitoring the progress of students and schools toward meeting established
achievement levels;
identifying the educational needs of students;
determining which achievement levels students have attained;
determining whether students receive a high school diploma; and
providing accountability information for school, school division, and state levels.
2.1.3 Accountability for Student Achievement
The Standards of Accreditation (SOA) for Virginia’s public schools outlines the state
requirements for student testing and graduation, as well as the requirements for the accreditation
of schools in the commonwealth. The SOA may be found on the website of the Virginia
Department of Education: http://www.doe.virginia.gov/boe/accreditation/.
2.2 Overview of Current Virginia SOL Assessments
The Virginia SOL assessments are standards-based tests designed to measure student
performance on Virginia’s content standards in the areas of reading, writing, mathematics,
science, and history/social science. The SOL tests contain primarily multiple-choice (MC) items,
however the mathematics, English, and science assessments also include technology enhanced
items (TEIs).2 TEIs are developed in a variety of formats that allow students to indicate their
responses in ways other than the MC format. The writing tests administered at grades 5, 8, and
high school include writing prompts in addition to MC items and TEIs.
2TEIs were used operationally on all assessments with the exception of paper-pencil tests and history/social science
tests.

Virginia Standards of Learning Assessments Technical Report 2013–2014 Administration Cycle
3
2.2.1 Online Testing in Virginia
In the 2000 session of the general assembly, legislation was passed that required and funded a
statewide web-based technology initiative. The goal of this initiative was for Virginia school
divisions to implement online, web-based SOL instruction, remediation, and testing in Virginia’s
high schools. The initiative provided funding for school divisions to purchase hardware,
software, and to upgrade network and Internet capabilities.
Because the initial focus of the project was Virginia’s high schools, the online testing initiative
began with the end-of-course (EOC) SOL tests. The first online EOC tests were administered in
fall 2001. Since that time, additional SOL tests have been move to the web-based delivery
system in a phased approached so that all tests are now available in the online system.
2.2.2 Current SOL Assessments
In 2013–2014, students in grades 3–8 and high school were tested using SOL assessments in the
content areas listed in Table 2.2.1. High school tests were designed to address specific course
content, regardless of the student’s current enrolled grade. The content-specific history
assessments are not grade-level dependent and are typically taken in the upper elementary or
middle school years.
Table 2.2.2.1 Virginia Standards of Learning Assessments at Each Grade Level
Grade Level
SOL Content Area 3 4 5 6 7 8
Content-Specific
History High School
English: Reading • • • • • • •
English: Writing • • •
Mathematics • • • • • •
History •
Science • • •
Algebra I •
Geometry •
Algebra II •
Virginia and U.S. History •
World History I •
World History II •
World Geography •
Earth Science •
Biology •
Chemistry •
Virginia Studies •
U.S. History to 1865 •
U.S. History: 1865 to Present •
Civics and Economics •

Virginia Standards of Learning Assessments Technical Report 2013–2014 Administration Cycle
4
3. DEVELOPMENT OF SOL ASSESSMENTS
The Virginia Department of Education works jointly with Virginia educators and its testing
contractor to develop a series of tests to measure student achievement on the SOL content
standards. The development of the SOL assessments involves the use of test blueprints, item
development specifications, multiple review committees, and field testing.
3.1 Content Standards, Curriculum Frameworks, and Test Blueprints
3.1.1 Standards of Learning (SOL)
The SOL represent a broad consensus of what parents, classroom teachers, and school
administrators—as well as academic, business, and community leaders—believe schools should
teach and students should learn. In each of the four core areas of English, mathematics, science,
and history/social science, a curriculum framework is provided that details the specific
knowledge and skills students must possess to meet the content standards for these subjects. The
SOL are reviewed and updated on a seven-year cycle.
3.1.2 Curriculum Frameworks
The SOL Curriculum Frameworks3 amplify the SOL and provide additional guidance to school
divisions and their teachers as they develop an instructional program appropriate for their
students. The curriculum frameworks assist teachers as they plan their lessons by identifying the
essential knowledge and skills students need to learn.
School divisions use the curriculum frameworks as a resource for developing sound curricular
and instructional programs, but the curriculum frameworks are not intended to limit the scope of
instructional programs. Additional knowledge and skills that can enrich instruction and enhance
students’ understanding of the content identified in the SOL should be included as part of quality
learning experiences.
3.1.3 Test Blueprints
The SOL test blueprint3 serves as a guide for test construction. Each test covers a number of
SOL. In the test blueprint, SOL are grouped into categories that address related content or skills.
These categories are called reporting categories. When the results of the SOL tests are reported,
the scores will be presented in terms of scores for each reporting category and a total test score.
Each SOL is assigned to only one reporting category.
The number of test items that will be assessed in each reporting category, as well as on the test as
a whole can be found in the test blueprint. Because of the large number of SOL in each grade-
level content area, every SOL will not be assessed on every version (form) of an SOL test. By
3The curriculum frameworks and test blueprints can be accessed at the following website:
http://www.doe.virginia.gov/testing/

Virginia Standards of Learning Assessments Technical Report 2013–2014 Administration Cycle
5
necessity, to keep the length of a test reasonable, each test will sample from the SOL within a
reporting category. However, every SOL is eligible for inclusion on each form of an SOL test.
In some content areas, there are SOL that do not lend themselves to assessment within the
current format of the SOL tests. The SOL not tested are listed as “Excluded from Testing” at the
end of the blueprint for each test.
There is a specific blueprint for each test. Each blueprint contains three components relevant to
each SOL test: general test information, a blueprint summary table, and the expanded blueprint.
The general test information section provides information about the following topics:
test blueprint;
reporting categories;
assignment of SOL to reporting categories;
Standards of Learning excluded from testing;
coverage of SOL; and
use of curriculum frameworks.
A summary table of the blueprint displays the following information:
reporting categories for each test;
number of test items in each reporting category;
SOL included in each reporting category;
SOL excluded from the SOL test;
number of operational items on the test;
number of field-test items on the test; and
total number of items (operational and field-test items) on the test.
The expanded blueprint provides full text for each SOL. In addition, SOL that are excluded from
the test are categorized by the reason they were not included.
3.2 Item Development
3.2.1 Specifications and Development
Item specifications are determined by the Virginia Department of Education for appropriate
assessment of the SOL. All items assess content specified by the SOL and within the guidelines
contained in the associated curriculum frameworks. Item types include MC, TEIs, and writing
prompts. On an annual basis, item development plans are drafted based on an evaluation of the
pools of items available for traditional test forms construction. Item pool distributions map the
counts of items by SOL, by item type, by Rasch item difficulty estimates, and by cognitive
complexity level. The annual item development plans for new items are approved by the Virginia
Department of Education.
The item authoring and development process is multi-phased and involves a variety of expert
groups. Item writers external to the testing vendors’ staff are trained on requirements for the SOL
assessment program. Item writers author items in accordance with item development plan-driven

Virginia Standards of Learning Assessments Technical Report 2013–2014 Administration Cycle
6
assignments and the SOL item specifications. Item writers are experienced in item authoring for
K-12 statewide assessments and have teaching experience in their assigned subject matter and
grade span.
Testing vendors’ content/assessment specialists review and edit newly submitted items for
content accuracy and grade-level appropriateness and for adherence to principles for quality item
construction, accessibility (i.e., universal design4), and fairness (e..g., bias, sensitivity, and
limited English proficiency). Content/assessment specialists are usually former teachers in their
designated subject matter and grade span. Items are developed for the primary presentation mode
of online delivery. Each item is coded for the SOL it is intended to measure. Items are reviewed
and edited to ensure the annual batch of new items meets expected distributions of item difficulty
and cognitive complexity levels as required by the SOL being assessed. There are a series of
internal item reviews involving different staff expertise. These reviews include content reviews,
a professional editorial review, and a fairness review. Additional guidance and feedback is
provided regarding the appropriateness of the content match to the SOL and adherence to item
specifications through Virginia content review committee meetings, as well as reviews
completed by Virginia Department of Education.
3.2.2 New Item Content Review Committees
On an annual basis, Virginia educators from across the state participate in the development of the
SOL assessments. Every summer, content review committees convene to review content
materials for the SOL program. Content committees are composed primarily of educators
teaching the subject of the test, including special education teachers. A small number of
committee members may be division curriculum staff or other school division employees. They
represent all grade levels—grade 3 through high school—all content areas, and the racial/ethnic
diversity of Virginia students. Committee members also represent a geographical cross section of
Virginia. Approximately one-third of every committee is new members each year in order to
provide a balance of experienced educators and new members and to bring new perspectives into
committee meetings. The committee members review the newly developed test items to confirm
that they appropriately and fairly measure student knowledge and skills in accordance with the
SOL and curriculum frameworks.
The committee members receive an orientation to the SOL assessment program, an overview of
the test development process, and information about their important role. Training focuses on
educators making judgments about the match of content to SOL, the appropriateness of the
content for the grade level, and fairness and accessibility issues. Committees meet separately by
grade level and subject. In addition to reviewing the match of the items to the SOL, content
review committee members also identify and note their concerns regarding potential item bias in
the areas of gender, racial/ethnic, religious, socioeconomic, and regional characteristics.
Additionally, special populations concerns may be noted regarding students with disabilities and
limited English proficiency (LEP). Following discussion, the committee as a whole recommends
4The application of the principles of universal design to assessments entails a blend of good test design,
consideration of as many users as possible, assistive technology where appropriate, and builds in appropriate visual
design (Dolan & Hall, 2001).

Virginia Standards of Learning Assessments Technical Report 2013–2014 Administration Cycle
7
that an item be accepted, edited, or rejected. Each committee member is also provided an
individual comment (input) form. While committee recommendations are made by consensus,
committee members also record their individual recommendations which may differ from the
committee consensus, on the comment forms. All recommendations are tallied, and all comments
are compiled into a master document that becomes an official record of the committee review.
Only after committee recommendations are counted and comments recorded, is the final decision
about an item made. As a result of the new item review process, some items are eliminated from
the prospective field-test set, while others are edited in the manner directed for field testing.
3.3 New Writing Prompt Development
3.3.1 Specifications and Development
Writing prompts are used to assess students’ writing skills on the SOL writing tests in grades 5,
8, and EOC. New writing prompts are developed and field tested every four or five years as
needed to support test construction. English language arts content specialists and item writers
draft large numbers of potential writing prompts. Each writing prompt adheres to SOL
specifications and is written in the form of a question, an issue, or a hypothetical situation.
3.3.2 New Writing Prompt Review Committees
As needed, the summer writing content review committees are asked to provide input on new
writing prompts including evaluating the prompt’s clarity, appropriateness for the SOL,
similarity to prior prompt topics,5 and perceived ability of the prompt to elicit an extended
written student response. The review process is similar to that used for the review of new MC
and TEIs. The committee as a whole provides a consensus recommendation, with individual
members’ comments captured on prompt comment forms. Based on committee feedback, edits
may be made to the prompts prior to field testing.
3.4 Field Testing
Once items and prompts have been developed, reviewed, and approved by the content review
committees and the Virginia Department of Education, they are eligible for inclusion on a field
test.
3.4.1 Embedded Field Testing of MC and TEIs
Field-test items are embedded within the Spring test forms in such a way that they appear
throughout the operational test form and are not identifiable to students. This allows for the
collection of data on the new items that is not impacted by motivation, as might occur if the
students knew that the new items did not contribute to their score.
The position of the field-test items is pre-determined for each core form, as is the number of
field-test variations per core. Each form has the same number of field-test items to keep the test
5 New prompts are compared to old prompt pools to make sure that the same topic is not used again.

Virginia Standards of Learning Assessments Technical Report 2013–2014 Administration Cycle
8
length consistent. The number of field-test forms is determined based on how many new items
need to be field tested in a given year.
In the fall and summer administrations where the population taking the test is not representative
of the state’s student population, place-holder items are included in the field-test positions to
maintain consistent test lengths. These items do not contribute to a student’s score, nor is the data
used to update item statistics.
3.4.2 Stand-Alone Field Testing of Writing Prompts
For writing tests, new prompts are field tested as needed using a separate, stand-alone field-test
administration. Typically, new writing prompts are developed and field tested every four to five
years. The last stand-alone field test for writing occurred during the 2011–2012 administration.
3.4.3 Sampling
During each spring test administration, test forms are distributed throughout the commonwealth
in a way that will facilitate timely equating and the collection of representative field-test data.
The manner in which test forms are distributed across the school divisions is called the sampling
plan. The sampling procedures are based on data files containing participation counts that
schools submit prior to the Spring administration. These files indicate the number of students in
each school who will take each test online or in paper-and-pencil format. In conjunction with the
participation counts, the school division’s graduation date and the date that school closes for the
year are considered when assigning test forms in the sampling plan.
An attempt is made to assign test forms to divisions in such a way that approximately equal
numbers of students respond to each field-test variation across the cores.6 Also, test forms are
assigned at the school division level so that all schools are administered the same core for a
given test. The core that is assigned to a division by the above process is labeled the Main form
for that division. Each division is also assigned an alternate form. The alternate form is utilized
in retesting students in the case of a testing irregularity. For instance, an administrator may need
to assign a different test form if the student becomes ill during a test, or if there is a disruption
that prevents the student from completing the test.
The MC/TEI section of the writing tests is assigned to divisions in the same way as the non-
writing tests. In addition, there are six to seven writing prompts that are administered each
spring. Of the six to seven prompts, four or five are new writing prompts that must be equated;
the other prompts have been equated during a previous administration. In order to obtain enough
data to calibrate each new prompt for equating purposes, the new prompts are randomly assigned
across the divisions.
6Each core generally contains multiple forms. The core and linking items are identical across each form, but the
embedded field-test items vary.

Virginia Standards of Learning Assessments Technical Report 2013–2014 Administration Cycle
9
3.4.4 Data Review Committees
In addition to reviewing new items during the summer item content review meetings, Virginia
educators review field-tested items. During the data review meeting, committee members’ are
asked to review the appropriateness of items’ content, using the field-test item statistics to inform
their judgments, as appropriate. During the data review meeting, committees recommend
accepting or rejecting items. As with new item review, comment (input) forms are the official
record of committee activity.
The same committee that reviews the writing MC items and TEIs also reviews writing prompt
results (when available). As part of the training for the prompt reviews, committee members are
provided with information on the scoring rubrics. The Virginia SOL Writing Field Test Prompt
Evaluation Form, which Virginia’s testing contractor completes as an evaluation of the prompts,
is also provided to the committee. This form is a hybrid of qualitative and quantitative
information. During the scoring process for field-tested prompts, scorers and team leaders record
their observations about the student responses to each prompt. Team leaders then compile a
qualitative report that addresses the following questions:
Did the students understand what the prompt asked them to do?
Did the students seem engaged by the prompt?
Were the students able to effectively focus on a central idea and provide specific
information and details?
Did the scorers, based upon reading hundreds of student responses to the prompt,
recommend that this prompt be used for live testing?
The report also includes the following pieces of information for each prompt:
final frequency distribution of prompt scores
suggestions and comments from the scorers
several examples of students’ written responses
Committee members review the prompt and responses to ascertain whether the prompt actually
elicited responses that are complete and well elaborated. Members also review the prompt itself
for appropriate content and to ensure fairness for all students. A prompt that elicits responses that
are similar to lists, or a prompt that seems to confuse students is considered to be poorly
performing and is usually recommended for rejection. In some circumstances, a prompt will be
recommended for field testing again at a different grade level. Feedback and comments from
committee members is added to the final report.
3.4.5 Statistics Reviewed During Data Review Meetings
For the purpose of reviewing the quality of new test items, reviewers are provided with various
data to assist them in decision-making. These data include classical statistics and item response
theory (IRT) statistics (Rasch measurement model).
The classical statistics calculated for the MC items/TEIs include
Virginia Standards of Learning Assessments Technical Report 2013–2014 Administration Cycle
10
numbers of students tested overall and by gender and ethnic group (African American,
Caucasian, Hispanic, and Asian);
traditional difficulties (p-values);
item-option response distributions for all respondents by gender and ethnic group; and
point-biserial correlations.
Classical statistics computed for field-tested writing prompts include
numbers of students tested overall and by gender and ethnic group (African American,
Caucasian, Hispanic, and Asian); and
frequency distributions, means, and standard deviations for the writing domain raw and
total scores.
To supplement the classical statistics, item difficulty parameter estimates based on the Rasch
IRT model are computed. More information about the Rasch model is included in Section 8 of
this report.
Three types of differential item functioning (DIF) data are calculated: separately calibrated
Rasch difficulty comparisons, Mantel-Haenszel Alpha and associated chi-square significance,
and response distributions for each analysis group. The differential Rasch comparisons provide
item-difficulty estimates for each analysis group. Under the assumptions of the Rasch model, the
item-difficulty value obtained for one group can be different from that of another group only
because of variations in some group characteristics and not because of variations in achievement.
When the Rasch item-difficulty estimate shows a statistically significant difference between
groups, the item is flagged to indicate that further examination of the particular item is needed.
The Mantel-Haenszel Alpha is a log/odds probability indicating when it is more likely for one of
the demographic groups to answer a particular item correctly. When this probability is
significantly different across the various groups, the item is flagged for further examination.
Response distributions for each analysis group indicate whether members of a group were drawn
to one or more of the answer choices for the item. If a large percentage of a particular group
selected an answer choice not chosen by other groups, the item is inspected carefully.
Statistical analyses merely serve to identify test items that have unusual characteristics. They do
not specifically identify items that are “biased;” such decisions are made by item reviewers who
are knowledgeable about the state’s content standards, instructional methodology, and student
testing behavior.
3.5 Test Construction
3.5.1 Procedures
New core operational test forms are generally used for the first time in the spring test
administration. For non-writing tests, generally three new core forms are developed annually for
all EOC assessments, except EOC World Geography. Typically, three new core forms are also
developed annually for all writing tests (at grades 5, 8, and EOC). For all other SOL tests two

Virginia Standards of Learning Assessments Technical Report 2013–2014 Administration Cycle
11
new core forms are typically developed annually. In some cases, fewer core forms are developed
and core forms from previous years are reused.
Test specifications and test construction guidelines are developed and approved by the Virginia
Department of Education. Test construction guidelines provide the operational process and the
established expectations (both psychometric and content characteristics) to guide SOL forms
assembly. The goal is to create test forms that are equivalent in content representation and
psychometric characteristics both within a year and across years.
A common item linking design is used year to year. Items from a core form from the prior spring
test administration are placed in the new administration’s two or three core forms and serve as
the anchor items. Anchor items are placed in the same, or nearly the same sequence positions in
the new core form that they appeared in on the old form. For tests with items that are associated
with passages (reading and writing), the passages (and associated items) are placed in as close as
possible to the same position within the new test form as they were placed in the prior form.
Anchor items represent approximately 20–30% of the operational forms. Content specialists
select anchor items, and psychometrics and the Virginia Department of Education approve them.
Following the approval of anchor items, content specialists select the remaining operational
items for each test. During the test construction process, psychometricians review each form to
see whether it meets the test specification blueprint and the statistical targets established to
produce forms of similar difficulty, statistical quality, and content representation within and
across years.
These draft forms are reviewed by the Virginia Department of Education. Any item replacements
are reviewed by psychometricians. The review process continues iteratively until the Virginia
Department of Education has provided final approval.
3.5.2 Test Form Review Committees
The newly drafted operational test forms for each SOL assessment are reviewed by content
review committees at the summer meetings. The new core forms are reviewed for each SOL test.
Committee members receive training for this task including information on the match of the
items on a form to the SOL test blueprint, the arrangement of items within the form, and the
balance of topic coverage and item types. Members are asked to confirm the appropriateness of
the item content and the accuracy of the keys.
Individual committee members have comment forms to record their overall evaluation of the test
form, as well as comments on individual items. Individual members’ comments and
recommendations are compiled into a master document following the meeting. Committee
review may result in the need to replace one or more items on a core form. These changes are
subject to review and approval by psychometrics and the Virginia Department of Education.
Once operational test cores are finalized, content specialists select field-test items and create
multiple sets that are embedded into the core forms to create multiple core form variations. These
field-test sets are reviewed and approved by the Virginia Department of Education.

Virginia Standards of Learning Assessments Technical Report 2013–2014 Administration Cycle
12
4. TEST ADMINISTRATION
4.1 Training and Materials
To ensure the successful administration of the SOL assessments, Virginia Department of
Education staff provides training to the division directors of testing (DDOTs) before each fall
and spring test administration. DDOTs in turn provide appropriate training to the divisions’
school test coordinators (STCs). STCs provide training to the schools’ examiners and proctors
including information about security requirements, manuals, local directions received from the
DDOTs, and other pertinent information. They address training preparation of the test sites and
the provision of accommodations for eligible students.
Test implementation manuals contain detailed instructions about administration procedures.
These manuals are provided on the Virginia Department of Education website:
http://www.doe.virginia.gov/testing/test_administration/index.shtml.
4.2 Testing Windows
There are three test administrations: Spring, Summer, and Fall. The Spring administration is the
main administration during which most students test. During the Spring administration SOL
assessments for all grades and subjects are provided. The Summer administration is available for
only grade 8 math and reading and all EOC tests. This administration provides an opportunity for
students to retest who are enrolled in summer school for EOC courses, for students who need to
retake an SOL tests to earn verified credits, and for transfer students who are seeking to earn
verified credits for qualifying transfer courses. The Fall administration is available for only
grades 6–8 and EOC. This administration is available for students who are retesting to earn
verified credits for graduation, and for students taking courses with block schedules who
complete a course during the fall. Some Virginia schools provide a block schedule for grades
6–8.
A fairly long testing window is provided for online assessments so that schools have enough
time to coordinate student access to computers and to accommodate different school calendars
across the state. Divisions can choose the weeks within the testing window during which they
will administer the assessments, leaving sufficient time for make-up testing. The testing window
for the writing assessments is earlier than the testing window for the non-writing assessments to
provide extra time for the human-scoring of the short paper (essay) component of the
assessment. In addition, the MC item/TEI component and the short paper component can be
administered separately. Unlike the online tests, paper tests are administered on a specific day.
The testing calendar is posted on the Virginia Department of Education website:
http://www.doe.virginia.gov/testing/test_administration/index.shtml.
4.3 Test Security Procedures
Everyone in the division who has access to, or assists with the administration of the paper-and-
pencil or online SOL assessments must read the Test Security Guidelines and sign the Test

Virginia Standards of Learning Assessments Technical Report 2013–2014 Administration Cycle
13
Security Agreement. The security agreement requires that those involved in the test
administration exercise the necessary precautions to ensure the security of the test content and all
test materials. This includes security procedures pertinent to the receipt, inventory, distribution,
and storage of test materials. These forms are included in each examiner’s manual and testing
implementation manual.7
4.4 Testing Accommodations
All students in tested grade levels and courses are expected to participate in Virginia’s
assessment program, unless specifically exempted by state or federal law or by Board of
Education regulations. Virginia’s assessment system includes students with disabilities and LEP
students. Students with disabilities and LEP students may take SOL tests with or without
accommodations or they may be assessed through alternate or alternative assessments. The tests
that comprise the Virginia Assessment Program are offered in English only; administration of the
tests in other languages is not permitted.
The individualized education program (IEP) team or 504 committee has the responsibility for
decisions regarding the need for and the selection of accommodations for students with
disabilities. Similarly, the LEP committee determines how LEP students will participate in the
SOL assessments and what, if any, accommodations should be provided to individual LEP
students. Accommodations allow students with disabilities or LEP designation more appropriate
access to test content so they can demonstrate their content knowledge.
Accommodations considered for testing should be those that the student uses routinely during
classroom instruction and assessments, as identified in the student’s IEP, 504 plan, or LEP
participation plan. The student should be familiar with an accommodation because the use of an
unfamiliar accommodation during testing may have a negative impact on the student’s
performance. However, it is important to note that certain accommodations used for instruction
or classroom assessment may not be allowed on the statewide assessment. Finally, providing an
accommodation based solely on its potential to enhance performance beyond allowing for more
appropriate access is inappropriate.
4.4.1 Testing Accommodations for Students with Disabilities
There are many assessment options for students with disabilities. These include the SOL
assessments without accommodations, the SOL assessments with accommodations, and
alternative (on-grade level) or alternate assessments including the Virginia Substitute Evaluation
Program (VSEP), the Virginia Grade Level Alternative (VGLA)8, the Virginia Modified
Achievement Standards Test (VMAST), and the Virginia Alternate Assessment Program
(VAAP). Information on state assessment options available to students with disabilities is
provided in the Students with Disabilities: Guidelines for Assessment Participation document
available on the Virginia Department of Education's website.
7These manuals may be downloaded from the following website:
http://www.doe.virginia.gov/testing/test_administration/ 8 VGLA is available for qualifying students with disabilities in 3–8 writing, science, and history.

Virginia Standards of Learning Assessments Technical Report 2013–2014 Administration Cycle
14
http://doe.virginia.gov/testing/participation/index.shtml.
The SOL assessments must be considered by the IEP Team or 504 Committee before
alternate/alternative assessments are considered. Although many students with disabilities will be
able access the SOL assessments without accommodations, others will require test
accommodations to address their disabilities and individual needs. Test accommodations for
students with disabilities are grouped in the following categories: time/scheduling, setting,
presentation, and response. The accommodations available within each of these categories are
provided in the table below and are described in more detail on the Virginia Department of
Education website.
http://www.doe.virginia.gov/testing/participation/guidelines_for_special_test_accommodations.p
df.

Virginia Standards of Learning Assessments Technical Report 2013–2014 Administration Cycle
15
4.4.2 Testing Accommodations for LEP Students
Testing accommodation determinations for LEP students, made by the LEP Committee, should
be based on the evidence collected from the student’s educational record, such as:
demographic information, including grade, age, number of years in U.S., prior schooling;
standardized testing scores, the ACCESS for ELLs9 test scores, and other academic
testing achievement;
current academic achievement, including general education achievement and comments
from general education teachers; and
English Language Proficiency Level as reported on the ACCESS for ELLs score report.
There are two types of accommodations available for LEP students on the Virginia SOL
assessments—direct and indirect linguistic accommodations.
Direct linguistic testing accommodations involve adjustments to the language of the test. The
following direct linguistic testing accommodations are available to LEP students on the SOL
assessments:
Read-Aloud Test (English only)
Audio Test (English only)
Bilingual Dictionary
Dictation to a Scribe (Writing, short-paper component only)
English Dictionary
Plain English Mathematics Test (grades 3 through 8 and Algebra I)
Audio tests are created by taking SOL items and recording a narrator who reads the test items out
loud in English. This recording can then be used for many students rather than depending on a
test administrator to read an item aloud over and over on an as-needed basis. Plain English test
versions include items that have less complex language, but still measure the full breadth and
depth of the SOL mathematics content standards. When Plain English forms were first
developed, existing SOL items would be evaluated, and the language would be simplified where
possible. Now items are created that assess the content without including complex language as
part of the item development process. Item writers are trained to use the following guidelines.
Avoid words that have double meaning
Avoid potentially unfamiliar words
Use short sentences
If lots of information is needed, break it up into bullets
Indirect linguistic testing accommodations involve adjustments to the conditions under which
LEP students take SOL tests. The following indirect linguistic testing accommodations are
available to LEP students on the SOL assessments:
9 Assessing Comprehension and Communication in English State-to-State for English Language Learners (ACCESS
for ELLs®) is Virginia’s English language proficiency assessment.

Virginia Standards of Learning Assessments Technical Report 2013–2014 Administration Cycle
16
Flexible schedule
Visual Aids
Student indicates a response
Additional information about the accommodations available for LEP students on the Virginia
SOL assessments is provided on the Virginia Department of Education website.
http://www.doe.virginia.gov/testing/participation/lep_guidelines.pdf.
5. WRITING SCORING
5.1 Human Scorer Recruitment and Qualifications
The constructed response portion of the SOL writing assessment is scored by human raters.
Highly qualified, experienced raters score all writing samples. These raters are drawn from a
database of college graduates who completed the selection process for scorers. The need for
ethnic and racial diversity is emphasized throughout the selection process. Scorers for the
Virginia SOL writing test have a minimum of a bachelor’s degree in an appropriate academic
discipline (e.g., English, education), demonstrated ability in performance assessment scoring,
and, preferably, teaching experience at the elementary or secondary level. The selection process
requires that each candidate successfully complete a personal interview, online scorer training,
and attain a high enough score on a qualification activity.
In addition to the scorers, scoring supervisors, scoring directors, and content specialists are
involved in the scoring process. Scoring supervisors are selected based on their proven ability to
score responses accurately and communicate scoring standards to scorers. Scoring directors are
chosen based on their expertise in evaluating writing and their experience training and
supervising scorers. A writing content specialist monitors quality and provides support and
direction for scoring directors. The content specialist is assigned based on educational
background and scoring experience.
5.2 Rangefinding
The writing samples used for training scorers are from the samples scored during the
rangefinding process. Rangefinding is the process of identifying model writing samples for the
two writing domains (composing/written expression and usage and mechanics) that characterize
each score point of the writing rubric (1–4). Scoring directors and the content specialists work
with Virginia rangefinding committees to create training sets. These writing samples, and others
identified by Virginia Department of Education and testing contractor staff, are used as scoring
guides during scorer training, qualifying, and calibration. The primary goal of the training is to
convey the decisions made during rangefinding to the scorers and to help them internalize the
scoring protocol.

Virginia Standards of Learning Assessments Technical Report 2013–2014 Administration Cycle
17
5.3 Scorer Training and Qualifying Procedures
Scorers are required to take several training modules where they learn about using the online
scoring system and implementing the scoring rubric. Each student essay response receives a
score on a scale of 1–4 points for each of the domains. The four rubric score points represent the
following:
4 = consistent control
3 = reasonable control
2 = inconsistent control
1 = little or no control
Training also includes a review of the anchor sets identified during rangefinding. These sets
represent each of the four rubric scores and both writing domains. The sets have been scored and
annotated so that scorers learn how and why the scores were determined. Next they complete
practice sets which include additional writing samples. Finally, they receive qualification writing
sets which they must score accurately in order to continue participating in the scoring of student
essays.
5.3.1 Anchor Sets
Scorers review an anchor set for each of the two domains. Anchor sets include clear examples of
each score point (1–4) and include annotations that provide a rationale for the scores assigned
during rangefinding. These papers help the scorers internalize the scoring rubric.
5.3.2 Practice Sets
After reviewing each anchor set, scorers practice on sample papers, applying a score for the
domain they are reviewing. The sets include examples of each score point. After applying scores
to practice papers, scorers review annotations. The annotations provide feedback on true scores
(the scores approved by the rangefinding committee) and explain the correct scores for the
practice papers.
5.3.3 Qualifying Sets
In order to qualify to score the Virginia SOL writing assessment, scorers take four sets of 10
papers and must achieve 70% perfect agreement and 100% adjacent agreement with
rangefinding-committee-approved scores for each domain on two of the four sets. Scorers who
do not meet these standards are released from the project.

Virginia Standards of Learning Assessments Technical Report 2013–2014 Administration Cycle
18
5.4 Scoring Procedures
5.4.1 Two Raters with Resolution for Nonadjacent Scores
In each test administration cycle, each writing response is reviewed by at least two professional
scorers. The first and second raters score the writing response. If the scores match or are
adjacent, they are summed together to create the final student score. If they are not adjacent, a
scoring supervisor provides a third score. If the third score matches one of the first two, then it is
summed with the matching score to provide the final score. If the third score is adjacent to one
(or both) of the first two scores, then the third score and the higher of the adjacent scores are
summed together to provide the final score. If the three scores do not match, and are not
adjacent, then the response is scored a fourth time by a scoring director. If the fourth score
matches any of the first three scores, then it is summed with the matching score which provides
the final score. If the fourth score is adjacent to any of the first three scores, then it is summed
with the highest adjacent score to provide the final score.
For responses that receive a backread score, this third score can overrule the outcome from the
first two scorers. For example, if the first two scorers provided a score of 2, but the backread
provided a score of 3, then instead of adding the first two scores together to provide the final
score, the backread score and the highest adjacent score would be added together. So in this
example, the student would receive a final score of 5 instead of the original score of 4. If the
backread score was 4 in this example, it would not match or be adjacent to the first two scores,
so the response would require a fourth score.
5.4.2 Backreading
Backreading is a system that allows a scoring supervisor and/or a scoring director to monitor an
individual rater’s score. Scoring supervisors read responses already scored by scorers they are
monitoring. While backreading, the scoring supervisor can evaluate the scorer’s performance,
provide feedback, and—if necessary—adjust an assigned score. The scoring supervisor may also
halt the scoring activity of an individual or group of scorers whose performance has declined.
The inter-rater reliability requirements are 65% perfect agreement and 96% perfect plus adjacent
agreement for all scorers. Approximately 5% of papers are included in the backreading process.
5.4.3 Validity Checks
Throughout scoring, scorers receive and score validity papers. These papers are pre-scored
according to rangefinding standards. All scores on validity papers are approved by the Virginia
Department of Education. Validity papers are used to monitor consistency in scoring over time;
they are interspersed with and indistinguishable from other student responses. Approved true
scores for these papers are loaded into the scoring system, and a report is run that indicates what
percentage of accuracy a scorer achieves on validity papers in scoring against the true score.
Validity papers are used as a check to ensure that scorers, as well as scoring supervisors, do not
drift from the rubric but continue to score accurately. For scorers that do not meet the 65%
perfect and 96% perfect plus adjacent agreement, targeted calibration sets are sent to further
evaluate a scorer and provide re-training.

Virginia Standards of Learning Assessments Technical Report 2013–2014 Administration Cycle
19
5.4.4 General Calibration Sets
Calibration is a process whereby scorers apply scores to student papers that had been scored
previously by scoring directors and possibly a scoring supervisor. Calibration sets include
student responses and are used as a training tool to improve agreement among scorers. After
scorers take a calibration set, annotations provide an explanation for the correct scores for the
responses.
Calibration is a form of training that creates consensus and accuracy among scorers. Calibration
sets may focus on particular scoring issues—including clarifying a scoring line, showing a
response that is unusual or problematic to score, or showing a range of responses or performance
skills for a particular score point. The scoring directors present scorers with calibration sets daily
throughout scoring.
5.4.5 Targeted Calibration Sets
Targeted calibration sets are similar to the general calibration sets. They include pre-scored
student responses. However, like the qualifying sets, scorers must achieve 70% exact agreement
and 100% exact plus perfect agreement in order to be allowed to continue scoring. Scorers who
do not attain the target accuracy rates are dismissed from the scoring process.
5.5 Rescore Process
The primary purpose of the rescore process is to provide an additional step to ensure that the
score assigned to the student’s writing sample produced as part of the writing tests is an accurate
representation of the student’s achievement.
5.5.1 Automatic Rescores
An automatic rescore process is applied to all EOC writing prompts scored as non-passing that
meet the following criteria:
student is attempting to achieve high school graduation by August 31 of that school year
a non-passing score was assigned to the student’s test
given the earned score on the MC component of the writing test, a passing overall score
is attainable when combined with a perfect score on the written component of the writing
test
5.5.2 Rescore Requested by School Divisions
Requests to rescore a student’s writing response may be initiated by parents or by school
personnel. All requests must be reviewed and approved by the school division before being
submitted. Requests should be considered only if there is substantial evidence that the writing
sample should have received a higher score. School division staff familiar with the rubric used to
score this assessment must review the writing sample. Rescore requests should be approved by
the school division only if the reviewers agree that the paper should have received a higher score

Virginia Standards of Learning Assessments Technical Report 2013–2014 Administration Cycle
20
according to the rubric. A school division may request that a student’s writing sample be
rescored if
the student failed the test; AND
there is evidence that the writing sample produced by the student for the writing test
should have received a higher score. Evidence of this requires that at least two school
division staff familiar with the rubric used to score the writing short-paper portion of the
writing test review the paper and agree that it should have received a higher score.
6. SCORES
6.1 Raw Scores
A raw score represents the number of points a student received for correctly answering questions
on a test. For the SOL non-writing tests that consist of MC items and TEIs only, the raw score
that a student earns is equal to the number of items the student answers correctly. For the SOL
writing tests that have a MC/TEI component and a short-paper component, the raw score of the
short-paper component is calculated as the weighted sum of the ratings given for each domain10
and the total raw score is the sum of the raw scores on the two components (MC/TEI plus short
paper).
Because different tests have different item types and different numbers of questions, the raw
score is only useful in relation to that test or content area. For example, consider a student who
receives a raw score of 59 on mathematics and a raw score of 43 on reading. Now imagine that
there were 75 total items on the mathematics test and 50 total items on the reading test. In simple
terms, this can mean the respective percentage correct would be 79% for the mathematics test
and 86% for the reading test.
Raw scores cannot be used for comparing student performance across different tests or test forms
because they are affected by test length and difficulty. Raw scores are comparable only within a
given test form. To make comparisons of student performance within a test across years, raw
scores must be converted to scale scores.
6.2 Total Scale Scores
A scale score is a conversion of a student’s raw score on a test to a common scale. The common
scale allows for a numerical comparison of student scores across different years and versions of a
specific test. Because Virginia uses multiple versions of a test within a grade and subject, the
scale is used to control slight variations in difficulty from one version of a test to the next. For all
SOL tests, the scale scores range from 0 to 600. Sometimes a scale score can be estimated as less
than 0 (for very low raw scores), or greater than 600 (for very high raw scores). In these cases, to
keep the range consistent, scale scores below 0 are set to 0 and scale scores above 600 are set to
600. In addition, at a raw score of 0, the scale score is always set to be 0, and at the top raw score
10
Each essay is scored on two elements: 1) composing and written expression and 2) usage and mechanics.

Virginia Standards of Learning Assessments Technical Report 2013–2014 Administration Cycle
21
(100% correct), the scale score is always set to 600 (see Section 8.2 for more information on
Scaling).
While the scale scores can be used for comparisons across test forms within an SOL test, they
cannot be compared across different SOL tests. For example, scale scores cannot be used to
reliably determine whether a student or group of students is stronger in reading than in
mathematics.
6.3 Reporting Category Scale Scores
SOL are grouped into categories that address related content or skills. These categories are called
reporting categories.11
For each SOL assessment, reporting category scale scores are reported in
addition to the overall test scale score. There are varying numbers of reporting categories for the
SOL assessments. For each assessment, the reporting category scale scores range from 0 to 50,
with a 30 indicating approximate mastery of the content covered by that reporting category.
Sometimes a reporting category scale score can be estimated as less than 0 (for very low raw
scores), or greater than 50 (for very high raw scores). In these cases, to keep the range consistent,
scale scores below 0 are set to 0 and scale scores above 50 are set to 50. In addition, at a
reporting category raw score of 0, the reporting category scale score is always set to be 0, and at
the top reporting category raw score (100% correct), the reporting category scale score is always
set to 50 (see Section 8.2 for more information on Scaling).
Reporting category scale scores allow only comparisons within a given reporting category. A
reporting category scale score cannot be used to reliably determine whether a student or group of
students is stronger on one reporting category compared to another reporting category.
6.4 Performance Levels
In addition to test scores, performance levels are reported on all SOL assessments. Students are
classified into performance levels on the basis of their scale scores as compared with the
performance level cut scores, which were adopted by the Virginia Board of Education based on
recommendations of educators who participated in standard setting meetings. For the reading and
mathematics assessments in grades 3–8, there are four performance levels: fail/below basic,
fail/basic, pass/proficient, and pass/advanced. For all other assessments, there are three
performance levels: fail/does not meet, pass/proficient, and pass/advanced or advanced/college
path for EOC Reading, EOC Writing, and Algebra II. For all SOL assessments, the cut score for
the pass/proficient level corresponds to a scale score of 400, and the cut score for the
pass/advanced level corresponds to 500.
Regardless of which form or test administration a student takes a particular SOL test, the same
level of achievement is required to obtain a scale score of 400 for pass/proficient and a scale
score of 500 for pass/advanced. For each SOL assessment, the scale scores that represent
pass/proficient and pass/advanced remain the same over years, but they may correspond to
11
A list of the reporting categories for a given SOL assessment can be found in the test blueprints:
http://www.doe.virginia.gov/testing/

Virginia Standards of Learning Assessments Technical Report 2013–2014 Administration Cycle
22
different raw scores across test forms and administrations. The fluctuation of raw scores does not
mean that the requirements for the performance levels have changed. It only reflects changes in
difficulty across test forms.
7. PERFORMANCE STANDARDS
7.1 Standard Setting
Performance standards relate levels of test performance directly to what students are expected to
learn, as defined in the statewide curriculum. This is done by establishing cut scores that
distinguish between performance levels. Standard setting is the process of establishing the cut
scores that define the performance levels for an assessment.
7.1.1 Performance Level Descriptors (PLDs)
Performance level descriptors (PLDs) are statements of what a student should know and be able
to do at each performance level given the content standards being assessed. In grades 3–8
reading and mathematics, there are four performance levels that a student may achieve:
fail/below basic, fail/basic, pass/proficient, and pass/advanced. For all other assessments, three
performance levels exist: fail/does not meet, pass/proficient, and pass/advanced or
advanced/college path12
for EOC Reading, EOC Writing, and Algebra II.
7.1.2 Selecting Standard Setting Committees
Standard setting committee meetings are used to establish cut scores on the SOL assessments
that operationalize the PLDs. Virginia educators participate in the meetings and recommend cut
scores. These educators are recruited by the Virginia Department of Education based on the
following criteria:
instructional training and experience in the content area;
in-depth knowledge of the SOL content standards;
instructional experience with students who have disabilities and/or LEP students; and
balanced regional representation.
Additionally, secondary and higher education members are recruited to participate in setting the
EOC performance standards.
12
A student obtaining the proficiency level of advanced/college path on the Algebra II test should have the necessary
knowledge and skills for enrollment, without remediation, in an introductory credit-bearing college mathematics
course with Algebra II as the highest prerequisite. A student obtaining a proficiency level of advanced/college path
on the EOC Reading test should have the necessary knowledge and skills for enrollment, without remediation, in an
introductory credit-bearing college course with a substantial reading load. A student obtaining a proficiency level of
advanced/college path on the EOC Writing test should have the necessary knowledge and skills for enrollment,
without remediation, in an introductory credit-bearing college course with a substantial writing load.
Virginia Standards of Learning Assessments Technical Report 2013–2014 Administration Cycle
23
7.1.3 Standard Setting Process
Standard setting panelists are guided through an established process to help them identify cut
scores that make sense and reflect the PLDs.
Standard setting panelists participate in a general session in which the reason for setting new
performance standards is described and an overview of the standard setting procedure is given.
Following the general session, committees break into subject- and grade-specific groups, where
they review the PLDs and define threshold descriptions which further define what “just barely
basic”, “just barely proficient” and “just barely advanced” students know and can do. After
discussion and general agreement about what the threshold level descriptions are for the basic,
proficient and advanced performance levels, the panelists review the operational test in order to
experience it as a student would. For the SOL writing tests, they also review examples of short
paper responses as well as scoring rubrics.
The methods in the Angoff (1971) family of standard setting procedures are among the most
widely used approaches employed for selected-response (MC) exams. The particular variation of
Angoff used in to set standards for the Virginia SOL assessments is called the Yes/No method.
For MC items, panelists review each operational test item and evaluate whether or not the “just
barely proficient” and “just barely advanced” student would be likely (at least 2/3rds of the time)
to get the item correct (yes or no). MC score recommendations for each performance level are
calculated by recoding each ‘yes’ to the value of one (1) and each ‘no’ to the value of zero (0)
and then summing across all items for each individual.
For the short paper component on the writing assessments, another variation of Angoff known as
the Expected Task Score approach is used. Using this method, panelists evaluate whether or not
the “just barely proficient” and “just barely advanced” student would be likely (at least 2/3rds of
the time) to get each rubric score (1, 2, 3, and 4). Although each domain is scored on a 1–4 point
scale, the domains are differentially weighted when finding the total score. Essay score
recommendations for each performance level are calculated by summing together the weighted
rubric score across the two domains for each individual. Individual total cut score
recommendations for each performance level are calculated by summing together the selected
response score recommendations and short paper score recommendations for each panelist.
Panelists practice the Modified-Angoff rating methods using sample items and then engaged in
three rounds of ratings for the individual items. Cut scores are calculated by aggregating the
room-level data for each performance level. The cut scores are provided to the panelists as
feedback after each round of ratings. Panelists then engage in room level discussions about how
the individual items were rated as well as the resulting raw score cuts.
After the third and final round of ratings, panelists complete an evaluation of the standard setting
process, their confidence in the results, and their satisfaction with the standard setting
facilitator/facilities. These surveys are used to ensure that all panelists understood the process
used to facilitate their recommendations and were confident in their recommendations and
satisfied with the standard setting facilitator/facilities.

Virginia Standards of Learning Assessments Technical Report 2013–2014 Administration Cycle
24
Next, a smaller group of committee members is convened to review the recommendations
coming from Round 3. This articulation committee reviews the PLDs of all assessments included
in a particular standard setting committee meeting (e.g., grades 3–8 reading) and discusses the
results of Round 3 with regards to the estimated impact data. Impact data provides the percentage
of students who would fall into each performance level if the Round 3 cut scores were adopted.
The articulation committee can suggest modifications to the cut score recommendations if there
is justification based on the content or the impact data. The final recommended cut scores are
submitted to the Virginia State Board of Education for approval.
Approved cut scores for all SOL tests can be found on the Virginia Department of Education
website.
http://www.doe.virginia.gov/testing/scoring/sol-cut-scores.pdf
7.2 Standard Setting Schedule
Each subject area undergoes a review and potential revision to the content standards every seven
years. After the content standards are revised, the performance standards must also be revised.
Therefore, standard setting in Virginia also occurs on a seven-year cycle. There were no
standard-setting events during the 2013–2014 test administration cycle. The table below provides
years of the previous standard settings and future standard settings.
Table 7.2.1 Virginia SOL Standard Setting Schedule
Subjects
Previous
Standard Setting
Upcoming
Standard Setting
History 2010–2011 2017–2018
Mathematics 2011–2012 2018–2019
Reading and Writing 2012–2013 2019–2020
Science 2012–2013 2019–2020
8. CALIBRATION, SCALING, AND EQUATING
8.1 Rasch Partial Credit Model (RPCM)
For the Virginia SOL assessments, the unidimensional IRT Rasch Partial Credit Model (RPCM;
Masters, 1982; Rasch, 1980) is used for item calibration. The RPCM model is commonly used
for calibration, scaling, and equating in large assessment programs. The WINSTEPS software
program (Linacre, 2006) is used to calibrate items, that is, to calculate item difficulty estimates,
and is also used to calculate student proficiency estimates.
There are several benefits to using the RPCM model:
The model can handle both dichotomous (e.g., MC/TEI) and polytomous (e.g., prompt)
items.

Virginia Standards of Learning Assessments Technical Report 2013–2014 Administration Cycle
25
Unlike raw scores or percent correct values, estimates of item difficulty and student
proficiency based on RPCM are not dependent upon the particular items included on a
test form. Therefore, item difficulty and student proficiency values can be compared
across forms and administrations.
The underlying proficiency scale that is created using RPCM can be used to maintain
performance levels across forms so that the interpretation of passing the SOL test means
the same thing regardless of the particular form a student happens to receive.
There is a one-to-one relationship between raw scores and Rasch item difficulty estimates
so that it is possible to develop a raw score to theta table, where theta () is the student
proficiency value estimated using RPCM.
Item difficulty and student proficiency (theta) are estimated simultaneously, and the
values are on the same scale. This makes it possible to predict which items a student is
likely to get right or wrong based on their proficiency.
Masters (1982) provided a formula for calculating the probability of a student with proficiency
obtaining a raw score of x on item/task i involving mi+1 score categories with difficulties Dij.
𝑃𝑥𝑖 = 𝑒
∑ (𝜃−𝐷𝑖𝑗)𝑥𝑗=0
∑ [𝑒∑ (𝜃−𝐷𝑖𝑗)𝑘
𝑗=0 ]𝑚𝑖𝑘=0
, x = 0, 1, ..., mi (8.1)
For dichotomous items, the result of the equation 8.1 can be displayed as an item characteristic
curve (ICC) where the vertical axis is the probability of a correct response, ranging from 0 to 1,
and the horizontal axis is the student’s proficiency estimate. The theta/proficiency scale is
continuous and unbounded in theory. In practice, it typically ranges from -4 to +4 logits.
An example ICC is provided in Figure 8.1.1. The difficulty of an item corresponds to the
location on the ICC where a student has a 0.5 probability of answering the item correctly.
Because item difficulty and student proficiency are on the same scale, in the example ICC, the
item difficulty is 0.85 and the student theta corresponding to a 0.5 probability of a correct
response is also 0.85.
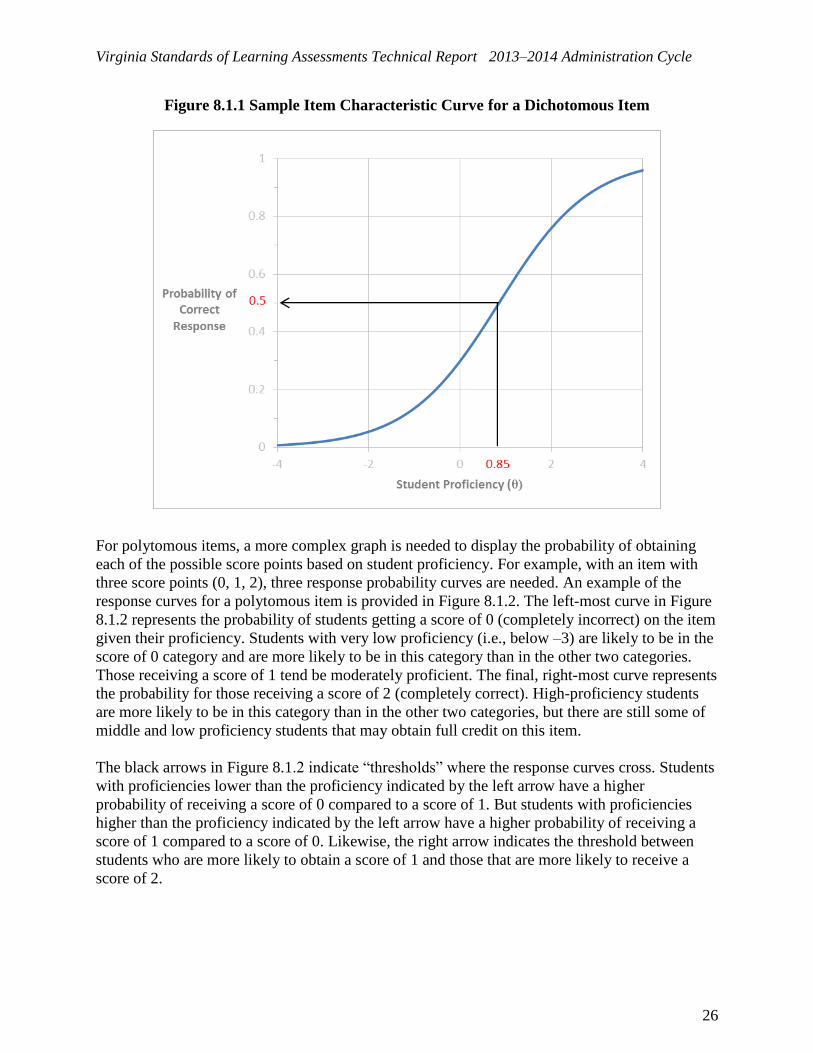
Virginia Standards of Learning Assessments Technical Report 2013–2014 Administration Cycle
26
Figure 8.1.1 Sample Item Characteristic Curve for a Dichotomous Item
For polytomous items, a more complex graph is needed to display the probability of obtaining
each of the possible score points based on student proficiency. For example, with an item with
three score points (0, 1, 2), three response probability curves are needed. An example of the
response curves for a polytomous item is provided in Figure 8.1.2. The left-most curve in Figure
8.1.2 represents the probability of students getting a score of 0 (completely incorrect) on the item
given their proficiency. Students with very low proficiency (i.e., below –3) are likely to be in the
score of 0 category and are more likely to be in this category than in the other two categories.
Those receiving a score of 1 tend be moderately proficient. The final, right-most curve represents
the probability for those receiving a score of 2 (completely correct). High-proficiency students
are more likely to be in this category than in the other two categories, but there are still some of
middle and low proficiency students that may obtain full credit on this item.
The black arrows in Figure 8.1.2 indicate “thresholds” where the response curves cross. Students
with proficiencies lower than the proficiency indicated by the left arrow have a higher
probability of receiving a score of 0 compared to a score of 1. But students with proficiencies
higher than the proficiency indicated by the left arrow have a higher probability of receiving a
score of 1 compared to a score of 0. Likewise, the right arrow indicates the threshold between
students who are more likely to obtain a score of 1 and those that are more likely to receive a
score of 2.
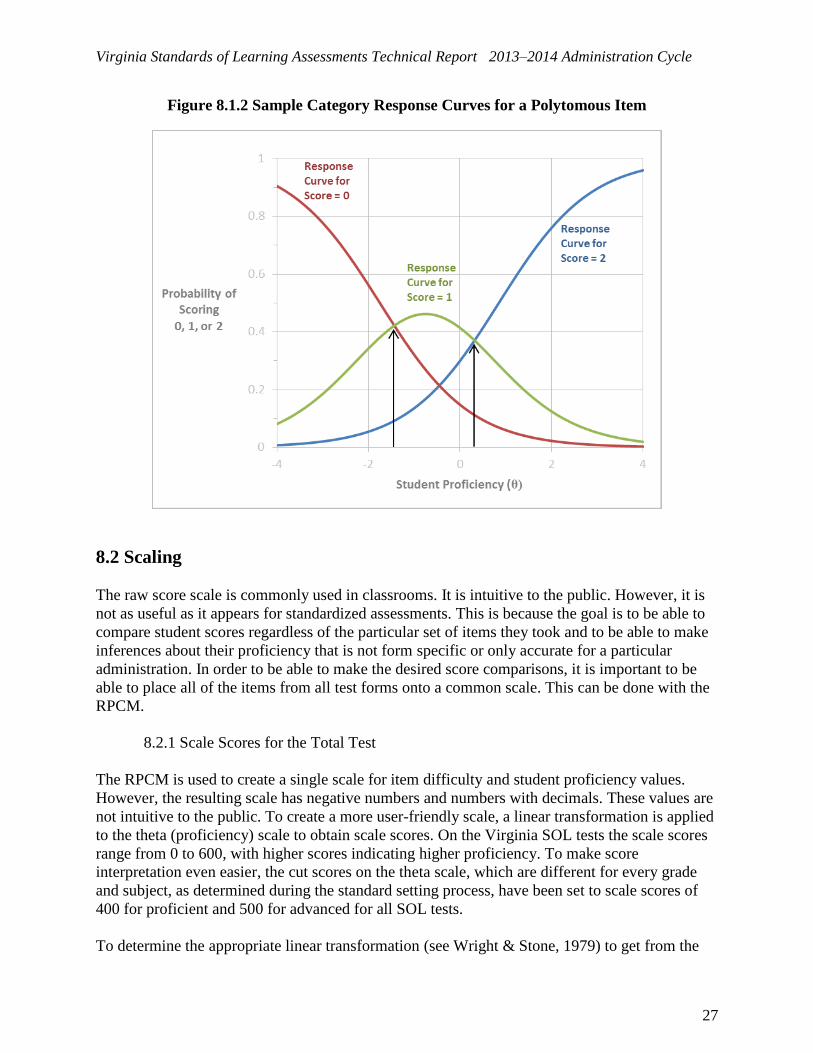
Virginia Standards of Learning Assessments Technical Report 2013–2014 Administration Cycle
27
Figure 8.1.2 Sample Category Response Curves for a Polytomous Item
8.2 Scaling
The raw score scale is commonly used in classrooms. It is intuitive to the public. However, it is
not as useful as it appears for standardized assessments. This is because the goal is to be able to
compare student scores regardless of the particular set of items they took and to be able to make
inferences about their proficiency that is not form specific or only accurate for a particular
administration. In order to be able to make the desired score comparisons, it is important to be
able to place all of the items from all test forms onto a common scale. This can be done with the
RPCM.
8.2.1 Scale Scores for the Total Test
The RPCM is used to create a single scale for item difficulty and student proficiency values.
However, the resulting scale has negative numbers and numbers with decimals. These values are
not intuitive to the public. To create a more user-friendly scale, a linear transformation is applied
to the theta (proficiency) scale to obtain scale scores. On the Virginia SOL tests the scale scores
range from 0 to 600, with higher scores indicating higher proficiency. To make score
interpretation even easier, the cut scores on the theta scale, which are different for every grade
and subject, as determined during the standard setting process, have been set to scale scores of
400 for proficient and 500 for advanced for all SOL tests.
To determine the appropriate linear transformation (see Wright & Stone, 1979) to get from the

Virginia Standards of Learning Assessments Technical Report 2013–2014 Administration Cycle
28
theta scale to the 0–600 scale, theta is multiplied by a slope constant (γ) and then an intercept
constant (α) is added to the result.
Scale Score = α + γ ∙ theta, (8.2)
where the intercept of the linear transformation is
α = (D1d2 − D2d1 )/ (d2 − d1) , (8.3)
and the slope is
γ = (D2 − D1)/ (d2 − d1 ). (8.4)
Here D1 = 400 (the proficient cut scale score), D2 = 500 (the advanced cut scale score), d1 is the
theta value associated with the proficient cut score, and d2 is the theta value associated with the
advanced cut score. Again, D1 and D2 are constant across SOL tests, but d1 and d2 differ based on
the specific standards for each test.13
Although scale scores are a linear transformation of the theta scale, they are a nonlinear
transformation of the raw scores from which they were obtained. That is, the distance between
scale scores does not remain the same for each change in the raw scores. Typically, for the
middle of the scale (around the 350–400 range), the increments are smaller than they are near the
top or bottom of the scale. Sometimes a scale score can be estimated as less than 0 (for very low
raw scores), or greater than 600 (for very high raw scores). In these cases, to keep the range
consistent, scale scores below 0 are set to 0 and scale scores above 600 are set to 600. In
addition, at a raw score of 0, the scale score is always set to be 0, and at the top raw score (100%
correct), the scale score is always set to 600.
8.2.2 Scale Scores for Reporting Categories
Each assessment covers a number of SOL, which are grouped into categories that address related
content or skills. These categories are called reporting categories. Reporting category scale
scores are calculated to provide an interpretation of student performance in each reporting
category in relation to the performance standard on the test as a whole. For example, Rasch item
difficulty estimates for items in reporting category 1 (obtained from the calibration and equating
process conducted at the total test level) are used to create a raw-score-to-theta table specific to
reporting category 1. Once the raw-score-to-theta table is produced, the following formula is
used to create a scale for reporting category 1:
Reporting Category 1 Scale Score = 30 + 7 × (𝜃𝑋−𝜃𝑃𝑅𝑂𝐹
𝜎𝑅), (8.5)
where 𝜃𝑋 is the theta value associated with the reporting category raw score, 𝜃𝑃𝑅𝑂𝐹 is the theta
value associated with the passing cut on the overall test (equivalent to d1 in equations 8.3 and
13
Although the proficient and advanced scale score cuts are constant across SOL tests, for the tests that also have a
basic cut score, the basic scale score cuts vary. This is because with a linear transformation it is not possible to fix
three points.

Virginia Standards of Learning Assessments Technical Report 2013–2014 Administration Cycle
29
8.4), and 𝜎𝑅 is the standard deviation of the theta values associated with the reporting category.
The standard deviations used in these calculations are derived from the first administration of a
test after new performance standards are set. The reporting category scale scores range from 0 to
50. Sometimes a reporting category scale score can be estimated as less than 0 (for very low
reporting category raw scores), or greater than 50 (for very high reporting category raw scores).
In these cases, to keep the range consistent, reporting category scale scores below 0 are set to 0
and reporting category scale scores above 50 are set to 50. In addition, at a reporting category
raw score of 0, the reporting category scale score is always set to be 0, and at the top reporting
category raw score (100% correct), the reporting category scale score is always set to 50.
The same process and formula is used to create scale scores for the rest of the reporting
categories on a test.
8.3 Equating
Equating is a statistical procedure that adjusts for slight differences in difficulty between test
forms. Once the adjustment is applied, scores can be compared across forms and students taking
one form of a test are neither advantaged nor disadvantaged when compared to students taking a
different form of a test.
The equating design used for the SOL assessments is the common item non-equivalent group
design (Kolen & Brennan, 2014). In this design, a set of common items (also called linking items
or anchor items) that was administered on a previous form is also included on a new form. This
set of items provides a mechanism for estimating differences in form difficulty while taking
differences in student proficiency into consideration.
8.3.1 Field-Test Equating
As described in Section 8.1, the items on the SOL assessments are calibrated using the RPCM.
Once the items are calibrated, the item difficulty statistics are obtained. Each time a set of items
is calibrated using the Winsteps software (with item centered scaling), the average difficulty for
the set is always estimated arbitrarily as zero. However, some item sets may be easier than
others, so the item difficulty statistics must be transformed to be on the same scale. An initial set
of items can be used to set the scale. Then, each time new sets of items are calibrated, they can
be transformed so their item difficulties are on this initial or base scale. The process for testing
out new items is called field testing, and the estimation of item difficulties and transformation to
the base scale is called field-test equating.
In field-test equating, rather than using equating to estimate the difficulty of a test form, the goal
is to estimate the difficulty of new items. These new items are included on forms with
operational items that have already been field tested during previous administrations. The
operational items serve as the common items for equating. These items were placed onto the base
scale previously. Rasch values for the common (operational) items are fixed while Rasch values
for the field-test items are freely calibrated. By fixing the common item Rasch values, the
Winsteps software can estimate the field-test values on the same underlying base Rasch scale.

Virginia Standards of Learning Assessments Technical Report 2013–2014 Administration Cycle
30
8.3.2 Pre-Equating
One of the benefits of IRT is that item difficulty and student proficiency (θ) are estimated
simultaneously, with both estimates on the same scale. Using this relationship, a raw score to
theta table can be generated using the following equation:
𝑅𝑎𝑤 𝑆𝑐𝑜𝑟𝑒 = ∑ ∑ 𝑗 × 𝑃𝑖𝑗(𝜃)𝑚𝑖𝑗=0
𝐼𝑖=1 , (8.6)
where 𝑃𝑖𝑗(𝜃) is the probability of a correct response for each of the i = 1, ..., I items given that
the item categories (j) are scored 0, ..., mi. The scaling constants described in Section 8.2 can be
applied to the theta values and a raw score to scale score (RSSS) table can be produced.
Pre-equating makes use of this relationship by using existing item difficulty estimates, obtained
during field testing or previous post-equating analyses, to generate a RSSS table for a test form
prior to the test being administered. No transformation of item difficulties is needed in this case
because previous equating analyses have already placed all of the item statistics on the same
scale.
Pre-equating is completed for all new SOL forms as a way to evaluate the difficulty of the test
and the position of the cut scores that differentiate the performance levels on the form prior to
administration. Test difficulty values can be compared to established targets and used to
determine whether modifications should be made to a potential test form during the test
construction process.
Although pre-equating is sufficient for generating the RSSS table needed for reporting student
scores, often post-equating is completed after the administration in order to update the RSSS
table, taking possible changes in item difficulty into account.
8.3.3 Post-Equating
Post-equating allows for new item difficulty estimates to be computed and used to generate
scoring tables for reporting purposes. The item difficulty values can change for a variety of
reasons including changes in instructional practice and item position effects (e.g., some items
become harder if they move from earlier in a test form to later in a test form). As with pre-
equating, the goal of post-equating is to estimate form difficulty rather than item difficulty, and
to generate a RSSS table. Typically, new SOL forms are post-equated.
In order to post-equate, a linking design is implemented where a set of common items is included
on a new form that has already been administered on a previous form. The common item set is
made up of 20–30% of the operational items and is representative of the total test in terms of
content and statistical properties. Figure 8.3.3.1 provides a diagram of an example linking
design. Because Core 1 is typically released to the public annually, items on Core 1 cannot be
carried forward to future forms. Therefore, linking items from the first year that link forward to
the second year can only come from Cores 2 and 3. In this example, one set of linking sets comes
from Core 2 (Year 1) and is included in Core 1 (Year 2); a second set of linking items comes
from Core 2 (Year 1) and is included in both Core 2 (Year 2) and in Core 3 (Year 2). Therefore,
Cores 2 and 3 (Year 2) share linking items. The linking design is similar for tests that have only

Virginia Standards of Learning Assessments Technical Report 2013–2014 Administration Cycle
31
two core forms, except Core 2 in Year 1 provides the linking items for both Core 1 and Core 2 in
Year 2.
Figure 8.3.3.1 Linking Process for the SOL Assessments
Year 1 Year 2
Released Released
Core 1 Core 1
Link 1
Core 2 Core 2
Core 3 Link 2 Core 3
The Rasch item difficulty values for the linking items are already on the base scale. To post-
equate the non-linking items, the Rasch values for the linking items are anchored (or fixed) while
the Rasch values for the non-linking items are freely estimated. The Rasch values estimated by
Winsteps for the non-linking items are on the base scale because of the anchoring of the linking
item Rasch values during the estimation process. The anchored Rasch values for the linking
items, and the newly estimated Rasch values for the non-linking items are used to generate a
RSSS table for the new core form.
Post-equating is conducted on a sample of the student population so that scores can be reported
back to schools quickly. Once scores are available for at least 3,000 students on a core form, the
post-equating process begins. Data are evaluated to make sure the sample will adequately
support the post-equating process, and item-level statistics are created to double check scoring
accuracy. Additionally, linking items are evaluated for stability. Linking items should have
stable item difficulty estimates over time or they will not provide a stable link to the base scale.
Therefore, if linking items have a displacement value greater than 0.5 (indicating poor stability),
they are removed from the link set. Content representation of the linking set is evaluated if items
are dropped. Post-equating is replicated by at least two psychometricians from the testing
contractor and an additional replication is provided by an external verification group. Based on
this process, a RSSS table is generated and verified for reporting.
9. RELIABILITY
Because tests contain a limited number of items given to students during a single administration,
the score each student obtains is only an estimate of their true proficiency. Reliability is a way of
quantifying the level of stability in test scores. High reliability indicates that there is a high
degree of stability in the observed score representing the student’s true proficiency level, and that
if the student was retested on the same content, they would likely obtain a very similar score.
Conversely, low reliability indicates that there is a low degree of stability in the observed score
and that if the student was tested again on the same content, they might obtain a very different

Virginia Standards of Learning Assessments Technical Report 2013–2014 Administration Cycle
32
score. Highly reliable scores are essential to making inferences about what students know and
can do. Reliability estimates for new SOL core forms are provided in Part II of this report.
9.1 Internal Consistency
There are many ways to estimate reliability, but one way that is commonly used on large-scale
assessments where students only receive one form is to compute internal consistency reliability.
Internal consistency quantifies the stability of scores by estimating how consistently individuals
respond to items. A basic estimate of internal consistency reliability is Cronbach’s coefficient
alpha statistic (Cronbach, 1951). Coefficient alpha is equivalent to the average correlation
between scores based on all possible divisions of a test into two halves. Coefficient alpha can be
used on any combinations of dichotomous (two score categories) and polytomous (three or more
score categories) test items and is computed using the following formula:
𝛼 =𝑛
𝑛−1(1 −
∑ 𝑆𝑗2𝑛
𝑗=1
𝑆𝑋2 ), (9.1)
where n is the number of items,
𝑆𝑗2 is the variance of students’ scores on item j, and
𝑆𝑋2 is the variance of the total-test scores.
Cronbach’s alpha ranges in value from 0.0 to 1.0, where higher values indicate greater reliability.
Two factors affect estimates of internal consistency: test length and homogeneity of items. The
longer the test, the higher the internal consistency value tends to be. Likewise, the more similar
the items, the more likely examinees will respond consistently across items within the test, which
also leads to higher reliability.
Stratified alpha (Cronbach, Schonemann, & McKie, 1965) provides a more appropriate
reliability estimate for tests that are made up of homogeneous items clustered within
heterogeneous components. For example, the SOL writing tests contain a combination of MC
items paired with an open-ended writing prompt. Coefficient alpha for each component (MC and
prompt) is included in calculating reliability for total test scores using the following stratified
alpha formula:
𝑺𝒕𝒓𝒂𝒕𝒊𝒇𝒊𝒆𝒅 𝜶 = 𝟏 − ∑ 𝝈𝒊
𝟐(𝟏−𝝆𝒊𝒊′)
𝝈𝑻𝟐 ,
(9.2)
where 𝝈𝒊𝟐 = variance of scores on item type i,
𝜎𝑇2 = variance of total scores, and
𝜌𝑖𝑖′ = reliability coefficient of scores on item type i.
9.2 Inter-Rater Reliability
For assessments that are scored by human raters, for example, the SOL writing test prompt
component, the consistency with which raters provide scores is an important measure of
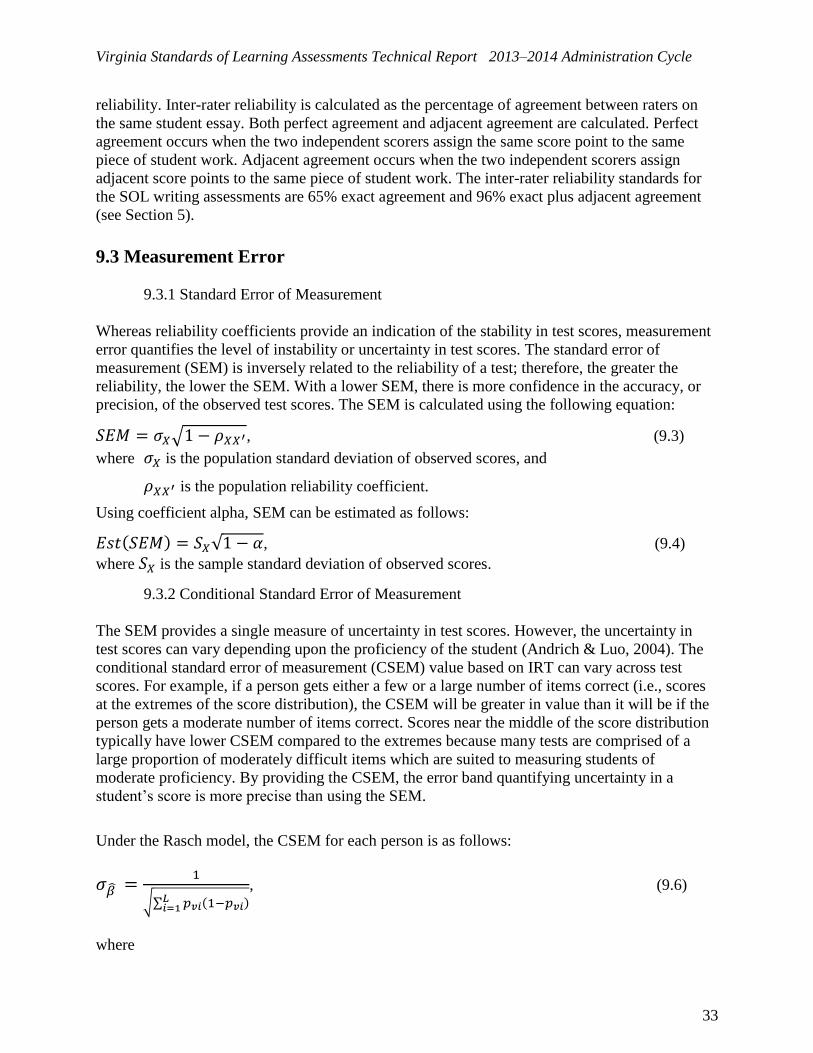
Virginia Standards of Learning Assessments Technical Report 2013–2014 Administration Cycle
33
reliability. Inter-rater reliability is calculated as the percentage of agreement between raters on
the same student essay. Both perfect agreement and adjacent agreement are calculated. Perfect
agreement occurs when the two independent scorers assign the same score point to the same
piece of student work. Adjacent agreement occurs when the two independent scorers assign
adjacent score points to the same piece of student work. The inter-rater reliability standards for
the SOL writing assessments are 65% exact agreement and 96% exact plus adjacent agreement
(see Section 5).
9.3 Measurement Error
9.3.1 Standard Error of Measurement
Whereas reliability coefficients provide an indication of the stability in test scores, measurement
error quantifies the level of instability or uncertainty in test scores. The standard error of
measurement (SEM) is inversely related to the reliability of a test; therefore, the greater the
reliability, the lower the SEM. With a lower SEM, there is more confidence in the accuracy, or
precision, of the observed test scores. The SEM is calculated using the following equation:
𝑆𝐸𝑀 = 𝜎𝑋√1 − 𝜌𝑋𝑋′, (9.3)
where 𝜎𝑋 is the population standard deviation of observed scores, and
𝜌𝑋𝑋′ is the population reliability coefficient.
Using coefficient alpha, SEM can be estimated as follows:
𝐸𝑠𝑡(𝑆𝐸𝑀) = 𝑆𝑋√1 − 𝛼, (9.4)
where 𝑆𝑋 is the sample standard deviation of observed scores.
9.3.2 Conditional Standard Error of Measurement
The SEM provides a single measure of uncertainty in test scores. However, the uncertainty in
test scores can vary depending upon the proficiency of the student (Andrich & Luo, 2004). The
conditional standard error of measurement (CSEM) value based on IRT can vary across test
scores. For example, if a person gets either a few or a large number of items correct (i.e., scores
at the extremes of the score distribution), the CSEM will be greater in value than it will be if the
person gets a moderate number of items correct. Scores near the middle of the score distribution
typically have lower CSEM compared to the extremes because many tests are comprised of a
large proportion of moderately difficult items which are suited to measuring students of
moderate proficiency. By providing the CSEM, the error band quantifying uncertainty in a
student’s score is more precise than using the SEM.
Under the Rasch model, the CSEM for each person is as follows:
𝜎𝛽 ̂ =1
√∑ 𝑝𝑣𝑖(1−𝑝𝑣𝑖)𝐿𝑖=1
, (9.6)
where

Virginia Standards of Learning Assessments Technical Report 2013–2014 Administration Cycle
34
v is for a particular person,
i is for a particular item,
L is the number of items on the test,
𝛽 ̂is the student proficiency estimate, and
𝑝𝑣𝑖 is the probability that a person answers an item correctly and is defined as
𝑝𝑣𝑖 = 𝑒𝛽𝑣−𝛿𝑖
1+𝑒𝛽𝑣−𝛿𝑖, (9.7)
where 𝛽𝑣 is person v’s proficiency and 𝛿𝑖 is the item’s difficulty.
An approximate 68% confidence interval for �̂� is given by �̂� ± 𝐶𝑆𝐸𝑀. To interpret this
confidence interval, consider a student who takes the test 100 times. Assuming measurement
error is normally distributed, the student’s true proficiency would fall within the confidence
interval 68% of the time (or 68 times out of 100).
9.4 Decision Accuracy and Consistency
Students are classified into performance levels based on a comparison of their scale scores to the
performance level cut scores. The most important cut score on the SOL assessments is the
pass/proficient cut score. Students who obtain a scale score less than the pass/proficient cut score
have failed the test whereas students who obtain a scale score greater than or equal to the
pass/proficient cut score have passed the test. However, observed scores always have some
degree of measurement error. This error may lead to misclassifications. A misclassification
occurs when a proficient student fails a test (false negative) or when a non-proficient student
passes a test (false positive). Because of the decisions made based on these classifications, it is
important to evaluate decision misclassifications to verify that they are kept to a minimum.
Decision accuracy is the extent to which the decision made based on students’ scores on a
particular test form (observed classifications) would agree with the decisions that would be made
if each student were tested with all possible parallel forms of the assessments or an infinite
number of independent administrations of the test (true classification). Decision consistency is
the extent to which two observed classifications, based on taking two equally difficult forms of
the test would classify students into the same performance category. Both decision accuracy and
decision consistency are calculated for each SOL test form using the Livingston and Lewis
(1995) equations as implemented in BBClass (Brennan, 2004).
10. VALIDITY
As noted in the Standards for Educational and Psychological Testing (AERA, APA, & NCME,
2014), “validity refers to the degree to which evidence and theory support the interpretations of
test scores for proposed uses of tests.” Sources of validity evidence are often clustered into the
following categories:

Virginia Standards of Learning Assessments Technical Report 2013–2014 Administration Cycle
35
Evidence Based on Test Content
Evidence Based on Response Processes
Evidence Based on Internal Structure
Evidence Based on Relationships to Other Variables
However, these sources of validity evidence are not considered independent pieces that must be
equally represented and studied. Instead, these categories are used in this chapter to provide a
framework for validating the interpretation(s) of scores that result from the SOL assessments.
“These sources of evidence may illuminate different aspects of validity, but they
do not represent distinct types of validity. Validity is a unitary concept. It is the
degree to which all the accumulated evidence supports the intended interpretation
of test scores for the proposed use.” (AERA, APA, & NCME, 2014)
10.1 Validity Evidence Based on Test Content
Content validity answers the question: “Does the test include items that measure all relevant
aspects of the content while excluding irrelevant content?” Content validity is frequently defined
in terms of the sampling adequacy of test items. That is, content validity is the extent to which
the items in a test adequately represent the construct of interest (Suen, 1990). In educational
testing, the state curriculum defines the content that is to be taught and assessed. Consequently,
content validity provides judgmental evidence in support of the domain relevance and
representativeness of the content in the test (Messick, 1989).
Section 3 of this technical report provides a good deal of information about the development of
the SOL assessments including item development, prompt development, field testing of new
items, and construction of new test forms. Virginia educators are included during each step of the
test development cycle so that the SOL tests are very closely aligned with the SOL content
standards from the beginning. The sections below provide a short summary of how this
alignment provides content validity evidence for the SOL program.
10.1.1 Relation to Content Standards
Each Virginia SOL assessment is built to a specified test blueprint so that student scores reflect a
consistent measure of the breadth of the commonwealth’s content standards within each subject.
This blueprint specifies the number of items to be used from each content strand within each
reporting category. The content in the SOL test blueprint derives directly from the SOL
curriculum framework.14
The SOL curriculum framework amplifies the SOL and defines the
content knowledge, skills, and understandings that are measured by the SOL tests. The
14
The SOL curriculum frameworks and test blueprints may be accessed at the following website:
http://www.doe.virginia.gov/testing/

Virginia Standards of Learning Assessments Technical Report 2013–2014 Administration Cycle
36
curriculum framework provides additional guidance to school divisions and their teachers as they
develop an instructional program appropriate for their students. It assists teachers as they plan
their lessons by identifying essential content knowledge and skills students need to acquire. This
supplemental framework delineates in greater specificity the minimum content that all teachers
should teach and all students should learn. This direct relationship of the SOL curriculum
frameworks with the SOL test blueprint and the SOL assessments lends support to the content
validity of the SOL assessments.
10.1.2 Educator Input on Item Development
The Virginia Department of Education and its testing contractor are engaged in a continuous
item and test development cycle. All SOL items go through several review rounds both internally
and with Virginia educators (see Section 3). New SOL test forms are also rigorously reviewed
and vetted with Virginia educators to ensure a tight alignment between the content the tests
measure and the Virginia content standards that are to be assessed. These steps include item bias
reviews where educators look for cases where an item may be measuring more than just the
intended construct, especially where unintended constructs would disadvantage certain student
subgroups.
10.1.3 SOL Assessment Alignment Studies
In addition to Virginia’s rigorous item and test development process, the Department of
Education contracted with the Virginia Commonwealth University to conduct external reviews
of the alignment between the SOL tests and the SOL content standards. The alignment studies
were conducted using procedures developed by Norman Webb (Webb, 2005) and focused on
four different alignment criteria:
Categorical Concurrence
Depth of Knowledge Consistency
Range of Knowledge Correspondence
Balance of Representation
Using a large panel of trained alignment evaluators, results indicated that the assessments and the
standards were well aligned based on the four criteria used to evaluate the alignment. A few
discrepancies were identified including cases where test items required a lower depth of
knowledge than was anticipated based on the SOL. For some assessments, the balance of
representation was also not perfectly aligned. However, in most cases all four alignment criteria
were met. Alignment studies were conducted for all of the SOL reading, mathematics, and
science assessments at grades 3–8 and EOC. These results provide evidence that the test
development process has been successful in building assessments that measure the knowledge
and skills identified as important in the Virginia content standards.
10.2 Validity Evidence Based on Response Processes
Response processes are the cognitive strategies that students use to respond to items. For
example, if a test is measuring reading comprehension, then it is reasonable to expect that the

Virginia Standards of Learning Assessments Technical Report 2013–2014 Administration Cycle
37
student would have to read a selection and respond to a question that requires understanding of
the selection the student read. If the student read a passage about planets and was asked a
question that he or she knew the answer to because of prior learning in an astronomy class, then
his or her response to the question may not accurately reflect reading comprehension skills.
Instead, the item might be better characterized as measuring astronomy content knowledge.
10.2.1 Item Development
SOL reading assessments include both passage-based items and stand-alone items that measure
the reading SOL. Passages contain a variety of lengths, topics, and genres. Some items are even
tied to a pair of passages so that item responses are dependent upon integrating concepts across
two passages. Passages are selected to be grade-level appropriate and engaging for students.
These features of reading test development are intended to elicit student responses that
accurately reflect their proficiency in relation to the reading content standards.
Likewise, a variety of math items are developed. For many math tests some items are developed
to measure math content knowledge in the context of calculator use, whereas other items are
developed to measure math content knowledge where calculator use will not be permitted. Even
among MC items, there are a wide range of math items, some of which require a simple
computation, while others require problem solving and/or multi-step calculations.
History items contain excerpts from historical documents, images of historical figures, and maps
of important locations. Likewise, science items contain diagrams, scenarios, and graphs, similar
to what students see in the classroom.
Finally, the writing assessments include both MC and prompt item types. The MC items allow
for quick measures of skills like punctuation, grammar, and revision skills, while the prompt
items require students to create a piece of writing. Without the prompt, it would be difficult to
truly evaluate the important writing response process of students creating a piece of writing. For
writing, the prompt scoring is also a critical part of the validity evidence. Without appropriate
and accurate application of the prompt rubric, valid interpretations of student scores would not
be possible. Detailed information about the professional scoring of students’ prompt responses is
provided in Section 5.
A lot of planning goes into creating items that assess the breadth and depth of the content
standards creatively with items that can be easily administered and scored under high-stakes
conditions. Moreover, item development specifications provide guidance for developing items
that measure the intended content, without measuring additional factors that are not what the test
is intended to measure. For example, mathematics items are developed with English learners in
mind. Unnecessarily complex language and double-meaning words are avoided. The Virginia
Department of Education has also provided session breaks on some of the SOL assessments to
allow students to test over two days. Breaking up the testing session allows students content
knowledge to be measured without concern that the test will be speeded or that the items at the
end of the test will be a better measure of testing endurance rather than content knowledge.
Virginia Standards of Learning Assessments Technical Report 2013–2014 Administration Cycle
38
10.2.2 Technology Enhanced Items (TEIs)
TEIs have been introduced into the SOL assessments over time with the first items field tested
for math in Spring 2011. TEIs were first field tested for reading, writing, and science in Spring
2012. TEIs will be field tested for history in a future administration. These items allow students
to demonstrate content knowledge in different ways than they have been able to with MC items
alone. For example, students can plot points on a coordinate plane to provide a response to a
math item. They can select several components of a food web in science. They can identify
relevant regions on a map for history. The Virginia Department of Education continues to field
test these item types on SOL tests to measure content with greater fidelity and to a greater depth
of knowledge. TEIs comprise approximately 15% of the SOL assessment and are an important
component of Virginia’s commitment to developing items that best measure the intended
response processes.
10.3 Validity Evidence Based on Internal Structure
10.3.1 Internal Consistency
Section 9.1 detailed the statistics used to evaluate the internal consistency of the SOL
assessments. These reliability statistics include coefficient alpha and stratified alpha. Reliability
of the SOL assessments is evaluated each year for the new core forms. Part II of the technical
report includes these statistics for the overall group and broken out by gender and the two largest
ethnic subgroups in Virginia—African Americans and Caucasians. The reliability values for the
SOL assessments are quite high, indicating highly reliable assessments. The non-writing subjects
have values at or above 0.85 for the total group. Writing reliability values are 0.80 and above for
the total group. Similar reliability values are found for each of the subgroups. These values
provide evidence that the SOL assessments are reasonably homogenous measures of each
content domain (e.g., reading, math), as expected.
10.3.2 Differential Item Functioning (DIF)
As described in Section 3.4, each new SOL item is field tested before it is used on an operational
assessment. As part of the field-test process, statistics are generated to verify that the items are
functioning as intended. DIF is evaluated for males and females and for African American and
Caucasian students. Items that exceed customary thresholds are flagged for additional scrutiny. If
the Virginia Department of Education or teacher reviewers identify a potential concern with the
item, it is eliminated from the pool of items used to measure students’ knowledge of the SOL.
This process helps to ensure that the items on the Virginia SOL assessments are measuring the
content standards and not measuring other, unintended constructs or disadvantaging particular
student subgroups.
10.3.3 Unidimensionality Evaluation
During the first administration of a new SOL test, developed based on revised content standards,
an exploratory factor analysis is conducted to verify that the assessment measures one primary
factor. For example, in the mathematics area, the mathematics assessments should be measuring

Virginia Standards of Learning Assessments Technical Report 2013–2014 Administration Cycle
39
mathematics competence and not the combined effects of mathematics competence, reading and
language proficiency, and the ability to work quickly. Often called the requirement for “test
unidimensionality,” evidence for the validity of the unifactor or unidimensionality assumption
for an assessment can come from performing a factor analysis.
Data from student responses to test items were analyzed to look for relationships amongst the
items and to identify the factor or factors the test items are measuring. An EFA will frequently
identify multiple factors—although not all factors are of the same strength relative to their
prevalence in the data. It is therefore important to review the eigenvalues associated with each
factor as these provide an indication of the relative strength of each factor. Reviewing the
“eigenvalue plot” that is obtained from analyzing the data is one method for conducting this
evaluation. However, Divgi’s index (Divgi, 1980; similar to a method proposed by Lord, 1980)
provides a simple evaluation when testing for unidimensionality (one factor). This index
provides the ratio of the difference between the eigenvalues associated with the first and second
factors to the difference between the eigenvalues associated with the second and third factors. A
value that is greater than 3.0 implies that the test in question is characterized by a dominant first
dimension.
In every case, the first eigenvalue was substantially larger than the second and the second and the
third eigenvalues were of similar magnitude. In addition, the results showed that all values of
Divgi’s index exceeded 3.0. These results suggest that the Virginia SOL mathematics, reading,
writing, and science assessments across all grades and core forms are characterized by a
dominant primary dimension, indicating that they are measuring a dominant trait or main factor.
10.4 Validity Evidence Based on Relationships to Other Variables
Additional validity evidence can be provided by linking scores from the assessment of interest to
scores from other assessments or measures (e.g., course grades). For example, linking a reading
assessment to another measure of reading would be expected to show a stronger relationship than
linking a reading assessment to a mathematics assessment. During the 2013–2014 academic year,
the SOL assessment results were not linked empirically to other assessments or scores that would
provide validity evidence for SOL scores. However, Virginia plans to carry out additional
research in this area to support the validity of the SOL assessment program in the coming years.
11. ALTERNATE AND ALTERNATIVE ASSESSMENTS
The commonwealth of Virginia offers the following alternative and alternate assessments:
The Virginia Grade Level Alternative (VGLA) Program
The Virginia Substitute Education Program (VSEP)
The Virginia Modified Achievement Standards Test (VMAST)
The Virginia Alternate Assessment Program (VAAP)
The purpose of these assessments is to evaluate the performance of students who are unable to
participate in the Virginia SOL statewide testing program, even with accommodations.

Virginia Standards of Learning Assessments Technical Report 2013–2014 Administration Cycle
40
Information about these assessments can be found in the Virginia Alternative and Alternate
Assessments Overview.
12. RESOURCES
In addition to the information presented in this technical report (Part I and Part II), other
resources are available that provide specific details on a variety of topics pertaining to the
Virginia SOL assessments. These include testing implementation and examiner’s manuals,
Electronic Practice Assessment Tools (ePAT) applications, released versions of the SOL
assessments, and practice items. These resources are available on the Virginia Department of
Education website.
http://www.doe.virginia.gov/testing/test_administration/index.shtml

Virginia Standards of Learning Assessments Technical Report 2013–2014 Administration Cycle
41
PART II: STATISTICAL SUMMARIES FOR SPRING 2014
1. OVERVIEW OF STATISTICAL SUMMARIES
This section contains an overview of the statistical summaries for the spring 2014 administration
of the Virginia SOL assessments and VMAST mathematics and reading assessments. For more
information about reliability, the CSEM, decision consistency, and decision accuracy, see Part I,
Section 9, Reliability.
1.1 Administration Results
Three sets of tables are included in the Administration Results section. The first set shows the
percentages of students who participated in online or paper-and-pencil administration in the
spring 2014 administration. The second set shows the percentages of students in the proficient
and advanced performance levels and the overall pass rate for each of the SOL assessments in
the spring 2014 administration. The last set shows the raw score summary statistics for all newly
constructed SOL assessments for the spring 2014 online administration.
1.2 Reliability Estimates for Non-Writing Assessments
Coefficient alpha reliability coefficients are provided overall, and by gender and ethnic
subgroups (white and black) for all newly constructed core forms of the SOL assessments.
Reliability was not recalculated for reused forms.
1.3 Reliability Estimates for Writing Assessments
The reliability of all the writing assessments was estimated using stratified alpha. Stratified alpha
is provided for each combination of MC core and writing prompt for the administrations in
grades 5, 8, and high school EOC. Analyses were done for the overall group and by subgroups
based on gender and ethnicity (white and black).
Inter-rater reliability values are also provided for each prompt.
1.4 Decision Consistency and Accuracy Indices
Results are provided for the decision consistency and accuracy analyses for the 2014 new online
SOL assessments. Although there is no general rule to determine the acceptable levels of
decision accuracy and consistency needed for educational assessments, the Virginia SOL
assessments have decision accuracy and consistency levels comparable to those that are reported
in the Livingston and Lewis (1995) paper that describes the procedure. As expected, decision
accuracy is generally higher than decision consistency.

Virginia Standards of Learning Assessments Technical Report 2013–2014 Administration Cycle
42
1.5 Raw Score-to-Scale Score Conversion Tables and Conditional SEMs
RSSS conversions tables are provided, which include the CSEM at each scale score level for all
newly constructed cores (1, 2, and 3) of the non-writing assessments. For the writing
assessments, these tables are provided for each combination of MC core and writing prompt.
1.6 VMAST Results
Statistical summaries were also done for all newly constructed cores (1, 2, and 3) for VMAST
grades 3–8 mathematics and reading as well as Algebra I and EOC reading assessments. The
same analyses conducted for the SOL assessments, were also done for the VMAST assessments.
For the 2014 spring administration, the results include the percentage of students who
participated in VMAST administration, the percentages of students in the proficient and
advanced performance levels, and the overall pass rate for each of the VMAST assessments,
along with reliability estimates and decision consistency and accuracy analyses.
2. SPRING 2014 STATISTICAL SUMMARY
2.1 Administration Results
2.1.1 Participation by Mode of Administration
The following tables show the number of tests administered in the online and paper modes of
administration. Each table shows the grade and subject area of the test, the total number of valid
tests administered, and the percentages of tests that were administered online and on paper.
Table 2.1.1.1 Percentage of Tests Taken by Mode: Grades 3–8
Grade Subject Total
Number
Mode
Online (%) Paper (%)
3
Reading 91,074 99 1
Mathematics 93,058 99 1
Science 86,635 100 0
History 87,735 100 0
4 Reading 92,083 99 1
Mathematics 92,817 99 1
5
Reading 90,525 99 1
Mathematics 84,899 99 1
Science 92,179 99 1
Writing 88,733 100 0
6 Reading 91,371 99 1

Virginia Standards of Learning Assessments Technical Report 2013–2014 Administration Cycle
43
Grade Subject Total
Number
Mode
Online (%) Paper (%)
Mathematics 82,063 99 1
7 Reading 91,852 99 1
Mathematics 77,106 100 0
8
Reading 92,270 99 1
Mathematics 62,718 99 1
Science 83,188 99 1
Writing 90,729 100 0
Table 2.1.1.2 Percentage of Tests Taken by Mode: Content-Specific History
Grade Subject Total Number Mode
Online (%) Paper (%)
CSH
Virginia Studies 92,010 99 1
U.S. History to 1865 86,263 100 0
U.S. History: 1865 to Present 85,185 100 0
Civics and Economics 81,373 99 1
Table 2.1.1.3 Percentage of Tests Taken by Mode: End-of-Course
Grade Subject Total Number Mode
Online (%) Paper (%)
End-of-Course
Earth Science 78,224 99 1
Biology 95,162 100 0
Chemistry 62,306 100 0
Algebra I 119,254 99 1
Geometry 97,686 100 0
Virginia & U.S. History 86,407 100 0
World History I 77,780 99 1
World History II 74,554 100 0
World Geography 21,541 100 0
English: Reading 84,879 99 1
Algebra II 72,186 100 0
Writing 79,225 99 1

Virginia Standards of Learning Assessments Technical Report 2013–2014 Administration Cycle
44
Table 2.1.1.4 Percentage of Tests Taken by Mode: VMAST Mathematics and Reading
Grade Subject Total Number Mode
Online (%) Paper (%)
3 VMAST Reading 697 100 0
VMAST Mathematics 746 100 0
4 VMAST Reading 1,158 100 0
VMAST Mathematics 1,190 100 0
5 VMAST Reading 1,182 100 0
VMAST Mathematics 1,315 100 0
6 VMAST Reading 765 100 0
VMAST Mathematics 916 100 0
7 VMAST Reading 711 100 0
VMAST Mathematics 874 100 0
8 VMAST Reading 790 100 0
VMAST Mathematics 938 100 0
End of Course VMAST Reading 202 100 0
VMAST Mathematics 566 100 0
2.1.2 Percent of Students in each Performance Level
The results in this section are based on all tests that were taken with a valid score. The tables
below show the grade and subject area, the total number of tests taken, the percentages passing at
the proficient and advanced performance levels, and the overall passing rate. Tests taken on
paper and online are combined in the calculation of the passing rates.
Table 2.1.2.1 Grades 3–8 Passing Rates
Grade Subject N-Count Performance Level Overall Pass
Rate (%) Proficient (%) Advanced (%)
3
Reading 91,074 53.4 14.7 68.1
Mathematics 93,058 51.1 15.1 66.2
Science 86,635 58.6 23.7 82.3
History 87,735 47.4 37.9 85.3
4 Reading 92,083 52.2 17.5 69.7
Mathematics 92,817 53.8 25.9 79.6
5
Reading 90,525 53.0 20.0 73.0
Mathematics 84,899 49.4 23.6 73.0
Science 92,179 54.1 18.0 72.1
Writing 88,733 48.2 22.5 70.7
6 Reading 91,371 58.0 14.7 72.6
Mathematics 82,063 63.0 12.6 75.6
7 Reading 91,852 58.9 16.5 75.4
Mathematics 77,106 51.1 13.2 64.3

Virginia Standards of Learning Assessments Technical Report 2013–2014 Administration Cycle
45
Grade Subject N-Count Performance Level Overall Pass
Rate (%) Proficient (%) Advanced (%)
8
Reading 92,270 59.0 10.6 69.6
Mathematics 62,718 57.6 7.5 65.1
Science 83,188 63.2 11.4 74.6
Writing 90,729 52.7 16.8 69.6
Table 2.1.2.2 Content-Specific History Passing Rates
Subject N-Count Performance Level Overall Pass
Rate (%) Proficient (%) Advanced (%)
Virginia Studies 92,010 41.7 43.3 85.0
U.S. History to 1865 86,263 44.0 36.4 80.5
U.S. History: 1865 to Present 85,185 49.6 32.2 81.8
Civics and Economics 81,373 52.2 31.3 83.5
Table 2.1.2.3 End-of-Course Passing Rates
Subject N-Count Performance Level Overall Pass
Rate (%) Proficient (%) Advanced (%)
Earth Science 78,224 62.8 7.2 70.0
Biology 95,162 60.7 9.9 70.6
Chemistry 62,306 65.1 13.1 78.2
Algebra I 119,254 55.9 7.0 63.0
Geometry 97,686 53.4 10.6 64.0
Virginia & U.S. History 86,407 65.0 12.8 77.9
World History I 77,780 57.0 17.4 74.4
World History II 74,554 58.9 16.7 75.6
World Geography 21,541 65.9 10.3 76.2
English: Reading 84,879 66.7 8.6 75.3
Algebra II 72,186 53.4 18.7 72.1
Writing 79,225 57.6 21.8 79.4
Table 2.1.2.4 VMAST Grades 3–8 & End-of-Course Passing Rates
Grade Subject N-Count Performance Level
Overall Pass
Rate (%) Proficient
(%) Advanced
(%)
3 VMAST Reading 697 45.9 5.5 51.4
VMAST Mathematics 746 38.9 4.6 43.4
4 VMAST Reading 1,158 52.6 5.6 58.2
VMAST Mathematics 1,190 52.9 4.1 57.0
5 VMAST Reading 1,182 46.9 2.4 49.2

Virginia Standards of Learning Assessments Technical Report 2013–2014 Administration Cycle
46
Grade Subject N-Count Performance Level
Overall Pass
Rate (%) Proficient
(%) Advanced
(%)
VMAST Mathematics 1,315 26.9 2.5 29.4
6 VMAST Reading 765 42.4 1.2 43.5
VMAST Mathematics 916 31.4 1.4 32.9
7 VMAST Reading 711 51.3 3.7 55.0
VMAST Mathematics 874 45.1 0.6 45.7
8 VMAST Reading 790 41.1 3.5 44.7
VMAST Mathematics 938 39.7 1.5 41.2
End-of-Course VMAST Reading 202 48.5 2.0 50.5
VMAST Mathematics 566 28.4 0.2 28.6
2.1.3 Raw Score Summary Statistics
Tables 2.1.3.1 through 2.1.3.6 show the raw score summary statistics for each newly constructed
Virginia SOL online and VMAST assessments taken in the 2014 spring administration. Each
table shows the grade and subject area of the test, number of examinees taking each test per core,
as well as the number of test items, observed raw score mean, median, standard deviation, and
minimum and maximum total raw scores.
Table 2.1.3.1 Summary Statistics for Grades 3–8 Reading and Mathematics Online
Subject Grade Core Items N Mean Med SD Min Max
Reading
3 1 40 38,412 28.4 30 7.2 1 40
2 40 38,592 27.8 29 7.6 2 40
4 1 40 38,778 29.5 31 6.9 1 40
2 40 39,004 28.4 30 7.5 1 40
5 1 40 37,627 28.3 30 6.5 1 40
2 40 38,869 28.6 30 7.5 3 40
6 1 45 38,340 32.1 34 7.5 1 45
2 45 38,705 32.4 34 8.2 2 45
7 1 45 38,227 33.6 35 7.5 3 45
2 45 38,964 32.4 34 7.6 1 45
8 1 45 38,053 32.5 34 7.5 1 45
2 45 39,276 31.6 33 7.9 1 45
Mathematics
3 1 40 46,941 29.6 31 7.0 1 40
2 40 25,961 29.8 31 7.2 3 40
4 1 50 47,282 36.7 39 9.3 1 50
2 50 26,657 37.2 39 8.9 2 50
5 1 50 44,735 37.8 40 9.0 4 50
2 50 21,915 37.1 39 8.9 5 50
6 1 50 40,026 34.6 36 9.7 1 50
2 50 24,196 36.3 38 9.2 3 50
7 1 50 37,618 35.0 37 9.3 3 50

Virginia Standards of Learning Assessments Technical Report 2013–2014 Administration Cycle
47
Subject Grade Core Items N Mean Med SD Min Max 2 50 23,832 36.7 38 9.3 1 50
8 1 50 30,266 34.6 36 9.4 1 50
2 50 17,678 35.0 36 9.7 1 50 Note: Plain English is not included in the math results.
Table 2.1.3.2 Summary Statistics for Grades 3, 5, and 8 History and Science Online
Subject Grade Core Items N Mean Med SD Min Max
History 3 1 40 34,649 31.8 34 6.7 1 40
2 40 37,170 30.4 32 7.3 1 40
Science
3 1 40 46,321 30.2 32 6.9 3 40
2 40 24,652 30.7 32 6.7 4 40
5 1 40 47,764 28.8 30 6.7 1 40
2 40 27,479 28.3 30 7.4 1 40
8 1 50 43,103 34.3 35 9.0 1 50
2 50 25,698 33.7 35 9.0 1 50
Table 2.1.3.3 Summary Statistics for Content-Specific History Online
Subject Core Items N Mean Med SD Min Max
Virginia Studies 1 40 36,438 30.6 32 7.0 3 40
2 40 38,771 29.5 31 7.1 2 40
U.S. History to 1865 1 40 35,312 29.9 32 7.4 4 40
2 40 35,732 29.2 31 7.8 1 40
U.S. History: 1865 to Present 1 40 36,122 30.9 32 6.6 4 40
2 40 33,535 30.0 31 7.0 3 40
Civics and Economics 1 40 32,893 29.8 31 6.7 2 40
2 40 33,584 28.7 30 7.2 3 40
Table 2.1.3.4 Summary Statistics for High School End-of-Course Online
Subject Core Items N Mean Med SD Min Max
Earth Science
1 50 27,685 32.7 34 9.3 3 50
2 50 18,364 33.0 34 9.2 5 50
3 50 6,393 30.5 31 9.4 6 50
Biology
1 50 38,496 34.7 36 8.8 1 50
2 50 20,654 34.2 35 8.9 7 50
3 50 9,956 32.3 33 9.4 5 50
Chemistry
1 50 28,696 33.6 34 8.8 5 50
2 50 13,660 34.8 36 8.9 5 50
3 50 5,954 32.7 34 9.4 4 50
Algebra I*
1 50 44,640 32.3 33 10.6 4 50
2 50 24,728 29.5 30 10.8 3 50

Virginia Standards of Learning Assessments Technical Report 2013–2014 Administration Cycle
48
Subject Core Items N Mean Med SD Min Max 3 50 10,410 28.3 28 10.8 2 50
Geometry
1 50 38,898 32.7 33 10.0 3 50
2 50 19,461 30.9 31 10.1 2 50
3 50 9,357 28.9 29 9.7 5 50
Virginia & U.S. History
1 60 22,530 42.0 44 10.0 7 60
2 60 20,990 42.6 44 10.0 8 60
3 60 20,773 42.1 44 10.7 2 60
World History I
1 60 19,060 39.4 40 11.1 5 60
2 60 19,519 42.7 45 11.7 3 60
3 60 20,075 41.6 43 11.6 5 60
World History II
1 60 19,385 41.9 43 10.4 8 60
2 60 19,771 43.5 45 10.8 3 60
3 60 18,865 41.2 43 11.1 6 60
World Geography 1 60 8,737 41.7 43 10.3 6 60
2 60 8,106 41.3 43 11.0 6 60
English: Reading
1 55 24,356 41.2 43 8.0 7 55
2 55 19,108 42.5 44 7.9 8 55
3 55 16,347 38.8 40 9.0 7 55
Algebra II
1 50 33,005 34.9 36 9.4 4 50
2 50 14,877 33.0 34 9.4 5 50
3 50 5,938 30.6 31 9.7 4 50
*Plain English is not included in the results.
Table 2.1.3.5 Summary Statistics for VMAST Grades 3–8 & End-of-Course Online
Subject Grade Core Items N Mean Med SD Min Max
VMAST
Reading
3 2 32 558 19.5 20 5.9 4 32
4 2 32 969 18.6 19 5.7 5 31
5 2 32 964 19.0 19 5.5 1 30
6 2 36 617 21.8 22 5.9 6 35
7 2 36 601 21.6 22 5.9 7 35
8 2 36 639 22.0 23 5.9 6 35
End of Course 3 44 74 25.4 25 6.7 12 40
VMAST
Mathematics
3 2 32 616 18.0 18 6.0 4 31
4 2 40 1,012 23.9 24 6.5 9 40
5 2 40 1,105 22.0 22 7.0 2 39
6 2 40 770 21.9 21 6.4 5 38
7 2 40 763 21.1 21 5.9 5 35
8 2 40 785 21.6 22 6.4 6 36
End of Course 3 40 347 20.9 20 5.8 9 36

Virginia Standards of Learning Assessments Technical Report 2013–2014 Administration Cycle
49
Table 2.1.3.6 shows the raw score summary statistics for grades 5, 8, and EOC Virginia SOL
writing tests taken in the 2014 spring administration. The table presents the number of examinees
tested for every grade/core/prompt combination, as well as the observed raw score mean,
median, standard deviation, and minimum and maximum values. The maximum possible raw
score for the grade 5 writing test is 46. It includes 22 MC questions and an essay item. The
maximum possible raw score for the grade 8 writing test is 48. It includes 24 MC questions and
an essay item. The maximum possible raw score for the EOC writing test is 54. It includes 30
MC questions and an essay item.
Table 2.1.3.6 Summary Statistics for Grades 5, 8, and End-of-Course Writing Tests
Grade Core Prompt N Mean Med SD Min Max
5
1
2502 5,591 33.2 34 6.6 10 46
2509 5,544 33.4 34 6.6 9 46
2510 5,682 33.4 34 6.6 8 46
2519 5,621 33.5 34 6.8 8 46
2522 5,618 34.1 35 6.9 10 46
2532 5,637 34.2 35 6.9 8 46
2549 5,681 34.1 35 6.9 7 46
2
2502 3,923 33.0 34 6.7 9 46
2509 3,928 33.2 34 6.4 9 46
2510 3,880 33.4 34 6.5 9 46
2519 3,890 33.4 34 6.6 8 46
2522 3,992 33.8 35 6.8 9 46
2532 3,972 33.8 34 6.6 10 46
2549 3,979 33.8 34 6.8 9 46
3
2502 2,447 34.7 35 6.4 13 46
2509 2,472 34.3 35 6.7 10 46
2510 2,445 34.2 35 6.6 11 46
2519 2,576 34.7 35 6.6 10 46
2522 2,428 34.8 36 6.7 12 46
2532 2,448 34.9 36 6.6 11 46
2549 2,438 35.0 36 6.7 9 46
8
1
2806 5,729 34.8 35 6.7 9 48
2810 5,574 34.9 35 6.7 10 48
2812 5,777 35.0 35 6.7 7 48
2813 5,591 35.2 36 6.6 10 48
2819 5,531 34.8 35 6.6 10 48
2849 5,528 34.6 35 6.8 10 48
2852 5,613 35.2 36 6.7 9 48
2
2806 4,128 35.9 37 6.5 8 48
2810 4,024 35.6 36 6.5 9 48
2812 3,910 35.9 37 6.5 9 48
2813 4,001 36.3 37 6.5 9 48
2819 4,048 35.6 36 6.5 9 48

Virginia Standards of Learning Assessments Technical Report 2013–2014 Administration Cycle
50
Grade Core Prompt N Mean Med SD Min Max 2849 4,007 35.6 36 6.6 9 48
2852 3,958 36.1 37 6.5 10 48
3
2806 2,470 36.5 37 6.6 10 48
2810 2,454 36.7 37 6.7 10 48
2812 2,461 36.6 37 6.6 15 48
2813 2,454 36.9 38 6.7 12 48
2819 2,569 36.5 37 6.6 11 48
2849 2,533 36.3 37 6.9 10 48
2852 2,562 37.0 38 6.7 11 48
EOC
1
2101 4,779 40.9 42 7.1 9 54
2102 4,757 41.0 42 6.9 10 54
2107 4,730 40.9 42 7.0 9 54
2115 4,968 41.1 42 6.9 10 54
2121 4,858 41.1 42 6.9 10 54
2122 4,810 41.1 42 7.0 10 54
2126 4,799 41.2 42 6.9 10 54
2
2101 3,277 40.4 41 7.5 12 54
2102 3,339 40.6 41 7.2 13 54
2107 3,314 40.2 41 7.4 13 54
2115 3,386 40.8 42 7.3 13 54
2121 3,414 40.6 41 7.5 10 54
2122 3,370 40.8 41 7.4 12 54
2126 3,332 40.8 41 7.2 16 54
3
2101 2,054 40.4 41 7.7 16 54
2102 1,990 40.9 42 7.5 11 54
2107 2,029 40.8 41 7.5 11 54
2115 2,059 40.8 41 7.4 15 54
2121 2,095 40.6 41 7.4 15 54
2122 2,110 40.7 41 7.4 10 54
2126 2,081 40.7 41 7.5 10 54
2.2 Reliability Estimates for Multiple-Choice/Technology Enhanced Item
Assessments
2.2.1 Overall Reliability Estimates
This section addresses the overall reliability estimates for each newly constructed SOL tests and
VMAST administered in spring 2014. Each table shows the number of students used in the
analyses and the associated Cronbach’s Alpha reliability for each grade/core combination. In
almost all cases, the Alphas were above the desired lower limit of 0.80 except for VMAST
mathematics, where all Alphas meet the acceptable lower limit of 0.70.

Virginia Standards of Learning Assessments Technical Report 2013–2014 Administration Cycle
51
Table 2.2.1.1 Cronbach’s Alpha for Grades 3–8 Reading
Subject Grade Core Online
N Alpha
Reading
3 1 38,412 0.87
2 38,592 0.88
4 1 38,778 0.87
2 39,004 0.88
5 1 37,627 0.85
2 38,869 0.89
6 1 38,340 0.86
2 38,705 0.89
7 1 38,227 0.88
2 38,964 0.87
8 1 38,053 0.88
2 39,276 0.88
Table 2.2.1.2 Cronbach’s Alpha for Grades 3–8 Mathematics
Subject Grade Core Online
N Alpha
Mathematics
3 1 46,941 0.88
2 25,961 0.89
4 1 47,282 0.91
2 26,657 0.91
5 1 44,735 0.92
2 21,915 0.91
6 1 40,026 0.91
2 24,196 0.91
7 1 37,618 0.91
2 23,832 0.92
8 1 30,266 0.91
2 17,678 0.92
Note: Plain English is not included in the math results.
Table 2.2.1.3 Cronbach’s Alpha for Grades 3, 5, and 8 History and Science
Subject Grade Core Online
N Alpha
History 3 1 34,649 0.88
2 37,170 0.89
Science 3 1 46,321 0.87

Virginia Standards of Learning Assessments Technical Report 2013–2014 Administration Cycle
52
Subject Grade Core Online
N Alpha
2 24,652 0.88
5 1 47,764 0.86
2 27,479 0.88
8 1 43,103 0.90
2 25,698 0.90
Table 2.2.1.4 Cronbach’s Alpha for Content-Specific History Tests
Subject Core Online
N Alpha
Virginia Studies 1 36,438 0.88
2 38,771 0.88
United States History to 1865 1 35,312 0.89
2 35,732 0.90
United States History: 1865 to Present 1 36,122 0.87
2 33,535 0.88
Civics and Economics 1 32,893 0.87
2 33,584 0.88
Table 2.2.1.5 Cronbach’s Alpha for High School End-of-Course Tests
Subject Core Online
N Alpha
Earth Science
1 27,685 0.90
2 18,364 0.90
3 6,393 0.90
Biology
1 38,496 0.89
2 20,654 0.89
3 9,956 0.90
Chemistry
1 28,696 0.89
2 13,660 0.89
3 5,954 0.90
Algebra I
1 44,640 0.93
2 24,728 0.92
3 10,410 0.92
Geometry
1 38,898 0.92
2 19,461 0.91
3 9,357 0.90
Virginia & United States History 1 22,530 0.90

Virginia Standards of Learning Assessments Technical Report 2013–2014 Administration Cycle
53
Subject Core Online
N Alpha
2 20,990 0.90
3 20,773 0.92
World History I
1 19,060 0.91
2 19,519 0.93
3 20,075 0.93
World History II
1 19,385 0.90
2 19,771 0.92
3 18,865 0.92
World Geography 1 8,737 0.90
2 8,106 0.92
English: Reading/Lit. & Res.
1 24,356 0.87
2 19,108 0.87
3 16,347 0.89
Algebra II
1 33,005 0.91
2 14,877 0.91
3 5,938 0.91
Note: Plain English is not included in the Algebra I results.
Table 2.2.1.6 Cronbach’s Alpha for VMAST Grades 3–8 & End-of-Course Mathematics
and Reading
Subject Grade Core Online
N Alpha
VMAST Mathematics
3 2 616 0.82
4 2 1,012 0.81
5 2 1,105 0.83
6 2 770 0.81
7 2 763 0.76
8 2 785 0.81
End-of-Course 3 347 0.75
VMAST Reading
3 2 558 0.82
4 2 969 0.80
5 2 964 0.78
6 2 617 0.79
7 2 601 0.79
8 2 639 0.80
End-of-Course 3 74 0.79

Virginia Standards of Learning Assessments Technical Report 2013–2014 Administration Cycle
54
2.2.2 Reliability Estimates by Gender
This section presents subgroup reliability results broken down by gender for SOL and VMAST
tests administered in the spring of 2014. Each table shows the number of students used in the
analyses and the associated Cronbach’s Alpha for each grade/core/gender combination. For all
SOL tests, the Alphas are above the desired lower limit of 0.80. For the VMAST mathematics
and reading tests, the Alphas were above the acceptable lower limit of 0.70. Students not
reporting their gender were excluded from these results.
Table 2.2.2.1 Cronbach’s Alpha for Grades 3–8 Reading by Gender
Subject Grade Core
Online
Female Male
N Alpha N Alpha
Reading
3 1 18,739 0.87 19,673 0.88
2 19,075 0.88 19,517 0.89
4 1 19,126 0.87 19,652 0.87
2 19,299 0.88 19,705 0.89
5 1 18,851 0.84 18,776 0.85
2 19,132 0.88 19,737 0.89
6 1 18,916 0.85 19,424 0.87
2 19,064 0.89 19,641 0.90
7 1 18,763 0.87 19,464 0.88
2 19,276 0.86 19,688 0.88
8 1 18,674 0.87 19,379 0.88
2 19,281 0.87 19,995 0.89
Table 2.2.2.2 Cronbach’s Alpha for Grades 3–8 Mathematics by Gender
Subject Grade Core
Online
Female Male
N Alpha N Alpha
Mathematics
3 1 23,352 0.88 23,589 0.88
2 12,813 0.89 13,148 0.89
4 1 23,696 0.91 23,586 0.92
2 13,248 0.90 13,409 0.91
5 1 22,740 0.91 21,995 0.92
2 10,952 0.90 10,963 0.91
6 1 20,075 0.91 19,951 0.92
2 12,106 0.91 12,090 0.92
7 1 18,775 0.90 18,843 0.91
2 11,692 0.91 12,140 0.92
8 1 14,809 0.90 15,457 0.91
2 8,407 0.91 9,271 0.92
Note: Plain English is not included in the math results.

Virginia Standards of Learning Assessments Technical Report 2013–2014 Administration Cycle
55
Table 2.2.2.3 Cronbach’s Alpha for Grade 3 History and Grades 3, 5, and 8 Science by
Gender
Subject Grade Core
Online
Female Male
N Alpha N Alpha
History 3 1 17,245 0.88 17,404 0.88
2 18,150 0.89 19,020 0.89
Science
3 1 22,956 0.87 23,365 0.88
2 12,071 0.87 12,581 0.88
5 1 24,047 0.85 23,717 0.86
2 13,429 0.88 14,050 0.88
8 1 21,447 0.89 21,656 0.90
2 12,441 0.89 13,257 0.91
Table 2.2.2.4 Cronbach’s Alpha for Content-Specific History Tests by Gender
Subject Core
Online
Female Male
N Alpha N Alpha
Virginia Studies 1 18,227 0.88 18,211 0.89
2 19,101 0.87 19,670 0.88
United States History to
1865 1 17,736 0.89 17,576 0.90
2 17,511 0.89 18,221 0.90
United States History:
1865 to Present 1 17,807 0.87 18,315 0.87
2 16,581 0.87 16,954 0.89
Civics and Economics 1 16,327 0.86 16,566 0.87
2 16,500 0.88 17,084 0.88

Virginia Standards of Learning Assessments Technical Report 2013–2014 Administration Cycle
56
Table 2.2.2.5 Cronbach’s Alpha for High School End-of-Course Tests by Gender
Subject Core
Online
Female Male
N Alpha N Alpha
Earth Science
1 13,621 0.89 14,064 0.90
2 8,982 0.90 9,382 0.90
3 3,064 0.89 3,329 0.90
Biology
1 19,159 0.89 19,337 0.90
2 10,146 0.89 10,508 0.90
3 4,879 0.89 5,077 0.90
Chemistry
1 15,050 0.89 13,646 0.90
2 7,189 0.89 6,471 0.90
3 3,168 0.89 2,786 0.91
Algebra I
1 21,972 0.92 22,668 0.93
2 12,038 0.92 12,690 0.92
3 5,103 0.92 5,307 0.92
Geometry
1 19,588 0.92 19,310 0.92
2 9,627 0.91 9,834 0.92
3 4,645 0.90 4,712 0.90
Virginia & United States History
1 11,378 0.90 11,152 0.90
2 10,364 0.90 10,626 0.90
3 10,387 0.91 10,386 0.92
World History I
1 9,430 0.91 9,630 0.92
2 9,451 0.93 10,068 0.94
3 9,840 0.92 10,235 0.93
World History II
1 9,964 0.90 9,421 0.91
2 9,825 0.92 9,946 0.92
3 9,593 0.91 9,272 0.92
World Geography 1 4,523 0.89 4,214 0.91
2 4,104 0.91 4,002 0.92
English: Reading/Lit. & Res.
1 12,270 0.87 12,086 0.87
2 9,325 0.87 9,783 0.88
3 8,301 0.88 8,046 0.89
Algebra II
1 16,933 0.91 16,072 0.91
2 7,923 0.90 6,954 0.91
3 3,136 0.90 2,802 0.91
Note: Plain English is not included in the Algebra I results.

Virginia Standards of Learning Assessments Technical Report 2013–2014 Administration Cycle
57
Table 2.2.2.6 Cronbach’s Alpha for VMAST Grades 3–8 & End-of-Course by Gender
Subject Grade Core
Online
Female Male
N Alpha N Alpha
VMAST
Mathematics
3 2 209 0.81 407 0.83
4 2 404 0.80 608 0.82
5 2 425 0.82 680 0.84
6 2 282 0.81 488 0.81
7 2 305 0.77 458 0.76
8 2 305 0.78 480 0.82
End-of-Course 3 128 0.77 219 0.74
VMAST
Reading
3 2 181 0.80 377 0.83
4 2 357 0.79 612 0.81
5 2 344 0.78 620 0.78
6 2 218 0.78 399 0.79
7 2 225 0.78 376 0.80
8 2 252 0.76 387 0.81
End-of-Course 3 31 0.72 43 0.82
2.2.3 Reliability Estimates by Ethnic Group
Reliability results are broken down by ethnic group for SOL tests and VMAST administered in
the spring of 2014. In Virginia, only the white and black ethnic groups have a large enough
population to calculate reliability statistics. Each table shows the number of students used in the
analyses and the associated Cronbach’s Alpha for each grade/core/ethnic combination. In almost
all instances, the Alphas were above the desired lower limit of 0.80, with the exception of
VMAST. For VMAST, the Alphas were above the acceptable lower limit of 0.70. Students not
reporting their ethnicity are excluded from these results.
Table 2.2.3.1 Cronbach’s Alpha for Grades 3–8 Reading by Ethnic Group
Subject Grade Core
Online
Black White
N Alpha N Alpha
Reading
3 1 8,491 0.87 19,014 0.86
2 9,398 0.87 18,842 0.88
4 1 8,335 0.86 19,484 0.85
2 9,170 0.88 19,249 0.86
5 1 8,342 0.84 18,842 0.82
2 9,287 0.88 19,333 0.87
6 1 8,814 0.86 19,108 0.83
2 9,206 0.89 19,317 0.88

Virginia Standards of Learning Assessments Technical Report 2013–2014 Administration Cycle
58
Subject Grade Core
Online
Black White
N Alpha N Alpha
7 1 8,883 0.87 19,501 0.85
2 9,357 0.86 19,790 0.85
8 1 9,075 0.86 19,420 0.85
2 9,640 0.87 20,064 0.87
Table 2.2.3.2 Cronbach’s Alpha for Grades 3–8 Mathematics by Ethnic Group
Subject Grade Core
Online
Black White
N Alpha N Alpha
Mathematics
3 1 12,438 0.88 23,716 0.86
2 4,652 0.89 12,868 0.87
4 1 11,765 0.92 24,085 0.90
2 4,845 0.90 13,146 0.89
5 1 11,484 0.91 22,429 0.90
2 4,702 0.91 10,727 0.89
6 1 11,124 0.91 19,529 0.90
2 4,912 0.91 11,849 0.89
7 1 9,607 0.90 19,673 0.89
2 4,499 0.90 12,105 0.90
8 1 9,389 0.90 14,561 0.90
2 4,235 0.91 8,341 0.91
Note: Plain English is not included in the math results.
Table 2.2.3.3 Cronbach’s Alpha for Grade 3 History and Grades 3, 5, and 8 Science by
Ethnic Group
Subject Grade Core
Online
Black White
N Alpha N Alpha
History 3 1 8,261 0.88 18,275 0.86
2 8,631 0.89 18,831 0.88
Science
3 1 12,133 0.87 24,024 0.85
2 4,590 0.87 12,911 0.86
5 1 12,003 0.83 24,250 0.83
2 5,165 0.86 13,477 0.86
8 1 10,822 0.87 22,714 0.88
2 4,891 0.85 12,766 0.88
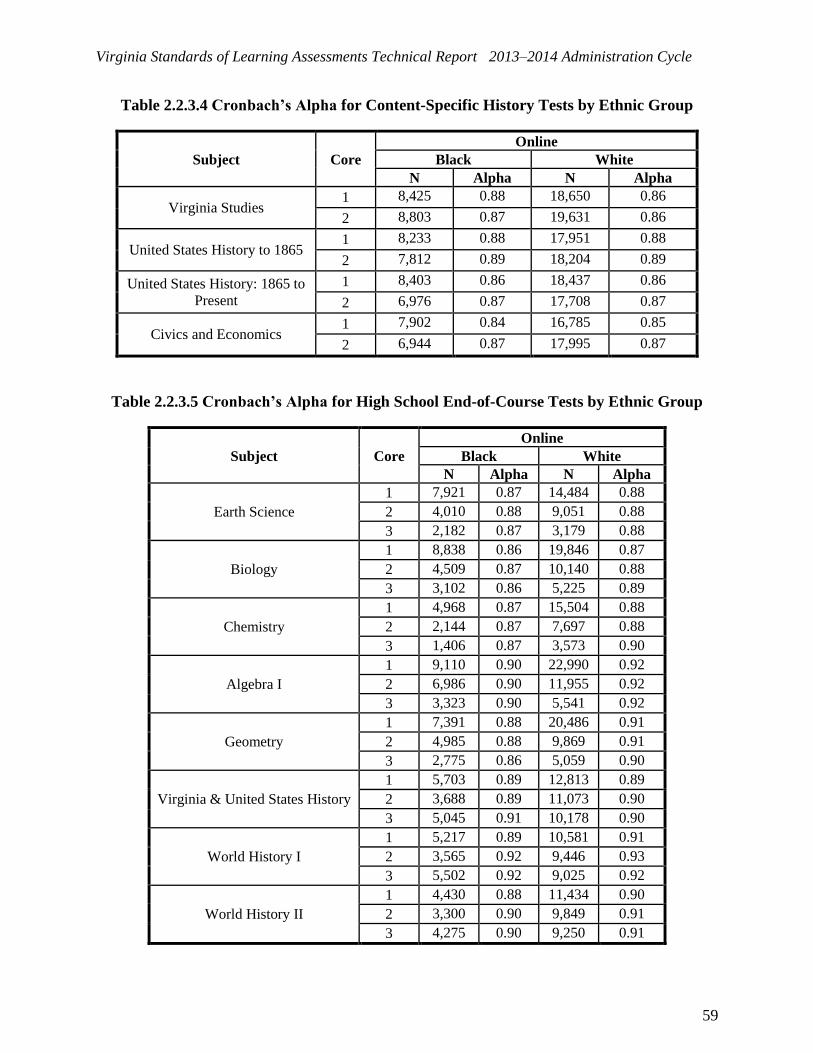
Virginia Standards of Learning Assessments Technical Report 2013–2014 Administration Cycle
59
Table 2.2.3.4 Cronbach’s Alpha for Content-Specific History Tests by Ethnic Group
Subject Core
Online
Black White
N Alpha N Alpha
Virginia Studies 1 8,425 0.88 18,650 0.86
2 8,803 0.87 19,631 0.86
United States History to 1865 1 8,233 0.88 17,951 0.88
2 7,812 0.89 18,204 0.89
United States History: 1865 to
Present
1 8,403 0.86 18,437 0.86
2 6,976 0.87 17,708 0.87
Civics and Economics 1 7,902 0.84 16,785 0.85
2 6,944 0.87 17,995 0.87
Table 2.2.3.5 Cronbach’s Alpha for High School End-of-Course Tests by Ethnic Group
Subject Core
Online
Black White
N Alpha N Alpha
Earth Science
1 7,921 0.87 14,484 0.88
2 4,010 0.88 9,051 0.88
3 2,182 0.87 3,179 0.88
Biology
1 8,838 0.86 19,846 0.87
2 4,509 0.87 10,140 0.88
3 3,102 0.86 5,225 0.89
Chemistry
1 4,968 0.87 15,504 0.88
2 2,144 0.87 7,697 0.88
3 1,406 0.87 3,573 0.90
Algebra I
1 9,110 0.90 22,990 0.92
2 6,986 0.90 11,955 0.92
3 3,323 0.90 5,541 0.92
Geometry
1 7,391 0.88 20,486 0.91
2 4,985 0.88 9,869 0.91
3 2,775 0.86 5,059 0.90
Virginia & United States History
1 5,703 0.89 12,813 0.89
2 3,688 0.89 11,073 0.90
3 5,045 0.91 10,178 0.90
World History I
1 5,217 0.89 10,581 0.91
2 3,565 0.92 9,446 0.93
3 5,502 0.92 9,025 0.92
World History II
1 4,430 0.88 11,434 0.90
2 3,300 0.90 9,849 0.91
3 4,275 0.90 9,250 0.91

Virginia Standards of Learning Assessments Technical Report 2013–2014 Administration Cycle
60
Subject Core
Online
Black White
N Alpha N Alpha
World Geography 1 2,043 0.88 4,881 0.90
2 2,607 0.89 3,955 0.91
English: Reading/Lit. & Res.
1 6,150 0.86 12,613 0.86
2 2,156 0.88 10,227 0.85
3 5,415 0.86 8,120 0.87
Algebra II
1 5,399 0.89 17,925 0.90
2 3,311 0.88 8,361 0.90
3 1,476 0.88 3,629 0.91
Note: Plain English is not included in the Algebra I results.
Table 2.2.3.6 Cronbach’s Alpha for VMAST Grades 3–8 & End-of-Course by Ethnic
Group
Subject Grade Core
Online
Black White
N Alpha N Alpha
VMAST Reading
3 2 177 0.82 229 0.82
4 2 295 0.80 386 0.82
5 2 291 0.81 358 0.79
6 2 188 0.77 221 0.80
7 2 168 0.79 210 0.81
8 2 174 0.78 229 0.82
End-of-Course 3 21 0.78 39 0.78
VMAST Mathematics
3 2 187 0.81 201 0.83
4 2 302 0.84 373 0.80
5 2 336 0.81 412 0.84
6 2 217 0.76 309 0.82
7 2 224 0.75 296 0.77
8 2 206 0.79 332 0.80
End-of-Course 3 81 0.72 175 0.76
2.3 Reliability Estimates for Writing Assessments
2.3.1 Stratified Alpha
The tables below present Stratified Alpha reliability estimates in writing for grades 5, 8, and
EOC. Results are provided for the overall sample, as well as by gender and ethnic group, for
each combination of MC core and writing prompt.
For grade 5, Stratified Alpha ranged from 0.80 to 0.83. For grade 8, Stratified Alpha ranged from
0.84 to 0.86. For EOC, Stratified Alpha ranged from 0.85 to 0.88.

Virginia Standards of Learning Assessments Technical Report 2013–2014 Administration Cycle
61
Table 2.3.1.1 Stratified Alpha for Grades 5, 8, and End-of-Course Writing
Grade Core Online
Prompt N Alpha
Writing 5
1
2502 5,591 0.81
2509 5,544 0.81
2510 5,682 0.81
2519 5,621 0.82
2522 5,618 0.83
2532 5,637 0.83
2549 5,681 0.83
2
2502 3,923 0.82
2509 3,928 0.80
2510 3,880 0.81
2519 3,890 0.81
2522 3,992 0.83
2532 3,972 0.82
2549 3,979 0.83
3
2502 2,447 0.81
2509 2,472 0.82
2510 2,445 0.82
2519 2,576 0.81
2522 2,428 0.83
2532 2,448 0.83
2549 2,438 0.83
Writing 8
1
2806 5,729 0.84
2810 5,574 0.84
2812 5,777 0.85
2813 5,591 0.84
2819 5,531 0.84
2849 5,528 0.85
2852 5,613 0.85
2
2806 4,128 0.84
2810 4,024 0.85
2812 3,910 0.85
2813 4,001 0.84
2819 4,048 0.85
2849 4,007 0.84
2852 3,958 0.84
3
2806 2,470 0.86
2810 2,454 0.86
2812 2,461 0.85

Virginia Standards of Learning Assessments Technical Report 2013–2014 Administration Cycle
62
Grade Core Online
Prompt N Alpha
2813 2,454 0.86
2819 2,569 0.85
2849 2,533 0.86
2852 2,562 0.86
Writing End-of-Course
1
2101 4,779 0.86
2102 4,757 0.85
2107 4,730 0.86
2115 4,968 0.85
2121 4,858 0.85
2122 4,810 0.86
2126 4,799 0.85
2
2101 3,277 0.87
2102 3,339 0.87
2107 3,314 0.87
2115 3,386 0.87
2121 3,414 0.88
2122 3,370 0.87
2126 3,332 0.87
3
2101 2,054 0.88
2102 1,990 0.88
2107 2,029 0.88
2115 2,059 0.88
2121 2,095 0.88
2122 2,110 0.87
2126 2,081 0.88
Table 2.3.1.2 shows the reliability results for grades 5, 8, and EOC writing broken down by
gender for each combination of MC core and writing prompt. For grade 5, Stratified Alpha
ranged from 0.79 to 0.83 for females and from 0.80 to 0.84 for males. For grade 8, Stratified
Alpha ranged from 0.82 to 0.86 for females and from 0.84 to 0.87 for males. For EOC, Stratified
Alpha ranged from 0.83 to 0.88 for females and from 0.86 to 0.89 for males.
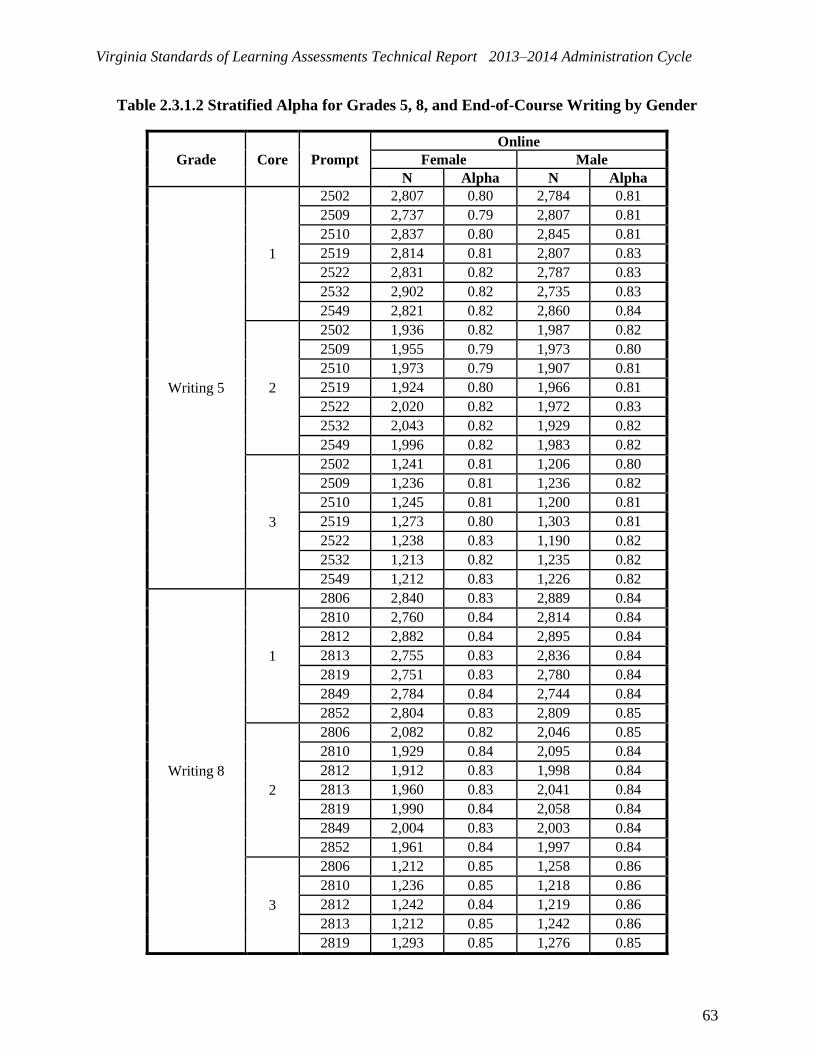
Virginia Standards of Learning Assessments Technical Report 2013–2014 Administration Cycle
63
Table 2.3.1.2 Stratified Alpha for Grades 5, 8, and End-of-Course Writing by Gender
Grade Core Prompt
Online
Female Male
N Alpha N Alpha
Writing 5
1
2502 2,807 0.80 2,784 0.81
2509 2,737 0.79 2,807 0.81
2510 2,837 0.80 2,845 0.81
2519 2,814 0.81 2,807 0.83
2522 2,831 0.82 2,787 0.83
2532 2,902 0.82 2,735 0.83
2549 2,821 0.82 2,860 0.84
2
2502 1,936 0.82 1,987 0.82
2509 1,955 0.79 1,973 0.80
2510 1,973 0.79 1,907 0.81
2519 1,924 0.80 1,966 0.81
2522 2,020 0.82 1,972 0.83
2532 2,043 0.82 1,929 0.82
2549 1,996 0.82 1,983 0.82
3
2502 1,241 0.81 1,206 0.80
2509 1,236 0.81 1,236 0.82
2510 1,245 0.81 1,200 0.81
2519 1,273 0.80 1,303 0.81
2522 1,238 0.83 1,190 0.82
2532 1,213 0.82 1,235 0.82
2549 1,212 0.83 1,226 0.82
Writing 8
1
2806 2,840 0.83 2,889 0.84
2810 2,760 0.84 2,814 0.84
2812 2,882 0.84 2,895 0.84
2813 2,755 0.83 2,836 0.84
2819 2,751 0.83 2,780 0.84
2849 2,784 0.84 2,744 0.84
2852 2,804 0.83 2,809 0.85
2
2806 2,082 0.82 2,046 0.85
2810 1,929 0.84 2,095 0.84
2812 1,912 0.83 1,998 0.84
2813 1,960 0.83 2,041 0.84
2819 1,990 0.84 2,058 0.84
2849 2,004 0.83 2,003 0.84
2852 1,961 0.84 1,997 0.84
3
2806 1,212 0.85 1,258 0.86
2810 1,236 0.85 1,218 0.86
2812 1,242 0.84 1,219 0.86
2813 1,212 0.85 1,242 0.86
2819 1,293 0.85 1,276 0.85

Virginia Standards of Learning Assessments Technical Report 2013–2014 Administration Cycle
64
Grade Core Prompt
Online
Female Male
N Alpha N Alpha
2849 1,284 0.84 1,249 0.87
2852 1,298 0.86 1,264 0.85
Writing End-of-Course
1
2101 2,376 0.85 2,403 0.86
2102 2,333 0.84 2,424 0.86
2107 2,298 0.84 2,432 0.87
2115 2,465 0.83 2,503 0.86
2121 2,449 0.84 2,409 0.86
2122 2,387 0.85 2,423 0.87
2126 2,361 0.84 2,438 0.86
2
2101 1,618 0.87 1,659 0.88
2102 1,619 0.86 1,720 0.87
2107 1,689 0.87 1,625 0.88
2115 1,706 0.87 1,680 0.88
2121 1,686 0.87 1,728 0.88
2122 1,688 0.87 1,682 0.88
2126 1,680 0.86 1,652 0.88
3
2101 995 0.87 1,059 0.88
2102 986 0.87 1,004 0.89
2107 1,006 0.88 1,023 0.88
2115 1,051 0.86 1,008 0.88
2121 1,064 0.86 1,031 0.88
2122 1,059 0.87 1,051 0.88
2126 1,042 0.87 1,039 0.89
Table 2.3.1.3 shows the reliability results for grades 5, 8, and EOC writing broken down by
ethnic group for each combination of MC core and writing prompt. For grade 5, Stratified Alpha
ranged from 0.80 to 0.83 for black students and from 0.77 to 0.82 for white students. For grade 8,
Stratified Alpha ranged from 0.81 to 0.85 for black students and from 0.82 to 0.85 for white
students. For EOC, Stratified Alpha for both black and white students ranged from 0.83 to 0.87.
Table 2.3.1.3 Stratified Alpha for Grades 5, 8, and End-of-Course Writing by Ethnic
Group
Grade Core Prompt
Online
Black White
N Alpha N Alpha
Writing 5 1
2502 1,271 0.80 3,018 0.80
2509 1,177 0.80 3,067 0.78
2510 1,269 0.81 3,050 0.79
2519 1,187 0.80 3,063 0.80
2522 1,224 0.82 3,055 0.81
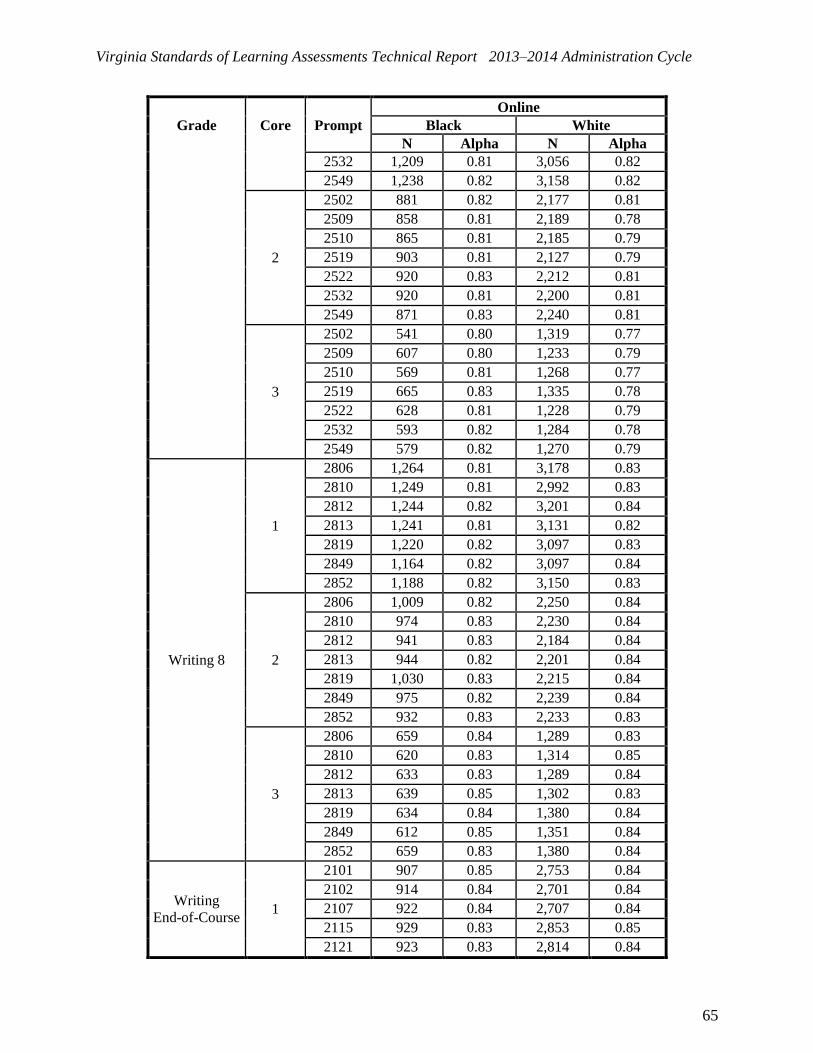
Virginia Standards of Learning Assessments Technical Report 2013–2014 Administration Cycle
65
Grade Core Prompt
Online
Black White
N Alpha N Alpha
2532 1,209 0.81 3,056 0.82
2549 1,238 0.82 3,158 0.82
2
2502 881 0.82 2,177 0.81
2509 858 0.81 2,189 0.78
2510 865 0.81 2,185 0.79
2519 903 0.81 2,127 0.79
2522 920 0.83 2,212 0.81
2532 920 0.81 2,200 0.81
2549 871 0.83 2,240 0.81
3
2502 541 0.80 1,319 0.77
2509 607 0.80 1,233 0.79
2510 569 0.81 1,268 0.77
2519 665 0.83 1,335 0.78
2522 628 0.81 1,228 0.79
2532 593 0.82 1,284 0.78
2549 579 0.82 1,270 0.79
Writing 8
1
2806 1,264 0.81 3,178 0.83
2810 1,249 0.81 2,992 0.83
2812 1,244 0.82 3,201 0.84
2813 1,241 0.81 3,131 0.82
2819 1,220 0.82 3,097 0.83
2849 1,164 0.82 3,097 0.84
2852 1,188 0.82 3,150 0.83
2
2806 1,009 0.82 2,250 0.84
2810 974 0.83 2,230 0.84
2812 941 0.83 2,184 0.84
2813 944 0.82 2,201 0.84
2819 1,030 0.83 2,215 0.84
2849 975 0.82 2,239 0.84
2852 932 0.83 2,233 0.83
3
2806 659 0.84 1,289 0.83
2810 620 0.83 1,314 0.85
2812 633 0.83 1,289 0.84
2813 639 0.85 1,302 0.83
2819 634 0.84 1,380 0.84
2849 612 0.85 1,351 0.84
2852 659 0.83 1,380 0.84
Writing End-of-Course
1
2101 907 0.85 2,753 0.84
2102 914 0.84 2,701 0.84
2107 922 0.84 2,707 0.84
2115 929 0.83 2,853 0.85
2121 923 0.83 2,814 0.84

Virginia Standards of Learning Assessments Technical Report 2013–2014 Administration Cycle
66
Grade Core Prompt
Online
Black White
N Alpha N Alpha
2122 887 0.84 2,789 0.85
2126 961 0.85 2,728 0.83
2
2101 772 0.87 1,835 0.86
2102 816 0.85 1,859 0.86
2107 814 0.86 1,838 0.86
2115 818 0.84 1,874 0.87
2121 843 0.86 1,878 0.87
2122 812 0.87 1,843 0.86
2126 782 0.86 1,841 0.86
3
2101 526 0.85 1,125 0.85
2102 504 0.87 1,093 0.85
2107 508 0.85 1,083 0.85
2115 522 0.86 1,099 0.85
2121 528 0.86 1,127 0.85
2122 534 0.85 1,143 0.85
2126 530 0.86 1,126 0.85
2.3.2 Inter-Rater Reliability
There were a total of 7 writing prompts (5 new and 2 old prompts) administered in the spring
2014 administration in grades 5, 8, and EOC writing. The following tables provide the inter-rater
reliability for each prompt/trait combination. Across all grades, the perfect agreement rate was
above 65% and the perfect plus adjacent agreement rate was 99% or higher.
Table 2.3.2.1 Inter-Rater Reliability for Grade 5 Writing Assessment: Prompts 2502, 2509,
2510, 2519, 2522, 2532, and 2549
Prompt Trait Online
N Perfect
Agree (%) Adjacent (%)
Non-
Adjacent (%)
2502 Comp/Written Expression 13,091 72 28 0
Usage and Mechanics 13,091 67 32 1
2509 Comp/Written Expression 12,985 70 29 0
Usage and Mechanics 12,985 68 31 1
2510 Comp/Written Expression 13,125 71 29 0
Usage and Mechanics 13,125 67 32 1
2519 Comp/Written Expression 13,217 70 29 0
Usage and Mechanics 13,217 67 32 1
2522 Comp/Written Expression 13,175 72 28 0
Usage and Mechanics 13,175 68 31 1
2532 Comp/Written Expression 13,120 71 29 0
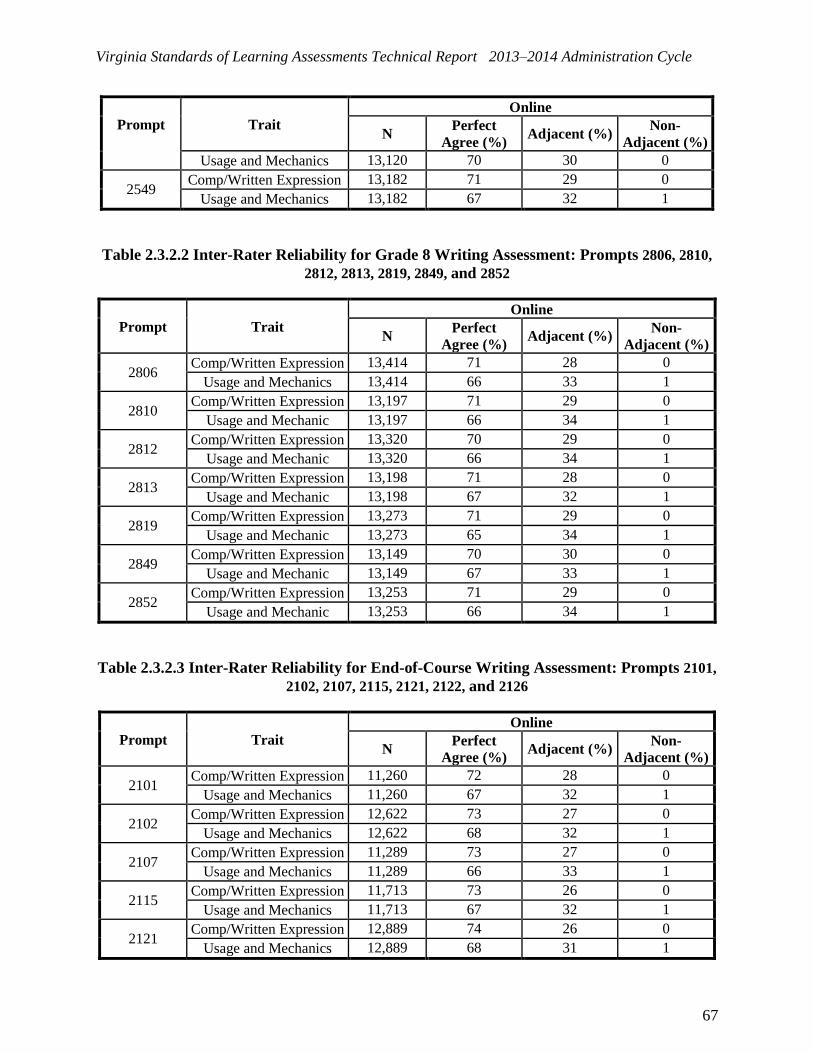
Virginia Standards of Learning Assessments Technical Report 2013–2014 Administration Cycle
67
Prompt Trait Online
N Perfect
Agree (%) Adjacent (%)
Non-
Adjacent (%)
Usage and Mechanics 13,120 70 30 0
2549 Comp/Written Expression 13,182 71 29 0
Usage and Mechanics 13,182 67 32 1
Table 2.3.2.2 Inter-Rater Reliability for Grade 8 Writing Assessment: Prompts 2806, 2810,
2812, 2813, 2819, 2849, and 2852
Prompt Trait Online
N Perfect
Agree (%) Adjacent (%)
Non-
Adjacent (%)
2806 Comp/Written Expression 13,414 71 28 0
Usage and Mechanics 13,414 66 33 1
2810 Comp/Written Expression 13,197 71 29 0
Usage and Mechanic 13,197 66 34 1
2812 Comp/Written Expression 13,320 70 29 0
Usage and Mechanic 13,320 66 34 1
2813 Comp/Written Expression 13,198 71 28 0
Usage and Mechanic 13,198 67 32 1
2819 Comp/Written Expression 13,273 71 29 0
Usage and Mechanic 13,273 65 34 1
2849 Comp/Written Expression 13,149 70 30 0
Usage and Mechanic 13,149 67 33 1
2852 Comp/Written Expression 13,253 71 29 0
Usage and Mechanic 13,253 66 34 1
Table 2.3.2.3 Inter-Rater Reliability for End-of-Course Writing Assessment: Prompts 2101,
2102, 2107, 2115, 2121, 2122, and 2126
Prompt Trait Online
N Perfect
Agree (%) Adjacent (%)
Non-
Adjacent (%)
2101 Comp/Written Expression 11,260 72 28 0
Usage and Mechanics 11,260 67 32 1
2102 Comp/Written Expression 12,622 73 27 0
Usage and Mechanics 12,622 68 32 1
2107 Comp/Written Expression 11,289 73 27 0
Usage and Mechanics 11,289 66 33 1
2115 Comp/Written Expression 11,713 73 26 0
Usage and Mechanics 11,713 67 32 1
2121 Comp/Written Expression 12,889 74 26 0
Usage and Mechanics 12,889 68 31 1
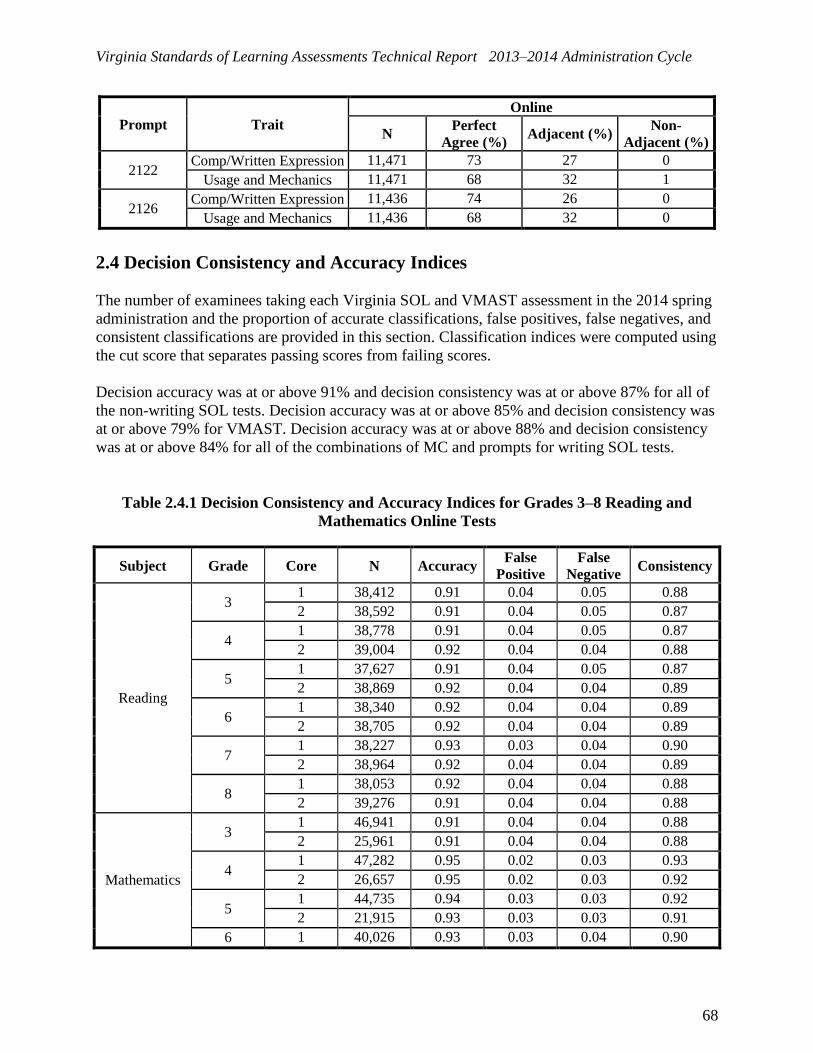
Virginia Standards of Learning Assessments Technical Report 2013–2014 Administration Cycle
68
Prompt Trait Online
N Perfect
Agree (%) Adjacent (%)
Non-
Adjacent (%)
2122 Comp/Written Expression 11,471 73 27 0
Usage and Mechanics 11,471 68 32 1
2126 Comp/Written Expression 11,436 74 26 0
Usage and Mechanics 11,436 68 32 0
2.4 Decision Consistency and Accuracy Indices
The number of examinees taking each Virginia SOL and VMAST assessment in the 2014 spring
administration and the proportion of accurate classifications, false positives, false negatives, and
consistent classifications are provided in this section. Classification indices were computed using
the cut score that separates passing scores from failing scores.
Decision accuracy was at or above 91% and decision consistency was at or above 87% for all of
the non-writing SOL tests. Decision accuracy was at or above 85% and decision consistency was
at or above 79% for VMAST. Decision accuracy was at or above 88% and decision consistency
was at or above 84% for all of the combinations of MC and prompts for writing SOL tests.
Table 2.4.1 Decision Consistency and Accuracy Indices for Grades 3–8 Reading and
Mathematics Online Tests
Subject Grade Core N Accuracy False
Positive False
Negative Consistency
Reading
3 1 38,412 0.91 0.04 0.05 0.88
2 38,592 0.91 0.04 0.05 0.87
4 1 38,778 0.91 0.04 0.05 0.87
2 39,004 0.92 0.04 0.04 0.88
5 1 37,627 0.91 0.04 0.05 0.87
2 38,869 0.92 0.04 0.04 0.89
6 1 38,340 0.92 0.04 0.04 0.89
2 38,705 0.92 0.04 0.04 0.89
7 1 38,227 0.93 0.03 0.04 0.90
2 38,964 0.92 0.04 0.04 0.89
8 1 38,053 0.92 0.04 0.04 0.88
2 39,276 0.91 0.04 0.04 0.88
Mathematics
3 1 46,941 0.91 0.04 0.04 0.88
2 25,961 0.91 0.04 0.04 0.88
4 1 47,282 0.95 0.02 0.03 0.93
2 26,657 0.95 0.02 0.03 0.92
5 1 44,735 0.94 0.03 0.03 0.92
2 21,915 0.93 0.03 0.03 0.91
6 1 40,026 0.93 0.03 0.04 0.90

Virginia Standards of Learning Assessments Technical Report 2013–2014 Administration Cycle
69
Subject Grade Core N Accuracy False
Positive False
Negative Consistency
2 24,196 0.95 0.02 0.03 0.93
7 1 37,618 0.92 0.04 0.04 0.89
2 23,832 0.93 0.04 0.04 0.90
8 1 30,266 0.92 0.04 0.04 0.89
2 17,678 0.93 0.03 0.04 0.90
Note: Plain English is not included in the math results.
Table 2.4.2 Decision Consistency and Accuracy Indices for Grade 3 History and Grades 3,
5, and 8 Science Online Tests
Subject Grade Core N Accuracy False
Positive False
Negative Consistency
History 3 1 34,649 0.96 0.02 0.03 0.94
2 37,170 0.94 0.02 0.03 0.92
Science
3 1 46,321 0.93 0.03 0.04 0.91
2 24,652 0.95 0.02 0.03 0.92
5 1 47,764 0.91 0.04 0.05 0.87
2 27,479 0.92 0.04 0.04 0.89
8 1 43,103 0.93 0.03 0.04 0.90
2 25,698 0.93 0.03 0.04 0.90
Table 2.4.3 Decision Consistency and Accuracy Indices for Content-Specific History Online
Tests
Subject Core N Accuracy False
Positive False
Negative Consistency
Virginia Studies 1 36,438 0.95 0.02 0.03 0.94
2 38,771 0.94 0.03 0.03 0.92
US History to 1865 1 35,312 0.94 0.02 0.03 0.92
2 35,732 0.94 0.03 0.03 0.91
US History: 1865 to Present 1 36,122 0.95 0.02 0.03 0.92
2 33,535 0.93 0.03 0.04 0.91
Civics and Economics 1 32,893 0.95 0.02 0.03 0.93
2 33,584 0.94 0.03 0.04 0.91

Virginia Standards of Learning Assessments Technical Report 2013–2014 Administration Cycle
70
Table 2.4.4 Decision Consistency and Accuracy Indices for High School End-of-Course
Online Tests
Subject Core N Accuracy False
Positive False
Negative Consistency
Earth Science
1 27,685 0.93 0.03 0.04 0.90
2 18,364 0.93 0.03 0.04 0.90
3 6,393 0.92 0.04 0.04 0.89
Biology
1 38,496 0.93 0.03 0.04 0.90
2 20,654 0.93 0.03 0.04 0.90
3 9,956 0.92 0.04 0.04 0.89
Chemistry
1 28,696 0.93 0.03 0.04 0.91
2 13,660 0.95 0.02 0.03 0.92
3 5,954 0.93 0.03 0.04 0.90
Algebra I
1 44,640 0.93 0.03 0.03 0.91
2 24,728 0.92 0.04 0.04 0.89
3 10,410 0.92 0.04 0.04 0.89
Geometry
1 38,898 0.93 0.03 0.04 0.90
2 19,461 0.92 0.04 0.04 0.89
3 9,357 0.91 0.04 0.05 0.87
Virginia & United States History
1 22,530 0.94 0.03 0.03 0.92
2 20,990 0.95 0.02 0.03 0.93
3 20,773 0.95 0.02 0.03 0.93
World History I
1 19,060 0.93 0.03 0.04 0.91
2 19,519 0.95 0.02 0.03 0.93
3 20,075 0.95 0.02 0.03 0.93
World History II
1 19,385 0.94 0.03 0.03 0.91
2 19,771 0.94 0.03 0.03 0.92
3 18,865 0.94 0.03 0.03 0.91
World Geography 1 8,737 0.94 0.03 0.03 0.91
2 8,106 0.94 0.03 0.03 0.92
English: Reading/Lit. & Res.
1 24,356 0.94 0.02 0.03 0.92
2 19,108 0.95 0.02 0.03 0.93
3 16,347 0.93 0.03 0.04 0.90
Algebra II 1 33,005 0.93 0.03 0.04 0.90
2 14,877 0.94 0.03 0.03 0.91

Virginia Standards of Learning Assessments Technical Report 2013–2014 Administration Cycle
71
Subject Core N Accuracy False
Positive False
Negative Consistency
3 5,938 0.92 0.04 0.04 0.89
Table 2.4.5 Decision Consistency and Accuracy Indices for VMAST Grades 3–8 and End-
of-Course Mathematics and Reading
Subject Grade Core N Accuracy False
Positive False
Negative Consistency
VMAST
Mathematics
3 2 616 0.88 0.07 0.05 0.83
4 2 1,012 0.86 0.07 0.07 0.81
5 2 1,105 0.90 0.06 0.04 0.86
6 2 770 0.88 0.07 0.05 0.83
7 2 763 0.85 0.09 0.07 0.79
8 2 785 0.86 0.08 0.06 0.81
End-of-Course 3 347 0.90 0.07 0.04 0.85
VMAST
Reading
3 2 558 0.88 0.07 0.06 0.83
4 2 969 0.86 0.07 0.07 0.81
5 2 964 0.85 0.08 0.06 0.80
6 2 617 0.86 0.08 0.06 0.80
7 2 601 0.86 0.07 0.07 0.81
8 2 639 0.86 0.08 0.07 0.80
End-of-Course 3 74 0.86 0.07 0.07 0.80
Table 2.4.6 Decision Consistency and Accuracy Indices for Grades 5, 8, and End-of-Course
Writing Tests
Grade Core Prompt N Accuracy False
Positive False
Negative Consistency
5
1
2502 5,591 0.88 0.05 0.06 0.84
2509 5,544 0.89 0.05 0.06 0.85
2510 5,682 0.88 0.05 0.06 0.84
2519 5,621 0.89 0.05 0.06 0.84
2522 5,618 0.90 0.05 0.06 0.85
2532 5,637 0.90 0.05 0.06 0.86
2549 5,681 0.90 0.05 0.05 0.85
2
2502 3,923 0.89 0.05 0.06 0.84
2509 3,928 0.89 0.05 0.06 0.84
2510 3,880 0.89 0.05 0.06 0.84
2519 3,890 0.88 0.05 0.06 0.84
2522 3,992 0.89 0.05 0.06 0.84
2532 3,972 0.88 0.06 0.06 0.84
2549 3,979 0.89 0.05 0.06 0.84
3 2502 2,447 0.89 0.05 0.06 0.85

Virginia Standards of Learning Assessments Technical Report 2013–2014 Administration Cycle
72
Grade Core Prompt N Accuracy False
Positive False
Negative Consistency
2509 2,472 0.90 0.05 0.06 0.86
2510 2,445 0.89 0.05 0.06 0.85
2519 2,576 0.89 0.05 0.06 0.85
2522 2,428 0.90 0.05 0.06 0.85
2532 2,448 0.90 0.05 0.06 0.86
2549 2,438 0.90 0.05 0.05 0.86
8
1
2806 5,729 0.89 0.05 0.06 0.84
2810 5,574 0.89 0.05 0.06 0.85
2812 5,777 0.90 0.05 0.05 0.86
2813 5,591 0.89 0.05 0.05 0.85
2819 5,531 0.90 0.05 0.05 0.86
2849 5,528 0.90 0.05 0.05 0.86
2852 5,613 0.90 0.05 0.05 0.85
2
2806 4,128 0.90 0.05 0.05 0.85
2810 4,024 0.90 0.05 0.05 0.85
2812 3,910 0.91 0.04 0.05 0.87
2813 4,001 0.90 0.05 0.05 0.85
2819 4,048 0.90 0.05 0.05 0.85
2849 4,007 0.89 0.05 0.06 0.85
2852 3,958 0.90 0.05 0.05 0.85
3
2806 2,470 0.91 0.04 0.05 0.87
2810 2454 0.91 0.04 0.05 0.87
2812 2,461 0.91 0.04 0.05 0.87
2813 2,454 0.91 0.04 0.05 0.87
2819 2,569 0.91 0.04 0.05 0.87
2849 2,533 0.91 0.04 0.05 0.87
2852 2,562 0.91 0.04 0.05 0.87
End-of-Course
1
2101 4,779 0.94 0.03 0.04 0.91
2102 4,757 0.95 0.02 0.03 0.92
2107 4,730 0.94 0.03 0.03 0.91
2115 4,968 0.94 0.03 0.04 0.91
2121 4,858 0.94 0.03 0.04 0.91
2122 4,810 0.94 0.03 0.03 0.91
2126 4,799 0.94 0.03 0.03 0.91
2
2101 3,277 0.93 0.03 0.04 0.90
2102 3,339 0.93 0.03 0.04 0.90
2107 3,314 0.93 0.03 0.04 0.90
2115 3,386 0.93 0.03 0.04 0.90
2121 3,414 0.93 0.03 0.04 0.90
2122 3,370 0.92 0.04 0.04 0.89
2126 3,332 0.93 0.03 0.04 0.90
3 2101 2,054 0.93 0.03 0.04 0.91
2102 1,990 0.94 0.03 0.03 0.91

Virginia Standards of Learning Assessments Technical Report 2013–2014 Administration Cycle
73
Grade Core Prompt N Accuracy False
Positive False
Negative Consistency
2107 2,029 0.94 0.03 0.03 0.92
2115 2,059 0.94 0.03 0.03 0.92
2121 2,095 0.94 0.03 0.03 0.92
2122 2,110 0.94 0.03 0.03 0.91
2126 2,081 0.94 0.03 0.03 0.92
2.5 Raw Score to Scale Score (RSSS) Conversion Tables and Conditional SEM
Table 2.5.1 RSSS Conversions for Grade 3 Reading
Raw Score
Online
Core 1 Core 2
SS SEM SS SEM
0 0 0
1 119 64 121 64
2 164 46 167 46
3 192 38 194 38
4 212 34 215 34
5 229 31 231 31
6 243 28 245 28
7 255 27 257 27
8 266 26 268 26
9 276 25 278 25
10 285 24 288 24
11 294 23 296 23
12 302 23 305 23
13 310 22 313 22
14 318 22 320 22
15 326 21 328 21
16 333 21 335 21
17 340 21 342 21
18 347 21 349 21
19 354 21 356 21
20 361 21 363 21
21 368 21 370 21
22 375 21 377 21
23 382 21 384 21
24 390 21 391 21
25 397 22 398 21
26 405 22 406 22
27 413 22 414 22
28 421 23 422 23
29 429 23 430 23

Virginia Standards of Learning Assessments Technical Report 2013–2014 Administration Cycle
74
30 438 24 439 24
31 448 25 448 25
32 458 26 458 26
33 469 27 469 27
34 482 29 482 29
35 496 31 496 31
36 513 34 512 34
37 533 38 533 38
38 561 46 561 46
39 600 600
40 600 600
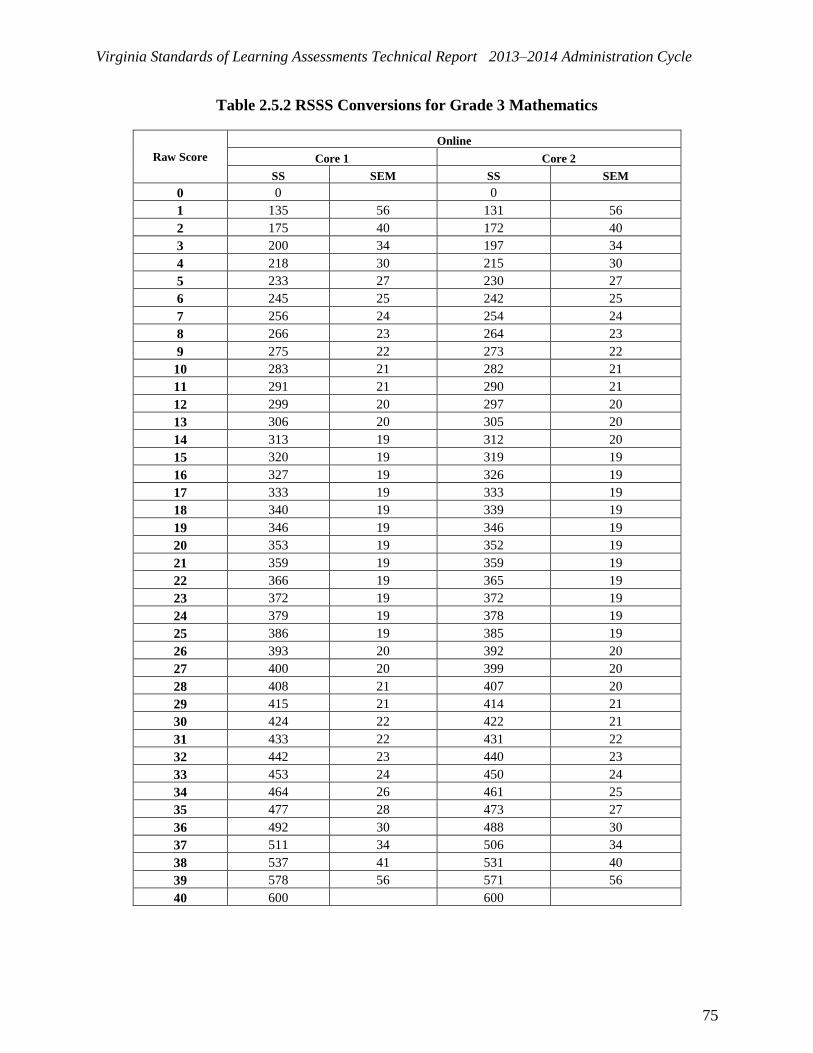
Virginia Standards of Learning Assessments Technical Report 2013–2014 Administration Cycle
75
Table 2.5.2 RSSS Conversions for Grade 3 Mathematics
Raw Score
Online
Core 1 Core 2
SS SEM SS SEM
0 0 0
1 135 56 131 56
2 175 40 172 40
3 200 34 197 34
4 218 30 215 30
5 233 27 230 27
6 245 25 242 25
7 256 24 254 24
8 266 23 264 23
9 275 22 273 22
10 283 21 282 21
11 291 21 290 21
12 299 20 297 20
13 306 20 305 20
14 313 19 312 20
15 320 19 319 19
16 327 19 326 19
17 333 19 333 19
18 340 19 339 19
19 346 19 346 19
20 353 19 352 19
21 359 19 359 19
22 366 19 365 19
23 372 19 372 19
24 379 19 378 19
25 386 19 385 19
26 393 20 392 20
27 400 20 399 20
28 408 21 407 20
29 415 21 414 21
30 424 22 422 21
31 433 22 431 22
32 442 23 440 23
33 453 24 450 24
34 464 26 461 25
35 477 28 473 27
36 492 30 488 30
37 511 34 506 34
38 537 41 531 40
39 578 56 571 56
40 600 600

Virginia Standards of Learning Assessments Technical Report 2013–2014 Administration Cycle
76
Table 2.5.3 RSSS Conversions for Grade 3 Science
Raw Score
Online
Core 1 Core 2
SS SEM SS SEM
0 0 0
1 185 52 176 52
2 222 37 213 38
3 245 31 236 31
4 261 27 253 28
5 274 25 267 25
6 286 23 278 23
7 296 22 288 22
8 305 21 297 21
9 313 20 306 20
10 320 19 313 20
11 327 19 321 19
12 334 18 328 19
13 341 18 334 18
14 347 18 341 18
15 353 17 347 18
16 359 17 353 17
17 365 17 359 17
18 371 17 365 17
19 376 17 370 17
20 382 17 376 17
21 388 17 382 17
22 393 17 388 17
23 399 17 394 17
24 405 17 400 18
25 411 18 406 18
26 417 18 412 18
27 423 18 419 18
28 430 19 425 19
29 437 19 432 19
30 444 20 440 20
31 452 20 448 20
32 460 21 456 21
33 469 22 466 22
34 480 23 476 24
35 491 25 488 25
36 505 28 502 28
37 522 31 519 32
38 545 38 542 38
39 582 52 581 52
40 600 600
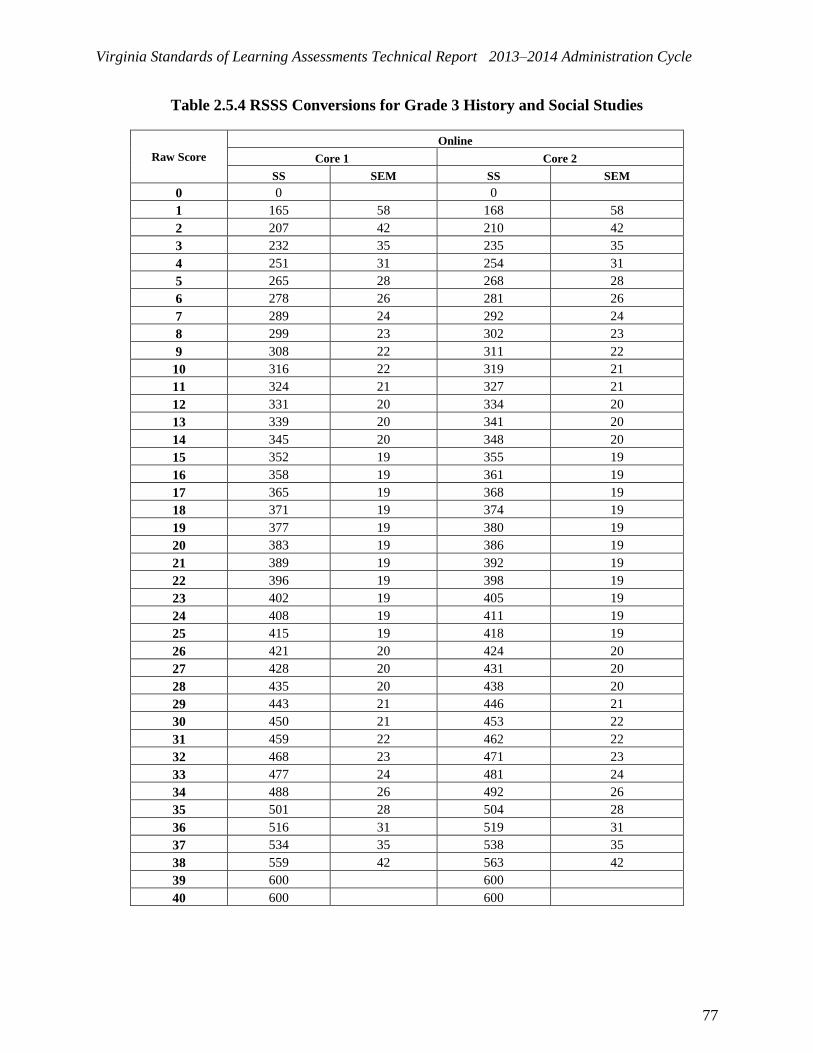
Virginia Standards of Learning Assessments Technical Report 2013–2014 Administration Cycle
77
Table 2.5.4 RSSS Conversions for Grade 3 History and Social Studies
Raw Score
Online
Core 1 Core 2
SS SEM SS SEM
0 0 0
1 165 58 168 58
2 207 42 210 42
3 232 35 235 35
4 251 31 254 31
5 265 28 268 28
6 278 26 281 26
7 289 24 292 24
8 299 23 302 23
9 308 22 311 22
10 316 22 319 21
11 324 21 327 21
12 331 20 334 20
13 339 20 341 20
14 345 20 348 20
15 352 19 355 19
16 358 19 361 19
17 365 19 368 19
18 371 19 374 19
19 377 19 380 19
20 383 19 386 19
21 389 19 392 19
22 396 19 398 19
23 402 19 405 19
24 408 19 411 19
25 415 19 418 19
26 421 20 424 20
27 428 20 431 20
28 435 20 438 20
29 443 21 446 21
30 450 21 453 22
31 459 22 462 22
32 468 23 471 23
33 477 24 481 24
34 488 26 492 26
35 501 28 504 28
36 516 31 519 31
37 534 35 538 35
38 559 42 563 42
39 600 600
40 600 600

Virginia Standards of Learning Assessments Technical Report 2013–2014 Administration Cycle
78
Table 2.5.5 RSSS Conversions for Grade 4 Reading
Raw Score
Online
Core 1 Core 2
SS SEM SS SEM
0 0 0
1 112 62 123 62
2 157 45 168 45
3 184 37 195 37
4 204 33 216 33
5 220 30 232 30
6 234 28 246 28
7 246 26 258 26
8 257 25 269 25
9 267 24 279 24
10 276 23 289 23
11 285 23 297 23
12 293 22 306 22
13 301 22 314 22
14 309 21 321 21
15 316 21 329 21
16 323 21 336 21
17 331 21 343 21
18 338 21 350 21
19 345 21 357 20
20 352 21 364 20
21 359 21 371 20
22 366 21 378 20
23 373 21 385 21
24 380 21 392 21
25 388 21 399 21
26 396 22 406 21
27 404 22 414 22
28 412 23 421 22
29 420 23 430 23
30 430 24 438 23
31 439 25 447 24
32 450 26 457 25
33 461 27 468 26
34 474 29 480 28
35 488 31 494 30
36 505 34 510 33
37 526 38 530 37
38 554 45 558 45
39 599 62 600
40 600 600
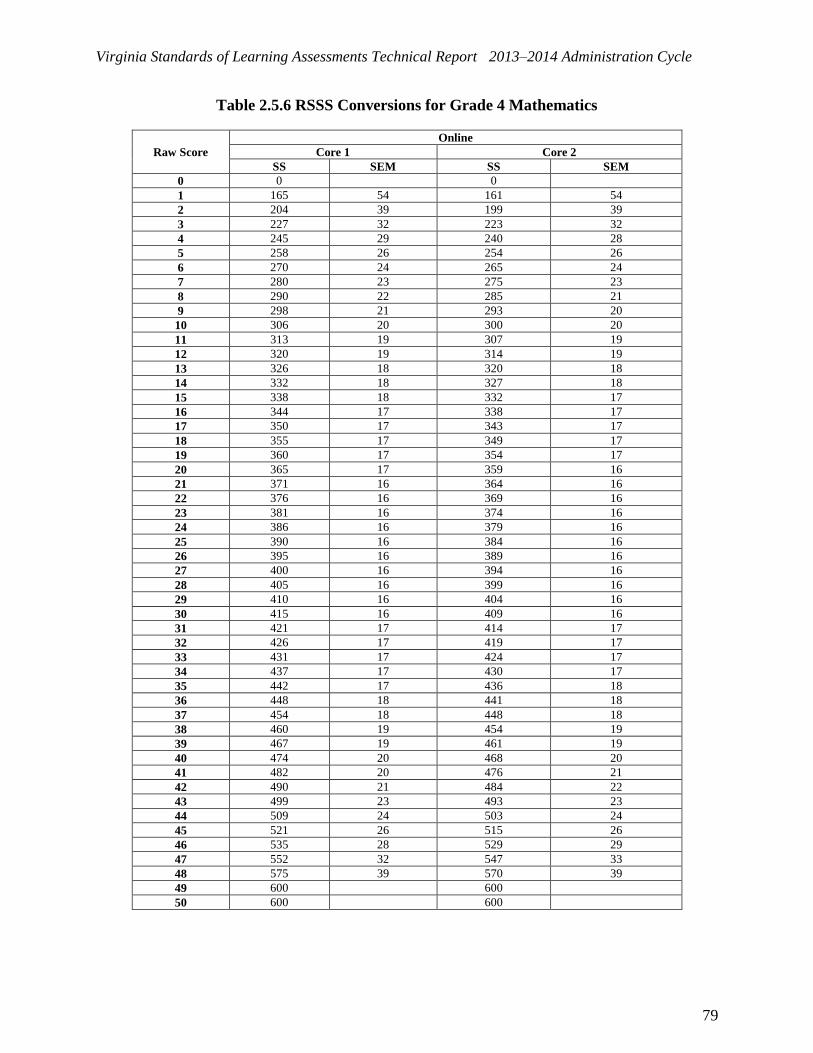
Virginia Standards of Learning Assessments Technical Report 2013–2014 Administration Cycle
79
Table 2.5.6 RSSS Conversions for Grade 4 Mathematics
Raw Score
Online
Core 1 Core 2
SS SEM SS SEM
0 0 0
1 165 54 161 54
2 204 39 199 39
3 227 32 223 32
4 245 29 240 28
5 258 26 254 26
6 270 24 265 24
7 280 23 275 23
8 290 22 285 21
9 298 21 293 20
10 306 20 300 20
11 313 19 307 19
12 320 19 314 19
13 326 18 320 18
14 332 18 327 18
15 338 18 332 17
16 344 17 338 17
17 350 17 343 17
18 355 17 349 17
19 360 17 354 17
20 365 17 359 16
21 371 16 364 16
22 376 16 369 16
23 381 16 374 16
24 386 16 379 16
25 390 16 384 16
26 395 16 389 16
27 400 16 394 16
28 405 16 399 16
29 410 16 404 16
30 415 16 409 16
31 421 17 414 17
32 426 17 419 17
33 431 17 424 17
34 437 17 430 17
35 442 17 436 18
36 448 18 441 18
37 454 18 448 18
38 460 19 454 19
39 467 19 461 19
40 474 20 468 20
41 482 20 476 21
42 490 21 484 22
43 499 23 493 23
44 509 24 503 24
45 521 26 515 26
46 535 28 529 29
47 552 32 547 33
48 575 39 570 39
49 600 600
50 600 600

Virginia Standards of Learning Assessments Technical Report 2013–2014 Administration Cycle
80
Table 2.5.7 RSSS Conversions for Grade 5 Reading
Raw Score
Online
Core 1 Core 2
SS SEM SS SEM
0 0 0
1 107 66 101 66
2 155 48 150 48
3 184 40 180 40
4 206 35 202 36
5 224 32 220 33
6 239 30 235 30
7 252 28 249 29
8 264 27 261 27
9 275 26 272 26
10 285 25 282 25
11 294 24 292 25
12 303 24 301 24
13 312 23 310 23
14 320 23 318 23
15 329 23 326 23
16 337 23 334 22
17 344 22 342 22
18 352 22 350 22
19 360 22 357 22
20 367 22 365 22
21 375 22 372 22
22 383 22 379 22
23 391 22 387 22
24 398 23 395 22
25 407 23 402 22
26 415 23 410 23
27 423 24 418 23
28 432 24 427 24
29 441 25 436 24
30 451 25 445 25
31 461 26 455 26
32 472 27 465 27
33 484 28 477 28
34 497 30 489 30
35 512 32 504 32
36 530 35 521 35
37 552 40 542 39
38 581 48 571 47
39 600 600
40 600 600

Virginia Standards of Learning Assessments Technical Report 2013–2014 Administration Cycle
81
Table 2.5.8 RSSS Conversions for Grade 5 Mathematics
Raw Score
Online
Core 1 Core 2
SS SEM SS SEM
0 0 0
1 141 55 136 55
2 180 39 176 40
3 204 33 200 33
4 221 29 217 29
5 235 26 231 26
6 247 24 243 24
7 257 23 254 23
8 266 22 263 22
9 274 21 271 21
10 282 20 279 20
11 289 19 286 20
12 296 19 293 19
13 302 18 300 19
14 308 18 306 18
15 314 18 312 18
16 320 17 318 18
17 326 17 324 17
18 331 17 329 17
19 336 17 334 17
20 342 17 340 17
21 347 17 345 17
22 352 17 350 17
23 357 17 355 17
24 362 17 360 17
25 367 17 366 17
26 372 17 371 17
27 378 17 376 17
28 383 17 381 17
29 388 17 386 17
30 393 17 392 17
31 399 17 397 17
32 404 18 402 17
33 410 18 408 17
34 416 18 414 18
35 422 18 420 18
36 429 19 426 18
37 435 19 432 19
38 442 20 439 19
39 450 20 446 20
40 457 21 453 20
41 466 22 461 21
42 475 23 470 22
43 485 24 479 23
44 496 25 490 25
45 509 27 502 27
46 524 30 516 29
47 543 34 534 33
48 568 40 558 40
49 600 598 55
50 600 600

Virginia Standards of Learning Assessments Technical Report 2013–2014 Administration Cycle
82
Table 2.5.9 RSSS Conversions for Grade 5 Science
Raw Score
Online
Core 1 Core 2
SS SEM SS SEM
0 0 0
1 136 60 150 60
2 180 43 193 43
3 206 36 219 36
4 225 32 238 32
5 241 29 253 29
6 254 27 266 27
7 266 26 277 25
8 276 24 287 24
9 286 23 296 23
10 295 23 305 22
11 304 22 313 22
12 312 22 321 21
13 319 21 328 21
14 327 21 335 20
15 334 21 342 20
16 341 20 349 20
17 348 20 356 20
18 355 20 362 20
19 362 20 369 20
20 368 20 375 20
21 375 20 382 20
22 382 20 388 20
23 389 20 395 20
24 396 20 402 20
25 403 21 409 20
26 410 21 416 21
27 418 21 423 21
28 426 22 431 21
29 434 22 439 22
30 443 23 447 23
31 452 24 456 23
32 462 25 466 24
33 472 26 476 26
34 484 27 488 27
35 498 29 502 29
36 514 32 518 32
37 534 36 538 36
38 560 44 564 44
39 600 600
40 600 600

Virginia Standards of Learning Assessments Technical Report 2013–2014 Administration Cycle
83
Table 2.5.10 RSSS Conversions for Grade 6 Reading
Raw Score
Online
Core 1 Core 2
SS SEM SS SEM
0 0 0
1 139 59 129 59
2 181 42 171 42
3 206 35 197 35
4 225 31 216 31
5 240 28 231 28
6 253 26 244 26
7 264 25 255 25
8 274 23 265 24
9 283 22 274 23
10 291 22 283 22
11 299 21 291 21
12 306 20 298 21
13 313 20 305 20
14 320 20 312 20
15 326 19 318 19
16 333 19 325 19
17 339 19 331 19
18 345 19 337 19
19 351 18 343 19
20 356 18 349 18
21 362 18 355 18
22 368 18 361 18
23 374 18 366 18
24 379 18 372 18
25 385 18 378 18
26 391 18 384 19
27 397 19 390 19
28 403 19 396 19
29 409 19 402 19
30 415 19 409 19
31 422 20 415 20
32 429 20 422 20
33 436 20 430 21
34 443 21 437 21
35 451 22 445 22
36 459 22 454 23
37 468 23 463 24
38 478 25 474 25
39 489 26 485 27
40 502 28 499 29
41 517 31 515 32
42 535 35 535 36
43 561 42 562 44
44 600 600
45 600 600

Virginia Standards of Learning Assessments Technical Report 2013–2014 Administration Cycle
84
Table 2.5.11 RSSS Conversions for Grade 6 Mathematics
Raw Score
Online
Core 1 Core 2
SS SEM SS SEM
0 0 0
1 219 42 217 42
2 249 30 248 31
3 267 25 266 25
4 280 22 280 22
5 291 20 291 20
6 300 19 300 19
7 308 17 309 18
8 315 17 316 17
9 321 16 322 16
10 327 15 329 16
11 332 15 334 15
12 337 14 340 15
13 342 14 345 14
14 347 14 350 14
15 352 14 354 14
16 356 13 359 14
17 360 13 363 13
18 364 13 368 13
19 368 13 372 13
20 372 13 376 13
21 376 13 380 13
22 380 13 384 13
23 384 13 388 13
24 388 13 391 13
25 392 13 395 13
26 396 13 399 13
27 399 13 403 13
28 403 13 407 13
29 407 13 411 13
30 411 13 415 13
31 415 13 419 13
32 419 13 423 13
33 423 13 427 13
34 428 13 431 13
35 432 14 436 14
36 437 14 440 14
37 441 14 445 14
38 446 15 450 14
39 452 15 455 15
40 457 15 461 15
41 463 16 467 16
42 470 17 473 17
43 477 18 480 18
44 485 19 488 19
45 494 20 497 20
46 505 22 508 22
47 519 25 522 25
48 537 30 540 30
49 567 42 570 42
50 600 600

Virginia Standards of Learning Assessments Technical Report 2013–2014 Administration Cycle
85
Table 2.5.12 RSSS Conversions for Grade 7 Reading
Raw Score
Online
Core 1 Core 2
SS SEM SS SEM
0 0 0
1 126 59 139 59
2 168 42 181 42
3 194 35 206 35
4 213 31 225 31
5 228 28 240 28
6 241 26 253 26
7 253 25 264 25
8 263 24 274 23
9 272 23 283 22
10 280 22 291 22
11 288 21 299 21
12 296 21 307 20
13 303 20 314 20
14 310 20 321 20
15 316 19 327 19
16 323 19 334 19
17 329 19 340 19
18 335 19 346 19
19 341 18 352 18
20 347 18 358 18
21 353 18 364 18
22 358 18 369 18
23 364 18 375 18
24 370 18 381 18
25 376 18 387 18
26 382 18 393 18
27 388 19 399 19
28 394 19 405 19
29 400 19 411 19
30 406 19 417 19
31 413 19 424 19
32 419 20 430 20
33 426 20 437 20
34 434 21 445 21
35 441 21 453 21
36 450 22 461 22
37 459 23 470 23
38 469 24 480 24
39 480 26 491 26
40 492 28 503 28
41 507 31 518 31
42 526 35 537 35
43 551 42 562 42
44 593 59 600
45 600 600

Virginia Standards of Learning Assessments Technical Report 2013–2014 Administration Cycle
86
Table 2.5.13 RSSS Conversions for Grade 7 Mathematics
Raw Score
Online
Core 1 Core 2
SS SEM SS SEM
0 0 0
1 154 51 147 51
2 191 37 183 37
3 213 31 206 31
4 229 27 222 27
5 243 25 235 25
6 254 23 246 23
7 263 22 256 21
8 272 20 265 20
9 280 20 273 20
10 287 19 280 19
11 294 18 287 18
12 301 18 293 18
13 307 17 299 17
14 313 17 305 17
15 318 17 311 17
16 324 16 316 16
17 329 16 321 16
18 334 16 327 16
19 339 16 332 16
20 344 16 337 16
21 349 16 342 16
22 354 15 347 16
23 358 15 351 16
24 363 15 356 16
25 368 15 361 16
26 372 15 366 16
27 377 15 371 16
28 382 15 375 16
29 386 16 380 16
30 391 16 385 16
31 396 16 390 16
32 401 16 396 16
33 406 16 401 16
34 411 16 406 17
35 417 17 412 17
36 422 17 418 17
37 428 17 424 18
38 434 18 430 18
39 440 18 437 19
40 447 19 444 19
41 454 19 451 20
42 462 20 459 21
43 471 21 468 22
44 480 23 478 23
45 491 24 490 25
46 504 27 503 27
47 520 31 520 31
48 542 37 542 37
49 579 51 580 52
50 600 600

Virginia Standards of Learning Assessments Technical Report 2013–2014 Administration Cycle
87
Table 2.5.14 RSSS Conversions for Grade 8 Reading
Raw Score
Online
Core 1 Core 2
SS SEM SS SEM
0 0 0
1 138 56 143 56
2 179 40 183 40
3 203 34 208 34
4 221 30 226 30
5 236 27 240 27
6 248 25 252 25
7 259 24 263 24
8 268 23 272 22
9 277 22 281 21
10 285 21 289 21
11 293 20 297 20
12 300 20 304 20
13 307 19 311 19
14 314 19 317 19
15 320 19 323 18
16 326 18 329 18
17 333 18 335 18
18 339 18 341 18
19 344 18 347 18
20 350 18 352 18
21 356 18 358 18
22 362 18 364 18
23 368 18 369 18
24 373 18 375 18
25 379 18 380 18
26 385 18 386 18
27 391 18 392 18
28 397 18 397 18
29 403 19 403 18
30 410 19 410 18
31 416 19 416 19
32 423 20 422 19
33 430 20 429 20
34 437 20 436 20
35 445 21 444 21
36 453 22 452 21
37 462 23 461 22
38 472 24 470 24
39 483 25 481 25
40 496 27 493 27
41 510 30 507 30
42 529 34 525 34
43 553 41 550 40
44 594 56 590 56
45 600 600

Virginia Standards of Learning Assessments Technical Report 2013–2014 Administration Cycle
88
Table 2.5.15 RSSS Conversions for Grade 8 Mathematics
Raw Score
Online
Core 1 Core 2
SS SEM SS SEM
0 0 0
1 196 43 190 43
2 227 31 222 31
3 245 26 241 26
4 259 23 255 23
5 270 21 267 21
6 280 19 277 20
7 288 18 285 19
8 296 17 293 18
9 302 17 300 17
10 308 16 307 16
11 314 15 313 16
12 320 15 319 15
13 325 15 324 15
14 330 14 329 15
15 335 14 335 14
16 340 14 339 14
17 344 14 344 14
18 349 14 349 14
19 353 13 353 14
20 357 13 358 14
21 361 13 362 13
22 365 13 366 13
23 370 13 370 13
24 374 13 375 13
25 378 13 379 13
26 382 13 383 13
27 386 13 387 13
28 390 13 391 13
29 394 13 395 13
30 398 13 400 13
31 402 13 404 14
32 407 13 408 14
33 411 14 413 14
34 415 14 417 14
35 420 14 422 14
36 425 14 427 14
37 430 15 432 15
38 435 15 437 15
39 440 15 443 16
40 446 16 449 16
41 452 16 455 17
42 459 17 462 17
43 466 18 469 18
44 474 19 478 19
45 483 21 487 21
46 494 23 499 23
47 508 26 513 26
48 526 31 532 31
49 557 43 563 43
50 600 600

Virginia Standards of Learning Assessments Technical Report 2013–2014 Administration Cycle
89
Table 2.5.16 RSSS Conversions for Grade 8 Science
Raw Score
Online
Core 1 Core 2
SS SEM SS SEM
0 0 0
1 190 47 194 47
2 224 34 227 34
3 244 28 248 28
4 260 25 263 25
5 272 23 275 22
6 282 21 285 21
7 292 20 294 20
8 300 19 302 19
9 307 18 310 18
10 314 18 317 17
11 321 17 323 17
12 327 17 329 16
13 333 16 335 16
14 339 16 340 16
15 344 16 346 15
16 349 15 351 15
17 354 15 356 15
18 359 15 361 15
19 364 15 365 15
20 369 15 370 15
21 374 15 375 14
22 378 14 379 14
23 383 14 384 14
24 387 14 388 14
25 392 14 393 14
26 396 14 397 14
27 401 14 402 14
28 405 14 406 14
29 410 14 411 14
30 414 14 415 14
31 419 14 420 15
32 423 15 425 15
33 428 15 429 15
34 433 15 434 15
35 438 15 439 15
36 443 15 445 16
37 448 16 450 16
38 454 16 456 16
39 460 16 461 17
40 466 17 468 17
41 472 18 474 18
42 479 18 482 19
43 487 19 490 20
44 496 20 498 21
45 506 22 509 22
46 517 24 521 24
47 532 28 535 28
48 552 33 556 33
49 585 46 589 46
50 600 600

Virginia Standards of Learning Assessments Technical Report 2013–2014 Administration Cycle
90
Table 2.5.17 RSSS Conversions for United States History to 1865
Raw Score
Online
Core 1 Core 2
SS SEM SS SEM
0 0 0
1 161 60 167 60
2 204 43 210 43
3 230 36 236 36
4 250 32 255 31
5 265 29 270 29
6 278 27 283 27
7 290 25 295 25
8 300 24 305 24
9 310 23 314 23
10 319 22 323 22
11 327 22 331 22
12 335 21 339 21
13 342 21 346 21
14 350 21 353 20
15 357 20 360 20
16 364 20 367 20
17 371 20 373 20
18 377 20 380 19
19 384 20 386 19
20 391 20 393 19
21 397 20 399 19
22 404 20 406 20
23 411 20 412 20
24 418 20 419 20
25 425 20 426 20
26 432 21 433 20
27 439 21 440 21
28 447 21 447 21
29 455 22 455 22
30 464 23 464 22
31 473 23 473 23
32 482 24 482 24
33 493 25 493 25
34 504 27 504 27
35 518 29 518 29
36 534 32 534 32
37 553 36 553 36
38 579 43 580 44
39 600 600
40 600 600
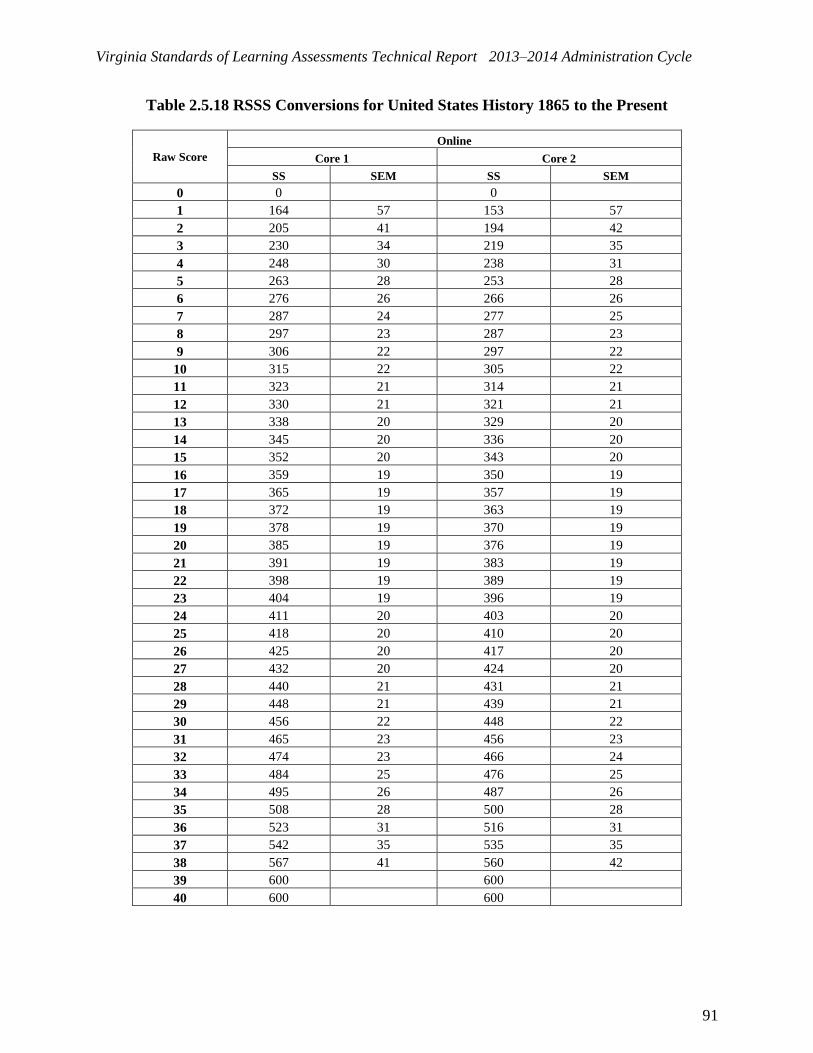
Virginia Standards of Learning Assessments Technical Report 2013–2014 Administration Cycle
91
Table 2.5.18 RSSS Conversions for United States History 1865 to the Present
Raw Score
Online
Core 1 Core 2
SS SEM SS SEM
0 0 0
1 164 57 153 57
2 205 41 194 42
3 230 34 219 35
4 248 30 238 31
5 263 28 253 28
6 276 26 266 26
7 287 24 277 25
8 297 23 287 23
9 306 22 297 22
10 315 22 305 22
11 323 21 314 21
12 330 21 321 21
13 338 20 329 20
14 345 20 336 20
15 352 20 343 20
16 359 19 350 19
17 365 19 357 19
18 372 19 363 19
19 378 19 370 19
20 385 19 376 19
21 391 19 383 19
22 398 19 389 19
23 404 19 396 19
24 411 20 403 20
25 418 20 410 20
26 425 20 417 20
27 432 20 424 20
28 440 21 431 21
29 448 21 439 21
30 456 22 448 22
31 465 23 456 23
32 474 23 466 24
33 484 25 476 25
34 495 26 487 26
35 508 28 500 28
36 523 31 516 31
37 542 35 535 35
38 567 41 560 42
39 600 600
40 600 600

Virginia Standards of Learning Assessments Technical Report 2013–2014 Administration Cycle
92
Table 2.5.19 RSSS Conversions for Civics and Economics
Raw Score
Online
Core 1 Core 2
SS SEM SS SEM
0 0 0
1 183 55 179 55
2 223 39 219 39
3 247 33 243 33
4 265 29 261 29
5 279 27 275 26
6 291 25 287 25
7 302 23 298 23
8 312 22 308 22
9 321 21 317 21
10 329 21 325 21
11 337 20 333 20
12 345 20 340 20
13 352 19 347 19
14 359 19 354 19
15 366 19 361 19
16 372 19 368 19
17 379 19 374 18
18 385 18 380 18
19 392 18 387 18
20 398 18 393 18
21 404 18 399 18
22 411 19 406 18
23 417 19 412 19
24 424 19 419 19
25 431 19 425 19
26 437 19 432 19
27 445 20 439 20
28 452 20 446 20
29 460 21 454 20
30 468 21 462 21
31 477 22 471 22
32 486 23 480 23
33 496 24 490 24
34 507 25 501 25
35 520 27 513 27
36 535 30 528 29
37 553 33 546 33
38 578 40 570 40
39 600 600
40 600 600

Virginia Standards of Learning Assessments Technical Report 2013–2014 Administration Cycle
93
Table 2.5.20 RSSS Conversions for Virginia Studies
Raw Score
Online
Core 1 Core 2
SS SEM SS SEM
0 0 0
1 134 68 130 68
2 183 49 179 49
3 213 41 209 41
4 234 36 231 36
5 252 33 248 33
6 267 30 263 30
7 280 29 276 29
8 292 27 288 27
9 302 26 298 26
10 312 25 308 25
11 322 25 317 25
12 331 24 326 24
13 339 24 335 24
14 347 23 343 23
15 355 23 351 23
16 363 23 359 23
17 371 22 366 22
18 378 22 374 22
19 385 22 381 22
20 393 22 388 22
21 400 22 396 22
22 408 22 403 22
23 415 22 411 22
24 423 23 418 23
25 430 23 426 23
26 438 23 434 23
27 447 24 442 24
28 455 24 451 24
29 464 25 459 25
30 473 25 469 25
31 483 26 479 26
32 494 27 489 27
33 506 29 501 29
34 519 30 514 30
35 533 33 529 33
36 551 36 546 36
37 573 41 568 41
38 600 598 49
39 600 600
40 600 600

Virginia Standards of Learning Assessments Technical Report 2013–2014 Administration Cycle
94
Table 2.5.21 RSSS Conversions for EOC Reading
Raw Score
Online
Core 1 Core 2 Core 3
SS SEM SS SEM SS SEM
0 0 0 0
1 173 48 178 48 181 48
2 208 35 212 34 215 34
3 228 29 233 28 236 28
4 244 25 248 25 251 25
5 256 23 259 23 262 23
6 267 21 270 21 272 21
7 276 20 278 20 281 20
8 284 19 286 19 289 19
9 291 18 293 18 296 18
10 298 17 299 17 302 17
11 304 17 305 17 308 16
12 310 16 311 16 313 16
13 315 16 316 16 319 16
14 320 16 321 15 324 15
15 325 15 326 15 329 15
16 330 15 331 15 333 15
17 335 15 335 14 338 14
18 340 15 340 14 342 14
19 344 14 344 14 346 14
20 348 14 348 14 350 14
21 353 14 352 14 354 14
22 357 14 356 14 358 14
23 361 14 360 14 362 14
24 365 14 364 14 366 14
25 369 14 368 14 370 13
26 373 14 372 13 374 13
27 377 14 376 13 378 13
28 381 14 380 13 381 13
29 385 14 383 13 385 13
30 389 14 387 14 389 14
31 393 14 391 14 393 14
32 397 14 395 14 397 14
33 401 14 399 14 401 14
34 405 14 403 14 405 14
35 409 14 407 14 409 14
36 414 14 411 14 413 14
37 418 14 416 14 418 14
38 423 15 420 14 422 15
39 427 15 424 15 427 15
40 432 15 429 15 431 15
41 437 16 434 15 436 15
42 442 16 439 16 441 16
43 448 16 444 16 447 16
44 454 17 450 17 453 17
45 460 17 456 17 459 17
46 466 18 462 18 465 18
47 474 19 469 19 472 19
48 481 20 477 20 480 20
49 490 21 486 21 489 21
50 501 23 496 23 499 23
51 513 25 508 25 512 25
52 528 29 522 28 527 29
53 549 35 543 34 548 35
54 583 48 577 48 582 48
55 600 600 600

Virginia Standards of Learning Assessments Technical Report 2013–2014 Administration Cycle
95
Table 2.5.22 RSSS Conversions for EOC Earth Science
Raw Score
Online
Core 1 Core 2 Core 3
SS SEM SS SEM SS SEM
0 0 0 0
1 219 43 217 43 223 43
2 251 31 248 31 254 31
3 270 26 267 26 272 26
4 284 23 280 23 286 23
5 295 21 291 21 297 21
6 305 19 300 19 306 19
7 313 18 309 18 314 18
8 320 17 316 17 322 17
9 327 16 322 16 328 16
10 333 16 328 16 334 16
11 339 15 334 15 340 15
12 344 15 339 15 345 15
13 349 14 344 14 350 14
14 354 14 349 14 355 14
15 359 14 354 14 359 14
16 363 14 358 14 364 14
17 367 13 363 14 368 13
18 372 13 367 13 372 13
19 376 13 371 13 377 13
20 380 13 375 13 381 13
21 384 13 379 13 385 13
22 388 13 383 13 388 13
23 391 13 387 13 392 13
24 395 13 391 13 396 13
25 399 13 395 13 400 13
26 403 13 399 13 404 13
27 407 13 403 13 408 13
28 411 13 407 13 412 13
29 414 13 411 13 416 13
30 418 13 415 13 420 13
31 422 13 419 13 424 13
32 426 13 423 13 428 13
33 431 13 428 14 432 13
34 435 14 432 14 436 14
35 439 14 437 14 441 14
36 444 14 442 14 445 14
37 448 14 447 15 450 14
38 453 15 452 15 455 15
39 459 15 457 15 461 15
40 464 16 463 16 466 16
41 470 16 469 17 473 16
42 476 17 476 17 479 17
43 484 18 483 18 487 18
44 491 19 492 19 495 19
45 501 20 501 21 504 21
46 511 22 513 23 515 23
47 525 26 527 26 529 26
48 543 31 546 31 548 31
49 574 43 577 43 579 43
50 600 600 600

Virginia Standards of Learning Assessments Technical Report 2013–2014 Administration Cycle
96
Table 2.5.23 RSSS Conversions for EOC Biology
Raw Score
Online
Core 1 Core 2 Core 3
SS SEM SS SEM SS SEM
0 0 0 0
1 205 46 205 46 208 46
2 238 33 237 33 240 33
3 257 27 257 27 260 27
4 272 24 271 24 274 24
5 283 22 283 22 286 22
6 293 20 293 20 295 20
7 301 19 301 19 304 19
8 309 18 309 18 311 18
9 315 17 316 17 318 17
10 322 16 322 17 324 16
11 327 16 328 16 330 16
12 333 16 334 16 336 16
13 338 15 340 15 341 15
14 343 15 345 15 346 15
15 348 15 350 15 351 15
16 353 14 354 15 356 14
17 357 14 359 14 360 14
18 362 14 364 14 364 14
19 366 14 368 14 369 14
20 370 14 373 14 373 14
21 374 14 377 14 377 14
22 379 14 381 14 381 14
23 383 14 385 14 385 14
24 387 14 390 14 389 13
25 391 14 394 14 393 13
26 395 14 398 14 398 13
27 399 14 402 14 402 14
28 403 14 406 14 406 14
29 408 14 411 14 410 14
30 412 14 415 14 414 14
31 416 14 419 14 418 14
32 421 14 424 14 423 14
33 425 14 429 14 427 14
34 430 15 433 15 431 14
35 435 15 438 15 436 15
36 440 15 443 15 441 15
37 445 16 448 15 446 15
38 451 16 454 16 451 16
39 456 16 459 16 457 16
40 463 17 465 17 463 17
41 469 18 472 17 469 17
42 477 19 479 18 476 18
43 485 20 487 19 483 19
44 494 21 495 20 492 20
45 504 22 505 22 501 22
46 517 25 517 24 513 24
47 532 28 532 27 527 27
48 553 34 551 33 547 33
49 587 46 584 46 579 46
50 600 600 600

Virginia Standards of Learning Assessments Technical Report 2013–2014 Administration Cycle
97
Table 2.5.24 RSSS Conversions for EOC Chemistry
Raw Score
Online
Core 1 Core 2 Core 3
SS SEM SS SEM SS SEM
0 0 0 0
1 202 46 219 45 217 45
2 235 33 251 32 249 32
3 256 28 270 27 269 27
4 271 24 284 23 283 24
5 283 22 296 21 294 21
6 293 21 305 20 304 20
7 302 19 313 19 312 19
8 311 18 321 18 320 18
9 318 18 328 17 327 17
10 325 17 334 16 333 16
11 331 17 340 16 339 16
12 337 16 345 15 344 15
13 343 16 350 15 349 15
14 348 15 355 15 354 15
15 354 15 360 14 359 14
16 359 15 364 14 364 14
17 364 15 369 14 368 14
18 368 14 373 14 373 14
19 373 14 377 14 377 14
20 378 14 382 14 381 14
21 382 14 386 13 385 14
22 387 14 390 13 390 13
23 391 14 394 13 394 13
24 395 14 398 13 398 13
25 400 14 402 13 402 13
26 404 14 406 13 406 13
27 409 14 410 13 410 13
28 413 14 414 13 414 13
29 417 14 418 13 418 14
30 422 14 422 14 422 14
31 426 14 426 14 427 14
32 431 14 430 14 431 14
33 436 14 435 14 435 14
34 440 15 439 14 440 14
35 445 15 444 14 445 15
36 450 15 449 15 450 15
37 456 15 454 15 455 15
38 461 16 459 15 460 16
39 467 16 465 16 466 16
40 473 17 470 16 472 17
41 480 17 477 17 478 17
42 487 18 484 18 485 18
43 495 19 491 19 493 19
44 504 20 500 20 502 20
45 514 22 509 21 512 22
46 526 24 521 24 523 24
47 541 27 535 27 538 27
48 561 33 554 32 558 33
49 593 45 587 45 591 45
50 600 600 600

Virginia Standards of Learning Assessments Technical Report 2013–2014 Administration Cycle
98
Table 2.5.25 RSSS Conversions for EOC Algebra I
Raw Score
Online
Core 1 Core 2 Core 3
SS SEM SS SEM SS SEM
0 0 0 0
1 239 39 242 39 240 39
2 267 28 270 28 268 28
3 284 23 287 23 285 23
4 297 21 299 21 298 21
5 307 19 309 19 307 19
6 315 17 318 17 316 17
7 323 16 325 16 323 16
8 329 16 332 15 330 15
9 335 15 338 15 336 15
10 341 14 343 14 341 14
11 346 14 348 14 346 14
12 351 14 353 13 351 13
13 356 13 357 13 356 13
14 360 13 362 13 360 13
15 365 13 366 13 364 13
16 369 13 370 12 368 12
17 373 12 374 12 372 12
18 377 12 377 12 376 12
19 381 12 381 12 380 12
20 385 12 385 12 384 12
21 388 12 388 12 387 12
22 392 12 392 12 391 12
23 396 12 395 12 395 12
24 399 12 399 12 398 12
25 403 12 402 11 402 12
26 407 12 406 12 405 12
27 410 12 409 12 409 12
28 414 12 413 12 413 12
29 418 12 416 12 416 12
30 422 12 420 12 420 12
31 425 12 423 12 424 12
32 429 12 427 12 428 12
33 433 12 431 12 431 12
34 437 13 434 12 435 13
35 441 13 438 12 440 13
36 446 13 442 13 444 13
37 450 13 447 13 448 13
38 455 14 451 13 453 14
39 460 14 456 14 458 14
40 465 14 461 14 463 14
41 471 15 466 15 469 15
42 477 16 472 15 475 16
43 484 16 479 16 482 16
44 491 17 486 17 489 18
45 499 19 494 19 498 19
46 510 21 504 21 508 21
47 522 23 517 23 521 24
48 539 28 534 28 538 28
49 567 39 562 39 566 39
50 600 600 600

Virginia Standards of Learning Assessments Technical Report 2013–2014 Administration Cycle
99
Table 2.5.26 RSSS Conversions for EOC Geometry
Raw Score
Online
Core 1 Core 2 Core 3
SS SEM SS SEM SS SEM
0 0 0 0
1 217 44 225 44 224 44
2 249 32 256 31 255 31
3 268 26 274 26 274 26
4 282 23 288 23 288 23
5 294 21 299 21 299 21
6 303 20 308 19 308 19
7 312 18 316 18 316 18
8 319 18 323 17 323 17
9 326 17 330 16 330 16
10 333 16 336 16 336 16
11 338 16 341 15 342 15
12 344 15 347 15 347 15
13 349 15 352 14 352 15
14 354 15 356 14 357 14
15 359 14 361 14 362 14
16 364 14 366 14 366 14
17 368 14 370 14 370 14
18 373 14 374 13 375 13
19 377 14 378 13 379 13
20 381 13 382 13 383 13
21 386 13 386 13 387 13
22 390 13 390 13 391 13
23 394 13 394 13 395 13
24 398 13 398 13 399 13
25 402 13 402 13 403 13
26 406 13 406 13 407 13
27 410 13 410 13 411 13
28 414 13 414 13 415 13
29 418 13 418 13 419 13
30 423 13 423 13 423 13
31 427 14 427 14 427 14
32 431 14 431 14 432 14
33 436 14 436 14 436 14
34 440 14 440 14 441 14
35 445 14 445 14 445 14
36 450 15 450 15 450 15
37 455 15 455 15 455 15
38 460 15 460 15 461 15
39 466 16 466 16 466 16
40 471 16 472 16 472 16
41 478 17 478 17 479 17
42 485 18 485 18 486 18
43 492 18 492 19 494 19
44 501 20 501 20 502 20
45 510 21 511 21 512 21
46 522 23 522 23 524 24
47 536 26 536 26 539 27
48 555 32 555 32 559 32
49 587 44 587 44 591 44
50 600 600 600

Virginia Standards of Learning Assessments Technical Report 2013–2014 Administration Cycle
100
Table 2.5.27 RSSS Conversions for EOC Algebra II
Raw Score
Online
Core 1 Core 2 Core 3
SS SEM SS SEM SS SEM
0 0 0 0
1 161 55 168 55 167 55
2 201 40 207 40 207 40
3 225 33 231 33 231 33
4 242 29 249 29 249 29
5 256 26 263 26 263 27
6 268 24 275 25 276 25
7 278 23 286 23 286 23
8 288 22 295 22 296 22
9 296 21 304 21 305 21
10 304 20 312 20 313 20
11 311 19 319 20 320 20
12 318 19 326 19 327 19
13 324 18 333 19 334 19
14 331 18 339 18 340 18
15 337 18 346 18 346 18
16 342 17 352 18 352 18
17 348 17 357 18 358 18
18 353 17 363 17 364 17
19 359 17 369 17 369 17
20 364 17 374 17 375 17
21 369 17 379 17 380 17
22 374 17 385 17 385 17
23 379 16 390 17 390 17
24 384 16 395 17 395 17
25 389 16 400 17 401 17
26 394 16 406 17 406 17
27 399 17 411 17 411 17
28 404 17 416 17 416 17
29 409 17 421 17 421 17
30 415 17 427 17 427 17
31 420 17 432 17 432 17
32 425 17 438 17 437 17
33 431 17 443 18 443 17
34 437 18 449 18 449 18
35 442 18 455 18 454 18
36 448 18 461 18 460 18
37 455 19 468 19 467 19
38 461 19 475 19 473 19
39 468 20 482 20 480 20
40 476 20 489 21 487 20
41 484 21 497 21 495 21
42 492 22 506 22 504 22
43 502 23 516 23 513 23
44 513 25 527 25 523 24
45 525 27 539 27 535 26
46 539 29 554 30 549 29
47 557 33 572 33 567 33
48 582 40 597 40 591 40
49 600 600 600
50 600 600 600

Virginia Standards of Learning Assessments Technical Report 2013–2014 Administration Cycle
101
Table 2.5.28 RSSS Conversions for EOC Virginia and U.S. History
Raw Score
Online
Core 1 Core 2 Core 3
SS SEM SS SEM SS SEM
0 0 0 0
1 193 46 204 46 198 46
2 226 33 237 33 230 33
3 245 27 256 27 250 27
4 260 24 270 24 264 24
5 271 22 282 22 276 22
6 281 20 291 20 285 20
7 289 19 300 19 293 19
8 296 18 307 18 301 18
9 303 17 314 17 308 17
10 309 16 320 16 314 16
11 315 16 326 16 319 16
12 320 15 331 15 325 15
13 325 15 336 15 330 15
14 330 15 341 15 334 15
15 334 14 346 14 339 14
16 339 14 350 14 343 14
17 343 14 354 14 348 14
18 347 14 358 14 352 14
19 351 13 362 13 356 13
20 355 13 366 13 360 13
21 359 13 370 13 364 13
22 363 13 374 13 367 13
23 366 13 377 13 371 13
24 370 13 381 13 375 13
25 374 13 385 13 378 13
26 377 13 388 13 382 13
27 381 13 392 13 385 13
28 384 13 395 13 389 13
29 388 13 399 13 392 13
30 391 13 402 13 396 13
31 395 13 405 13 399 13
32 398 13 409 13 403 13
33 402 13 412 13 406 13
34 406 13 416 13 410 13
35 409 13 420 13 414 13
36 413 13 423 13 417 13
37 417 13 427 13 421 13
38 420 13 430 13 425 13
39 424 13 434 13 428 13
40 428 13 438 13 432 13
41 432 14 442 13 436 14
42 436 14 446 14 440 14
43 440 14 450 14 445 14
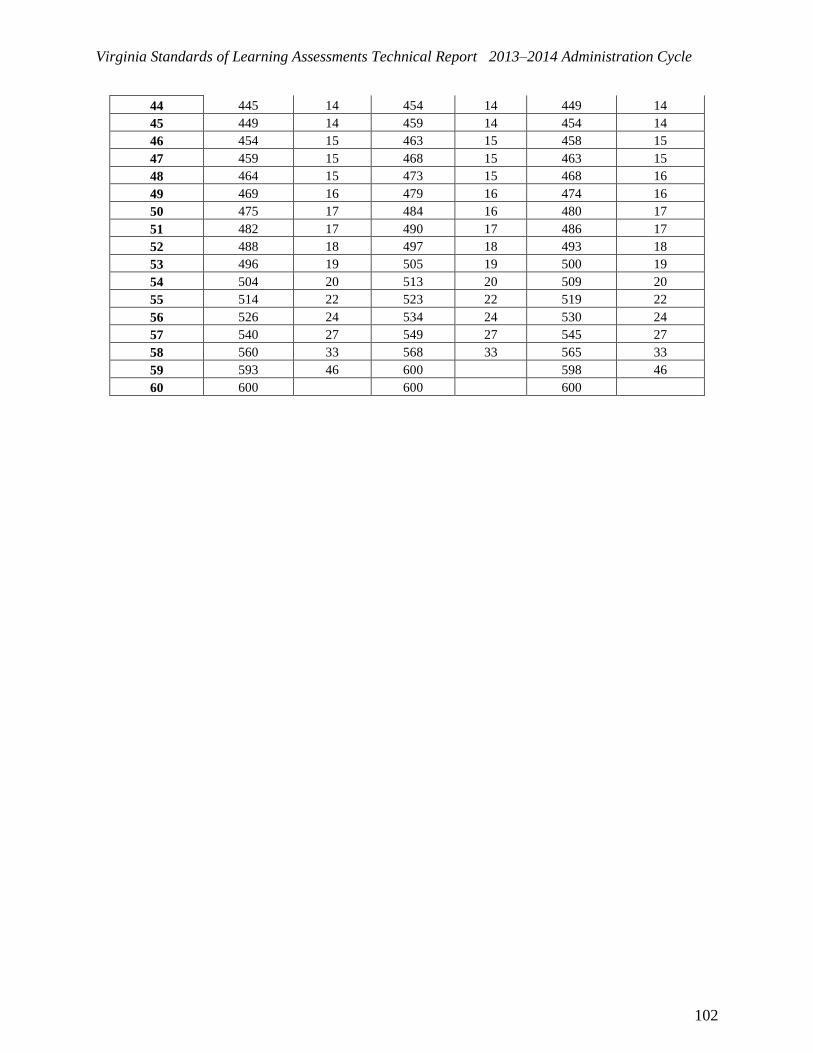
Virginia Standards of Learning Assessments Technical Report 2013–2014 Administration Cycle
102
44 445 14 454 14 449 14
45 449 14 459 14 454 14
46 454 15 463 15 458 15
47 459 15 468 15 463 15
48 464 15 473 15 468 16
49 469 16 479 16 474 16
50 475 17 484 16 480 17
51 482 17 490 17 486 17
52 488 18 497 18 493 18
53 496 19 505 19 500 19
54 504 20 513 20 509 20
55 514 22 523 22 519 22
56 526 24 534 24 530 24
57 540 27 549 27 545 27
58 560 33 568 33 565 33
59 593 46 600 598 46
60 600 600 600

Virginia Standards of Learning Assessments Technical Report 2013–2014 Administration Cycle
103
Table 2.5.29 RSSS Conversions for EOC World History I
Raw Score
Online
Core 1 Core 2 Core 3
SS SEM SS SEM SS SEM
0 0 0 0
1 195 47 190 47 191 47
2 229 34 224 34 225 34
3 249 28 244 28 246 28
4 264 25 259 25 261 25
5 276 23 271 23 273 23
6 286 21 281 21 283 21
7 295 20 290 20 292 20
8 303 19 298 19 300 19
9 310 18 305 18 307 18
10 317 17 312 17 313 17
11 323 17 318 17 319 17
12 328 16 323 16 325 16
13 334 16 329 16 330 16
14 339 15 334 15 335 15
15 344 15 339 15 340 15
16 348 15 343 15 345 15
17 353 14 348 14 349 14
18 357 14 352 14 354 14
19 361 14 356 14 358 14
20 365 14 360 14 362 14
21 369 14 365 14 366 14
22 373 13 368 14 370 13
23 377 13 372 13 374 13
24 381 13 376 13 378 13
25 385 13 380 13 381 13
26 389 13 384 13 385 13
27 392 13 387 13 389 13
28 396 13 391 13 392 13
29 400 13 395 13 396 13
30 403 13 398 13 400 13
31 407 13 402 13 403 13
32 410 13 406 13 407 13
33 414 13 409 13 410 13
34 418 13 413 13 414 13
35 421 13 417 13 418 13
36 425 13 420 13 421 13
37 429 13 424 13 425 13
38 433 13 428 13 429 13
39 437 14 432 14 433 13
40 441 14 436 14 437 14
41 445 14 440 14 441 14
42 449 14 444 14 445 14
43 453 14 448 14 449 14

Virginia Standards of Learning Assessments Technical Report 2013–2014 Administration Cycle
104
44 457 14 453 14 453 14
45 462 15 457 15 458 15
46 467 15 462 15 462 15
47 472 15 467 15 467 15
48 477 16 472 16 473 16
49 482 16 478 16 478 16
50 488 17 484 17 484 17
51 495 18 490 18 490 18
52 502 18 497 18 497 18
53 509 19 504 19 505 19
54 518 21 513 21 513 21
55 528 22 523 22 523 22
56 539 25 534 25 535 25
57 554 28 549 28 550 28
58 574 34 569 34 570 34
59 600 600 600
60 600 600 600

Virginia Standards of Learning Assessments Technical Report 2013–2014 Administration Cycle
105
Table 2.5.30 RSSS Conversions for EOC World History II
Raw Score
Online
Core 1 Core 2 Core 3
SS SEM SS SEM SS SEM
0 0 0 0
1 190 50 182 50 182 50
2 226 36 217 36 218 36
3 247 29 238 29 239 30
4 262 26 253 26 254 26
5 274 23 265 23 267 23
6 284 22 276 22 277 22
7 293 20 284 20 286 20
8 301 19 292 19 294 19
9 308 18 299 18 301 18
10 315 17 306 17 307 18
11 321 17 312 17 313 17
12 326 16 317 16 319 16
13 331 16 322 16 324 16
14 336 15 327 15 330 16
15 341 15 332 15 334 15
16 346 15 337 15 339 15
17 350 15 341 15 343 15
18 354 14 345 14 348 14
19 358 14 349 14 352 14
20 362 14 353 14 356 14
21 366 14 357 14 360 14
22 370 14 361 14 364 14
23 374 14 365 14 368 14
24 378 13 369 13 371 14
25 381 13 372 13 375 14
26 385 13 376 13 379 13
27 389 13 379 13 383 13
28 392 13 383 13 386 13
29 396 13 387 13 390 13
30 399 13 390 13 393 13
31 403 13 394 13 397 13
32 406 13 397 13 400 13
33 410 13 401 13 404 13
34 414 13 404 13 408 13
35 417 13 408 13 411 13
36 421 14 412 13 415 14
37 425 14 415 14 419 14
38 428 14 419 14 423 14
39 432 14 423 14 426 14
40 436 14 427 14 430 14
41 440 14 431 14 434 14
42 444 14 435 14 439 14
43 449 15 439 15 443 15

Virginia Standards of Learning Assessments Technical Report 2013–2014 Administration Cycle
106
44 453 15 443 15 447 15
45 458 15 448 15 452 15
46 462 16 453 15 456 15
47 467 16 458 16 461 16
48 473 16 463 16 467 16
49 478 17 468 17 472 17
50 484 18 474 17 478 17
51 491 18 481 18 485 18
52 498 19 488 19 492 19
53 506 20 495 20 500 20
54 515 22 504 22 508 22
55 525 23 514 23 518 23
56 537 26 526 26 531 26
57 552 30 542 29 546 29
58 574 36 563 36 567 36
59 600 598 50 600
60 600 600 600
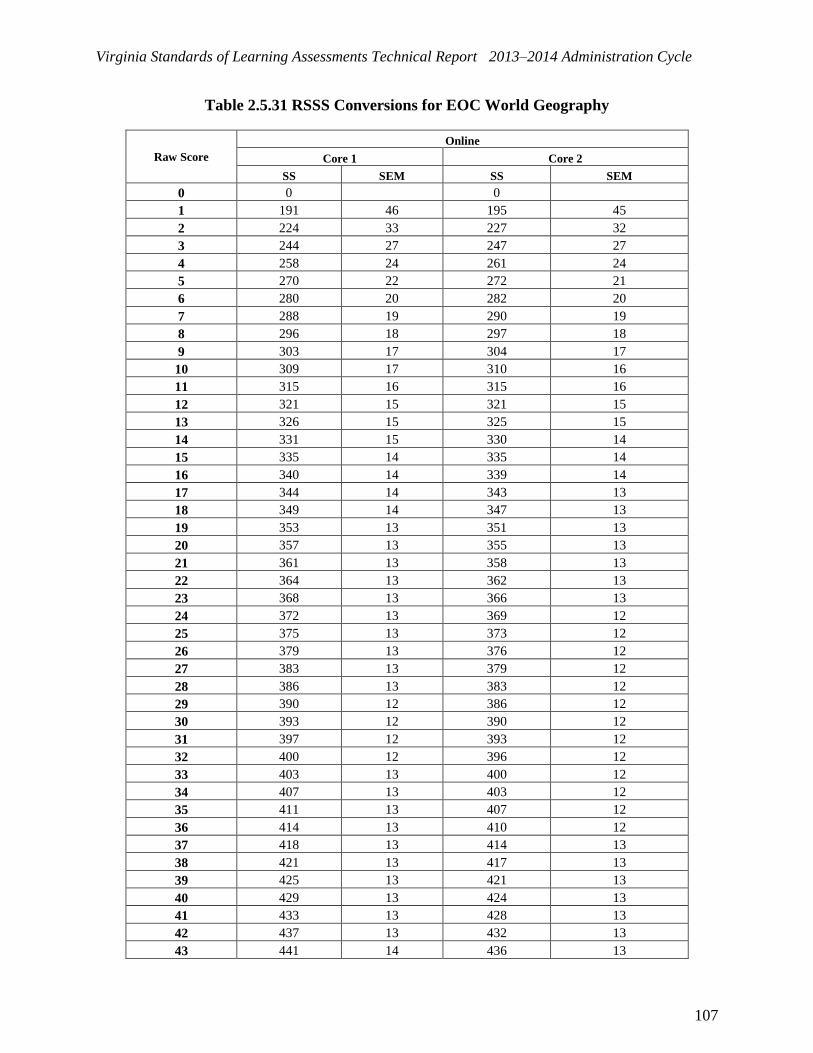
Virginia Standards of Learning Assessments Technical Report 2013–2014 Administration Cycle
107
Table 2.5.31 RSSS Conversions for EOC World Geography
Raw Score
Online
Core 1 Core 2
SS SEM SS SEM
0 0 0
1 191 46 195 45
2 224 33 227 32
3 244 27 247 27
4 258 24 261 24
5 270 22 272 21
6 280 20 282 20
7 288 19 290 19
8 296 18 297 18
9 303 17 304 17
10 309 17 310 16
11 315 16 315 16
12 321 15 321 15
13 326 15 325 15
14 331 15 330 14
15 335 14 335 14
16 340 14 339 14
17 344 14 343 13
18 349 14 347 13
19 353 13 351 13
20 357 13 355 13
21 361 13 358 13
22 364 13 362 13
23 368 13 366 13
24 372 13 369 12
25 375 13 373 12
26 379 13 376 12
27 383 13 379 12
28 386 13 383 12
29 390 12 386 12
30 393 12 390 12
31 397 12 393 12
32 400 12 396 12
33 403 13 400 12
34 407 13 403 12
35 411 13 407 12
36 414 13 410 12
37 418 13 414 13
38 421 13 417 13
39 425 13 421 13
40 429 13 424 13
41 433 13 428 13
42 437 13 432 13
43 441 14 436 13

Virginia Standards of Learning Assessments Technical Report 2013–2014 Administration Cycle
108
44 445 14 440 14
45 449 14 445 14
46 454 14 449 14
47 459 15 454 15
48 464 15 459 15
49 469 16 464 16
50 475 16 470 16
51 481 17 476 17
52 487 18 482 18
53 495 19 489 19
54 503 20 498 20
55 512 21 507 21
56 524 24 518 24
57 538 27 532 27
58 557 33 552 32
59 590 45 584 45
60 600 600

Virginia Standards of Learning Assessments Technical Report 2013–2014 Administration Cycle
109
Table 2.5.32 RSSS Conversions for Grade 3 VMAST Reading
Raw Score
Online
Core 2
SS SEM
0 0
1 160 60
2 203 43
3 229 36
4 249 32
5 265 29
6 278 27
7 290 26
8 301 25
9 311 24
10 321 23
11 330 23
12 338 22
13 347 22
14 355 22
15 363 22
16 371 22
17 379 22
18 388 22
19 396 22
20 404 22
21 413 23
22 422 23
23 432 24
24 442 25
25 453 26
26 465 27
27 479 29
28 495 32
29 515 36
30 542 43
31 585 60
32 600
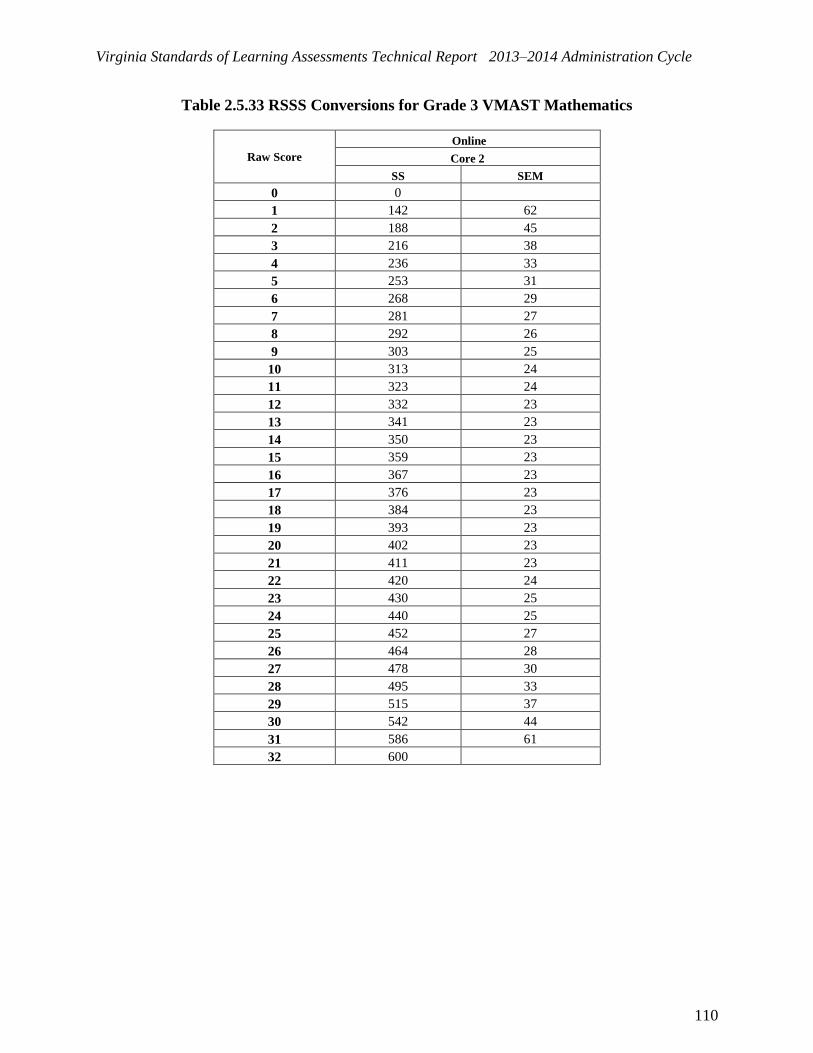
Virginia Standards of Learning Assessments Technical Report 2013–2014 Administration Cycle
110
Table 2.5.33 RSSS Conversions for Grade 3 VMAST Mathematics
Raw Score
Online
Core 2
SS SEM
0 0
1 142 62
2 188 45
3 216 38
4 236 33
5 253 31
6 268 29
7 281 27
8 292 26
9 303 25
10 313 24
11 323 24
12 332 23
13 341 23
14 350 23
15 359 23
16 367 23
17 376 23
18 384 23
19 393 23
20 402 23
21 411 23
22 420 24
23 430 25
24 440 25
25 452 27
26 464 28
27 478 30
28 495 33
29 515 37
30 542 44
31 586 61
32 600

Virginia Standards of Learning Assessments Technical Report 2013–2014 Administration Cycle
111
Table 2.5.34 RSSS Conversions for Grade 4 VMAST Reading
Raw Score
Online
Core 2
SS SEM
0 0
1 169 61
2 213 44
3 239 37
4 259 32
5 276 30
6 289 28
7 301 26
8 313 25
9 323 24
10 332 24
11 342 23
12 350 23
13 359 22
14 367 22
15 375 22
16 384 22
17 392 22
18 400 22
19 409 23
20 417 23
21 426 23
22 436 24
23 446 25
24 456 26
25 468 27
26 481 28
27 495 30
28 512 33
29 533 37
30 561 45
31 600
32 600
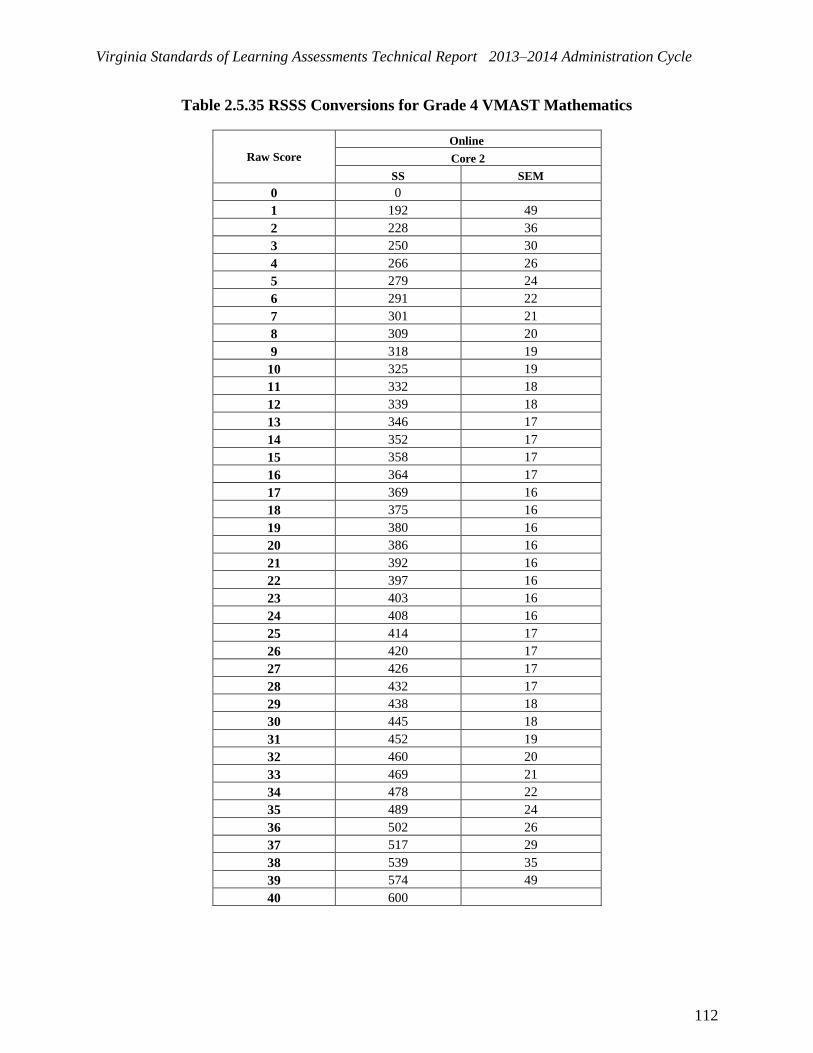
Virginia Standards of Learning Assessments Technical Report 2013–2014 Administration Cycle
112
Table 2.5.35 RSSS Conversions for Grade 4 VMAST Mathematics
Raw Score
Online
Core 2
SS SEM
0 0
1 192 49
2 228 36
3 250 30
4 266 26
5 279 24
6 291 22
7 301 21
8 309 20
9 318 19
10 325 19
11 332 18
12 339 18
13 346 17
14 352 17
15 358 17
16 364 17
17 369 16
18 375 16
19 380 16
20 386 16
21 392 16
22 397 16
23 403 16
24 408 16
25 414 17
26 420 17
27 426 17
28 432 17
29 438 18
30 445 18
31 452 19
32 460 20
33 469 21
34 478 22
35 489 24
36 502 26
37 517 29
38 539 35
39 574 49
40 600
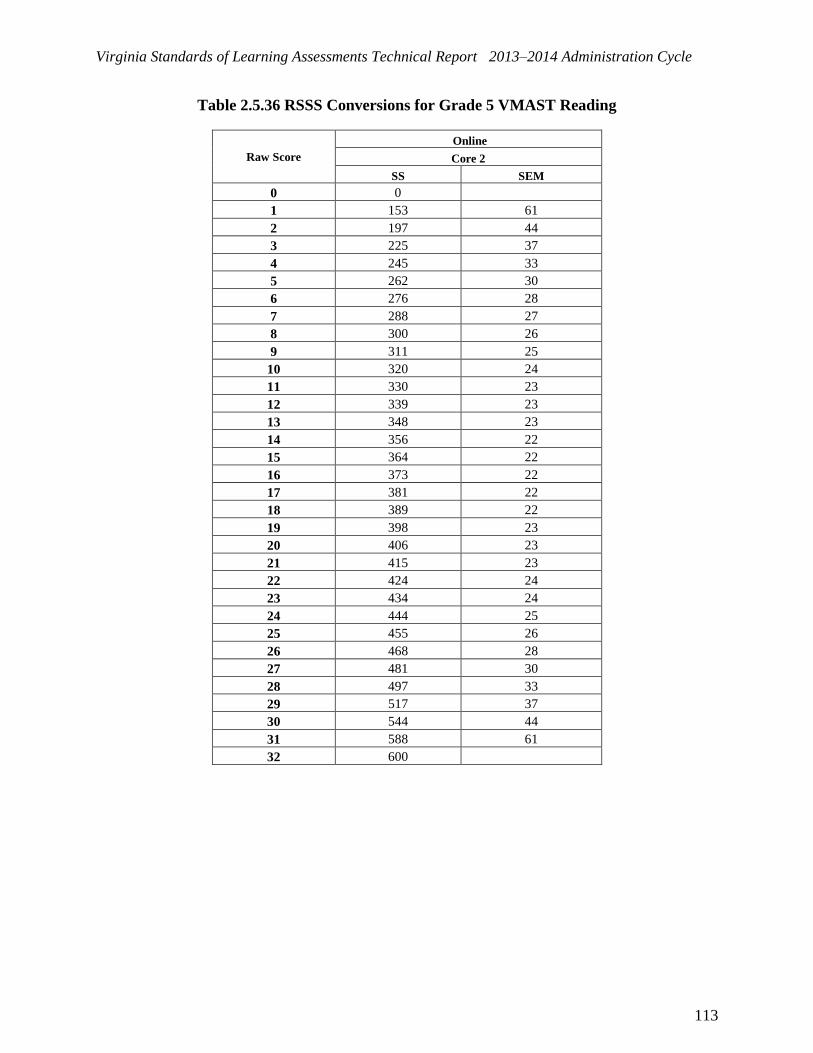
Virginia Standards of Learning Assessments Technical Report 2013–2014 Administration Cycle
113
Table 2.5.36 RSSS Conversions for Grade 5 VMAST Reading
Raw Score
Online
Core 2
SS SEM
0 0
1 153 61
2 197 44
3 225 37
4 245 33
5 262 30
6 276 28
7 288 27
8 300 26
9 311 25
10 320 24
11 330 23
12 339 23
13 348 23
14 356 22
15 364 22
16 373 22
17 381 22
18 389 22
19 398 23
20 406 23
21 415 23
22 424 24
23 434 24
24 444 25
25 455 26
26 468 28
27 481 30
28 497 33
29 517 37
30 544 44
31 588 61
32 600

Virginia Standards of Learning Assessments Technical Report 2013–2014 Administration Cycle
114
Table 2.5.37 RSSS Conversions for Grade 5 VMAST Mathematics
Raw Score
Online
Core 2
SS SEM
0 0
1 86 69
2 136 50
3 166 41
4 188 36
5 206 33
6 221 31
7 235 29
8 247 28
9 258 27
10 268 26
11 277 25
12 286 24
13 295 24
14 303 24
15 311 23
16 319 23
17 327 23
18 335 23
19 342 23
20 350 23
21 357 23
22 365 23
23 373 23
24 380 23
25 388 23
26 396 24
27 405 24
28 413 24
29 423 25
30 432 26
31 442 27
32 453 28
33 465 29
34 479 31
35 494 33
36 512 36
37 534 41
38 564 50
39 600
40 600

Virginia Standards of Learning Assessments Technical Report 2013–2014 Administration Cycle
115
Table 2.5.38 RSSS Conversions for Grade 6 VMAST Reading
Raw Score
Online
Core 2
SS SEM
0 0
1 178 52
2 216 37
3 238 31
4 255 28
5 269 25
6 280 23
7 290 22
8 299 21
9 308 20
10 316 20
11 323 19
12 330 19
13 337 18
14 343 18
15 350 18
16 356 18
17 362 18
18 368 18
19 374 18
20 380 18
21 387 18
22 393 18
23 400 18
24 406 19
25 413 19
26 421 20
27 429 20
28 437 21
29 446 22
30 456 23
31 468 25
32 481 28
33 498 31
34 521 37
35 558 52
36 600

Virginia Standards of Learning Assessments Technical Report 2013–2014 Administration Cycle
116
Table 2.5.39 RSSS Conversions for Grade 6 VMAST Mathematics
Raw Score
Online
Core 2
SS SEM
0 0
1 141 58
2 184 42
3 210 35
4 230 31
5 245 29
6 259 27
7 271 25
8 281 24
9 291 23
10 300 22
11 309 22
12 317 21
13 325 21
14 332 20
15 339 20
16 346 20
17 353 20
18 360 19
19 366 19
20 373 19
21 380 19
22 386 19
23 393 19
24 399 19
25 406 20
26 413 20
27 420 20
28 428 21
29 435 21
30 443 22
31 452 22
32 461 23
33 471 24
34 482 26
35 495 28
36 510 30
37 528 34
38 553 41
39 595 58
40 600

Virginia Standards of Learning Assessments Technical Report 2013–2014 Administration Cycle
117
Table 2.5.40 RSSS Conversions for Grade 7 VMAST Reading
Raw Score
Online
Core 2
SS SEM
0 0
1 163 59
2 206 43
3 232 36
4 251 32
5 267 29
6 280 27
7 291 25
8 302 24
9 312 23
10 321 22
11 329 22
12 337 21
13 345 21
14 352 21
15 360 20
16 367 20
17 374 20
18 381 20
19 388 20
20 395 20
21 402 20
22 409 21
23 417 21
24 424 21
25 432 22
26 441 22
27 450 23
28 459 24
29 469 25
30 481 27
31 494 29
32 509 31
33 528 35
34 554 43
35 597 59
36 600

Virginia Standards of Learning Assessments Technical Report 2013–2014 Administration Cycle
118
Table 2.5.41 RSSS Conversions for Grade 7 VMAST Mathematics
Raw Score
Online
Core 2
SS SEM
0 0
1 157 60
2 200 43
3 227 36
4 246 32
5 262 29
6 276 27
7 287 26
8 298 24
9 308 24
10 317 23
11 326 22
12 334 22
13 341 21
14 349 21
15 356 21
16 363 20
17 370 20
18 377 20
19 384 20
20 391 20
21 397 20
22 404 20
23 411 20
24 418 20
25 425 20
26 432 21
27 439 21
28 447 21
29 455 22
30 463 23
31 472 23
32 482 24
33 492 25
34 504 27
35 517 29
36 533 32
37 552 36
38 578 43
39 600
40 600

Virginia Standards of Learning Assessments Technical Report 2013–2014 Administration Cycle
119
Table 2.5.42 RSSS Conversions for Grade 8 VMAST Reading
Raw Score
Online
Core 2
SS SEM
0 0
1 103 69
2 153 50
3 183 41
4 205 37
5 223 33
6 239 31
7 252 29
8 264 28
9 275 27
10 286 26
11 296 25
12 305 25
13 314 25
14 323 24
15 331 24
16 340 24
17 348 24
18 356 24
19 364 24
20 373 24
21 381 24
22 390 24
23 399 25
24 408 25
25 417 26
26 427 26
27 438 27
28 449 28
29 462 30
30 475 31
31 491 34
32 510 37
33 532 42
34 563 50
35 600
36 600

Virginia Standards of Learning Assessments Technical Report 2013–2014 Administration Cycle
120
Table 2.5.43 RSSS Conversions for Grade 8 VMAST Mathematics
Raw Score
Online
Core 2
SS SEM
0 0
1 140 59
2 183 43
3 210 36
4 230 32
5 245 29
6 259 27
7 271 25
8 282 24
9 291 23
10 300 22
11 309 22
12 317 21
13 325 21
14 332 21
15 340 20
16 347 20
17 354 20
18 360 20
19 367 20
20 374 20
21 381 20
22 388 20
23 394 20
24 401 20
25 409 20
26 416 21
27 424 21
28 431 22
29 440 22
30 449 23
31 458 24
32 468 25
33 480 26
34 492 28
35 507 31
36 525 34
37 549 39
38 582 49
39 600
40 600

Virginia Standards of Learning Assessments Technical Report 2013–2014 Administration Cycle
121
Table 2.5.44 RSSS Conversions for EOC VMAST Reading
Raw Score
Online
Core 3
SS SEM
0 0
1 167 56
2 207 40
3 231 33
4 249 29
5 263 27
6 275 25
7 286 23
8 295 22
9 304 21
10 312 21
11 319 20
12 326 19
13 333 19
14 340 19
15 346 18
16 352 18
17 358 18
18 363 18
19 369 18
20 375 17
21 380 17
22 386 17
23 391 17
24 397 17
25 402 17
26 408 18
27 414 18
28 420 18
29 426 18
30 432 18
31 438 19
32 445 19
33 452 20
34 459 20
35 467 21
36 475 22
37 485 23
38 495 25
39 507 26
40 521 29
41 539 33
42 563 40
43 600
44 600

Virginia Standards of Learning Assessments Technical Report 2013–2014 Administration Cycle
122
Table 2.5.45 RSSS Conversions for EOC VMAST Algebra I
Raw Score
Online
Core 3
SS SEM
0 0
1 167 53
2 205 38
3 228 31
4 245 28
5 258 25
6 270 23
7 280 22
8 289 21
9 297 20
10 305 19
11 312 19
12 318 18
13 325 18
14 331 18
15 337 18
16 343 17
17 349 17
18 354 17
19 360 17
20 366 17
21 371 17
22 377 17
23 383 17
24 389 17
25 394 18
26 401 18
27 407 18
28 413 19
29 420 19
30 427 20
31 435 20
32 443 21
33 452 22
34 463 24
35 474 25
36 488 28
37 505 32
38 528 38
39 566 53
40 600
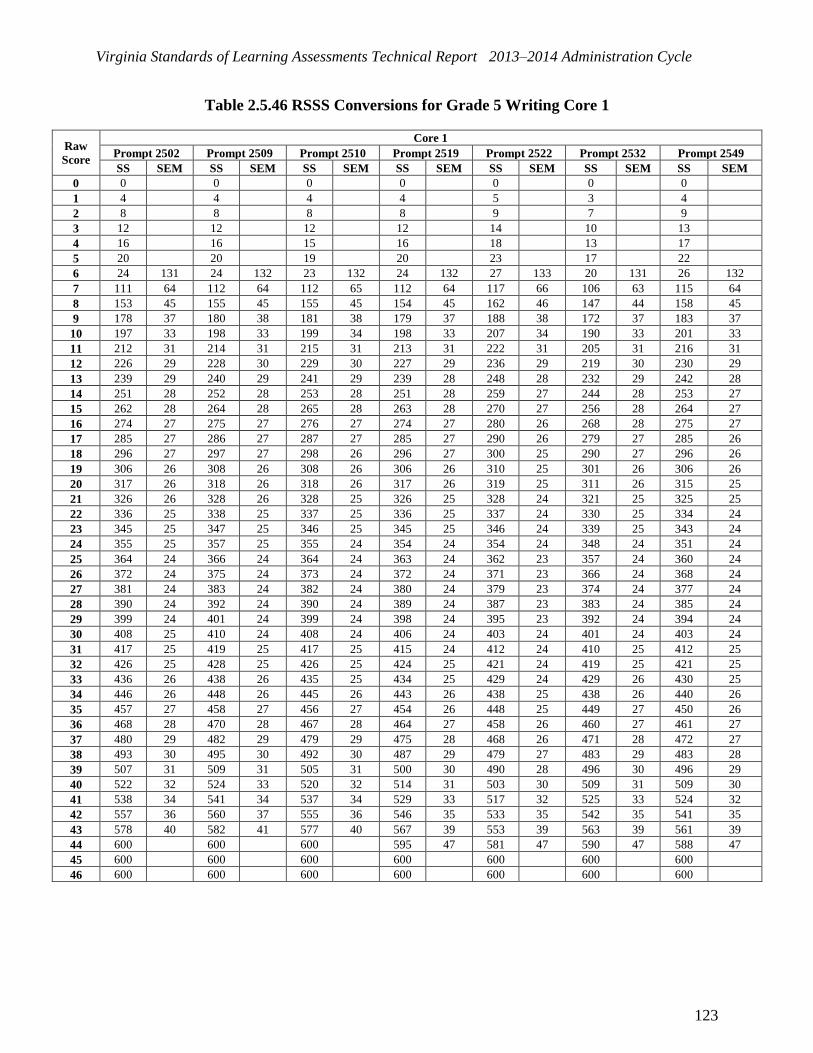
Virginia Standards of Learning Assessments Technical Report 2013–2014 Administration Cycle
123
Table 2.5.46 RSSS Conversions for Grade 5 Writing Core 1
Raw
Score
Core 1
Prompt 2502 Prompt 2509 Prompt 2510 Prompt 2519 Prompt 2522 Prompt 2532 Prompt 2549
SS SEM SS SEM SS SEM SS SEM SS SEM SS SEM SS SEM
0 0 0 0 0 0 0 0
1 4 4 4 4 5 3 4
2 8 8 8 8 9 7 9
3 12 12 12 12 14 10 13
4 16 16 15 16 18 13 17
5 20 20 19 20 23 17 22
6 24 131 24 132 23 132 24 132 27 133 20 131 26 132
7 111 64 112 64 112 65 112 64 117 66 106 63 115 64
8 153 45 155 45 155 45 154 45 162 46 147 44 158 45
9 178 37 180 38 181 38 179 37 188 38 172 37 183 37
10 197 33 198 33 199 34 198 33 207 34 190 33 201 33
11 212 31 214 31 215 31 213 31 222 31 205 31 216 31
12 226 29 228 30 229 30 227 29 236 29 219 30 230 29
13 239 29 240 29 241 29 239 28 248 28 232 29 242 28
14 251 28 252 28 253 28 251 28 259 27 244 28 253 27
15 262 28 264 28 265 28 263 28 270 27 256 28 264 27
16 274 27 275 27 276 27 274 27 280 26 268 28 275 27
17 285 27 286 27 287 27 285 27 290 26 279 27 285 26
18 296 27 297 27 298 26 296 27 300 25 290 27 296 26
19 306 26 308 26 308 26 306 26 310 25 301 26 306 26
20 317 26 318 26 318 26 317 26 319 25 311 26 315 25
21 326 26 328 26 328 25 326 25 328 24 321 25 325 25
22 336 25 338 25 337 25 336 25 337 24 330 25 334 24
23 345 25 347 25 346 25 345 25 346 24 339 25 343 24
24 355 25 357 25 355 24 354 24 354 24 348 24 351 24
25 364 24 366 24 364 24 363 24 362 23 357 24 360 24
26 372 24 375 24 373 24 372 24 371 23 366 24 368 24
27 381 24 383 24 382 24 380 24 379 23 374 24 377 24
28 390 24 392 24 390 24 389 24 387 23 383 24 385 24
29 399 24 401 24 399 24 398 24 395 23 392 24 394 24
30 408 25 410 24 408 24 406 24 403 24 401 24 403 24
31 417 25 419 25 417 25 415 24 412 24 410 25 412 25
32 426 25 428 25 426 25 424 25 421 24 419 25 421 25
33 436 26 438 26 435 25 434 25 429 24 429 26 430 25
34 446 26 448 26 445 26 443 26 438 25 438 26 440 26
35 457 27 458 27 456 27 454 26 448 25 449 27 450 26
36 468 28 470 28 467 28 464 27 458 26 460 27 461 27
37 480 29 482 29 479 29 475 28 468 26 471 28 472 27
38 493 30 495 30 492 30 487 29 479 27 483 29 483 28
39 507 31 509 31 505 31 500 30 490 28 496 30 496 29
40 522 32 524 33 520 32 514 31 503 30 509 31 509 30
41 538 34 541 34 537 34 529 33 517 32 525 33 524 32
42 557 36 560 37 555 36 546 35 533 35 542 35 541 35
43 578 40 582 41 577 40 567 39 553 39 563 39 561 39
44 600 600 600 595 47 581 47 590 47 588 47
45 600 600 600 600 600 600 600
46 600 600 600 600 600 600 600

Virginia Standards of Learning Assessments Technical Report 2013–2014 Administration Cycle
124
Table 2.5.47 RSSS Conversions for Grade 5 Writing Core 2
Raw
Score
Core 2
Prompt 2502 Prompt 2509 Prompt 2510 Prompt 2519 Prompt 2522 Prompt 2532 Prompt 2549
SS SEM SS SEM SS SEM SS SEM SS SEM SS SEM SS SEM
0 0 0 0 0 0 0 0
1 5 5 5 5 6 4 5
2 10 10 10 10 11 9 11
3 15 15 15 15 17 13 16
4 19 19 19 20 22 17 21
5 24 24 24 25 28 22 27
6 29 130 29 131 29 131 30 131 33 132 26 129 32 131
7 115 63 115 63 116 64 116 63 121 65 109 62 118 63
8 156 44 157 45 157 45 157 44 164 45 149 44 160 44
9 180 37 181 37 182 37 181 37 189 37 173 37 184 37
10 198 33 199 33 200 33 199 33 207 33 191 33 202 33
11 213 30 214 31 215 31 213 30 222 30 206 31 216 30
12 226 29 227 29 228 29 226 29 235 29 219 29 229 29
13 238 28 240 28 241 28 239 28 247 27 231 28 241 27
14 249 27 251 27 252 27 250 27 258 26 243 28 252 27
15 260 27 262 27 263 27 261 27 268 26 255 27 263 26
16 271 27 273 27 274 26 272 27 278 25 266 27 273 26
17 282 26 283 26 284 26 282 26 287 25 276 27 283 26
18 292 26 294 26 294 26 292 26 297 25 287 26 292 25
19 302 26 304 26 304 26 302 26 306 25 297 26 302 25
20 312 25 314 26 314 25 312 25 315 24 307 25 311 25
21 322 25 323 25 323 25 322 25 324 24 316 25 320 24
22 331 25 333 25 332 25 331 25 332 24 326 25 329 24
23 340 25 342 25 341 24 340 24 341 24 334 24 338 24
24 349 24 351 24 350 24 349 24 349 23 343 24 346 24
25 358 24 360 24 359 24 358 24 357 23 352 24 354 24
26 367 24 369 24 367 24 366 24 365 23 360 24 363 24
27 375 24 378 24 376 24 375 24 373 23 369 24 371 24
28 384 24 386 24 384 24 383 24 381 23 377 24 380 24
29 393 24 395 24 393 24 392 24 390 23 386 24 388 24
30 402 25 404 25 402 24 401 24 398 24 395 24 397 24
31 411 25 413 25 411 25 410 25 407 24 404 25 406 25
32 421 25 423 25 420 25 419 25 415 24 413 25 415 25
33 430 26 432 26 430 26 428 25 424 25 423 26 425 25
34 441 26 442 26 440 26 438 26 433 25 433 26 434 26
35 451 27 453 27 450 27 448 26 443 25 443 27 445 27
36 463 28 465 28 462 28 459 27 453 26 454 27 456 27
37 475 29 477 29 474 29 470 28 463 27 466 28 467 28
38 488 30 490 30 487 30 483 29 474 27 478 29 479 29
39 502 31 504 32 501 31 496 30 486 28 491 30 491 29
40 518 33 520 33 516 33 510 31 498 30 505 31 505 31
41 535 34 537 35 533 34 525 33 513 32 520 33 520 32
42 553 36 556 37 551 37 542 35 529 34 538 35 536 35
43 575 40 579 41 573 40 563 39 549 39 559 39 557 39
44 600 600 600 591 47 576 47 586 47 584 47
45 600 600 600 600 600 600 600
46 600 600 600 600 600 600 600

Virginia Standards of Learning Assessments Technical Report 2013–2014 Administration Cycle
125
Table 2.5.48 RSSS Conversions for Grade 5 Writing Core 3
Raw
Score
Core 3
Prompt 2502 Prompt 2509 Prompt 2510 Prompt 2519 Prompt 2522 Prompt 2532 Prompt 2549
SS SEM SS SEM SS SEM SS SEM SS SEM SS SEM SS SEM
0 0 0 0 0 0 0 0
1 4 4 4 4 4 3 4
2 8 8 8 8 9 7 8
3 12 12 12 12 13 10 13
4 15 15 15 15 17 13 17
5 19 19 19 19 22 17 21
6 23 131 23 131 23 132 23 131 26 132 20 130 25 132
7 110 64 110 64 111 64 111 64 116 65 105 63 113 64
8 151 45 152 45 153 45 152 45 159 46 145 44 155 45
9 176 37 177 37 178 37 177 37 185 38 170 37 180 37
10 194 33 195 33 196 33 195 33 203 33 187 33 198 33
11 209 30 211 31 212 31 210 30 219 30 202 30 213 30
12 222 29 224 29 225 29 223 29 231 29 216 29 226 29
13 234 28 236 28 237 28 235 28 243 27 228 28 237 27
14 246 27 247 27 248 27 246 27 254 26 239 28 248 27
15 257 27 258 27 259 27 257 27 264 26 251 27 259 26
16 267 27 269 27 270 26 268 26 274 25 262 27 269 26
17 278 26 279 26 280 26 278 26 284 25 272 27 279 26
18 288 26 289 26 290 26 288 26 293 25 283 26 288 25
19 298 26 300 26 300 26 298 26 302 25 293 26 298 25
20 308 26 309 26 309 25 308 25 311 24 303 25 307 25
21 318 25 319 25 319 25 318 25 320 24 312 25 316 24
22 327 25 329 25 328 25 327 25 328 24 322 25 325 24
23 336 25 338 25 337 24 336 25 337 24 331 24 334 24
24 345 24 347 25 346 24 345 24 345 24 339 24 342 24
25 354 24 356 24 355 24 354 24 354 23 348 24 351 24
26 363 24 365 24 364 24 363 24 362 23 357 24 359 24
27 372 24 374 24 372 24 371 24 370 23 365 24 368 24
28 381 24 383 24 381 24 380 24 378 23 374 24 376 24
29 390 24 392 24 390 24 388 24 386 24 382 24 385 24
30 398 25 401 25 399 24 397 24 395 24 391 24 393 24
31 408 25 410 25 408 25 406 25 403 24 400 25 402 25
32 417 25 419 25 417 25 415 25 412 24 410 25 412 25
33 427 26 429 26 426 26 425 25 421 25 419 26 421 25
34 437 26 439 26 436 26 435 26 430 25 429 26 431 26
35 448 27 450 27 447 27 445 26 440 25 440 27 441 26
36 459 28 461 28 458 28 455 27 449 26 451 27 452 27
37 471 29 473 29 470 29 467 28 460 27 462 28 463 28
38 484 30 486 30 483 30 479 29 471 27 474 29 475 29
39 499 31 500 32 497 31 492 30 482 28 487 30 488 29
40 514 33 516 33 512 33 506 31 495 30 501 31 501 31
41 531 34 533 35 529 34 521 33 509 32 517 33 516 32
42 550 37 553 37 548 37 539 35 525 34 534 35 533 35
43 571 40 575 41 570 40 560 39 545 39 555 39 553 39
44 599 47 600 598 47 587 47 571 46 582 47 580 46
45 600 600 600 600 600 600 600
46 600 600 600 600 600 600 600

Virginia Standards of Learning Assessments Technical Report 2013–2014 Administration Cycle
126
Table 2.5.49 RSSS Conversions for Grade 8 Writing Core 1
Raw
Score
Core 1
Prompt 2806 Prompt 2810 Prompt 2812 Prompt 2813 Prompt 2819 Prompt 2849 Prompt 2852
SS SEM SS SEM SS SEM SS SEM SS SEM SS SEM SS SEM
0 0 0 0 0 0 0 0
1 13 13 12 12 12 13 13
2 26 26 24 24 24 27 25
3 39 40 37 36 36 40 38
4 52 53 49 48 48 53 51
5 65 66 61 60 60 67 63
6 78 113 79 113 73 114 72 112 72 114 80 114 76 113
7 152 54 155 55 150 56 146 54 148 56 156 55 151 55
8 187 38 191 39 188 40 181 38 185 39 192 39 186 38
9 208 31 212 32 211 33 202 32 207 32 214 32 207 32
10 223 28 227 28 228 29 217 28 223 29 229 28 223 28
11 236 26 240 26 241 27 230 26 236 27 242 26 236 26
12 247 24 251 24 253 25 241 25 248 25 253 24 247 25
13 257 24 261 23 263 24 252 24 258 24 263 23 257 24
14 266 23 270 23 273 23 262 24 268 23 272 23 266 23
15 275 23 279 22 283 23 271 23 277 23 281 22 275 23
16 284 22 287 22 291 22 280 23 286 23 289 22 284 22
17 292 22 296 22 300 22 289 22 295 22 298 22 292 22
18 301 22 304 21 308 22 298 22 303 22 306 21 301 22
19 309 21 312 21 316 21 306 22 311 21 314 21 308 21
20 317 21 319 21 324 21 314 21 319 21 321 21 316 21
21 324 21 327 21 332 21 321 21 327 21 329 21 324 21
22 332 21 334 20 339 21 329 21 334 21 336 20 331 20
23 339 20 341 20 347 20 336 20 342 20 343 20 338 20
24 346 20 348 20 354 20 343 20 349 20 351 20 345 20
25 353 20 355 20 361 20 350 20 356 20 358 20 352 20
26 361 20 362 20 368 20 358 20 363 20 365 20 359 20
27 368 20 369 20 375 20 365 20 370 20 371 20 366 20
28 375 20 376 20 382 20 372 20 378 20 378 20 374 20
29 382 21 384 21 389 20 379 21 385 21 386 20 381 21
30 390 21 391 21 396 20 387 21 392 21 393 21 388 21
31 397 21 399 21 403 21 394 21 400 21 400 21 396 21
32 405 22 406 21 410 21 402 21 408 22 408 21 404 21
33 414 22 415 22 418 21 410 22 416 22 416 22 412 22
34 422 22 423 22 426 22 419 22 425 22 424 22 420 22
35 431 23 432 23 434 22 427 22 434 23 433 22 429 23
36 440 23 441 23 443 23 436 23 443 23 442 23 438 23
37 450 24 450 24 452 23 446 23 453 24 451 23 447 23
38 460 24 460 24 462 24 455 24 463 25 460 24 457 24
39 470 25 470 25 472 24 465 24 474 25 471 24 467 24
40 481 25 481 25 482 25 475 25 486 26 481 25 478 25
41 492 26 493 26 494 26 486 26 498 27 492 26 489 26
42 505 27 505 27 506 27 498 27 511 28 504 27 501 27
43 518 29 518 28 520 29 511 28 526 30 518 28 514 28
44 533 31 533 31 536 31 526 31 542 32 533 31 529 31
45 551 34 551 34 555 35 544 34 562 35 551 34 547 34
46 575 41 575 41 580 42 569 41 587 42 575 41 571 41
47 600 600 600 600 600 600 600
48 600 600 600 600 600 600 600

Virginia Standards of Learning Assessments Technical Report 2013–2014 Administration Cycle
127
Table 2.5.50 RSSS Conversions for Grade 8 Writing Core 2
Raw
Score
Core 2
Prompt 2806 Prompt 2810 Prompt 2812 Prompt 2813 Prompt 2819 Prompt 2849 Prompt 2852
SS SEM SS SEM SS SEM SS SEM SS SEM SS SEM SS SEM
0 0 0 0 0 0 0 0
1 12 12 11 11 11 13 12
2 24 25 23 23 22 25 24
3 37 37 34 34 34 38 36
4 49 49 45 45 45 50 47
5 61 62 57 57 56 63 59
6 73 113 74 114 68 114 68 113 67 114 75 114 71 113
7 148 55 150 55 146 56 142 54 144 56 151 56 147 55
8 184 38 187 39 184 40 177 38 181 39 188 39 183 39
9 204 31 208 32 207 33 198 32 203 32 209 32 204 32
10 220 28 223 28 223 29 214 28 219 29 225 28 219 28
11 232 26 236 26 236 27 226 26 232 26 237 26 232 26
12 243 24 247 24 248 25 237 25 243 25 248 24 242 24
13 252 23 256 23 258 24 248 24 253 24 258 23 252 23
14 261 23 265 22 268 23 257 23 263 23 267 22 261 23
15 270 22 274 22 277 22 266 23 272 22 275 22 270 22
16 278 22 282 21 285 22 275 22 280 22 283 22 278 22
17 286 21 290 21 293 22 283 22 288 22 291 21 286 21
18 294 21 297 21 301 21 291 21 296 21 299 21 294 21
19 302 21 305 21 309 21 299 21 304 21 307 21 302 21
20 310 21 312 20 317 21 307 21 312 21 314 21 309 21
21 317 21 319 20 324 21 314 21 319 21 322 20 317 20
22 324 20 326 20 331 20 322 20 327 20 329 20 324 20
23 331 20 333 20 339 20 329 20 334 20 336 20 331 20
24 338 20 340 20 346 20 336 20 341 20 343 20 338 20
25 345 20 347 20 353 20 343 20 348 20 350 20 344 20
26 352 20 354 20 360 20 350 20 355 20 356 20 351 20
27 359 20 361 20 366 20 356 20 362 20 363 20 358 20
28 366 20 368 20 373 20 363 20 369 20 370 20 365 20
29 374 20 375 20 380 20 371 20 376 20 377 20 372 20
30 381 21 382 21 387 20 378 21 384 21 384 20 380 21
31 388 21 390 21 395 20 385 21 391 21 392 21 387 21
32 396 21 397 21 402 21 393 21 399 21 399 21 395 21
33 404 22 405 22 410 21 401 22 407 22 407 21 403 22
34 413 22 414 22 417 22 409 22 415 22 415 22 411 22
35 422 23 423 23 426 22 418 23 424 23 424 22 420 23
36 431 23 432 23 434 23 427 23 434 24 433 23 429 23
37 441 24 441 24 443 23 437 23 444 24 442 24 438 24
38 451 24 451 24 453 24 446 24 454 25 452 24 448 24
39 461 25 462 25 463 25 456 24 465 26 462 25 458 25
40 473 26 473 26 474 26 467 25 477 27 473 25 469 25
41 484 26 485 26 486 27 478 26 490 28 485 26 481 26
42 497 27 497 27 499 28 490 27 504 29 497 27 493 27
43 511 29 511 29 513 29 504 28 519 30 510 29 506 29
44 526 31 526 31 529 32 518 31 535 32 525 31 521 31
45 544 34 544 34 548 35 537 34 555 35 543 34 540 34
46 568 41 568 41 573 42 561 41 580 42 567 41 564 41
47 600 600 600 600 600 600 600
48 600 600 600 600 600 600 600

Virginia Standards of Learning Assessments Technical Report 2013–2014 Administration Cycle
128
Table 2.5.51 RSSS Conversions for Grade 8 Writing Core 3
Raw
Score
Core 3
Prompt 2806 Prompt 2810 Prompt 2812 Prompt 2813 Prompt 2819 Prompt 2849 Prompt 2852
SS SEM SS SEM SS SEM SS SEM SS SEM SS SEM SS SEM
0 0 0 0 0 0 0 0
1 12 12 11 11 11 13 12
2 24 25 23 23 22 25 24
3 37 37 34 34 34 38 36
4 49 49 45 45 45 50 47
5 61 62 57 57 56 63 59
6 73 113 74 114 68 114 68 113 67 114 75 114 71 113
7 148 55 150 56 146 57 142 55 144 56 151 56 147 55
8 184 38 187 39 184 40 178 38 181 39 188 39 183 39
9 205 32 208 32 207 33 198 32 203 32 210 32 204 32
10 220 28 224 28 224 29 214 28 219 29 225 28 219 28
11 232 26 236 26 237 27 227 26 232 26 238 26 232 26
12 243 24 247 24 249 25 238 25 244 25 249 24 243 24
13 253 23 257 23 259 24 248 24 254 24 258 23 253 23
14 262 23 266 22 268 23 258 23 263 23 267 23 262 23
15 271 22 274 22 277 23 267 23 272 23 276 22 271 22
16 279 22 283 22 286 22 276 22 281 22 284 22 279 22
17 287 22 290 21 294 22 284 22 289 22 292 21 287 21
18 295 21 298 21 302 21 292 22 297 21 300 21 295 21
19 303 21 306 21 310 21 300 21 305 21 308 21 303 21
20 311 21 313 21 318 21 308 21 313 21 315 21 310 21
21 318 21 320 20 325 21 315 21 321 21 323 20 318 20
22 325 20 328 20 333 20 323 20 328 20 330 20 325 20
23 333 20 335 20 340 20 330 20 335 20 337 20 332 20
24 340 20 342 20 347 20 337 20 342 20 344 20 339 20
25 347 20 348 20 354 20 344 20 349 20 351 20 346 20
26 354 20 355 20 361 20 351 20 356 20 358 20 352 20
27 361 20 362 20 368 20 358 20 363 20 364 20 359 20
28 368 20 369 20 374 20 365 20 370 20 371 20 366 20
29 375 20 376 20 381 20 372 20 377 20 378 20 373 20
30 382 21 383 21 388 20 379 21 385 21 385 20 381 21
31 390 21 391 21 396 20 387 21 392 21 393 21 388 21
32 397 21 399 21 403 21 394 21 400 21 400 21 396 21
33 405 22 407 22 411 21 402 22 408 22 408 21 404 22
34 414 22 415 22 418 22 411 22 417 22 416 22 412 22
35 423 23 424 23 427 22 419 23 425 23 425 22 421 23
36 432 23 433 23 435 23 428 23 435 24 434 23 430 23
37 442 24 442 24 444 23 438 23 445 24 443 23 439 24
38 452 24 452 24 454 24 447 24 455 25 453 24 449 24
39 462 25 463 25 464 25 457 24 466 26 463 25 459 25
40 474 26 474 26 475 26 468 25 478 27 474 25 470 25
41 485 26 486 26 487 27 479 26 491 28 485 26 482 26
42 498 27 498 27 500 28 491 27 505 29 498 27 494 27
43 512 29 512 29 514 29 504 28 520 30 511 29 507 29
44 527 31 527 31 530 32 520 31 536 32 526 31 522 31
45 545 34 545 34 549 35 538 34 556 35 545 34 541 34
46 569 41 569 41 574 42 562 41 582 42 568 41 565 41
47 600 600 600 600 600 600 600
48 600 600 600 600 600 600 600

Virginia Standards of Learning Assessments Technical Report 2013–2014 Administration Cycle
129
Table 2.5.52 RSSS Conversions for EOC Writing Core 1
Raw
Score
Core 1
Prompt 2101 Prompt 2102 Prompt 2107 Prompt 2115 Prompt 2121 Prompt 2122 Prompt 2126
SS SEM SS SEM SS SEM SS SEM SS SEM SS SEM SS SEM
0 0 0 0 0 0 0 0
1 15 14 15 15 14 14 15
2 29 28 29 29 28 28 29
3 44 43 44 44 42 43 44
4 59 57 59 58 56 57 59
5 73 71 73 73 70 71 73
6 88 107 85 107 88 108 87 107 84 107 85 107 88 107
7 161 53 157 53 162 54 159 53 156 53 157 52 160 52
8 197 37 193 37 199 38 194 37 192 37 192 37 195 37
9 218 30 214 30 221 31 215 30 213 31 212 30 215 30
10 233 27 229 27 236 27 229 26 228 27 227 26 230 26
11 245 24 241 25 249 25 241 24 240 25 239 24 242 24
12 255 23 252 23 259 23 252 23 251 23 249 23 252 23
13 264 22 261 22 268 22 261 22 260 22 258 22 261 22
14 273 21 270 21 277 21 269 21 269 21 267 21 269 21
15 281 20 278 21 284 20 277 21 277 21 275 21 277 20
16 288 20 286 21 292 20 285 20 285 21 283 20 285 20
17 296 20 294 20 299 19 293 20 293 20 290 20 292 20
18 303 20 302 20 306 19 300 20 301 20 298 20 300 20
19 310 19 309 20 312 19 307 20 308 20 305 20 307 20
20 317 19 317 20 319 19 314 19 315 20 312 20 314 19
21 324 19 324 20 326 19 321 19 322 19 319 19 321 19
22 331 19 331 19 332 18 328 19 329 19 326 19 327 19
23 337 19 338 19 338 18 335 19 336 19 333 19 334 19
24 344 19 344 19 344 18 341 19 343 19 340 19 340 18
25 350 18 351 19 351 18 348 18 349 19 346 18 347 18
26 356 18 357 18 357 18 354 18 356 18 352 18 353 18
27 363 18 364 18 363 18 360 18 362 18 358 18 359 18
28 369 18 370 18 369 18 366 18 368 18 365 18 365 18
29 375 18 376 18 375 18 372 18 374 18 371 18 371 18
30 381 18 382 18 381 18 378 18 380 18 377 18 377 18
31 387 18 388 18 387 18 384 18 386 18 383 18 383 18
32 393 18 394 18 393 18 391 18 392 18 389 18 390 18
33 399 18 400 18 399 18 397 18 399 18 396 19 396 19
34 406 19 406 19 405 19 403 19 405 19 402 19 402 19
35 412 19 413 19 412 19 410 19 411 19 409 19 409 19
36 419 19 420 19 419 19 417 19 418 19 416 19 416 19
37 425 19 426 19 426 19 424 20 425 19 423 20 423 20
38 432 20 434 20 433 20 431 20 432 20 430 20 430 20
39 440 20 441 20 440 20 438 20 439 20 437 20 437 20
40 447 20 449 20 448 21 446 20 446 20 445 21 445 21
41 455 21 457 21 456 21 454 21 454 21 453 21 453 21
42 463 21 465 21 464 21 462 21 462 21 461 21 461 21
43 471 21 473 22 473 22 471 22 470 21 470 22 470 22
44 480 22 482 22 482 22 479 22 479 22 479 22 479 22
45 489 22 492 23 491 23 489 22 488 22 488 22 488 23
46 498 23 502 23 501 23 498 23 498 23 498 23 498 23
47 508 23 512 24 511 24 508 24 508 24 508 24 508 24
48 518 24 524 25 522 25 519 25 519 25 519 25 519 25
49 530 26 536 26 534 26 531 26 532 27 531 26 531 26
50 543 28 550 28 547 28 545 28 546 29 545 28 545 28
51 560 31 567 32 564 32 562 32 563 32 562 32 562 32
52 582 38 589 38 586 38 584 38 586 38 584 38 584 38
53 600 600 600 600 600 600 600
54 600 600 600 600 600 600 600

Virginia Standards of Learning Assessments Technical Report 2013–2014 Administration Cycle
130
Table 2.5.53 RSSS Conversions for EOC Writing Core 2
Raw
Score
Core 2
Prompt 2101 Prompt 2102 Prompt 2107 Prompt 2115 Prompt 2121 Prompt 2122 Prompt 2126
SS SEM SS SEM SS SEM SS SEM SS SEM SS SEM SS SEM
0 0 0 0 0 0 0 0
1 17 16 17 16 16 16 17
2 33 32 33 33 31 32 33
3 50 48 50 49 47 48 50
4 67 64 67 65 63 64 66
5 83 80 83 82 78 80 83
6 100 106 96 106 100 107 98 106 94 106 96 106 99 106
7 171 52 166 52 172 53 168 51 165 52 166 51 169 51
8 205 36 200 36 208 37 202 36 199 36 199 36 203 36
9 225 30 220 30 228 30 221 29 219 30 218 29 222 29
10 239 26 235 26 243 26 235 26 234 26 233 26 236 26
11 251 24 247 24 255 24 247 24 246 24 244 24 247 24
12 261 22 257 23 264 22 257 22 256 23 254 23 257 22
13 269 21 266 22 273 21 266 22 265 22 263 22 266 21
14 278 21 275 21 281 20 274 21 274 21 272 21 274 21
15 285 20 283 21 289 20 282 20 282 21 280 21 282 20
16 293 20 291 20 296 19 290 20 290 20 287 20 289 20
17 300 19 299 20 303 19 297 20 297 20 295 20 297 20
18 307 19 306 20 309 19 304 19 305 20 302 20 304 19
19 314 19 313 20 316 18 311 19 312 19 309 19 311 19
20 320 19 320 19 322 18 318 19 319 19 316 19 317 19
21 327 19 327 19 328 18 324 19 325 19 323 19 324 19
22 333 18 333 19 334 18 331 18 332 19 329 18 330 18
23 339 18 340 18 340 18 337 18 338 18 335 18 336 18
24 345 18 346 18 346 18 343 18 344 18 341 18 342 18
25 351 18 352 18 352 17 349 18 350 18 347 18 348 18
26 357 18 358 18 357 17 355 18 356 18 353 18 354 17
27 363 17 364 17 363 17 360 17 362 18 359 17 359 17
28 368 17 369 17 368 17 366 17 368 17 364 17 365 17
29 374 17 375 17 374 17 372 17 373 17 370 17 371 17
30 379 17 380 17 379 17 377 17 379 17 376 17 376 17
31 385 17 386 17 385 17 383 17 384 17 381 18 382 17
32 391 17 392 17 391 17 388 18 390 18 387 18 387 18
33 396 18 397 18 396 18 394 18 396 18 393 18 393 18
34 402 18 403 18 402 18 400 18 402 18 399 18 399 18
35 408 18 409 18 408 18 406 18 408 18 405 18 405 18
36 414 18 415 18 414 18 413 18 414 18 412 19 412 19
37 421 19 422 19 421 19 419 19 420 19 418 19 418 19
38 427 19 428 19 428 19 426 19 427 19 425 19 425 19
39 434 19 435 20 435 20 433 20 433 19 432 20 432 20
40 441 20 442 20 442 20 440 20 440 20 439 20 439 20
41 449 20 450 20 450 20 448 20 448 20 447 20 447 20
42 456 21 458 21 458 21 456 21 456 21 455 21 455 21
43 464 21 467 22 466 22 464 21 464 21 463 21 463 21
44 473 22 476 22 475 22 473 22 472 22 472 22 472 22
45 482 22 485 23 484 23 482 22 481 22 481 23 481 23
46 491 23 495 24 494 23 491 23 491 23 491 23 491 23
47 501 24 506 24 504 24 502 24 502 24 501 24 501 24
48 512 25 517 25 515 25 513 25 513 25 512 25 513 25
49 524 26 530 27 528 26 525 26 525 27 524 26 525 26
50 537 28 544 29 541 28 539 28 540 29 538 29 539 29
51 553 31 561 32 558 32 555 32 557 32 555 32 556 32
52 575 37 583 38 580 38 577 38 579 38 578 38 578 38
53 600 600 600 600 600 600 600
54 600 600 600 600 600 600 600

Virginia Standards of Learning Assessments Technical Report 2013–2014 Administration Cycle
131
Table 2.5.54 RSSS Conversions for EOC Writing Core 3
Raw
Score
Core 3
Prompt 2101 Prompt 2102 Prompt 2107 Prompt 2115 Prompt 2121 Prompt 2122 Prompt 2126
SS SEM SS SEM SS SEM SS SEM SS SEM SS SEM SS SEM
0 0 0 0 0 0 0 0
1 17 16 17 16 16 16 17
2 33 32 33 33 32 32 33
3 50 48 50 49 48 48 50
4 67 64 67 65 63 64 66
5 83 80 83 82 79 80 83
6 100 106 96 106 100 107 98 106 95 106 96 106 99 106
7 171 52 167 52 173 53 168 51 166 52 166 51 170 51
8 206 36 201 36 208 37 202 36 200 36 199 36 203 36
9 225 30 221 30 229 30 222 30 220 30 219 29 222 29
10 240 26 235 26 244 26 236 26 235 27 233 26 236 26
11 251 24 247 24 255 24 247 24 247 24 245 24 248 24
12 261 22 258 23 266 23 258 23 257 23 255 23 258 22
13 270 22 267 22 274 21 267 22 266 22 264 22 267 22
14 279 21 276 22 283 21 275 21 275 21 273 21 275 21
15 287 20 284 21 290 20 283 21 284 21 281 21 283 21
16 294 20 293 21 298 20 291 20 292 21 289 21 291 20
17 302 20 301 21 305 19 299 20 299 20 297 20 299 20
18 309 20 308 20 312 19 306 20 307 20 304 20 306 20
19 316 19 316 20 318 19 314 20 314 20 312 20 313 19
20 323 19 323 20 325 19 321 19 322 20 319 19 320 19
21 330 19 330 19 331 18 328 19 329 19 326 19 327 19
22 337 19 337 19 338 18 334 19 335 19 332 19 333 19
23 343 19 344 19 344 18 341 19 342 19 339 19 340 18
24 349 18 350 18 350 18 347 18 348 18 345 18 346 18
25 355 18 356 18 356 18 353 18 355 18 351 18 352 18
26 362 18 362 18 362 18 359 18 361 18 357 18 358 18
27 367 18 368 18 368 18 365 18 367 18 363 18 364 18
28 373 18 374 18 373 18 371 18 373 18 369 18 370 18
29 379 18 380 18 379 18 377 18 379 18 375 18 376 18
30 385 18 386 18 385 18 383 18 384 18 381 18 382 18
31 391 18 392 18 391 18 389 18 390 18 387 18 388 18
32 397 18 398 18 397 18 395 18 396 18 393 18 394 18
33 403 18 404 18 403 18 401 18 402 18 400 18 400 18
34 409 18 410 18 409 18 407 18 408 18 406 19 406 18
35 415 18 416 18 415 19 413 19 415 18 412 19 412 19
36 422 19 423 19 422 19 420 19 421 19 419 19 419 19
37 428 19 429 19 429 19 427 19 428 19 426 19 426 19
38 435 19 436 19 436 19 434 20 434 19 433 20 433 20
39 442 20 443 20 443 20 441 20 441 20 440 20 440 20
40 449 20 451 20 450 20 448 20 449 20 448 20 448 20
41 457 20 459 21 458 21 456 21 456 20 455 21 455 21
42 465 21 467 21 466 21 464 21 464 21 463 21 463 21
43 473 21 475 22 474 21 472 21 472 21 472 21 472 21
44 481 21 484 22 483 22 481 22 481 22 480 22 480 22
45 490 22 493 23 492 22 490 22 490 22 489 22 489 22
46 499 23 503 23 502 23 499 23 499 23 499 23 499 23
47 509 23 513 24 512 24 509 24 509 24 509 24 509 24
48 519 24 524 25 523 25 520 25 520 25 520 25 520 25
49 531 26 537 26 535 26 532 26 533 26 532 26 532 26
50 544 28 551 28 548 28 546 28 547 29 546 28 546 28
51 560 31 567 32 565 32 562 32 564 32 562 32 563 32
52 582 38 589 38 587 38 584 38 587 38 585 38 585 38
53 600 600 600 600 600 600 600
54 600 600 600 600 600 600 600

Virginia Standards of Learning Assessments Technical Report 2013–2014 Administration Cycle
132
REFERENCES
American Educational Research Association (AERA), American Psychological Association
(APA), & National Council on Measurement in Education (NCME). (2014). Standards
for educational and psychological testing. Washington, DC: AERA.
Andrich, A., & Luo, G. (2004). Modern measurement and analysis in social science. Perth,
Western Australia: Murdoch University.
Angoff, W.H. (1971). Scales, norms and equivalent scores. In R.L. Thorndike (Ed.), Educational
measurement (2nd ed., pp. 508–600). Washington, DC: American Council on Education.
Brennan, R. L. (2004). Manual for BB-CLASS: A computer program that uses the beta-binomial
model for classification consistency and accuracy (CASMA Research Report No. 9).
Iowa City, IA: Center for Advanced Studies in Measurement and Assessment, University
of Iowa. (Available from http://www.education.uiowa.edu/casma).
Cronbach, L. J. (1951). Coefficient alpha and the internal structure of tests. Psychometrika, 16,
297–334.
Cronbach, L.J., Schonemann, P., & McKie, D. (1965). Alpha coefficients for stratified-parallel
tests. Educational and Psychological Measurement, 25, 291–312.
Divgi, D. R. (1980). Dimensionality of binary items: Use of a mixed model. Paper presented at
the annual meeting of the National Council on Measurement in Education. Boston MA.
Dolan, R. P., & Hall, T. E. (2001). Universal design for learning: Implications for large-scale
assessments. Perspectives: International Dyslexia Association, 27(4), 22–25.
http://www.cast.org/udl/Dolan_IDA_Perspectives_2001.htm
Kaiser, H. F. (1960). The application of electronic computers to factor analysis. Educational and
Psychological Measurement, 20, 141–151.
Kolen, M. J., & Brennan, R. L. (2014). Test equating, scaling, and linking: Methods and
practices (3rd Ed.). New York: Springer-Verlag.
Linacre, J. M. (2006). WINSTEPS: Rasch measurement computer programs. Chicago: Winsteps.
Livingston, S. A., & Lewis, C. (1995). Estimating the consistency and accuracy of classifications
based on test scores. Journal of Educational Measurement, 32, 179–197.
Lord, F. M. (1980). Applications of item response theory to practical testing problems. New
York: Erlbaum Associates.
Masters, G. N. (1982). A Rasch model for partial credit scoring. Psychometrika, 47, 149–174.

Virginia Standards of Learning Assessments Technical Report 2013–2014 Administration Cycle
133
Messick, S. (1989). Validity. In R. L. Linn (Ed.), Educational measurement (3rd ed., pp. 13–
103). New York: Macmillan.
Rasch, G. (1980). Probabilistic models for some intelligence and attainment tests. Chicago, IL:
University of Chicago Press.
Suen, H. K. (1990). Principles of test theories. Hillsdale, NJ: Lawrence.
Webb, N. L. (2005). Web alignment tool (WAT) training manual. Madison, WI: University of
Wisconsin, Wisconsin Center for Education Research.
Wright, B. D., & Stone, M. H. (1979). Best test design. Chicago, IL: MESA Press.