· Web viewThe Chinese economy lost momentum through 2015, consistently registering...
62
The Westpac– Department of Industry, Innovation and Science China Resources Quarterly Sourthern autumn ~ Northern spring 2016 The Westpac–Department of Industry, Innovation and Science China Resources QuarterlyThe Westpac–Department of Industry, Innovation and Science China Resources Quarterly 1
Transcript of · Web viewThe Chinese economy lost momentum through 2015, consistently registering...
The Westpac–Department of Industry, Innovation and Science China Resources Quarterly
Sourthern autumn ~ Northern spring 2016
The Westpac–Department of Industry, Innovation and Science China Resources QuarterlyThe Westpac–Department of
Industry, Innovation and Science China Resources Quarterly 1
© Commonwealth of Australia 2016
Creative Commons licence With the exception of the Coat of Arms, this publication is licensed under a Creative Commons Attribution 3.0 Australia Licence. Creative Commons Attribution 3.0 Australia Licence is a standard form license agreement that allows you to copy, distribute, transmit and adapt this publication provided that you attribute the work.
A summary of the licence terms is available from: http://creativecommons.org/licenses/by/3.0/au/deed.en
The full licence terms are available from: http://creativecommons.org/licenses/by/3.0/au/legalcode
The Commonwealth’s preference is that you attribute this publication (and any material sourced from it) using the following wording: Source: Licensed from the Commonwealth of Australia under a Creative Commons Attribution 3.0 Australia Licence.
ISSN 978-1-921516-05-4 [Print]
ISSN 978-1-921516-07-8 [PDF]
This work is copyright. Apart from any use as permitted under the Copyright Act 1968, no part may be reproduced or altered by any process without prior written permission from the Australian Government. Requests and inquiries concerning reproduction and rights should be addressed to:
Department of Industry, Innovation and Science GPO Box 9839, Canberra ACT 2601 or by emailing [email protected]
The Westpac–Department of Industry, Innovation and Science China Resources QuarterlyThe Westpac–Department of
Industry, Innovation and Science China Resources Quarterly 2
AcknowledgementsThis publication was jointly undertaken by the Westpac Institutional Bank, a division of the Westpac Group, and the Australian Government Department of Industry, Innovation and Science. The relationship is non–commercial. The report was previously published under the title of the Westpac–BREE China Resources Quarterly.
Editors
Westpac: Elliot Clarke and Justin Smirk
Department of Industry, Innovation and Science: Kate Penney, Marco Hatt, Nikolai Drahos, Karan Sharma and Thuong Nguyen.
Design and production
Julie Doel
Cover image
Shutterstock
This report was finalised on 13 May 2016.
The Westpac–Department of Industry, Innovation and Science China Resources QuarterlyThe Westpac–Department of
Industry, Innovation and Science China Resources Quarterly 3

Contents
1. Executive summary
2. Recent developments in the Chinese economy
3. Steel
4. Iron ore
5. Metallurgical coal
6. Developments in China’s energy policy
7. Thermal coal
8. Oil
9. Gas
10. Uranium
11. Gold
12. Silver
13. Copper
14. Aluminium
15. Alumina
16. Bauxite
17. Nickel
18. Zinc
19. Lead
20. Tin
21. Molybdenum
22. Tungsten
23. Cobalt
24. Antimony
25. Platinum & Palladium
26. Mineral SandsThe Westpac–Department of Industry, Innovation and Science China Resources QuarterlyThe Westpac–Department of
Industry, Innovation and Science China Resources Quarterly 4
27. China’s exports of rare earth oxides
28. Magnesium & Cadmium
29. Diamonds and Magnesium
30. China maps
The Westpac–Department of Industry, Innovation and Science China Resources QuarterlyThe Westpac–Department of
Industry, Innovation and Science China Resources Quarterly 5
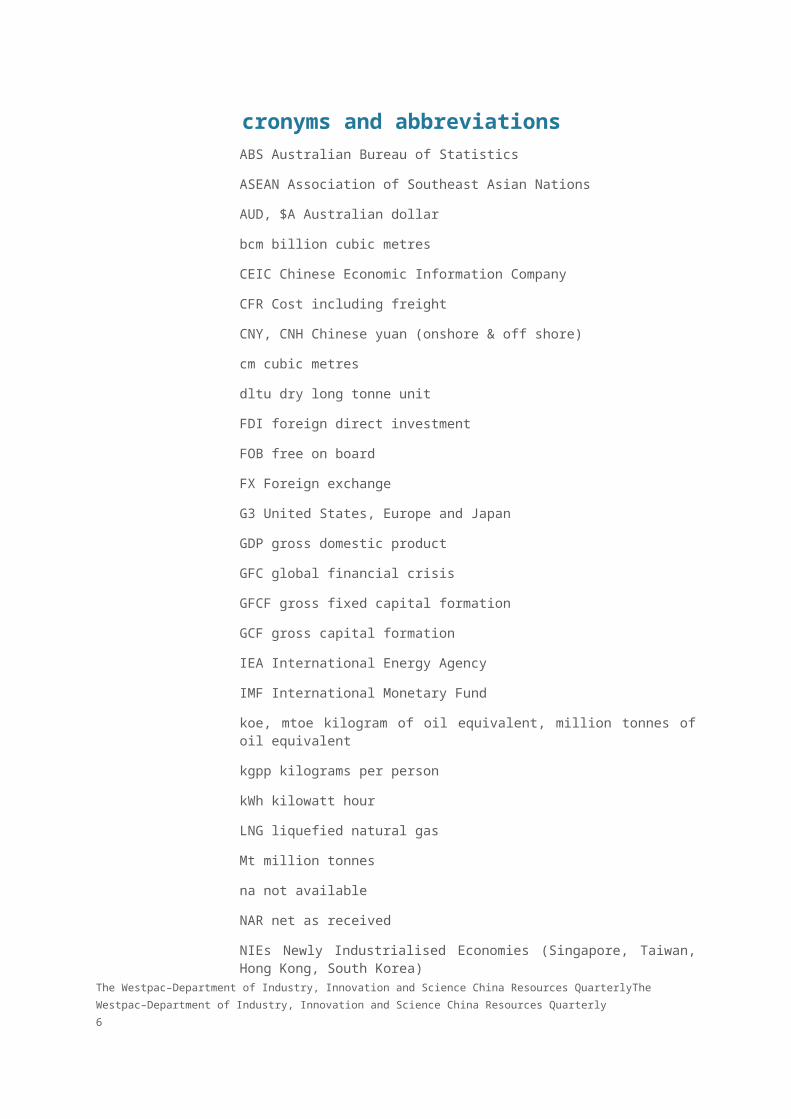
cronyms and abbreviationsABS Australian Bureau of Statistics
ASEAN Association of Southeast Asian Nations
AUD, $A Australian dollar
bcm billion cubic metres
CEIC Chinese Economic Information Company
CFR Cost including freight
CNY, CNH Chinese yuan (onshore & off shore)
cm cubic metres
dltu dry long tonne unit
FDI foreign direct investment
FOB free on board
FX Foreign exchange
G3 United States, Europe and Japan
GDP gross domestic product
GFC global financial crisis
GFCF gross fixed capital formation
GCF gross capital formation
IEA International Energy Agency
IMF International Monetary Fund
koe, mtoe kilogram of oil equivalent, million tonnes of oil equivalent
kgpp kilograms per person
kWh kilowatt hour
LNG liquefied natural gas
Mt million tonnes
na not available
NAR net as received
NIEs Newly Industrialised Economies (Singapore, Taiwan, Hong Kong, South Korea)
ODI outward direct investment
The Westpac–Department of Industry, Innovation and Science China Resources QuarterlyThe Westpac–Department of
Industry, Innovation and Science China Resources Quarterly 6

OECD Organisation for Economic Cooperation and Development
OPEC Organisation of Petroleum Exporting Countries
PMI Purchasing Managers Index
PPP purchasing–power parity
ppt percentage point
RMB Chinese Renminbi
SHIBOR Shanghai Interbank Offered Rate
Sq km square kilometres
USD, US$ United States dollar
The Westpac–Department of Industry, Innovation and Science China Resources QuarterlyThe Westpac–Department of
Industry, Innovation and Science China Resources Quarterly 7

1. Executive summary The Chinese economy lost momentum through 2015, consistently registering sub–par outcomes over the year. Since the previous edition of the CRQ, aggregate demand moderated further in the March quarter 2016. The principal sources of weakness remain heavy industry on the domestic front as well as soft external demand for Chinese produced goods. Against these negatives, residential building activity has turned. And the services sector continues to experience robust growth.
Growth in heavy industrial capacity and mining investment both slowed significantly during 2015, with coal mining and ferrous metals smelting among the weakest segments. Outlays on utilities capex continue to grow at a healthy pace; however, investment in transport infrastructure looks to be plateauing at a relatively high level. Public sector capex stabilized in 2015, having experienced steep declines in 2014. It has since strengthened to contribute two-thirds of the (albeit) modest growth in investment in the year to March.
Real estate construction activity looks to have found a base in late-2015 from which robust momentum has developed. Sales turnover has accelerated rapidly in the first three months of 2016, and housing starts have followed suit. In recent months, there has also been evidence of broadening month-on-month dwelling price gains across the major cities. However, relative to a year ago, the gains remain heavily concentrated in tier-1 cities – and even within this category, city-by-city price gains have diverged materially from one another.
The heavy industrial sector continues to struggle. The proportion of industrial firms making losses remains historically high; and demand for basic inputs consumed by construction remains soft. As a result, excess capacity is looking increasingly pronounced in some sub–sectors; while producer prices continue to decline, as they have done since early 2012.
China’s exports have fallen over the past year, with the deterioration evident across the G3, in intra–Asian trade and in shipments to extra–regional emerging markets.
An unexpected shift in exchange rate policy sparked global comment in the second half of 2015 (and again in early 2016). Yet, with respect to capital flows, the reduction in FX reserves associated with intervention is only part of the story. China’s ongoing development and first steps toward financial liberalisation have seen robust growth in service imports, Chinese bank loans to foreign entities, and outward foreign direct investment.
Commodity prices followed the declines of 2014 and the first half of 2015 with yet further declines through late–2015 and early–
The Westpac–Department of Industry, Innovation and Science China Resources QuarterlyThe Westpac–Department of
Industry, Innovation and Science China Resources Quarterly 8
2016. A sharp rally thereafter gave pause to consider whether real demand had strengthened; instead, it seems to have had much more to do with speculative positioning and low inventory levels. Prices are largely being driven by increased supply; although as noted above and throughout the CRQ, growth in demand has, in the main, been considerably lower than the norms established during the 2000s.
The global supply trend has been exemplified by Australia’s bulk commodity export volumes, which remain high irrespective of prices. Even so, as the period of time that commodity prices spend around their current levels extends, the more pressure will be brought to bear on those mines operating in the upper quartile of their cost curves.
The Westpac–Department of Industry, Innovation and Science China Resources QuarterlyThe Westpac–Department of
Industry, Innovation and Science China Resources Quarterly 9

2. Recent developments in the Chinese economy
The softer momentum evident in the Chinese economy through 2015 continued into the early part of 2016. The growth narrative has changed little since the previous edition of the CRQ, with aggregate momentum continuing to depend on the service sector as the secondary sector (manufacturing and construction) stagnates – the latter impacted not only by soft global demand, but also tough domestic conditions.
Real GDP expanded by 6.7%yr in Q1 2016. That compares to 6.8%yr in Q4 2015; 6.9%yr in Q3; 7.0%yr in Q1 & Q2; and 7.3%yr in Q1 2014. Q1 2016 was the weakest quarterly outcome for annual growth back to Q1 2009, and before that Q1 2000.
Figures 1–3
Please refer to page 2 of The Westpac-DIIS China Resources Quarterly PDF version.
Albeit not typically the focus for market participants, nominal GDP has historically been a better guide of current momentum, exhibiting significantly more cyclical amplitude than the real measure. In the March quarter, nominal growth accelerated sharply from 6.0%yr in Q4 2015 to 7.2%yr, the strongest outcome in five quarters, back to Q4 2014’s 7.5%yr. The implicit price deflator consequently rebounded from –0.8%yr in Q4 2015 to +0.5%yr currently.
However, the above rebound in nominal growth came solely from the volatile primary sector, where growth jumped from 4%yr three months ago to 13%yr. Apparent from the CPI data, agricultural commodity prices rose strongly in the quarter, producing the nominal activity surge.
In contrast, growth in the secondary sector only managed to edge up incrementally in Q1, from flat in Q4 to 1%yr. Momentum in the tertiary sector meanwhile remained robust at 11%yr, only marginally below Q4’s 12%yr. The Chinese household is pivotal for growth: two years ago, fixed capital formation and final consumption contributed 4.2ppts and 3.7ppts respectively. By end–2015, the relevant contributions for investment and consumption were 2.5ppts and 4.6ppts.
Nominal investment growth in heavy industrial and extractive industries remains weak, as is non–residential building. Utilities capex however remain at elevated levels, with the urbanisation process continuing across the country. Also housing has accelerated in early-2016 (page 4). The contribution from State–owned enterprises has strengthened from one to two-thirds since December.
It is constructive to complement the national accounts with a range of alternative indicators which also correlate with overall activity. Doing so provides a richer and more complete picture of key macroeconomic trends.
The Westpac–Department of Industry, Innovation and Science China Resources QuarterlyThe Westpac–Department of
Industry, Innovation and Science China Resources Quarterly 10

Beginning with the People’s Bank of China’s corporate survey, we see that the largest firms across the nation believe conditions deteriorated further in the first quarter of 2016 – consistent with continued weakness in secondary-sector activity.
The survey’s ‘business situation’ measure has now been below its long–run average for nine consecutive quarters – and eleven of the past twelve. Weakness in domestic orders is a key factor, having been sub-par for almost all of the past four years; as per recent PMI and trade results, external demand is also lacking.
Other measures of aggregate activity highlight the impact that weak conditions in the old bellwether sectors of manufacturing and construction have had on raw material demand. While growth in cement production has risen off its lows to be up 16%yr in March, this follows a protracted period of weakness. Further, electricity demand is only modestly higher over the year, +4%yr, and steel demand is unchanged relative to a year ago.
Part of the issue facing the secondary industry is that, while activity has certainly firmed in tier-1 cities, elsewhere there has been little improvement.
As noted in our discussion of GDP, in stark contrast to weak conditions in the secondary sector, services momentum is robust.
This sector is job intensive. And given the stage of development China currently finds itself at, services growth is the key to continued, sustained wage gains for the urbanising population.
Early 2016 has seen mixed results within services. Growth in financial services has slowed abruptly, from 27%yr in Q2 2015 to 11%yr currently, as financial market exuberance petered out. But, over the same period, real estate services growth has strengthened, from 12%yr in Q2 2015 to 18%yr. We are still waiting for a recovery in wholesale & retail momentum; but a base does seem to have formed in recent quarters.
Figures 4–6
Please refer to page 3 of The Westpac-DIIS China Resources Quarterly PDF version.
2.1 The real estate sector
Real estate represents around one quarter of nominal urban fixed investment. Real estate investment itself is split roughly 70/30 between residential and non–residential. State–owned enterprises represent circa 14% of the total.
In the previous edition of the CRQ, we noted that the real estate slowdown directly accounted for around 47% of the near 5ppt deceleration in investment growth in 2015. In early 2016, this drag has been reversed, with year-to-date growth in real estate investment troughing in late-2015, then strengthening from 3%yr at December to 9%yr in March.
The Westpac–Department of Industry, Innovation and Science China Resources QuarterlyThe Westpac–Department of
Industry, Innovation and Science China Resources Quarterly 11

This is a pleasing development which points to excess inventory of new housing having been wound down, and construction activity consequently strengthening.
Having effectively stalled in December at just 1.6%yr, the volume of housing sales turnover has accelerated rapidly over the three months to March, to now be up 38%yr. Annual growth in starts has also rebounded, from –7%yr in December to +27%yr currently.
In terms of the pricing detail, the net balance of 70 cities seeing month–on–month price appreciation in new dwellings rose sharply in early-2016, from +20% in December (41 rising, 27 declining) to +77% in March (62 rising, 8 declining). The equivalent figures for secondary markets are +14% in December (35 up, 25 down) and +59% in March (54 up, 13 down). This shift points to an uptrend taking hold, albeit one that is likely much stronger in some regions than others.
Comparing the annual price change across the three tiers highlights how concentrated the momentum is. Against a 29%yr gain for tier-1, tier-2 and tier-3 have respectively seen price growth of just 4%yr and 1%yr. A similar disparity is seen in the secondary market, tier-1 through 3 price growth being 36%yr; 4%yr; and 1%yr respectively. Herein is a material complication for policy makers. There is a need to manage exuberance in the most-developed and wealthy cities, while also seeking to promote a broadening of the recovery to tier-2 and 3.
Figures 7–9
Please refer to page 4 of The Westpac-DIIS China Resources Quarterly PDF version.
2.2 Monetary & financial conditions
The monetary policy stance has had a basic tightening posture since 2011, related to the unwinding of the stimulus–era legacy, periodically interrupted by a cyclical need to underpin growth and/or accommodate smooth refinancing. The annual flow of credit to GDP peaked at 40% in late 2009; hit a local trough of 25% of GDP in early 2012; rebounded to 33% of GDP in early 2013; then fell to a new low circa 21% of GDP at Q1 2016. While traditional bank loans were a major contributor to the stimulus package, much of the cyclical amplitude since has been related to shadow finance, dominated by the off–balance sheet activity of the banks themselves (figure 10).
Turning to the currency, last August authorities altered the way in which the Renminbi was managed, focusing on stability against a basket of currencies rather than the USD bilateral rate. Having initially fallen circa 6%, CNY is now 4% below its August level. The real effective RMB exchange rate is just over 2% lower than March 2015.
The Westpac–Department of Industry, Innovation and Science China Resources QuarterlyThe Westpac–Department of
Industry, Innovation and Science China Resources Quarterly 12

Coupled with real interest rates marginally below average (despite a series of cuts), a strong real exchange rate means financial conditions are restrictive, giving little (if any) impetus to the broader economy.
In aid of financial market stability and their longer–run objectives, Chinese authorities intervened in FX markets through the second half of 2015 and early-2016. For now, this decision looks to have proved effective in mitigating market concerns over the currency and China’s outlook. Improved sentiment in financial markets, aided by commodity price gains, has also been of considerable help.
It is also worth highlighting that there are additional factors behind the depletion of FX reserves, namely: a rise in foreign loans made by Chinese banks as well as outward FDI by Chinese corporates and citizens at a time of weaker export receipts. As internationalisation and development proceed, private flows will grow rapidly. Bank–related activity; outward direct investment; rapid growth in portfolio flows (from a very low base); and a growing services deficit will all become increasingly important avenues for goods’ surplus recycling.
Figures 10–12
Please refer to page 5 of The Westpac-DIIS China Resources Quarterly PDF version.
The Westpac–Department of Industry, Innovation and Science China Resources QuarterlyThe Westpac–Department of
Industry, Innovation and Science China Resources Quarterly 13
Table 1: General macroeconomic data
Mar–13 Jun–13 Sep–13 Dec–13 Mar–14 Jun–14 Sep–14 Dec–14 Mar–15 Jun–15 Sep–15 Dec–15 Mar–16
Real GDP %yr 7.8 7.5 7.9 7.6 7.3 7.4 7.1 7.2 7 7 6.9 6.8 6.7
Nominal GDP %yr 10.3 9.4 10.2 10.4 8.3 8.5 8.3 7.5 6.6 7 6.2 6 7.2
Contributions to real GDP percentage points ytd
Final consumption expenditure 4.3 3.4 3.5 3.7 5.5 4 3.6 3.7 4.5 4.1 4 4.6 na
Gross capital formation 2.3 4.1 4.3 4.2 3.1 3.6 3 3.4 1.2 2.6 3 2.5 na
Net exports 1.1 0.1 –0.1 –0.2 –1.2 –0.2 0.8 0.2 1.3 0.3 –0.1 –0.2 na
Secondary industry %ytd 7.7 7.6 7.8 7.9 7.5 7.6 7.5 7.3 6.3 6.1 6 6 5.8
Tertiary industry %ytd 8.3 8.3 8.3 8.3 7.6 7.6 7.6 7.8 8 8.3 8.4 8.3 7.6
Current Account %GDP 4qma 2.6 2.4 1.8 1.5 1.3 1.7 2.2 2.7 3.3 3.3 3.1 3.2 2.8
GDP deflator %yr 2.5 1.9 2.3 2.8 1 1.1 1.2 0.3 –0.4 0 –0.7 –0.8 0.5
Fixed investment deflator %yr 0.2 –0.1 0 0.9 1.1 0.6 0.4 –0.1 –0.9 –1.2 –2.3 –2.9 –2.7
Land price index %yr 3.9 5.1 6.2 7 7.5 7.2 6.1 5.2 3.8 3.4 3.5 3.2 3.6
Consumer price index %yr 2.4 2.4 2.8 2.9 2.3 2.2 2 1.5 1.2 1.4 1.7 1.5 2.1
Non–food %yr –2.5 –2.2 –1.4 –1.7 –1.9 –1.1 –2.2 –4.1 –4.6 –5.4 –5.9 –5.4 –3.9
Central revenue 4qma %yr 10.7 10.1 10.8 10.2 10.8 10.8 9.7 8.7 7.3 7.5 8.2 8.5 9.2
Central expenditures 4qma %yr 11.6 10.8 7.5 11.2 11.3 13.4 14.1 8.5 7.6 7.1 11.1 15.9 17.4
Central operating position 4qma %GDP –1.7 –1.7 –1.4 –1.8 –1.8 –2.3 –2.4 –1.8 –1.9 –2.2 –3 –3.5 –3.8
Money supply M2 %yr 15.7 14 14.2 13.6 12.1 14.7 12.9 12.2 11.6 11.8 13.1 13.3 14.9Bank loans (stock) %yr 14.9 14.2 14.3 14.1 13.9 14 13.2 13.6 14.7 14.4 15.8 15.4 15Total credit supply (new, rolling annual) %GDP 33 32.5 31.5 29.4 28 29 26 25.9 24 22.5 23.4 22.8 25.2
The Westpac–Department of Industry, Innovation and Science China Resources QuarterlyThe Westpac–Department of Industry, Innovation and Science China Resources Quarterly
14

Mar–13 Jun–13 Sep–13 Dec–13 Mar–14 Jun–14 Sep–14 Dec–14 Mar–15 Jun–15 Sep–15 Dec–15 Mar–16
Exports %yr 18.9 4.1 3.9 7.5 –4.7 5 13 8.6 10 –2.2 –5.9 –5.3 –8.6
to G3 3.4 –4.9 2.6 9.4 2.8 9.3 10.5 3.8 7.6 –1.0 –3.3 –4.2 –6.4
to Asia ex Japan 36.7 15.2 7.5 6.9 –10.3 2.8 16.2 13.3 9.9 –2.6 –7.4 –4.1 –9.0
to Australia 5.7 –5.3 3 –1.5 1.1 4.8 4.1 5.3 14.4 4.2 1 2 –1.0
to non–Asian emerging markets 22.2 0.4 –1.4 5.9 –3.3 3.9 14.6 10 16.6 –5.0 –10.0 –14.7 –16.1
Imports %yr 9.4 5.2 8.4 7.2 3.3 1.5 1.2 –1.4 –17.9 –13.5 –14.2 –12.0 –13.4
from G3 –0.8 –0.1 4.3 8.1 11.5 7.4 4.3 2.4 –11.8 –10.2 –13.0 –11.0 –9.8
from Asia ex Japan 17.5 8.1 7.3 1.5 –4.7 1.7 3.5 –0.4 –14.1 –11.4 –14.5 –9.2 –12.9
from Australia 7.5 9.1 19 33.5 24.8 2.4 –1.9 –20.5 –26.5 –30.9 –20.5 –18.5 –30.8
from non–Asian emerging markets –0.9 –6.8 4.9 6.3 2.4 4.5 0.8 –4.4 –36.7 –27.6 –20.5 –23.0 –11.3
Trade balance USDbn 43.5 65.7 61.5 90.5 16.6 85.9 128.1 149.5 123.7 139.5 163.6 174.8 125.7
Change in FX reserves USDbn 131 54 166 159 127 45 –106 –45 –113 –36 –180 –184 –118
Enterprise survey – net balance, 50 base
Business conditions 62.6 57.1 56.3 58.1 55.3 55.4 54.9 54.5 52.8 51.8 49.4 48.4 46.7
Profitability 52.8 55.6 55.1 57.6 50.9 54.1 55 55 51 52.8 51.1 50.5 47.2
Domestic orders 48.8 50.3 48.2 49.4 44.4 48.5 46.9 46.5 42.5 46.3 43.3 42.5 39.1
Foreign orders 46.6 49.9 50.1 48.7 45.4 49.7 49.9 47.9 44.2 48.7 46.3 43.7 41
Banking climate – % of average
Demand for loans 98.9 92.6 95.4 95 99.9 91.3 85.1 82.9 87.9 77.2 72.4 72.6 80.1
Ease of policy stance 91.6 91.5 72.6 73.6 68.7 74.1 84.3 90.3 96.9 118.7 110.1 121 115.2
Bankers’ confidence level 130.7 116 110.4 129.1 122.4 97.2 107 95 86 78.6 73.5 68.6 69
Westpac MNI Consumer Sentiment* – % of average
Headline composite 100.7 101.8 96.4 103.2 98.9 97.6 94.9 93 94.2 93 97.1 93.6 95.7
Expected family finances 102.1 103.7 96.9 104.2 98.1 99.7 95.2 92.5 94.4 93.5 99.5 93.7 96.9
House price expectations 100 99.8 103.8 102.3 105.8 104.6 105.8 104.5 106.5 105.4 107.5 103.8 105.6
The Westpac–Department of Industry, Innovation and Science China Resources QuarterlyThe Westpac–Department of Industry, Innovation and Science China Resources Quarterly
15

Employment outlook 108.5 107.6 97.1 109.9 99.4 99.5 94.4 93.1 93.6 92.9 90.5 89.7 87.9
Sources: Westpac Economics, CEIC, MNI.
The Westpac–Department of Industry, Innovation and Science China Resources QuarterlyThe Westpac–Department of Industry, Innovation and Science China Resources Quarterly
16

Table 2: Resource related economic indicators
Apr-15 May-15 Jun-15 Jul-15 Aug-15 Sep-15 Oct-15 Nov-15 Dec-15 Jan-16 Feb-16 Mar-16
Industrial production %yr 3mma 6.1 5.9 6.3 6.3 6.3 5.9 5.8 5.8 5.9 na na 5.9
Electricity –0.1 2.5 3.9 2.6 2.8 1.6 1.4 1.4 1.4 na na 5.9
Processed crude oil 4.8 8.2 7.2 6.2 5.6 4.7 3.3 2.2 2.8 na na 0.5
Cement* –14.4 –11.6 –6.6 –5.7 –5.1 –4.1 –3.6 –4.3 –4.3 na na 24.8
Steel products* 3.4 2.9 2.1 –0.2 –0.9 –1.4 –0.9 0 –0.7 na na 1.7
Non–ferrous metals* 19.9 21.1 23.5 22.6 21.2 18.4 16.1 13.6 9.9 na na 3.8
Automobiles* –0.6 –2.6 –5.2 –8.9 –10.6 –12.3 –7.0 0.1 8.8 na na 4.2
Civilian ships* 11 7 –1.7 –1.9 –0.7 –2.3 0.3 –9.8 –9.1 na na –14.7
Metal cutting tools* 6.9 5.2 9.7 2.5 –1.7 –14.9 –16.4 na na na na na
Apr–15 May–15 Jun–15 Jul–15 Aug–15 Sep–15 Oct–15 Nov–15 Dec–15 Jan–16 Feb–16 Mar–16
Fixed asset investment %yr 3mma 12.2 10.9 10.4 10.5 10.2 8.6 8.4 9 9 9.3 9.1 10.5
Manufacturing, of which 9.9 9.9 9.3 8.7 7.7 6.4 6.8 7.4 7.4 7.1 6.5 6.9
Heavy industry 7.5 6.8 7.1 6.2 5.4 3.4 4.9 4.9 5.7 4.4 4.1 4.4
Hard infrastructure, of which 20.5 18.5 17.3 17.3 18.8 16.6 15.5 16.7 15.4 16.3 13.9 17.8
Highways 21.9 20.5 21.1 18.4 14.9 12.2 13.8 15.7 13.4 10.8 7.6 8.9
Railways 34.5 44.3 23.7 26.7 12.3 3.4 –10.2 –10.7 –13.6 –13.4 –17.4 –8.7
Utilities 20.5 18.1 15.7 15.8 15.8 14.2 12.8 14.5 17.5 18.8 18.1 19
Real estate, of which 5.8 3.2 2.1 2.9 1.7 –0.4 –2.2 –3.5 –3.1 –1.3 1.4 5.2
Dwellings 3.5 0.6 0.7 2.3 1.7 –0.1 –1.8 –2.9 –3.0 –1.9 0.3 3.8
Non–residential 10.9 8.7 5.1 4.3 1.9 –1.1 –3.0 –4.8 –3.4 –0.2 3.6 8.2
Off–market urban construction –10.3 –20.9 –13.7 –29.8 –27.2 –37.5 –6.5 17 –6.8 –24.0 –46.5 –32.9
Value of new project starts 8.8 9.9 –0.2 –4.5 –3.8 1.2 –0.2 3.9 5.7 19.2 27.6 40.3
Number of new project starts 8.7 12.2 11.3 18 17.5 23.6 23.3 27.9 24 32.1 41.8 46.8
Local government projects 12.4 11 11 10.8 10.7 8.9 9.1 9.8 9.2 9.5 9.2 11
Central government projects 8.3 7.7 –2.9 2.8 0.3 3.2 –3.0 –4 5.3 4.4 5.1 0.1
State owned enterprise investment 12 10.1 10.7 11.9 12.5 10.2 10.6 11.7 9.7 12.6 14.5 22.1
The Westpac–Department of Industry, Innovation and Science China Resources QuarterlyThe Westpac–Department of Industry, Innovation and Science China Resources Quarterly
17

Apr-15 May-15 Jun-15 Jul-15 Aug-15 Sep-15 Oct-15 Nov-15 Dec-15 Jan-16 Feb-16 Mar-16
Volume of housing starts –17.4 –15.7 –14.2 –16.4 –17.7 –7.6 –8.6 –10 –17.4 –4.7 6.9 18.1
Volume of housing sales –3.6 6.8 12.7 16.6 16.6 14.2 9.7 7.7 5.2 12.8 19.3 31.3
Value of housing sales – Nationwide –9.4 –2.1 5.3 11.6 16.1 17.9 18.3 18 17.5 27.9 38.3 52.9
Eastern provinces –8.4 –0.6 8.8 17 22.9 25.1 25.4 24.7 23.7 36.2 48.9 67.8
Central provinces –12.3 –3.6 1.7 5.9 9 10.8 12 13.2 13.6 21.2 28.3 37.1
Western provinces –9.5 –5.1 –1.6 1.7 3.9 4.5 4.4 4.1 3.9 9.4 14.7 21.6
Volume of land sales –43.5 –41.7 –44.5 –30.6 –32.6 –33.6 –37.1 –34.9 –26.6 –21.8 –19.6 –11.3
70 city new house prices net % rising m–o–m –41.4 –32.9 –2.9 1.4 18.6 28.6 –8.6 11.4 20 20 45.7 77.1
Auto sales –7.1 17.1 32.9 34.3 34.3 30 27.1 34.3 14.3 17.1 8.6 58.6
Excavator sales 0.9 0.8 –1.1 –3.3 –4.1 –2.7 3.6 11.3 15.8 14.5 7.5 5.3
Bulldozer sales 6.5 4.8 0.5 –2.9 –4.4 –2.2 4.4 13.4 18.5 17.2 8.8 5.9
Terrestrial freight –49.7 –36.5 –33.6 –32.2 –32.3 –31.0 –31.6 –29.2 –28.4 –17.8 4 19.7
Aquatic freight 4.6 2.2 4.4 4.7 4 4 3.9 4.4 5.3 1 –4.6 –8.6
International air freight 1.2 0.8 1.6 4.1 4.1 4.6 5.3 5.9 4.7 2 0.5 0.9
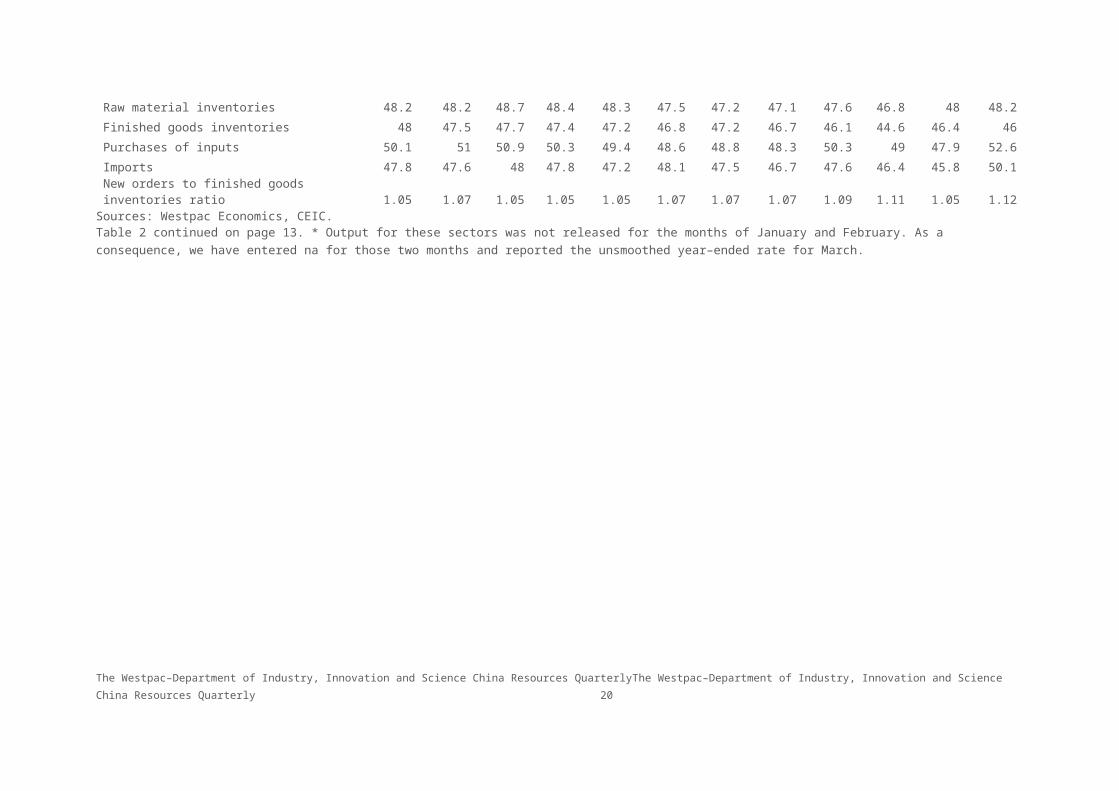
Manufacturing PMI – index – of which Apr–15 May–15 Jun–15 Jul–15 Aug–15 Sep–15 Oct–15 Nov–15 Dec–15 Jan–16 Feb–16 Mar–16
Output 50.1 50.2 50.2 50 49.7 49.8 49.8 49.6 49.7 49.4 49 50.2
New orders 52.6 52.9 52.9 52.4 51.7 52.3 52.2 51.9 52.2 51.4 50.2 52.3
New export orders 50.2 50.6 50.1 49.9 49.7 50.2 50.3 49.8 50.2 49.5 48.6 51.4
Order backlog 48.1 48.9 48.2 47.9 47.7 47.9 47.4 46.4 47.5 46.9 47.4 50.2
Raw material inventories 48.2 48.2 48.7 48.4 48.3 47.5 47.2 47.1 47.6 46.8 48 48.2
Finished goods inventories 48 47.5 47.7 47.4 47.2 46.8 47.2 46.7 46.1 44.6 46.4 46
Purchases of inputs 50.1 51 50.9 50.3 49.4 48.6 48.8 48.3 50.3 49 47.9 52.6
Imports 47.8 47.6 48 47.8 47.2 48.1 47.5 46.7 47.6 46.4 45.8 50.1
New orders to finished goods inventories ratio 1.05 1.07 1.05 1.05 1.05 1.07 1.07 1.07 1.09 1.11 1.05 1.12Sources: Westpac Economics, CEIC.Table 2 continued on page 13. * Output for these sectors was not released for the months of January and February. As a consequence, we have entered na for those two months and reported the unsmoothed year–ended rate for March.
The Westpac–Department of Industry, Innovation and Science China Resources QuarterlyThe Westpac–Department of Industry, Innovation and Science China Resources Quarterly
18

3. SteelSteel prices in China increased for the first time in three years in Q1 because of increased demand from China’s construction sector.
Growth in China’s construction fixed asset investment—up 37%yr in Q1—may have resulted in a temporary steel shortage and with very low inventories this would have provided some short-term support to domestic steel prices. Even so, China’s steel consumption was down 2.9%yr in Q1.
Figures 13–15
Please refer to page 10 of The Westpac-DIIS China Resources Quarterly PDF version.
Table 3: Steel prices (quarterly averages)
Domestic RMB/t Dec-13Mar-
14 Jun-14Sep-
14 Dec-14Mar-
15Jun-
15 Sep-15 Dec-15 Mar-16
Rebar 3527 3348 3258 3078 2940 2577 2435 2226 2055 2180
Hot-rolled sheet 3489 3399 3392 3272 3008 2636 2425 2071 1882 2188
Cold-rolled sheet 4342 4214 4096 4001 3898 3582 3160 2719 2423 2892
Plate 3455 3433 3448 3270 2962 2588 2404 2091 1916 2202
Wire rod 3519 3394 3347 3155 2952 2605 2471 2265 2083 2196
Benchmarks USD/t
Rebar benchmarker 477 454 431 408 392 344 314 274 251 261
HRC benchmarker 480 466 454 442 410 359 325 271 245 274
CRC benhmarker 611 597 562 551 534 489 424 356 322 364Source: Bloomberg.
China’s steel production was down 1.1%qtr and 4.1%yr to 192 Mt in Q1. However, the recent increase in prices may have induced a supply response in the latter part of the quarter—in the month of March, production was the highest since May 2014.
China’s automotive manufacturing sector also supported increased domestic steel demand in Q1. Steel use in automobile production is estimated to have increased by 7%yr to 14 Mt in Q1.
Authorities in the Chinese province of Hebei—which accounts for just under one-quarter of steel production in China—announced a ban on reopening of steel mills that have been previously ordered to shut down.
China’s steel exports grew 2.1%yr to 28 Mt in Q1, despite complaints about unfair competition from authorities in the United States and Europe.
Figures 16–20
Please refer to page 11 of The Westpac-DIIS China Resources Quarterly PDF version.
4. Iron oreIron ore prices averaged US$49 a tonne (CFR) in Q1, up 4.1%qtr but down 22%yr. Price volatility was high in Q1 and early Q2. On 7 March, the iron ore spot price recorded its largest ever one day rise of 19 per cent and on 21 April iron ore closed at US$70/t, the highest price since January 2015. Prices have lost some ground more recently, closing at US$56 a tonne on 13 May.
The March increase in China’s steel production and expectations of further investment stimulus provided support to prices in Q1. In addition, increased futures trading on the Dalian Commodity Exchange may have contributed to higher iron ore prices and price volatility in Q1 and early Q2. The volume of iron ore traded on the exchange was up 489%yr in Q1 to total 4.1 billion tonnes.
Figures 21–23
Please refer to page 12 of The Westpac-DIIS China Resources Quarterly PDF version.
Table 4: Iron ore prices (USD/t, 62% ferrous metal content unless otherwise indicated).
Qingdao spot price, CFRDec-
13Mar-
14Jun-
14Sep-
14Dec-
14Mar-
15Jun-
15Sep-
15Dec-
15Mar-
16
Quarter average 135 121 103 90 74 62 58 55 47 49
Quarter end 135 117 94 78 71 51 59 56 44 54
Quarter high 140 135 120 98 84 71 66 59 57 64
Quarter low 130 104 89 78 67 51 47 45 38 40Qingdao price in CNY terms, CFR 821 736 642 558 457 390 363 346 299 318
Sources: Bloomberg. CFR is cost including freight
Also supporting higher prices were announcements of modest declines in the production guidance for the world’s three largest producers—Rio Tinto, BHP Billiton and Vale. Despite these announcements, global supply is still expected to increase in 2016.
China’s iron ore port stocks remained at 89 Mt in Q1, but were down 4.1%yr.
China’s iron ore production (run of mine) fell 8%yr in the first two months of 2016, providing additional support to import demand from the domestic steel industry.
Figures 24–28
Please refer to page 13 of The Westpac-DIIS China Resources Quarterly PDF version.
China’s imports of iron ore rose 6.4%yr in Q1 to 242 Mt. The growth in imports mostly came from Brazil (up 12 Mt) and Australia (up 6 Mt), with imports from the rest of the world falling by 3.0 Mt. Australia’s share of the seaborne market into China stood at 62% in Q1, compared with 22% for Brazil and 16% for the rest of the world.

Australia’s iron ore export volumes into China declined 6%qtr but increased by 6%yr to 153 Mt in Q1. Export earnings decreased by 5%qtr and by 13%yr to A$9 billion.
Figures 29–33
Please refer to page 14 of The Westpac-DIIS China Resources Quarterly PDF version.
Table 5: Iron ore & metallurgical coal summary data
Iron ore Dec-
13Mar-
14Jun-
14Sep-
14Dec-
14Mar-
15Jun-
15Sep-
15Dec-
15Mar-
16
China iron ore imports Mt 219 222 235 242 234 227 226 246 254 242
Australia Mt 113 118 138 149 143 144 147 159 158 150
Brazil Mt 44 42 39 45 46 42 42 50 58 54
valueUSDbn 28 28 26 22 19 16 13 15 14 11
Raw production * Mt 405 304 394 411 389 281 350 382 363 naIron ore stocks at ports, end of qtr Mt 81 104 106 103 95 93 74 81 89 89
weeks of importsweeks 5 6 6 6 6 5 4 5 5 5
Exports to China Mt 127 122 146 150 152 144 155 164 162 153
valueAUDbn 16 14 13 12 11 10 10 10 9 9
Metallurgical coal
China met coal imports Mt 21 13 18 13 18 11 11 15 12 11
valueUSDbn 2418 1634 1812 1270 1736 980 883 1163 791 742
Australian exports to China Mt 14 10 12 11 13 8 11 9 9 9
valueAUDmn 1823 1248 1238 1143 1514 957 1160 926 892 953
Sources: Bloomberg, ABS, CEIC. * Raw mine output with a low iron content.

5. Metallurgical coalMetallurgical coal spot prices edged up slightly in Q1. The average price of Australian prime hard coking coal (FOB) was US$79 a tonne, up 1.8%qtr but down 27%yr. The average price of low volatility PCI (FOB) was US$66 a tonne, up 4.7%qtr but down 29%yr.
Spot prices for hard coking coal increased substantially from late March, with a number of trades reported at more than US$100 a tonne in April. An uptick in construction activity in China and reduced supply availability in Australia have been cited as the main drivers of this result.
Figures 34–36
Please refer to page 16 of The Westpac-DIIS China Resources Quarterly PDF version.
Table 6: Metallurgical coal prices (quarterly average spot prices).Dec-
13Mar-
14Jun-
14Sep-
14Dec-
14Mar-
15Jun-
15Sep-
15Dec-
15Mar-
16Aus Premium Hard FOB East Coast
USD/t 143 125 115 114 113 108 90 84 77 79
Aus Premium Hard CFR East Coast to China
USD/t 156 136 125 123 122 114 96 91 83 82
Source: Bloomberg
Australian benchmark prices for high-quality metallurgical coal delivered in the June quarter 2016 settled at US$84 a tonne, up from US$81 a tonne in the March quarter 2016.
China’s imports of metallurgical coal increased 5%yr to 11.4 Mt in Q1. Imports from Australia were 6 Mt. Australia accounted for 53% of China’s imports, Mongolia for 28%, Canada for 14% and Russia for 5%. The value of China’s metallurgical coal imports was US$0.7 billion in Q1.
Australia exported 9.3 Mt of metallurgical coal to China in Q1, up 2%qtr and 20%yr. The value of these exports was A$953 million, up 7%qtr but flat through the year.
Figures 37–41
Please refer to page 17 of The Westpac-DIIS China Resources Quarterly PDF version.

6. Developments in China’s energy policy In April, the National Energy Administration (NEA) announced plans to limit total energy consumption to around 4.34 billion tonnes of standard coal equivalent in 2016, with non-fossil fuel consumption rising by around 1.2%yr.
The Government aims to add over 20 million kilowatts of installed wind power and more than 15 million kilowatts of installed photovoltaic power in the next five years to increase renewable energy generation, with the long-term aim of reducing China’s carbon intensity by 60%-65% from 2005 levels by 2030.
The NEA announced in March that to end a bottleneck in power transmission that has kept clean energy idle, power transmission companies (primarily the State Grid Corporation of China and the China Southern Power Grid-the two largest power transmission companies) must provide grid connectivity for all renewable power generation sources.
In March, the National Reform and Development Commission and the NEA announced the establishment of China’s first electricity trading centres in Beijing and Guangzhou. The trading centres are a part of reforms to China’s electricity industry and aim to increase power supply efficiency.
Recent energy consumption data from the National Bureau of Statistics shows that China’s energy intensity has declined rapidly over the past few years. In 2015, China’s energy intensity declined 5.6%yr, following a 4.8%yr decline in 2014 and a 3.7%yr decline in 2013. The NEA aims to reduce energy intensity by 3.4%yr in 2016.
To promote the use of electric vehicles, China plans to invest RMB 30 billion (US$4.6 billion) in recharging-infrastructure in 2016.
China’s crude oil imports reached a record 91.1 million barrels in Q1. Low prices encouraged increased purchases from a group of new importers (reflecting a change in Government policy which allows non-state owned enterprises to import oil) and state and commercial stockpiling.
In February, the State Council announced that around 1.8 million jobs in the coal and steel sectors in China will be made redundant. The State Council also announced it will not approve any new coal production capacity over the next 3 years, and will remove around 500 Mt of production capacity within 3–5 years.
In January 2016, China launched a multi-billion dollar China-Latin America Cooperation Fund to promote collaboration in the development of renewable energy.
6.1 Electricity trends
China generated 478 billion kWh of electricity in March, a 6% increase relative to the same period in 2015. Over the same period, nuclear generation increased 42%yr, while wind increased 20%yr. Hydro electricity generation increased 11%yr and thermal electricity generation increased 4%yr.

Investment in new generation capacity decreased 18% in Q1 relative to the same period in 2015 to RMB 78 billion. Declines were registered across investment in all sources of energy with investment in nuclear, hydro, and thermal electricity generation declining by 5%yr, 17%yr, and 31%yr, respectively.
Overall electricity consumption in China decreased 4.5%qtr to 1352 billion kWh in Q1. Consumption across all sectors except tertiary and residential decreased in Q1 relative to 2015 Q4, as the economy departs from energy intensive sectors. Tertiary industry and residential electricity use increased by 11%qtr and 24%qtr, respectively. Primary and secondary industrial energy use declined by 14%qtr and 11%qtr, respectively.
Figures 42–47
Please refer to page 19 of The Westpac-DIS China Resources Quarterly PDF version
7. Thermal coalWeak demand from China and surplus supply capacity kept pressure on key thermal coal FOB prices in Q1. Newcastle spot prices declined 5%qtr, Baltic fell 11%qtr and Qinhuangdao (QHD) remained flat.
China’s coal consumption declined 3.7%yr to 910 Mt in Q1. Consumption was affected by slower economic growth, policies to diversify the energy mix and increased hydro-electric power generation.
China will halt the construction of new coal-fired power plants in 15 regions and stop approving new projects in as many as 13 provinces until 2018 to address overcapacity in its coal-fired power sector.
Figures 48–50
Please refer to page 20 of The Westpac-DIIS China Resources Quarterly PDF version.
Table 7: Thermal coal prices
Dec-13
Mar-14
Jun-14
Sep-14
Dec-14
Mar-15
Jun-15
Sep-15
Dec-15
Mar-16
Newcastle 6000 kcal USD/t 84.0 78.7 73.1 68.6 63.7 65.7 59.1 58.8 53.0 50.5Newcastle 6000 kcal AUD/t 90.7 87.4 78.2 74.0 75.1 83.8 76.1 81.3 73.5 69.9
Source: Bloomberg.
China’s coal production declined 5.3%yr to 811 Mt in Q1 because of efforts to restrict production.
The National Energy Administration (NEA) announced that more than 1000 coal mines will be closed in 2016 as part of plans to shut up to 500 Mt of capacity within 3–5 years.

China’s thermal coal imports declined 3%yr to 37 Mt in Q1 after falling in the first two months of the year before recovering in March. Australia’s share of China’s imports was 23% while Indonesia’s share was 47%.
Australia’s exports to China declined by 34%yr to 6.6 Mt in Q1. Export earnings declined by 46%yr to A$361 million.
Figures 51–55
Please refer to page 21 of The Westpac-DIIS China Resources Quarterly PDF version.
Table 8: Thermal coal summary data
Dec-
13Mar-
14Jun-
14Sep-
14Dec-
14Mar-
15Jun-
15Sep-
15Dec-
15Mar-
16
China imports Mt 68 71 58 50 50 38 40 42 36 37
valueUSDmn 4973 5145 4069 3346 3156 2255 2244 2096 1682 1568
EOQ stocks at ports Mt 23 27 31 26 29 32 28 23 16 13
weeks of imports weeks 4 5 7 7 8 11 9 7 6 4
Exports to China Mt 12 11 13 12 11 10 10 8 7 7
valueAUDmn 830 861 871 742 708 664 622 493 391 361
Sources: ABS; CEIC; Bloomberg.
8. OilIn April, oil prices recovered from lows recorded in early 2016. On average oil prices were significantly lower than average prices recorded for most of 2015, reflecting ongoing excess supply.
WTI prices averaged US$33.41/bbl in Q1, down 20%qtr. Brent prices declined 21%qtr to average US$35.21/bbl and Tapis declined 18%qtr to US$36.21/bbl.
There were no changes to China’s benchmark gasoline and diesel prices in Q1, because the National Development and Reform Commission unveiled a new pricing mechanism in mid-January. Price adjustments for oil products will be suspended when global crude oil prices fall below US$40/bbl.

Table 9: Crude oil spot prices (USD/bbl, quarterly)Brent Dec-13 Mar-14 Jun-14 Sep-14 Dec-14 Mar-15 Jun-15 Sep-15 Dec-15 Mar-16
Quarter average 109.4 107.9 109.8 103.5 77.1 55.1 63.5 51.3 44.7 35.2
Quarter end 110.8 107.8 112.4 94.7 57.3 55.1 63.6 49.6 37.3 39.6
Quarter high 112.6 111.2 115.1 112.3 94.2 62.6 67.8 62.1 53.1 41.8
Quarter low 103.5 105.8 104.8 94.7 57.3 46.6 55.0 42.7 36.1 27.9
Tapis
Quarter average 117.2 114.3 115.0 106.2 79.5 56.1 64.6 52.6 44.2 36.2
Quarter end 120.7 113.2 117.0 100.2 58.6 55.9 63.3 53.0 35.6 40.7
Quarter high 121.7 118.6 119.4 115.0 98.4 64.2 70.3 64.7 53.7 42.9
Quarter low 110.8 111.7 110.1 98.7 58.6 47.4 56.8 43.8 35.6 27.7
West Texas Intermediate
Quarter average 97.6 98.7 103.1 97.6 73.2 48.5 57.8 46.5 42.0 33.4
Quarter end 98.4 101.6 105.4 91.2 53.3 47.6 59.5 45.4 37.0 38.3
Quarter high 104.1 104.9 107.3 107.6 91.0 53.5 61.4 57.0 49.6 40.2
Quarter low 92.3 91.7 99.4 91.2 53.3 43.5 49.1 38.1 34.7 26.2
Source: Bloomberg

China’s imports of crude oil increased 13%yr to a record 91.1 Mt in Q1, supported by significantly lower oil prices and changes in government policy that allow for non-state owned enterprises to import some oil.
China’s imports of crude oil from Iran decreased 5%yr in Q1 to 6.4 Mt. Imports from Saudi Arabia, Angola and Russia increased 7%yr, 16%yr and 42%yr in Q1, respectively.
In Q1 China’s crude oil imports from Australia increased 18%yr to 0.7 Mt. Australia’s export earnings declined 12%yr to US$217 million..
Figures 59–63
Please refer to page 24 of The Westpac-DIIS China Resources Quarterly PDF version.
9. GasChina’s LNG import and gas pipeline unit values both declined in Q1 by 10%qtr and 7%qtr, respectively.
ENN Energy Holdings, one of China’s largest gas distributors, announced in March that its gas sales have increased more than 15% in the first two months of the year, as lower gas prices have incentivised consumers to switch from coal to gas. This follows the lowest growth rate in gas consumption in China over the past decade with an increase of only 3.7%yr in 2015.
The Yamal LNG project announced in April that it had secured around US$12 billion in funding from China Exim Bank and China Development Bank. China is expected to be a major recipient of gas from the Yamal LNG development. In total Yamal LNG is expected to cost around US$27 billion.
Figures 64–68
Please refer to page 26 of The Westpac-DIIS China Resources Quarterly PDF version.
China’s LNG imports increased 17%yr in Q1 to 6 Mt. LNG imports from Qatar increased 43%yr to 1.9 Mt in Q1, while imports from Malaysia and Indonesia declined 22%yr to 0.6 Mt and 31%yr to 0.5 Mt, respectively.
China’s LNG imports from Australia continued to account for the majority of its total LNG imports in Q1 at 34%. Imports from Australia increased 85%yr in Q1 to 2 Mt. Export earnings increased 122%yr to US$600.5 million.
Figures 69–73
Please refer to page 27 of The Westpac-DIIS China Resources Quarterly PDF version.

Table 10: Oil and gas summary data
Oil Dec-13 Mar-14 Jun-14 Sep-14 Dec-14 Mar-15 Jun-15 Sep-15 Dec-15 Mar-16
China imports Mt 71 75 77 77 80 80 83 85 87 91Saudi
Arabia Mt 13 13 11 12 13 13 14 12 12 14
Angola Mt 9 11 10 9 10 10 9 10 9 11Russian
Federation Mt 6 7 8 8 10 9 11 11 12 12
Iran Mt 5 7 9 6 6 7 8 6 6 6
Oman Mt 7 6 9 8 8 8 6 9 9 8
other Mt 30 31 31 33 33 35 35 37 39 39
China production
Crude Mt 53 51 52 52 54 52 54 54 54 na
Gasoline Mt 25 27 27 27 29 29 31 31 31 na
Diesel Mt 44 42 43 44 46 44 46 45 45 na
Chinese imports from Australia kt 462 731 712 744 540 600 557 541 690 709
value USDmn 393 600 567 595 342 247 269 252 246 217
Gas
China pipeline imports Mt 5 5 6 6 6 7 6 6 7 8
China LNG imports kt 5140 5629 4297 4811 5155 5127 4392 4627 5522 6017
Qatar kt 1785 2570 1380 1329 1458 1323 711 1153 1628 1891
Australia kt 906 843 905 1162 902 1094 1286 1672 1500 2024
Indonesia kt 677 617 608 676 653 672 745 817 631 466
Malaysia kt 685 843 698 623 829 820 1128 474 830 643
other kt 1087 756 705 1021 1312 1218 521 512 934 995
China production Bcm 30 32 29 29 34 34 29 30 34 naChinese
imports from Australia kt 906 843 905 1162 902 1094 1286 1672 1500 2024

value USDmn 160 146 160 239 173 271 433 485 444 601Source:
CEIC.

10. UraniumFigures 74–77
Please refer to page 28 of The Westpac-DIIS China Resources Quarterly PDF version.
Table 11: Uranium summary data.
Dec-
13Mar-
14Jun-
14Sep-
14Dec-
14Mar-
15Jun-
15Sep-
15Dec-
15Mar-
16
Uranium spot priceUS$/lb U3O8 35 35 29 32 37 38 36 36 35 32
China nuclear power generation
billion kWh 30 27 28 38 37 35 42 50 45 na
Investment in nuclearRMB billion 20 11 13 14 19 10 11 13 23 9
China uranium imports t 6216 4045 6801 4985 9281 2041 5659 7505 7439 na
lueUSDmn 677 396 675 482 810 210 587 721 691 naSource: CEIC, Cameco, UxC Consulting
The average spot price for uranium fell by 10%qtr and 16%yr in Q1 to US$32/lb.
China’s investment in new nuclear capacity fell by 6%yr to RMB 9 billion in Q1.
China has 32 nuclear reactors in operation and 22 nuclear reactors under construction as of Q1, with China General Nuclear Power Corporation’s (CGN) Yangjiang-3 and Fangchenggang-1 reactors commencing commercial operations in January 2016.
China’s 13th Five-Year Plan announced in March 2016 sets a target of 58 GWe of nuclear generation capacity by end of 2020, with a further 30 GWe of nuclear generation capacity planned.
Figures 78–82
Please refer to page 29 of The Westpac-DIS China Resources Quarterly PDF version.

11. GoldThe average LBMA gold price increased 7%qtr in Q1 to $US1182 a troy ounce, after having declined in the previous three quarters. Shanghai Gold Exchange prices averaged $US38 a gram, up 7%qtr.
The rise in prices came despite the US Federal Reserve lifting interest rates in December 2015 for the first time in almost a decade. Negative interest rates in Europe and Japan, uncertainty about the global economy, and financial market volatility all lent support to prices during Q1.
The Shanghai Gold Exchange launched a yuan-denominated benchmark price on 19 April. The benchmark price was launched at 258 yuan a gram and had increased to around 265 yuan a gram in early May. The price is fixed twice a day with eighteen institutions participating, including Chinese banks, jewellers and miners.
World ETF gold holdings increased by 330 tonnes in Q1 after three quarters of consecutive decline. The increase reflected stronger demand from investors. Gold holdings in Chinese gold ETFs increased by 11 tonnes to be 17 tonnes at the end of Q1 with Chinese investors taking a more bullish view on gold prices after Chinese New Year.
World physical gold demand declined 24%yr in Q1 to 781 tonnes weighed down by higher prices. Although there is typically an increase in jewellery purchases in the first two months of the year because of Chinese New Year, jewellery consumption in China decreased 27%yr in Q1 due to soft consumer sentiment and weaker economic conditions.
Figures 83–84
Please refer to page 30 of The Westpac-DIIS China Resources Quarterly PDF version
Table 12: Gold prices (USD/troy oz unless specified otherwise)
LBMA spot prices Dec-13Mar-
14 Jun-14 Sep-14 Dec-14Mar-
15 Jun-15 Sep-15 Dec-15Mar-
16
Quarter average 1272 1292 1290 1282 1201 1219 1194 1125 1104 1182
Quarter end 1206 1284 1327 1208 1185 1184 1172 1115 1061 1233
Quarter high 1353 1383 1328 1339 1249 1302 1226 1170 1184 1272
Quarter low 1189 1201 1244 1208 1141 1150 1172 1085 1051 1061Shanghai avg RMB/g 251 256 259 255 238 246 239 229 228 248Shanghai avg USD/g 41 42 41 41 39 39 38 36 36 38Sources: LBMA, Bloomberg
World gold supply increased 4%yr in the first two months of 2016. Production in China—the world’s largest producer—increased 0.3%yr.
China’s gold imports via Hong Kong were 92 tonnes in the first two months of 2016, down 41%yr.

Australia exported 37 tonnes of gold to China in Q1, down 29%qtr and 5%yr. The value of gold exports was A$1.9 billion, down 24%qtr and flat through the year.
Figures 85–89
Please refer to page 31 of The Westpac-DIIS China Resources Quarterly PDF version.
Table 13: Gold and silver summary data
Dec-
13Mar-
14Jun-
14Sep-
14Dec-
14Mar-
15Jun-
15Sep-
15Dec-
15Mar-
16
GoldChina imports (via Hong Kong) t 382 333 204 169 389 229 179 242 343 92
Domestic production t 120 96 115 141 100 111 118 111 111 37Australian exports to China t 51 47 40 30 42 39 40 56 52 37
ueAUDmn 2255 2174 1774 1318 1899 1952 1975 2801 2560 1943
Silver
China imports t 78 68 90 84 76 118 217 332 230 219
Domestic production t 918 918 918 918 918 918 918 918 918 naSources: ABS, CEIC, WMS
12. SilverFigures 90–93
Please refer to page 33 of The Westpac-DIIS China Resources Quarterly PDF version.
Table 14: Silver prices (USD/oz unless specified otherwise)LBMA spot prices Dec-13 Mar-14 Jun-14 Sep-14 Dec-14 Mar-15 Jun-15 Sep-15 Dec-15 Mar-16
Quarter average 20.8 20.5 19.7 19.7 16.5 16.7 16.5 14.9 14.8 14.9
Quarter end 19.5 19.8 21.0 17.0 15.7 16.7 15.7 14.5 13.9 15.4
Quarter high 22.8 22.0 21.1 21.4 17.5 18.3 17.7 15.2 16.1 15.9
Quarter low 19.1 19.2 18.8 17.0 15.3 15.5 15.7 14.4 13.7 13.8Shanghai avg RMB/g 4.24 4.15 4.15 4.22 3.60 3.58 3.54 3.31 3.28 3.32
Shanghai avg USD/g 0.70 0.68 0.67 0.68 0.58 0.57 0.57 0.53 0.51 0.51
Sources: LBMA, Bloomberg

13. CopperThe average LME copper price declined by 4%qtr in Q1 to be US$4672 a tonne—the lowest quarterly price in six years. The SHFE copper price declined by 2%qtr to RMB 36,165 a tonne.
World and LME copper stocks were down 57%yr and 45%yr, respectively, at the end of Q1. Conversely, SHFE inventories increased to 369 kt at the end of Q1, up 107%qtr and 51%yr. The reasons cited for rising stocks in China include arbitrage opportunities and expectations of a weaker yuan.
China’s State Reserve Bureau was reported to be seeking 150 kt of domestically refined copper to support local producers during the downturn in prices.
Figures 94–96
Please refer to page 34 of The Westpac-DIIS China Resources Quarterly PDF version.
Table 15: Copper prices (USD/t unless specified otherwise)LME spot prices Dec-13 Mar-14 Jun-14 Sep-14 Dec-14 Mar-15 Jun-15 Sep-15 Dec-15 Mar-16
Quarter average 7153 7041 6787 6994 6624 5818 6043 5259 4892 4672
Quarter end 7395 6636 6955 6736 6359 6051 5721 5093 4702 4856
Quarter high 7395 7440 7035 7184 6860 6309 6448 5762 5344 5103
Quarter low 6939 6435 6600 6736 6306 5391 5646 4888 4516 43113 Month forward 7161 7008 6757 6976 6568 5790 6046 5261 4885 4665Shanghai avg RMB/t 51555 49403 49328 50273 47525 42391 44074 39913 36954 36165Shanghai avg USD/t 8468 8097 7915 8156 7729 6799 7104 6335 5779 5532
Sources: LME, Bloomberg
China’s refined copper consumption was 2 Mt in the first two months of 2016, up 31%yr.
China’s refined copper production was 1.4 Mt in the first two months of 2016, up 17%yr. However, key Chinese smelters have agreed to cut output by a minimum 350 kt in 2016 in response to low prices.
China’s total copper imports increased 34%yr in Q1. Australia was the third largest source of China’s imports with a 6% market share. Chile accounted for 30% of China’s imports and Peru accounted for 15%.
Australia’s copper export volumes (metal content) to China increased 3%yr to 112 kt in Q1. Export earnings decreased 10%yr to A$701 million.
Figures 97–101
Please refer to page 35 of The Westpac-DIIS China Resources Quarterly PDF version.
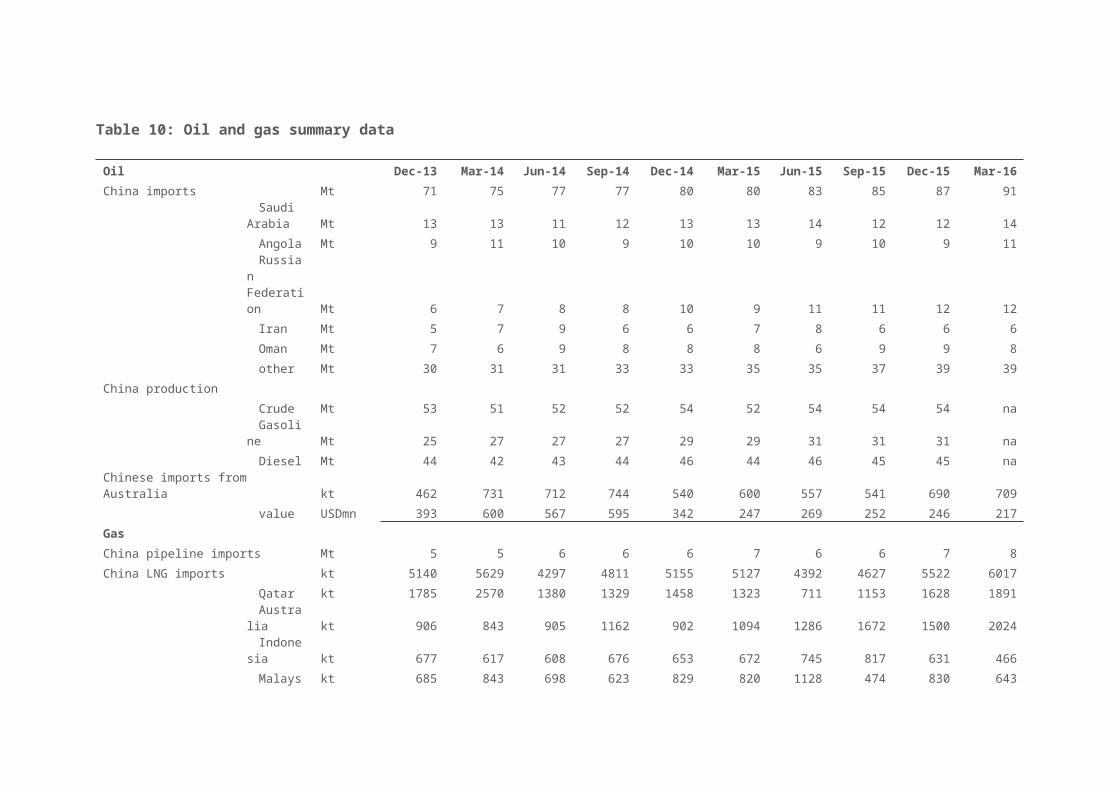
Table 16: Copper summary data Dec-13 Mar-14 Jun-14 Sep-14 Dec-14 Mar-15 Jun-15 Sep-15 Dec-15 Mar-16
China
total imports kt 1819 1836 1699 1725 1935 1729 1774 1886 2324 2320Austra
lia kt 128 165 144 140 152 116 142 123 174 134
Chile kt 574 542 538 438 629 569 558 580 717 702
Peru kt 213 182 182 196 205 172 192 267 300 346
other 904 946 834 950 949 872 883 916 1133 1138
refined production kt 1909 1651 1823 2027 2321 1834 1951 2009 2205 na
total world stocks kt 916 909 694 700 769 1037 934 963 911 571
stocks - weeks weeks 2.1 2.2 1.5 1.6 1.7 2.5 2.1 2.3 2.0 1.9
Australian exports to China kt 154 121 128 126 138 109 122 139 158 112
value AUDmn 1209 961 881 902 1045 778 921 1002 1064 701Sources: Bloomberg, World Metal Statistics, ABS

14. Aluminium In Q1, SHFE and LME aluminium spot prices averaged RMB 11,024 and US$1516 a tonne, up 5%qtr and 1.4%qtr, respectively because of production cuts. Cuts to global production since late 2015 contributed to a 4%qtr reduction in LME stocks in Q1, reaching a multi-year low of 2756 kt at the end of February 2016.
China’s aluminium production increased 9%yr as new capacity came online during 2015. However, production decreased 9%qtr to 7.1 Mt in Q1 as smelters have been required to curtail production under the “Supply Side Reform” policy initiated by the government.
China’s exports of unwrought aluminium and aluminium products decreased 10%qtr and 11%yr to 1080 kt in Q1 as countries such as India imposed higher import duties on aluminium products from China.
Figures 102–104
Please refer to page 37 of The Westpac-DIIS China Resources Quarterly PDF version.
Table 17: Aluminium prices (USD/t unless specified otherwise)
LME spot prices Dec-13 Mar-14 Jun-14Sep-
14 Dec-14 Mar-15 Jun-15 Sep-15 Dec-15 Mar-16
Quarter average 1769 1708 1798 1987 1966 1800 1765 1591 1495 1516
Quarter end 1765 1731 1851 1935 1832 1789 1647 1562 1508 1492
Quarter high 1849 1768 1871 2114 2099 1872 1919 1693 1608 1622
Quarter low 1695 1642 1715 1838 1828 1742 1642 1486 1424 1453
3 Month forward 1815 1752 1836 2008 1974 1813 1787 1621 1509 1516
Shanghai avg RMB/t 14349 13168 13133 14069 13507 12849 12964 12000 10500 11024
Shanghai avg USD/t 2356 2158 2107 2282 2197 2060 2090 1904 1642 1686
Aus FOB alumina 320 328 318 323 355 342 337 292 233 221China Alumina RMB/t 2503 2438 2353 2435 2737 2630 2442 2272 1853 1721
Sources: LME, Bloomberg
China’s aluminium imports were 26 kt in Q1, down 64%qtr and 23%yr as domestic production continued to displace imports. Imports from Australia decreased 62%qtr and 26%yr to nearly 6 kt. Despite this fall in imports, Australia’s share of China’s total imports increased to 22% in Q1.
Australia’s aluminium exports to China declined 58%yr, to 1.4 kt in Q1 and export earnings fell 65%yr to just over A$3 million.
Figures 105–109
Please refer to page 38 of The Westpac-DIIS China Resources Quarterly PDF version.

15. AluminaAlumina prices averaged US$221 a tonne in Q1, down 5%qtr and 36%yr, due to a sustained increase in global supply.
In 2015, China’s alumina production increased 20%yr to 56 Mt, driven by increased production from new capacity.
China imported 1240 kt of alumina in Q1, down 18%qtr, due to lower aluminium production.
Alumina imports from Australia decreased 29%qtr to 703 kt in Q1. Australia remained the principal source of China’s alumina imports. However, its market share fell 8%qtr from 65% in the December 2015 quarter, driven by increased imports from Brazil and Vietnam.
Figures 110–114
Please refer to page 39 of The Westpac-DIIS China Resources Quarterly PDF version
.
16. BauxiteChina, the world’s second largest bauxite producer, produced 65 Mt in 2015, unchanged from 2014.
China imported 13.6 Mt of bauxite in Q1, up 36%yr. Growth in China’s bauxite imports was largely attributable to increased imports from Brazil (up 256%yr) and Malaysia (up 79%yr). Despite being the principal source of China’s bauxite imports in 2015, Malaysia’s market share decreased 15%qtr to 33% in Q1 as Malaysia’s government limited supply growth to address socio-environmental concerns.
Guinea has emerged as a key competitive supplier. During Q1, China sourced 1.7 Mt of bauxite from Guinea, up 519%qtr and 1700%yr.
The Indonesian Government is planning to amend its bauxite export ban rule implemented since early 2014 and allow Indonesia’s bauxite producers to resume bauxite exports to China in the second half of 2016. Prior to the export ban, Indonesia was the largest source of China’s bauxite imports. The change is likely to increase the supply available for China’s bauxite import markets and put further pressure on Australia’s bauxite exporters.
Australia is a key source of China’s bauxite imports with a market share of 29%. In Q1, bauxite exports from Australia were up to 5 Mt, an increase of 9%yr. Earnings from bauxite exports decreased 7%yr to A$219 million.
Figures 115–118
Please refer to page 40 of The Westpac-DIIS China Resources Quarterly PDF version.

Table 18: Aluminium, alumina and bauxite summary data Dec-13 Mar-14 Jun-14 Sep-14 Dec-14 Mar-15 Jun-15 Sep-15 Dec-15 Mar-16
China imports kt 193 176 96 51 31 34 46 70 73 26Austr
alia kt 32 48 19 7 6 8 3 13 15 6
India kt 18 19 1 1 2 7 2 0 1 0
Russia kt 46 30 24 17 2 2 4 4 1 0
other kt 98 79 52 27 21 19 37 53 57 20
refined production kt 5837 5755 5747 6045 6393 7205 8010 8185 7889 na
total world stocks kt 7171 7377 7145 6738 6428 4807 4549 4145 3783 na
stocks - weeks 8 7 7 7 6 5 4 4 4 na
Australian exports to China kt 35 34 10 5 6 3 3 19 11 1
value AUDmn 76 73 21 14 18 9 9 47 27 3
Alumina
China imports kt 1354 1484 1281 1158 1354 933 880 1329 1512 1240
Australia kt 1177 1184 655 523 791 455 555 869 987 703
Production Mt 11 11 12 12 13 13 14 14 15 na
Bauxite
China imports Mt 18 13 7 8 8 10 13 16 17 14
Australia Mt 3 3 4 5 4 5 5 6 4 4
Malaysia Mt 0 0 0 1 2 2 5 8 8 4
Australian exports to China Mt 4 3 4 5 5 5 5 5 5 5
value AUDmn 151 87 141 182 227 235 257 268 251 219Sources: ABS, Bloomberg, World Metal Statistics, CEIC

17. NickelThe LME nickel price averaged US$8499 a tonne in Q4, down 41%yr and 10%qtr. This is the lowest quarterly price recorded since June 2003. At these prices, it is estimated that around 70% of global nickel miners are operating at a loss on an operating cost basis.
China’s port stocks of nickel ore are estimated to have decreased by 27%yr to 13.1 Mt at the end of Q1.
In Q1, LME stocks declined by 2.2%qtr to 432 kt, while SHFE stocks increased 52%qtr to 73 kt.
China’s refined nickel production decreased by 6%yr in 2015 to 343 kt. Production in Gansu increased 3.3%yr to 153 kt, while production in Guangxi and Jiangxi decreased 75%yr to 5 kt and 52%yr to 19 kt, respectively.
Figures 119–121
Please refer to page 42 of The Westpac-DIIS China Resources Quarterly PDF version.
Table 19: Nickel prices (USD/t unless specified otherwise)LME spot prices Dec-13 Mar-14 Jun-14 Sep-14 Dec-14 Mar-15 Jun-15 Sep-15 Dec-15 Mar-16
Quarter average 13909 14643 18465 18576 15799 14338 13008 10561 9437 8499
Quarter end 13970 15735 18715 16505 14935 12460 11680 10070 8665 8280
Quarter high 14635 16225 21200 19795 16825 15455 14415 12060 10710 9375
Quarter low 13270 13365 15780 16505 14650 12460 11680 9305 8160 77103 Month forward 13979 14693 18512 18669 15877 14400 13055 10611 9481 8542Shanghai avg RMB/t 96837 96380 128595 128862 109421 106548 98129 80765 72228 67885Shanghai avg USD/t 15906 15786 20634 20905 17793 17089 15817 12826 11296 10383
Sources: LME, Bloomberg
The value of China’s nickel imports increased by 33%yr in Q1 to US$1.2 billion. China’s nickel imports from Russia increased by 239%yr to US$654 million, while imports from the Philippines decreased 66%yr to US$101 million and imports from Australia decreased 12%yr to US$71 million.
The value of Australia’s nickel ores and concentrate exports is estimated to have decreased by 21%yr in Q1 to A$104 million.
Figures 122–126
Please refer to page 43 of The Westpac-DIIS China Resources Quarterly PDF version.

Table 20: Nickel summary data Dec-13 Mar-14 Jun-14 Sep-14 Dec-14 Mar-15 Jun-15 Sep-15 Dec-15 Mar-16
China imports USDmn 2095 1585 1625 2314 1251 904 1918 1951 1510 1201
Australia USDmn 112 67 112 99 71 81 87 97 48 71
Canada USDmn 89 96 85 102 57 72 107 98 87 86
Russia USDmn 233 326 402 396 146 193 655 784 644 654
Indonesia USDmn 914 712 28 8 1 0 0 1 0 0
Philippines USDmn 448 171 720 1375 694 294 562 612 313 101
other USDmn 299 212 276 334 282 265 507 359 418 289
Refined production kt 87 75 90 99 102 82 93 91 77 na
LME stocks kt 282 285 305 356 413 434 456 452 441 432
stocks - weeks weeks 7.0 8.4 9.5 10.2 13.9 14.7 11.5 11.2 11.3 na
Australian ores and conc. exports kt 103 71 78 103 85 67 72 81 82 81
value AUDmn 188 131 162 219 182 132 113 140 136 104Source: Bloomberg, World Metal Statistics, International Nickel Study Group

18. ZincThe LME zinc spot price averaged US$1679 a tonne in Q1, an increase of 4.0%qtr but a decline of 19%yr. Zinc was one of the best performing metals in Q1, as closure of mines and curtailed production at operating mines led to LME stockpiles falling to lowest in six years. According the International Lead and Zinc Study Group the global market for refined zinc recorded a deficit of 60,000 t in the second half of 2015.
LME stocks decreased 6%qtr to end Q1 at 436 kt. However, stocks held at the SHFE increased by 35%qtr to 271 kt.
China’s refined zinc production increased 7.2% to total 6.2 Mt in 2015. Growth was particularly strong in Shaanxi, where production increased 14%yr to 956 kt, and Gansu, where production increased 48%yr to 404 kt.
Figures 127–129
Please refer to page 45 of The Westpac-DIIS China Resources Quarterly PDF version.
Table 21: Zinc prices (USD/t unless specified otherwise)LME spot prices Dec-13 Mar-14 Jun-14 Sep-14 Dec-14 Mar-15 Jun-15 Sep-15 Dec-15 Mar-16
Quarter average 1907 2029 2073 2311 2235 2080 2190 1847 1613 1679
Quarter end 2086 1981 2205 2290 2167 2076 1994 1657 1600 1785
Quarter high 2116 2156 2205 2420 2335 2184 2405 2096 1835 1860
Quarter low 1828 1942 1962 2194 2114 1985 1994 1587 1462 14543 Month forward 1932 2027 2079 2314 2241 2092 2192 1855 1634 1683Shanghai avg RMB/t 14969 14953 15155 16542 16655 16127 16399 14840 13347 13560Shanghai avg USD/t 2459 2450 2432 2683 2709 2586 2643 2356 2087 2074
Sources: LME, Bloomberg
China’s total zinc imports (refined and ore) increased 28%yr in 2015 to 1915 kt as consumers took advantage of lower prices. Imports from Australia increased 35%yr to 670 kt. Imports from Peru increased 49%yr to 428 kt, while imports from Turkey decreased 45%yr to 11 kt.
Australia’s zinc exports (by metal content) to China increased 31%yr to 142 kt, with export earnings growing by 34%yr to A$254 million in Q1.
Figures 130–134
Please refer to page 46 of The Westpac-DIIS China Resources Quarterly PDF version.

Table 22: Zinc summary data Dec-13 Mar-14 Jun-14 Sep-14 Dec-14 Mar-15 Jun-15 Sep-15 Dec-15 Mar-16
China imports kt 428 431 347 353 370 391 410 506 608 naA
ustralia kt 143 139 120 111 125 112 132 148 279 na
Kazakhstan kt 40 50 34 53 41 36 52 41 33 na
Peru kt 56 58 65 66 99 106 100 101 122 na
Turkey kt 10 6 5 6 3 0 4 1 5 na
other kt 180 180 123 118 103 137 123 216 170 na
refined production kt 1445 1259 1406 1508 1607 1458 1613 1574 1551 na
total world stocks kt 1472 1511 1283 1330 1192 1108 1111 1215 1112 na
stocks - weeks weeks 5.6 6.2 4.9 4.9 4.5 4.5 4.0 4.5 4 na
Australian exports to China kt 190 119 91 90 204 109 183 198 274 142v
alue AUDmn 282 195 152 150 350 189 295 318 458 254
Source: Bloomberg, World Metal Statistics, International Lead and Zinc Study Group, CEIC

19. LeadFigures 135–138
Please refer to page 48 of The Westpac-DIIS China Resources Quarterly PDF version.
Table 23: Lead prices (USD/t unless specified otherwise)LME spot prices Dec-13 Mar-14 Jun-14 Sep-14 Dec-14 Mar-15 Jun-15 Sep-15 Dec-15 Mar-16
Quarter average 2111 2106 2096 2181 2000 1806 1942 1714 1613 1744
Quarter end 2206 2041 2129 2083 1853 1808 1754 1656 1600 1705
Quarter high 2259 2212 2160 2269 2095 1882 2140 1857 1835 1897
Quarter low 2027 2008 2016 2051 1814 1696 1742 1625 1462 15973 Month forward 2134 2127 2120 2194 2009 1817 1952 1725 1634 1745Shanghai avg RMB/t 14109 13928 13922 14208 13452 12494 13494 13336 13207 13593Shanghai avg USD/t 2317 2282 2234 2305 2184 2004 2175 2116 2065 2079
Sources: LME, Bloomberg
Table 24: Lead summary data
Dec-
13Mar-
14Jun-
14Sep-
14Dec-
14Mar-
15Jun-
15Sep-
15Dec-
15Mar-
16
China imports kt 242 224 214 285 273 220 197 238 350 na
a kt 30 50 29 48 52 39 32 29 46 na
kt 9 18 3 18 26 18 27 30 40 na
kt 40 23 26 15 34 24 20 22 38 na
kt 46 6 27 67 68 26 24 62 85 na
kt 7 7 14 9 17 14 6 13 16 na
kt 111 121 116 128 76 100 89 94 125 na
refined production kt 1141 1056 1105 1050 1065 995 1062 898 954 na
total world stocks kt 586 562 542 577 560 546 468 449 473 na
stocks - weeks weeks 3 3 3 3 3 3 2 2 3 naAustralian exports to China kt 52 46 64 55 59 34 33 34 48 6
AUDmn 97 86 105 97 123 72 75 77 114 16Source: Bloomberg, World Metal Statistics, International Lead and Zinc Study Group, CEIC
20. TinFigures 139–144
Please refer to page 50 of The Westpac-DIIS China Resources Quarterly PDF version.

21. MolybdenumFigures 145–150
Please refer to page 51 of The Westpac-DIIS China Resources Quarterly PDF version.
22. TungstenFigures 151–156
Please refer to page 52 of The Westpac-DIIS China Resources Quarterly PDF version.
23. CobaltFigures 157–162
Please refer to page 53 of The Westpac-DIIS China Resources Quarterly PDF version.
24. AntimonyFigures 163–168
Please refer to page 54 of The Westpac-DIIS China Resources Quarterly PDF version.
25. Platinum & PalladiumFigures 169–174
Please refer to page 55 of The Westpac-DIIS China Resources Quarterly PDF version.
26. Mineral SandsFigures 175–180
Please refer to page 56 of The Westpac-DIIS China Resources Quarterly PDF version
.
27. China’s exports of rare earth oxidesFigures 181–186
Please refer to page 57 of The Westpac-DIIS China Resources Quarterly PDF version.
28. Magnesium & CadmiumFigures 187–192
Please refer to page 58 of The Westpac-DIIS China Resources Quarterly PDF version.
29. Diamonds and MagnesiumFigures 193–198
Please refer to page 59 of The Westpac-DIIS China Resources Quarterly PDF version.

Table 25: China mineral and energy import summaryChina's imports unit Mar-14 Jun-14 Sep-14 Dec-14 Mar-15 Jun-15 Sep-15 Dec-15 Mar-16
Iron ore Mt 222 235 242 234 227 226 246 254 242
Australia Mt 118 138 149 143 144 147 159 158 150
share % 53 59 62 61 64 65 64 62 62
Thermal coal Mt 71 58 50 50 38 40 42 36 37
Australia Mt na na na na na na na na na
share % na na na na na na na na na
Metallurgical coal Mt 13 18 13 18 11 11 15 12 11
Australia Mt na na na na na na na na na
share % na na na na na na na na na
Aluminium kt 176 96 51 31 34 46 70 73 26
Australia kt 48 19 7 6 8 3 13 15 6
share % 27 20 14 18 22 6 18 21 22
Alumina kt 1484 1281 1158 1354 933 880 1329 1512 1240
Australia kt 1184 655 523 791 455 555 869 987 703
share % 80 51 45 58 49 63 65 65 57
Bauxite Mt 13 7 8 8 10 13 16 17 14
Australia Mt 3 4 5 4 5 5 6 4 4
Share % 24 55 55 50 49 36 34 26 29
Copper kt 1836 1699 1725 1935 1729 1774 1886 2324 2320
Australia kt 165 144 140 152 116 142 123 174 134
share % 9 8 8 8 7 8 7 7 6
Oil Mt 75 77 77 80 80 83 85 87 91
Australia Mt 0.7 0.7 0.7 0.5 0.6 0.6 0.5 0.7 0.7
share % 1.0 0.9 1.0 0.7 0.7 0.7 0.6 0.8 0.8
Gas (LNG) kt 5629 4297 4811 5155 5127 4392 4627 5522 6017
Australia kt 843 905 1162 902 1094 1286 1672 1500 2024
share % 15 21 24 18 21 29 36 27 34
Zinc kt 431.0 347.2 353.0 370.3 391.0 410.3 506.1 607.9 na
Australia kt 138.5 119.5 111.4 125.1 112.1 131.7 147.5 278.7 na
share % 32 34 32 34 29 32 29 46 na
NickelUS$mn 1585 1625 2314 1251 904 1918 1951 1510 1201
AustraliaUS$mn 67 112 99 71 81 87 97 48 71
share % 4 7 4 6 9 5 5 3 6
Lead kt 224.0 213.8 284.8 273.0 220.4 197.0 238.3 349.5 na
Australia kt 49.6 28.8 47.8 52.0 39.1 31.6 28.9 45.8 na
share % 22 13 17 19 18 16 12 13 na
Tin kt 22.0 21.3 24.5 27.4 17.1 31.2 32.4 31.9 26.2
Australia kt 0.0 0.0 0.0 0.0 0.0 0.0 0.0 0.0 0.0
share % 0 0 0 0 0 0 0 0 0
Uranium t 4045 6801 4985 9281 2041 5659 7505 7439 naSources: CEIC and Bloomberg

30. China maps(Figures 199–210)
Please refer to pages 62–67 of The Westpac-DIIS China Resources Quarterly PDF version.
© Copyright 2016 Westpac Bank Corporation
31. Terms and conditions.1. WIBIQ is a service provided by Westpac Institutional Bank (Westpac Banking Corporation ABN 33 007 457 141 AFSL and ACL 233714) here referred to as “Westpac”. 2. Your access to this service is subject to these terms and conditions, the Westpac Privacy Statement, notices, disclaimers and any other statements contained on this website. 3. You agree that any view or opinions expressed in the articles or podcasts contained in WIB IQ are the author’s own and may not necessarily reflect the view or opinions of Westpac. 4. You agree that any commentary contained in WIBIQ is not intended as personal advice and should not be relied upon as such by you. 5. WIB IQ may contain information in relation to certain financial products. Westpac makes no recommendation to buy, hold or sell these financial products, nor does it make any representations or warranties regarding the financial products. You should make your own decision in relation to the financial products based on your own enquiries, the information contained in the relevant disclosure documents, and the suitability of the relevant financial products to your own investment objectives, financial situation and particular needs.
Westpac disclaimerThings you should know: Each time someone visits our site, data is captured so that we can accurately evaluate the quality of our content and make improvements for you. We may at times use technology to capture data about you to help us to better understand you and your needs, including potentially for the purposes of assessing your individual reading habits and interests to allow us to provide suggestions regarding other reading material which may be suitable for you.
If you are located in Australia, this material and access to this website is provided to you solely for your own as a client of Westpac Institutional Bank being a division of Westpac Banking Corporation ABN 33 007 457 141 AFSL 233714 (‘Westpac’). If you are located outside of Australia, this material and access to this website is provided to you as outlined below.
This material and this website contain general commentary only and does not constitute personal advice. Certain types oftransactions, including those involving futures, options and high yield securities give rise to substantial risk and are not suitable for all investors. We recommend that you seek your own independent legal or financial advice before proceeding with any investment decision. This information has been prepared without taking account of your objectives, financial situation or needs. This material and this website may contain material provided by third parties. While such material is published with the necessary permission none of Westpac or its related entities accepts any responsibility for the accuracy or completeness of any such material. Although we have made every effort to ensure the information is free from error, none of Westpac or its related entities warrants the accuracy, adequacy or completeness of the information, or otherwise endorses it in any way. Except where contrary to law, Westpac and its related entities intend by this notice to exclude liability for the information. The information is subject to change without notice and none of Westpac or its related entities is under any obligation to update the information or correct any inaccuracy which may become apparent at a later date. The information contained in this material and this website does not constitute an offer, a solicitation of an offer, or an inducement to subscribe for, purchase or sell any financial instrument or to enter a legally binding contract. Past performance is not a reliable indicator of future performance. The forecasts given in this material and this website are predictive in character. Whilst every effort has been taken to ensure that the assumptions on which the forecasts are based are reasonable, the forecasts may be affected by incorrect

assumptions or by known or unknown risks and uncertainties. The ultimate outcomes may differ substantially from these forecasts.
Additional information if you are located outside of AustraliaNew Zealand: The current disclosure statement for the New Zealand division of Westpac Banking Corporation ABN 33 007 457 141 or Westpac New Zealand Limited can be obtained at the internet address www.westpac.co.nz. Westpac Institutional Bank products and services are provided by either Westpac Banking Corporation ABN 33 007 457 141 incorporated in Australia (New Zealand division) or Westpac New Zealand Limited. For further information please refer to the Product Disclosure Statement (available from your Relationship Manager) for any product for which a Product Disclosure Statement is required, or applicable customer agreement. Download the Westpac NZ QFE Group Financial Advisers Act 2008 Disclosure Statement at www.westpac.co.nz.
China, Hong Kong, Singapore and India: This material has been prepared and issued for distribution in Singapore toinstitutional investors, accredited investors and expert investors (as defined in the applicable Singapore laws and regulations) only. Recipients in Singapore of this material should contact Westpac Singapore Branch in respect of any matters arising from, or in connection with, this material. Westpac Singapore Branch holds a wholesale banking licence and is subject to supervision by the Monetary Authority of Singapore. Westpac Hong Kong Branch holds a banking license and is subject to supervision by the Hong Kong Monetary Authority. Westpac Hong Kong branch also holds a license issued by the Hong Kong Securities and Futures Commission (SFC) for Type 1 and Type 4 regulated activities. This material is intended only to “professional investors” as defined in the Securities and Futures Ordinance and any rules made under that Ordinance. Westpac Shanghai and Beijing Branches hold banking licenses and are subject to supervision by the China Banking Regulatory Commission (CBRC). Westpac Mumbai Branch holds a banking license from Reserve Bank of India (RBI) and subject to regulation and supervision by the RBI.
UK: The contents of this communication, which have been prepared by and are the sole responsibility of Westpac bankingCorporation London (“WBC”) and Westpac Europe Limited. WBC (a) has its principal place of business in the United Kingdom atCamomile Court, 23 Camomile Street, London EC3A 7LL, and is registered at Cardiff in the UK (as Branch No. BR00106), and (b) authorised and regulated by the Australian Prudential Regulation Authority in Australia. WBC is authorised in the United Kingdom by the Prudential Regulation Authority. WBC is subject to regulation by the Financial Conduct Authority and limited regulation by the Prudential Regulation Authority. Details about the extent of our regulation by the Prudential Regulation Authority are available from us on request. Westpac Europe Limited is a company registered in England (number 05660023) and is authorised by the Prudential Regulation Authority and regulated by the Financial Conduct Authority and the Prudential Regulation Authority.
This communication is being made only to and is directed at (a) persons who have professional experience in matters relatingto investments who fall within Article 19(5) of the Financial Services and Markets Act 2000 (Financial Promotion) Order 2005 (the “Order”) or (b) high net worth entities, and other persons to whom it may otherwise lawfully be communicated, falling within Article 49(2)(a) to (d) of the Order (all such persons together being referred to as “relevant persons”). Any person who is not a relevant person should not act or rely on this communication or any of its contents. The investments to which this communication relates are only available to and any invitation, offer or agreement to subscribe, purchase or otherwise acquire such investments will be engaged in only with, relevant persons. Any person who is not a relevant person should not act or rely upon this communication or any of its contents. In the same way, the information contained in this communication is intended for “eligible counterparties” and “professional clients” as defined by the rules of the Financial Conduct Authority and is not intended for “retail clients”. With this in mind, Westpac expressly prohibits you from passing on the information in this communication to any third party. In particular this communication and, in each case, any copies thereof may not be taken, transmitted or distributed, directly or indirectly into any restricted jurisdiction.
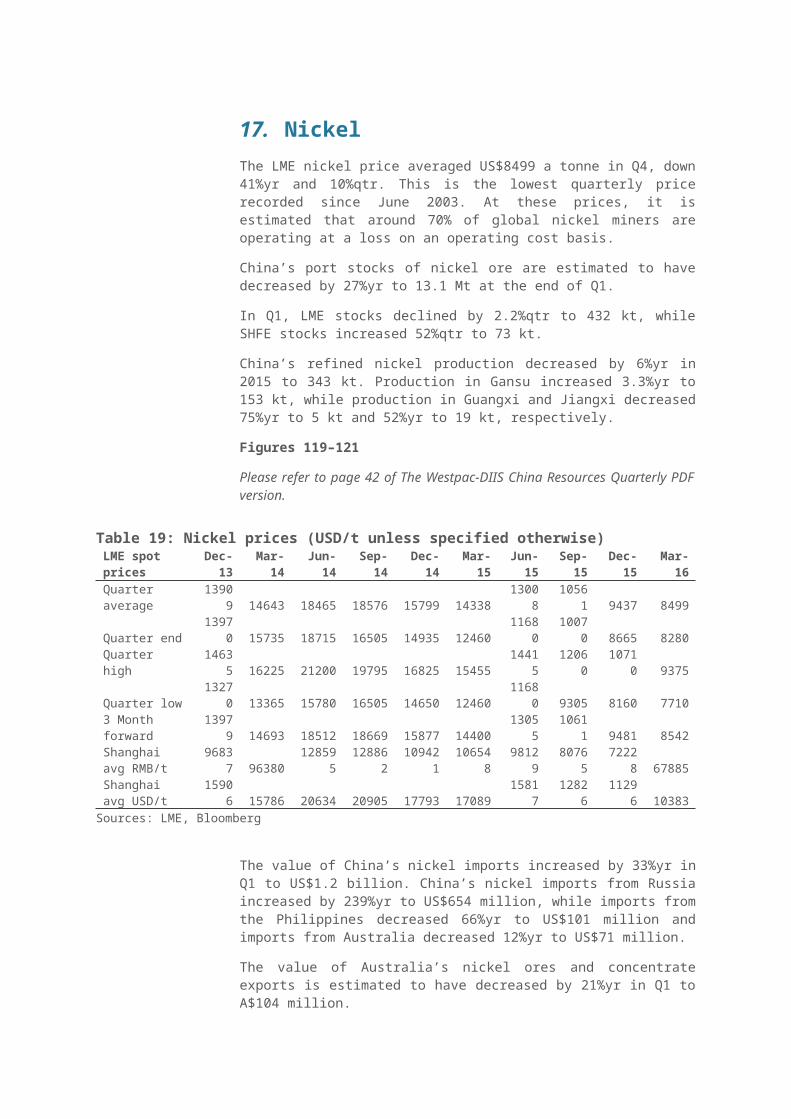
U.S.: Westpac operates in the United States of America as a federally licensed branch, regulated by the Office of the Comptroller of the Currency. Westpac is also registered with the US Commodity Futures Trading Commission (“CFTC”) as a Swap Dealer, but is neither registered as, or affiliated with, a Futures Commission Merchant registered with the US CFTC. Westpac Capital Markets, LLC (‘WCM’), a wholly–owned subsidiary of Westpac, is a broker–dealer registered under the U.S. Securities Exchange Act of 1934 (‘the Exchange Act’) and member of the Financial Industry Regulatory Authority (‘FINRA’). This communication is provided for distribution to U.S. institutional investors in reliance on the exemption from registration provided by Rule 15a–6 under the Exchange Act and is not subject to all of the independence and disclosure standards applicable to debt research reports prepared for retail investors in the United States. WCM is the U.S. distributor of this communication and accepts responsibility for the contents of this communication. All disclaimers set out with respect to Westpac apply equally to WCM. If you would like to speak to someone regarding any security mentioned herein, please contact WCM on +1 212 389 1269. All disclaimers set out with respect to Westpac apply equally to WCM.
Investing in any non–U.S. securities or related financial instruments mentioned in this communication may present certain risks.The securities of non–U.S. issuers may not be registered with, or be subject to the regulations of, the SEC in the United States.Information on such non–U.S. securities or related financial instruments may be limited. Non–U.S. companies may not subject to audit and reporting standards and regulatory requirements comparable to those in effect in the United States. The value of any investment or income from any securities or related derivative instruments denominated in a currency other than U.S. dollars is subject to exchange rate fluctuations that may have a positive or adverse effect on the value of or income from such securities or related derivative instruments.
The author of this communication is employed by Westpac and is not registered or qualified as a research analyst, representative, or associated person under the rules of FINRA, any other U.S. self–regulatory organisation, or the laws, rules or regulations of any State. Unless otherwise specifically stated, the views expressed herein are solely those of the author and may differ from the information, views or analysis expressed by Westpac and/or its affiliates.
For the purposes of Regulation AC only: Each analyst whose name appears in this report certifies that (1) the views expressed in this report accurately reflect the personal views of the analyst about any and all of the subject companies and their securities and (2) no part of the compensation of the analyst was, is, or will be, directly or indirectly related to the specific views or recommendations in this report.
For XYLO Foreign Exchange clients: This information is provided to you solely for your own use and is not to be distributedto any third parties. XYLO Foreign Exchange is a division of Westpac Banking Corporation ABN 33 007 457 141 and ACL 233714. Information is current as at date shown on the publication. This information has been prepared without taking account of yourobjectives, financial situation or needs. Because of this you should, before acting on this information, consider its appropriateness, having regard to your objectives, financial situation or needs. XYLO Foreign Exchange’s combined Financial Services Guide and Product Disclosure Statement can be obtained by calling XYLO Foreign Exchange on 1300 995 639, or by emailing [email protected].
The information may contain material provided directly by third parties, and while such material is published with permission,Westpac accepts no responsibility for the accuracy or completeness of any such material. Except where contrary to law, Westpac intends by this notice to exclude liability for the information. The information is subject to change without notice and Westpac is under no obligation to update the information or correct any inaccuracy which may become apparent at a later date. Past performance is not a reliable indicator of future performance. The forecasts given in this document are predictive in character. Whilst every effort has been taken to ensure that the assumptions on which the forecasts are based are reasonable, the forecasts may be affected by incorrect assumptions or by known or unknown risks and uncertainties. The ultimate outcomes may differ substantially from these forecasts.