authors.library.caltech.edu · Web viewGlobalisation and Pollution: Tele-connecting Local Primary...
22
Globalisation and Pollution: Tele-connecting Local Primary PM 2.5 Emissions to Global Consumption Jing Meng 1,2 , Junfeng Liu 1, * , Yuan Xu 3 , Dabo Guan 4 , Zhu Liu 5 , Ye Huang 1,6 , and Shu Tao † 1 Laboratory for Earth Surface Processes, College of Urban and Environmental Sciences, Peking University, Beijing, China 2 School of Environmental Sciences, University of East Anglia, Norwich, NR4 7JT, UK 3 Department of Geography and Resource Management & Institute of Environment, Energy and Sustainability, the Chinese University of Hong Kong, Hong Kong, China 4 School of International Development, University of East Anglia, Norwich, NR4 7TJ, UK 5 Resnick Sustainability Institute, California Institute of Technology, Pasadena, California 91125, USA 6 Laboratoire des Sciences du Climat et de l’Environnement, Commissariat à l'Energie Atomique-Centre National de la Recherche Scientifique-Université de Versailles Saint-Quentin- en- Yvelines, Centre d'Etudes Orme des Merisiers, 91191 Gif sur Yvette, France * Corresponding author: Email: [email protected] Tel.:+86 (0)10 6275 7852
Transcript of authors.library.caltech.edu · Web viewGlobalisation and Pollution: Tele-connecting Local Primary...

Globalisation and Pollution: Tele-connecting Local Primary PM2.5 Emissions to
Global Consumption
Jing Meng1,2, Junfeng Liu1, * , Yuan Xu3, Dabo Guan4, Zhu Liu5, Ye Huang1,6, and Shu Tao†
1 Laboratory for Earth Surface Processes, College of Urban and Environmental Sciences,
Peking University, Beijing, China
2 School of Environmental Sciences, University of East Anglia, Norwich, NR4 7JT, UK
3 Department of Geography and Resource Management & Institute of Environment, Energy and
Sustainability, the Chinese University of Hong Kong, Hong Kong, China
4 School of International Development, University of East Anglia, Norwich, NR4 7TJ, UK
5 Resnick Sustainability Institute, California Institute of Technology, Pasadena, California 91125,
USA
6 Laboratoire des Sciences du Climat et de l’Environnement, Commissariat à l'Energie Atomique-
Centre National de la Recherche Scientifique-Université de Versailles Saint-Quentin-en-
Yvelines, Centre d'Etudes Orme des Merisiers, 91191 Gif sur Yvette, France
* Corresponding author:
Email: [email protected]
Tel.:+86 (0)10 6275 7852

CaptionTable S1. Definition of regions.
Table S2. Definition of sectors.
Table S3. Produced, consumed and traded PM2.5 emissions.
Table S4. Budget of average primary fine aerosol concentrations from inter-continental transport
of aerosols from each source region to each receptor region, contributions of a region on
itself (referred to ‘domestic’) are shown in bold: (a) induced by production of source
region [Unit: μg∙m-3]; (b) induced by consumption of source region [Unit: μg∙m-3]; (c)
the ratio concentrations induced by consumption to production.
Figure S1. Distribution of consumption-based PM2.5 emissions (FCr) in 2007 by mass of emissions
in the region.
Figure S2. PM2.5 emissions embodied in imports and exports of the largest net importing/exporting
countries/regions. Intermediate goods (gray) are those used by industries in the
importing country to further processing and meet consumer demand for domestic
goods.
Supporting method
Bridging PKU-inventory and GTAP classifications

Table S1. Definition of regions.
Number Code Description Member Countries
1 AUS Australia Australia, Cocos (Keeling) Islands, Christmas Island, Heard Island and McDonald Islands, Norfolk Island
2 NZL New Zealand New Zealand3 XOC Rest of Oceania American Samoa, Cook Islands, Fiji,
Micronesia Federated States of, Guam, Kiribati, Marshall Islands, Northern Mariana Islands, New Caledonia, Niue, Nauru, Palau, Papua New Guinea, French Polynesia, Solomon Islands, Tokelau, Tonga, Tuvalu, Vanuatu, Wallis and Futuna, Samoa, Pitcairn, United States Minor Outlying Islands
4 CHN China China5 HKG Hong Kong Hong Kong6 JPN Japan Japan7 KOR Korea Republic of The Korea Republic of8 MNG Mongolia Mongolia9 TWN Taiwan Taiwan10 XEA Rest of East Asia Macao, Korea Democratic Peoples
Republic of11 KHM Cambodia Cambodia12 IDN Indonesia Indonesia13 LAO Lao People's
Democratic RepublicLao People's Democratic Republic
14 MYS Malaysia Malaysia15 PHL Philippines Philippines16 SGP Singapore Singapore17 THA Thailand Thailand18 VNM Viet Nam Viet Nam19 XSE Rest of Southeast
AsiaBrunei Darussalam, Myanmar, Timor Leste
20 BGD Bangladesh Bangladesh21 IND India India22 NPL Nepal Nepal23 PAK Pakistan Pakistan24 LKA Sri Lanka Sri Lanka25 XSA Rest of South Asia Afghanistan, Bhutan, Maldives26 CAN Canada Canada27 USA United States of United States of America

Number Code Description Member Countries
America28 MEX Mexico Mexico29 XNA Rest of North
AmericaBermuda, Greenland, Saint Pierre, and Miquelon
30 ARG Argentina Argentina31 BOL Bolivia, the
Plurinational Republic of
Bolivia, the Plurinational Republic of
32 BRA Brazil Brazil33 CHL Chile Chile34 COL Colombia Colombia35 ECU Ecuador Ecuador36 PRY Paraguay Paraguay37 PER Peru Peru38 URY Uruguay Uruguay39 VEN Venezuela Venezuela40 XSM Rest of South
AmericaFalkland Islands (Malvinas), French Guiana, Guyana, Suriname, South Georgia and the South Sandwich Islands
41 CRI Costa Rica Costa Rica42 GTM Guatemala Guatemala43 HND Honduras Honduras44 NIC Nicaragua Nicaragua45 PAN Panama Panama46 SLV El Salvador El Salvador47 XCA Rest of Central
AmericaBelize
48 XCB Caribbean Aruba, Anguilla, Netherlands Antilles, Antigua & Barbuda, Bahamas, Barbados, Cuba, Cayman Islands, Dominica, Dominican Republic, Grenada, Haiti, Jamaica, Saint Kitts and Nevis, Saint Lucia, Montserrat, Puerto Rico, Turks and Caicos Islands, Trinidad and Tobago, Saint Vincent and the Grenadines, Virgin Islands British, Virgin Islands U.S.
49 AUT Austria Austria50 BEL Belgium Belgium51 CYP Cyprus Cyprus52 CZE Czech Republic Czech Republic53 DNK Denmark Denmark54 EST Estonia Estonia

Number Code Description Member Countries
55 FIN Finland Finland, Aland Islands56 FRA France France, Guadeloupe, Martinique, Reunion57 DEU Germany Germany58 GRC Greece Greece59 HUN Hungary Hungary60 IRL Ireland Ireland61 ITA Italy Italy62 LVA Latvia Latvia63 LTU Lithuania Lithuania64 LUX Luxembourg Luxembourg65 MLT Malta Malta66 NLD Netherlands Netherlands67 POL Poland Poland68 PRT Portugal Portugal69 SVK Slovakia Slovakia70 SVN Slovenia Slovenia71 ESP Spain Spain72 SWE Sweden Sweden73 GBR United Kingdom United Kingdom74 CHE Switzerland Switzerland75 NOR Norway Norway, Svalbard and Jan Mayen76 XEF Rest of EFTA Iceland, Liechtenstein77 ALB Albania Albania78 BGR Bulgaria Bulgaria79 BLR Belarus Belarus80 HRV Croatia Croatia81 ROU Romania Romania82 RUS Russian Federation Russian Federation83 UKR Ukraine Ukraine84 XEE Rest of Eastern
EuropeThe Moldova Republic of
85 XER Rest of Europe Andorra, Bosnia, and Herzegovina, Faroe Islands, Gibraltar, Monaco, Macedonia the former Yugoslav Republic of, San Marino, Serbia, Guernsey, Isle of Man, Jersey, Montenegro, Holy See (Vatican City State)
86 KAZ Kazakhstan Kazakhstan87 KGZ Kyrgyzstan Kyrgyzstan88 XSU Rest of Former
Soviet UnionTajikistan, Turkmenistan, Uzbekistan
89 ARM Armenia Armenia90 AZE Azerbaijan Azerbaijan

Number Code Description Member Countries
91 GEO Georgia Georgia92 BHR Bahrain Bahrain93 IRN The Iran Islamic
Republic ofThe Iran Islamic Republic of
94 ISR Israel Israel95 KWT Kuwait Kuwait96 OMN Oman Oman97 QAT Qatar Qatar98 SAU Saudi Arabia Saudi Arabia99 TUR Turkey Turkey
100 ARE United Arab Emirates
United Arab Emirates
101 XWS Rest of Western Asia Iraq, Jordan, Lebanon, Palestinian Territory Occupied, Syrian Arab Republic, Yemen
102 EGY Egypt Egypt103 MAR Morocco Morocco104 TUN Tunisia Tunisia105 XNF Rest of North Africa Algeria, Libyan Arab Jamahiriya, Western
Sahara106 BEN Benin Benin107 BUF Burkina Faso Burkina Faso108 CMR Cameroon Cameroon109 CIV Cote d'Ivoire Cote d'Ivoire110 GHA Ghana Ghana111 GUI Guinea Guinea112 NGA Nigeria Nigeria113 SEN Senegal Senegal114 TOG Togo Togo115 XWF Rest of Western
AfricaCape Verde, Gambia, Guinea-Bissau, Liberia, Mali, Mauritania, Niger, Saint Helena, Ascension and Tristan Da Cunha, Sierra Leone
116 XCF Central Africa Central African Republic, Congo, Gabon, Equatorial Guinea, Sao Tome and Principe, Chad
117 XAC South Central Africa Angola, Congo the Democratic Republic of the
118 ETH Ethiopia Ethiopia119 KEN Kenya Kenya120 MDG Madagascar Madagascar121 MWI Malawi Malawi

Number Code Description Member Countries
122 MUS Mauritius Mauritius123 MOZ Mozambique Mozambique124 RWA Rwanda Rwanda125 TZA Tanzania United
Republic ofTanzania United Republic of
126 UGA Uganda Uganda127 ZMB Zambia Zambia
128 ZWE Zimbabwe Zimbabwe129 XEC Rest of Eastern
AfricaBurundi, Comoros, Djibouti, Eritrea, Mayotte, Sudan, Somalia, Seychelles
130 BWA Botswana Botswana131 NAM Namibia Namibia132 ZAF South Africa South Africa133 XSC Customs Union Lesotho, Swaziland134 XTW Rest of the World Antarctica, French Southern Territories,
Bouvet Island, British Indian Ocean Territory
Table S2. Definition of sectors.
Number Sector Category
1 Paddy rice Agriculture
2 Wheat3 Cereal grains nec4 Vegetables, fruit, nuts;5 Oil seeds6 Sugarcane, sugar beet7 Plant-based fibers8 Crops nec

9 Cattle, sheep, goats, horses10 Animal products nec11 Raw milk12 Wool, silk-worm cocoons13 Forestry14 Fishing15 Coal Mining
16 Oil17 Gas18 Minerals nec19 Meat: cattle, sheep, goats, horses Light Manufacting20 Meat products nec21 Vegetable oils and fats22 Dairy products23 Processed rice24 Sugar25 Food products nec26 Beverages and tobacco products27 Textiles28 Wearing apparel29 Leather products30 Wood products31 Paper products, publishing32 Petroleum, coal products Petroleum, coal products33 Chemical, rubber, plastic products Chemical, rubber, plastic 34 Mineral products nec Mineral products35 Ferrous metals36 Metals nec Metal products
37 Metal products38 Motor vehicles and parts Equipment Manufacturing39 Transport equipment nec40 Electronic equipment41 Machinery and equipment nec42 Manufactures nec43 Electricity Power generation
44 Gas manufacture, distribution45 Water collection, purification, and distribution46 Construction Construction
47 Trade Non-transport Services
48 Transport nec Transport
49 Sea transport
50 Air transport
51 Communication Non-transport Services
52 Financial services nec

53 Insurance
54 Business services nec
55 Recreation and other services
56 Public Administration, Defense, Health, Education
57 Dwellings
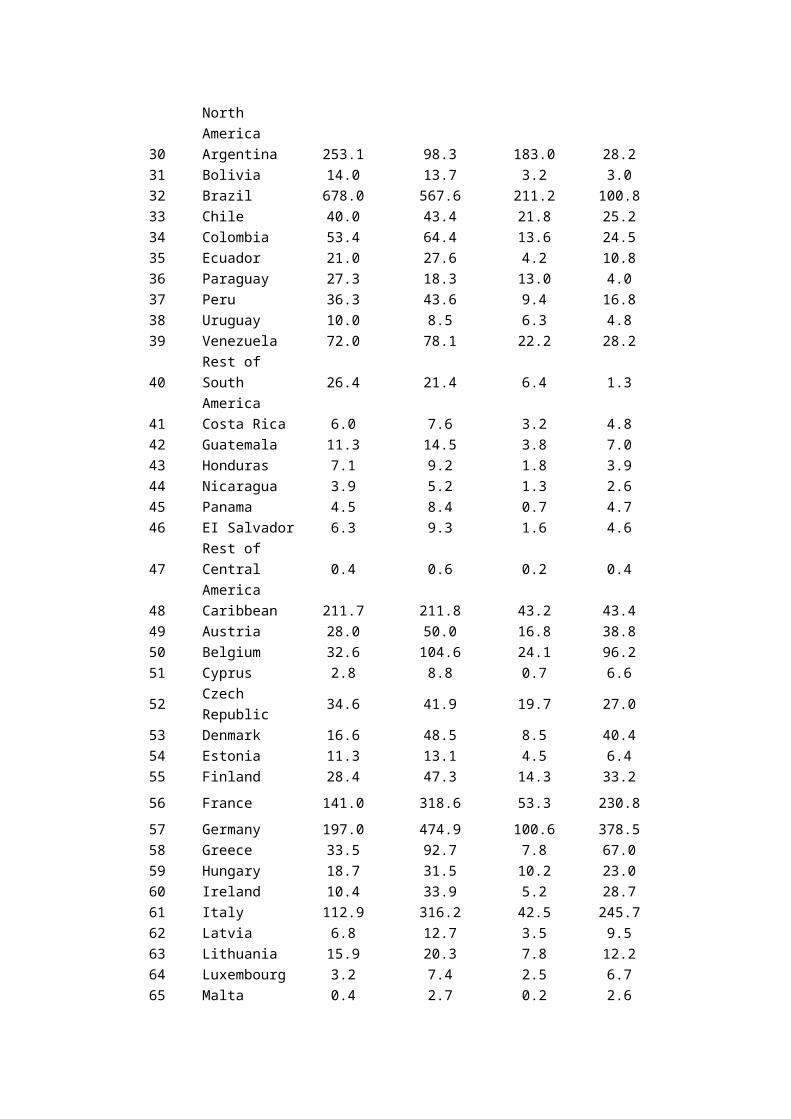
Table S3. Produced, consumed and traded PM2.5 emissions.
Number Region
Production based
Emissions (Gg)
Consumptionbased Emissions
(Gg)
Emission embodied in exports
(Gg)
EmissionEmbodied in imports (Gg)
1 Australia 114.5 173.4 48.6 107.52 New Zealand 12.4 24.5 4.2 16.43 Rest of Oceania 22.9 16.8 11.2 5.1
4 The mainland of 9371.7 6947.7 2717.0 293.0

China5 Hong Kong 0.0 80.3 0.0 80.36 Japan 477.0 725.2 166.9 415.17 Korea 174.6 294.6 73.6 193.68 Mongolia 11.2 10.4 3.4 2.69 Taiwan 0.0 66.7 0.0 66.7
10Rest of East Asia
123.3 91.8 42.7 11.2
11 Cambodia 22.6 25.1 4.3 6.712 Indonesia 425.4 400.6 105.2 80.4
13Lao People’s Democratic Republic
34.0 28.8 7.5 2.2
14 Malaysia 113.3 93.4 72.2 52.415 Philippines 116.1 118.1 28.9 30.916 Singapore 4.8 43.2 3.4 41.717 Thailand 259.3 189.3 128.0 58.018 Viet Nam 231.2 187.2 93.8 49.8
19Rest of Southeast Asia
96.3 73.6 32.5 9.8
20 Bangladesh 164.3 179.6 10.4 25.621 India 3060.3 2782.3 482.8 204.822 Nepal 29.8 32.7 2.2 5.123 Pakistan 251.7 256.4 32.2 36.924 Sri Lanka 20.0 29.7 4.3 13.9
25Rest of South Asia
30.4 29.7 10.1 9.5
26 Canada 147.8 219.6 76.5 148.2
27United States of America
1217.2 2275.4 220.2 1278.5
28 Mexico 183.1 221.3 54.6 92.8
29Rest of North America
19.6 12.3 10.4 3.1
30 Argentina 253.1 98.3 183.0 28.231 Bolivia 14.0 13.7 3.2 3.032 Brazil 678.0 567.6 211.2 100.833 Chile 40.0 43.4 21.8 25.234 Colombia 53.4 64.4 13.6 24.535 Ecuador 21.0 27.6 4.2 10.836 Paraguay 27.3 18.3 13.0 4.037 Peru 36.3 43.6 9.4 16.838 Uruguay 10.0 8.5 6.3 4.839 Venezuela 72.0 78.1 22.2 28.240 Rest of South 26.4 21.4 6.4 1.3

America41 Costa Rica 6.0 7.6 3.2 4.842 Guatemala 11.3 14.5 3.8 7.043 Honduras 7.1 9.2 1.8 3.944 Nicaragua 3.9 5.2 1.3 2.645 Panama 4.5 8.4 0.7 4.746 EI Salvador 6.3 9.3 1.6 4.6
47Rest of Central America
0.4 0.6 0.2 0.4
48 Caribbean 211.7 211.8 43.2 43.449 Austria 28.0 50.0 16.8 38.850 Belgium 32.6 104.6 24.1 96.251 Cyprus 2.8 8.8 0.7 6.652 Czech Republic 34.6 41.9 19.7 27.053 Denmark 16.6 48.5 8.5 40.454 Estonia 11.3 13.1 4.5 6.455 Finland 28.4 47.3 14.3 33.2
56 France 141.0 318.6 53.3 230.8
57 Germany 197.0 474.9 100.6 378.558 Greece 33.5 92.7 7.8 67.059 Hungary 18.7 31.5 10.2 23.060 Ireland 10.4 33.9 5.2 28.761 Italy 112.9 316.2 42.5 245.762 Latvia 6.8 12.7 3.5 9.563 Lithuania 15.9 20.3 7.8 12.264 Luxembourg 3.2 7.4 2.5 6.765 Malta 0.4 2.7 0.2 2.666 Netherlands 30.0 97.9 20.8 88.667 Poland 149.5 157.8 56.3 64.668 Portugal 21.0 43.5 7.4 29.969 Slovakia 27.8 26.1 16.8 15.170 Slovenia 5.8 11.3 3.2 8.871 Spain 124.3 276.3 40.2 192.272 Sweden 28.8 57.9 17.1 46.2
73United Kingdom
105.4 377.4 37.1 309.1
74 Switzerland 12.8 52.0 6.6 45.775 Norway 10.2 39.2 5.9 34.976 Rest of EFTA 1.4 4.7 0.7 3.977 Albania 3.4 7.0 0.9 4.578 Bulgaria 36.5 32.7 17.8 14.079 Belarus 56.8 37.4 40.0 20.780 Croatia 11.5 19.3 4.3 12.1

81 Romania 70.7 79.8 22.7 31.8
82Russian Federation
907.6 791.4 339.6 223.4
83 Ukraine 357.4 166.0 239.8 48.4
84Rest of Eastern Europe
4.1 7.2 2.2 5.2
85 Rest of Europe 67.2 67.6 19.6 20.086 Kazakhstan 202.5 183.0 68.9 49.587 Kyrgyzstan 7.9 7.6 3.5 3.2
88Rest of Former Soviet Union
67.4 53.6 29.4 15.6
89 Armenia 3.3 5.1 1.5 3.390 Azerbaijan 13.1 22.1 3.2 12.291 Georgia 4.7 8.3 2.3 5.992 Bahrain 1.7 5.7 0.9 4.9
93Iran, the Islamic Republic of
246.7 297.9 43.0 94.2
94 Israel 19.1 40.1 8.1 29.195 Kuwait 14.9 37.3 4.1 26.596 Oman 8.7 20.6 2.3 14.297 Qatar 16.1 29.4 6.5 19.998 Saudi Arabia 87.8 153.0 23.6 88.899 Turkey 342.8 385.6 88.6 131.3
100United Arab Emirates
34.7 165.1 8.4 138.8
101Rest of West Asia
254.5 207.7 107.5 60.6
102 Egypt 302.0 256.0 85.9 40.0103 Morocco 97.5 104.4 18.7 25.6104 Tunisia 38.6 24.4 25.9 11.8
105Rest of North Africa
112.4 130.8 31.3 49.7
106 Benin 7.0 8.7 5.3 7.1107 Burkina Faso 9.2 10.1 1.3 2.3108 Cameroon 9.1 9.3 2.8 3.0109 Cote d'lvoire 4.8 8.3 1.7 5.2110 Ghana 15.3 25.5 3.5 13.8111 Guinea 15.2 13.7 3.4 1.9112 Nigeria 59.5 73.1 22.6 36.1113 Senegal 15.7 15.6 5.7 5.7114 Togo 4.4 6.4 2.9 4.9
115Rest of Western Africa
34.6 45.0 9.9 20.3
116 Rest of Central 12.7 18.7 4.1 10.2
Africa
117Rest of South Central Africa
21.5 29.3 9.0 16.8
118 Ethiopia 25.0 32.3 1.9 9.1119 Kenya 21.6 25.6 6.5 10.5120 Madagascar 53.9 47.7 8.7 2.5121 Malawi 50.6 39.8 13.0 2.2122 Mauritius 2.2 5.1 0.9 3.7123 Mozambique 10.0 12.5 3.9 6.4124 Rwanda 8.6 10.1 1.3 2.8
125Tanzania, the United Republic of
18.3 20.2 5.5 7.4
126 Uganda 103.6 88.5 19.0 3.9127 Zambia 6.5 9.2 3.2 5.9128 Zimbabwe 22.5 16.0 12.3 5.8
129Rest of Eastern Africa
19.4 35.7 4.1 20.4
130 Botswana 4.9 11.5 2.3 8.9131 Namibia 3.8 8.1 2.4 6.6132 South Africa 617.4 376.8 294.2 53.7
133Rest of South the African Customs Union
4.9 3.7 2.2 0.9
134Rest of the world
0.0 0.0 0.0 0.0
Total 24002.4 24002.4 7236.3 7236.3

Table S4. Budget of average primary fine aerosol concentrations from inter-
continental transport of aerosols from each source region to each receptor region,
contributions of a region on itself (referred to ‘domestic’) are shown in bold: (a)
induced by production of source region [Unit: μg∙m-3]; (b) induced by consumption of
source region [Unit: μg∙m-3]; (c) the ratio concentrations induced by consumption to
production.
(a) induced by production of source region [Unit: μg∙m-3]
Source RegionReceptor Region
NA EU IN EANA 0.349 0.007 0.002 0.002EU 0.001 0.773 0.005 0.008IN 0.001 0.001 2.931 0.070EA 0.012 0.004 0.019 4.263
(b) induced by consumption of source region [Unit: μg∙m-3]
Source RegionReceptor Region
NA EU IN EANA 0.299 0.034 0.097 0.428EU 0.017 0.631 0.121 0.383IN 0.001 0.004 2.469 0.044EA 0.013 0.019 0.057 4.094
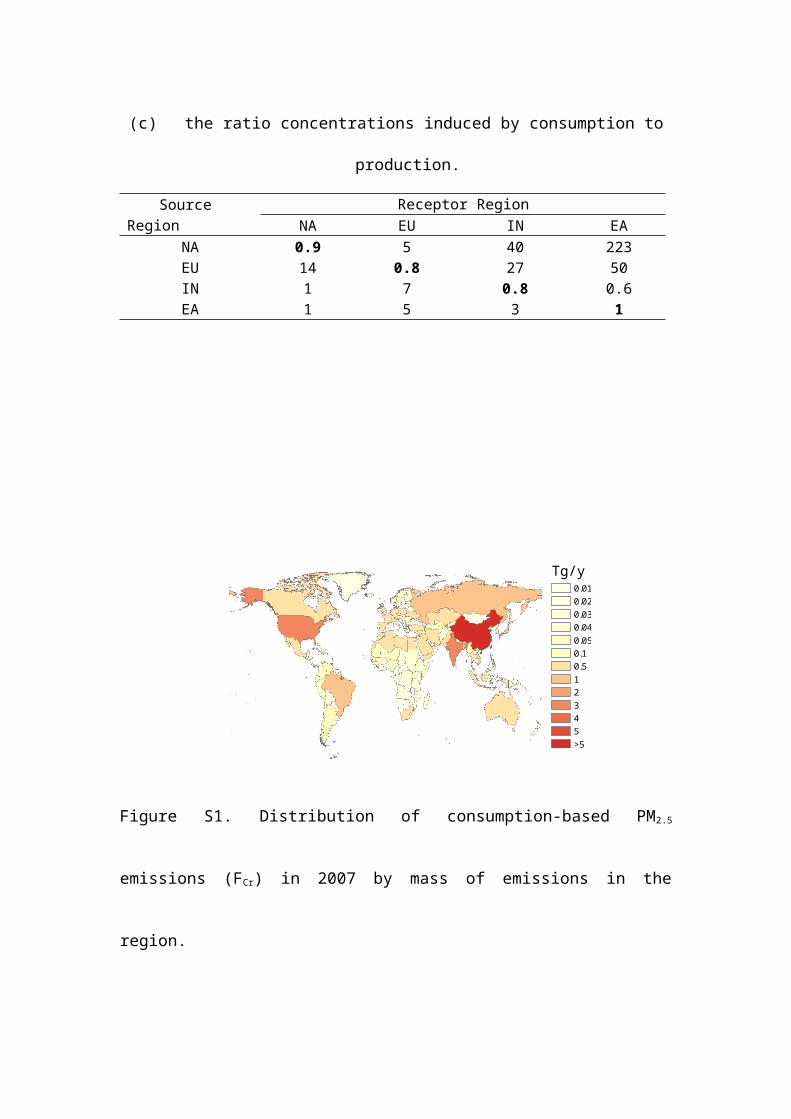
(c) the ratio concentrations induced by consumption to production.
Source RegionReceptor Region
NA EU IN EANA 0.9 5 40 223EU 14 0.8 27 50IN 1 7 0.8 0.6EA 1 5 3 1
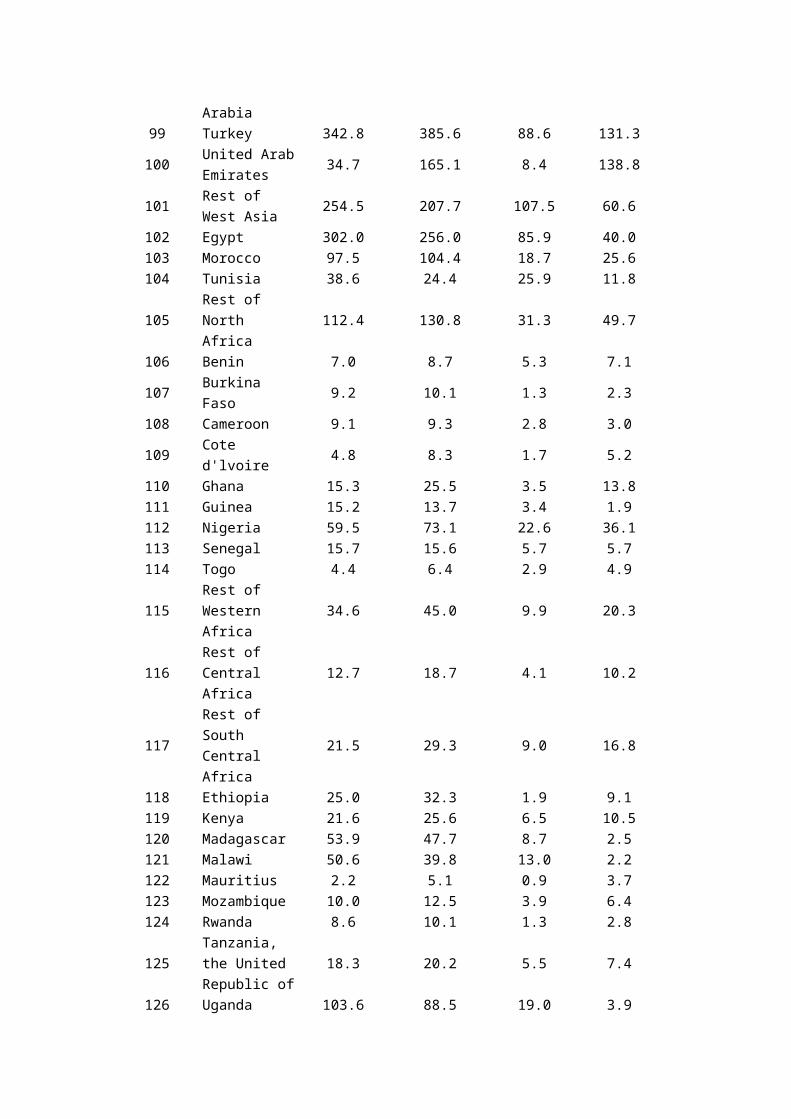
Figure S1. Distribution of consumption-based PM2.5 emissions (FCr) in 2007 by mass
of emissions in the region.
Gg/y0.010.020.030.040.050.10.512345>5
Tg/y

Figure S2. PM2.5 emissions embodied in imports and exports of the largest net importing/exporting countries/regions. Intermediate goods (gray) are those used by industries in the importing country to further processing and meet consumer demand for domestic goods.

Bridging PKU-inventory and GTAP classifications
Bridging the two databases was done by setting up concordance matrices between the 78
emission sources and each of GTAP’s countries’ sectors. Let C be such a concordance matrix,
holding Cij=1 if PKU-inventory class I corresponds to GTAP sector j, as shown in Table S1.
The original primary fuel type in GTAP database covers coal, oil, coal and oil products, and
gas. As the emission factors of various types of fuel vary significant, the coal, oil, coal and oil
products were split into seven types of fuel according to the energy statistics from International
Energy Agency [1-5]. The coal consumption was divided into Briquettes, coke; Brown coal, peat;
Hard coal, coking coal. The consumption of coal and oil products was divided into Heavy fuel oil;
Gasoline, aviation fuel, kerosene; Liquefied Petroleum Gas. For some developing countries
without country-specific energy statistics, the average proportion of different types of fuels of
NON-OECD countries were used. Then the emissions from power generation were split into 2
sectors (Sector 43-44 in Table S5) according to the sectors’ fuel consumption. For example, the
emissions from coke used in power generation were C, the coke consumption in Sector 43 and
Sector 44 was E1 and E2, then the emissions from coke comsumption in Sector 43 and Sector 44
was and , respectively. * 1 / (E1 E 2)C E * 2 / (E1 E 2)C E
Reference (1). IEA (2010) Energy Statistics of Non‐OECD Countries 2010: (Complete Edition ‐ ISBN 9789264084117). Sourceoecd Energy volume 2010(16):i-770(770).(2). IEA (2012) Energy Statistics of OECD Countries 2012: Complete Edition - ISBN 9789264173736. Sourceoecd Energy volume 2012(8):i-426(426).(3) IEA (2007) Energy Statistics of Non‐OECD Countries: 2004/2005: 2007 Edition (Complete Edition ‐ ISBN 9264027688). Source OECD Energy 2007(15):i-786.(4) IEA 2010) Energy Statistics of OECD Countries 2010: (Complete Edition ‐ ISBN 9789264084087). Sourceoecd Energy volume 2010(16):i-398.(5) IEA (2010) Energy Statistics of OECD Countries 2010: (Edition complète ‐ ISBN 9789264084094 ‐ Fr. à paraître). SourceOCDE Energie 2010(26):i-398.