tspace.library.utoronto.ca · Web viewDevelopment of Simple Hole-transporting Materials for...
35
Development of Simple Hole-transporting Materials for Perovskite Solar Cells Andrew M. Namespetra, a Arthur D. Hendsbee, c Greg C. Welch, c* Ian G. Hill b* a Department of Chemistry, Dalhousie University, 6274 Coburg Road, Halifax, NS B3H 4R2 Canada b Department of Physics and Atmospheric Sciences, Dalhousie University, 6310 Coburg Road, Halifax, NS B3H 4R2, Canada c Department of Chemistry, University of Calgary, 2500 University Drive NW, Calgary, AB, T2N 1N4 [email protected] [email protected] Supporting Information S1
Transcript of tspace.library.utoronto.ca · Web viewDevelopment of Simple Hole-transporting Materials for...

Development of Simple Hole-transporting Materials for Perovskite Solar Cells
Andrew M. Namespetra,a Arthur D. Hendsbee,c Greg C. Welch,c* Ian G. Hillb*
a Department of Chemistry, Dalhousie University, 6274 Coburg Road, Halifax, NS B3H 4R2Canada
b Department of Physics and Atmospheric Sciences, Dalhousie University, 6310 Coburg Road,Halifax, NS B3H 4R2, Canada
c Department of Chemistry, University of Calgary, 2500 University Drive NW, Calgary, AB, T2N 1N4
[email protected]@dal.ca
Supporting Information
S1

Table of Contents
1. General Details......................................................................................................................................S3
2. Materials Synthesis………………........................................................................................................S4
3. Experimental Details.............................................................................................................................S9
4. Characterization................................................................................................................................S12
5. UV-Visible Spectroscopy.................................................................................................................S15
6. Device Characterization......................................................................................................................S16
7. X-Ray Diffraction................................................................................................................................S17
8. Definitions for AFM surface parameters...........................................................................................S19
9. Photoluminescence Quenching Experiments....................................................................................S20
10. Electrochemical Characterization of HTMs...................................................................................S21
11. References...........................................................................................................................................S26
S2
1. General Details
General Synthetic Details:
Chemical syntheses were conducted on a bench top or under an atmosphere of dry, O2-free N2
via Schlenk line techniques and/or an Innovative Technology Inc. N2 atmosphere glove box.
Purification by flash column chromatography was performed using a Biotage® Isolera flash
system.
Materials:
1-hexylamine, 4-bromophthalic anhydride and pivalic acid (PivOH) were purchased from TCI
America and used without further purification. 1-ethylpropylamine, tris-4-bromo-phenylamine, 2-
tributylstannyl furan, 2-hexylthiophene, magnesium sulphate, anhydrous toluene (Tol),
chloroform (CHCl3), chlorobenzene (CB) and N,N’-dimethylacetamide (DMA) were purchased
from Sigma-Aldrich and were used without further purification. Pd(PPh3)4 and Pd(OAc)2 were
purchased from Strem Chemicals. SiliaCat® heterogeneous catalyst DPP-Pd was purchased from
SiliCycle. Anhydrous potassium carbonate was purchased from ACP chemicals. Glacial acetic
acid (AcOH) was purchased from Fisherbrand and used without further purification. N,N’-
dimethylformamide (DMF) was purchased from EMD Millipore and used without further
purification. All solvents were purchased from the Dalhousie solvent exchange program and
used without further purification, unless otherwise noted.
S3

2. Synthesis:
4-Bromo-N-Hexyl-Phthalimide was synthesized according to previously reported methods.1
HTM03 was synthesized as described in our previous publication.2
HTM04 was synthesized according to the procedure described in the literature.3
Synthesis of CH3NH3I: The synthesis of CH3NH3I was performed using the procedure
documented by Im et al. as a guideline.4 A 250 mL round-bottom flask was loaded with 27 mL
of 55 wt-% HI(aq) (BC Scientific, Product No. 0152-01), 30 mL of a 40% aqueous solution of
methylamine (Fisher Scientific, Product No. 00983) and a stir bar. The reaction mixture was
stirred in an ice bath in air for 3 h. The solvent was removed using a rotary evaporator, leaving
behind a brown solid. The solid product was stirred with diethyl ether for 30 minutes and
filtered using a Buchner funnel. This process was repeated twice to wash the product. The
washed final product was recrystallized from a minimum amount of boiling ethanol, cooled, and
filtered to recover white crystals. The crystals were washed with diethyl ether and dried in a
vacuum oven overnight. The solid was stored in an Ar-filled glovebox prior to use.
S4

Scheme S1 – Experimental procedure for the Synthesis of HTM01
Synthesis of Tris(4-(5-hexylthiophen-2-yl)phenyl)amine (HTM01): This compound was
synthesized differently from the known literature preparation.5 A 10-20 mL glass vial was
loaded on the bench top with tris[4-bromophenyl]amine (1.00 g, 2.1 mmol), 2-hexylthiophene
(0.628 g, 3.7 mmol), potassium carbonate (0.343 g, 2.5 mmol) and a stir bar. The vial was then
brought inside the glove-box where Palladium (II) Acetate (0.007 g, 0.031 mmol), pivalic acid
(0.013 g, 0.13 mmol) and N,N’-dimethylacetamide (10 mL) was added as a solvent. The vial was
sealed with a silicone cap under a nitrogen atmosphere. The reaction mixture was heated in an oil
bath at 100 ºC and monitored by TLC, which showed full conversion of starting material after 6
hours. The reaction was allowed to cool to room temperature and was subsequently extracted
with dichloromethane (~200 mL) and water (~400 mL). The organic phase was dried over
MgSO4 and filtered. Filtrate containing product was concentrated under reduced pressure and
loaded onto silica gel for purification via flash column chromatography with pentane/CH2Cl2 as
the eluting solvent system. Following the removal of solvent from the product fraction, an off
white solid was obtained which was recrystallized from a minimal amount of boiling
isopropanol, and filtered to yield an off white solid that was washed with methanol. Yield 16%
(0.211 g) 1H NMR (CDCl3): δ 7.43 (d 6H, 3JH-H = 9Hz); 7.09 (d 6H, 3JH-H = 9Hz); 7.04 (d, 3H,
S5

3JH-H = 4 Hz); 6.72 (d 3H, 3JH-H = 4 Hz); 2.80 (t, 6H, 3JH-H = 8 Hz); 1.74-1.64 (m, 6H); 1.44-1.28
(m, 18H); 0.89 (t, 9H, 3JH-H = 7 Hz).
Scheme S2 – Experimental procedure for the Synthesis of TPA(Fu)3.
Synthesis of Tris[4-(furanyl)-phenyl]amine, (TPA(Fu)3): A 10-20 mL glass vial was loaded on
the bench top with tris[4-bromophenyl]amine (1.0 g, 2.1 mmol), 2-tributylstannyl-furan (2.3 g,
6.4 mmol), heterogeneous catalyst Silica Cat DPP-Pd ® (`0.42 g, 0.11 mmol) and a stir bar.
N,N’-dimethylformamide (~10 mL) was added as a solvent and the vial was sealed with a Teflon
® cap and heated in an oil bath at 110 ºC for 24 hours. The reaction mixture was allowed to cool
to room temperature, diluted with dichloromethane and slurried in a mixture of K2CO3/SiO2 to
remove remaining tin by-products. The mixture was filtered and the filtrate containing product
was concentrated under reduced pressure and loaded onto silica gel for purification via flash
column chromatography with pentane/CH2Cl2 as the eluting solvent system. Following the
removal of solvent from the product fraction, a viscous oil was obtained which was taken up in a
minimal amount of acetone and precipitated into MeOH/H2O (1:1) and filtered to give an off
white solid. Yield 81 % (0.756 g). Spectroscopic data match those previously reported for this
compound.6
S6

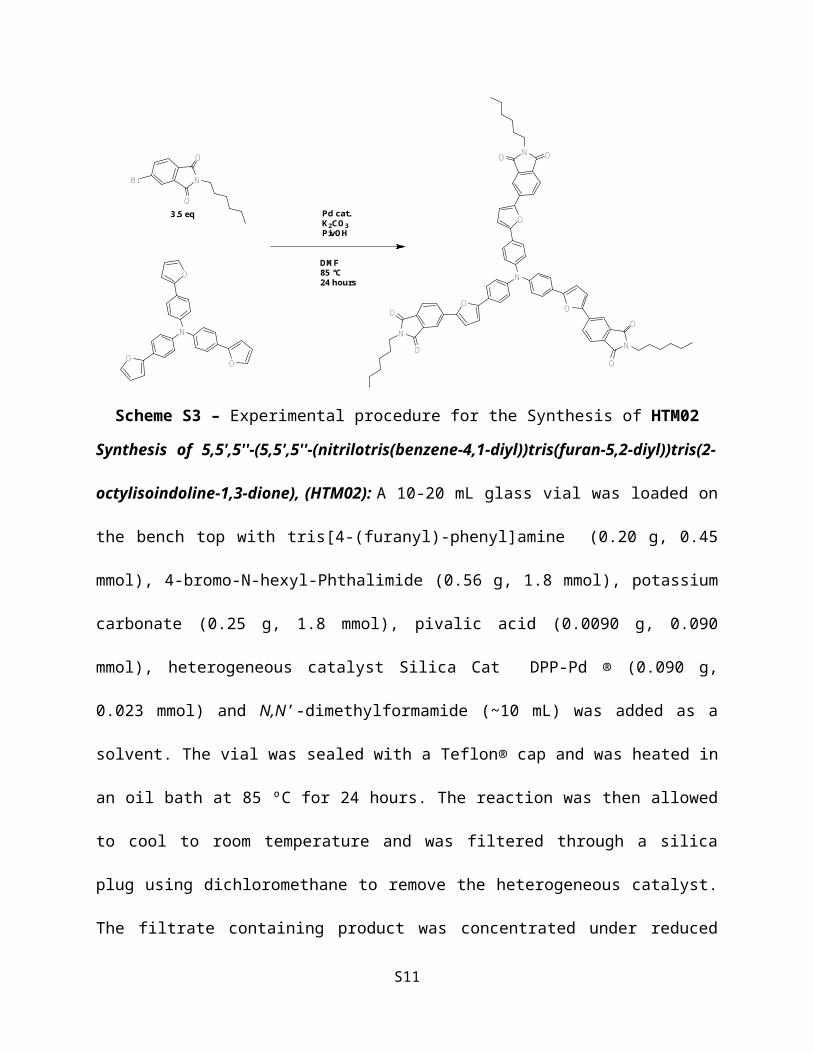
Scheme S3 – Experimental procedure for the Synthesis of HTM02
Synthesis of 5,5',5''-(5,5',5''-(nitrilotris(benzene-4,1-diyl))tris(furan-5,2-diyl))tris(2-
octylisoindoline-1,3-dione), (HTM02): A 10-20 mL glass vial was loaded on the bench top with
tris[4-(furanyl)-phenyl]amine (0.20 g, 0.45 mmol), 4-bromo-N-hexyl-Phthalimide (0.56 g, 1.8
mmol), potassium carbonate (0.25 g, 1.8 mmol), pivalic acid (0.0090 g, 0.090 mmol),
heterogeneous catalyst Silica Cat DPP-Pd ® (0.090 g, 0.023 mmol) and N,N’-
dimethylformamide (~10 mL) was added as a solvent. The vial was sealed with a Teflon® cap
and was heated in an oil bath at 85 ºC for 24 hours. The reaction was then allowed to cool to
room temperature and was filtered through a silica plug using dichloromethane to remove the
heterogeneous catalyst. The filtrate containing product was concentrated under reduced pressure
and loaded onto silica gel for purification via flash column chromatography with Pentane/CH2Cl2
as the eluting solvent system. Following the removal of solvent from the product fraction, an
orange film was obtained in the round-bottom flask which was dissolved in a minimal amount of
dichloromethane and precipitated into stirring methanol, filtered and washed with methanol to
yield an orange solid. Yield: 58% (293 mg). 1H NMR (CDCl3): δ 8.12-7.81 (m, 9H); 7.70 (m,
S7
O
N OO
N
O
N
O
O
O
N
O
O
O
N
OO
Pd cat. K2CO3 PivOH
N
O
O
Br
3.5 eq
DMF85 °C24 hours

6H); 7.22 (m, 6H); 6.97 (d, 3H, 3JH-H = 4 Hz); 6.75 (d, 3H, 3JH-H = 2 Hz); 4.05 (t, 6H, 3JH-H = 7
Hz); 1.70-1.66 (m, 6H); 1.38-1.25 (m, 18H); 0.88 (t, 9H, 3JH-H = 7 Hz); 13C NMR (CDCl3): δ
168.29; 168.18; 155.08; 146.80; 136.08; 133.26; 129.57; 127.87; 127.86; 125.40; 125.21;
124.50; 124.46; 123.78; 117.88; 110.95; 107.20; 38.19; 31.39; 28.60; 26.56; 22.53; 14.01
S8

3. Experimental DetailsDevice Fabrication:
All PSC devices were fabricated with the same configuration: FTO/compact
TiO2/Perovskite/HTL/MoOx/Ag. The MoOx-Ag top contact was used to replace gold in order to
reduce the overall cost of the system.7 FTO glass substrates (25 × 25 mm) were scrubbed clean
with deionized (DI) H2O and lab detergent, sonicated in a solution of deionized H2O and lab
detergent, sonicated in ethanol, rinsed in DI H2O and finally treated under a UV-ozone lamp for
20 min.
The hole-blocking layer of dense TiO2 was formed via spin-coating. A mildly acidic
solution of titanium isopropoxide (Sigma-Aldrich, Product No. 377996-25ML, 99.999% purity)
in ethanol was deposited onto the substrate through a 0.45 µm PVDF filter and spun at 2000 rpm
for 45 s. Preparation of the precursor solution is described elsewhere.8 The films were
immediately annealed in a cintering oven in which the temperature was ramped up at a rate of 30
°C/min to 500 °C, held at 500 °C for 30 min, and then ramped down to room temperature over a
period of 30 min. The substrates were cooled to room-temperature before the perovskite active
layer was formed.
The perovskite active layer was formed via a sequential spin-coating method described
previously by others.9–11 The precursor solution – a 1.0 M solution of PbI2 (Alfa Aesar, 99.9985
%) in DMF (Sigma-Aldrich, 99.8 %, anhydrous) was prepared and heated at 70 °C for at least 12
h to fully dissolve. The hot solution was deposited onto the substrate through a 0.45 µm PTFE
filter and then spin-coated at 6000 rpm for 60 s. The PbI2-coated substrate was placed
immediately on a hot-plate at 70 °C to dry for 15 min. After drying and cooling to room-
temperature, a film of CH3NH3I was spin-coated onto the PbI2 film from a 50 mg/mL solution in
S9

isopropanol (filtered through a 0.45 µm PVDF filter) at 6000 rpm for 60 s. The substrate was
transferred into an Ar-filled glovebox and annealed on a hot-plate at 100 °C for 60 min to
promote interdiffusion of the MAI into the PbI2 layer and conversion to the perovskite.
Spin-coating solutions for HTM deposition were prepared by combining the weighed
solid compound and the measured volume of solvent (chlorobenzene) in a 4.0 mL Teflon®-
capped vial with a stir bar. Each material was weighed using an analytical balance and the
solvent was measured using a 1000-μL micropipette. HTM01, HTM02 and HTM03 were
synthesized and purified in-house, as described elsewhere in the ESI. Spiro-OMeTAD was
purchased from Sigma-Aldrich (Product No. 792071-1G, 99% purity) and used as-is. HTM03
and HTM04 exhibited low solubility in organic solvents (~ 25 mg/mL in chlorobenzene at 70
°C). As a result, it was necessary to cast the solution at elevated temperature and spin at a slow
rate (1000 rpm) to achieve a film of sufficient thickness to completely cover the underlying
perovskite active layer.
For HTLs containing non-conjugated polymer additives, solutions were prepared by
combining a weighed quantity of HTM04 with a 10 mg/mL stock chlorobenzene solution of each
polymer into a 4.0 mL Teflon®-capped vial and finally adding chlorobenzene. To dissolve, the
solutions were heated overnight while stirring at 70 °C on a hotplate. The concentration of
HTM04 and polymer in solution was 25 mg/mL and 0.5 mg/mL (2% by-weight), respectively.
The two insulating polymers used were polystyrene (PS) and trimethyl-terminated (PDMS, MW
= 14000 g/mol, supplied by VWR, catalog no. CAAA42490-AD).
All HTMs were deposited onto the perovskite layer in air via spin-coating from
chlorobenzene (CB) solutions and filtered through 0.45 µm PTFE filters. Deposition parameters
for each HTM are given in Table 1. The top contact was deposited by thermal evaporation at <
S10
4.0×10⁻⁶ torr. A 10-nm layer of MoOx was deposited followed by 75 nm of Ag. After the metal
deposition, the devices were promptly transferred to an Ar-filled glovebox where they were
tested and subsequently stored. The active area of each device was 0.032 cm2.
Table S1. HTM deposition parameters.
HTMConcentration
in CB (mg/mL)
Solution deposition
temperature (°C)
Spin speed (rpm)
Spin duration
(s)
Spiro-OMeTAD 80 25 4000 30
HTM01 25 25 1000 90HTM02 25 25 1000 90HTM03 25 70 1000 90HTM04 25 70 1000 90
S11

4. CharacterizationCurrent-Density – Voltage (J-V) Measurements: For photovoltaic measurements, solar cell
devices were illuminated using a calibrated Xe arc lamp (Sciencetech SS0.5K) as the light source
in an Ar-filled glovebox. A National Institute of Standards and Technology (NIST)-traceable
calibrated photodiode (Newport 818-UV-L) in conjunction with a near infrared absorptive filter
(Thorlabs NENIR60A) was used to measure the output power density of the light source for
wavelengths below 800 nm. The measured power density provided by the source was 100 (±1)
mW/cm2 (1.00 Suns) of AM 1.5G spectrum over the relevant wavelengths.
J-V measurements of all devices were performed using a Keithley 236 Source-Measure
Unit. Each device were tested by scanning from forward bias (FB) to short-circuit (SC) (+2.0 V
to 0.0 V) and then in the reverse direction (SC to FB, or 0.0 V to + 2.0 V). Each scan was
repeated with three different scan delays (5 ms, 10 ms and 100 ms) at a sampling rate of 0.01
V/step. The specific shunt resistance (RSH) and series resistance (RS) for the devices with the
highest efficiency were determined by calculating the inverse slope at short-circuit (V = 0 V) and
at open-circuit (V = Voc) using the formula: R = [ΔV/ΔI]/Area.
Powder X-ray Diffraction (pXRD): pXRD experiments were performed using a Rigaku
Ultima IV X-ray diffractometer equipped with a CuKα radiation source, scintillation detector,
fixed monochromator and 285 nm focusing slit. Powdered samples were loaded into glass trays
and then mounted into the instrument. Experiments were run using the RINT2200 Right
software package with divergence and receiving slit widths of 10 mm and 0.3 mm, respectively.
Powder patterns were acquired by scanning through Bragg angles between 3° and 40° at a rate of
2° per minute.
S12

Nuclear Magnetic Resonance (NMR): 1H and {1H}13C (NMR) spectroscopy spectra were
recorded on either a Bruker Avance-500 MHz spectrometer or a Bruker Avance-300 MHz
spectrometer at 300 K. Chemical shifts (in ppm) were referenced to SiMe4. All experiments were
performed in deuterated chloroform (CDCl3).
UV-Vis spectroscopy: All UV-Vis spectra of the HTMs were acquired using an Agilent Cary
60 spectrophotometer. Solution experiments were conducted on solution samples (with CHCl3
as the solvent) loaded in quartz cuvettes. Thin-film experiments were conducted on films of the
HTMs spun on 25 × 25 mm glass pieces cut from microscope slides. Spectra were acquired by
scanning from 800 or 900 nm to 200 nm at a rate of 600 nm/s.
Photoluminescence (PL) spectroscopy: PL experiments were conducted on thin film samples
using an Agilent Technologies Cary Eclipse Fluorescence spectrophotometer. The samples were
irradiated by monochromatic visible light with excitation wavelength of λex. The film-coated
substrates were mounted vertically into the instrument with the film-side facing the radiation
source at a 45° angle. Emission spectra were acquired by scanning at a rate of 600 nm/min with
excitation and emission slit widths set to 20 nm.
Cyclic Voltammetry (CV): CV experiments for the HTMs were performed using a BASi Cell
Stand instrument equipped with an N2 bubbler as well as an Ag/AgCl electrode, Pt wire and
glassy-carbon electrode as the pseudo-reference, counter electrode and working electrode,
respectively. Measurements were conducted using the BASi Epsilon EC software program.
Samples were prepared with a concentration of ~1 mg/mL by dissolving each HTM in anhydrous
S13

CH2Cl2 with ~0.1 M tetrabutylammoniumhexafluorophosphate (TBAPF6) as the supporting
electrolyte. All solutions were purged with N2(g) and then scanned at 50, 100 and 150 mV/s as-
is and at 100 mV/s after the addition of a ferrocene (Fc) standard. The resulting voltammograms
were referenced to the oxidation potential of Fc/Fc+ which was set to 0.48 V. The value of the
oxidation potential of each HTM was determined by the intersection of the line tangent to the
onset of oxidation and the baseline of the curve. The values of the HOMO levels were estimated
by comparing the onset of oxidation to the normal hydrogen electrode (NHE), assuming that the
HOMO of Fc/Fc+ is equal to 4.80 eV.12 Therefore, E(HOMO) = Eox (vs. Fc) + 4.80 eV. Similarly,
the LUMO levels of HTM01, HTM02, HTM03 and HTM04 were obtained by comparing the
onsets of reduction to the NHE using the oxidation of Fc/Fc+ as an internal standard. Therefore,
E(LUMO) = Ered (vs. Fc) + 4.80 eV.
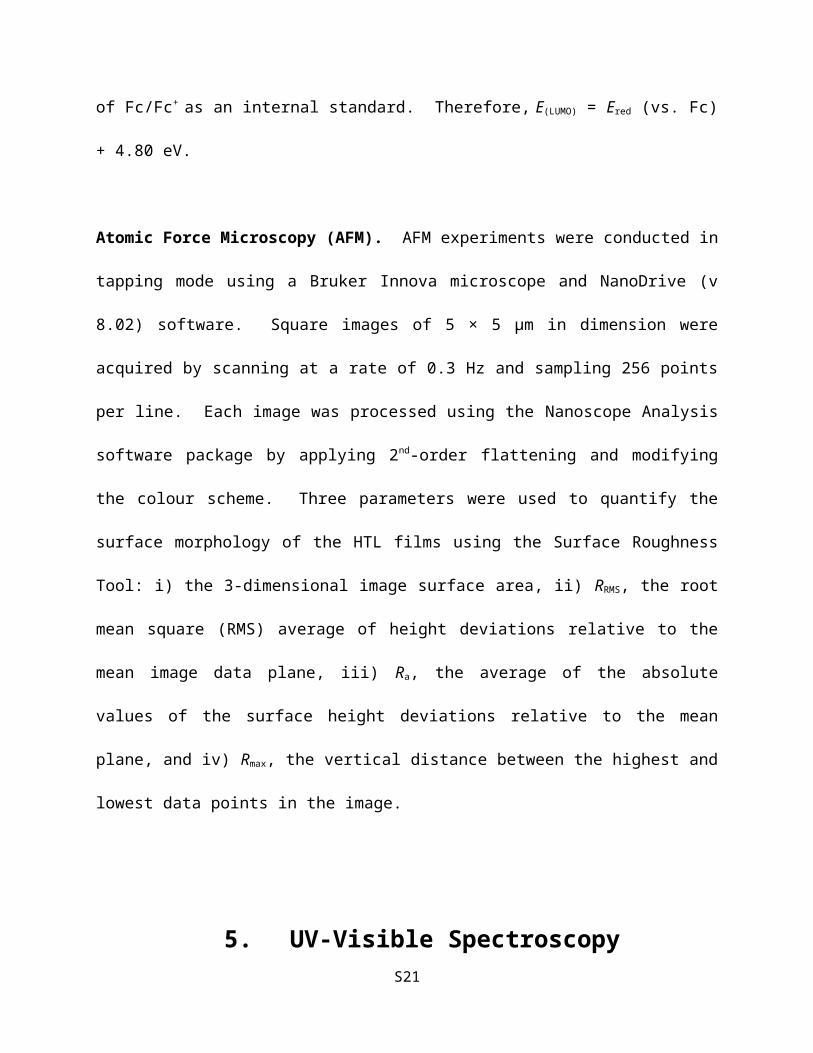
Atomic Force Microscopy (AFM). AFM experiments were conducted in tapping mode using a
Bruker Innova microscope and NanoDrive (v 8.02) software. Square images of 5 × 5 µm in
dimension were acquired by scanning at a rate of 0.3 Hz and sampling 256 points per line. Each
image was processed using the Nanoscope Analysis software package by applying 2nd-order
flattening and modifying the colour scheme. Three parameters were used to quantify the surface
morphology of the HTL films using the Surface Roughness Tool: i) the 3-dimensional image
surface area, ii) RRMS, the root mean square (RMS) average of height deviations relative to the
mean image data plane, iii) Ra, the average of the absolute values of the surface height deviations
relative to the mean plane, and iv) Rmax, the vertical distance between the highest and lowest data
points in the image.
S14

5. UV-Visible Spectroscopy
Figure S1. UV-Vis absorption spectra acquired for solution samples of each HTM in this study.
Table S1. Onsets of absorption (λonset,solution)acquired from solution UV-Vis absorption spectra and the corresponding optical bandgap energies (Eg,solution).
HTM λonset,solution
(nm)Eg,solution
(eV)Spiro-
OMeTAD 416 2.98
HTM01 411 3.02HTM02 510 2.43HTM03 685 1.81HTM04 665 1.86
S15

6. Device Characterization
Figure S2. A comparison of J-V curves of the best-performing devices with each of the five HTMs. The plots depict curves acquired by scanning from forward bias to short-circuit (+2.0 V to 0.0 V) or from short-circuit to forward bias (0.0 V to +2.0 V) with scan delays of either 5, 10 or 100 ms.
S16

S17

7. X-Ray Diffraction
Figure S3. X-ray diffraction (XRD) patterns of HTM films on glass. Each patterns is normalized such that the level of the noise is equivalent. The scans were acquired with a range between 3° and 40°, however, no diffraction peaks were observed above 2θ = 10°. Thus, only narrow range is used to clearly the show the diffraction peaks.
S18

Figure S4. XRD patterns for HTM04 with and without polymer additives. Each patterns is normalized such that the level of the noise is equivalent. The scans were acquired with a range between 3° and 40°, however, no diffraction peaks were observed above 2θ = 10°. Thus, only narrow range is used to clearly the show the diffraction peaks.
S19

8. Definitions for AFM surface parameters:RMS roughness (RRMS): The root mean square average of height deviations taken from the mean image data plane
R RMS = √∑ Z i2N
Average roughness (Ra): The average of the absolute values of the surface height deviations relative to the mean plane
R a = 1N
∑j = 1
N
|Zj |
Roughness Rmax: The vertical distance between the highest and lowest data points in the image.
S20
9. Photoluminescence Quenching Experiments
Figure S5. Non-normalized photoluminescence spectra acquired for thin-film samples on glass: neat perovskite, neat HTM04 and a two-layer film of HTM04 on perovskite. The excitation wavelength was 532. From the spectra, it is evident that the fluorescence from the perovskite layer is effectively quenched by the upper HTM04 layer, suggesting that effective charge-transport occurs between the two layers.
S21

10. Electrochemical Characterization of HTMs
Figure S6. Cyclic voltammetry (CV) plots for spiro-OMeTAD acquired at varying scan rates. The voltage axis is normalized such that the onset of oxidation of ferrocene (Fc) is equal to zero. An estimation of the HOMO energy level was obtained by comparing the onset of oxidation of spiro-OMeTAD (from the scan acquired at 100 mV/s with Eox = 0.20 eV) to the normal hydrogen electrode (NHE), assuming the ionization energy of Fc to be 4.80 eV below the vacuum level.12
S22
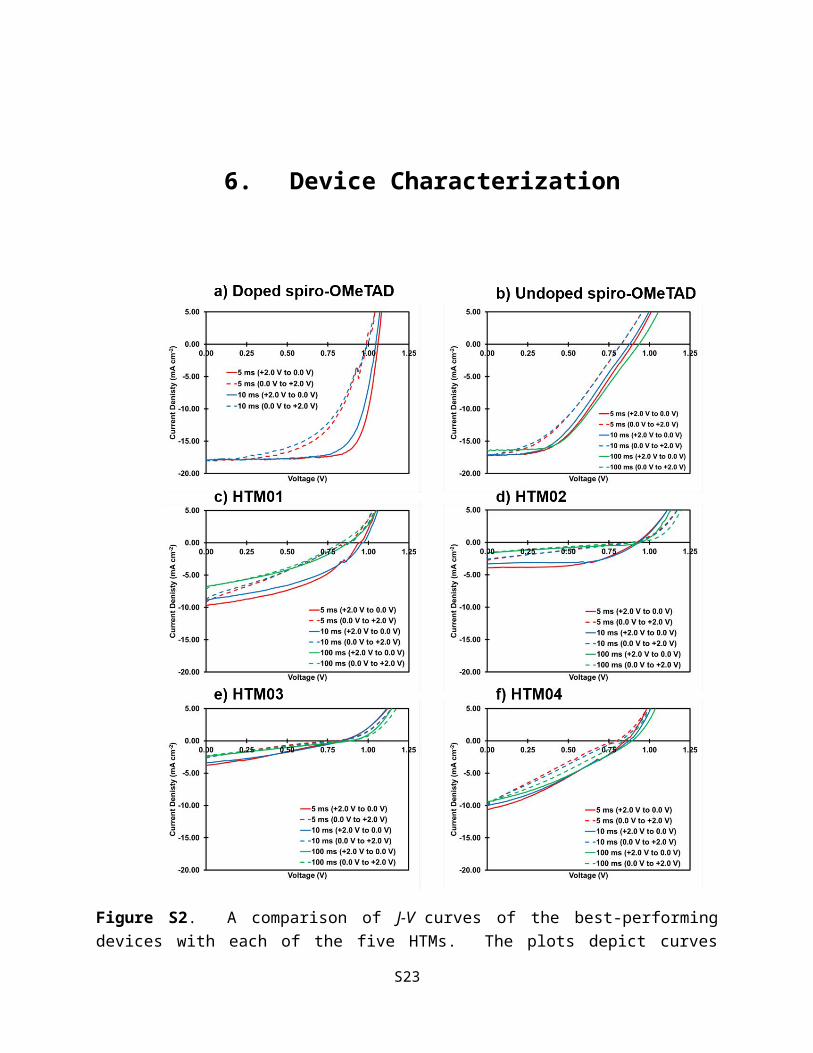
Figure S7. CV plots for HTM01 acquired at varying scan rates. The voltage axis is normalized such that the onset of oxidation of ferrocene (Fc) is equal to zero. An estimation of the HOMO and LUMO energy levels were obtained by comparing the onsets of oxidation and reduction, respectively, of HTM01 (from the scan acquired at 100 mV/s with Eox = 0.14 eV and Ered = −2.03 eV) to the normal hydrogen electrode (NHE), assuming the ionization energy of Fc to be 4.80 eV below the vacuum level.12
S23

Figure S8. CV plots for HTM02 acquired at varying scan rates. The voltage axis is normalized such that the onset of oxidation of ferrocene (Fc) is equal to zero. An estimation of the HOMO and LUMO energy levels were obtained by comparing the onsets of oxidation and reduction, respectively, of HTM02 (from the scan acquired at 100 mV/s with Eox = 0.26 eV and Ered = −1.90 eV) to the normal hydrogen electrode (NHE), assuming the ionization energy of Fc to be 4.80 eV below the vacuum level.12
S24
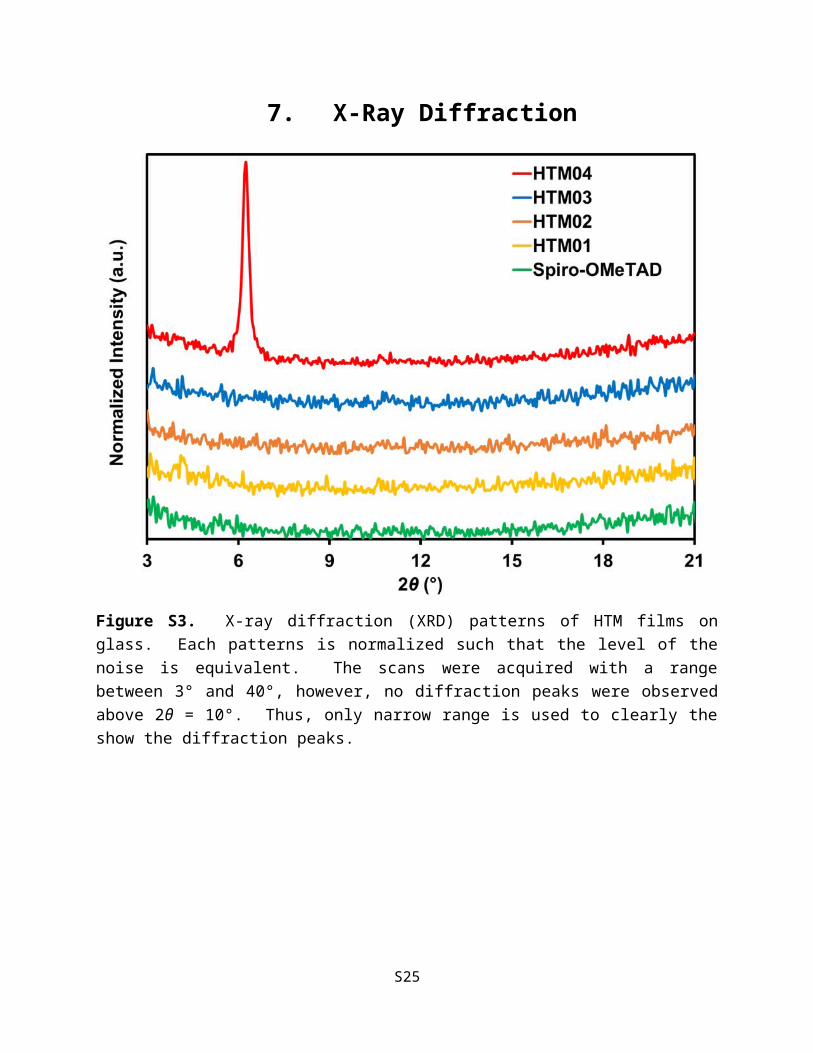
Figure S9. CV plots for HTM03 acquired at varying scan rates. The voltage axis is normalized such that the onset of oxidation of ferrocene (Fc) is equal to zero. An estimation of the HOMO and LUMO energy levels were obtained by comparing the onsets of oxidation and reduction, respectively, of HTM03 (from the scan acquired at 100 mV/s with Eox = 0.26 eV and Ered = −1.44 eV) to the normal hydrogen electrode (NHE), assuming the ionization energy of Fc to be 4.80 eV below the vacuum level.12
S25

Figure S10. CV plots for HTM04 acquired at varying scan rates. The voltage axis is normalized such that the onset of oxidation of ferrocene (Fc) is equal to zero. An estimation of the HOMO and LUMO energy levels were obtained by comparing the onsets of oxidation and reduction, respectively, of HTM04 (from the scan acquired at 100 mV/s with Eox = 0.23 eV and Ered = −1.43 eV) to the normal hydrogen electrode (NHE), assuming the ionization energy of Fc to be 4.80 eV below the vacuum level.12
S26

11. References
1 J.-P. Sun, A. D. Hendsbee, A. F. Eftaiha, C. Macaulay, L. R. Rutledge, G. C. Welch and I. G. Hill, J. Mater. Chem. C, 2014, 2, 2612–2621.
2 J. Areephong, A. D. Hendsbee and G. C. Welch, New J. Chem., 2015.
3 T. S. van der Poll, J. A. Love, T.-Q. Nguyen and G. C. Bazan, Adv. Mater., 2012, 24, 3646–3649.
4 J.-H. Im, C.-R. Lee, J.-W. Lee, S.-W. Park and N.-G. Park, Nanoscale, 2011, 3, 4088–4093.
5 A. Saeki, S. Seki, N. Satoh, K. Yamamoto and S. Tagawa, J. Phys. Chem. B, 2008, 112, 15540–15545.
6 K. Idzik, J. Sołoducho, M. Łapkowski and S. Golba, Electrochim. Acta, 2008, 53, 5665–5669.
7 Y. Zhao, A. M. Nardes and K. Zhu, Appl. Phys. Lett., 2014, 104, 21306.
8 A. Abrusci, S. D. Stranks, P. Docampo, H.-L. Yip, A. K. Y. Jen and H. J. Snaith, Nano Lett., 2013, 13, 3124–3128.
9 Z. Xiao, C. Bi, Y. Shao, Q. Dong, Q. Wang, Y. Yuan, C. Wang, Y. Gao and J. Huang, Energy Environ. Sci., 2014, 7, 2619–2623.
10 C. Bi, Y. Shao, Y. Yuan, Z. Xiao, C. Wang, Y. Gao and J. Huang, J. Mater. Chem. A, 2014, 2, 18508–18514.
11 J.-H. Im, I.-H. Jang, N. Pellet, M. Grätzel and N.-G. Park, Nat. Nano., 2014, 9, 927–932.
12 A. Shafiee, M. M. Salleh and M. Yahaya, Sains Malaysiana, 2011, 40, 173–176.
S27


![Tamara - tspace.library.utoronto.ca€¦ · praxinoscope [Layboume79]. The thaurnatrope. a spinning disc. seems to superimpose two separate images. The zoetrope and praxinoscope display](https://static.fdocuments.in/doc/165x107/5f1062e67e708231d448dab9/tamara-praxinoscope-layboume79-the-thaurnatrope-a-spinning-disc-seems-to.jpg)