view
29
WA Marketing& Bus iness NetworkingCongress– Perth 7 June2006 “Pos itionedfor Success” Trevor Amery Cha irman, Subaru (Aust) Pty Ltd
-
Upload
hondafanatics -
Category
Documents
-
view
157 -
download
0
Transcript of view

WA Marketing & Business Networking Congress – Perth
7 June 2006
“Positioned for Success”Trevor Amery
Chairman, Subaru (Aust) Pty Ltd
Agenda
•Background
•Positioning- Strategic
- Operational
•“Success?”
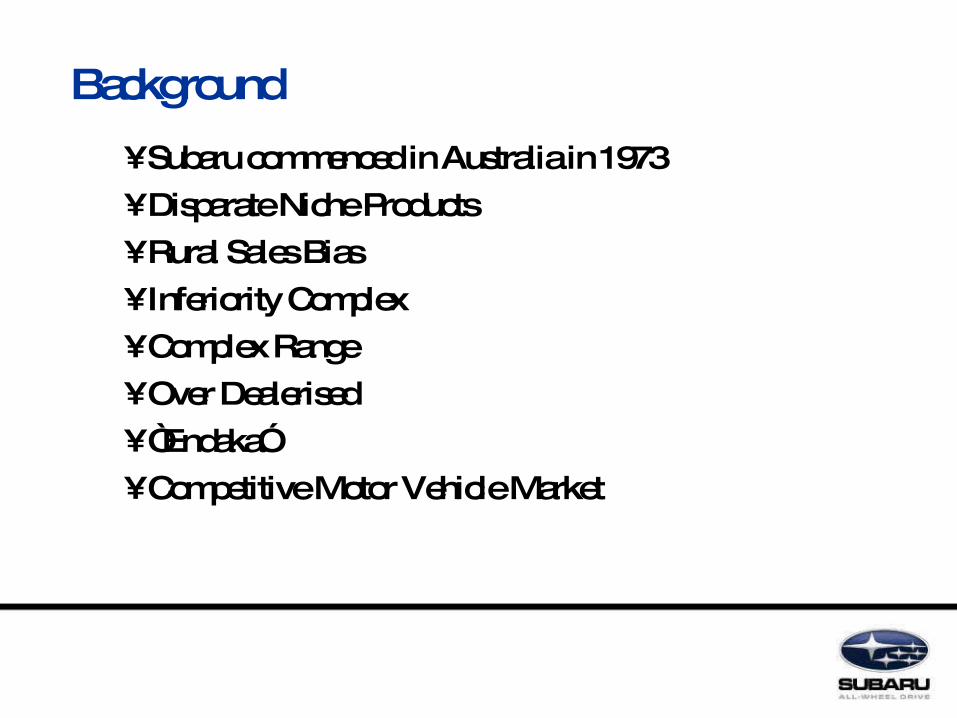
Background
•Subaru commenced in Australia in 1973•Disparate Niche Products•Rural Sales Bias•Inferiority Complex•Complex Range•Over Dealerised•“Endaka”•Competitive Motor Vehicle Market

•53 Brands / Marques•4 Local Manufacturers Market Share
- Toyota 20.5%- Holden 17.7%- Ford 13.1%- Mitsubishi 6.3%
5 7 .6 %•49 Marques compete in 42.4% of market
- Average 8,551 units each•Over 800 models / variants•Total Volume 988,269 units
VFACTS: 2005
Background
“Positioning”

Strategic
Customer, Dealers, Employees, FHI, Tomen & Inchcape
•Position Subaru as the pre-eminent Japanese automotive brand in the Australian marketplace
•Position Subaru as the All-Wheel Drive brand
•Position Subaru Australia as the pre-eminent distributor of Subaru product in the world
•Manage the Subaru brand to optimise the value for all stakeholders

CUSTOMER
• Grow Brand• Real Time• Experiences
RETAIL
• Create Brand• Build Network• Quality Sales• CRM
MARKETER
Helped Network sell cars
ADVERTISER
Sold cars to Dealers
IMPORTER
M o v e c lo s e r t o t h e C u s t o m e rStrategic

SUBARUBRAND IMAGE
StrategicPrice
Post PurchaseExperience
Ease ofOwnership
PurchaseExperience/
Process
Psychographics- Demographics
Product /Features

K e y B e n c h m a r k sStrategic
•Product Positioning•Product Planning•Marketing Consistency•Dealership Presentation
• Training- Skill- Attitude
• Presentation
Operational
•Rationalise Dealer Network•Rationalise Model Range•Marketing focused on the Consumer
Benefits of our Differences•Go Rallying•Web Strategy•RRP Integrity

O r d e r t o D e liv e r y C y c leOperational
Production Order 0
Proc. & Production 58 58
Shipping 21 79
Wharf to Compound 2 81
Landed – Wholesale 78 159
Wholesale - Retail 59 218
1995 - DAYS IN PROCESS

“Success?”
(
00
0’
)RetailedUnits
s
96
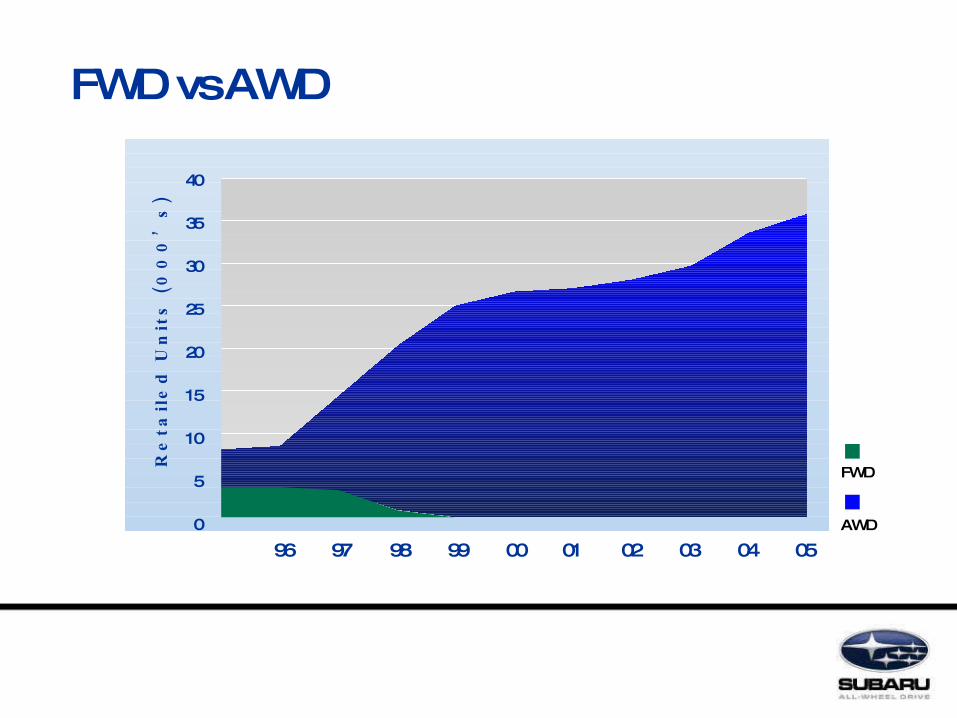
40
35
30
25
20
15
10
5
0
97 98 99 00 01 02 03 04 05
FWD vs AWD
FWD
AWD


1 9 9 6 - 2 0 0 5
unprecedented ten consecutive championships
P o s s u m B o u r n e 1996 - 2002
C o d y C r o c k e r 2003 - 2005
AU S TR ALIAN R ALLYC H AM P IO N
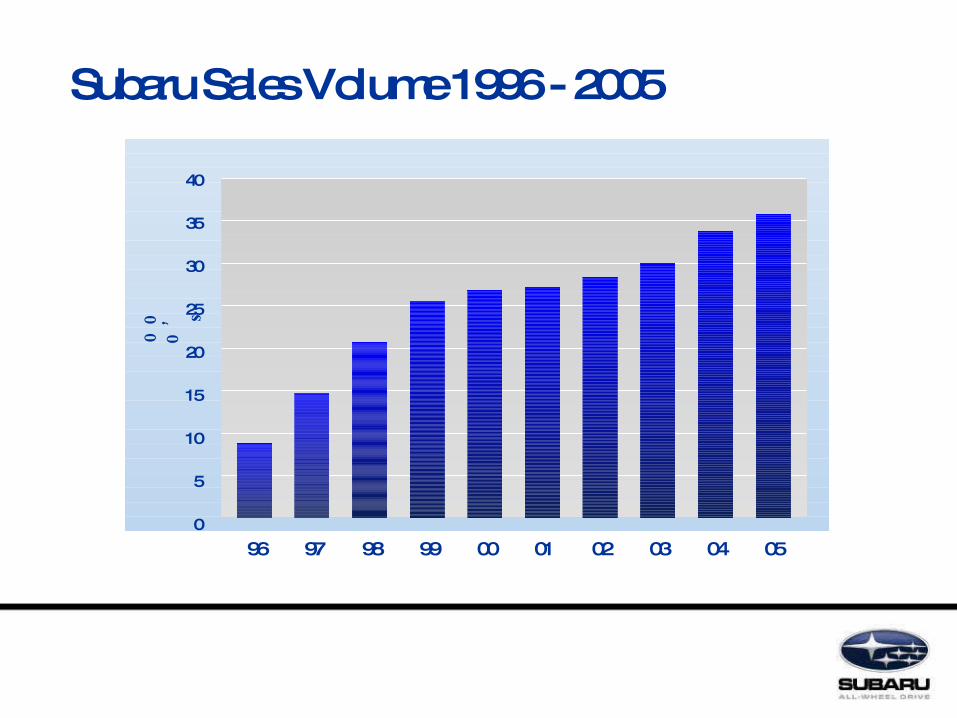
40
35
30
25
20
15
10
5
0
96 97 99 01 02 04 05
Subaru Sales Volume 1996 - 2005
98 00 03
00
0’ s

5,000
4,500
4,000
3,500
3,000
2,500
2,000
1.500
1,000
500
0
99 00 01 02 03 04 05
Subaru Sales Volume $50k Plus

4.0
3.5
3.0
2.5
2.0
1.5
1.0
.5
0
Subaru Market Share
96 97 99 01 02 04 0598 00 03 YTD Mar 06
%
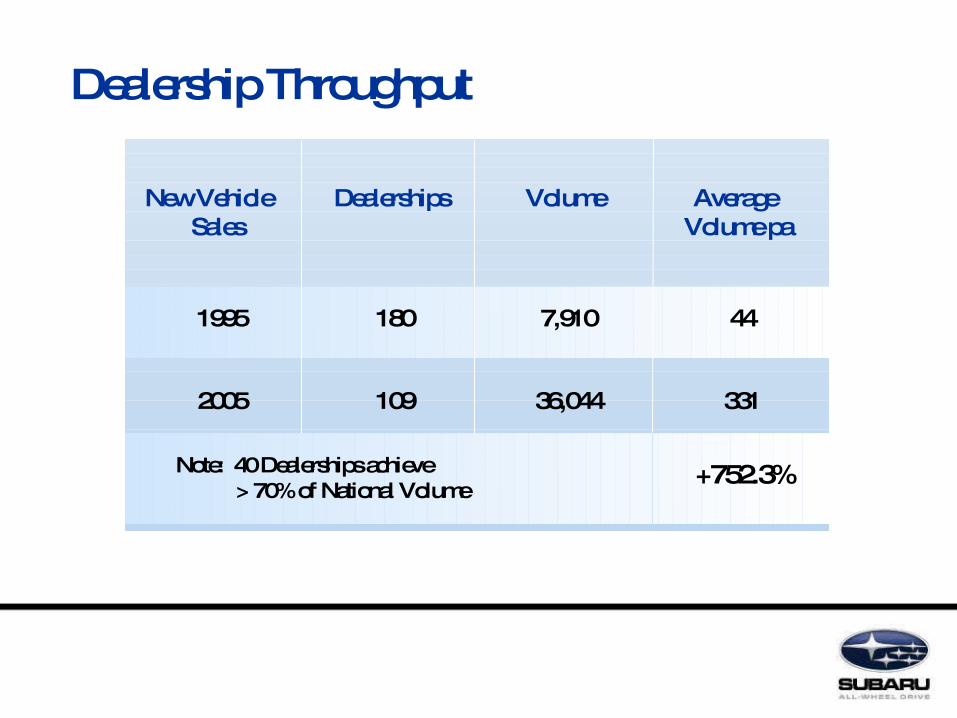
1995 180 7,910 44
2005 109 36,044 331
New Vehicle Dealerships Volume Average Sales Volume pa
Dealership Throughput
Note: 40 Dealerships achieve > 70% of National Volume
+752.3%

Subaru Melbourne – Docklands
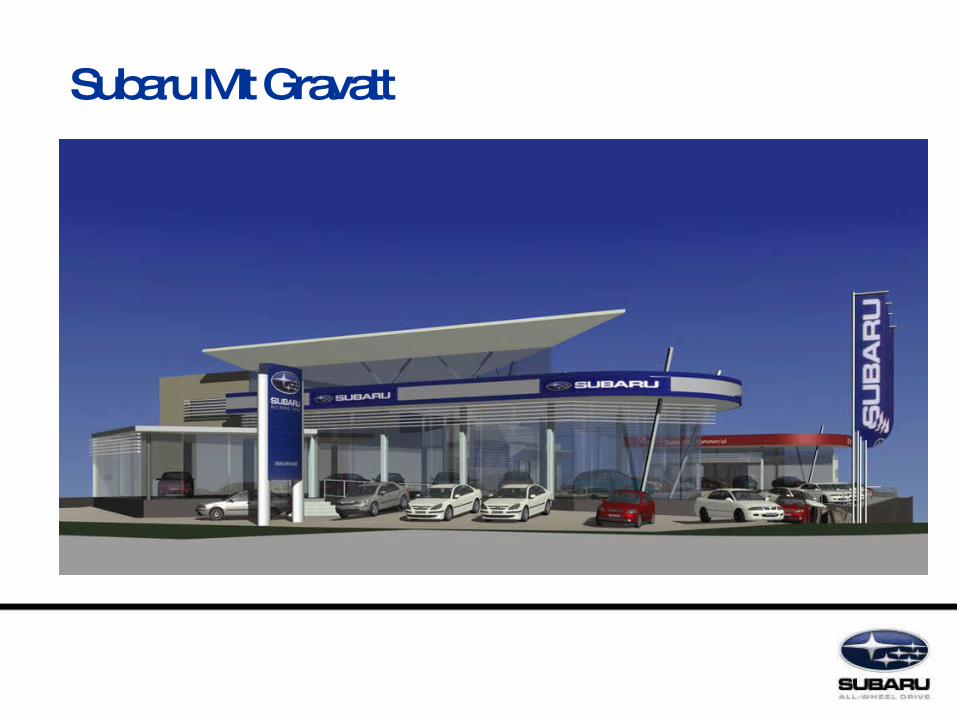
Subaru Mt Gravatt

80
70
60
50
40
30
20
10
0
% of current drivers who would consider repurchasing brand (based on 12mth database and no 20k filter in demographic)
Peu
ge
ot
Su
baru
Ho
lde
n
BM
W
To
yota
Ho
nd
a
Mazd
a
Fo
rd
Vo
lvo
Nis
san
Saab
La
nd
Ro
ver
Vo
lkswag
en
Hyu
nd
ai
Merce
des
Mits
ub
ishi
48
71
65 65
59
52 5147 48
44
3033
56
33
4342
52
68
59 61 61
51
4549
28
4744
32
41
33
4643
Jan 04 -Dec 04
Jul 05 - Jan 06
SOURCE: Panorama
New Car Brand Loyalty:
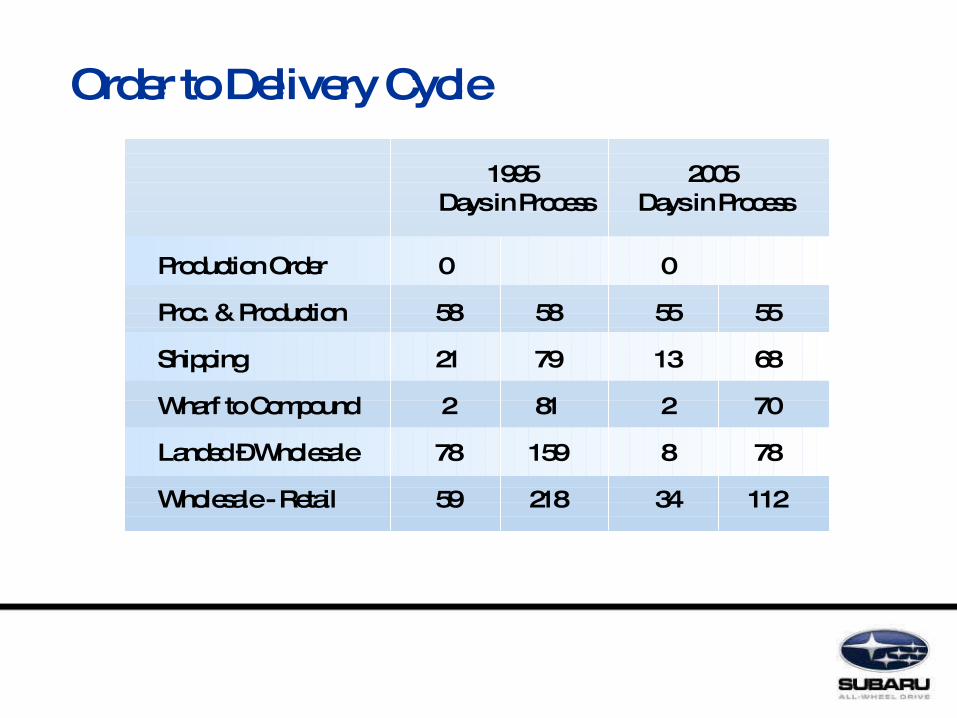
Order to Delivery Cycle
Production Order 0 0
Proc. & Production 58 58 55 55
Shipping 21 79 13 68
Wharf to Compound 2 81 2 70
Landed – Wholesale 78 159 8 78
Wholesale - Retail 59 218 34 112
1995 2005 Days in Process Days in Process
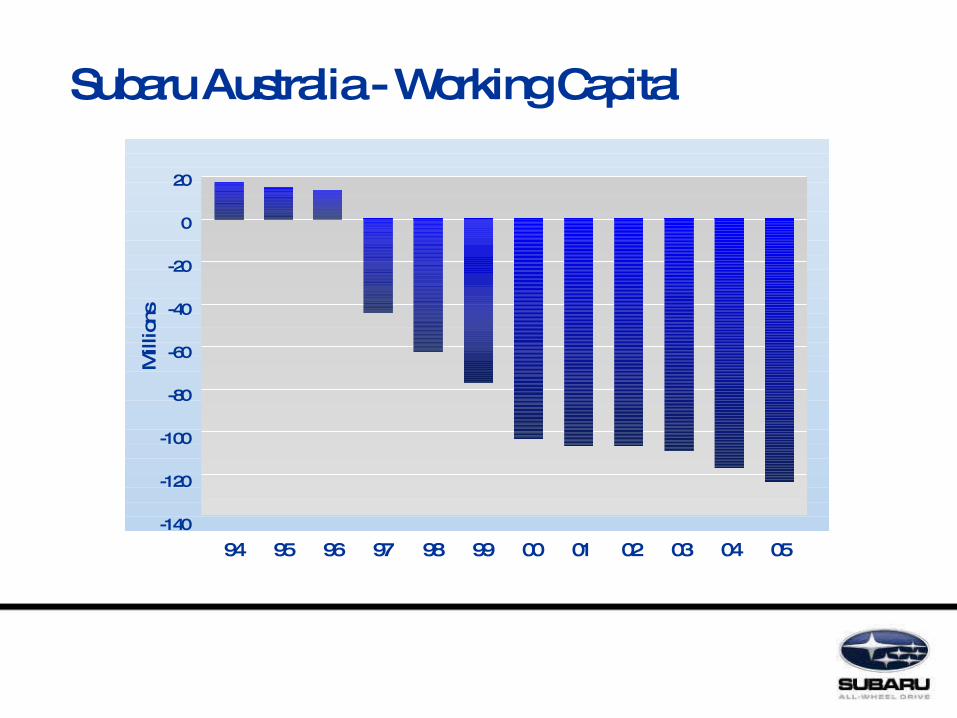
20
0
-20
-40
-60
-80
-100
-120
-140
94 97 99 01 02 04 0598 00 03
Mill
ions
Subaru Australia - Working Capital
95 96
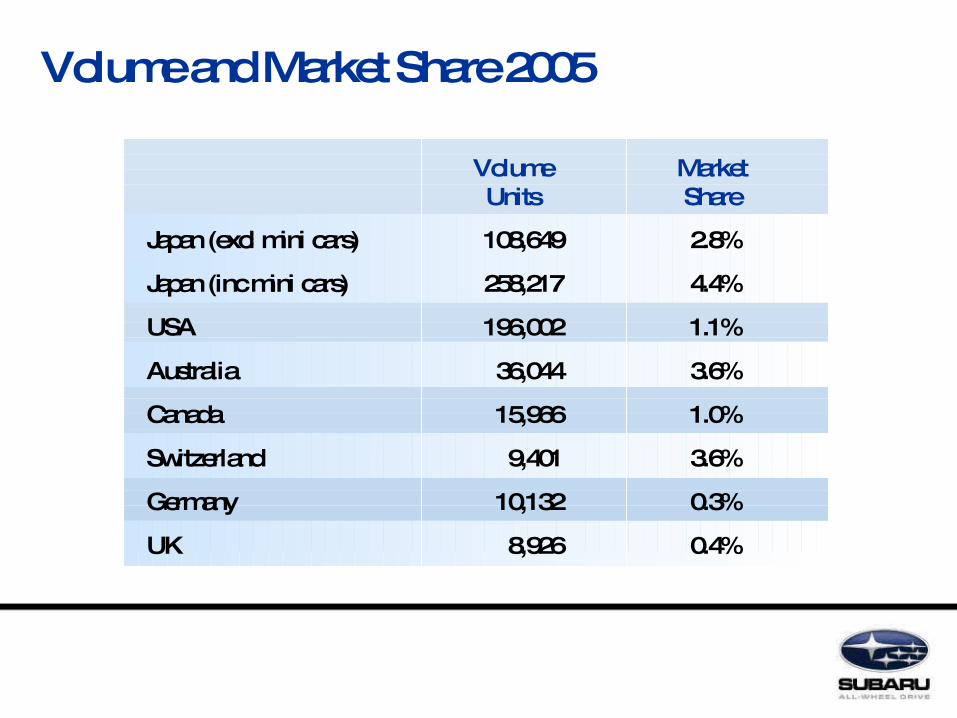
Volume MarketUnits Share
Volume and Market Share 2005
Japan (excl mini cars)
Japan (inc mini cars)
USA
Australia
Canada
Switzerland
Germany
UK
108,649
258,217
196,002
36,044
15,966
9,401
10,132
8,926
2.8%
4.4%
1.1%
3.6%
1.0%
3.6%
0.3%
0.4%

40
30
25
20
15
10
597 99 01 02 04 0598 00 0396
Subaru Australia v Peers
Australia
Germany
UKSwitzerland
Canada
FHI: Retail Sales (000’s)
97 99 01 02 04 0598 00 03
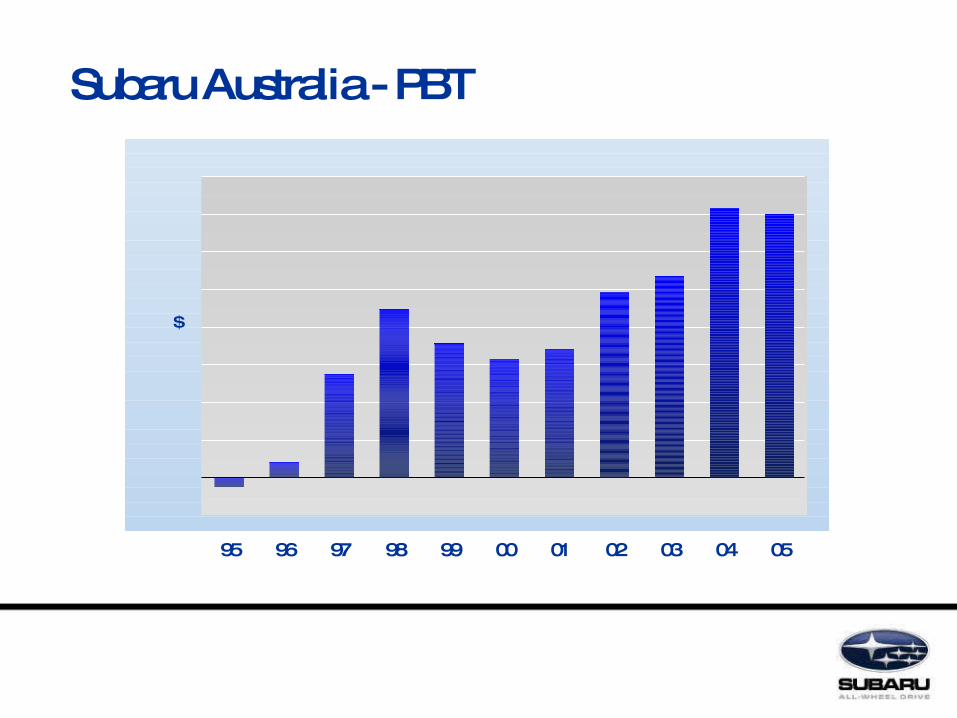
$
95 96
Subaru Australia - PBT

Thank you for your interest.