Victims of Crime Survey (VOCS 2011) - INEGI 3. Isabel... · 1.Introduction. 2. Methodology. 3. VOCS...
23
Victims of Crime Survey (VOCS 2011)
Transcript of Victims of Crime Survey (VOCS 2011) - INEGI 3. Isabel... · 1.Introduction. 2. Methodology. 3. VOCS...
Victims of Crime Survey (VOCS 2011)
Contents1.Introduction
2. Methodology
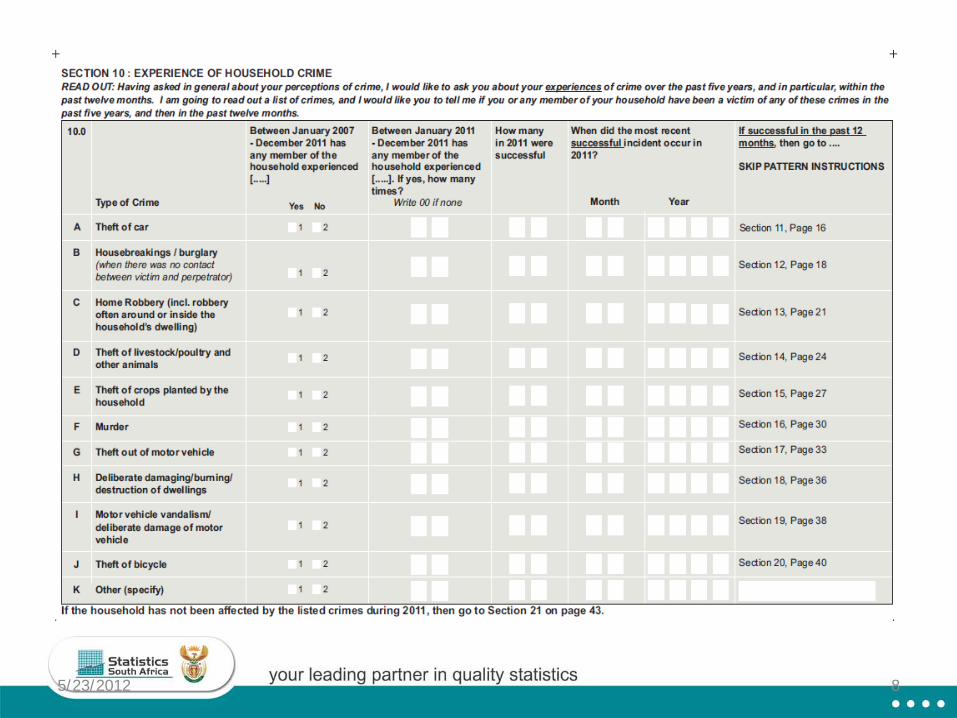
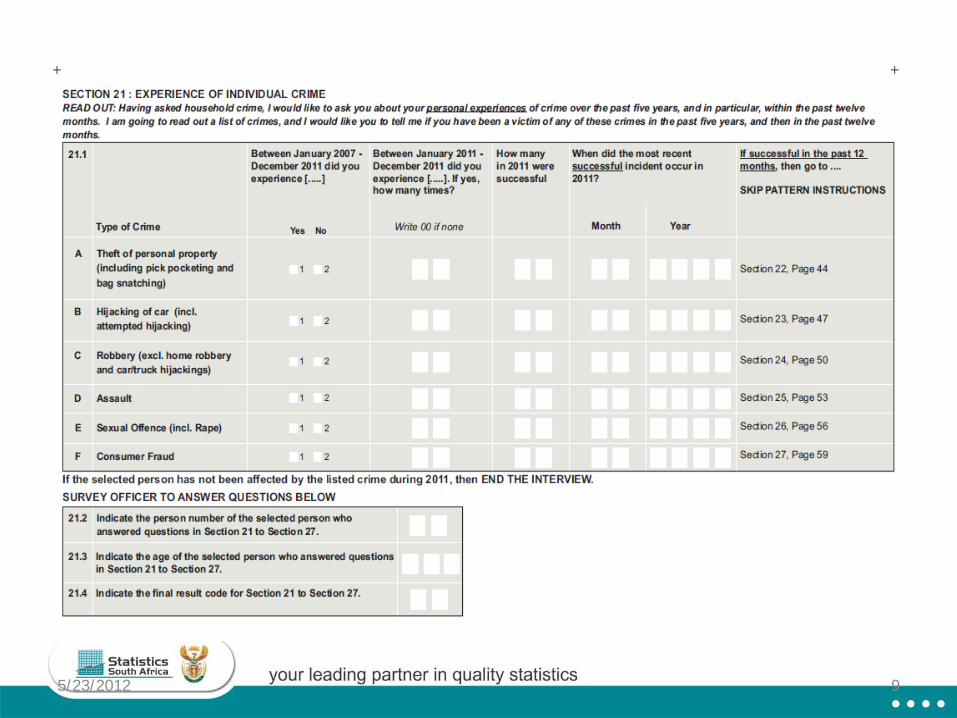
3. VOCS questionnaireSelected Results:• Public perceptions about crime and safety• Feelings of safety• Perceptions about the police
4. Limitations
5. Learning experiences
6. Moving forward
• The first Victims of Crime survey (VOCS) in South Africa (SA) was conducted by Statistics South Africa (Stats SA) in 1998. The Institute for Security Studies (ISS) conducted the 2003 and 2007 versions of the VOCS
• The ‘new’ Victims of Crime Survey (VOCS) series is countrywide annually household-based, large sample survey
Objectives of VOCS are to determine:• The nature, extent and patterns of crime in South Africa, from the victim’s
perspective
• Victim risk and victim proneness, so as to inform the development of crime prevention and public education programmes
• People’s perceptions of services provided by the police and the courts as components of the criminal justice system
Introduction
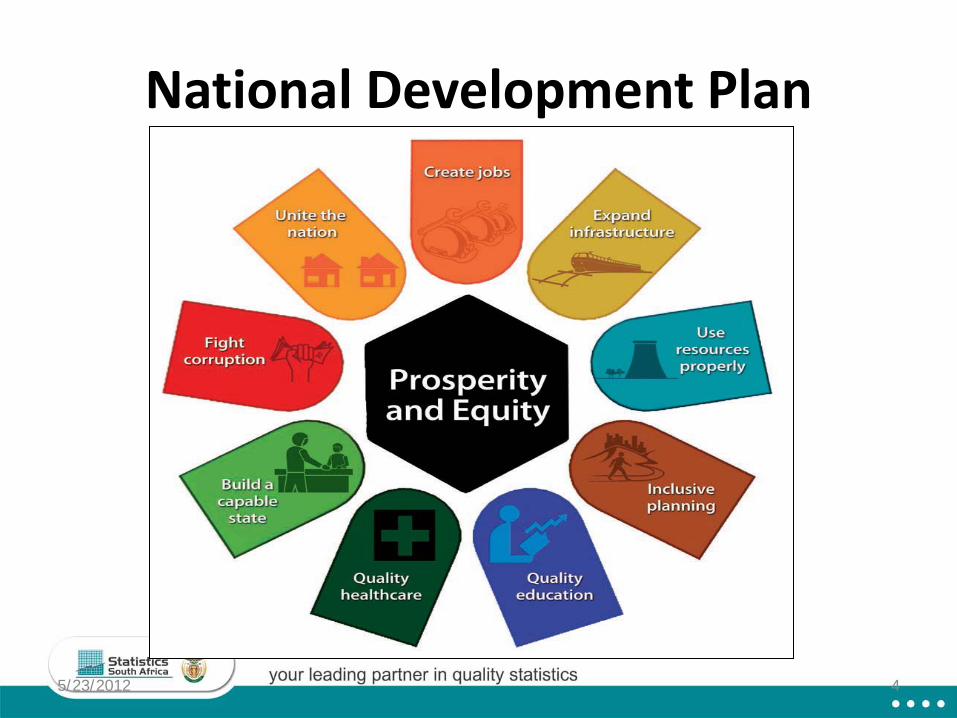
National Development Plan
5/23/2012 4
Responsibility of Statistics South Africa
The survey has now become:• Institutionalised• Standardised• Regularised
5/23/2012 5
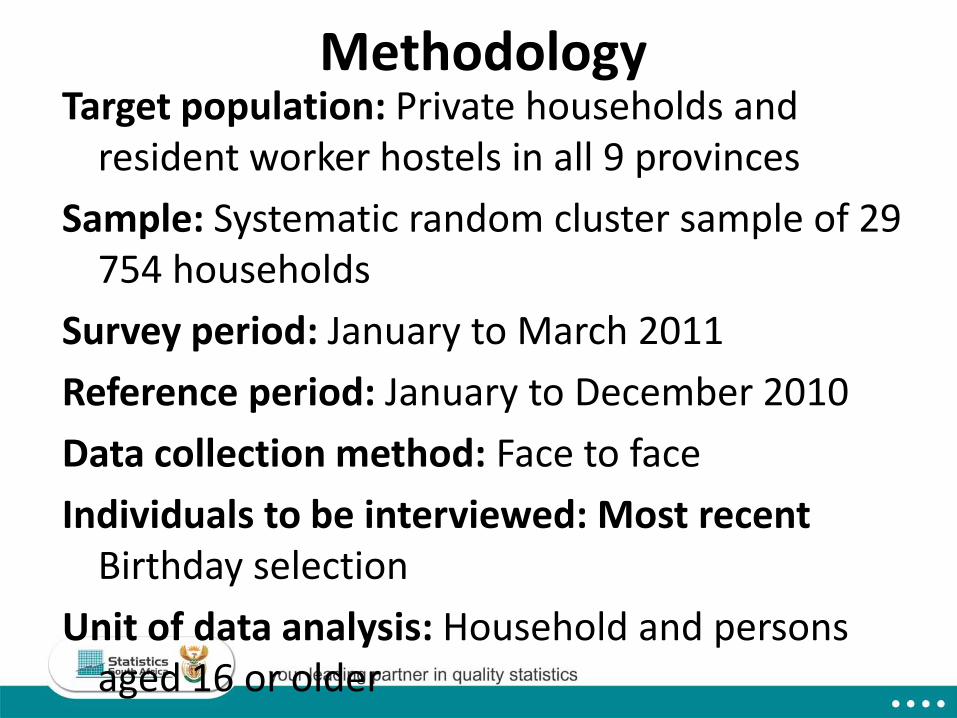
MethodologyTarget population: Private households and
resident worker hostels in all 9 provincesSample: Systematic random cluster sample of 29
754 households Survey period: January to March 2011Reference period: January to December 2010Data collection method: Face to faceIndividuals to be interviewed: Most recent
Birthday selectionUnit of data analysis: Household and persons
aged 16 or older
5/23/2012 7
5/23/2012 8
5/23/2012 9
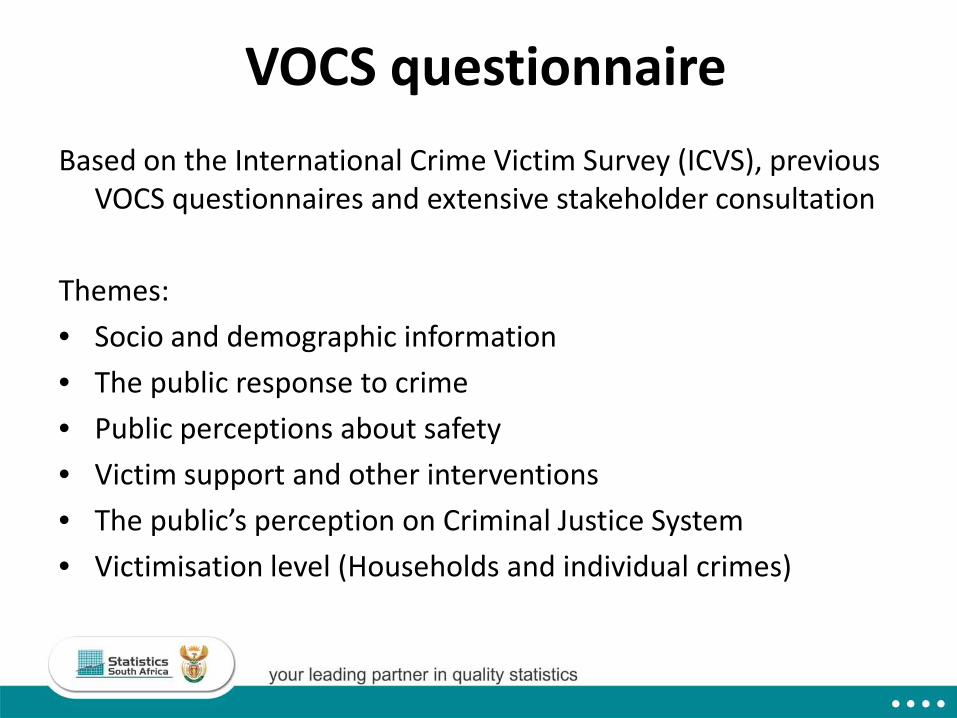
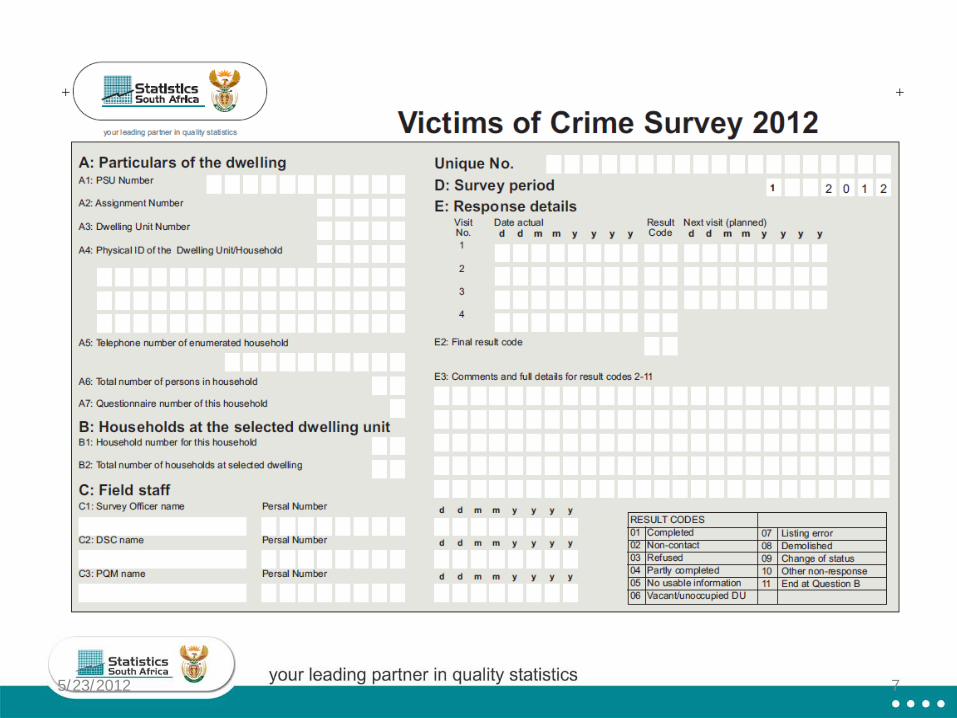
VOCS questionnaireBased on the International Crime Victim Survey (ICVS), previous
VOCS questionnaires and extensive stakeholder consultation
Themes: • Socio and demographic information• The public response to crime • Public perceptions about safety• Victim support and other interventions• The public’s perception on Criminal Justice System• Victimisation level (Households and individual crimes)
PERCEPTIONS ABOUT CRIME AND SAFETY IN THE AREA OF RESIDENCE
Most common crimes Crime feared most
Housebreaking/burglary 53,0 50,2
Home robbery 49,7 50,4
Street robbery 40,9 39,7
Pick-pocketing or bag-snatching 28,5 26,5
Assault (incl. domestic violence) 21,0 20,6
Murder 16,7 34,1
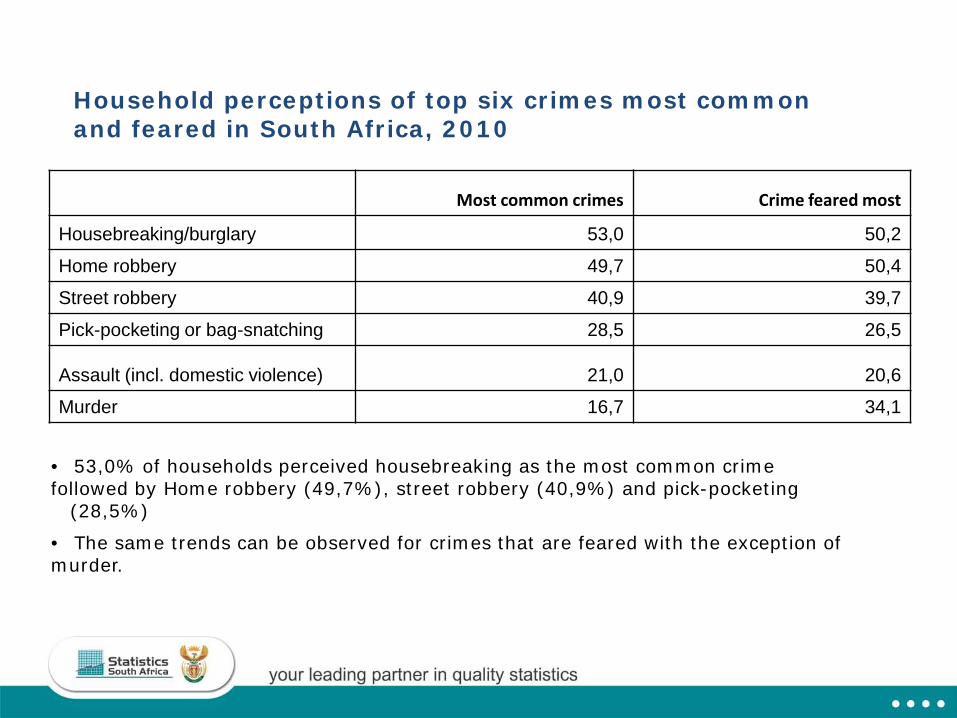
Household perceptions of top six crimes most common and feared in South Africa, 2010
• 53,0% of households perceived housebreaking as the most common crime followed by Home robbery (49,7%), street robbery (40,9%) and pick-pocketing
(28,5%)
• The same trends can be observed for crimes that are feared with the exception of murder.
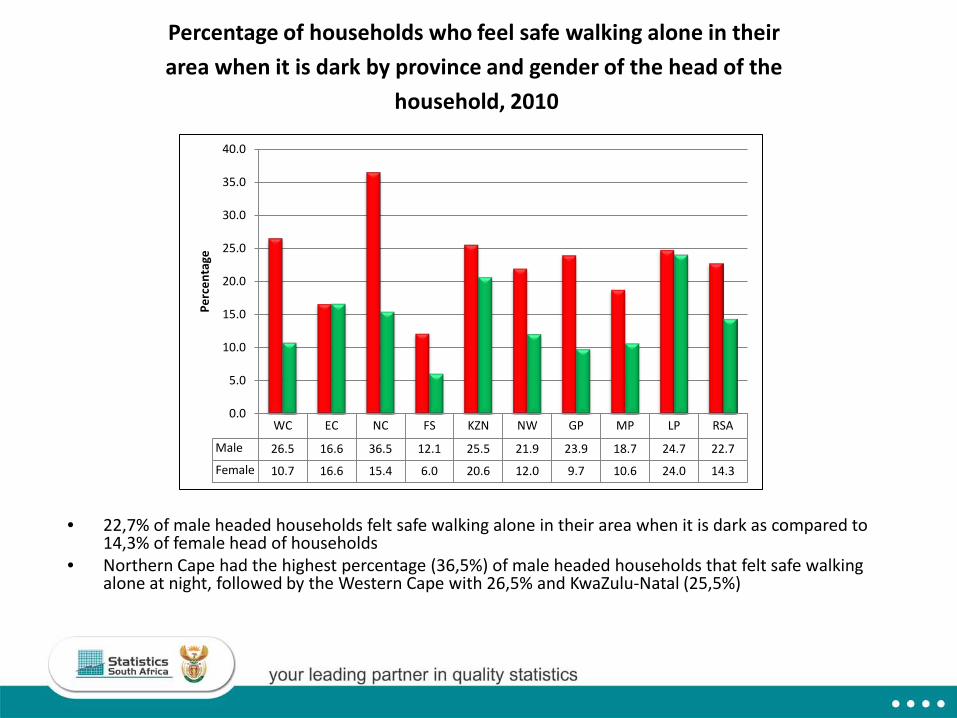
Percentage of households who feel safe walking alone in their area when it is dark by province and gender of the head of the
household, 2010
• 22,7% of male headed households felt safe walking alone in their area when it is dark as compared to 14,3% of female head of households
• Northern Cape had the highest percentage (36,5%) of male headed households that felt safe walking alone at night, followed by the Western Cape with 26,5% and KwaZulu-Natal (25,5%)
WC EC NC FS KZN NW GP MP LP RSA
Male 26.5 16.6 36.5 12.1 25.5 21.9 23.9 18.7 24.7 22.7
Female 10.7 16.6 15.4 6.0 20.6 12.0 9.7 10.6 24.0 14.3
0.0
5.0
10.0
15.0
20.0
25.0
30.0
35.0
40.0
Perc
enta
ge

Views of households on where government should spend money in order to reduce crime (per cent), 2010
66.0
21.013.1
0
10
20
30
40
50
60
70
Social and/or economic development
Law enforcement Judiciary/courts
Perc
enta
ge
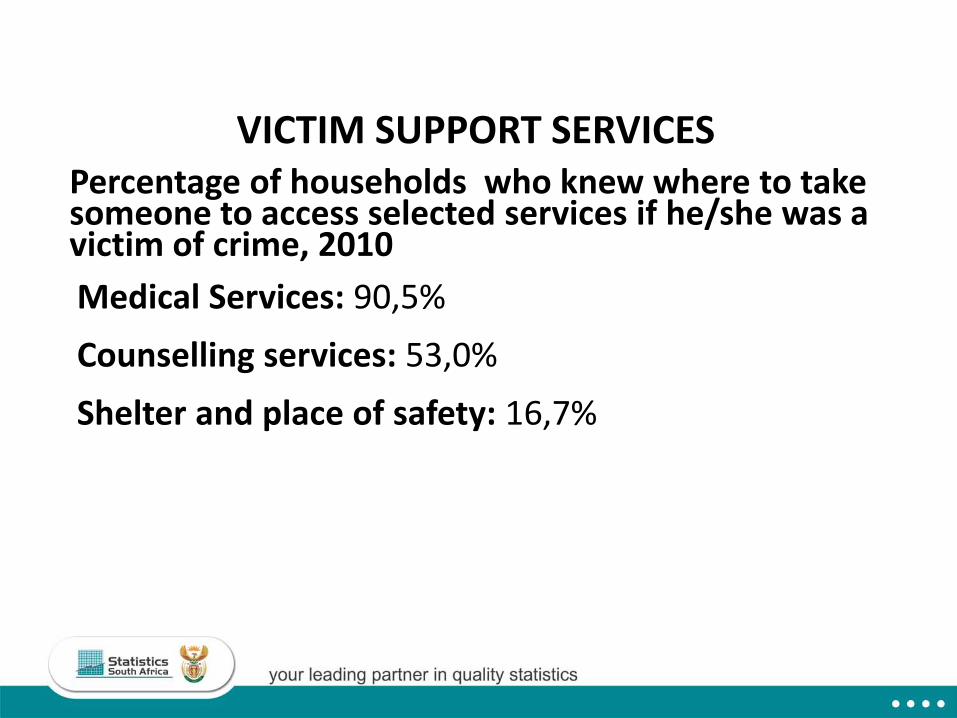
Percentage of households who knew where to take someone to access selected services if he/she was a victim of crime, 2010Medical Services: 90,5%Counselling services: 53,0%Shelter and place of safety: 16,7%
VICTIM SUPPORT SERVICES
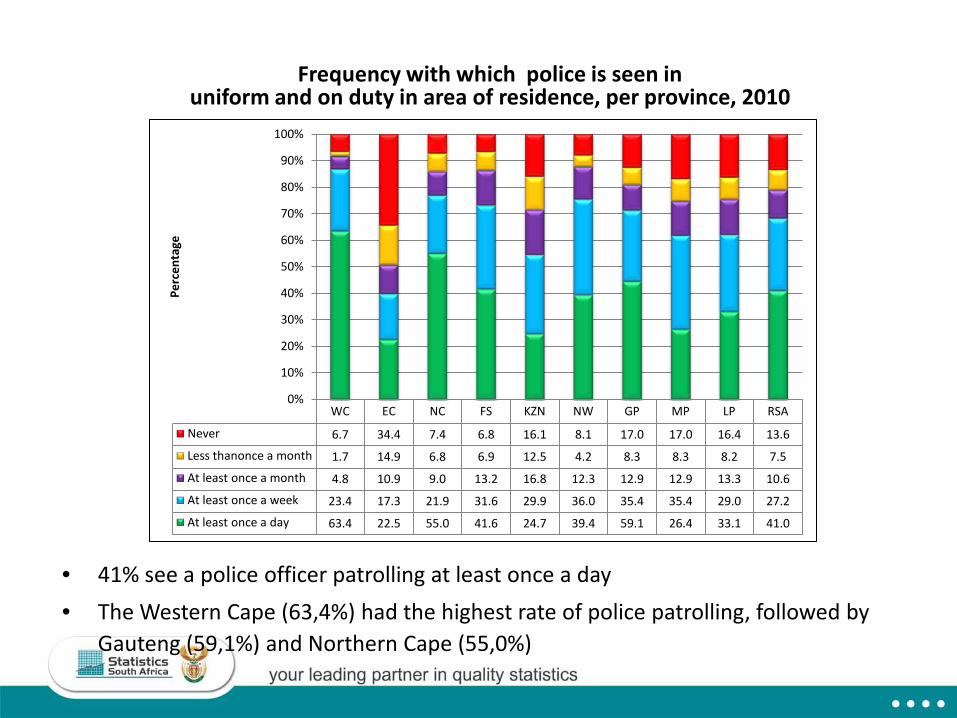
Frequency with which police is seen in uniform and on duty in area of residence, per province, 2010
• 41% see a police officer patrolling at least once a day• The Western Cape (63,4%) had the highest rate of police patrolling, followed by
Gauteng (59,1%) and Northern Cape (55,0%)
WC EC NC FS KZN NW GP MP LP RSA
Never 6.7 34.4 7.4 6.8 16.1 8.1 17.0 17.0 16.4 13.6
Less thanonce a month 1.7 14.9 6.8 6.9 12.5 4.2 8.3 8.3 8.2 7.5
At least once a month 4.8 10.9 9.0 13.2 16.8 12.3 12.9 12.9 13.3 10.6
At least once a week 23.4 17.3 21.9 31.6 29.9 36.0 35.4 35.4 29.0 27.2
At least once a day 63.4 22.5 55.0 41.6 24.7 39.4 59.1 26.4 33.1 41.0
0%
10%
20%
30%
40%
50%
60%
70%
80%
90%
100%
Perc
enta
ge
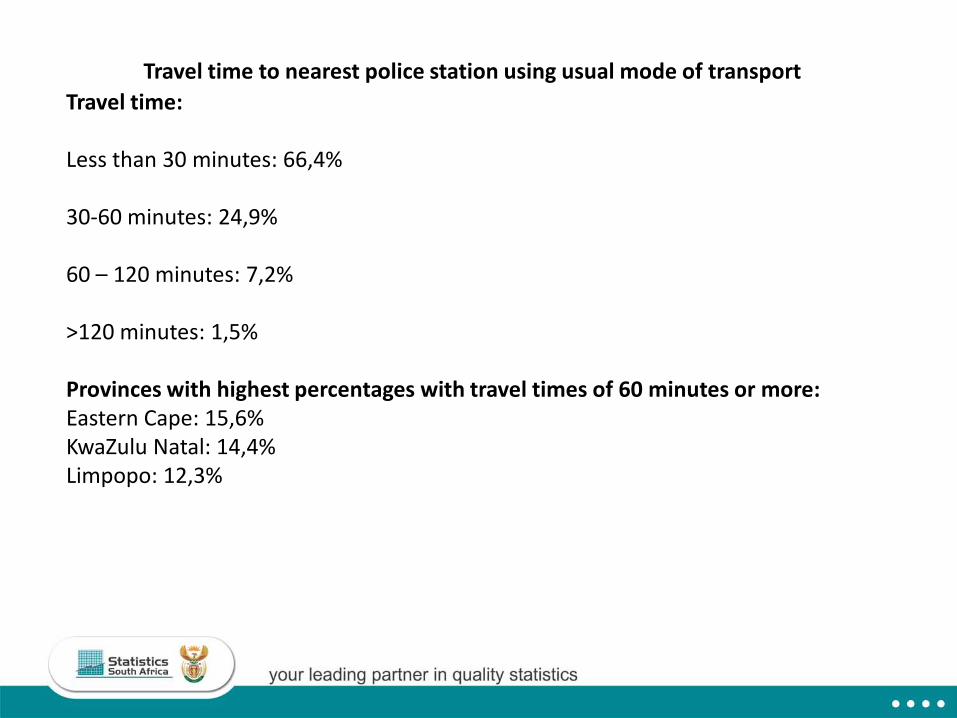
Travel time to nearest police station using usual mode of transport Travel time:
Less than 30 minutes: 66,4%
30-60 minutes: 24,9%
60 – 120 minutes: 7,2%
>120 minutes: 1,5%
Provinces with highest percentages with travel times of 60 minutes or more:Eastern Cape: 15,6% KwaZulu Natal: 14,4%Limpopo: 12,3%
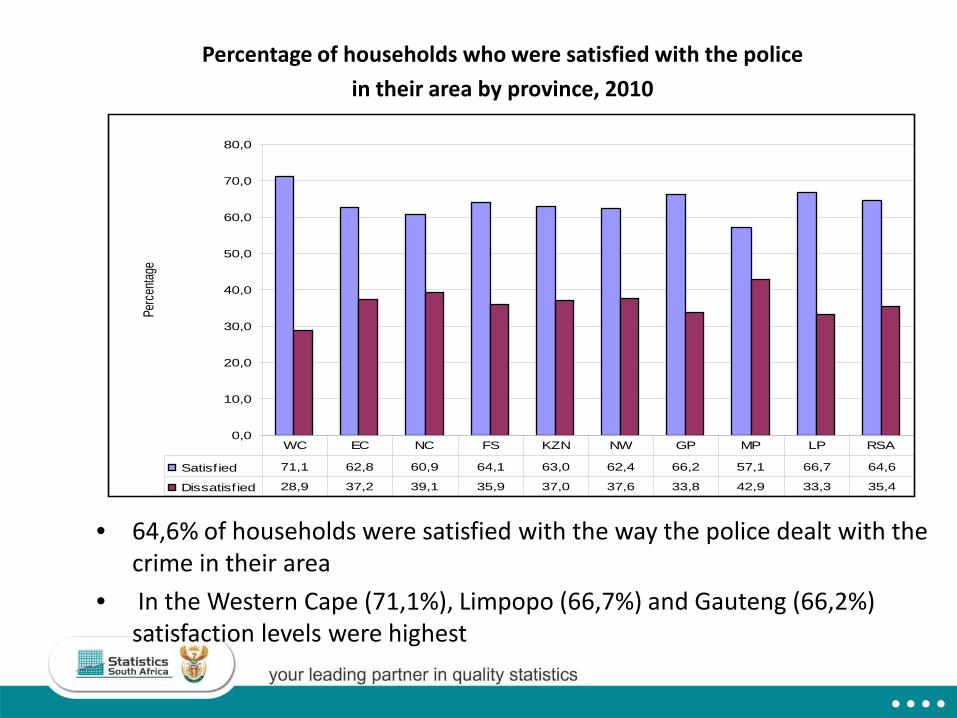
Percentage of households who were satisfied with the police in their area by province, 2010
• 64,6% of households were satisfied with the way the police dealt with the crime in their area
• In the Western Cape (71,1%), Limpopo (66,7%) and Gauteng (66,2%) satisfaction levels were highest
0,0
10,0
20,0
30,0
40,0
50,0
60,0
70,0
80,0Pe
rcen
tage
Satisf ied 71,1 62,8 60,9 64,1 63,0 62,4 66,2 57,1 66,7 64,6
Dissatisf ied 28,9 37,2 39,1 35,9 37,0 37,6 33,8 42,9 33,3 35,4
WC EC NC FS KZN NW GP MP LP RSA
Limitations • Survey may also be subject to undercounting particularly for
incidents of a sensitive nature (e.g. Sexual offences)
• The accuracy of statistics in surveys influenced by the ability of respondents to recall past victimisations
• The current survey do not make provision for recording certain types of crime (such as child abuse and victims against women)
• Difficulties gaining access to households, particularly in high-income areas, and cultural considerations despite publicity and letter of Stats SA
Learning experiences• Child protection act versus Statistics Act• Classifications used in the questionnaire needs to be
as close as possible to administrative record classification.
• The use of so called household crimes increase response rates on those crimes. However, it is not yet clear what the margin of error on proxy responses are.
• Weighting of randomly selected person crimes needs to be refined.
5/23/2012 20
5/23/2012 21
Moving forward
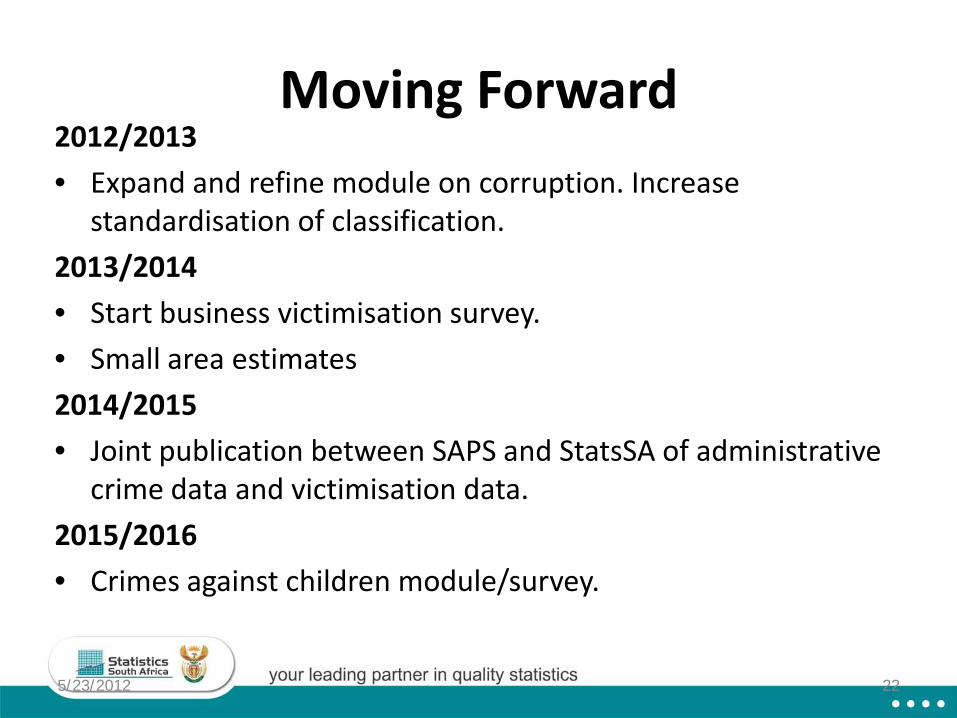
Moving Forward2012/2013• Expand and refine module on corruption. Increase
standardisation of classification. 2013/2014• Start business victimisation survey.• Small area estimates2014/2015• Joint publication between SAPS and StatsSA of administrative
crime data and victimisation data.2015/2016• Crimes against children module/survey.
5/23/2012 22
THANK YOU
HTTP://WWW.STATSSA.GOV.ZA/PUBLICATIONS/P0341/P03412011.PDF