Vicente Salas, Lucio San Juan and Javier Vallés
50
THE FINANCIAL AND REAL PERFORMANCE OF NON-FINANCIAL CORPORATIONS IN THE EURO AREA: 1999-2015 Documentos Ocasionales N.º 1708 Vicente Salas, Lucio San Juan and Javier Vallés 2017
Transcript of Vicente Salas, Lucio San Juan and Javier Vallés

THE FINANCIAL AND REAL PERFORMANCE OF NON-FINANCIAL CORPORATIONS IN THE EURO AREA: 1999-2015
Documentos OcasionalesN.º 1708
Vicente Salas, Lucio San Juanand Javier Vallés
2017

THE FINANCIAL AND REAL PERFORMANCE OF NON-FINANCIAL
CORPORATIONS IN THE EURO AREA: 1999-2015
THE FINANCIAL AND REAL PERFORMANCE OF NON-FINANCIAL
CORPORATIONS IN THE EURO AREA: 1999-2015 (*)
Vicente Salas
UNIVERSIDAD DE ZARAGOZA
Lucio San Juan
BANCO DE ESPAÑA
Javier Vallés
BANCO DE ESPAÑA
Documentos Ocasionales. N.º 1708
2017
(*) We thank Pablo Hernández de Cos, Manuel Ortega, Ana Esteban and Ignacio González for comments on a previous version. The final text is solely the authors’ responsibility.

The Occasional Paper Series seeks to disseminate work conducted at the Banco de España, in the performance of its functions, that may be of general interest.
The opinions and analyses in the Occasional Paper Series are the responsibility of the authors and, therefore, do not necessarily coincide with those of the Banco de España or the Eurosystem.
The Banco de España disseminates its main reports and most of its publications via the Internet on its website at: http://www.bde.es.
Reproduction for educational and non-commercial purposes is permitted provided that the source is acknowledged.
© BANCO DE ESPAÑA, Madrid, 2017
ISSN: 1696-2230 (on-line edition)

Abstract
This paper documents the aggregated performance of non-fi nancial corporations in the
largest euro area economies and compares it with the performance of the US corporate
sector as reported by National Economic Accounts and Financial Accounts. We fi nd
signifi cant cross-country structural differences in the behaviour of real and fi nancial
indicators that remain long after the creation of the single currency, although there
has been convergence in the average cost of debt paid by corporations and in the
deleveraging process unfolding after the fi nancial crisis. German corporations stand out,
with higher productivity of operating capital and profi t margins. Moreover, a lower average
cost of debt and also a lower average corporate tax rate have contributed to a higher return
of equity in Germany compared with the return in other EU countries and the US. Since the
crisis years, German and Spanish companies have joined the US corporations in saving
more than they invest. We also fi nd some evidence of a declining proportion of cash-fl ows
allocated to capital investment.
Keywords: Non-fi nancial corporations, Sectoral National Accounts, fi nancial performance,
rates of return of assets and equity, euro area.
JEL classifi cation: G30.

Resumen
Este trabajo documenta el comportamiento agregado de las empresas no fi nancieras en
las principales economías de la zona del euro y lo compara con el de Estados Unidos a
partir de la información de las Cuentas Nacionales Sectoriales y las Cuentas Financieras.
Encontramos diferencias muy signifi cativas entre países en un conjunto de ratios fi nancieras
y reales, diferencias que se mantienen tras la creación del euro, aunque tras la crisis fi nanciera
ha habido convergencia en el coste de la deuda pagada por las empresas y en el proceso de
desendeudamiento. Las empresas alemanas presentan una mayor productividad del capital
y mayores benefi cios. Además, un menor coste medio de la deuda y de los impuestos en
las empresas alemanas ha contribuido a que estas presenten una mayor rentabilidad del
capital en comparación con las empresas de otros países de la zona del euro y de Estados
Unidos. Desde los años de la crisis tanto las empresas alemanas como las españolas han
pasado a tener un volumen de ahorro superior al de su inversión, igual que las empresas
americanas. También encontramos evidencia de que en la actualidad las empresas dedican,
en general, una menor proporción de su cash-fl ow a inversión.
Palabras claves: Empresas no fi nancieras, cuentas sectoriales, evolución fi nanciera,
rentabilidad de activos, zona del euro.
Códigos JEL: G30.

BANCO DE ESPAÑA 7 DOCUMENTO OCASIONAL N.º 1708
INDEX
Abstract 5
Resumen 6
1 Introduction 8
2 The links between National and Financial Accounts and accounting statements 10
2.1 Income statement 10
2.2 Balance sheet and generation and uses of funds 11
2.3 Flow of funds 12
3 Real and financial variables from the income statement and the balance sheet 14
3.1 Contribution of NFCs to Income and to GDP 14
3.2 Output Growth 15
3.3 Output/ Inputs Composition 16
3.4 Assets and Liabilities 20
3.5 Composition of assets 22
3.6 Composition of liabilities 24
4 Sources and Uses of Funds 29
5 Rates of Return, Cost of Debt and Income Taxes 32
5.1 Returns on assets 32
5.2 Cost of debt and income taxes 36
6 Conclusions 39
DATA APPENDIX 43

BANCO DE ESPAÑA 8 DOCUMENTO OCASIONAL N.º 1708
1 Introduction
This paper examines the performance of the non-fi nancial corporate (NFC) sectors in Germany,
France, Italy and Spain since the creation of the euro in 1999. For comparative reasons the
examination will also include performance indicators of the US corporate sector during the
same sample period. The creation of the euro and the end of national currencies contribute to
fi nancial integration and the approximation in the fi nancial cost of capital of fi rms in euro area
members, given the elimination of exchange rate risks. The goal of this paper is to examine
how the creation of the euro affected the convergence of selected fi nancial and real indicators
for the aggregate of corporate sectors of the four largest euro area countries. The global and
the European economies have undergone years of severe fi nancial and economic crisis during the
sample period. Hence, another issue examined in the paper is how the corporate sectors of
the different countries compare in their performance in the years running up to the crisis, and
in the following period, including the more recent recovery. That analysis seems relevant, for
example, for understanding the weak recovery of business investment since the crisis both in
the euro area and in the US (ECB (2016) and Dottling et al. (2017)).
The data used in the analysis include the income statement and the balance sheet
of the NFC sector in each country, as reported by National Economic Accounts and by the
Financial Accounts, respectively, to EUROSTAT. Data on the corporate sector of the US are
taken from the Bureau of Economic Analysis. The analysis covers the distribution of gross value
added in terms of labour and non-labour income; the composition of balance sheet assets and
liabilities; the calculation of profi t margins and rates of return on capital; and the evaluation of
fl ows of funds, including investment in gross capital formation. The countries considered are the
largest in the euro area and the focus is on the performance of NFCs during the period 1999-
2015. Other components of the market economy such as the fi nancial corporate sector (banks,
insurance companies and so on) and the activity of unincorporated fi rms and self-employed
individuals are excluded. To appreciate the relevance of the non-fi nancial corporate sector in the
national economies, notice that in 2015 the gross value added of the NFC sector represented
between 57% (Germany) and 44% (Italy) of each country’s total GDP, while in the same year
NFCs contributed to gross capital formation in the economy in a range from 71% (Spain) to 52%
(Italy). These proportions would be substantially higher if the comparisons were made solely with
the market economy.
The evaluation of the fi nancial and real indicators contemplates the consolidated
accounts of the non-fi nancial corporate sector as if they were the accounting statements that a
single corporation uses to report on the results of its business activity. Thus the fi rst step in the
analysis will be the organisation of the fl ows and stocks as reported in National Accounts so as
to match as closely as possible the organisation of accounts in the income statements and the
balance sheets prescribed by fi nancial reporting accounting standards at the fi rm level. The time
period covered in this study (1999-2015) includes the years of economic expansion, until 2007,
the years of severe contraction in economic activity due to the great recession, 2008 2013, and

BANCO DE ESPAÑA 9 DOCUMENTO OCASIONAL N.º 1708
the years of recovery, 2014 and 2015. This means that we will be able to compare differences in
performance for corporate sectors in different stages of the business cycle. Moreover, it provides
the opportunity to investigate how the different corporate sectors of the euro area countries
adjust to the single currency, and particularly to the monetary policy of the ECB. The paper
describes what happens in the aggregated corporate sectors of the four countries during the
sample period, with special attention to convergence or divergence in the values of the selected
variables. However, it avoids possible explanations for the observed cross-country differences,
and for the observed changes in the variables over time, left for future work.
Two signifi cant limitations of the dataset need to be kept in mind in the interpretation
of the results. The fi rst is that the income statement and the balance sheet are prepared
independently and using different data sources (transactions of the National Accounts and
balances of the Financial Accounts, respectively), while accounting statements of individual
corporations are drawn from the recording of transactions using double-entry bookkeeping.
The internal consistency between stocks and fl ows assured by double-entry accounting of fi rm-
level transactions cannot be assured at the aggregate level and certain adjustment between
National Accounts and Financial Assets have to be made. The second issue relevant for
the proper interpretation of the results is that the Financial Accounts with the raw data used in the
preparation of the balance sheet includes information only on fi nancial assets and liabilities,
including net worth. No specifi c information on the operating assets of corporations, i.e. on the
assets the NFCs deploy to produce goods and services in the country, is directly available. The
assumption we make here is that, in an initial approximation, the (market) value of the operating
assets of NFCs in each country is equal to the difference between liabilities and net worth minus
fi nancial assets, as reported in the Financial Accounts.
The rest of the document is organised as follows. Section 2 presents some
methodological issues on how to link the National Accounts with accounting statements such
as the income statement, balance sheet and fl ow of funds. Section 3 contains the results of the
analysis of the income fl ows and the balance sheet of the corporate sectors. Section 4 focuses
on the fl ow of funds data, including the investment rate, and in Section 5 fl ows and stocks are
related to indicators of corporate rates of return. The conclusions summarise the main results
of the analysis.

BANCO DE ESPAÑA 10 DOCUMENTO OCASIONAL N.º 1708
2 The links between National and Financial Accounts and accounting statements
This section explains how accounts from National Statistics sources will be organised to produce
an income statement, a balance sheet and a fl ow of funds of the NFC sector in each country
during the period 19992015.
2.1 Income statement
Corporations obtain their revenues mainly from selling the goods and services they produce on
the markets. Production activities consume resource inputs that fi rms purchase, like labour and
intermediate goods and services, together with others directly supplied internally from long-life
resources previously purchased or internally built up, e.g. capital services from machinery and
equipment. The value of production can be decomposed into the value of goods and services
that the NFC sector purchases from other institutional sectors of the economy, including imports
from abroad, and the value added to these externally supplied inputs within the corporate sector
when combined with labour and capital services. Hence, the gross value added (GVA) by NFCs is
the difference between the monetary value of producer goods and services minus the purchase
cost of inputs purchased outside the corporate sector.
The difference between the revenues from the production and sales of goods and
services, and the explicit costs incurred in such production and sales, gives the operating profi t;
these profi ts represent the accounting profi t (before interest and taxes) from operational activities
of production and sales conducted within the boundaries of the national economy. Operating
profi ts are also the residual of gross value added net of production taxes and subsidies,
compensation of employees, depreciation of capital and other expenses.
Corporations can, and actually do, generate income from fi nancial investments, from
real estate assets, and from production and sales activities abroad; in the latter case income is
most often received in the form of royalties, interests and dividends. Throughout this paper, we
group all income from investments and transactions other than the production and sale of goods
and services within national boundaries, under the single heading of fi nancial income.
Firms that use debt from banks or from other sources to fi nance their investment will
pay prearranged interest on this debt; these interest expenditures are tax-deductible, meaning
corporations pay taxes on total profi ts, from operations and from other activities, net of the
interest paid on debt. Accounting conventions do not attribute a fi nancial cost (opportunity
cost) to own funds, so the net profi ts reported on the bottom line of the income statement
are not equal to the economic profi ts. The reason is that the calculation of net profi ts ignores
the opportunity fi nancial cost of the own funds – equity – that, together with debt, fi nance all
corporate assets.1
1 Barkai (2016) presents an estimation of the user cost of capital for the NFCs of the US economy to obtain the implied
economic profi t measure.

BANCO DE ESPAÑA 11 DOCUMENTO OCASIONAL N.º 1708
Given all these considerations, the items on the income statement, from the value of
production to the net profi ts of NFCs, are presented in Box 1.
2.2 Balance sheet and generation and uses of funds
We write the equality between assets and liabilities in a simplifi ed balance sheet as follows:
FA + OA = D + E
Where FA indicates fi nancial assets, OA indicates operating assets, D is the amount of debt
and E is the amount of equity. The operating assets are those used in the production and sale
of goods and services within national boundaries, together with labour and intermediate inputs
purchased outside the corporate sector. The operating assets can be separated into tangible
and intangible fi xed assets, and current assets; the current assets, in turn, include inventories,
accounts receivable minus accounts payable2, and cash and cash equivalents for the normal
operation of the business activity. Thus we have:
2 The accounts receivable represent sales already delivered to customers but still pending payment; accounts payable
represent the money value of goods and services purchased by the fi rm from its suppliers, also pending payment. Both
are directly tied to the activity of producing and selling goods and services within national boundaries, and the reason
for obtaining the difference between the two is to avoid double counting in the sense that what a supplier records on its
balance sheet as accounts receivable appears on the balance sheet of the buyer as accounts payable. Another reason
to net out accounts payable from accounts receivable in the modifi ed balance sheet is because accounts payable are
debt without explicit fi nancial cost that is determined mainly as part of the commercial policy of the company, while bank
loans and bonds have an explicit fi nancial cost and are the result of fi nancial leverage policies and decisions.
BOX 1INCOME STATEMENT OF NFCs
Value of production
- Consumption of goods services from outside the NFC sector
= Gross Value Added (GVA)
- Production taxes + subsidies
- Labour compensation
= Gross operating profi t
- Amortisation and other expenses (net) (a)
=Operating profi t
+Financial income
+Other property rents (net) (b)
= Earnings before interest and taxes (EBIT)
- Interest on debt
- Corporate and property taxes
= Net profi t
a Other net expenses are obtained from other current transfers.
b Other net property rents includes income from investment funds and insurance policies, net withdrawals from
income of quasi-corporations and net rents.

BANCO DE ESPAÑA 12 DOCUMENTO OCASIONAL N.º 1708
Operating Assets (OA) = Fixed Assets + Inventories + Accounts Receivable - Accounts Payable +
Cash and cash equivalents.
The Financial Assets (FA) include all the assets that represent claims on income from
investments other than those that turn into operating assets of the business. They may include
bank deposits additional to cash and cash equivalents, bonds, loans and equity. Some of these
loans and equity will be the fi nancial counterpart of assets in subsidiaries and other corporations
abroad, on the balance sheet of the national headquarters.
2.3 Flow of funds
The equivalent to the simplifi ed balance sheet above, in terms of fl ows, may be written as3:
ΔFA + ΔOA = ΔD + ΔE
The equation expresses the identity between fl ows of sources and uses of funds in a
given period of time. Most often, for growing fi rms, the fl ow on uses of funds includes positive
changes in the stock of fi nancial assets, ΔFA, from new fi nancial investments, and changes in
the stock of operating assets or productive capacity, ΔOA. Firms invest in tangible and intangible
capital to replace the loss in productive capacity from depreciation of capital assets, and
possibly expand that capacity. The change in operating assets is affected positively by the new
capital investment, I, and negatively by depreciation, AM, so ΔOA=IN =I-AM, where IN is the
net capital investment. Firms generate internal funds from retained earnings, RE, equal to profi t
B minus dividends paid, DI, that expand the equity base, and change directly the equity base
either with new issues or with share buy-backs, ΔC: ΔE=B-DI+ΔC. Finally ΔD is the change in
debt needed to balance the fl ow account. We then re-write the balance fl ow equation as:
ΔFA + IN = ΔD + B – DI +ΔC
Therefore, profi t B can be written as,
B = (DI—ΔC) + IN + (ΔAF –ΔD)
The second equation expresses the identity between the net profi ts generated in the
period and the distribution to three possible uses: pay dividends to the shareholders (net of
shares issues or cancelations), net investment in operating assets, capacity expansion, and
modify the difference between fi nancial assets and corporate debt to balance the fl ows account.
Instead of profi ts one could use cash fl ows (CF), profi ts (B) plus amortisation (AM), a cost but not
a cash outfl ow, in the balance of fl ows equation. The new equation is:
CF=B+AM = (DI—ΔC) + I + (ΔAF –ΔD)
3 This way of writing the generation and uses of businesses’ cash fl ows is taken from Gruber and Kamin (2015).

BANCO DE ESPAÑA 13 DOCUMENTO OCASIONAL N.º 1708
In National Accounts it is common to use the measure of excess (+) or need (-) of funds
as an indicator of whether the corporate sector generates internally more funds than those
needed to fi nance capital investment and the dividends paid to the shareholders, excess; or, on
the contrary, the corporate sector needs funds additional to those generated internally to fi nance
investment and dividends paid, needs. From the previous notation,
Excess (+)/ Needs (-) of funds = (B – DI) – IN = ΔAF – (ΔD + ΔC) = CF - DI - I
Net profi ts minus distributed dividends (BDI) gives the amount of corporate savings (S).
Thus the excess of funds corresponds to a situation where corporate savings are greater than
investment. As we will show below there is evidence of positive corporate lending for some
countries in recent years, i.e. savings higher than investment, a phenomenon called “corporate
savings glut”.

BANCO DE ESPAÑA 14 DOCUMENTO OCASIONAL N.º 1708
3 Real and financial variables from the income statement and the balance sheet
Table A1 in the Appendix shows the values of the items listed as part of the income statement
aggregate for all NFCs of France, Germany, Italy, Spain and the US from 1999 to 2015. The
items included in the income statement are the same as those listed in section 2.1 (Box 1).
For each country the Table shows the values in absolute terms (current euro/dollars). At a later
stage, the analysis of the contents of the assets and liabilities of the balance sheet are based on
the items from Table A2 of the Appendix.
3.1 Contribution of NFCs to Income and to GDP
The corporate sector contributes to the national income of the economy from two main sources: the
gross value added (GVA) from production and sales activities conducted within the country; and
the fi nancial income plus other property income, earned by holding domestic assets, fi nancial
and non-fi nancial alike, outside the boundaries of the NFC sector, and by holding fi nancial and
non-fi nancial assets resident in foreign countries. Overall, the sum of GVA, fi nancial income
and income from property assets gives the total income with which the NFCs contribute to the
Gross National Income of the country. Figure 1 shows the evolution over time of the ratio of
the gross income of the NFC sector to the Gross National Income for each country in the sample.
Germany, France and Spain are the countries where the contribution of income
generated in the NFC is the highest, around 55% of their total income by 2015. The remaining
national income comes from households, governments and fi nancial institutions. It is interesting
that in these countries the NFCs income share moderately increases in the pre-crisis years and
continues that trend with the recovery. In Italy the corporate sector only contributes around 43%
of the national income and has been stable around that value. In this country households income
share is much higher (around 10 percentage points) than in the other European countries and
that may explained by the relative importance of self-employed business4.
4 For example, in Italy self-employed businesses account for 23% of the total employment whereas that ratio in Germany
and France is 10% and in Spain is 17% for the average 1999-2015 period.
30
35
40
45
50
55
60
1999 2000 2001 2002 2003 2004 2005 2006 2007 2008 2009 2010 2011 2012 2013 2014 2015
FRANCE GERMANY ITALY SPAIN US
%
NFCs INCOME AS A PROPORTION OF GROSS NATIONAL INCOME (CURRENT PRICES)
FIGURE 1
SOURCE: Own calculations.

BANCO DE ESPAÑA 15 DOCUMENTO OCASIONAL N.º 1708
The NFCs income share in the US is around 38% of the national income but that only
takes into consideration the non-fi nancial corporate business. If we were also considering the
non-fi nancial non-corporate business (as it is reported for the European countries by Eurostat)
then the average income share were around 50% in the sample period, close to the European
values in Figure 1 with the exception of Italy.
Although the contribution of GVA to the National Income is much more signifi cant than
the contribution of fi nancial and other property rents, the composition is not the same in all
countries. Figure 2 shows the separate contribution of GVA in relation to GDP. Now the GVA
contribution to GDP in Germany and France is more stable over time than the contribution of
total income. Comparing Figure 1 and 2, the gross income contribution of the corporate sectors
in Germany and France is quite similar but the GVA relative to GDP of the French corporate
sector is 7 pp lower than the contribution of that of Germany. That may be explained by the
higher importance of fi nancial rents in France over the sample period.
3.2 Output Growth
The annual real rate of growth of GVA (nominal minus the infl ation rate measured by the GDP
defl ator) in Figure 3 shows high volatility, which is as expected given that all the countries were
affected by the fi nancial and economic crisis. But this variable also shows signifi cant differences
across countries over time. The GVA of the Spanish NFC sector was growing at 7% in real terms
in 2007, just before the start of the fi nancial crisis; in fact, since the introduction of the euro, the
real growth rate has on average been more than twice the growth rate of the corporate sectors
in other European countries.
The severe contraction in corporate sector activity is clear from Figure 3. In 2007, GVA
in Germany and France was growing at an annual real rate of 4% while in 2009 their respective
rates were negative at 6.5% and 4%. The Spanish corporate sector’s rate of growth fell from 7%
in 2007 to 2% in 2009. The second recession had also very signifi cant real effects. In France
and Germany the growth rate in the second recession, around 2012, was close to zero. The
double dip in the Italian and Spanish corporate sector was notable, with growth rates of 4%
40
45
50
55
60
FRANCE GERMANY ITALY SPAIN US
%
SOURCE: Own calculations.
GVA OF CORPORATE SECTOR AS A PROPORTION OF GDP FIGURE 2
1999 2000 2001 2002 2003 2004 2005 2006 2007 2008 2009 2010 2011 2012 2013 2014 2015

BANCO DE ESPAÑA 16 DOCUMENTO OCASIONAL N.º 1708
and -3% respectively in 2012. Again, this highlights the heterogeneous effects of the recent
crisis in Europe, due partly to the accumulated vulnerabilities in some of these countries in the
precrisis years of economic expansion. In 2014 and 2015, annual growth rates are positive in
all countries, with Spain and Germany leading the recovery, and concentrated in the range of
1% to 3%.
The growth rates of GVA of the corporate sector in the US shows as much volatility as
that of the European countries in the years in the run-up to the last crisis, but a more stable path
since 2010. With the dot com crisis at the start of the 2000s the growth rate turned negative,
standing at almost 3% in 2001; the recovery was fast and in 2004 the US corporate sector grew
at 4%, substantially higher than the growth rates of the European countries. The GVA of the US
corporate sector started to decelerate in 2007 and the growth rate turned negative in 2008 and
2009, when it was close to 6%, similar to the growth rate of the German and the Italian sector.
The corporate sector in the US has been growing above 2% since 2010 whereas the European
corporate sectors did not catch up with a similar growth rate until four years later.
3.3 Output/ Inputs Composition
The output produced by NFCs consumes different inputs. One distinction is between inputs
purchased from suppliers outside the corporate sector, intermediate inputs, and inputs from
primary resources, labour and capital, incorporated into the process of adding economic value
within the corporate sector. On the basis of this distinction, the value of production is decomposed
into monetary value of intermediate inputs and th gross value added, GVA. The ratios of GVA to
the value of production in Figure 4 offers information on the relative signifi cance of “make” versus
“buy” in the value chain of the different corporate sectors, and its evolution over time.
Among the European countries, the Italian NFC sector has the lowest ratio of GVA
to value production and the German NFC sector the highest, meaning the Italian NFC sector
is that where the intermediate inputs purchased from outside the sector have more weight in
the value of production and the German the one with the lowest weignt of intermediate inputs
in production. One could say then that the German NFC sector is more vertically integrated,
-8
-6
-4
-2
0
2
4
6
8
FRANCE GERMANY ITALY SPAIN US
%
REAL (GDP DEFLATOR) ANNUAL GROWTH RATE OF GVA FIGURE 3
SOURCE: Own calculations.
2000 2001 2002 2003 2004 2005 2006 2007 2008 2009 2010 2011 2012 2013 2014 2015

BANCO DE ESPAÑA 17 DOCUMENTO OCASIONAL N.º 1708
making more and buying less than Italy’s. In particular, 35% of the value of everything produced
by the Italian NFC sector comes from value added within the sector, while in German NFCs
GVA represents 45% of the value of production. GVA as a proportion of total production in the
French NFC sector is slightly lower than in Germany’s, while in the case of Spain the proportion
is somewhere between that of French and Italian corporations. Finally, the US companies have
a much higher GVA ratio than their European counterparts, and it represents more than 50% of
their production in the entire sample period.
In the fi ve countries the composition of the value of production undergoes some
changes over time. The common pattern in Europe is a decrease in the share of GVA and
therefore an increase in intermediate inputs consumption in the precrisis years, 19992007. In
2009 the trend changes and GVA increases its weight in total production. By 2015 the corporate
sectors of all the countries have practically reached the GVA/total production ration they had
in the year 2000, and the signifi cant cross-country differences in the initial years of the sample
period remain. The Spanish NFC sector is that where the two trends during the sample period
are more pronounced: in 2007, GVA as a proportion of the value of production was 5 p.p. lower
than in the year 2000, and two years later, in 2009, it was back to the 2000 level. The years of a
disproportionate increase in the value of intermediate inputs relative to the value of production in
the Spanish NFCs coincide with the extraordinary expansion of the construction and real estate
sub-sectors, an increase in imports and huge external current account defi cits, all fuelled by an
unprecedented increase in credit to the private sector of the economy. By contrast, the share of
GVA in the US corporate sector only deviates from the general stability over time with the rise in
the crisis years of 2008-2009.
Labour compensation and profits
Gross Value Added is divided into the compensation of employees, the compensation of
capital services, and the compensation of entrepreneurial inputs, used in the production
of goods and services. At this point of the analysis, the separation between capital input costs
and economic entrepreneurial rents/economic profi ts has not been made since it would require
25
30
35
40
45
50
55
60
FRANCE GERMANY ITALY SPAIN US
%
RATIO OF GVA TO VALUE OF PRODUCTION FIGURE 4
SOURCE: Own calculations.
1999 2000 2001 2002 2003 2004 2005 2006 2007 2008 2009 2010 2011 2012 2013 2014 2015

BANCO DE ESPAÑA 18 DOCUMENTO OCASIONAL N.º 1708
having an estimate of the user cost of capital that is not available. Therefore, we will simply
decompose GVA into labour and non-labour inputs compensation. Figure 5 shows the proportion
of labour compensation relative to GVA. The non-labour compensation includes taxes net of
subsidies on production (around 1%), and the sum of gross capital services compensation and
entrepreneurial rents not included in labour compensation.
The Italian corporate sector has the lowest proportion of labour compensation
relative to GVA, while the French corporate sector is that with the highest proportion. In 1999
the differences between the two countries was 15 p.p.; in 2015 the difference is only 10 p.p.
because Italian corporate sector labour compensation has been gaining weight throughout the
sample period. In 1999 the proportions of labour compensation relative to GVA of the corporate
sectors of France, Germany and Spain were all very similar (around 62%) and also similar to the
US labour share. The labour ratios for France and Spain remain practically identical until 2007, in
the years prior to the crisis, and have diverged since 2008. In France the ratio increases to over
65% and in Spain falls to 57% in 2015. The German share of labour compensation decreases
in the pre-crisis period and in 2007 is almost 10 pp lower than in 1999. Since 2008 the trend
has changed sign and in the fi nal years of the sample period this ratio stabilises to a value close
to 60%. The corporate sector in the US is the only one where the labour share moves on a
decreasing trend throughout the sample period. Thus, in 2015 the share of labour compensation
converges to values 5 p.p. lower than its value in 2000 for the corporate sectors of Germany,
Spain and the US. But the French corporate sector remains removed from this converging trend,
while the Italian labour share converges to this value but with an increasing time trend.
In any case, these differences on the pattern of labour share trends relative to GVA
shown in Figure 5 with a homogenous dataset do not conform exactly to the generally accepted
view that the share is moving on a decreasing trend in most developed countries around the
world (Karabarbounis and Neiman, 2013).
As for the profi ts share in GVA, we shall focus on two measures of accounting profi ts:
the operating profi t and net profi t in the income statement outlined in section 2.1. The operating
40
45
50
55
60
65
70
FRANCE GERMANY ITALY SPAIN US
%
LABOUR COMPENSATION AS A PROPORTION OF GVA FIGURE 5
SOURCE: Own calculations.
1999 2000 2001 2002 2003 2004 2005 2006 2007 2008 2009 2010 2011 2012 2013 2014 2015

BANCO DE ESPAÑA 19 DOCUMENTO OCASIONAL N.º 1708
profi t includes the capital services (operating assets) compensation and the entrepreneurial
compensation, net of depreciation allowances and other costs, with all of these concepts
originating from production activities within domestic boundaries. It is equal to GVA minus
production taxes and subsidies, minus labour compensation and minus depreciation and
other expenses. The net profi t, the bottom line of the income statement, gives the amount of
shareholders’ free disposable income after all revenues and explicit costs of the corporations
are accounted for. Figures 6 and 7 show the ratios of operating profi ts to GVA and net profi ts to
all corporate income (GVA plus fi nancial and other property income, since part of the net profi t
arises from other income other than GVA) respectively, for the NFCs of the selected countries.
The ratio of operating profi ts in Italian NFCs decreases over time from a high of 30%
in 1999 to 17.5% in 2015; this decline in the operating profi t margin is parallel to the increase
in the labour share from Figure 5. In French NFCs something similar occurs but with profi t
margins between 15 p.p. and 10 p.p. lower than in the Italian NFCs. The operating profi t margin
of German NFCs fi rst increases until 2007 and decreases thereafter to values similar to those
in the initial years of the sample period, just the opposite of the profi t margin of Spanish NFCs,
although at lower level values (20%). The operating profi t margin of US corporations in 2015 is
5 p.p. higher in 2015 than in 19995. The course of operating profi t margins is determined mainly
by changes in the share of labour compensation and amortisation expenses in total GVA; in
countries like Spain, the operating margin does not increase in parallel with the decrease in the
share of labour compensation during the crisis because the decrease is offset by an increase in
amortisation expenses.
The profi t margins calculated as the ratio of net profi t to total corporate income (see
Figure 7) do not always coincide in their time trend with that of the net operating margins in
Figure 6. The net profi t margin increases in the pre-crisis years in Germany, France and the US,
while it decreases in the corporate sectors of Italy, starting in 2005, and especially in Spain (from
15% in 1999 to 7% in 2007). Spanish NFCs is also the corporate sector where net profi t margin
5 Cette and Villetelle (2015) report a similar pattern of profi t margins for the European and the US corporates, but showing
a higher level of that ratio.
0
5
10
15
20
25
30
35
FRANCE GERMANY ITALY SPAIN US
%
OPERATING PROFIT RELATIVE TO GVA FIGURE 6
SOURCE: Own calculations.
1999 2000 2001 2002 2003 2004 2005 2006 2007 2008 2009 2010 2011 2012 2013 2014 2015

BANCO DE ESPAÑA 20 DOCUMENTO OCASIONAL N.º 1708
increases most sharply during the crisis years, to a value close to 20% in 2015. In the corporate
sectors of France, Italy and the US the net profi t margin stabilises during the crisis around 15%,
while German corporations earn a net profi t margin almost 10 pp higher, up to a level of 24%.
Revenues and costs other than those used to obtain the operating profi ts in the income
statement contribute differently, in quantity and sign, to corporate net profi ts among the countries
compared. In the Spanish NFC sector the net contribution is increasingly negative until 2007, and
increasingly positive in the following years. Therefore, the time evolution in the net profi t margin
of Spanish corporations is explained in part by interest expenses and corporate profi t taxes,
increasing in the period of expansion, and decreasing after the crisis.6 This is also the pattern
observed in interest expenses in US corporations (see section 6.3 below). Italian NFCs’ net profi t
margin follows a decreasing path, very similar in size to that shown by the operating profi t margin.
Thus Italy, out of the fi ve countries, had the highest net profi t margin rate in 1999 (24%) whereas
it presents the lowest rate in 2015 (14%).
Thus, the share of operating profi ts and net profi ts in GVA and total income, respectively,
show large difference across countries, with German corporates presenting the largest values
before and after the crisis, and Spanish corporates posting the biggest recovery, i.e. 13 pp in
the period from 2007 to 2015.
3.4 Assets and Liabilities
We now examine the balance sheets of NFCs in the selected countries during the same time
period in which we examined the income statement, namely 19992015. The Financial Accounts
of the NFC sector for the European economies (ESA 2010) come from the statistical offi ce of the
European Union7. The information provided in the National Income and Product Account (NIPA)
6 For example, the 2016 Annual Report of the Banco de España documents how the positive effects stemming from
the additional easing of ECB monetary policy since mid-2014 and the decrease in the taxation of households and
companies contributed to aggregate economic growth in the most recent period and, in particular, to the recovery of
Spanish corporate profi ts.
7 This information can be found at the following link: http://ec.europa.eu/eurostat/web/sector-accounts/data/database
0
5
10
15
20
25
30
FRANCE GERMANY ITALY SPAIN US
%
NET PROFIT RELATIVE TO ALL INCOME FIGURE 7
SOURCE: Own calculations.
1999 2000 2001 2002 2003 2004 2005 2006 2007 2008 2009 2010 2011 2012 2013 2014 2015

BANCO DE ESPAÑA 21 DOCUMENTO OCASIONAL N.º 1708
for the US non-fi nancial corporate business is taken from the Bureau of Economic Analysis8. In
the composition of assets and liabilities we will follow the exposition in section 2.2. The balance
sheets of German, French, Italian, Spanish and US NFCs, in absolute values, appear in Table A2
of the Appendix9. The reported values of the corresponding accounts are consolidated fi gures,
meaning that the assets and liabilities from transactions affecting NFCs within the same country
are netted out. The fi nancial assets, along with equity, are valued at current prices, while debt is
recorded at face value.
In the case of European NFCs, the ESA reports only the stocks of fi nancial assets
and fi nancial liabilities, including net worth, held by NFCs at the end of the respective year. No
reference is made to the stock of tangible and other operating assets that corporations own and
use in the production of goods and services. Liabilities and net worth exceed fi nancial assets so
it is reasonable to assume that the difference between the liabilities side and the assets side of
the balance sheet reported in the ESA has as a counterpart on the assets side the non-fi nancial
assets – tangible and intangible alike – that corporations use for production and sale. This is
precisely the case for the US NFCs, for which this breakdown of information is available in the
NIPA tables of the BEA. The reported balance sheet information is presented in Box 2.
According to the information in Table A2, in the four European countries the total assets
of NFCs increase in the fi fteen-year period, albeit with differences among them. Spain is the
country where total assets experienced the highest increase, and in 2015 they are 2.5 times the
value in 1999. In German NFCs the ratio of total assets in 2015 to total assets in 1999 is 1.4, the
lowest among the selected countries, while in France and Italy assets multiply by two during the
same period. The value total of assets of US NFCs in 2015 is also twice the value in the year 1999.
Figure 8 shows the growth rates of total assets, expressed in real terms (nominal growth
rate minus CPI infl ation). The most pronounced differences in growth rates across countries
8 The information can be accessed through the following link: https:\\www.bea.gov/iTable/index_nipa.cfm.
9 The values of assets and liabilities shown in Table A2 for each year are calculated as an average of two consecutive
year-end values: the current and the previous year.
BOX 2ASSETS AND LIABILITIES OF NFCs
Operating assets Tangible and intangible assets, accounts receivable minus accounts payable, cash and short-term deposits
Debt Including bank loans and other interest-bearing debt and excluding accounts payable
Financial assets Excluding accounts receivable, cash and short-term deposits
Equity Net worth
seitilibaiL latoTstessA latoT

BANCO DE ESPAÑA 22 DOCUMENTO OCASIONAL N.º 1708
occur in the years prior to the crisis. Total corporate assets decrease sharply in 2001 and 2002,
probably as the consequence of the dot-com crisis, especially in Germany and France. Starting
in 2003 the growth rates recover and reach maximum values for the sample period in most of the
countries in 200607. With the crisis they fall sharply again and the recovery to positive territory
does not seem to fi rm until 2013, in line with the doubledip recession that some European
countries affected by the sovereign debt crisis experienced during this period. The assets of
Spanish corporations experience the highest growth rates in the years of expansion with a value
of 15% in 2006. Two years later that rate is negative and remains there until 2014 and 2015
when the growth rate stabilises at zero. Since 2010 the US corporate sector has been that with
the highest total assets growth rate in real terms, consistent with an earlier and more vigorous
economic recovery compared with the European one.
3.5 Composition of assets
On the assets side of the balance sheet a distinction is made between operating assets and
fi nancial assets (as defi ned before). Figure 9 shows the time evolution of operating assets as
a proportion of total assets; the complementary value is the proportion of fi nancial assets. The
Italian and Spanish corporate sectors have the largest proportion of operating assets relative to
total assets, and the German sector the smallest, with the French in between. The differences
are important: in Italy close to 80% of the total assets of NFCs are operating assets while in
German NFCs the proportion is close to 50%10. In the corporate sectors of France and the
US, operating assets as a proportion of total assets is around 50%60%. The proportion of
operating assets in the Spanish corporate sector has moved on a moderate declining trend
since the start of the crisis whereas the German corporate sector has shown a positive trend
10 We are aware that other international statistical sources, like the Financial Soundness Indicators of the IMF, report
for Germany values of operating and total assets in the 20102015 period different from those reported by Eurostat.
We decided to maintain the same source of data for all EU countries to preserve homogeneity. In particular, German
operating assets with IMF data reach 63% over total assets during the average period 2010-2015, i.e. 15 p.p. higher
than those obtained with Eurostat and reported in Figure 9. Therefore, according to IMF data, operating assets as a
proportion of total assets of NFCs in Germany would be in an intermediate range among the countries analyzed, while
with Eurostat data they are in the lowest band. We did not fi nd such large differences in the other countries considered.
The higher German operating assets according to IMF data has a counterpart on the liability side, specifi cally in capital
and reserves, while the rest of balance-sheet items (fi nancial assets and debt) are practically the same between IMF
and Eurostat statistics.
-15
-10
-5
0
5
10
15
20
FRANCE GERMANY ITALY SPAIN US
%
REAL ANNUAL GROWTH RATE OF TOTAL CORPORATE ASSETS FIGURE 8
SOURCE: Own calculations.
2000 2001 2002 2003 2004 2005 2006 2007 2008 2009 2010 2011 2012 2013 2014 2015

BANCO DE ESPAÑA 23 DOCUMENTO OCASIONAL N.º 1708
since 200111. In the rest of the corporate sectors the proportions stay stable over time. The
particular evolution of Spanish operating assets may simply be the consequence of the larger
excess capacity built up in the precrisis years, when the operating assets of Spanish corporations
grew at higher rates. Similarly, the fall in the weight of Spanish NFCs’ operating assets could be
in line with the important reduction in gross capital formation in the years of the crisis jointly with
the contraction in the internal demand. At the same time, Spanish corporations have maintained
practically unchanged the fi nancial assets during the years of the crisis.
After the fi nancial crisis there have been policy and academic discussions about the
issue of corporations “hoarding” cash rather than investing, especially among large US fi rms.
Figure 10 depicts a ratio of liquid assets to total assets for the NFCs of the fi ve economies
analysed. We defi ne the liquidity ratio as: ((cash + shortterm deposits + mutual funds)/total
assets). The liquidity ratio shows substantial differences across countries in overall levels and in
changes over time. Interestingly, the German corporate sector shows the highest liquidity ratio
and presents a clear positive trend, starting with a value of 11% in 1999 that steadily increases
11 The lower proportion of operating assets of NFCs in Germany could also be partly linked to their higher share of
holdings abroad since they are classifi ed as fi nancial assets (equity holdings).
0
10
20
30
40
50
60
70
80
90
FRANCE GERMANY ITALY SPAIN US
%
OPERATING ASSETS AS A PROPORTION OF TOTAL ASSETS FIGURE 9
SOURCE: Own calculations.
1999 2000 2001 2002 2003 2004 2005 2006 2007 2008 2009 2010 2011 2012 2013 2014 2015
0
5
10
15
20
FRANCE GERMANY ITALY SPAIN US
%
LIQUID ASSETS RELATIVE TO TOTAL ASSETS FIGURE 10
SOURCE: Own calculations.
1999 2000 2001 2002 2003 2004 2005 2006 2007 2008 2009 2010 2011 2012 2013 2014 2015

BANCO DE ESPAÑA 24 DOCUMENTO OCASIONAL N.º 1708
over time to almost 20% in 2015. The other EU countries show a lower and more stable liquidity
ratio (around 5%10%). The Spanish corporations present a more volatile ratio, increasing in
periods of expansion and decreasing in periods of contraction.
Contrary to what might be expected from the corporate “hoarding” claim, US
corporations show lower liquidity ratios than corporations in EU countries, namely 3% compared
with a much higher ratio in the case of German corporations. Moreover, the liquidity ratio of US
corporations remains quite stable over time with a minor blip only in 2009.
3.6 Composition of liabilities
On the liabilities side of the balance sheet we fi rst focus attention on three different leverage
ratios, one relating to the level of total leverage and the other two to the composition of leverage.
Later we propose a modifi ed leverage ratio that takes into account the liquid fi nancial assets and
two stock-fl ow ratios, and that also analyses corporate debt.
The ratio of debt to total assets is shown in Figure 11. French corporations show the
lowest leverage ratio among EU corporate sectors throughout the time period, around 40% on
average. The German and French corporations also show the highest stability in the leverage
ratio over time, the German ratio slightly decreasing and the French one slightly increasing to
converge at a value of 42% in 2015. The leverage ratios of Spanish and Italian NFCs show more
volatility over time. Spanish corporations started with a leverage ratio similar to that of French
fi rms in 1999, at 35%, and in 2009 the ratio was 57%, almost double that in 1999. Since 2009
deleveraging has been signifi cant and gradually approaching that of the other countries, and
similar to the course of the leverage ratio of Italian corporations since 2012; however, by 2015
the leverage ratio of corporations in the corporate sectors of Italy and Spain is still 5 pp above
the ratio of German and French corporations.
US corporations are less leveraged than their European counterparts practically
throughout the sample period; the US leverage ratio has been decreasing and in 2015 it is at
30
35
40
45
50
55
60
FRANCE GERMANY ITALY SPAIN US
%
DEBT RELATIVE TO TOTAL LIABILITIES FIGURE 11
SOURCE: Own calculations.
1999 2000 2001 2002 2003 2004 2005 2006 2007 2008 2009 2010 2011 2012 2013 2014 2015

BANCO DE ESPAÑA 25 DOCUMENTO OCASIONAL N.º 1708
32%, 10 pp lower than the leverage ratio of corporations in Germany and France and 15 pp
lower than the leverage ratio of Spanish and Italian corporations.
Figure 12A depicts loans as a proportion of total debt. In the EU countries, between
60% and 90% of total NFCs’ debts are in the form of loans. Spanish corporations hold the
largest proportion of debt in loans, at 90%, and Germans the lowest, at 60%. The leverage ratios
of French and Italian corporations are in between. Loans represent a much lower proportion of
all debt of NFCs in the US, at 20% in 2015, than in the EU countries. However, examining the
phenomenon of “bancarization” among the economies compared requires a closer look at bank
debt. Figure 12B represents the ratio of bank loans to total loans . Normally, bank loans account
for most of the loans received by non fi nancial fi rms in Europe, ranging between 70% and
80% in the period and countries considered, although the deleveraging process in Spain
and the rebalancing towards diversifi ed funding sources of NFCs in this country (towards more
market-based fi nance) have led their ratio to fall below even 60% recently, while in the rest
of the European countries analysed it has remained relatively stable and above 70% over most
of the period. In the case of US corporations this ratio stands at somewhat below 30% in 2015,
with a slightly decreasing trend since 1999.
During and after the years of the fi nancial crisis, NFCs of all economies have reduced
their leverage with banks most notably. In the case of Spanish corporations, bank debt increased
0
20
40
60
80
100
99 00 01 02 03 04 05 06 07 08 09 10 11 12 13 14 15
%
LOANS AND BANKS LOANS FIGURE 12
A LOANS RELATIVE TO TOTAL DEBT
0
20
40
60
80
100
99 00 01 02 03 04 05 06 07 08 09 10 11 12 13 14 15
%
B BANK LOANS RELATIVE TO TOTAL LOANS
SOURCE: Own calculations.
FRANCE GERMANY ITALY SPAIN US

BANCO DE ESPAÑA 26 DOCUMENTO OCASIONAL N.º 1708
as a proportion of total debt in the period 19992007 to the point where, in 2008, 74% of the debt
of Spanish NFCs was bank loans. Banking debt was then the main source of debt that fuelled
the growth of assets and liabilities of Spanish NFCs during the years of economic expansion
prior to the crisis. Since 2008 the contraction in Spanish NFCs’ bank debt has been higher than
in the other economies as shown jointly in Figures 12A and 12B. This contraction approaches
20 p.p. in terms of total debt, set against more moderate reductions in the rest of the countries
(around 5 p.p.).
A second relevant debt composition ratio makes the distinction between short-term
and long-term debt. High levels of debt expose fi rms to fi nancial risks that may be reduced by
a proportion of debt with a longer maturity. Figure 13 shows long-term debt (both bank and
nonbank) as a proportion of total debt. Except for France, there has been a signifi cant rise in
longterm leverage both in the euro area and in the US corporates over the sample period. In
1995 Italian NFCs had the lowest ratio (a difference of 30 p.p. relative to the other euro area
economies); and by 2015 Spanish corporates, which present a similar total leverage ratio to the
average euro area (Figure 11), present the highest proportion of longterm debt (89%), almost
15 p.p. more than the other euro area economies. Moreover, the signifi cant differences between
the US and the core euro area economies (France and Germany) in terms of the longterm
leverage ratio in 1995 have disappeared by 2015.
Arguably, the liquid fi nancial assets held by corporations are readily available to pay for
their debt so the leverage ratios should account for differences in the liquidity ratio to assess the
true differences in vulnerability due to higher or lower leverage ratios. With this in mind, Figure 14
presents the evolution of a modifi ed leverage ratio calculated as follows: (total debt – longterm
deposits liquid assets)/(liabilities – longterm deposits - liquid assets). Longterm bank deposits
are added now to the liquid assets considering that they could be collateral of the bank debt.
Compared with the standard leverage ratio in Figure 11, the modifi ed leverage ratio
presents a lower level, as expected. The higher proportion of liquidity assets and the higher
35
45
55
65
75
85
95
FRANCE GERMANY ITALY SPAIN US
%
LONG-TERM DEBT RELATIVE TO TOTAL DEBT FIGURE 13
SOURCE: Own calculations.
1999 2000 2001 2002 2003 2004 2005 2006 2007 2008 2009 2010 2011 2012 2013 2014 2015

BANCO DE ESPAÑA 27 DOCUMENTO OCASIONAL N.º 1708
proportion of long-term deposits in the EU countries compared with the US explain that, with the
new leverage ratio, the differences between US and EU corporations are now less pronounced.
In fact, with the new leverage ratio differences between French and US corporations practically
disappear. Now German corporations have shown a clearly downward trend since 2003. The
German modifi ed leverage ratio in 2015 is 9 p.p. lower than that for corporations in the US.
The previous “stock ratios” of leverage may be complemented with two other leverage
ratios that combine stocks and fl ows. The ratio of corporate debt to GVA is presented in Figure 15
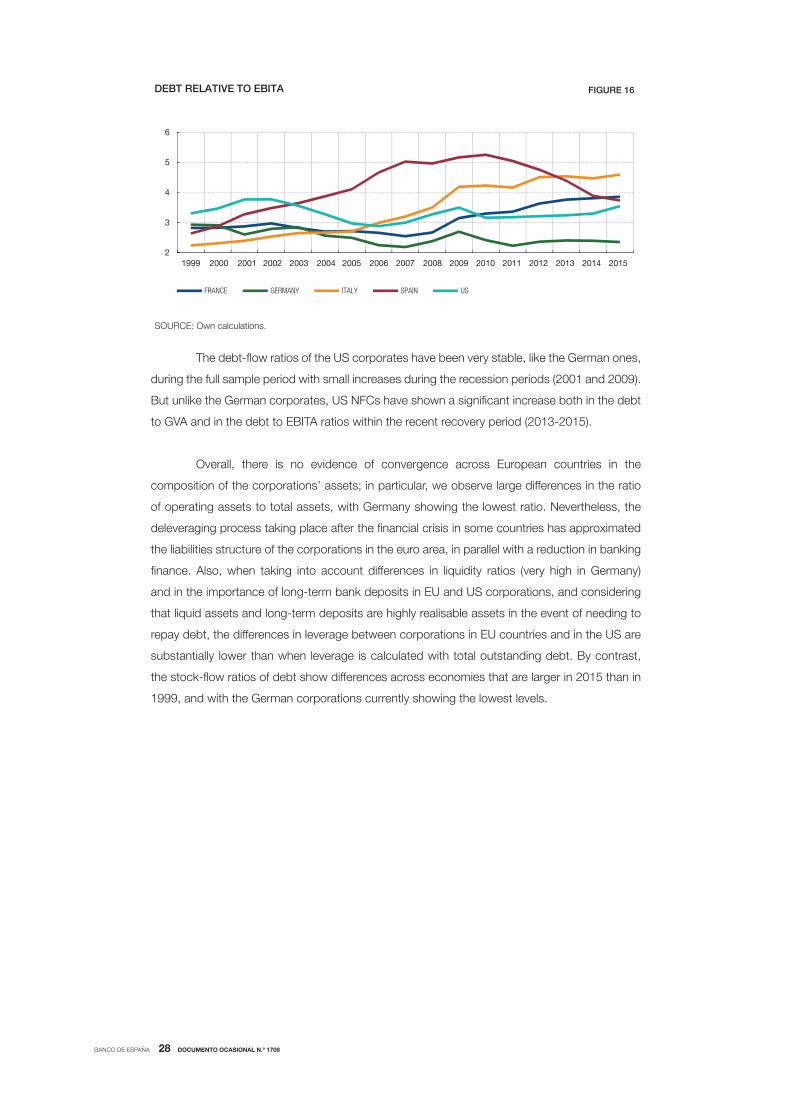
and the ratio of debt to profi t before interest and taxes plus amortisation (EBITA) is in Figure 16.
Contrary to the standard leverage ratio (Figure 11), those two new ratios do not show
convergence across countries on the deleveraging process after the fi nancial crisis. For example
in terms of the debt to EBITA ratio the Spanish corporates show a clear correction of their
leverage after 2010 whereas Italian and French corporates increase their leverage and present
debt ratios much higher than before the crisis. On the other side, German corporates have the
lowest ratio by 2015: on average they only need two years of generated cash fl ow excluding
taxes and interest payments to pay back their debts.
1.0
1.2
1.4
1.6
1.8
2.0
2.2
2.4
FRANCE GERMANY ITALY SPAIN US
DEBT RELATIVE TO GVA FIGURE 15
SOURCE: Own calculations.
1999 2000 2001 2002 2003 2004 2005 2006 2007 2008 2009 2010 2011 2012 2013 2014 2015
20
30
40
50
60
FRANCE GERMANY ITALY SPAIN US
%
MODIFIED LEVERAGE RATIO FIGURE 14
SOURCE: Own calculations.
1999 2000 2001 2002 2003 2004 2005 2006 2007 2008 2009 2010 2011 2012 2013 2014 2015
BANCO DE ESPAÑA 28 DOCUMENTO OCASIONAL N.º 1708
The debt-fl ow ratios of the US corporates have been very stable, like the German ones,
during the full sample period with small increases during the recession periods (2001 and 2009).
But unlike the German corporates, US NFCs have shown a signifi cant increase both in the debt
to GVA and in the debt to EBITA ratios within the recent recovery period (2013-2015).
Overall, there is no evidence of convergence across European countries in the
composition of the corporations’ assets; in particular, we observe large differences in the ratio
of operating assets to total assets, with Germany showing the lowest ratio. Nevertheless, the
deleveraging process taking place after the fi nancial crisis in some countries has approximated
the liabilities structure of the corporations in the euro area, in parallel with a reduction in banking
fi nance. Also, when taking into account differences in liquidity ratios (very high in Germany)
and in the importance of long-term bank deposits in EU and US corporations, and considering
that liquid assets and long-term deposits are highly realisable assets in the event of needing to
repay debt, the differences in leverage between corporations in EU countries and in the US are
substantially lower than when leverage is calculated with total outstanding debt. By contrast,
the stock-fl ow ratios of debt show differences across economies that are larger in 2015 than in
1999, and with the German corporations currently showing the lowest levels.
2
3
4
5
6
FRANCE GERMANY ITALY SPAIN US
DEBT RELATIVE TO EBITA FIGURE 16
SOURCE: Own calculations.
1999 2000 2001 2002 2003 2004 2005 2006 2007 2008 2009 2010 2011 2012 2013 2014 2015

BANCO DE ESPAÑA 29 DOCUMENTO OCASIONAL N.º 1708
4 Sources and Uses of Funds
We now focus on the annual fl ow of funds generated by NFCs through their saving and
investment decisions. The analysis will be based on the framework put forward in section 2.3
on the identity between sources and uses of funds. The sources of funds (internal) are equal to
net profi ts plus depreciation allowances (depreciation is part of production costs but no outfl ow
of cash is involved). The uses include payment of dividends and capital investment. If generated
cash fl ows exceed capital investment plus dividends then fi rms can either reduce their debt
levels or increase their fi nancial assets, including cash. If internally generated funds fall short
of dividends plus capital investment then fi rms will have to reduce fi nancial assets or look for
external funds (issuing new debt or equity). According to the National Sector Accounts, the
difference between corporate savings (net profi ts plus depreciation and minus dividends paid)
and gross investment gives the Excess (+) or the Need (-) of funds in the corporate sector.12
The annual fl ows of funds in the NFC sectors of the four European countries and of the
US during the period 19992015, in absolute values, appear in Table A3 of the Appendix. We
will concentrate fi rst on possible differences in the uses of gross cash fl ows paying dividends
or fi nancing gross investment. Figures 17 and 18 show the two ratios. French and Italian
corporations allocate a stable proportion of their gross cash fl ows to fi nance gross investment,
between 50% and 60%. In the German corporate sector where investment in capital formation
represented 60% of gross cash fl ow in 1999, by the end of the period it represents only 40%. The
Spanish corporate sector is clearly atypical in relation to that ratio: in 1999 Spanish corporations’
capital investment was equal to their aggregate cash fl ows; the proportion increases in the years
of economic expansion and in 2007 Spanish corporations investment was 40% higher than
cash fl ows, resorting mainly to the credit of resident and non-resident banks to cover this internal
defi cit. With the onset of the crisis the ratio adjusts downwards to return to more normal values
12 A limitation of the use of national and fi nancial accounts is that we do not have information about the investment
abroad by the NFCs.
0
20
40
60
80
100
120
140
160
FRANCE GERMANY ITALY SPAIN US
%
GROSS CAPITAL INVESTMENT RELATIVE TO GROSS CASH FLOW FIGURE 17
SOURCE: Own calculations.
1999 2000 2001 2002 2003 2004 2005 2006 2007 2008 2009 2010 2011 2012 2013 2014 2015

BANCO DE ESPAÑA 30 DOCUMENTO OCASIONAL N.º 1708
over the following two years and, since then, it has held stable at values of investment relative
to cash fl ows similar to those of French corporations.
The time pattern of gross investment relative to gross cash fl ow in US corporations is
similar to that of the ratio in German corporations, going from high to low, with this decreasing
trend concentrating in the initial years of the sample. However, gross investment as a proportion
of gross cash fl ow in US corporations has been 20 p.p. higher than the proportion in German
corporations throughout the period.
Another possible use of internally generated funds is to pay dividends to the shareholders.
Figure 18 compares the proportion of dividends to gross cash fl ows across countries and over
time. Countries’ corporate sectors cluster in two groups: France, Germany and Italy are in one
group where dividends represent between 40% and 60% of gross cash fl ows; and in Spain
and the US the ratio practically coincides and stays in the range of 20%30% throughout the
period. It seems that corporations allocate a relatively stable proportion of gross cash fl ow to
pay dividends over time and let external fi nance, debt and equity issues cover the shortfalls in
internal funds due to ups and downs in gross capital investment13.
Figure 19 shows the needs (-) and excess (+) of funds relative to gross cash fl ows, as
described in section 2.3. The German corporate sector was closely balanced, meaning that
its sources of funds were almost equal to its uses, from 2002 to 2008. The French and Italian
corporate sectors’ needs have been negative every year, with investment exceeding saving by
an amount that represents 20% of gross cash fl ows (in the case of Italy the needs have tended
towards zero in recent years). The more atypical behaviour over time again, while expected
(given the changes in investment relative to gross cash fl ows in Figure 17), corresponds to the
Spanish corporate sector. The need for funds (excess of investment over saving) was increasing
during the economic expansion and in 2007 represented up to 80% of gross cash fl ows; in the
13 NFCs in Spain and Italy have traditionally resorted to bank credit when searching for funding. NFCs in Germany and
France have a more balanced position between equity and debt in their funding. And the US NFCs rely on equity to a
greater extent than European companies (see CNMV, 2011).
0
10
20
30
40
50
60
70
FRANCE GERMANY ITALY SPAIN US
%
DIVIDENDS RELATIVE TO GROSS CASH FLOWS FIGURE 18
SOURCE: Own calculations.
1999 2000 2001 2002 2003 2004 2005 2006 2007 2008 2009 2010 2011 2012 2013 2014 2015

BANCO DE ESPAÑA 31 DOCUMENTO OCASIONAL N.º 1708
next two years the Spanish corporate sector moved rapidly to a position of excess, similarly
to the German sector, by an amount that represents around 10% of gross cashfl ows. The US
corporate sector has had an excess of funds since 2002, but in proportions lower than that of
the German corporations.
Therefore, since 2009 the German and Spanish corporate sectors, together with the US
sector, have joined the group of countries that contribute to the “savings glut”, a situation where
the corporate sector’s sources of funds are higher than its uses and therefore it contributes to
fi nancing the rest of the economy (Gruber and Kamin, 2015). We also highlight the fact that the
pattern of gross investment as a proportion of generated cash fl ow has been decreasing since
1999 for most countries, with Germany the country that proportionally uses fewest internally
generated resources for new capital investment.
-80
-60
-40
-20
0
20
FRANCE GERMANY ITALY SPAIN US
%
EXCESS (+) AND NEEDS (–) OF FUNDS BY NFCs RELATIVE TO GROSS CASH FLOWS FIGURE 19
SOURCE: Own calculations.
1999 2000 2001 2002 2003 2004 2005 2006 2007 2008 2009 2010 2011 2012 2013 2014 2015

BANCO DE ESPAÑA 32 DOCUMENTO OCASIONAL N.º 1708
5 Rates of Return, Cost of Debt and Income Taxes
In this section we combine fl ow (income statement) and stock (balance sheet) data, to calculate
the rates of return on invested assets and the cost of debt of the NFC sectors. The rates of
return include the return on operating assets, the return on fi nancial assets, the return on total
assets and the return on equity (see Box 3).
From the income statement, Earnings before Interest and Taxes are equal to Operating
Profi ts plus Financial Income and plus Other Property Income. Net Profi t is equal to Earnings
before Interest and Taxes minus Interest Expenses and minus Corporate Profi t Taxes. The values
of these ratios are calculated with data from Tables A1 and A2 of the Appendix.
5.1 Returns on assets
The returns on operating assets appear in Figure 20. The German corporate sector has by
far the highest rate of return on operating assets, with values that fl uctuate around 20%14.
In the rest of the countries, including the US, the corporate sectors earn rates of return on
operating assets in the range of 5%10%. The ROA Operational of German and US corporations
is more procyclical than in other countries: it moderately increases in the years of expansion
and moderately decreases in the years of the crisis, although in both cases the value in 2015 is
higher than the value in 2000. A similar pattern was observed for both countries when describing
operating profi ts (net profi ts) as a proportion of GVA (total income) in Figure 6 (Figure 7). The
rate of return on the operational assets of the corporate sectors in France and Italy decrease
over time and their values in 2015 are lower than they were in the year 2000. In Spain the rate
14 As mentioned before, with IMF data operating assets in Germany would be higher than those reported by Eurostat.
Thus in 2010-2015 the ROA of operating assets of German NFCs with the IMF data would be on average 11%, Still
German NFCs would show the highest rate of return on operating assets during that period.
BOX 3RATES OF RETURN ON ASSETS AND EQUITY
ROA Operational = Operating Profit
Operating Assets
ROE = Net profit
Equity
Return on financial assets = Financial Income + Other net property income
Financial Assets
ROA Total = Earnings Before Interest and Taxes
Total Assets

BANCO DE ESPAÑA 33 DOCUMENTO OCASIONAL N.º 1708
of return slightly decreases until 2007 and recovers in the years of the crisis to 8.2% in 2015,
still under the fi gure of 9% earned in the early years of the sample period. Finally, the ROA
Operational of corporations in the US shows an increasing trend, as in Germany, moving from
6.7% in 2001 to 7.7% in 2015.
The return on operational assets is equal to operating profi t margin (operating profi t
relative to GVA) times the productivity of operating assets (GVA relative to operating assets). The
operating profi t margins were shown in Figure 6, and in Figure 21 we compare the productivity
of the different countries’ operating assets.
The German corporate sector shows substantially higher productivity of operating assets
than in the other corporate sectors, as also occurs when comparing the operating profi t margins
(Figure 6). Only the productivity of Italian corporations’ operating assets shows a moderate
negative trend that combined with the decrease in the operating profi t margin (Figure 6) explains
the negative evolution of ROA Operational in Figure 20. In the rest of the corporate sectors the
evolution of ROA is mainly explained by the behaviour of the operating profi t margin. By way of
0
5
10
15
20
25
FRANCE GERMANY ITALY SPAIN US
%
RETURN ON OPERATING ASSETS (ROA) FIGURE 20
SOURCE: Own calculations.
1999 2000 2001 2002 2003 2004 2005 2006 2007 2008 2009 2010 2011 2012 2013 2014 2015
0
20
40
60
80
100
FRANCE GERMANY ITALY SPAIN US
%
PRODUCTIVITY OF OPERATING ASSETS (GVA PER EURO OF OPERATING ASSET) FIGURE 21
SOURCE: Own calculations.
1999 2000 2001 2002 2003 2004 2005 2006 2007 2008 2009 2010 2011 2012 2013 2014 2015

BANCO DE ESPAÑA 34 DOCUMENTO OCASIONAL N.º 1708
summary, in 2015 the German corporate sector earns 2 pp more of operating margin than the
US corporate sector but German companies generate more than double the GVA per euro of
operating assets than their US counterparts15.
The explanation of why the productivity of operating assets in German corporations
is much higher would require close examination. We notice that the average depreciation
allowances of German corporations represent around 16% of operating assets while in the
US, Italy and Spain they represent less than half, between 6% and 7% (9% in the case of
France). This means that, on average, the operating assets of German corporations remain on
the balance sheet for 6 years while in the US and the other European countries this period is
15 years.
In addition to operating assets, corporations also hold fi nancial assets which likewise
generate income in return. Figure 22 shows the (nominal) return on fi nancial assets for the fi ve
countries considered. In this respect, the Italian and French corporate sectors present the higher
returns in comparison with the other economies (with the exception of 20112015 for Italy) but
with a clear negative trend in the second part of the sample period. Spanish corporates have
stable fi nancial returns, of around 4%. By contrast German corporates present an increasing
trend in fi nancial returns from 1999 to 2010 with a return of 5% in 2015. The US companies
show in 2015 a low return on fi nancial assets (around 3%) and also with a clear declining trend
since 2000.
Combining the results of Figures 20 and 22, we obtain the rate of return on total assets
as the ratio of profi ts before interest and taxes to total assets (Figure 23). The rates of return on
total assets are in general lower than the rates of return on operating assets, and higher than
the returns on fi nancial assets, as expected. The exception is the Italian corporate sector where
15 ROA results depend very much on the defi nition of operating assets (i.e. capital). If capital stocks were generated, for
example, by the perpetual inventory method instead of the (market) value of the operating assets from the Financial
Accounts, these cross-country differences could change.
0
2
4
6
8
10
12
14
16
FRANCE GERMANY ITALY SPAIN US
%
RETURN ON FINANCIAL ASSETS FIGURE 22
SOURCE: Own calculations.
1999 2000 2001 2002 2003 2004 2005 2006 2007 2008 2009 2010 2011 2012 2013 2014 2015

BANCO DE ESPAÑA 35 DOCUMENTO OCASIONAL N.º 1708
rates of returns are similar for operational and for fi nancial assets. The Italian and the French
corporate sectors have, since 2008, experienced a negative trend in the return on total assets.
In 2015 the corporate sectors of Spain, Italy and the US earn a rate of return on total assets of
5% (before taxes), France a return of 4% and Germany a return of 11%.
Corporations fi nance their assets with debt and equity. Banks and others creditors
charge an explicit interest rate specifi ed at the time of the transaction, while equity holders
receive a part of the residual profi t (net profi t or profi t after interest and taxes) in the form of
distributed dividends (apart from changes in the valuation of their stakes in the company that
arise when they sell their shares). In addition to differences in the return on total assets, the
return on equity (ROE), defi ned as net profi t relative to equity, can differ across corporate sectors
owing to differences in the cost of debt, leverage and tax rates.
Figure 24 shows the return on equity of the respective corporate sectors. Once again,
the German corporate sector is the most profi table, with a signifi cant difference with the others;
during most of the sample period the German corporate sector earns a return on equity close to
20%, twice the return earned in the other countries16. In Italy and Spain the ROE of corporations
decreases sharply in the years 2004-2007. In the Italian case the corporate ROE continues to
decline moderately but intermittently in the following years, reaching 6.6% in 2015, while in Spain
the ROE increases above pre-crisis values as early as 2009. Since then it has held quite stable
at 10% (3 pp higher than the ROE of France and Italy and 7 pp lower than the ROE of German
corporations). The ROE of the US corporate sector is fairly stable, around 5% throughout the
sample period, but lower when compared with the European countries.
Overall these rates of return on assets and on equity show similar patterns. There
is no evidence of convergence across euro area countries, with German corporate returns
16 The higher operating assets reported in the IMF data implies a parallel upgrade in net worth (equity). This higher value
of equity would imply, ceteris paribus, a ROE of 11% in the average period 2010-2015, compared with an average
ROE of 18% according to Eurostat statistics. However, NFCs in Germany would continue having the highest rates of
return on equity across the countries considered during that period.
0
2
4
6
8
10
12
14
16
FRANCE GERMANY ITALY SPAIN US
%
RETURN ON TOTAL ASSETS FIGURE 23
SOURCE: Own calculations.
1999 2000 2001 2002 2003 2004 2005 2006 2007 2008 2009 2010 2011 2012 2013 2014 2015

BANCO DE ESPAÑA 36 DOCUMENTO OCASIONAL N.º 1708
signifi cantly higher than in the other four countries, and no systematic change may be discerned
after the 2007/2008 crisis, except for the substantial decline in the equity return for Italian NFCs.
5.2 Cost of debt and income taxes
The same return on assets will turn into different returns on equity if corporations differ in terms of
leverage ratios, the cost of debt, and the taxes they pay on corporate profi ts. We now compare
the costs of debt and the effective tax rates of corporate sectors in the different countries.
Differences in leverage ratios were already examined in Figure 11.
In the period 19992007, years in which the cost of debt remains relatively stable in all
countries, the average cost of debt is around 3% for the German corporations and between 5%
and 6% for the Italian ones (see Figure 25). For French and Spanish corporations the average
cost of debt is somewhere in between the costs for the German and Italian corporations. In 2007,
just before the crisis, French, Italian and Spanish corporations converge towards an average
cost of debt of 5%. As a reaction to the crisis, the ECB implemented an ultra-accommodative
monetary policy that still persists, resulting in decreases in the cost of debt in all countries. As
a consequence, the corporate sectors of the euro zone pay interest on debt accounting for
between 1% and 2% of all outstanding debt in 2015.
Corporations in the US pay higher average interest on debt than corporations in the euro
area countries, although the time evolution of average costs of debt in the former is closely in parallel
to those of the latter. During the sample period, the average cost of debt of German corporations is
between 3 pp and 4 pp lower than the average cost of debt of corporations in the US.
The conclusions from the comparison of the cost of debt among corporate sectors
change when the cost of debt is expressed in real terms: the nominal rates of Figure 25 minus
current infl ation (annual change in the CPI of the respective economy), as shown in Figure 26.
The absolute differences in average cost of debt adjusted for differences in infl ation across
corporate sectors in the euro zone stay around 1 p.p. throughout the sample period. In the
pre-crisis years (19992006) the Spanish corporate sector had the lowest infl ation-adjusted cost
0
5
10
15
20
25
FRANCE GERMANY ITALY SPAIN US
%
RETURN ON EQUITY (ROE) FIGURE 24
SOURCE: Own calculations.
1999 2000 2001 2002 2003 2004 2005 2006 2007 2008 2009 2010 2011 2012 2013 2014 2015

BANCO DE ESPAÑA 37 DOCUMENTO OCASIONAL N.º 1708
of debt, close to zero in the years 20022006. That may explain in part the sudden rise in the
Spanish corporate leverage ratio in that period (Figure 11). During the crisis years real interest
rates converge in a similar fashion to nominal interest rates.
Infl ation rate differentials are not enough to explain the differences in the nominal
cost of debt between the German and the US corporate sectors. The real cost of debt of US
corporations continues to be 2 pp to 3 pp higher than the real cost for the German corporations.
Also, differences in the taxation of corporate profi ts across countries can also explain
differences in the ROE across corporate sectors that do not show up when comparing returns
on total assets. Figure 27 shows the ratio of corporate and property taxes, reported in Table A1,
over profi t before taxes (net profi t plus corporate and property taxes). If property taxes are not
especially high the ratio will approximate the average effective tax rate on corporate profi ts of the
respective country. The calculated tax rate shows values in the reasonable range of 10% and
25%. The exception is the Spanish corporate sector in the period 19992007, when corporate
and property taxes show an increasing trend and reach a maximum above 50% of profi ts before
0
1
2
3
4
5
6
7
8
FRANCE GERMANY ITALY SPAIN US
%
AVERAGE COST OF DEBT (% INTEREST PAYMENTS/DEBT) FIGURE 25
SOURCE: Own calculations.
1999 2000 2001 2002 2003 2004 2005 2006 2007 2008 2009 2010 2011 2012 2013 2014 2015
-1
0
1
2
3
4
5
6
7
FRANCE GERMANY ITALY SPAIN US
%
COST OF DEBT IN REAL TERMS (CPI DEFLATOR) FIGURE 26
SOURCE: Own calculations.
1999 2000 2001 2002 2003 2004 2005 2006 2007 2008 2009 2010 2011 2012 2013 2014 2015

BANCO DE ESPAÑA 38 DOCUMENTO OCASIONAL N.º 1708
taxes in year 2007.The nominal corporate tax rate of Spanish corporations in the period 1999-
2007 was 35% so the increase in the calculated tax rate especially in the period 2004-2007 will
have to be attributed to the increase in property taxes in a period of accelerating increases in
property prices. Since 2009 the effective tax rate of Spanish corporations has been in line with
the rates of corporate sectors in the countries under comparison.
Although the differences have been modest, German corporations paid the lowest tax
rate practically throughout the period, a situation that continued in 2015. The lower average cost
of debt, and the lower tax rate on the corporate profi ts of German corporations contribute to
widen the relative differences in the ROE of German corporations with respect to the ROE in the
other countries, relative to the differences that are visible in Germany’s favour in terms of ROA.
This conclusion applies also to corporations in the US, with an estimated average tax rate over
corporate profi ts that in 2015 is still 6 p.p. higher than that of the German corporations.
0
10
20
30
40
50
60
FRANCE GERMANY ITALY SPAIN US
%
TAXES ON PROFITS AND PROPERTY OVER PROFITS BEFORE TAXES FIGURE 27
SOURCE: Own calculations.
1999 2000 2001 2002 2003 2004 2005 2006 2007 2008 2009 2010 2011 2012 2013 2014 2015

BANCO DE ESPAÑA 39 DOCUMENTO OCASIONAL N.º 1708
6 Conclusions
In this paper we were interested in three issues: i) how the creation of the euro affected the
performance of the corporate sectors of the largest euro-economies, and particularly whether
the single currency contributed to some convergence among them; ii) how the corporate
sectors of these economies were affected by the fi nancial and economic crisis and if all showed
the same resilience in returning to pre-crisis conditions; and iii) how the corporate sectors in the
euro zone compare with the corporate sector in the US in terms of performance and resilience.
As an initial approach to these issues we have analysed a set of aggregated fi nancial and real
indicators from the Non-Financial Corporate sector derived from national accounts. We are
planning to complement that analysis with more disaggregated data to take into account cross-
country fi rm and sector heterogeneity.
In relation to the fi rst issue we found signifi cant structural differences between the
European economies that remained in place well after the creation of the euro area:
— German NFCs “make” more than they “buy” in the sense that GVA represents a
higher proportion of the value of production of the corporate sector in Germany.
— The German and the Spanish corporate labour share (i.e. labour compensation
relative to GVA) shows something of a declining trend during the sample period, but
that is not the case for France and Italy.
— There are large differences in the composition of corporations’ assets. German
NFCs have much higher productivity of operating assets than corporations in the
other euro-economies compared. This result coincides with higher depreciation
rates of the operating assets (i.e. higher rotation of assets in the balance sheet) in
the German corporate sector.
— Higher operating margins, but especially higher productivity of operating assets,
explain why the return on German NFCs’ operating assets is more than twice the
rate of return on the operating assets of corporates from the other euro countries
compared.
— The dividend pay-out ratio (dividends relative to net profi t plus depreciation) of
Spanish corporations is lower than the pay-out by corporations in the other euro
countries considered. The relatively high proportion of retained earnings was not
an impediment for the Spanish corporate sector to be that where leverage rose
to higher values. The reason is also the comparatively high proportion of gross
investment in capital formation relative to gross generated cash fl ows among
Spanish corporations, especially during the pre-crisis years.

BANCO DE ESPAÑA 40 DOCUMENTO OCASIONAL N.º 1708
— German corporations pay a lower average cost than corporations elsewhere for
their debt with explicit cost, and also pay a lower average corporate and property
tax rate. Both factors contribute to maintaining the substantial differences in return
to equity in favour of German corporations.
As for the issue of how the corporate sectors compare in their behaviour and
performance in the pre-crisis years and in the years of the crisis, some of the relevant results
are the following:
— The corporate sectors of Spain and Italy are those with the biggest differences in
behaviour and performance between the pre-crisis and the crisis period. The Spanish
corporate sector shows the highest volatility in growth rates of GVA, with the highest
average rate of growth and the lowest average, respectively. The Italian corporate
sector experiences the highest decrease in profi tability among the corporate sectors
analysed.
— The high growth rate of GVA in the Spanish corporate sector until 2007 coincides
in time with a loss of weight of GVA in the value of production, much higher than
the loss in the corporate sectors of the other countries, and with higher rates of
net investment in operating capital. In the crisis years the Spanish corporate sector
converges towards the values of the other corporate sectors compared in terms of
weight of gross value added in total value of production, and in investment rates.
— There is some evidence of a declining proportion of cash fl ows to fi nance gross
capital investment, especially in the case of the German and Spanish corporations.
— Until 2009 the corporate sector in the four countries used funds in amounts larger
than those that were generated internally, particularly in the case of Spain, whose
high defi cit was covered by incurring new debt. Since 2009, the corporate sectors of
Germany and Spain have fi nanced the other sectors of the economy since savings
exceed investment by approximately 10% of gross cash fl ows. In the corporate
sectors of France and Italy, investments are permanently higher than savings and
the corporate sector draws funds from other sectors of the economy.
— During the crisis years there is some convergence in the leverage ratios of the four
countries’ corporations towards values around 40% of debt relative to total assets
and a reduction in the proportion of debt with banks. This convergence process
disappears with alternative leverage measures that consider liquid assets, the ratio
of debt relative to GVA or the ratio of debt to EBiTA. Currently, German corporates
are those with the lowest leverage ratios.
— No systematic changes may be discerned in the differences in the rates of return on
assets and on equities after the fi nancial crisis.

BANCO DE ESPAÑA 41 DOCUMENTO OCASIONAL N.º 1708
— In the precrisis years the Spanish corporate sector experienced a unique increase in
the corporate and property tax rates , which rose to over 50% in 2007 according to
our calculations. In the next two years the tax rate converged towards fi gures in line
with those paid by corporations in the other countries analysed, and has continued
at these levels since.
— By the end of the period, 2015, there is convergence in the average cost of debt
paid by corporations in the different countries, meaning the signs of fi nancial
fragmentation seem to have disappeared.
Finally, as for the issue of how the corporate sectors of euro area members compare with
the corporate sector in the US, the general conclusion is that the performance of corporations
in the US differs from that of German corporations, and resembles more the performance of
corporations of the rest of the European countries, in particular in terms of the returns on assets
and on equity. In general, the performance of US corporations shows lower output volatility and
a higher proportion of value added than their European counterparts. Of particular note is the
comparative high average cost of debt, as well as the low leverage ratio of US corporations in
the sample period. Since 2002, the corporate sector in the US has almost every year saved
more than it has invested, generating an excess of funds that fi nance other sectors of the
economy. During the crisis years, the corporate sectors of Germany and Spain joined the US
corporate sector in saving more than they invested, and by 2015 German corporations present
the highest excess of savings over investment.
Why these differences in behaviour and performance? What are their implications,
if any, for real convergence within the European and Monetary Union? These are relevant
questions that the descriptive analysis presented here motivates but whose answer requires a
more thorough and detailed analysis by future research.

BANCO DE ESPAÑA 42 DOCUMENTO OCASIONAL N.º 1708
References
BARKAI, S. (2016). “Declining Labor and Capital Shares”, mimeo, University of Chicago.
BANCO DE ESPAÑA (2017). Annual Report, 2016.
CETTE, G. and J.P. VILLETELLE (2015). “The Financial Position and Funding of French Non-Financial Corporations”,
Quarterly Selection of Articles, Spring 2015. Banque de France.
COMISIÓN NACIONAL DEL MERCADO DE VALORES (2011). Annual Report, 2010.
DOTTLING, R., G. GUTIÉRREZ and T. PHILIPPON (2017). “Is there an Investment Gap in Advanced Economies? If So,
Why?”, Mimeo.
EUROPEAN CENTRAL BANK (2016). “Business Investment Developments in the Euro Area since the Crisis”, Economic
Bulletin.
GRUBER, J. and S. KAMIN (2016). “The Corporate Saving Glut and Falloff of Investment Spending in OECD Economies”,
IMF Economic Review, vol. 64, 777-799.
KARABARBOUNIS, L. and B. NEIMAN (2014). “The Global Decline of the Labor Share”, Quarterly Journal of Economics,
129 (1), 61-103.

DATA APPENDIX
BANCO DE ESPAÑA 43 DOCUMENTO OCASIONAL N.º 1708
Millions of euros for EA countries and billions of dollars for US
51024102310221021102010290028002700260025002400230022002100200029991ECNARF
Value of production 1,621,723 1,791,226 1,886,968 1,916,875 1,948,317 2,044,748 2,147,733 2,278,117 2,412,748 2,493,283 2,299,357 2,424,264 2,556,891 2,594,421 2,596,427 2,599,445 2,630,655
Intermediate consumption 917,954 1,043,907 1,104,475 1,109,085 1,115,781 1,176,374 1,245,618 1,335,617 1,415,570 1,467,591 1,313,507 1,412,215 1,508,802 1,533,215 1,521,136 1,515,816 1,520,853
Gross value added 703,769 747,319 782,493 807,790 832,536 868,374 902,115 942,499 997,177 1,025,692 985,850 1,012,049 1,048,089 1,061,206 1,075,292 1,083,629 1,109,802
Production taxes less subsidies 27,703 29,854 28,597 29,721 29,269 32,295 35,329 31,862 34,684 35,273 37,897 30,760 36,625 39,454 42,404 34,823 29,733
Compensation of employees 445,675 473,243 497,443 518,148 533,113 553,805 574,677 602,886 628,819 650,803 642,870 661,644 684,434 700,754 710,945 719,833 731,085
t 230,391 244,222 256,453 259,921 270,154 282,274 292,109 307,751 333,674 339,616 305,083 319,645 327,030 320,998 321,943 328,973 348,984
Amortization and other net expenses 129,730 141,358 151,116 157,881 162,064 170,864 179,248 191,560 203,534 215,760 214,715 218,396 230,556 236,313 239,521 243,035 247,420
39,58224,28586,48474,69942,101863,09658,321041,031191,611168,211014,111090,801040,201733,501468,201166,001 tiforp gnitarepO 8 101,564
091980,781676,691935,112430,691563,512200,842044,232520,202342,371515,451017,931614,831262,231305,111702,88emocni laicnaniF ,445 194,513
Other net property income 12,668 7,751 7,735 43 7,051 7,175 5,152 16,007 25,639 15,044 11,295 9,826 7,700 5,542 1,953 4,593 4,045
Earnings before interest and taxes 201,536 222,118 245,334 240,499 254,851 273,100 291,256 334,223 388,219 386,902 317,028 307,109 315,713 286,903 271,464 280,976 300,122
765,05646,46010,56214,77595,97789,76418,68496,411504,99443,18148,86215,76951,17218,37204,38319,76368,94tbed no tseretnI
Corporate and property taxes 28,059 29,659 34,568 29,464 26,262 28,600 33,415 42,685 44,991 48,020 24,484 32,220 36,952 37,645 41,035 39,418 38,940
2219,671914,561648,171661,991209,602037,502881,422328,342491,012000,981889,671034,751322,731463,721645,421416,321tiforp teN 10,615
GERMANY
Value of production 2,390,005 2,560,750 2,666,462 2,634,226 2,677,733 2,786,371 2,901,449 3,102,375 3,328,773 3,450,671 3,105,054 3,364,869 3,651,074 3,657,606 3,681,511 3,797,246 3,868,122
Intermediate consumption 1,282,573 1,403,173 1,457,725 1,411,164 1,451,810 1,523,221 1,617,907 1,751,974 1,894,498 1,995,782 1,738,461 1,909,244 2,116,266 2,098,006 2,084,715 2,130,392 2,131,118
Gross value added 1,107,432 1,157,577 1,208,737 1,223,062 1,225,923 1,263,150 1,283,542 1,350,401 1,434,275 1,454,889 1,366,593 1,455,625 1,534,808 1,559,600 1,596,796 1,666,854 1,737,004
Production taxes less subsidies -19,274 -18,884 -17,129 -15,745 -13,964 -12,512 -14,555 -16,107 -13,645 -14,052 -16,023 -15,882 -13,986 -11,530 -12,515 -12,647 -12,114
Compensation of employees 686,501 718,250 728,290 729,413 730,448 734,343 735,088 752,811 779,117 811,815 803,612 836,062 881,176 922,245 947,239 985,708 1,025,651
t 440,205 458,211 497,576 509,394 509,439 541,319 563,009 613,697 668,803 657,126 579,004 635,445 667,618 648,885 662,072 693,793 723,467
Amortization and other net expenses 198,806 207,606 217,722 227,071 228,254 233,748 240,095 242,856 255,186 263,435 269,584 274,509 282,942 290,677 297,350 304,291 313,847
3227,463802,853676,483639,063024,903196,393716,314148,073419,223175,703581,182323,282458,972506,052993,142 tiforp gnitarepO 89,502 409,620
4,201056,99706,001675,601955,501550,501050,09946,011931,49608,79301,38406,47567,26289,77941,501768,65740,43emocni laicnaniF 89
Other net property income 10,829 5,773 7,009 -548 7,167 27,221 14,157 27,033 39,161 11,927 31,266 18,961 35,086 24,916 31,072 24,214 23,544
Earnings before interest and taxes 286,275 313,245 392,012 359,757 351,117 409,396 420,174 495,680 546,917 516,267 430,736 484,952 525,321 489,700 496,401 513,366 535,653
388,92345,13482,13749,82307,34959,54202,44216,35050,35834,84685,44061,54826,44075,15483,15631,15977,44tbed no tseretnI
Corporate and property taxes 39,829 48,053 27,620 27,037 28,634 37,800 40,152 58,574 59,508 59,284 37,994 44,508 58,833 59,992 58,874 61,264 64,527
4955,024342,604167,004587,224584,493045,843173,304953,434866,883634,533634,623558,772051,182800,313650,412766,102tiforp teN 41,243
INCOME STATEMENT OF NFCs TABLE A1
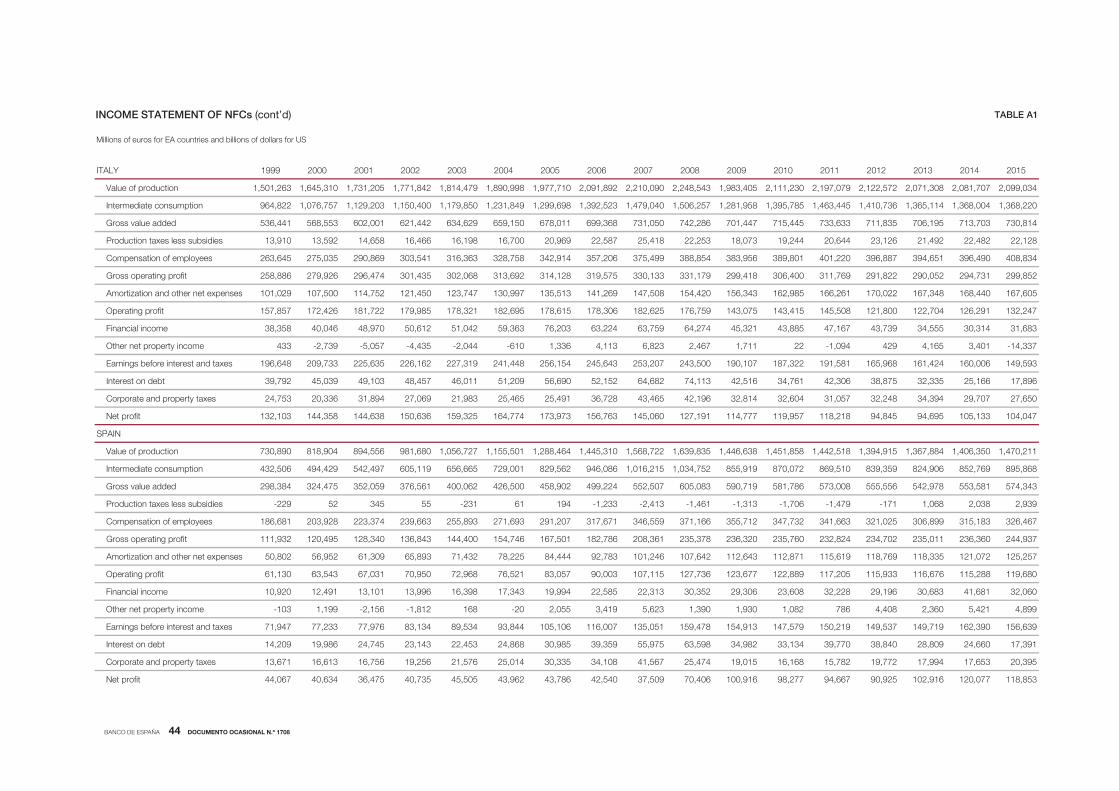
BANCO DE ESPAÑA 44 DOCUMENTO OCASIONAL N.º 1708
Millions of euros for EA countries and billions of dollars for US
51024102310221021102010290028002700260025002400230022002100200029991YLATI
Value of production 1,501,263 1,645,310 1,731,205 1,771,842 1,814,479 1,890,998 1,977,710 2,091,892 2,210,090 2,248,543 1,983,405 2,111,230 2,197,079 2,122,572 2,071,308 2,081,707 2,099,034
Intermediate consumption 964,822 1,076,757 1,129,203 1,150,400 1,179,850 1,231,849 1,299,698 1,392,523 1,479,040 1,506,257 1,281,958 1,395,785 1,463,445 1,410,736 1,365,114 1,368,004 1,368,220
Gross value added 536,441 568,553 602,001 621,442 634,629 659,150 678,011 699,368 731,050 742,286 701,447 715,445 733,633 711,835 706,195 713,703 730,814
Production taxes less subsidies 13,910 13,592 14,658 16,466 16,198 16,700 20,969 22,587 25,418 22,253 18,073 19,244 20,644 23,126 21,492 22,482 22,128
Compensation of employees 263,645 275,035 290,869 303,541 316,363 328,758 342,914 357,206 375,499 388,854 383,956 389,801 401,220 396,887 394,651 396,490 408,834
t 258,886 279,926 296,474 301,435 302,068 313,692 314,128 319,575 330,133 331,179 299,418 306,400 311,769 291,822 290,052 294,731 299,852
Amortization and other net expenses 101,029 107,500 114,752 121,450 123,747 130,997 135,513 141,269 147,508 154,420 156,343 162,985 166,261 170,022 167,348 168,440 167,605
1407,221008,121805,541514,341570,341957,671526,281603,871516,871596,281123,871589,971227,181624,271758,751 tiforp gnitarepO 26,291 132,247
386,13413,03555,43937,34761,74588,34123,54472,46957,36422,36302,67363,95240,15216,05079,84640,04853,83emocni laicnaniF
Other net property income 433 -2,739 -5,057 -4,435 -2,044 -610 1,336 4,113 6,823 2,467 1,711 22 -1,094 429 4,165 3,401 -14,337
Earnings before interest and taxes 196,648 209,733 225,635 226,162 227,319 241,448 256,154 245,643 253,207 243,500 190,107 187,322 191,581 165,968 161,424 160,006 149,593
698,71661,52533,23578,83603,24167,43615,24311,47286,46251,25096,65902,15110,64754,84301,94930,54297,93tbed no tseretnI
Corporate and property taxes 24,753 20,336 31,894 27,069 21,983 25,465 25,491 36,728 43,465 42,196 32,814 32,604 31,057 32,248 34,394 29,707 27,650
401331,501596,49548,49812,811759,911777,411191,721060,541367,651379,371477,461523,951636,051836,441853,441301,231tiforp teN ,047
SPAIN
Value of production 730,890 818,904 894,556 981,680 1,056,727 1,155,501 1,288,464 1,445,310 1,568,722 1,639,835 1,446,638 1,451,858 1,442,518 1,394,915 1,367,884 1,406,350 1,470,211
Intermediate consumption 432,506 494,429 542,497 605,119 656,665 729,001 829,562 946,086 1,016,215 1,034,752 855,919 870,072 869,510 839,359 824,906 852,769 895,868
Gross value added 298,384 324,475 352,059 376,561 400,062 426,500 458,902 499,224 552,507 605,083 590,719 581,786 573,008 555,556 542,978 553,581 574,343
Production taxes less subsidies -229 52 345 55 -231 61 194 -1,233 -2,413 -1,461 -1,313 -1,706 -1,479 -171 1,068 2,038 2,939
Compensation of employees 186,681 203,928 223,374 239,663 255,893 271,693 291,207 317,671 346,559 371,166 355,712 347,732 341,663 321,025 306,899 315,183 326,467
t 111,932 120,495 128,340 136,843 144,400 154,746 167,501 182,786 208,361 235,378 236,320 235,760 232,824 234,702 235,011 236,360 244,937
Amortization and other net expenses 50,802 56,952 61,309 65,893 71,432 78,225 84,444 92,783 101,246 107,642 112,643 112,871 115,619 118,769 118,335 121,072 125,257
11882,511676,611339,511502,711988,221776,321637,721511,701300,09750,38125,67869,27059,07130,76345,36031,16 tiforp gnitarepO 9,680
060,23186,14386,03691,92822,23806,32603,92253,03313,22585,22499,91343,71893,61699,31101,31194,21029,01emocni laicnaniF
Other net property income -103 1,199 -2,156 -1,812 168 -20 2,055 3,419 5,623 1,390 1,930 1,082 786 4,408 2,360 5,421 4,899
Earnings before interest and taxes 71,947 77,233 77,976 83,134 89,534 93,844 105,106 116,007 135,051 159,478 154,913 147,579 150,219 149,537 149,719 162,390 156,639
193,71066,42908,82048,83077,93431,33289,43895,36579,55953,93589,03868,42354,22341,32547,42689,91902,41tbed no tseretnI
Corporate and property taxes 13,671 16,613 16,756 19,256 21,576 25,014 30,335 34,108 41,567 25,474 19,015 16,168 15,782 19,772 17,994 17,653 20,395
358,811770,021619,201529,09766,49772,89619,001604,07905,73045,24687,34269,34505,54537,04574,63436,04760,44tiforp teN
INCOME STATEMENT OF NFCs (cont’d) TABLE A1

BANCO DE ESPAÑA 45 DOCUMENTO OCASIONAL N.º 1708
Millions of euros for EA countries and billions of dollars for US
51024102310221021102010290028002700260025002400230022002100200029991SETATS DETINU
Value of production 10,061 10,821 10,623 10,502 10,796 11,548 12,596 13,438 13,962 14,229 12,475 13,571 14,661 15,553 15,999 16,823 16,875
Intermediate consumption 4,891 5,308 5,152 4,963 5,071 5,441 6,064 6,450 6,758 6,972 5,615 6,332 7,069 7,541 7,693 8,119 7,866
900,9407,8503,8210,8295,7932,7068,6752,7402,7889,6235,6801,6527,5935,5174,5315,5071,5dedda eulav ssorG
Production taxes less subsidies 425 450 445 473 496 531 573 610 633 633 606 633 671 690 722 738 754
Compensation of employees 3,310 3,597 3,585 3,542 3,596 3,763 3,930 4,129 4,305 4,358 4,088 4,159 4,363 4,593 4,750 5,000 5,260
t 1,435 1,466 1,442 1,524 1,633 1,814 2,029 2,249 2,266 2,266 2,166 2,447 2,558 2,728 2,834 2,966 2,995
Amortization and other net expenses 683 742 785 805 818 850 910 979 1,040 1,094 1,092 1,095 1,139 1,186 1,228 1,283 1,330
566,1386,1606,1245,1914,1353,1470,1271,1622,1962,1911,1469518917656427257 tiforp gnitarepO
462452252962172213453114274734795813292692423943203emocni laicnaniF
Other net property income 62 91 98 84 101 105 -36 130 154 158 174 197 193 169 206 206 197
Earnings before interest and taxes 1,116 1,163 1,079 1,100 1,209 1,387 1,680 1,837 1,852 1,741 1,601 1,862 1,884 1,980 2,063 2,143 2,126
354224014834444544084585606125154593293234574274393tbed no tseretnI
Corporate and property taxes 171 170 111 97 133 187 272 308 294 227 178 221 229 267 284 314 308
563,1804,1963,1572,1012,1791,1349929259800,1759508486175394125155tiforp teN
INCOME STATEMENT OF NFCs (cont’d) TABLE A1
SOURCE: Own calculations.NOTE: Other net expenses are obtained from other net current transfers. Data for US NFCs are not available for this item. Financial income corresponds to interest and dividends received. Other net property income includes income frominvestment funds and insurance policies, net withdrawals from income of quasi-corporations and net rents.

BANCO DE ESPAÑA 46 DOCUMENTO OCASIONAL N.º 1708
Millions of euros for EA countries and billions of dollars for US
51024102310221021102010290028002700260025002400230022002100200029991ECNARF
Operating assets 1,428,053 1,666,308 1,538,318 1,451,627 1,488,159 1,610,487 1,742,763 1,958,658 2,297,576 2,225,120 2,013,709 2,119,435 2,218,442 2,252,386 2,340,141 2,428,825 2,482,746
34,318,1332,446,1381,117,1970,119,1029,218,1234,435,1950,223,1061,181,1308,832,1082,124,1775,043,1171,590,1stessa laicnaniF 7 1,786,341 1,786,884 1,933,615 2,085,340 2,253,754
4,044310,924212,524350,634295,354963,324251,293339,504836,593512,253578,223815,892299,672345,852133,632012,912stessa diuqiL 57 474,958
Deposits, long-term 31,120 30,286 35,168 37,856 42,652 50,054 56,183 58,874 63,490 77,725 88,418 102,698 125,569 144,854 166,195 178,507 179,056
0,4278,239,3149,756,3303,639,3556,802,4875,177,3591,772,3645,239,2813,966,2924,096,2795,959,2488,600,3422,325,2stessa latoT 04,782 4,039,270 4,273,755 4,514,164 4,736,500
,708,1905,057,1298,466,1593,806,1780,345,1907,744,1322,443,1656,822,1831,151,1596,331,1319,731,1633,290,1001,789663,898tbeD 878 1,828,230 1,898,508 2,010,558
56,942,1810,352,1712,612,1733,171,1738,571,1895,731,1376,920,1881,539448,168586,408689,197957,887674,357894,396275,336snaoL 9 1,257,113 1,289,615
372,452,2089,762,2745,940,2612,393,2649,067,2553,724,2935,840,2804,187,1326,535,1615,255,1162,768,1487,910,2858,426,1ytiuqE 2,231,392 2,445,525 2,615,657 2,725,942
8,239,3149,756,3303,639,3556,802,4875,177,3591,772,3645,239,2813,966,2924,096,2795,959,2488,600,3422,325,2seitilibail latoT 72 4,004,782 4,039,270 4,273,755 4,514,164 4,736,500
GERMANY
Operating assets 1,403,300 1,424,944 1,321,122 1,289,949 1,356,419 1,436,261 1,464,576 1,604,591 1,834,003 1,766,761 1,618,077 1,748,369 1,827,275 1,866,812 2,025,621 2,153,915 2,164,420
24,959,1112,169,1557,700,2348,599,1233,098,1983,608,1642,227,1808,856,1958,868,1911,880,2098,689,1453,947,1stessa laicnaniF 2 1,880,144 1,929,183 2,127,069 2,258,128 2,405,040
8,818854,387186,037222,086788,636195,175220,635875,455692,435858,984249,974195,084385,684141,664643,104674,953stessa diuqiL 02 887,613
Deposits, long-term 104,654 106,356 119,111 130,571 137,966 142,791 155,138 171,163 177,973 184,705 219,251 245,157 254,893 293,419 325,146 335,786 358,544
7,3097,707,3882,975,3615,477,3648,928,3329,494,3569,072,3605,851,3622,510,3708,851,3142,904,3438,114,3456,251,3stessa latoT 07,419 3,795,995 4,152,690 4,412,043 4,569,460
,1400,867,1662,308,1789,858,1016,928,1025,627,1931,836,1799,016,1794,026,1145,326,1697,906,1190,965,1339,994,1563,793,1tbeD 801,055 1,867,881 1,922,900 1,960,753
1,1299,601,1382,411,1133,541,1898,341,1561,790,1284,640,1700,430,1421,750,1701,280,1753,390,1779,370,1948,110,1654,759snaoL 19,637 1,160,612 1,188,431 1,199,726
514,939,1425,409,1103,027,1709,449,1723,301,2487,658,1869,956,1900,835,1686,193,1110,945,1151,048,1109,119,1982,557,1ytiuqE 1,994,940 2,284,810 2,489,143 2,608,707
7,707,3882,975,3615,477,3648,928,3329,494,3569,072,3605,851,3622,510,3708,851,3142,904,3438,114,3456,251,3seitilibail latoT 90 3,707,419 3,795,995 4,152,690 4,412,043 4,569,460
ITALY
Operating assets 1,190,325 1,350,595 1,417,109 1,495,446 1,557,846 1,655,944 1,877,559 2,185,446 2,364,238 2,376,091 2,314,131 2,215,600 2,154,601 2,172,729 2,254,876 2,301,219 2,323,577
66965,756996,056350,536339,626961,126112,146934,356870,516397,255502,984673,744912,264230,205315,944472,363stessa laicnaniF 4,281 684,041
4,752299,242448,232430,332530,632564,522631,422176,522070,902495,581456,661340,551158,841873,441264,731833,521stessa diuqiL 09 283,221
865,32176,42754,82349,42894,91050,71932,61473,41500,11954,01756,01163,9879,7110,8941,9717,8909,8mret-gnol ,stisopeD
7,2335,248,2992,539,2103,710,3776,710,3425,008,2253,034,2941,541,2222,500,2566,759,1141,919,1801,008,1995,355,1stessa latoT 89,654 2,823,428 2,912,445 2,965,500 3,007,618
864,1013,584,1697,564,1570,744,1694,914,1364,663,1908,062,1365,531,1809,040,1077,179275,419416,268030,997650,127716,356tbeD ,214 1,442,084 1,433,737
57,151,1902,591,1539,291,1036,971,1007,661,1589,911,1161,320,1442,229649,548082,297704,947082,807131,666239,706866,745snaoL 1 1,102,361 1,079,726
,1858,323,1854,593,1308,515,1838,056,1868,657,1169,466,1444,983,1973,371,1056,090,1150,590,1211,021,1250,970,1389,998ytiuqE 338,119 1,444,231 1,523,417 1,573,881
5,248,2992,539,2103,710,3776,710,3425,008,2253,034,2941,541,2222,500,2566,759,1141,919,1801,008,1995,355,1seitilibail latoT 33 2,789,654 2,823,428 2,912,445 2,965,500 3,007,618
BALANCE SHEET OF NFCs TABLE A2
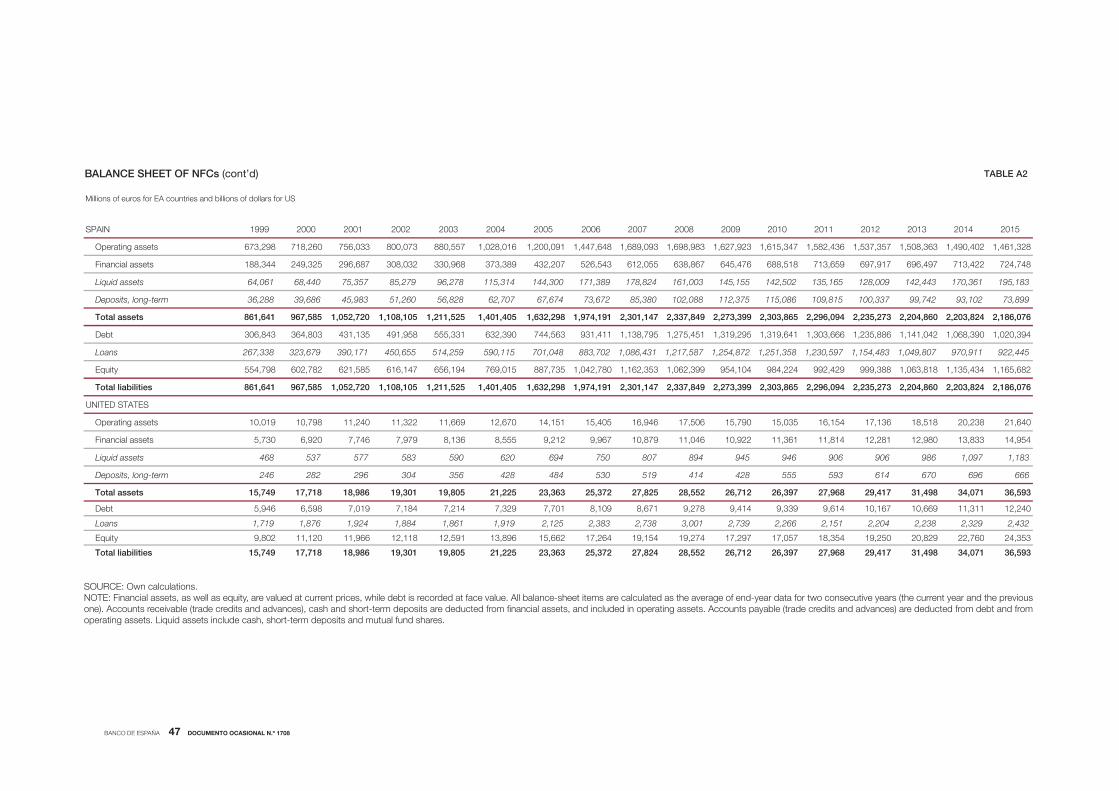
BANCO DE ESPAÑA 47 DOCUMENTO OCASIONAL N.º 1708
Millions of euros for EA countries and billions of dollars for US
51024102310221021102010290028002700260025002400230022002100200029991NIAPS
634,285,1743,516,1329,726,1389,896,1390,986,1846,744,1190,002,1610,820,1755,088370,008330,657062,817892,376stessa gnitarepO 1,537,357 1,508,363 1,490,402 1,461,328
17794,696719,796956,317815,886674,546768,836550,216345,625702,234983,373869,033230,803786,692523,942443,881stessa laicnaniF 3,422 724,748
591163,071344,241900,821561,531205,241551,541300,161428,871983,171003,441413,511872,69972,58753,57044,86160,46stessa diuqiL ,183
Deposits, long-term 36,288 39,686 45,983 51,260 56,828 62,707 67,674 73,672 85,380 102,088 112,375 115,086 109,815 100,337 99,742 93,102 73,899
0,692,2568,303,2993,372,2948,733,2741,103,2191,479,1892,236,1504,104,1525,112,1501,801,1027,250,1585,769146,168stessa latoT 94 2,235,273 2,204,860 2,203,824 2,186,076
240,141,1688,532,1666,303,1146,913,1592,913,1154,572,1597,831,1114,139365,447093,236133,555859,194531,134308,463348,603tbeD 1,068,390 1,020,394
08,940,1384,451,1795,032,1853,152,1278,452,1785,712,1134,680,1207,388840,107511,095952,415556,054171,093976,323833,762snaoL 7 970,911 922,445
31,1818,360,1883,999924,299422,489401,459993,260,1353,261,1087,240,1537,788510,967491,656741,616585,126287,206897,455ytiuqE 5,434 1,165,682
,2568,303,2993,372,2948,733,2741,103,2191,479,1892,236,1504,104,1525,112,1501,801,1027,250,1585,769146,168seitilibail latoT 296,094 2,235,273 2,204,860 2,203,824 2,186,076
UNITED STATES
046,12832,02815,81631,71451,61530,51097,51605,71649,61504,51151,41076,21966,11223,11042,11897,01910,01stessa gnitarepO
459,41338,31089,21182,21418,11163,11229,01640,11978,01769,9212,9555,8631,8979,7647,7029,6037,5stessa laicnaniF
381,1790,1689609609649549498708057496026095385775735864stessa diuqiL
666696076416395555824414915035484824653403692282642mret-gnol ,stisopeD
395,63170,43894,13714,92869,72793,62217,62255,82528,72273,52363,32522,12508,91103,91689,81817,71947,51stessa latoT
042,21113,11966,01761,01416,9933,9414,9872,9176,8901,8107,7923,7412,7481,7910,7895,6649,5tbeD
234,2923,2832,2402,2151,2662,2937,2100,3837,2383,2521,2919,1168,1488,1429,1678,1917,1snaoL
353,42067,22928,02052,91453,81750,71792,71472,91451,91462,71266,51698,31195,21811,21669,11021,11208,9ytiuqE
395,63170,43894,13714,92869,72793,62217,62255,82428,72273,52363,32522,12508,91103,91689,81817,71947,51seitilibail latoT
BALANCE SHEET OF NFCs (cont’d) TABLE A2
SOURCE: Own calculations.NOTE: Financial assets, as well as equity, are valued at current prices, while debt is recorded at face value. All balance-sheet items are calculated as the average of end-year data for two consecutive years (the current year and the previous
operating assets. Liquid assets include cash, short-term deposits and mutual fund shares.

BANCO DE ESPAÑA 48 DOCUMENTO OCASIONAL N.º 1708
Millions of euros for EA countries and billions of dollars for US
51024102310221021102010290028002700260025002400230022002100200029991ECNARF
219,671914,561648,171661,991209,602037,502881,422328,342491,012000,981889,671034,751322,731463,721645,421416,321stiforp teN 210,615
02,712233,412225,012589,402488,791079,391510,191387,081480,171760,161842,351028,641352,241471,531232,721027,611noitazitromA 9 220,883
w 240,334 251,778 262,538 279,476 304,250 330,236 350,067 381,278 424,606 415,203 399,700 404,786 404,151 382,368 379,751 394,121 431,498
Gross investment 151,563 177,925 179,277 171,861 169,653 182,244 198,319 216,873 244,779 247,161 195,436 218,965 254,566 245,979 246,829 262,325 273,504
5,602090,791463,802971,312899,312958,432436,242421,132453,802601,381492,561536,241583,921664,011358,501148,29diap sdnediviD 41 212,777
s -4,070 -32,000 -27,205 -21,770 -8,038 -17,302 -31,358 -43,949 -51,297 -74,592 -30,595 -28,177 -63,594 -71,975 -64,168 -74,745 -54,783
GERMANY
955,024342,604167,004587,224584,493045,843173,304953,434866,883634,533634,623558,772051,182800,313650,412766,102stiforp teN 441,243
84,092978,382855,872035,072758,262667,852852,352105,342134,332600,822111,422523,022789,712253,212858,302917,391noitazitromA 5 298,160
w 395,386 417,914 525,360 499,137 498,180 550,547 563,442 622,099 677,860 656,629 607,306 657,342 693,315 679,319 690,122 711,044 739,403
Gross investment 265,641 334,653 281,876 248,100 249,495 251,296 252,135 281,899 322,077 325,840 240,146 290,285 329,540 287,584 301,491 319,948 319,828
,923423,423177,733216,143156,423267,533351,473871,663851,643655,603059,772113,762268,062429,692361,032147,712diap sdnediviD 730 330,745
s -87,996 -146,902 -53,440 -9,825 -18,626 21,301 4,751 -5,958 -10,395 -43,364 31,398 42,406 22,163 53,964 64,307 61,366 88,830
ITALY
01331,501596,49548,49812,811759,911777,411191,721060,541367,651379,371477,461523,951636,051836,441853,441301,231stiforp teN 4,047
785,261612,261252,361395,061665,451076,841601,741328,041652,431074,821672,321059,711784,411069,701831,201554,59noitazitromA 162,343
w 227,558 246,496 252,598 265,123 277,275 288,050 302,443 291,019 285,883 274,297 263,447 274,523 278,811 258,097 256,911 267,720 266,390
Gross investment 119,966 145,092 138,422 147,981 148,544 152,687 153,619 170,555 181,283 177,853 134,353 162,678 173,341 137,341 138,830 143,678 146,376
,621889,821284,431337,541032,841734,051217,471405,671828,671841,771933,361268,651744,851595,741418,731151,731diap sdnediviD 408 125,893
s -29,559 -36,410 -33,419 -41,305 -28,131 -27,976 -28,324 -56,364 -71,904 -78,268 -21,343 -36,385 -40,263 -13,726 -10,907 -2,366 -5,879
SPAIN
358,811770,021619,201529,09766,49772,89619,001604,07905,73045,24687,34269,34505,54537,04574,63436,04760,44stiforp teN
036,611463,211840,011392,011489,701084,301533,001465,79934,19057,38691,67434,96510,36880,85577,35905,94464,44noitazitromA
w 88,531 90,143 90,250 98,823 108,520 113,396 119,982 126,290 128,948 167,970 201,251 201,757 202,651 201,218 212,964 232,441 235,483
,741292,631274,631647,131240,231401,031766,871610,981546,171656,051115,231155,911559,901259,301267,89938,98tnemtsevni ssorG 051 153,284
812,06629,27190,15176,45566,65327,04251,65898,64949,73112,14552,63784,03024,82962,32923,12454,12928,71diap sdnediviD
s -19,137 -30,073 -35,031 -34,401 -39,451 -49,602 -66,929 -86,566 -98,017 -57,595 14,995 28,992 14,240 10,075 25,581 12,464 21,981
UNITED STATES
563,1804,1963,1572,1012,1791,1349929259800,1759508486175394125155stiforp teN
033,1382,1822,1681,1931,1590,1290,1490,1040,1979019058818508587247386noitazitromA
596,2196,2795,2264,2053,2192,2530,2320,2399,1789,1768,1656,1205,1673,1872,1362,1532,1wolf-hsac ssorG
667,1586,1085,1705,1833,1832,1710,1163,1083,1533,1781,1950,1579759220,1541,1840,1tnemtsevni ssorG
907386336526635015094285775155174134943503992313482diap sdnediviD
s -97 -196 -44 114 178 166 209 101 36 80 527 544 476 330 385 323 220
FLOW OF FUNDS OF NFCs TABLE A3
SOURCE: Own calculations.

BANCO DE ESPAÑA PUBLICATIONS
OCCASIONAL PAPERS
0901 ÁNGEL ESTRADA, JUAN F. JIMENO and JOSÉ LUIS MALO DE MOLINA: The Spanish economy in EMU: the fi rst ten
years. (There is a Spanish version of this edition with the same number).
0902 ÁNGEL ESTRADA and PABLO HERNÁNDEZ DE COS: Oil prices and their effect on potential output. (There is a
Spanish version of this edition with the same number).
0903 PALOMA LÓPEZ-GARCÍA, SERGIO PUENTE and ÁNGEL LUIS GÓMEZ: Employment generation by small fi rms in Spain.
0904 LUIS J. ÁLVAREZ, SAMUEL HURTADO, ISABEL SÁNCHEZ and CARLOS THOMAS: The impact of oil price changes on
Spanish and euro area consumer price infl ation.
0905 CORAL GARCÍA, ESTHER GORDO, JAIME MARTÍNEZ-MARTÍN and PATRY TELLO: Una actualización de las funciones
de exportación e imporción de la economía española.
1001 L. J. ÁLVAREZ, G. BULLIGAN, A. CABRERO, L. FERRARA and H. STAHL: Housing cycles in the major euro area
countries.
1002 SONSOLES GALLEGO, SÁNDOR GARDÓ, REINER MARTIN, LUIS MOLINA and JOSÉ MARÍA SERENA: The impact of
the global economic and fi nancial crisis on Central Eastern and SouthEastern Europe (CESEE) and Latin America.
1101 LUIS ORGAZ, LUIS MOLINA and CARMEN CARRASCO: El creciente peso de las economías emergentes en la
economía y gobernanza mundiales. Los países BRIC.
1102 KLAUS SCHMIDT-HEBBEL: Central banking in Latin America: changes, achievements, challenges. (There is a Spanish
version of this edition with the same number).
1103 OLYMPIA BOVER: The Spanish Survey of Household Finances (EFF): description and methods of the 2008 wave.
1104 PABLO HERNÁNDEZ DE COS, MARIO IZQUIERDO and ALBERTO URTASUN: An estimate of the potential growth of
the Spanish economy. (There is a Spanish version of this edition with the same number).
1105 ENRIQUE ALBEROLA, CARLOS TRUCHARTE and JUAN LUIS VEGA: Central banks and macroprudential policy. Some
refl ections from the Spanish experience.
1106 SAMUEL HURTADO, ELENA FERNÁNDEZ, EVA ORTEGA and ALBERTO URTASUN: Nueva actualización del modelo
trimestral del Banco de España.
1107 PABLO HERNÁNDEZ DE COS and ENRIQUE MORAL-BENITO: Health care expenditure in the OECD countries:
effi ciency and regulation. (There is a Spanish version of this edition with the same number).
1201 ELOÍSA ORTEGA and JUAN PEÑALOSA: The Spanish economic crisis: key factors and growth challenges in the euro
area. (There is a Spanish version of this edition with the same number).
1202 MARÍA J. NIETO: What role, if any, can market discipline play in supporting macroprudential policy?
1203 CONCHA ARTOLA and ENRIQUE GALÁN: Tracking the future on the web: construction of leading indicators using
internet searches. (There is a Spanish version of this edition with the same number).
1204 JOSÉ LUIS MALO DE MOLINA: Luis Ángel Rojo en el Banco de España.
1205 PABLO HERNÁNDEZ DE COS and CARLOS THOMAS: El impacto de la consolidación fi scal sobre el crecimiento
económico. Una ilustración para la economía española a partir de un modelo de equilibrio general.
1206 GALO NUÑO, CRISTINA PULIDO and RUBÉN SEGURA-CAYUELA: Long-run growth and demographic prospects in
advanced economies.
1207 IGNACIO HERNANDO, JIMENA LLOPIS and JAVIER VALLÉS: Los retos para la política económica en un entorno de
tipos de interés próximos a cero.
1208 JUAN CARLOS BERGANZA: Fiscal rules in Latin America: a survey.
1209 ÁNGEL ESTRADA and EVA VALDEOLIVAS: The fall of the labour income share in advanced economies.
1301 ETTORE DORRUCCI, GABOR PULA and DANIEL SANTABÁRBARA: China’s economic growth and rebalancing.
1302 DANIEL GARROTE, JIMENA LLOPIS and JAVIER VALLÉS: Los canales del desapalancamiento del sector privado: una
comparación internacional.
1303 PABLO HERNÁNDEZ DE COS and JUAN F. JIMENO: Fiscal policy and external imbalances in a debt crisis:
the Spanish case.
1304 ELOÍSA ORTEGA and JUAN PEÑALOSA: Algunas refl exiones sobre la economía española tras cinco años de crisis.
1401 JOSÉ MARÍA SERENA and EVA VALDEOLIVAS: Integración fi nanciera y modelos de fi nanciación de los bancos
globales.
1402 ANTONIO MONTESINOS, JAVIER J. PÉREZ and ROBERTO RAMOS: El empleo de las Administraciones Públicas
en España: caracterización y evolución durante la crisis.

1403 SAMUEL HURTADO, PABLO MANZANO, EVA ORTEGA and ALBERTO URTASUN: Update and re-estimation of the
Quarterly Model of Banco de España (MTBE).
1404 JUAN CARLOS BERGANZA, IGNACIO HERNANDO and JAVIER VALLÉS: Los desafíos para la política monetaria
en las economías avanzadas tras la Gran Recesión.
1405 FERNANDO LÓPEZ VICENTE and JOSÉ MARÍA SERENA GARRALDA: Macroeconomic policy in Brazil: infl ation
targeting, public debt structure and credit policies.
1406 PABLO HERNÁNDEZ DE COS and DAVID LÓPEZ RODRÍGUEZ: Tax structure and revenue-raising capacity in Spain:
A comparative analysis with the UE. (There is a Spanish version of this edition with the same number).
1407 OLYMPIA BOVER, ENRIQUE CORONADO and PILAR VELILLA: The Spanish survey of household fi nances (EFF):
description and methods of the 2011 wave.
1501 MAR DELGADO TÉLLEZ, PABLO HERNÁNDEZ DE COS, SAMUEL HURTADO and JAVIER J. PÉREZ: Extraordinary
mechanisms for payment of General Government suppliers in Spain. (There is a Spanish version of this edition with the
same number).
1502 JOSÉ MANUEL MONTERO y ANA REGIL: La tasa de actividad en España: resistencia cíclica, determinantes
y perspectivas futuras.
1503 MARIO IZQUIERDO and JUAN FRANCISCO JIMENO: Employment, wage and price reactions to the crisis in Spain:
Firm-level evidence from the WDN survey.
1504 MARÍA DE LOS LLANOS MATEA: La demanda potencial de vivienda principal.
1601 JESÚS SAURINA and FRANCISCO JAVIER MENCÍA: Macroprudential policy: objectives, instruments and indicators.
(There is a Spanish version of this edition with the same number).
1602 LUIS MOLINA, ESTHER LÓPEZ y ENRIQUE ALBEROLA: El posicionamiento exterior de la economía española.
1603 PILAR CUADRADO and ENRIQUE MORAL-BENITO: Potential growth of the Spanish economy. (There is a Spanish
version of this edition with the same number).
1604 HENRIQUE S. BASSO and JAMES COSTAIN: Macroprudential theory: advances and challenges.
1605 PABLO HERNÁNDEZ DE COS, AITOR LACUESTA and ENRIQUE MORAL-BENITO: An exploration of real-time revisions
of output gap estimates across European countries.
1606 PABLO HERNÁNDEZ DE COS, SAMUEL HURTADO, FRANCISCO MARTÍ and JAVIER J. PÉREZ: Public fi nances
and infl ation: the case of Spain.
1607 JAVIER J. PÉREZ, MARIE AOURIRI, MARÍA M. CAMPOS, DMITRIJ CELOV, DOMENICO DEPALO, EVANGELIA
PAPAPETROU, JURGA PESLIAKAITĖ, ROBERTO RAMOS and MARTA RODRÍGUEZ-VIVES: The fi scal and
macroeconomic effects of government wages and employment reform.
1608 JUAN CARLOS BERGANZA, PEDRO DEL RÍO and FRUCTUOSO BORRALLO: Determinants and implications of low
global infl ation rates.
1701 PABLO HERNÁNDEZ DE COS, JUAN FRANCISCO JIMENO and ROBERTO RAMOS: The Spanish public pension system:
current situation, challenges and reform alternatives. (There is a Spanish version of this edition with the same number).
1702 EDUARDO BANDRÉS, MARÍA DOLORES GADEA-RIVAS and ANA GÓMEZ-LOSCOS: Regional business cycles
across Europe.
1703 LUIS J. ÁLVAREZ and ISABEL SÁNCHEZ: A suite of infl ation forecasting models.
1704 MARIO IZQUIERDO, JUAN FRANCISCO JIMENO, THEODORA KOSMA, ANA LAMO, STEPHEN MILLARD, TAIRI RÕÕM
and ELIANA VIVIANO: Labour market adjustment in Europe during the crisis: microeconomic evidence from the Wage
Dynamics Network survey.
1705 ÁNGEL LUIS GÓMEZ and M.ª DEL CARMEN SÁNCHEZ: Indicadores para el seguimiento y previsión de la inversión en
construcción.
1706 DANILO LEIVA-LEON: Monitoring the Spanish Economy through the Lenses of Structural Bayesian VARs.
1707 OLYMPIA BOVER, JOSÉ MARÍA CASADO, ESTEBAN GARCÍA-MIRALLES, JOSÉ MARÍA LABEAGA and
ROBERTO RAMOS: Microsimulation tools for the evaluation of fi scal policy reforms at the Banco de España.
1708 VICENTE SALAS, LUCIO SAN JUAN and JAVIER VALLÉS: The fi nancial and real performance of non-fi nancial
corporations in the euro area: 1999-2015.
Unidad de Servicios AuxiliaresAlcalá, 48 - 28014 Madrid
E-mail: [email protected]