Vibration Based Fault Diagnosis of a Hydraulic Brake ... using Variational Mode Decomposition (VMD)...
18
Copyright © 2014 Tech Science Press SDHM, vol.10, no.1, pp.81-97, 2014 Vibration Based Fault Diagnosis of a Hydraulic Brake System using Variational Mode Decomposition (VMD) R. Jegadeeshwaran 1 , V. Sugumaran 2 and K. P. Soman 3 Abstract: In automobile, brake system is an essential part responsible for con- trol of the vehicle. Vibration signals of a rotating machine contain the dynamic information about its health condition. Many research papers have reported the suitability of vibration signals for fault diagnosis applications. Many of them are based on (Fast Fourier Transform) FFT, which have their own drawback with non- stationary signals. Hence, there is a need for development of new methodologies to infer diagnostic information from such non stationary signals. This paper uses vibration signals acquired from a hydraulic brake system under good and simulated faulty conditions for the purpose of fault diagnosis. A new approach called Varia- tional mode decomposition (VMD) was used in this study. VMD decomposes the signal into various modes by identifying a compact frequency support around its central frequency, such that adding all the modes reconstructs the original signal. VMD finds intrinsic mode functions on central frequencies using alternating di- rection multiplier method (ADMM). Descriptive statistical features were extracted from VMD processed signals and classified using a machine learning algorithm. For classification J48 decision tree algorithm was used. The results were compared with the statistical features extracted from raw signal using decision tree classifier. Keywords: Brake fault diagnosis, decision tree algorithm, variational mode de- composition, alternating direction multiplier method, statistical features. 1 Introduction Brakes are the most important control components in automobile responsible for the stability of the vehicle. The main function of the brake is to decelerate or de- 1 School of Mechanical and Building Sciences, VIT University Chennai Campus, Chennai, Tamil Nadu, India – 600 127. E-mail: [email protected]; [email protected] 2 School of Mechanical and Building Sciences, VIT University Chennai Campus, Chennai, Tamil Nadu, India – 600 127. E-mail: [email protected] 3 Center of excellence in computational engineering and networking, Amrita Vishwa Vidyapeetham, Coimbatore, Tamil Nadu, India – 641 112. E-mail: [email protected].
Transcript of Vibration Based Fault Diagnosis of a Hydraulic Brake ... using Variational Mode Decomposition (VMD)...
Copyright © 2014 Tech Science Press SDHM, vol.10, no.1, pp.81-97, 2014
Vibration Based Fault Diagnosis of a Hydraulic BrakeSystem using Variational Mode Decomposition (VMD)
R. Jegadeeshwaran1, V. Sugumaran2 and K. P. Soman3
Abstract: In automobile, brake system is an essential part responsible for con-trol of the vehicle. Vibration signals of a rotating machine contain the dynamicinformation about its health condition. Many research papers have reported thesuitability of vibration signals for fault diagnosis applications. Many of them arebased on (Fast Fourier Transform) FFT, which have their own drawback with non-stationary signals. Hence, there is a need for development of new methodologiesto infer diagnostic information from such non stationary signals. This paper usesvibration signals acquired from a hydraulic brake system under good and simulatedfaulty conditions for the purpose of fault diagnosis. A new approach called Varia-tional mode decomposition (VMD) was used in this study. VMD decomposes thesignal into various modes by identifying a compact frequency support around itscentral frequency, such that adding all the modes reconstructs the original signal.VMD finds intrinsic mode functions on central frequencies using alternating di-rection multiplier method (ADMM). Descriptive statistical features were extractedfrom VMD processed signals and classified using a machine learning algorithm.For classification J48 decision tree algorithm was used. The results were comparedwith the statistical features extracted from raw signal using decision tree classifier.
Keywords: Brake fault diagnosis, decision tree algorithm, variational mode de-composition, alternating direction multiplier method, statistical features.
1 Introduction
Brakes are the most important control components in automobile responsible forthe stability of the vehicle. The main function of the brake is to decelerate or de-
1 School of Mechanical and Building Sciences, VIT University Chennai Campus, Chennai, TamilNadu, India – 600 127. E-mail: [email protected]; [email protected]
2 School of Mechanical and Building Sciences, VIT University Chennai Campus, Chennai, TamilNadu, India – 600 127. E-mail: [email protected]
3 Center of excellence in computational engineering and networking, Amrita Vishwa Vidyapeetham,Coimbatore, Tamil Nadu, India – 641 112. E-mail: [email protected].

82 Copyright © 2014 Tech Science Press SDHM, vol.10, no.1, pp.81-97, 2014
crease the speed of a vehicle in order to bring the vehicle to rest within a reasonabledistance. The rate of retardation should be proportional to the pedal effort. Hencethe brake system should provide the highest degree of safety. It is very importantthat the brake system must be maintained. The brake system may get faulty dueto various reasons, like pad wear, air leak, mechanical fade, etc. which reducesthe effectiveness of the brake system. It is essential that the brake system and brakecomponents should be monitored all the time and diagnosed when faults occur. Themalfunction of the brake system can be identified through its symptoms or somewarning sign. Therefore certain physical parameters such as vibration have beenfocused in detection incipient faults.
Vibrations generated by moving machine elements often facade the features of faultrelated signals generated by the machine elements such as gears [Wuxing, Tse, Gui-icai, and Shitielin., (2004)], bearings [Zvokelj, Zupan and Prebil (2010); Li and Ma(1997)] and cams [Tinta et al. (2005)]. When these vibration signals are analyzedusing fast Fourier transform (FFT), the frequency components are distributed due tooverlapping of harmonics and noise in addition to the frequency components. Thenon-stationary nature of the signals makes the situation further worse by changingthe frequency component itself. Hence analysis of the above signals in faulty op-erating conditions becomes difficult. Conventional application of measurement ofstatistical parameters may not be useful under such conditions.
In this context researchers are forced to pay their attention on signal processingmethods for improving the accuracy of the fault classification tools. In recent yearsEmpirical Mode Decomposition (EMD) was used to detect incipient faults in gearsand in bearings [Ricci and Pennachhi (2011); Loutridis S. J. (2004); Yu, Chengand Yang (2005)] along with intrinsic mode functions (IMF). The IMF may notsuitable non-stationary signals. Lei et al. used EMD to extract features from signalsfor classifying the different modes and degrees of gear faults [Lei, Zuo and He(2010)]. Hence, these EMD feature analysis will provide the information requiredto make a decision when intervention is required for maintenance. The results ofsuch analysis are used for failure analysis in order to determine the original causeof the fault. This feature analysis can be done using a machine learning approach[Jegadeeshwaran and Sugumaran (2013)].
Many reports illustrated a fuzzy [Wang and Chen (2007)], Neural Network [Ra-jakarunakaran, Venkumar, Devaraj, and Surya Prakasa Rao (2008)], support vectormachines (SVM) [Sakthivel, Sugumaran and Nair (2010)], proximal support vec-tor machines (PSVM) [Sugumaran, Muralidharan and Ramachanran (2007)], de-cision tree (DT) and best first (BF) tree [Jegadeeshwaran and Sugumaran (2013)]for fault diagnosis study to classify faults in various machine components such asroller bearing, ball bearing, gears and in a single point cutting tool and brakes etc.

Vibration Based Fault Diagnosis of a Hydraulic Brake System 83
In all the feature classification approaches, the maximum classification accuracyis a challenging one. Since the classification accuracy fully depends on the con-dition of the signal, the raw signal obtained from the brake setup cannot be useddirectly for analysis due to noise. It is very essential to improve the condition of thesignal through some preprocessing techniques. Hence a new preprocessing tech-nique was developed to decompose the signal into various modes or IMFs usingcalculus variations. The modes have compact frequency support around the centralfrequency. ADMM was used as optimization tool to find such central frequenciesconcurrently [Konstantin Dragomiretskiy and Dominique Zosso (2014)]. The mainpurpose of decomposing a signal is to identify various components (descriptive sta-tistical features) of the signal. This work focuses on a new algorithm - variationalmode decomposition (VMD), which extracts different modes present in the signal.The extracted statistical feature modes were then classified using J48 decision treealgorithm.
The vibration of the brake system depends on various parameters like, brake force,rotational speed of the rotor etc. The focus of this study is to identify a suitable‘feature-classifier’ set for the brake fault diagnosis. Hence a static brake test setupwith constant brake force or load and constant speed were considered in this study.
The paper is structured as follows:
The experimental setup, experimental procedure and fault simulation procedurehave been described in Section 2. Vibration signal acquisition, feature extractionprocess has been discussed in Section 3. Feature selection process has been de-scribed in Section 4. The theory about VMD features have been discussed in Sec-tion 5. The classification accuracy of decision tree algorithm with VMD processedstatistical process have been evaluated and compared with the statistical features(without VMD analysis) in Section 6. Section 7 summarizes the main findings ofthis paper. The decision tree (DT) classifier with VMD processed statistical fea-tures have been proposed as a suitable classifier for the brake fault diagnosis.
2 Experimental studies
The experimental study was conducted on a static hydraulic brake test setup. Acommercial passenger car’s (Model: Maruti Suzuki - Swift) hydraulic brake systemwas fabricated as the brake test rig as shown in Figure 1. The vibration signals wereacquired by using a piezoelectric type accelerometer (an uni-axial type, 50g range,100mV/g sensitivity and 40 kHz resonant frequency). It was connected to a dataacquisition system (DAQ system - NI USB 4432 model, sampling rate of 102.4 kilosamples per second, 24 bit resolution) through a signal conditioning unit, wherethe analog signal is converted to a digital signal using an analog to digital converter

84 Copyright © 2014 Tech Science Press SDHM, vol.10, no.1, pp.81-97, 2014
(ADC).
Figure 1: Experimental setup.
Initially the test rig was assumed to be in good condition and the vibration sig-nal was acquired. The frequently occurred nine most important fault conditionsnamely, air in the brake fluid, brake oil spill on disc brake, drum brake pad wear,disc brake pad wear (even) – inner, disc brake pad wear (even) – inner and outer,disc brake pad wear (uneven) – inner, disc brake pad wear (uneven) – inner andouter, reservoir leak, drum brake mechanical fade were simulated for testing. Un-der different simulated fault conditions the vibration signals were acquired from thehydraulic brake system working under constant braking condition (Original Speed667 rpm, Brake load 67.7 N). From the accelerometer, the vibration signals for dif-ferent fault conditions were taken with the following settings [Jegadeeshwaran andSugumaran (2013)].
1. Sample length: 1024 (arbitrarily chosen)
2. Sampling frequency: 24 kHz (as per the Nyquist sampling theorem)
3. Sample size: Minimum of 55 samples was taken for each conditions of thebraking system.
The acquired vibration signals in digital form were stored directly in the computerthrough NI LabVIEW graphical program (Figure 2). These vibration signals wereprocessed to extract the statistical features.
Vibration Based Fault Diagnosis of a Hydraulic Brake System 85
Figure 2: NI LabVIEW Graphical Program.
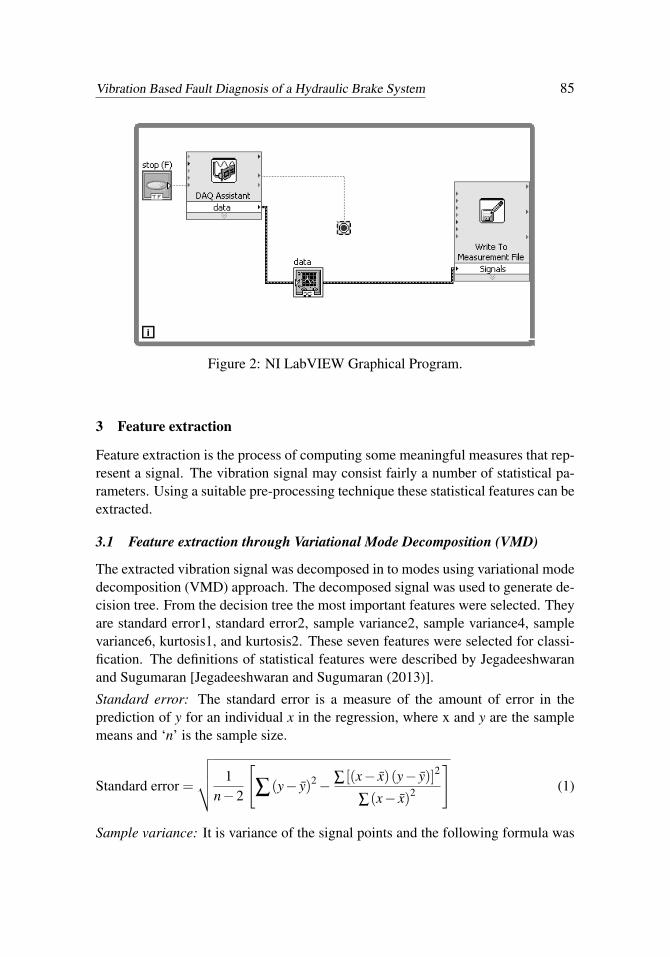
3 Feature extraction
Feature extraction is the process of computing some meaningful measures that rep-resent a signal. The vibration signal may consist fairly a number of statistical pa-rameters. Using a suitable pre-processing technique these statistical features can beextracted.
3.1 Feature extraction through Variational Mode Decomposition (VMD)
The extracted vibration signal was decomposed in to modes using variational modedecomposition (VMD) approach. The decomposed signal was used to generate de-cision tree. From the decision tree the most important features were selected. Theyare standard error1, standard error2, sample variance2, sample variance4, samplevariance6, kurtosis1, and kurtosis2. These seven features were selected for classi-fication. The definitions of statistical features were described by Jegadeeshwaranand Sugumaran [Jegadeeshwaran and Sugumaran (2013)].
Standard error: The standard error is a measure of the amount of error in theprediction of y for an individual x in the regression, where x and y are the samplemeans and ‘n’ is the sample size.
Standard error =
√√√√ 1n−2
[∑(y− y)2− ∑ [(x− x)(y− y)]2
∑(x− x)2
](1)
Sample variance: It is variance of the signal points and the following formula was
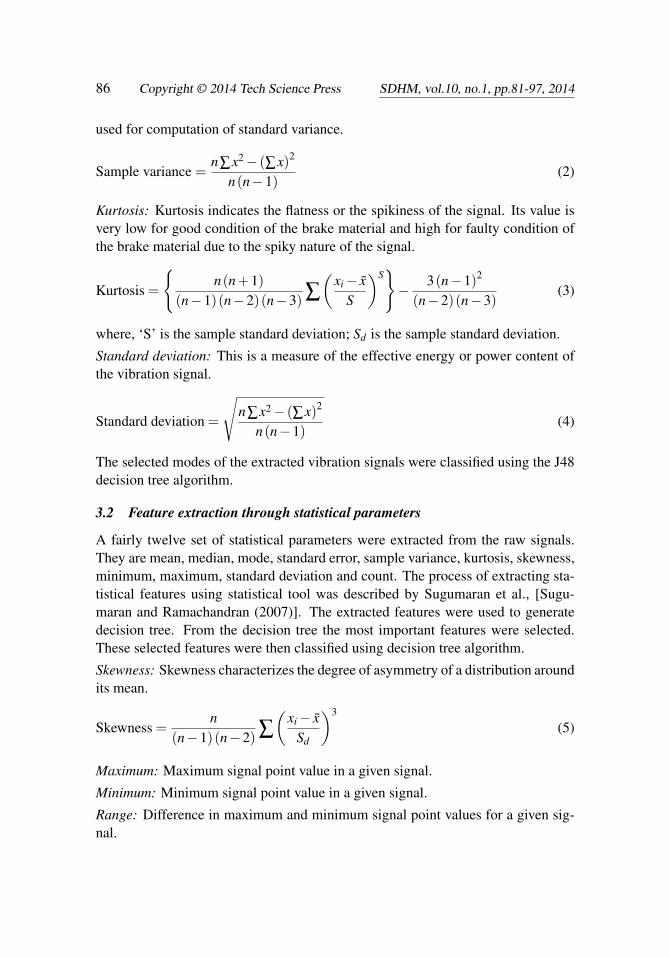
86 Copyright © 2014 Tech Science Press SDHM, vol.10, no.1, pp.81-97, 2014
used for computation of standard variance.
Sample variance =n∑x2− (∑x)2
n(n−1)(2)
Kurtosis: Kurtosis indicates the flatness or the spikiness of the signal. Its value isvery low for good condition of the brake material and high for faulty condition ofthe brake material due to the spiky nature of the signal.
Kurtosis =
{n(n+1)
(n−1)(n−2)(n−3) ∑
(xi− x
S
)S}− 3(n−1)2
(n−2)(n−3)(3)
where, ‘S’ is the sample standard deviation; Sd is the sample standard deviation.
Standard deviation: This is a measure of the effective energy or power content ofthe vibration signal.
Standard deviation =
√n∑x2− (∑x)2
n(n−1)(4)
The selected modes of the extracted vibration signals were classified using the J48decision tree algorithm.
3.2 Feature extraction through statistical parameters
A fairly twelve set of statistical parameters were extracted from the raw signals.They are mean, median, mode, standard error, sample variance, kurtosis, skewness,minimum, maximum, standard deviation and count. The process of extracting sta-tistical features using statistical tool was described by Sugumaran et al., [Sugu-maran and Ramachandran (2007)]. The extracted features were used to generatedecision tree. From the decision tree the most important features were selected.These selected features were then classified using decision tree algorithm.
Skewness: Skewness characterizes the degree of asymmetry of a distribution aroundits mean.
Skewness =n
(n−1)(n−2) ∑
(xi− x
Sd
)3
(5)
Maximum: Maximum signal point value in a given signal.
Minimum: Minimum signal point value in a given signal.
Range: Difference in maximum and minimum signal point values for a given sig-nal.

Vibration Based Fault Diagnosis of a Hydraulic Brake System 87
Mean: The arithmetic average of a set of values or distribution.
Median: Middle value separating the greater and lesser halves of a data set.
Mode: Most frequent value in a dataset.
Count: Number of data points in the signal.
4 Variational Mode Decomposition
Variational Mode Decomposition (VMD) decomposes the signal into various modesor intrinsic mode functions using calculus of variation. Each mode of the signalmay have compact frequency support around a central frequency. VMD tries tofind out these central frequencies and intrinsic mode functions centered on thosefrequencies concurrently using an optimization methodology called ADMM [Kon-stantin Dragomiretskiy and Dominique Zosso (2014)]. The original formulation ofthe optimization problem is continuous in time domain.
VMD is formulated as; Minimize the sum of the bandwidths of k modes subject tothe condition that sum of the k modes is equal to the original signal. The unknownsare k central frequencies and k functions centered at those frequencies. Since partof the unknowns is function, calculus of variation is applied to derive the optimalfunctions.
Bandwidth of an AM-FM signal primarily depends on both, with the maximumdeviation of the instantaneous frequency ∆ f ∼ max(|ωk (t)−ωk|) and the rate ofchange of instantaneous frequency. Dragomiretskiy and Zosso (2014) proposed afunction that can measure the bandwidth of a intrinsic mode function uk(t). Atfirst they computed Hilbert transform of uk(t). Let it be uH
k (t). Then formed ananalytic function
(uk(t)+ juH
k (t)). The frequency spectrum of this function is one
sided (exist only for positive frequency) and assumed to be centered on ωk . Bymultiplying this analytical signal with e− jωkt , the signal is frequency translatedto be centered at origin. The integral of the square of the time derivative of thisfrequency translated signal is a measure of bandwidth of the intrinsic mode functionuk(t).
Let uMk (t) =
(uk(t)+ juH
k (t))
e− jωkt (6)
It is a function whose spectrum is around origin (baseband). Magnitude of timederivative of this function when integrated over time is a measure of bandwidth.Hence,
∆ωk =∫ (
∂t(uM
k (t)))(
∂t(uM
k (t)))
dt (7)
where, ∂t(uM
k (t))= ∂t
[(δ (t)+ j
πt
)∗uk(t)
].

88 Copyright © 2014 Tech Science Press SDHM, vol.10, no.1, pp.81-97, 2014
The integral can also expressed as a norm.
∆ωk =
∥∥∥∥∂t
[(δ (t)+
jπt
)∗uk(t)
]∥∥∥∥2
2(8)
The sum of bandwidths of k modes is given byK∑
k=1∆ωk.
The resulting variational formulation is as follows:
minuk,ωk
{∑k
∥∥∥∥∂t
[((δ (t)+
jπt
)∗uk(t)
)e− jωkt
]∥∥∥∥2
2(9)
s.t. ∑k
uk = f , where f is the original signal.
The augmented Lagrangian multiplier method converts this into an unconstrainedoptimization problem. The following algorithmic approach has used for VMD:
Final algorithm for VMD:
initialize u1k , ω
1k , λ
1, n← 0
repeat
n← n+1
for k = 1 : K do
Update uk for all ω ≥ 0
un+1k ←
f −∑i<k un+1i −∑i>k un
i +λ n
21+2α(ω−ωn
k )2 (10)
Update ωk:
ωn+1k ←
∞∫0
ω∣∣un+1
k (ω)∣∣2 dω
∞∫0
∣∣un+1k (ω)
∣∣2 dω
(11)
end for
Dual ascent for all ω ≥ 0:
λn+1← λ
n + τ( f −∑k
un+1k ) (12)
until convergence: ∑k
∥∥un+1k − un
k
∥∥22
/‖un
k‖22 < ε (13)

Vibration Based Fault Diagnosis of a Hydraulic Brake System 89
4.1 Discretization of frequency
It is first assumed that length of the mirrored signal in the time domain is 1. Iftotal length of the mirrored signal in terms of number of discrete values is T , thensampling interval is 1/T . The discrete frequency ω is assumed to vary from -0.5to +0.5 so that it represents normalized discrete frequency. It must be noted thatalgorithm construct Fourier transform of different mode function values for positivefrequencies only. The other half can be easily created by conjugating and reflectingon the left side.
Once all the mode functions in the frequency domain are obtained, then obtainthe time domain mode functions by taking inverse Fourier transform. These modefunctions correspond to mirrored signal. Then cut off the appended (reflected por-tions) part of the signal to obtain the desired intrinsic mode functions.
5 Feature classification using J48 Decision tree Algorithm
In the preset study a decision tree classifier has been used. A decision tree is astatistical classifier which transforms the data to a tree called decision tree (Quin-lan, 1986). A standard tree consists root, nodes, branches and leaves (Figure 3).One branch is a chain of nodes which involves one attribute. The occurrence ofan attribute provides the information about the importance of the associated at-tribute. The procedure of forming the Decision Tree and feature selection has beenexplained in detail by Sugumaran [Sugumaran and Ramachandran (2007)]. Theselected features were classified using J48 decision tree algorithm.
6 Results and Discussion
The vibration signals were acquired for good and nine other fault conditions ofthe hydraulic brake system. Totally 550 samples were collected; 55 signals fromeach class. The statistical features were treated as features and act as input to thealgorithm. The corresponding status or condition of the classified data will be therequired output of the algorithm. This input and corresponding output togetherforms the dataset.
6.1 Classification using Decision Tree algorithm with Statistical Features (With-out VMD processed features)
The dataset is used with decision tree J48 algorithm for generating the decision treefor the purpose of feature selection and classification. From the twelve extractedfeatures, the top five features namely minimum, standard error, sample variance,kurtosis and skewness were selected from the decision tree shown in Figure 4. The

90 Copyright © 2014 Tech Science Press SDHM, vol.10, no.1, pp.81-97, 2014
Figure 3: Decision tree with Statistical features (without VMD).
selected features were classified using J48 decision tree algorithm [Jegadeeshwaranand Sugumaran (2013)]. J48 decision tree algorithm gives the maximum classifi-cation accuracy as 97.45 % for a selected number of features.
The number of objects required for forming a class was varied from 1 to 100. Refer-ing Figure 4, when the number of objects is 3 the algorithm gives the maximumclassification accuracy (97.45%).
When the number of data points is less the algorithm tends to over fit the data andwhen it is more the algorithm tends to generalize the model built. Hence, it is betterto chose minimum value to form a class. The confidence factor was varied from ‘0’to ‘1’ and found that there is no variation in the classification accuracy (Figure 5).Hence, in the present study it was fixed as ‘0.25’ (default value). The classificationaccuracy achieved was 97.45 %.

Vibration Based Fault Diagnosis of a Hydraulic Brake System 91
Figure 4: Minimum no. of objects Vs classification accuracy– Decision tree with-out VMD.
Figure 5: Confidence factor Vs classification accuracy – Decision tree withoutVMD.
92 Copyright © 2014 Tech Science Press SDHM, vol.10, no.1, pp.81-97, 2014
6.2 Classification using Decision Tree algorithm with Statistical Features (WithVMD processed features)
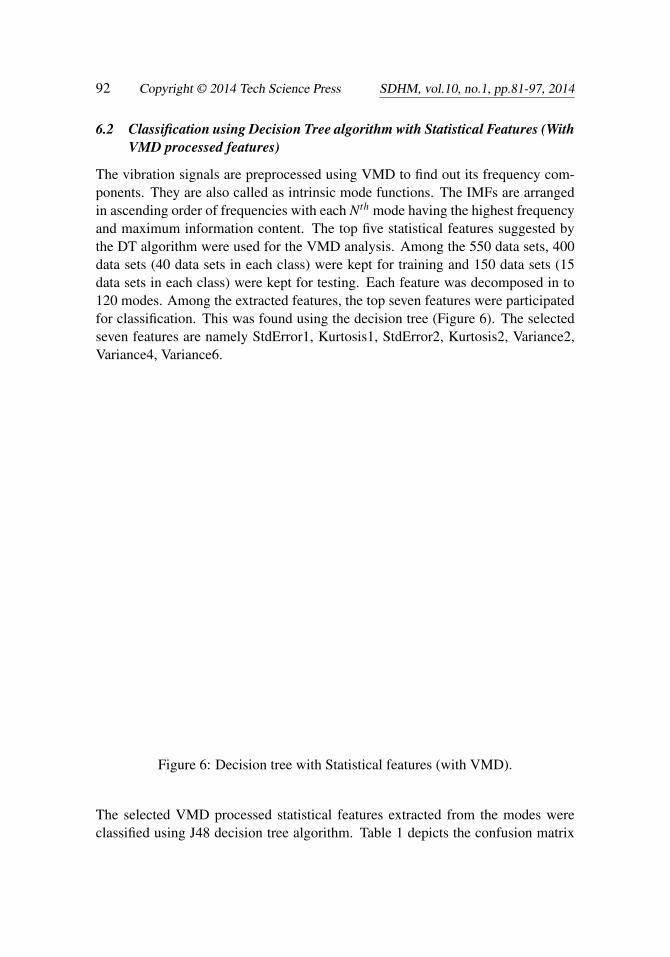
The vibration signals are preprocessed using VMD to find out its frequency com-ponents. They are also called as intrinsic mode functions. The IMFs are arrangedin ascending order of frequencies with each Nth mode having the highest frequencyand maximum information content. The top five statistical features suggested bythe DT algorithm were used for the VMD analysis. Among the 550 data sets, 400data sets (40 data sets in each class) were kept for training and 150 data sets (15data sets in each class) were kept for testing. Each feature was decomposed in to120 modes. Among the extracted features, the top seven features were participatedfor classification. This was found using the decision tree (Figure 6). The selectedseven features are namely StdError1, Kurtosis1, StdError2, Kurtosis2, Variance2,Variance4, Variance6.
Figure 6: Decision tree with Statistical features (with VMD).
The selected VMD processed statistical features extracted from the modes wereclassified using J48 decision tree algorithm. Table 1 depicts the confusion matrix
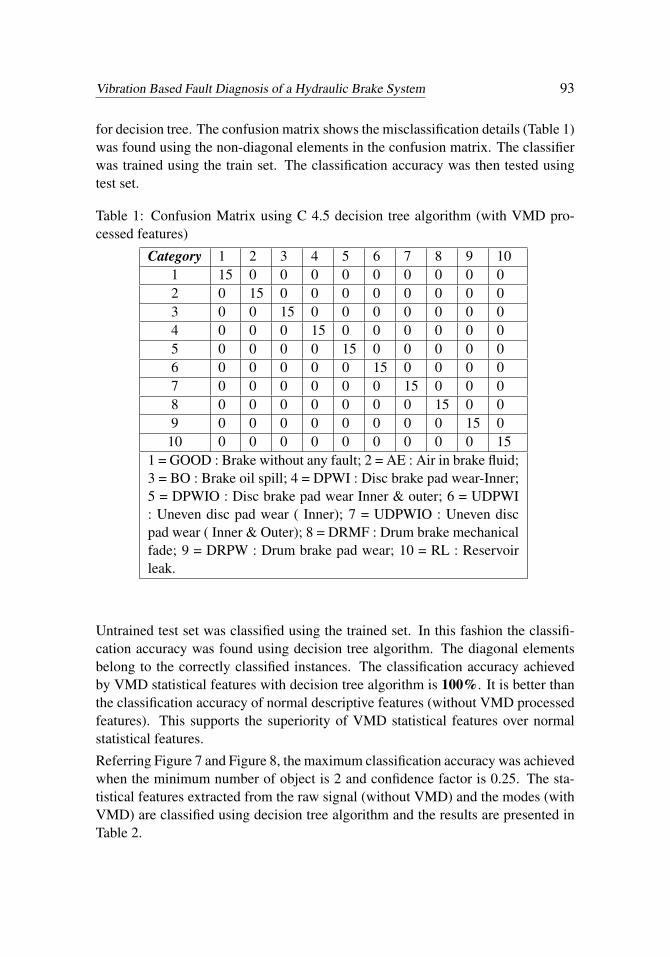
Vibration Based Fault Diagnosis of a Hydraulic Brake System 93
for decision tree. The confusion matrix shows the misclassification details (Table 1)was found using the non-diagonal elements in the confusion matrix. The classifierwas trained using the train set. The classification accuracy was then tested usingtest set.
Table 1: Confusion Matrix using C 4.5 decision tree algorithm (with VMD pro-cessed features)
Category 1 2 3 4 5 6 7 8 9 101 15 0 0 0 0 0 0 0 0 02 0 15 0 0 0 0 0 0 0 03 0 0 15 0 0 0 0 0 0 04 0 0 0 15 0 0 0 0 0 05 0 0 0 0 15 0 0 0 0 06 0 0 0 0 0 15 0 0 0 07 0 0 0 0 0 0 15 0 0 08 0 0 0 0 0 0 0 15 0 09 0 0 0 0 0 0 0 0 15 0
10 0 0 0 0 0 0 0 0 0 151 = GOOD : Brake without any fault; 2 = AE : Air in brake fluid;3 = BO : Brake oil spill; 4 = DPWI : Disc brake pad wear-Inner;5 = DPWIO : Disc brake pad wear Inner & outer; 6 = UDPWI: Uneven disc pad wear ( Inner); 7 = UDPWIO : Uneven discpad wear ( Inner & Outer); 8 = DRMF : Drum brake mechanicalfade; 9 = DRPW : Drum brake pad wear; 10 = RL : Reservoirleak.
Untrained test set was classified using the trained set. In this fashion the classifi-cation accuracy was found using decision tree algorithm. The diagonal elementsbelong to the correctly classified instances. The classification accuracy achievedby VMD statistical features with decision tree algorithm is 100%. It is better thanthe classification accuracy of normal descriptive features (without VMD processedfeatures). This supports the superiority of VMD statistical features over normalstatistical features.
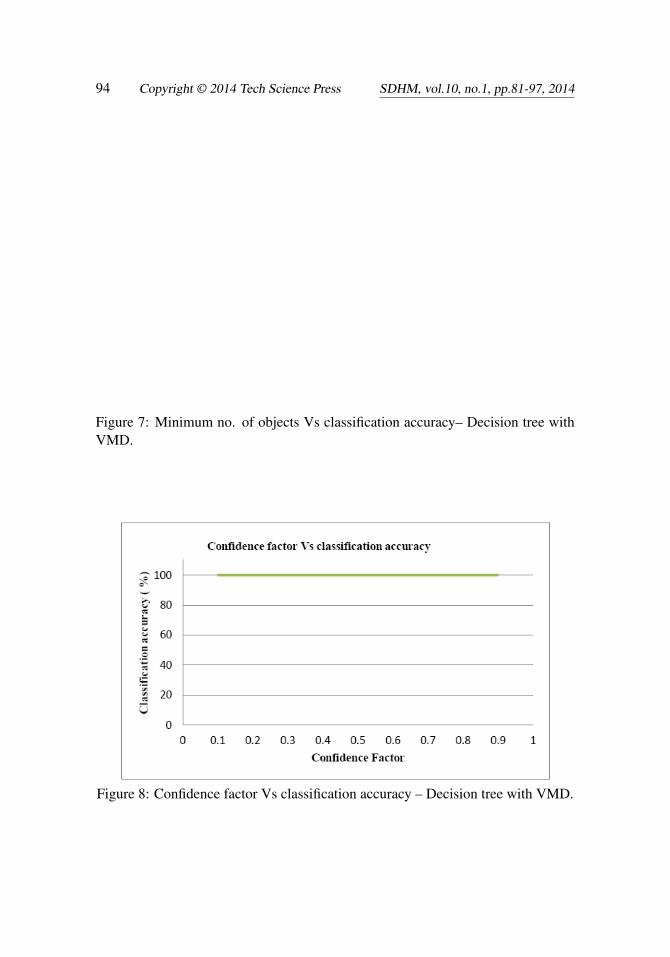
Referring Figure 7 and Figure 8, the maximum classification accuracy was achievedwhen the minimum number of object is 2 and confidence factor is 0.25. The sta-tistical features extracted from the raw signal (without VMD) and the modes (withVMD) are classified using decision tree algorithm and the results are presented inTable 2.
94 Copyright © 2014 Tech Science Press SDHM, vol.10, no.1, pp.81-97, 2014
Figure 7: Minimum no. of objects Vs classification accuracy– Decision tree withVMD.
Figure 8: Confidence factor Vs classification accuracy – Decision tree with VMD.

Vibration Based Fault Diagnosis of a Hydraulic Brake System 95
From Table 2, it is found that J48 decision tree algorithm gives the maximum clas-sification accuracy. The achieved classification accuracy for VMD processed sta-tistical features with decision tree was 100 %.
Table 2: Overall Classification accuracy.
S. No. Classifier Classification accuracy (%)1 DT (without VMD) 97.452 DT (with VMD) 100
7 Conclusion
The paper presented a new signal processing technique for fault diagnosis of brakesystem called ‘Variational mode decomposition’ along with decision tree classifier.For bench marking the new features and classier, statistical features extracted fromraw signal (without VMD preprocessing and with VMD preprocessing) and deci-sion tree classifier respectively have been taken up. First, the superiority of VMDprocessed features was established in comparison with conventional statistical fea-tures. Then, the classifier performance of the decision tree algorithm was comparedto prove the better performance. From the results and discussion, one can concludethat the VMD preprocessed signals with decision tree classifier performs better infault diagnosis of a hydraulic brake system.
References
Dragomiretskiy, K.; Zosso, D. (2014): Variational Mode Decomposition. IEEETransactions on Signal Processing, vol. 62, no. 3, pp. 531 - 544.
Jegadeeshwaran, R.; Sugumaran, V. (2013): Method and apparatus for fault di-agnosis of an automobile brake system. Recent patents on Signal Processing, vol.3, no. 1, pp. 2-11.
Jegadeeshwaran, R.; Sugumaran, V. (2013): Comparative study of decision treeclassifier and best first tree classifier for fault diagnosis of automobile hydraulicbrake system using statistical features. Measurement, vol. 46, no. 9, pp. 3247-3260.
Lei, Y.; Zuo, M. J.; He, Z.; Zi, Y. (2010): A multidimensional hybrid intelligentmethod for gear fault diagnosis. Expert Systems with Applications, vol. 37, no. 2,pp. 1419-1430.
96 Copyright © 2014 Tech Science Press SDHM, vol.10, no.1, pp.81-97, 2014
Li, C. J.; Ma, J. (1997): Wavelet decomposition of vibrations for detection ofbearing localized defects. NDTandE International, vol. 30, no. 3, pp.143-149.
Loutridis, S. J. (2004): Damage detection in gear systems using Empirical modedecomposition. Engineering Structures, vol. 26, no. 12, pp. 1833-41.
Quinlan, J. R. (1986): Induction of Decision Trees. Machine Learning, vol. 1,pp. 81-106.
Rajakarunakaran, S.; Venkumar, P.; Devaraj, D.; Surya Prakasa Rao, K.(2008): Artificial neural network approach for fault detection in rotary system.Applied Soft Computing, vol. 8, pp. 740-748.
Ricci, R.; Pennacchi, P. (2011): Diagnostics of gear faults based on EMD andautomatic selection of intrinsic mode functions. Mechanical systems and SignalProcessing, vol. 25, pp. 821-838.
Sakthivel, N. R.; Sugumaran, V.; Nair, B. B. (2010): Application of support vec-tor machine (SVM) and proximal support vector machine (PSVM) for fault classi-fication of mono-block centrifugal pump. International Journal of Data AnalysisTechniques and Strategies, vol. 2, pp. 38-61.
Sugumaran, V.; Muralidharan, V.; Ramachandran, K. I. (2007): Feature se-lection using Decision Tree and classification through Proximal Support VectorMachine for fault diagnostics of roller bearing. Mechanical Systems and SignalProcessing, vol. 21, pp. 930–942.
Sugumaran, V.; Ramachandran, K. I. (2007): Automatic rule learning usingdecision tree for fuzzy classifier in fault diagnosis of roller bearing. MechanicalSystem and Signal Processing, vol. 21, pp. 2237- 2247.
Tinta, D.; Petrov, J.; Benko, U.; Juric, J.; Rakar, R.; Zele, M.; Tavar, J.; Rejec,J.; Stefanovska, A. (2005): Fault diagnosis of vacuum cleaner motors. ControlEngineering Practice, vol. 13, pp. 177–187.
Wang, H. Q.; Chen, P. (2007): Sequential condition diagnosis for centrifugalpump system using fuzzy neural network. Neural Information Processing: Let-ters and Reviews, vol. 2, pp. 41–50.
Wuxing, L.; Peter, W. T.; Guicai, Z.; Tielin, S. (2004). Classification of gearfaults using cumulant and the radial basis function. Mechanical Systems andSignal Processing, vol. 18, pp. 381-389.
Yu, D.; Cheng, J.; Yang, Y. (2005): Application of EMD method and Hilbertspectrum to the fault diagnosis of roller bearings. Mechanical systems and signalprocessing, vol. 19, no. 2, pp. 259-70.
Zvokelj, M.; Zupan, S.; Prebil, I. (2010); Multivariate and multiscale monitoringof large-size low-speed bearings using Ensemble Empirical Mode Decomposition

Vibration Based Fault Diagnosis of a Hydraulic Brake System 97
method combined with Principal Component Analysis. Mechanical Systems andSignal Processing, vol. 24, pp. 1049-1067.