Analysis of Girder Differential Deflection and Web Gap Stress for
Vibration and Deflection of Rolled-Beam and Plate-Girder Bridges GEORGE M . FOSTER, Chief Deputy Commissioner, and LEROY T. OEHLER, Physical Research Engineer, Michigan State Highway Department
This is a report covering observations made on the vibration and deflection characteristics on an eight-span plate girder bridge consisting of f ive s imple spans and three spans of continuous beam design, and a continuation of the vibration and deflection studies on the Fennville Bridge, which was previously reported. The latter bridge consists of six simple spans of rol led beam construction with concrete decking. One of these spans was built with composite construction.
Three types of loading were used—normal commercial truck t r a f f i c with a minimum of control, controlled testing with two-axle trucks, and controlled testing with a special three-axle truck with axle spacing identical to that for H20-S16 bridge loading.
Observations are reported on the frequency of vibration, the amplitude and duration of vibration, and the deflection for these spans under s imilar loading conditions. The lateral distribution of the vibration and deflection among the longitudinal beams is shown fo r several rol led beam spans.
A method is presented f o r calculating the natural frequency of a highway span which checks the observations within approximately three percent. The occurrence of appreciable vibration is correlated with the type, gross weight, axle spacing, and speed of the vehicle causing vibration. Other factors i n fluencing vibration are discussed - for example, the effect of vehicle sequence on vibrations and the effect of induced impact.
The differences in behavior of the various spans are correlated with present design c r i te r ia , that is , "Design Live Load Plus Impact Deflection" and "Depth to Span Length Ratios. "
• UNTIL quite recently studies of the deflection and vibration characteristics of bridges dealt chiefly with ra i l road bridges. Cr i te r ia fo r the proper design of highway bridges were adopted or modified on the basis of data and experience gathered on rai l road structures. In two important points, impact and vibration, i t might be expected that the inherent differences in the types of vehicles using the highway bridge as compared to the ra i l road bridge would influence the behavior of the structures. For example the "hammer-blow" effect in a ra i l road bridge has no counterpart in a highway structure.
The senior author of this paper. Chief Deputy Commissioner of the Michigan State Highway Department and a member of the AASHO Committee on Deflection Limitations fo r Bridges, proposed that the Research Laboratory undertake a study of vibration and deflection on certain bridges in Michigan. Previous tests reported by him entitled "Michigan Test on Rolled-Beam Bridge Using H20-S16 Loading" provided useful in fo r mation on testing procedure and instrumentation which has been incorporated in this study. E. A. Finney, Assistant Testing and Research Engineer i n charge of r e search, set up the general research program. Field tests and analysis of the data was under the supervision of the junior author. Paul Mi l l iman, Physical Testing Engineer, supervised the operation and maintenance of the recording equipment.
The immediate aims of this investigation were to obtain data on the following i tems: 1. Measurement of overall deflection of each span under s imilar loading conditions. 2. Measurement of amplitude and frequency of vibration fo r each span under s i m i
lar loading conditions. 3. Determination of the effect of overall vehicle weight, type of vehicle, axle ar
rangement, vehicle speed and impact on vibration and deflection. This report describes the methods used in carrying out these objectives on the
Jackson By-Pass Bridge ( B l and X 1 of 38-1-4) an eight-span plate girder structure, and the Kalamazoo River Bridge near Fennville ( B l of 3-9-12), a six-span roUedbeam
79

P C I 7 « * IS 29 II S l l t a j TO C0N3T t
•2 tr
CO
o
ABUTMENT A ASUTMENT B
i l L L j J j L L J - ^
SECTIONAL VIEW
Figure 1. General plan of structure, Jackson By-Pass Bridge. Bl & XI of 38-1-14.

81
structure; the results obtained; and certain comparisons with theoretical values or design cr i te r ia .
JACKSON BY-PASS BRIDGE
Description of Bridge Spans
This structure is composed of simple and continuous spans of plate girder construct ion with a concrete deck. Fundamental information on this bridge is shown in Figure 1. The north and south roadways with their accompanying sidewalks and raised median wheel guards are independent superstructures fo r a l l spans, but the two roadways share common piers and abutments. Each roadway is supported by six lines of plate girder beams which are 4 f t . 2^2 in . back-to-back of angles, with one f u l l length and one v a r i able length cover plate on top and bottom flanges, fo r a l l beam spans. Five, or m some cases six rows of diaphragms connect the plate girders together transversely. The deck I S constructed of reinforced concrete with variable slab thickness to provide the required crown at the center and to allow fo r dead load deflection of the beams.
The f i r s t four spans have a 90-degree angle of crossing, but the last four spans are on a lYe degree curve. This bridge is also constructed on a vert ical curve. The fundamental differences between the eight spans are as follows:
Span 1 - West end span of a three-span continuous superstructure with a span length of 72 f t . 6 i n . , center to center of bearings.
Span 2 - Center span of a three -span continuous superstructure with a span length of 92 f t . 0 in .
Span 3 - East end span of a three-span continuous superstructure with a span length of 74 f t . 4^2 in .
Span 4 - Simple span of 84 f t . 3 in . length. Span 5 - Simple span of 84 f t . 3 in . length on horizontal curve. Span 6 - Simple span of 76 f t . 3 m . length on horizontal curve. Span 7 - Simple span of 81 f t . 9 in . length on horizontal curve. Span 8 - Simple span of 76 f t . 1̂ 2 in . length on horizontal curve. This structure was subjected to three types of t r a f f i c to effect vibrations and deflec
tions: (1) normal t ruck t r a f f i c with a mimmum of control; (2) two-axle county maintenance trucks; and (3) the special three-axle highway department bridge test truck. The second and th i rd types were used under controlled conditions to study the influence of certain factors on vibration. Since the electrorac instrumentation was common fo r a l l types of loading, i t w i l l be described f i r s t , followed by a description of the methods and procedures used fo r the three typos of t r a f f i c .
Test Instrumentation
Deflectometers to record bridge movement were built i n the Highway Research Laboratory. These deflectometers were fastened r ig id ly to the center safety curb or median s tr ip at the center of each span, as shown in Figure 2. With deflection of the bridge, the dial gage moved with the bridge as did the entire deflectometer assembly, with the exception of the end of the hinged cantilever beam which was held f r o m below by a tightened wire attached to a 100-lb. weight on the ground (see Figure 3) and above by a stretched spring. The movement of the bridge could be noted visually by reading the dial gage, but a permanent record was also obtained by means of a wire resistance strain gage fastened to an aluminum cantilever beam which was deflected by the top end of the dial gage stem. Change in the electrical resistance of the strain gage was a measure of the strain in the aluminum cantilever and this change m electr ical resistance resulted in a deflection of a light trace on a photosensitive paper str ip in a Hathaway 12-channel recording oscillograph. The Hathaway equipment is shown in Figure 4. A calibration of the dial deflection corresponding to a given trace deflection was made by moving each of the hinged cantilever beams a given amount and noting the movement on the corresponding trace p r io r to the beginning of testing. An indication of the t ruck speed and the time that the truck was on each successive span was obtained by means of t ra f f ic counter cables which gave a pip on an inactive oscillograph trace when the

82
T A B L E 1
SUMMARY OF OBSERVATIONS ON MAXIMUM D E F L E C T I O N AND MAXIMUM AMPLITUDE AND DURATION OF VIBRATION
Data on Spans Ratio of Depth to
Span Length
Design Live Load Plus Impact Deflection in In.
Max. Deflection in Inches
Max. Amplituc in Inches (With Impact Effect) Span Loaded
e of Vibration out Induced
Span Unloaded
Max. Duration of Vibration in Seconds After Truck is Off
The Span
1. Continuous Span 72'-6" inlength
1/17.2 0. 090 due to "2S1-2"
truck
0. 015 due to "2S1"
truck
0.009 due to three 2-axle trucks in
sequence
29 due to special 3-axle test truck with
induced impact
2. Continuous Span 92'-0" inlength
1/21. 9 1. 05 or 1/1050 of span
0. 094 due to "2S1-2"
truck
0.018 due to "2S1" truck
0. 017 due to "2S1"
truck
23 due to special 3-axle test truck with
induced impact
3. Continuous Span 74'-4^^" in length
1/17.7 0. 068 due to "2S2"
truck
0. 014 due to "3"
truck
0. Oil due to "2S1-2"
truck
18 due to special 3-axle test truck with induced impact
4. Simple Span 84'-3" in Ir ngth
1/20 0. 94 or 1/1080 of span
0 097 due to "2S2"
truck
0. 021 due to "3"
truck
0.009 due to "2S1"
truck
14 due to special 3-axle test truck with induced impact
5. Simple Span Approx. 84'-3"
1/20 0.94 or 1/1080 of span
0.135 due to "2S1-2"
truck
0. 030 due to "2-2"
truck
0. 012 due to "2S1-2"
truck
22 due to special 3-axle test truck with induced impact
6. Simple Span Approx. 76'-3" in length
1/18.1 0.82 or 1/1120 of span
0.106 due to "2S1-2"
truck
0.016 due to "2S2-2"
truck
0. 008 due to"2Sl-2"
truck
22 due to special 3-axle test truck with induced impact
7. Simple Span Approx. 81'-9" in length
1/19.4 0.89 or 1/1100 of span
0.112 dueto"2Sl-2"
truck
0.020 due to "2S2"
truck
0.006 due to "2S1-2"
truck
11 due to special 3-axle test truck
8 Simple Span Approx. 76'-lJs" in length
1/18.1 0.82 or 1/1120 of span
0.081 due to "2-2"
truck
0.020 due to "2S2"
truck
0. 0025 due to two 2-axle trucks side by side
8 due to special 3-axle test truck with induced impact
t ruck t i re passed over the cable. I t was in i t ia l ly intended that the deflections on eight spans would be taken simultane
ously and thus a direct comparison could be made between a l l spans. However, during the installation of the electronic equipment i t was found impossible to balance out the capacitance of the lead wires when they were over 150 feet long. Therefore, test data was gathered on four spans at one time, either Spans 1 through 4 or Spans 5 through 8.
Test Procedure
Normal Loading, Commercial Trucks. Data on deflections and vibrations of this bridge were obtained f o r normal truck t r a f f i c under the following testing procedure. At the Jackson Weighing Station, east of the bridge, the trucks were selected which would be passing over the test bridge. These were assigned test numbers, and axle loads and axle spacing measurements were obtained. At a convenient distance f r o m the bridge, the test trucks were stopped, the test truck numbers obtained, and the driver was instructed to fol low the painted stripe on the bridge which would place the center of the dual wheels on the load axles at 2 feet f r o m the curb face of the center median s t r ip . They were further instructed to travel over the bridge at approximately 35 mph. However, the east approach to the bridge has sufficient grade to prevent some trucks f r o m reaching the desired speed. As the truck approached the test spans, the recording

83
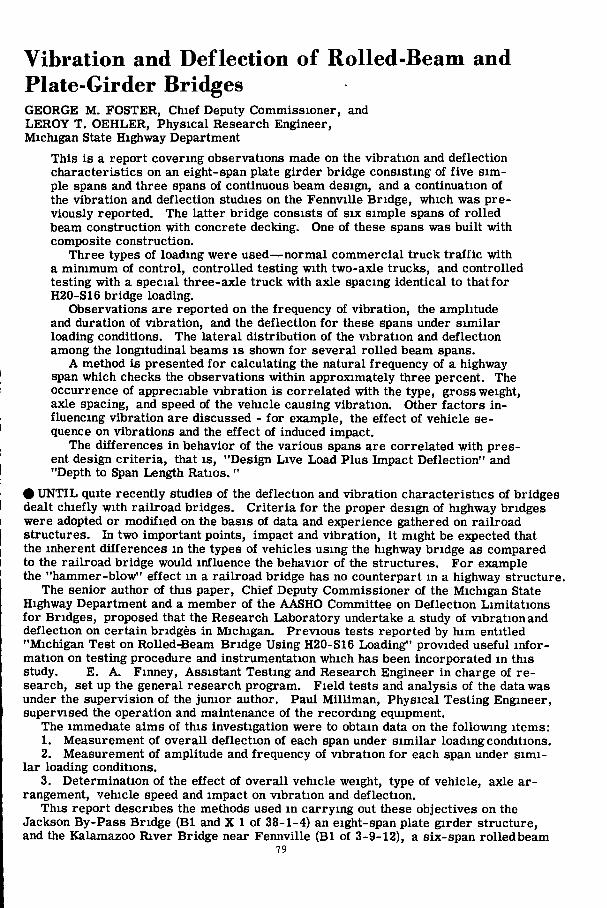
equipment was switched on and the data on vibrations and deflections were obtained for four of the eight spans at one time (see Figure 5). Sixty-four trucks were used for this phase of the study. These trucks varied from two-axle to six-axle vehicles with a distance between extreme axles of 11. 2 to 51. 2 feet. The gross weight of these vehicles varied from 5. 3 to 75. 3 kips and the speed range was from 16 to 42, 9 mph.
Figure 2. Defl ecton.eter used to measure the vibration and deflection at the center of the span.
Controlled Loadings, Two-Axle Trucks. In the controlled loading study, four county maintenance trucks were loaded and driven over the bridge at varied speeds, with and without boards on the spans to induce impact, and in definite dequence in certain cases, in an attempt to study some of the factors influencing vibration. All of these trucks were of the two-axle type with axle spacings of 13. 4 to 14. 7 feet and gross weights of 26. 5 to 28. 1 kips. Essential data on these trucks is given in Figure 6. The measurement of the static deflection was made for each span with each of the trucks respectively in the proper position on the span for the maximum effect. Previous to this testing phase, theoretical calculations of the natural frequency of the various spans had been made and the data on vibrations from the normal truck traffic had also been utilized to determine the natural frequency of the spans. Knowing the axle spacing of each truck, it was possible to calculate the speed for each ' truck for any given span, which would Figure 3. Wire, turnbuckle and 100-lb. cause the time interval between the first weight used for the purpose of holding the and second axle of the truck passing any hinged cantilever beam in position.

84
Figure 4. Hathaway recording oscillograph.
T A B L E 2
COMPARISON OF ACTUAL TO T H E O R E T I C A L D E F L E C T I O N FOR JACKSON BRIDGE SPANS
(Special three-axle test truck)
Span
Actual Deflection
Inches
Theoretical Deflection -
Inches
Ratio Actual/
Theoretical
2 4 5 6 7 8
0.087 0. 093 0. 093 0. 075 0. 086 0. 078
0. 228a 0. 216 0. 216 0. 193 0.212 0. 193
0.38 0. 43 0. 43 0.39 0.41 0. 40
FOx this three-span continuous structure, the effect of short additional cover plates over the center supports was neglected.
given point to be equal to the natural period of vibration of the span. This might result in a tendency to set up resonant vibrations in the span.'
Please refer to references.
85
It was intended that the trucks be driven over each span at speeds which might induce resonant vibrations (approximately 50 mph., but it varied with the axle spacing of the trucks and the natural frequency of the bridge spans) and at speeds more and less than this by 5 mph. However, only two of the trucks approached the calculated speeds and their speeds were generally 2 to 5 mph. less than required. In addition, tests were made with three vehicles in sequence with approximately twice the average axle spacing between vehicles. This was accomplished by placing the vehicles in line with ropes between, so that the drivers could gauge the distance apart of the vehicles by watching the sag in the ropes. The purpose of these runs was to establish a greater number of axle load repetitions which would be in phase. Also, tests were run with two trucks traveling across the bridge side by side. In both sets of tests just mentioned, the actual speeds were approximately 10 mph. less than the calculated resonant speed. Certain tests were also run with ^4-inch and 1^8-inch impact boards on the spans in order to measure the influence of these boards on the vibration of the spans.
Figure 5. A con.n;ercia] test truck passing over the bridge.
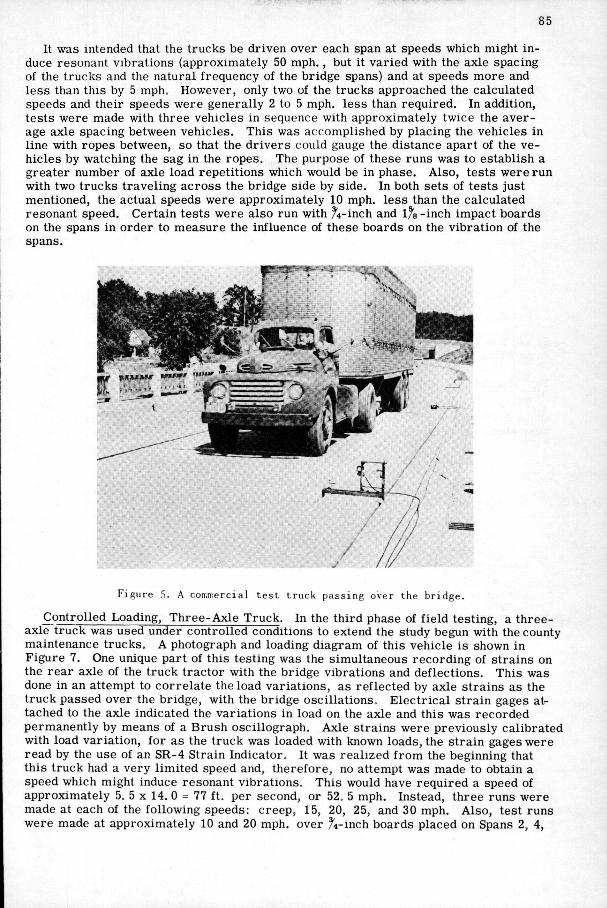
Controlled Loading, Three-Axle Truck. In the third phase of field testing, a three-axle truck was used under controlled conditions to extend the study begun with the county maintenance trucks. A photograph and loading diagram of this vehicle is shown in Figure 7. One unique part of this testing was the simultaneous recording of strains on the rear axle of the truck tractor with the bridge vibrations and deflections. This was done in an attempt to correlate the load variations, as reflected by axle strains as the truck passed over the bridge, with the bridge oscillations. Electrical strain gages attached to the axle indicated the variations in load on the axle and this was recorded permanently by means of a Brush oscillograph. Axle strains were previously calibrated with load variation, for as the truck was loaded with known loads, the strain gages were read by the use of an SR-4 Strain Indicator. It was realized from the beginning that this truck had a very limited speed and, therefore, no attempt was made to obtain a speed which might induce resonant vibrations. This would have required a speed of approximately 5. 5 x 14. 0 = 77 ft. per second, or 52. 5 mph. Instead, three runs were made at each of the following speeds: creep, 15, 20, 25, and 30 mph. Also, test runs were made at approximately 10 and 20 mph. over ft-mch boards placed on Spans 2, 4,

86
8 , 4 K I P S I 8 . , 0 K I P S
T O T A L
9 , 0 K I P S 1 7 , 9 K I P S
T O T A L , - I 2 6 9 K
[ T R U C K I I
10,1 K I P S I 8 . , 0 K I P S
T O T A L - 2 8
T R U C K 2
[ T R U C K 3 |
10,1 K I P S 17 . S K I P S
t O T A t .
T R U C K 4
Figure 6. Loading diagram of four county maintenance trucks used for controlled loading tests of Fennville Bridge.
5, and 7 to induce impact, and at 10, 15, 20, and 25 mph. over ifa-inch boards on the same spans.
Test Results
The oscillograph traces which recorded the movement of the center of the bridge spans gave a permanent record of the bridge vibration and deflection. These traces were studied to determine the magnitude of the bridge deflections and vibrations and
TABLE 3
SUMMARY OF OBSERVATIONS ON FREQUENCY OF VIBRATION
Ratio of Design Live Average Frequency of Significant Vibrabons Theoretical Natural %, Difference Depth to Load Plus ir Cyf let. / Sec. »̂ Frequency of Vib- of Theoretical
Span Impact De- Normal Controlled Loading ration in Cycles/ to Observed Second
Data on Spans Length flection in In. Loading 2-axle Trucks 3-axle Truck Average Frequency
1 Continuous Span 72'-6"in length
1/17.2 5.13 5. 22 None Significant
5 18 — - -
2 Continuous Span 92'-0" inlength
1/21 9 1 05 or 1/1050 of
Span
5.15 5 26 5. 25 5.22 4.86 6 9
3 Continuous Span 74'-1̂ 1!" inlength
1/17.7 5.14 5.25 None Significant
5 20
4 Simple Span 84'-3" in length
1/ZO 0. 94 or 1/1080 of
Span
5 48 5. 52 5. 46 5 49 5 46 0.6
5. Simple Span approx 84'-3" in length
1/20 0 94 or 1/1080 of
Span
5. 40 5.50 5. 52 5. 47 5. 46 0 2
6 Simple Span approx. 76'-3" in length
1/18 1 0 82 or 1/1120 of
Span
6 30 6 60 6.34 6 41 6.36 0.8
7 Simple Span approx. 81'-9" in length
1/19 4 0 89 or 1/1100 of
Span
5.93 6 01 5.85 5. 93 5.73 3 4
8. Simple Span approx. 76'-1)2" in length
1/18.1 0 82 None or 1/1120 of Significant
Span
None Significant
None Significant
None Significant
6 38 —
Note 3 - The average of test runs where at least 10 cycles of continuous vibration occurred after the truck had passed over the span.
87
10.05 K I P S 17.95 K I P S 2 2 . 0 0 K I P S
T O T A L - 5 0 . 0 K.
Figure 7. A photograph and loading diagram for the three-axle Walters test truck.
to determine the factors which influenced vibration. Table 1 contains information on the eight spans and two common design factors, that
is, "Ratio of Depth to Span Length of Girders, " and the "Design Live Load Plus Impact Deflection. " In addition, the observations on the maximum deflection, amplitude of vibration, and duration of vibration are shown. The amplitude of vibration while the truck was on the span (span loaded) and off the span (span unloaded) is treated separately. The maximum amplitudes of vibration are based only on trials without induced impact effects because under the effect of impact, much greater amplitudes resulted.
For this study it was necessary to separate the effects of bridge deflection and bridge vibration and, therefore, the deflection values given were obtained from the oscillograph trace by ignoring the periodic oscillation due to vibration and thus they represent the "crawl" deflection or static deflection only.
Observed Deflections. Maximum deflections for each span occurred as a result of

88
5 0 095
O 0 0S5
^ S P A N 4
r S P A N 5
N ^ ^ S P A N 7
^ S , . o S P A N 8
V S P A N 6
1/19 DEPTH TO SPAN LENGTH RATIO
Figure 8. Relation between observed deflect ion and depth to span length ratio (special three-axle test truck) .
; 0 090
P A N 4
- S P A N 5
P A N 4
- S P A N 5
S P A N 7
S P A N
^ S P A N 6
a on oso OSS 090 099 100 C A L C U L A T E D DESIGN LIVE LOAD P L U S IMPACT D E F L E C T I O N IN INCHE3
Figure 9. Relation between observed deflection and calculated design l i v e load plus impact def lect ion ( spec ia l three-axle tes t
t iuck) .
TRUCK N0.36jTYPE ' ^ - 2 " SPEED 38.5 FT/SEC SPAN 5
LOADED SPAN 8
SPAN 7
LOADED 0.080
7.200 14500 8^00
10.0— I* 14.8^ »\
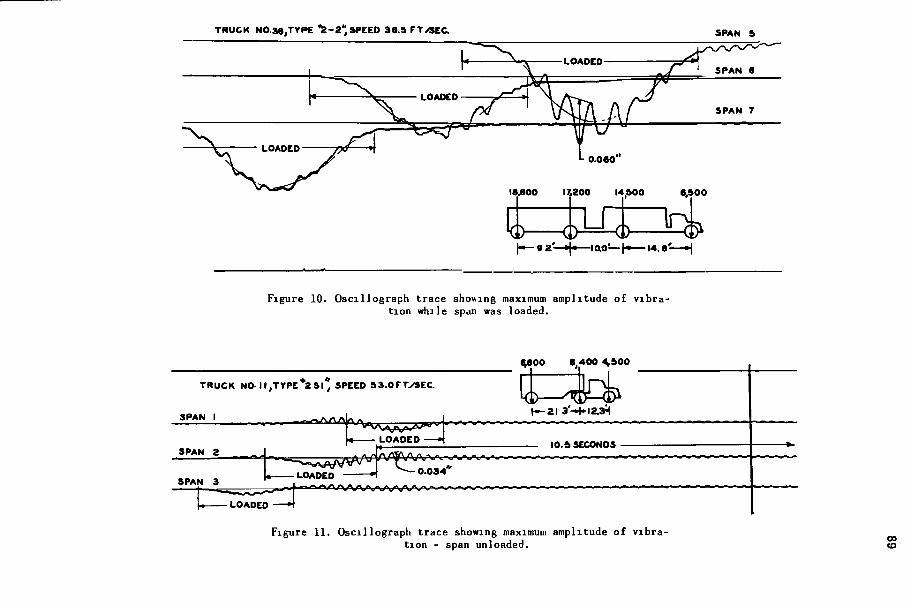
Figure 10. Oscillograph trace shoving maximum amplitude of v ibration while span was loaded.
TRUCK NO-11,TYPE*2 S I " SPEED SS.OFTySEC.
4800 8,400 4,t00
SPAN
LOADED
t — 2 1 3'-M»l2.3H
SPAN 2 10.5 SECONDS
SPAN 3 LOADED • 0 .034"
H LOADED
Figure 11. Oscillograph trace showing maximum amplitude of v ibration - span unloaded. 00
to

90
normal truck t r a f f i c . Span 5 deflected the most (0.135 inch) due to a single 2S1-2 type truck with an axle length of 36. 2 feet and a total load of 70. 4 kips. Since Spans 1 through 4 were subjected to one group of commercial trucks and Spans 5 through 8 to another set, the maximum deflection of Span 4 under normal loading was not as great as Span 5, although these spans are structurally almost identical.
Observed Deflections Compared to Theoretical Deflections. The maximum observed deflection fo r Span 5 was only 14. 4 percent of the deflection value for "Design Live Load Plus Impact, " but i t should be remembered that for design, lane live-load rather than the standard t ruck is used for a span of this length, and both lanes are loaded. Calculations indicate that theoretically (neglecting the stiffening effect of the concrete deck as I S customary) this truck would cause a deflection of 0. 312 inch. The special three-axle test t ruck caused a deflection on this span of 0. 093 inch while s imilar calculations would indicate a deflection of 0. 216 inch. Actual deflections are thus 43 percent in each case of the calculated deflections.
Table 2 compares the actual deflection with the theoretical deflection for the single spans and the continuous structure. The ratio of actual to theoretical deflection varies f r o m 39 to 43 percent for the single spans and is 38 percent for the three-span continuous structure.
I t w i l l later be shown that the concrete deck, acting with the steel plate girders, not only has a tendency to reduce the actual deflection but its stiffening effect is also reflected in the natural frequency of vibration of the spans.
It is interesting to compare the resulting deflections fo r the various simple spans, caused by a given vehicle and to correlate this with the two design considerations of "Depth to Span Length Ratio" and the "Calculated Design Live Load Plus Impact Def lect ion" values. This has been done in Figures 8 and 9 which il lustrate that nearly linear relationships do exist in this correlation as should be expected.
Maximum Amplitude of Vibration. The maximum amplitude of vibration fo r the various spans, fo r span loaded and unloaded, was caused by a commercial truck, in every case but one. Span 5 had the maximum amplitude of vibration with the truck on the span, 0. 030 inch (see Figure 10). However, the maximum amplitude of vibration, span unloaded (0. 017 inch), occurred on Span 2, the center span of the three-span continuous structure, due to a 2S1 truck (see Figure 11). The oscillograph trace shown in Figure 11 should be studied in detail because i t represents one of the best examples of harmonic vibration which was obtained in this study. A l l three spans of the continuous structure were vibrating regularly, with Spans 1 and 3 180 degrees out of phase with Span 2. The duration of this vibrating motion is also worthy of note. Suggestions as to the cause of this unusual example of vibration w i l l be duscussed under Factors In fluencing Vibration. In Figure 12, the relation fo r simple spans of the maximum observed amplitude of vibration, span unloaded, fo r the special three-axle test truck, is plotted against the "Depth to Span Length Ratio. "
Maximum Duration of Vibration. The maximum duration of vibration (29 seconds) occurred on Span 1, a part of the three-span continuous structure, due to the special three-axle test t ruck running over a ifs-inch thick board placed on Span 2 to cause an impact effect (see Figure 13). In every case but one, the maximum duration of vibration fo r each span occurred in this way. Span 1, however, vibrated in one case 25 seconds due to the special three-axle test t ruck passing over the bridge without induced effects.
Observed Frequency of Vibration. For a l l spans except Span 8, the use of the normal truck t r a f f i c and the two types of controlled loading effected sufficient occurrences of uniform harmonic vibration to obtain the natural frequency of these spans. To obtain the values fo r the Average Observed Frequency of Significant Vibrations, given in Table 3, only those cases were used where at least ten cycles of steady vibration had occurred. This eliminated cases where a few cycles of random vibration occurred which were markedly different in frequency f r o m the natural frequency of vibration fo r the span. As a result, the observed values were very uniform and compare very well with the Theoretical Natural Frequency of Vibration fo r the spans.
Calculated Natural Frequency of Vibration. In calculating the theoretical frequency, an etlective cross-section was used which included the two steel plate girders most

91
SPAN e
SP*N S
OtPTH TO 5MN LENGTH RATIO
F i g u r e 12. H e l a t i o n between observed maximum ampl iLui l e o f v i b r a t i o n and depth to span length rr f t io for s imple spans . (Spec
i a l t h r e e - a x l e t e s t t r u c k ) .
T A B L E 4
DAMPING C O E F F I C I E N T S OF VIBRATION JACKSON BY-PASS BRIDGE
Span Type Damping Span Coefficients
2 Three-span continuous plate girder 0. 004 4 Simple span plate girder 0. 012 5 Simple span plate girder 0. 009 6 Simple span plate girder 0, 010 7 Simple span plate girder 0. Oil 8 Simple span plate girder
affected by the passage of the truck, and 50 percent of the concrete deck above these two plate girders, which was considered as acting partially with the girders in composite action. These spans were not designed for composite action since shear developers were not used, but results of previous tests already published (2) have shown that the concrete deck does act to a limited extent as a part of the effective cross-section.
The formula for the natural frequency of a simple beam with a umform load is:
f 2V
g E I W
where:
386 inches per second.
I T = pi = 3.1416 L = length of span in inches g = acceleration of gravity =
per second E = modulus of elasticity of the material which was
assumed as follows:
E for steel = 30x10^ psi. E for concrete = 5x10® psi.
I = moment of inertia of the effective cross-section in inches*.
6
o

92
AVCRASe OBSERVCD F R E Q U E N C Y ^
^ T H E O R E T I C A L NAT JRAL F R E a u E N C Y
DEFTH TO 3MN LENGTH MTIO
F i g u r e 14. Average observed frequency and t h e o r e t i c a l n a t u r a l frequency of v i b r a t i o n compared to r a t i o o f depth to span l e n g t h -
for s imple spans.
W = weight of the uniform load in pounds per inch.
In calculating the natural frequency of vibration for the spans, the variation in moment of inertia. Due to the cover plates, was roughly taken into account by
^AVERAGE OBSEF
\ \ \ \
\ \ \ \
\ \ \ \
VED FREaUENCY
\ \ \ N
\ \
\ \
N. \ V \
N . \
\ \ \ \
THEOR ETICAL NATURAL F R E Q U E N C Y - ^
F i g u r e 15. Average observed frequency and t h e o r e t u c a l n a t u r a l frequency o f v i b r a t i o n compared to r a t i o o f des ign l i v e load p l u s
impact d e f l e c t i o n to span l ength .
assuming that the moment of inertia at the center half of the span was 20 percent greater than at the ends of the span, which is approximately true.
The difference between the theoretical and observed frequency was greatest for the three-span continuous structure but, for the simple spans, the largest difference was
T A B L E 5
E F F E C T OF INDUCED IMPACT AS CAUSED B Y A TRUCK RUNNING OVER A BOARD
(Three-axle test truck). Span 5
Max. Amplitude of Vibration - Inches
Test Condition
Truck Speed Ft. /Sec.
No Induced Impact 15. 5
Truck on
Span
0. 008
Truck off
Span
0. 002
Duration of Vibration
Seconds
8.1
Change in Effective
Axle Load Pounds
+1300
Induced Impact 3/4-inch Board 17.2 0. 034 0. 0025 10.3 +3800
Induced Impact 1-5/8-inch Board 16.9 0.081 0. 005 16.4 +6200
only 3. 4 percent and the average difference for the simple spans only 1. 2 percent. Figures 1" and 15 show the relation between the Average Observed Frequency of V i bration for the simple spans as compared to the "Ratio of Depth to Span Length," and the "Ratio of Design Live Load Plus Impact Deflection to Span Length."
Damping of Free Vibration. It is interesting to compare the damping of the free vibration for the various spans. A study of the decay in vibrations shows that the damping is very like Coulomb damping or friction damping, rather than the more con-

93 TABLE 6
SUMMARY OF OBSERVATIONS ON MAXIMUM DEFLECTION AND MAXIMUM AMPLITUDE AND DURATION OF VIBRATION
Data of Spans
Ratio of Depth to
Span Length
Design Live Load Plus Impact Deflection in In
Deflection in Inches Max. Amplitude of Vibration m inches. (Without Induced Impact Effect)
Max. Duration of Vibration in Seconds After Truck is Off the Span
Data of Spans
Ratio of Depth to
Span Length
Design Live Load Plus Impact Deflection in In
2-Axle Truck No. 3
3-Axle Truck
Max. Amplitude of Vibration m inches. (Without Induced Impact Effect)
Max. Duration of Vibration in Seconds After Truck is Off the Span
Data of Spans
Ratio of Depth to
Span Length
Design Live Load Plus Impact Deflection in In
2-Axle Truck No. 3
3-Axle Truck
Span Loaded Span Unloaded
Max. Duration of Vibration in Seconds After Truck is Off the Span
1 Simple Span 58'-5" in length. (Wes end of beams embedded in backwa.
1/19. 5 t
U).
0.855 or 1/820 of span
0.032 0.051 0.006 0.001 6 1
2. Simple Span 59'-3"in length.
1/19.8 0.896 or 1/790 of span
0.034 0. 053 0. 010 0.002 3.8
3. Simple Span 59'-3" in length. De-signedfor composite action. Shear developers used.
1/19.8 0.377 or 1/1880 of span
0.032 0.051 0.007 0.002 5.5
4. Simple Span 59'-3" m length.
1/19.8 0.896 or 1/1880 of span
0. 045 0.081 0. 012 0.002 3.9
5. Simple Span 59'-3" in length
1/19.8 0.896 or 1/790 of span
0.042 0. 073 0. 015 0.002 6.5
6. Simple Span 58'-5" in length. (Eas end of beams embedded in backwal
1
1/19. 5 t
1).
0.855 or 1/820 of span
0.036 0.061 0 012 0. 001 8.4
T A B L E 7
COMPARISON IN RANK OF STIFFNESS OF THE SIX F E N N V I L L E BRIDGE SPANS ON THE BASIS OF 1950 AND 1952-53 TESTS
Rank of Stiffness Based on Deflection
Span 1
Span 2
Span 3
Span 4
Span 5
Span 6
1950 Tests*
2
4
1
6
5
3
1952 Tests**
1.5
3
1.5
6
5
4
1953 Tests***
1.5
3
1.5
6
5
4
* Tests performed with special 3-axle truck with gross weight of 72 kips, reported in "Tests in Rolled-Beam Bridge Using H 20-S16 Loading", G. M. Foster, Highway Research Board, Research Report 14-B.
** Tests using 2-axle truck with a gross weight of 25 kips.
*** Tests using special 3-axle truck with a gross weight of 50 kips.
ventional viscous damping. Calculating the damping coefficients from experimental data on the basis of friction damping would be laborious and certain assumptions would be necessary. However, the damping coefficients may be calculated readily on the
94
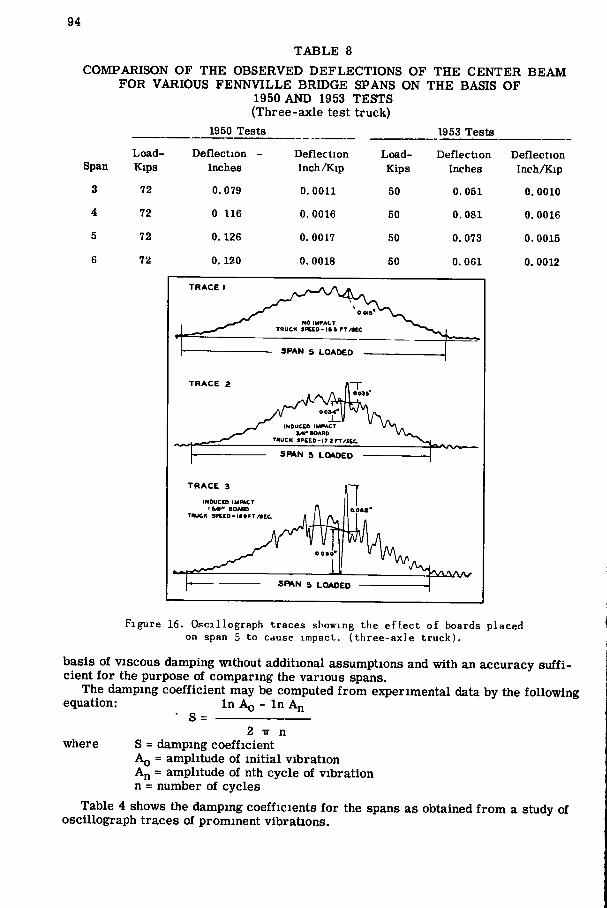
T A B L E 8 COMPARISON OF THE OBSERVED D E F L E C T I O N S OF THE C E N T E R BEAM
FOR VARIOUS F E N N V I L L E BRIDGE SPANS ON THE BASIS OF 1950 AND 1953 TESTS (Three-axle test truck)
1950 Tests 1953 Tests
Load- Deflection - Deflection Load- Deflection Deflection pan Kips Inches Inch/Kip Kips Inches Inch/Kip
3 72 0, 079 0. 0011 50 0.051 0. 0010
4 72 0 116 0.0016 50 0. 081 0. 0016
5 72 0. 126 0. 0017 50 0. 073 0. 0015
6 72 0.120 0, 0018 50 0. 061 0. 0012
T R A C E I
TRUCK
T R A C E 2
S P A N 5 L O A D E D
INDUCED [MPACT 3 ^ BOARD
TRUCK S P E E D - I 7 2 F T / 5 E C
T R A C E 3
INDUCED I M M C T I M " BOARD
TRUCK 5 P E E D - i a » F T / S E C
S R ^ N 5 L O A D E D
Sn^N 5 L O A D E D
a o i z
0 0 3 4
F i g u r e 16. O.sc i l lograph t r a c e s showing the e f f e c t of boards p l a c e d on span 5 to cause impact , ( t h r e e - a x l e t r u c k ) .
basis of VISCOUS damping without additional assumptions and with an accuracy sufficient for the purpose of comparing the various spans.
The damping coefficient may be computed from experimental data by the following equation: In A Q - In Ajj
• S = 2 IT n
where S = damping coefficient A Q = amplitude of initial vibration A„ = amplitude of nth cycle of vibration n = number of cycles
Table 4 shows the damping coefficients for the spans as obtained from a study of oscillograph traces of prominent vibrations.

95
Factors Influencing Vibration Type of Truck, Axle Spacing, and Truck ^eed. The type of truck appears to have
an effect on bridge vibration inasmuch as the axle spacing in combination with the truck speed influences the time period between axles passing a given point on the bridge span. This time period between axles, when related to the period of natural frequency of the structure, apparently affects the amplitude and duration of vibration. In the case of a two-axle truck the speed of the truck can be determined so that this time interval between the passage of the first and second axle is equal to the natural period of vibration of the bridge span. For commercial vehicles with more than two axles and non-uniform axle spacings, this time period between axles varies. If these time periods vary markedly, we might esqject a counter effect and a decrease in the amplitude of vibration.
Data gathered with the use of commercial trucks will first be used to discuss the significance of this timing. The maximum amplitude of free vibration (when the truck had passed off the span) and maximum duration of vibration for the continuous spans was caused by the passage of Truck No. 11 (see Figure 11). The next most significant vibration occurred due to Truck No. 8. Both trucks were of the 2S1 type and the speed and axle spacing between axles 2 and 3 gave a time period between axles of 0.397 and 0. 401 seconds. The natural period of vibration of this structure is 0.191 seconds, or approximately one-half of the time period between axles.
T R A C E I
2 N D A X L E O N SPAN 5
T R U C K S r C £ D - I S > F T / S E C 2 • K ft A A
/-^/^/V^/\/ \ / \ /W^^
T R A C E 2 2 N D A X L E O N S P A N 5
INDUCCO I M M C T
TRUCK S P C C D - I T S F T / 3 C C
T R A C E 3 2 N O A X L E O N S P A N 9
INDUCED IMRftCT I V S " BOARD
T R U C K J P I E D - n i r T / S E C
F i g u r e 17. Brush o s c i l l o g r a p h t r a c e s shoving the v a r i a t i o n i n e f f e c t i v e a x l e load wi th and without impact . ( H i r e e - a x l e t r u c k ) .
Note A l l three t r a c e s are not to the same s c a l e .
The other type of truck which caused the greatest amplitude and duration of free vibration was the 2S1-2. In general, the spacing of axles for this type is quite uniform. Truck No. 66 (2S1-2 type) caused the most significant vibrations on Spans 5 and 6, and the time periods between axles were as follows: (axle 1-2) 0. 223, (axle 2-3) 0.182, (axle 3-4) 0.173, (axle 4-5) 0.170 seconds. These time intervals are very close to the natural period for this span, which is 0.183 seconds. Another truck which caused significant vibrations on this span was No. 26 (2S1-2 type) with time intervals between axles of 0. 228, 0. 185, 0.195 and 0.189 seconds. On Span 6, Truck No. 66 was the most effective while No. 64 (2S1-2 type) was second. The time intervals betweenaxles

96
T A B L E 9 COMPARISON OF ACTUAL TO T H E O R E T I C A L D E F L E C T I O N OF F E N N V I L L E
BRIDGE SPANS (Special 3-axle test truck)
Span Actual
Deflection Inches
Theoretical Deflection
Inches
Ratio Actual /
Theoretical
1 0.051 0. 447 0.11
2 0.053 0. 476 0.11
3 0. 051 0.181 0.28
4 0. 081 0.476 0.17
5 0.073 0.476 0.15
6 0.061 0.447 0.14
for the latter truck were 0.190, 0.183, 0.161, and 0.175 seconds, while the natural period for the span was 0.156 seconds. Again, another 2S1-2 type truck caused the maximum duration of vibration on Span 7 with time intervals of 0. 228, 0.185, 0.194 and 0.189 seconds between axles as compared to the natural period for this span, which I S 0.169 seconds.
In studying the test data it appears that when this time interval between axles is nearly equal to or, in some cases, approximately one-half of the natural period of the structure, the vibrations are greater in amplitude and longer in duration. In connection with this, the uniform or nearly uniform axle spacing plays an important part for trucks with more than two axles. Generally, the importance of the first time interval between axle 1 and 2 is least, while the time between the last two axles is most important. There may be other variables besides the time interval between axles which play an important part in influencing vibration but this factor did seem to predominate.
The data gathered under controlled loading with two-axle trucks did not appear to reinforce the remarks made in the previous paragraph. There may be two reasons for this. First , the two-axle trucks were driven at maximum speed but the time interval between axles was always somewhat greater than the natural period of the bridge spans. Second, the trucks were loaded with approximately one-third of the total load on the front axle and two-thirds on the rear axle and thus the influence of the front axle may have been slight.
For controlled loading with the special three-axle truck, it was realized at the outset that it would not be possible to obtain sufficient speed to attest the previous remarks and, therefore, a considerable range in speed was used from creep speed to a maximum of approximately 30 mph.
Data from Spans 4 and 5 show that the maximum amplitude of bridge vibration while the truck was on the span or had passed off the span occurred with a truck speed of approximately 29 mph. This speed represents a time period between axles of 0.33 seconds while the natural period of vibration for these spans is approximately one-half of that, or 0.18 seconds.
A study of the vibration data gathered from the passage of commercial trucks over the bridge spans shows that, in general, a pair of tandem axles, especially when these are the last axles, appeared to reduce the amplitude and duration of free vibration. The effect of a pair of tandem axles on a vehicle such as a 2S-2 truck which is followed by two single axles does not appear to be as instrumental in reducing the amplitude and duration of free vibration.
Gross Truck Load. Another factor which has been analyzed for its effect on bridge

97
vibration is the total load of the truck. It would have been desirable in the testing procedure to use a given truck and vary the load on this truck while holding other variables, such as truck speed, constant. It was not possible to do this, however, for facilities were not available at the bridge site to change the load. During the normal load tests, the total loads of the trucks varied from 5. 3 to 75. 3 kips but these vehicles also varied in axle spacing and speed. Thus, the effect of total load appears to be masked by the influence of other variables. The two trucks causing the most significant vibrations on Spans 1, 2 and 3 had total loads of only 19. 5 and 18. 5 kips while the largest total load of any truck tested on these spans was 75.3 kips. For four of the five simple spans, trucks with total loads of less than 30 kips caused the most effect on the amplitude of free vibration and the duration of vibration.
Induced Impact. The effect of induced impact, caused by trucks running over boards placed on the span, was studied under controlled loading tests with two-axle and three-axle trucks. The effect of placing a single ?4 - inch board near the center of the span caused an average increase in maximum amplitude of bridge vibration, while the two-axle truck was on the span, of 27 percent; and for a ifa-inch board, 99 percent. The maximum recorded amplitude of bridge vibration for any span (0. 086 inch) occurred on Span 5 with the three-axle truck running over a ifs-inch board at a speed of 12. 4 mph. This maximum amplitude of vibration was 3. 3 times larger than the same maximum for this truck on Span 5 without simulated impact.
The influence of induced impact can also be i l lustrated by comparing the effect of the three-axle truck on the vibration of Span 5, without boards and with and ifs-inch boards and at approximately the same speed in each case. Table 5 makes this comparison and also shows the maximum effective axle load change recorded on the second axle of the truck as it passed over Span 5. Figure 16 is a copy of the three oscillograph traces of the test runs which are compared in Table 5, while Figure 17 shows the changes in effective axle load for the second axle on the same three test runs over Span 5. The effective axle load change was obtained by recording changes in bending strain on the axle by means of electrical strain gages. Prior to testing, this change in bending strain was calibrated with effective axle load change. The maximum change in effective load was ± 8, 900 lb, and occurred as the second axle of the truck struck a 1^8-inch board placed near the center of Span 7 while traveling at 17,2 mph. The maximum change without induced impact was 14 , 260 lb, and occurred on Span 5 with a truck speed of 31 mph.
't^ 41 O -C
c
c o-a m c u O 3
g »• 10
s ° s>
t>0 s o
— r f O O D m a
O o

98
Other Factors. Three test runs were made on Spans 1 through 4, and three on Spans 5 through 8, using 3 two-axle trucks in sequence with the distance between the rear axle of the first truck and the front axle of the next truck approximately twice the average axle spacing apart. An oscillograph trace of one of these test runs is shown in Figure 18. It was not possible to obtain maximum speed under these conditions but these test runs do have significance. Although they represent less than 15 percent of the test runs without the effect of impact, they provide the maximum duration of vi bration using two-axle county trucks for six of the eight spans and the maximum amplitude of vibration (span loaded condition) for five of the eight spans. Test runs with 2 two-axle trucks passing over the span while traveling side by side also increased the amplitude of vibration to a somewhat lesser degree.
For the three-span continuous structure test runs were also made with sufficient spacing between trucks so that Truck No. 1 would be at the center of Span 3 at the same time that the following truck passed the center of Span 1. This spacing did enhance vibration of the continuous spans and these test runs provided the maximum amplitude of vibration with two-axle test trucks for Spans 1 and 3 under both the span-loaded and span-unloaded conditions.
Discussion of Results
From the preceding data, the following conclusions should be emphasized as points of major importance:
1. The actual deflections of all spans were much less than the calculated deflections, generally about 40 percent of the calculated values.
2. Good correlation existed between the observed deflections of the simple spans TABLE 10
SUMMARY OF OBSERVATIONS ON FREQUENCY OF VIBRATION
Data on Spans
Ratio of Depth to
Span Length
Design Live Load Plus Impact Deflection in
Inches
Average Frequency of Significant Vibrations in Cycles / Second^
Theoretical Natural Frequency of Vibration in Cycles /Second
^ 0 Difference of Theoretical to Actual Frequency Ob
served
Data on Spans
Ratio of Depth to
Span Length
Design Live Load Plus Impact Deflection in
Inches 2-Axle Trucks 3-Axle Truck Average
Theoretical Natural Frequency of Vibration in Cycles /Second
^ 0 Difference of Theoretical to Actual Frequency Ob
served
1. Simple Span 58'-5" m length. (Wes end of beams embedded in backwal
1/19. 5 t
I).
0.855 or 1/820 of span
7.1 7.1 and 15.0
7.1 and 15.0
6.9 2.8
2. Simple Span 59'-3" in length.
1/19.8 0.896 or 1/790 of span
6.9 7.1 and 14.6
7.0 and 14.6
6.7 4.3
3. Simple Span 59'--3" in length. De-signedf or composite action -shear develqpers used.
1/19.8 0.377 or 1/1880 of span
7.0 6.9 and 14.9
7.0 and 14.9
7.2 2.9
4. Simple Span -59'-3" in length
1/19.8 0.896 or 1/1880 of span
6.9 and 14.2
6.9 and 14.0
6.9 and 14.1
6.7 2.9
5. Simple Span -59'-3" in length.
1/19.8 0.896 or 1/790 of span
6.8 and 14.1
6.9 and 13.9
6.9 and 14.0
6.7 2.9
6. Simple Span-58'-5" in length. (East end of beams embedded in backwall.)
1/19.5 0.855 or 1/820 of span
7.3 and 14.4
7.2 and 14.3
7.2 and 14.3
6.9 4.2
Note: • The average of test runs where at least 5 cycles of continuous vibration occurred after the truck had passed over the span.
5 ^ I I M men
DOUBLE BOLTED
» 9 ' - « ' '
IIEXP r ix l DOUBLE BOLTED
• 0 ^ 0 -
SWHAL SHEAR OEV
SINGLE M L T E D
Sffiio"
SINGLE BOLTED
S B - I D "
DOUBLE BOLTED
s s ' i o "
SINGLE BOLTED
5 , 4 ^
NOTE INTERMEDIATE DIAPHRAGMS
SPANS ^S S « t AT 1/3 POFNT SPANS a « 4 A T M POINT
SBTIHBER PILES
104 TIMBER PILES WITH METAL POIMrS
I ABUTMENT A |
S 9 TIMBER PILES n TIMBER RILES > » TiMBER RILES
" I ' l W I I I PIER W l I
NOTE A L L BEAMS J S V V W S *
I PIERN*i1 I PIER N . . I PIER M»S I
•STIUBER P U B
E L A W n A > « e 4 M l
B i / a r < i
J - B I ^ ^ S ^ . I / j i l
-1*-S L « ! -
M O R M A L m E L - S B S S i l
L C R O S S ^ e c m ^ ^ A B O T M E N ^
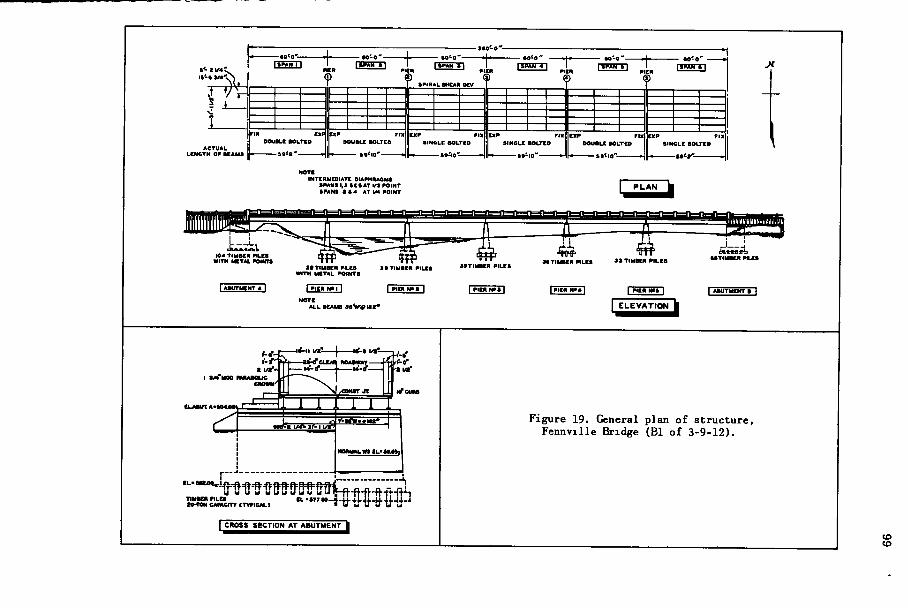
F i g u r e 19. Genera l p lan o f s t r u c t u r e , F e n n v i l l e Br idge ( B l o f 3 - 9 - 1 2 ) .
to

100
and the two present design criteria, "Depth to Span Length Ratio" and "Design Live Load Plus Impact Deflection. "
3. In general, the observed amplitude of vibration and duration of vibration increased with span flexibility, as might be expected.
4. The relatively simple method of calculating the natural frequency of vibration of a bridge span, previously proposed, gave excellent agreement with experimental data for the simple spans.
5. The amplitude of vibration and duration of vibration of a bridge span tended to increase when the time interval between axles passing a given point on the span very nearly coincided with the natural period of vibration of the span,
6. Several of the bridge spans, especially Spans 2, 4, and 5, although designed for a "Ratio of Live Load Plus Impact Deflection to Span Length" of 1 to 1000 or more, showed appreciable vibration. Even though the amplitude of vibration was actually quite small, it was very preceptible to a pedestrian on the bridge and may even become disconcerting.
7. A comparison of the center span of the continuous structure with the most flexible simple spans shows that the deflection and amplitude of vibration (span loaded) was less for the continuous structure, but the amplitude of vibration (span unloaded) and the duration of vibration was greater, and the damping coefficient of vibration was much less for the continuous structure.
T A B L E 11
DAMPING C O E F F I C I E N T S OF VIBRATION - F E N N V I L L E BRIDGE
Span Type Damping Coefficient
1 Simple Span - rolled beam 0.029
2 Simple Span - rolled beam 0.040
3 Sinqile Span - rolled beam with
composite design with deck. 0, 057
4 Sinqile Span - rolled beam 0.015
5 Simple Span - rolled beam 0.015
6 Sinq>le Span - rolled beam 0. 024 F E N N V I L L E BRIDGE
Description of Bridge Spans
This structure is composed of six simple spans of rolled beam concrete deck construction with a nominal span length of 60 feet. Seven lines of 36-inch wide flange beams are spaced 5 ft. 2 ) 4 in. on centers. The deck is of reinforced concrete construction with a variable slab thickness to provide the required crown at the center and to allow for dead load deflection of the beams. Fundamental information on this bridge is given in Figure 19. Singular features of the various spans are listed as follows:
Span 1 - West end of beams embedded in concrete backwall; two rows of diaphragms double-bolted to beams. Span length, center to center of bearings, is 58 ft. 5 in.
Span 2 - Three rows of diaphragms double-bolted. Span length is 59 ft. 3 in. Span 3 - Composite construction, using spiral shear developers; two rows of dia
phragms single-bolted. Span length is 59 ft. 3 m. Span 4 - Three rows of diaphragms single-bolted. Span length is 59 ft. 3 in. Span 5 - Two rows of diaphragms double-bolted. Span length is 59 ft. 3 m. Span 6 - Two rows of diaphragms single-bolted. The east end of the beams are
embedded in the backwall. Span length is 58 ft. 5 in.

101
F i g u r e 20. G e n e r a l v i e w o f F e n n v i l l e B r i d g e .
A general view of the bridge is shown in Figure 20. Since this bridge is located on a lightly traveled road and truck traffic is rather infrequent, it was considered feasible to test the bridge only under controlled loading conditions, using county maintenance trucks and the special three-axle test truck used for previously published tests (2) on this bridge.
Test Instrumentation
The same deflectometers were used for this bridge but the devices for fastening to the curb were removed and, instead, the deflectometers were fastened directly to the lower flange of the rolled beams (see Figure 21). This was readily possible here in-as much as the lower flanges of the beams were approximately 6 to 10 feet above the ground or water while, on the Jackson Bridge, the beams were 22 to 38 feet above the ground or water, and extensive scaffolding would have been necessary. The deflectometers were ordinarily placed on only the center beams of the seven longitudinal beams and at the center of the span. However, on Spans 1 and 4, deflectometers were placed on three to six of the other beams across the span in order to determine the lateral distribution of deflections and vibrations. Except for the above mentioned variations, the instrumentation was similar to that described for the Jackson By-Pass Bridge.
Test Procedure
Controlled Loading, Two-Axle Trucks. In the controlled loading tests on the Fennville Bridge, using county maintenance trucks, the testing program was similar to that of the Jackson Bridge. Figure 22 gives the loading diagrams for these trucks. The variation in axle spacing was 11. 7 to 13. 05 feet and in gross weight, 18. 12 to 24. 99 kips. All test runs were made with the trucks straddling the longitudinal center-line of the bridge. Since for every span, deflectometers were placed on the center beam, the trucks were directly above the beams for which vibrations and deflections

102
T A B L E 12 THE INFLUENCE OF INDUCED IMPACT ON THE MAXIMUM AMPUTUDE OF
VIBRATION (Special 3-axle test truck)
Maximum Amplitude of Vibration - Inches Percent Increase
Impact Due to: \%" Board Span No Impact 7^' Board l^s" Board Board \%" Board
1 0.0065 0. 0095 0. 0235 46 260 3 0. 007 0.012 0. 0225 72 220 4 0. 012 0. 013 0. 048 8 300
Average 42 260
were being obtained. Again on this program the trucks were to be driven at a speed which would make the time interval between the passing of the first and second axle equal to the natural period of bridge vibration. This time it was possible to approximate this speed on a few of the runs but even then the speed was somewhat less than intended. When the trucks followed one another in a definite sequence, the truck speed was well below the intended speed. Both the f^nA ifs-inch impact boards were also used in some of the test runs.
Controlled Loading, Three-Axle Truck. The special three-axle test truck was used under controlled conditions in the Fennville tests in a similar manner to that used on the Jackson By Pass Bridge. Effective axle load variation of the test truck was obtained simultaneously with bridge deflection and vibration. The axle loads were identical to those used during the testing of the Jackson Bridge (see Figure 7). Three runs were made at creep speed and at approximately 15, 20, 25, and 30 mph. Also, runs were made at approximately 15, 20, 25, and 30 mph. over % and 1%-mch impact boards on Spans 1, 3, and 4. The test vehicle approaching the ifa-inch impact board I S illustrated in Figure 23.
Test Results
Observed Deflections. A summary of the data on deflection, maximum amplitude and maximum duration of vibration is given in Table 6. A study of the deflection values shows an unusual variation between similar spans. The structural design of Spans 1 and 6 is quite similar but Span 6 has a greater deflection than Span 1. Also, Spans 2, 4, and 5 are nearly the same structurally except for the number of diaphragms and the amount of bolting of the diaphragms to the longitudinal beams. Previous tests on this bridge (2) m 1950, however, show the same variations between Spans 1 and 6 and between Spans 2, 4, and 5 but to a somewhat lesser degree. It might further be expected that Span 3 would have a smaller deflection value than shown, on the basis of the previous tests. However, a thorough study of the present test data fails to disclose any valid reason for doubting its accuracy. Also, it should be noted that the relative deflections between the spans for both the two-axle and the three-axle test truck are substantially in agreement.
A comparison of the tests reported here, conducted in 1952 and 1953, with the tests in 1950 indicate some changes m the rank of stiffness for the various spans. The gross loads used were not the same m the three tests, which might explain the slight changes m rank shown m Table 7. This table does show that the stiffness rank was identical for the 1952 and 1953 tests. However, a comparison of the 1950 tests with the 1952-53 tests would elicit the following remarks;
1. The stiffness rank of Span 3 has decreased relative to the other spans. 2. The stiffness rank of Spans 2 and 6 have been reversed. In the 1950 tests, deflection readings were not taken for the truck straddling the
longitudinal centerline of the bridge for all six spans. However, comparing the spans where readings were obtained gives the data shown in Table 8. This comparison indi-

103
cates that the deflection value per kip is very similar for the two tests for Spans 3 and 4, but the 1953 test values are smaller than the 1950 values for Spans 5 and 6, indicating a less flexible condition for these spans on the later tests.
Observed Deflections Compared to Theoretical Deflections. In Table 9, the actual deflections are compared to the calculated or theoretical deflection for the three-axle test truck. The theoretical deflection neglects the stiffening effect of the concrete deck which is common practice in design when composite construction is not used. For Span 3, with composite construction, the calculated deflection is based on an effective T -beam cross-section which includes the rolled beam and a 5 ft. 2}'4-in. width of concrete deck above the beam. The ratio of the modulus of elasticity of steel to concrete is considered as 6. The amount of the lane load considered as acting on one longitudinal beam is calculated on the basis of the distribution of wheel load to an interior longitudinal beam, as specified for design in the Standard Specifications for Highway Bridges as adopted by the AASHO. The smallest ratio of actual to calculated deflection was 0. 11 (Span 1) while the largest ratio was 0. 28 (Span 3).
Maximum Amplitude of Vibration. Due to the stiffer nature of the spans on the Fennville Bridge, it was much more difficult to instigate vibrations. These vibrations, when initiated, were not as great in amplitude and were much shorter in duration than on the Jackson Bridge. In addition, since this bridge is located in a rather isolated area and truck traffic is very light, it was not feasible to attempt to use commercial trucks for this study. This limited the type of trucks, the axle spacings, and the range in gross weight of the trucks to those which might economically be obtained for load testing. Perhaps the most stringent limitation was the number of axles, for it is believed that greater amplitude and duration of vibration might be obtained with trucks
F i g u r e 2 1 . De f 1 e c ton.e t e r i n s t a l l a t i o n , Span 4.

104
T A B L E 13
E F F E C T OF INDUCED IMPACT AS CAUSED BY A TRUCK RUNNING OVER A BOARD
(Three-axle test truck). Span 4
Amplitude of Vibration Span Loaded - Inches
Variation in Effective Axle Load - Pounds-
Test Condition Range Average * Range Average^
No Impact Impact due to Ji' Board
Impact due to l/s" Board
0. Oil to 0. 020
0. 010 to 0. 021
0. 024 to 0. 096
0. 015
0. 017
0. 052
+1500 to+2140
+2030 to +4600
+5950 to +9800
+ 1920
+ 3420
+ 7270
Percent Increase ? 4 " Board Percent Increase \%" Board
13
247
78
279
'^This is the average of four selected test runs for each test condition at truck speeds of 15-30 mph. where the truck speeds were almost the same for the three conditions of no impact, ^i" board and l^i" board.
3 75 K I P S 4 3 7 K I P S
TOTAL' I S 12 K
II 7^ •
4 10 K I P S IS 41 K I P S
1 19 51 K
^ I I 7 *
[ T R U C K l |
6 86 K I P S
I T R U C K 2 I
l « 3 3 K I P S
T d t t A t ' - \ \ 2 4 » 9 K
13 0 5 '
I T R U C K sl
Figure 22. Loading diagram of three county maintenance trucks used for controlled loading tests on Fennville Bridge.
having a greater number of axles. The maximum amplitude of vibration without induced impact was 0. 015 inch (see
Table 6) which occurred on Span 5 with the three-axle truck on the span traveling at a speed of 24. 5 mph. The maximum amplitude of vibration (span unloaded) was 0.002 inch which occurred on Spans 2,3, 4, and 5. The amplitudes of vibration with span unloaded were so small for all spans that the difference between spans is not significant.
Maximum Duration of Vibration. The maximum duration of vibration occurred on Span 6 due to the three-axle truck passing over an Impact board on Span 4. The reason for the effect of impact on one span influencing the behavior of another span is

105
F i g u r e 23. T h r e e - a x l e t e s t t r u c k a p p r o a c h i n g a 1 - 5 / 8 - i n c h b o a r d p l a c e d on the span t o cause impact.
not known at this time but its effect was definitely transmitted by some means - perhaps through the deck or the bridge piers. All spans appeared to be susceptible to the influence of impact on nearby spans. Figure 25 illustrates the vibration that takes place. Impact boards were placed on Spans 1 and 3. As the truck struck a ifg-inch board on Span 3, Spans 1 and 2 began to vibrate even though the truck had not yet reached these spans. This vibration then died out on Span 1 by the time the truck had reached the center of Span 2. As the truck struck the ifs-inch board on Span 1, Span 3, which had ceased to vibrate, began another series of vibrations.
Observed Frequency of Vibration. As a result of the stiffer nature of the Fennville Bridge spans and due to the fact that the truck types used for testing were limited, the occurrence of vibrations was much less frequent than on the Jackson Bridge. Sufficient cases of vibration occurred to establish the natural frequency of the bridge spans as given in Table 10, but these values are not as accurate as those obtainedfrom the Jackson Bridge. It should be noted that two values are given in most cases for the Average Frequency of Significant Vibrations. The second value is always approximately twice that of the first value. These bridge spans vibrated at either frequency and, in some cases, for a given test run they first vibrated at one frequency and later at the other. An oscillograph trace illustrating vibrations at both frequencies is shown in Figure 26. Since it was possible to work beneath the bridge, deflactometers were placed on all longitudinal beams on Spans 1 and 4. These data on the lateral distribution of the deflection and vibration sheds some light on the nature of these two frequencies of vibration. In every case where the span was vibrating at its natural frequency (approximately 7 cycles per second) all of the longitudinal beams in the span were vibrating in phase. However, in every case where the span was vibrating at approximately 14 cycles per second, the outside beams were vibrating 180 degrees out of phase with the center beam. Although these observations were made on only Spans 1 and 4, it is reasonable to expect that the same thing occurred on the other spans when they vibrated at these two frequencies.
Calculated Natural Frequency of Vibration. Theoretical calculations to obtain the natural frequency of vibration were made in a similar manner to those for the Jackson Bridge. Since the test trucks straddled the longitudinal centerline of the bridge, the center longitudinal beam and a width of concrete deck equal to the spacing between beams was considered in the computations. As before, when the spans were not

106
designed for composite action, the concrete deck was estimated to be only 50 percent effective. For the span designed for composite action (Span 3) the concrete deck was estimated to be 100 percent efficient in stiffening the structure. The calculated frequency was slightly less than the observed frequency for all spans except Span 3, indicating a stiffer structural condition than calculated. The average difference between calculated and observed frequency without regard to direction was 3.3 percent for these spans, while for the simple spans on the Jackson Bridge, this difference was only 1, 2 percent.
In the previous tests on this bridge conducted in 1950, vibrations occurred only while the truck was on the span. One reason for this was the limiting speed of 12 mph, due to the fact that the west bridge approach was not complete. The frequency of the vibrations varied from 2,12 to 2,85 cps. These frequencies were not close to the natural frequencies of the bridge spans. Recent tests indicate that the frequency of vibration with the span unloaded is much more uniform and generally very close to the natural frequency of vibration of the structure.
SOUTH B E A U NORTH K A M
srz
S o
*
S P A N
S P A N 4
" ' i " " " ' ' ^ « * " • " « » "<"• fU«CT10MlM PKOPERLr T n £ « E r o R E V A L U E S H O W N T O R I C A U • i s A N E S T I M A T E
• A S E O O N V A L U E S F O R A D J A C E N T R E A M S
F i g u r e 24. L a t e r a l d i s t r i b u t i o n o f d e f l e c t i o n ( t h r e e - a x l e t e s t t r u c k ) .
Damping of Free Vibration. The damping coefficients given in Table 11 may be considered only approximate, since the amplitude of vibration after the truck had passed off the span was very small and, often, vibration would decrease and then Increase again in magnitude in a recurring pattern. The damping coefficients for the spans of this rolled beam structure are definitely greater than for the spans of the plate girder bridge.
Factors Influencing Vibration
Type of Truck, Axle Spacing, and Truck Speed. It was not possible to establish the influence on vibration of some of the variables discussed previously on the other bridge. Here, the types of trucks for load testing were limited to the 2-D and the 2 SI , Thus, insufficient data was available to determine the effect of the type of vehicle on bridge vibration. In the case of the two-axle county maintenance trucks, a speed was attained in a few test runs where the time interval between the f irst and second axle passing a given point was only slightly more than the natural period of vibration for the spans. However, even though greater speeds were obtained with the two-axle trucks, the maximum amplitude of vibration was, in every case, obtained with the slower three-axle truck. The maximum amplitudes for each span ob-

107
ta ined w i t h the t w o - a x l e t r u c k s averaged only 36 percent of those obtained w i t h the t h r e e - a x l e t r u c k . I t i s t r u e that the t h r e e - a x l e t r u c k was s l i g h t l y m o r e than tw ice as heavy as the two-ax l e t r u c k s but i t appears f r o m the p rev ious data that the number of axles was m o r e i n f l u e n t i a l m causing the inc reased ampl i tude of v i b r a t i o n than was the weight of the t r u c k .
RIRST AXLC AT BOARD SPAN I BEAM A
3 PAW I MAM A
iWAH I aCAM C
SPAN I BEAM 0
SPAH I BEAM t
SPAN I BCAM r
SPAN I BEAM C -SPAN I LOADED-
F[RST AXLC AT BOARD
F i g u r e 2 5 . O s c i l l o g r a p h t r a c e i l l u s t r a t i n g t h e i n f l u e n c e o f i m p a c t e f f e c t s on one s p a n b e i n g t r a n s m i t t e d t o a d j a c e n t s p a n s .
T h r e e tes t r uns w i t h the t h r ee -ax l e t r u c k w e r e made at c reep speed and at a p p r o x i ma te ly 15, 20, 25, and 30 mph . wi thou t - impac t e f f ec t s . The m a x i m u m ampl i tude of v i b r a t i o n f o r the 6 spans o c c u r r e d f o r 2 spans a t a p p r o x i m a t e l y 30 m p h . f o r 3 spans at 25 mph . and f o r 1 span at app rox ima te ly 15 mph. However , the m a x i m u m d u r a t i o n of v i b r a t i o n f o r a l l 6 spans o c c u r r e d at a speed of a p p r o x i m a t e l y 30 mph . A t r u c k speed of 67 mph . wou ld have g iven a t i m e i n t e r v a l between the passage of the f i r s t and second, and second and t h i r d ax les equal to the average n a t u r a l p e r i o d of v i b r a t i o n of the 6 spans.
The tes t r uns where two t r u c k s passed over the b r i d g e spans i n a de f in i t e sequence tended to increase the ampl i tude of v i b r a t i o n w h i l e the span was loaded. T o a l esse r extent, the ampl i tude of v i b r a t i o n was also inc reased by two t r u c k s pass ing over the b r i d g e side by s ide.
Induced Impact . Impac t e f f ec t s produced by the t r u c k r u n n i n g over boards p laced on the span had a m a r k e d e f f ec t i n i n c r e a s i n g the ampl i tude of v i b r a t i o n . The m a x i m u m ampl i tudes obtained were 0. 048 and 0. 006 inches f o r the span-loaded and span-unloaded condi t ions . These o c c u r r e d w i t h the t h r ee -ax l e t r u c k pass ing over a l / s - i n c h b o a r d at 20, 2 and 21 .8 m p h . , r e spec t i ve ly . The in f luence of t h i s induced impac t i s qui te apparent i n Table 12 where the m a x i m u m ampl i tudes a re compared w i t h and w i t h out i m p a c t f o r the th ree spans where impac t e f f ec t s w e r e s tudied .
Another method of s tudying the e f f e c t of I m p a c t i s shown i n Tab le 13 w h i c h p resen ts the data f r o m 12 tes t r u n s w i t h the t h r ee -ax l e t r u c k . T h i s data compares the r e s u l t s of f o u r runs each w i t h no boa rd , f 4 - i n c h boa rd , and i f a - i n c h b o a r d at a l m o s t i d e n t i c a l speeds f o r the th ree tes t condi t ions . Such a c o m p a r i s o n indica tes that the average ampl i tude of v i b r a t i o n i s inc reased 13 percen t f o r the % - i n c h boa rd and 247 percent f o r the i f g - i n c h b o a r d w h i l e the inc reased v a r i a t i o n i n e f f e c t i v e axle load was 78 and 279 percent , r e spec t ive ly .
A study of the s t r a i n s on the second axle of the t r u c k d i sc losed that the range i n f r equency of load f l u c t u a t i o n v a r i e d f r o m 2. 48 to 3. 73 c p s . , and the m a x i m u m v a r i a t i o n i n e f f e c t i v e axle load wi thout i m p a c t was + 2900 l b . A c o m p a r i s o n between the m a x i m u m v a r i a t i o n i n e f f ec t i ve axle load as the t r u c k approached the b r i d g e and w h i l e i t was on the b r idge ind ica ted that the v a r i a t i o n was m o r e than tw ice as g rea t f o r the l a t t e r case.
L a t e r a l D i s t r i b u t i o n of De f l ec t i ons
The v a r i a t i o n i n d e f l e c t i o n of the seven long i tud ina l beams, w i t h the tes t load

108
T A B L E 14
COMPARISON O F INDICES FOR L A T E R A L D I S T R I B U T I O N
Span 1950 Tes t s^ 1952 T e s t s b 1953 Tests'^ 1 48 29 31 4 52 32 26
^ Tes t s p e r f o r m e d w i t h spec ia l 3 -ax le t r u c k w i t h g ross weight of 72 k i p s , r e p o r t e d i n "Tes t s i n R o l l e d B e a m B r i d g e Us ing H 20-S16 L o a d i n g , " G. M . Fos t e r , Highway Research B o a r d , Research Repor t 1 4 - B .
b Tes t s us ing 2-ax le t r u c k s . c Tes t s us ing spec ia l 3 -ax le t r u c k w i t h a g ross weigh t of 50 k i p s .
d i r e c t l y above the center beam, was obtained on Spans 1 and 4 f o r both the t w o - a x l e and th r ee -ax l e t r u c k loadings . F o r the two-ax l e t r u c k loading , de f l ec t ions were o b ta ined on f o u r o r f i v e of the seven beams w h i l e , on the t h r e e - a x l e t r u c k tes ts , d e f l e c -t o m e t e r s were p laced on a l l seven beams. I n the l a t t e r t e s t i ng , however , one d e f l e c -tome te r was found to be f a u l t y . The l a t e r a l d i s t r i b u t i o n of the beam d e f l e c t i o n i s shown i n F i g u r e 24 on the bas i s of the average values obtained f o r a l l tes ts w i t h the t h r e e - a x l e t r u c k wi thou t i m p a c t e f f ec t s .
I n the p r e v i o u s study of the F e n n v i l l e B r i d g e , i t was found advisable to compare the l a t e r a l d i s t r i b u t i o n on the spans by use of an index.
T h i s index i s the absolute s u m of the devia t ions of the pe rcen t of t o t a l def l e c t i o n o r s t r a i n f o r each beam f r o m 14 pe rcen t . I n other w o r d s , the d e f l e c t i o n index was f o r m e d by 1. s u m m i n g the r e c o r d e d de f l ec t ions f o r a l l seven beams under a c e r t a i n load cond i t ion and des ignat ing t h i s t o t a l as 100 percent ; 2. denot ing the d e f l e c t i o n on each beam as a pe rcen t of t h i s t o t a l de f l ec t i on ; 3. f i n d i n g the n u m e r i c a l d i f f e r e n c e f o r each beam between the pe rcen t of t o t a l d e f l e c t i o n and 14 percen t , s ince each beam w o u l d de f l ec t s l i g h t l y over 1 4 p e r -cent of the t o t a l d e f l e c t i o n i f the d i s t r i b u t i o n w e r e p e r f e c t ; and 4. s u m m i n g those devia t ions wi thou t r e g a r d to s ign to f o r m the index. (2)
Tab le 14 compares these ind ices f o r Spans 1 and 4 f o r the p r ev ious tes ts as w e l l as | the tes ts r e p o r t e d he re . The values f o r the 1952 and 1953 tes ts indicate a m o r e u n i f o r m d i s t r i b u t i o n of the d e f l e c t i o n than d i d the p r e v i o u s tes ts , f o r a p e r f e c t l y u n i f o r m d i s t r i b u t i o n w o u l d give an index of 0, w h i l e no d i s t r i b u t i o n wou ld r e s u l t i n an index of 170.
D i scus s ion of Resul t s
A f t e r a study of the tes t data on the F e n n v i l l e B r i d g e , the f o l l o w i n t po in t s a re apparent :
1 . T h i s r o l l e d beam s t r u c t u r e i s much s t i f f e r than assumed i n the design. When averaged f o r the s i x spans, the observed d e f l e c t i o n i s only 16 percen t of the ca lcu la ted d e f l e c t i o n f o r a g iven load .
2. The ampl i tude of v i b r a t i o n f o r t h i s b r i d g e i s so s m a l l tha t i t i s b a r e l y p e r c e p t i b l e to a p e r s o n on the b r i d g e .
3. A l l spans of t h i s b r i d g e v i b r a t e at the lowes t n a t u r a l f r e q u e n c y of the spans and at a f r equency a p p r o x i m a t e l y tw ice t h i s .
4. The proposed method of c a l cu l a t i ng the n a t u r a l f r equency of a b r i d g e span gave good agreement w i t h the observed f r equency of v i b r a t i o n .
5. The e f f e c t of su r face i r r e g u l a r i t i e s on the span, as s i m u l a t e d by boards p laced on the span, caused i m p a c t e f f ec t s wh ich inc reased the ampl i tude of v i b r a t i o n . F o r the t h i c k e r boa rd , t h i s increase was v e r y m a r k e d .
S U M M A R Y
C o m p a r i s o n of the T w o B r i d g e s
A genera l c o m p a r i s o n may be made of the two b r i d g e s on the bas i s of data obtained by the use of the spec ia l t h r e e - a x l e t r u c k , s ince t es t condi t ions w e r e v e r y s i m i l a r i n t h i s case f o r the two b r i d g e s . The average d e f l e c t i o n of the spans on the F e n n v i l l e

109
B r i d g e was 23 percen t less than the average d e f l e c t i o n of the s i m p l e spans on the Jackson B r i d g e . However , the average m a x i m u m ampl i tude of v i b r a t i o n on the Fenn-v i l l e B r i d g e was 48 percen t less f o r the span-loaded cond i t ion and 64 pe rcen t l e ss f o r the span-unloaded cond i t i on than tha t of the Jackson B r i d g e . On the Fennv iUe B r i d g e , the average f o r the spans of the m a x i m u m d u r a t i o n of v i b r a t i o n was 62 percen t l e ss than that of the Jackson B r i d g e .
I t should be noted that the average "Ra t io of Depth to Span Leng th" i s 1 to 1 9 . 1 f o r the Jackson B r i d g e spans and 1 to 19. 7 f o r the FennviUe B r i d g e spans, w h i l e the average "Ra t io of the Des ign L i v e Load P lus Impac t D e f l e c t i o n to Span Leng th" i s 1 to 1100 and 1 to 800, r e spec t i ve ly , exc lud ing the span w i t h s p i r a l shear deve lopers . Thus , i t i s apparent that between d i f f e r e n t types of s t r u c t u r e s (that i s , p la te g i r d e r to r o l l e d beam b r i d g e s ) , these two r a t i o s a re not adequate f o r c o n t r o l l i n g the m a g n i tude of b r i d g e v i b r a t i o n .
JPCCIM. T M « e -AXLE TEST TRUCK • K E 0 - 4 a f t r T / I C C ^ FREOOENCY I M - l a C H M M O ON i n w 4 I I s e r a . T J C P S
5 M H 4 BEAM A
SECOND AXLE AT U > A « 0 - „ | . ^ T H M O AXLE AT K M D FIRST AXLE AT BOARD-;
SFAN 4 BEAM B
SFAN 4 BEAM C
SFAN 4 BEAM F SRAN 4 BEjua^c
LOADED SPAN B LOADED-^
F i g u r e 2 6 . O s c i l l o g r a p h t r a c e i l l u s t r a t i n g t h e v i b r a t i o n o f S p a n 4 a t t w o f r e q u e n c i e s .
Genera l F ind ings
I t should be emphasized that the f o l l o w i n g conclus ions a re based on tes ts of on ly a f e w b r i d g e spans of each type and f u r t h e r r e s e a r c h o r m o r e extensive t e s t i ng may m o d i f y some of these concepts.
1. F o r the pla te g i r d e r s t r u c t u r e , good c o r r e l a t i o n ex i s t ed between the observed de f l ec t ions of the s i m p l e spans and the two c u r r e n t b r idge des ign c r i t e r i a .
2. The ampl i tude of v i b r a t i o n and the d u r a t i o n of v i b r a t i o n of a b r i d g e span tended to increase when the t i m e i n t e r v a l between axles pass ing a g iven po in t on the span v e r y n e a r l y co inc ided w i t h the n a t u r a l p e r i o d of v i b r a t i o n of the span. Thus , the type of t r u c k and i t s axle spacing, i n con junc t i on w i t h i t s speed, does have an e f f e c t on b r i d g e v i b r a t i o n .
3. The l a rges t r a t i o of m a x i m u m ampl i tude of v i b r a t i o n , wi thout induced impac t , to m a x i m u m d e f l e c t i o n f o r a g iven span was 0. 25 f o r the p la te g i r d e r s t r u c t u r e and 0. 21 f o r the r o l l e d b e a m s t r u c t u r e .
4. The m a x i m u m ampl i tude of v i b r a t i o n , w i t h induced impac t , approached and i n some cases exceeded the m a x i m u m d e f l e c t i o n f o r a g iven span.
F ind ings Pe r t i nen t to Des ign Concepts
1. I n both b r i d g e s t r u c t u r e s , the spans were much s t i f f e r than assumed i n the design. F o r a l l spans tested, the observed d e f l e c t i o n was a lways less than one-hal f of the va lue based on des ign ca lcu la t ions . The r a t i o of observed to ca lcu la ted d e f l e c t i o n was much s m a l l e r f o r the r o l l e d beam s t r u c t u r e than i t was f o r the pla te g i r d e r s t r u c t u r e .
2. The ampl i tude of v i b r a t i o n on the r o l l e d beam b r idge was s u f f i c i e n t l y s m a l l so that i t was b a r e l y pe rcep t ib l e to a pe r son on the b r i d g e . However , the ampl i tude of v i b r a t i o n on the pla te g i r d e r s t r u c t u r e was much grea te r ; i t was eas i ly pe rcep t ib l e and cou ld be cons idered d i s c o n c e r t i n g to a pedes t r i an on the b r i d g e .
3. The method p r e v i o u s l y d iscussed of comput ing the n a t u r a l f r equency of v i b r a t i o n f o r non-compos i te spans o n the bas i s of an e f f e c t i v e c r o s s - s e c t i o n , w h i c h inc ludes 50 percent of the concre te deck above the beam, and the beam o r p la te g i r d e r (100

l i O
percent of the concrete deck f o r compos i te spans), gave an average e r r o r o f s l i g h t l y over 2 percent when compared to the observed n a t u r a l f r equency .
4. I f the two p resen t design c r i t e r i a a re used as a means of p r even t ing undes i rab le b r i d g e v i b r a t i o n , then separate l i m i t i n g values a re r e q u i r e d f o r p la te g i r d e r and r o l l e d beam s t r u c t u r e s .
5. A be t te r means of c o n t r o l l i n g undes i rab le b r idge v i b r a t i o n i s by l i m i t i n g the na tu r a l f r equency of v i b r a t i o n of the b r idge span. (The method p r e v i o u s l y proposed f o r comput ing the n a t u r a l f r equency of v i b r a t i o n i s a r e l a t i v e l y s imp le computa t ion and yet possesses s u f f i c i e n t accuracy f o r des ign pu rposes . ) On the bas is of these tes ts , i t appears that i f the n a t u r a l f r equency of the span i s l i m i t e d to a value g rea te r than 6. 5 c p s . , the ampl i tude of v i b r a t i o n w i l l be s u f f i c i e n t l y s m a l l to p revent pedes t r i an d i s c o m f o r t o r uneasiness. M o r e f l e x i b l e s t r u c t u r e s than th i s a r e e n t i r e l y adequate s t r u c t u r a l l y , but the psycho log ica l r e a c t i o n of pedes t r ians to m o r e f l e x i b l e s t r u c t u r e s may w a r r a n t such a l i m i t a t i o n i n c e r t a i n cases.
References 1. N o r m a n , R. G . , " V i b r a t i o n of a Highway B r i d g e , " New Zealand Engineer ing ,
M a r c h 15, 1950, pp. 239-243. 2. F o s t e r , G. M . , Tes t on R o l l e d Beam B r i d g e Us ing H20-S16 Loading , Highway
Research B o a r d , Research Repor t 1 4 - B , Washington, D . C . , 1952. 3. Hansen, H . M . , and P . F . Chenea, Mechanics of V i b r a t i o n , New Y o r k , 1952,
John Wi l ey and Sons, Inc . 4 . T imoshenko , S. , V i b r a t i o n P r o b l e m s m Eng inee r ing , New Y o r k , 1937, D . Van
Nos t rand Company, Inc . 5. Thomson , W. T . , Mechan ica l V i b r a t i o n s , New Y o r k , 1948, P r e n t i c e - H a l l , Inc .