Very High Resolution Mapping with the Pléiades Satellite...
11
American Journal of Remote Sensing 2018; 6(2): 89-99 http://www.sciencepublishinggroup.com/j/ajrs doi: 10.11648/j.ajrs.20180602.14 ISSN: 2328-5788 (Print); ISSN: 2328-580X (Online) Very High Resolution Mapping with the Pléiades Satellite Constellation Roland Perko 1, * , Hannes Raggam 1 , Mathias Schardt 1 , Peter Michael Roth 2 1 Institute for Information and Communication Technologies, Joanneum Research, Graz, Austria 2 Institute of Computer Graphics and Vision, Graz University of Technology, Graz, Austria Email address: * Corresponding author To cite this article: Roland Perko, Hannes Raggam, Mathias Schardt, Peter Michael Roth. Very High Resolution Mapping with the Pléiades Satellite Constellation. American Journal of Remote Sensing. Vol. 6, No. 2, 2018, pp. 89-99. doi: 10.11648/j.ajrs.20180602.14 Received: August 16, 2018; Accepted: November 13, 2018; Published: December 24, 2018 Abstract: The Pléiades satellite constellation provides very high resolution multi-spectral optical data at a ground sampling distance of about 0.7 m at nadir direction. Due to the highly agile pointing angle capacity in the range of ±47 degrees the sensors are optimal for detailed earth observation. They are able to collect stereo and tri-stereo datasets in one overflight with a swath width of 20 km. Such images allow 3D mapping of any region on the Earth’s surface at very high resolution with high accuracy, where the reconstruction of the heights is based on along-track stereo. This work presents methodologies and workflows within the fields of remote sensing and computer vision that are used (1) to densely reconstruct digital surface models (DSM), (2) to derive digital terrain models (DTM), and (3) to generate multi-spectral ortho-rectified products. Within this process, the accuracy of the geometric sensor models, given as rational polynomial coefficient (RPC) models, plays a crucial role. Therefore, an assessment is performed on two distinct test sites discussing the initial 2D geo-location accuracy of the given sensor models. An optimization scheme is presented to adjust the given RPC models yielding 3D geo-location accuracies of 0.5 m in planimetry and 1 m in height. In the frame of surface model generation important issues like epipolar rectification, hierarchical stereo matching, and fusion of heights are reported. The main outcomes are that the sensor accuracy is within the range as defined by Astrium, but that a sensor model optimization is obligatory when it comes to highly accurate 3D mapping. The presented workflow generates mapping products with a GSD of 0.5m. The derived DSMs and DTMs show a high level of detail, thus enabling varying applications on a large scale, like land cover and land use classification, change detection, city modelling, or forest assessment. Keywords: Pléiades, Sensor Model, Accuracy Analysis, 3D Mapping, Digital Surface Model, Digital Terrain Model 1. Introduction The Pléiades satellite constellation is a dual system comprising the two identical satellites Pléiades-1A and Pléiades-1B. They have been launched in December 2011 and in December 2012, respectively, both providing very high resolution (VHR) image data (where VHR is defined for resolutions or ground sampling distances below 1 m). The satellites operate in the same orbit with an offset of 180 degrees to offer a daily revisit capacity. They are supplied with a remarkable agility, as the pointing angles can be triggered in a range of ±47 degrees (standard mode ±30 degrees). The sensors are capable of acquiring a panchromatic band (470-830 nm) with 0.7 m ground sampling distance (GSD) at nadir and four multi-spectral bands (blue: 430-550 nm; green: 500-620 nm; red: 590-710 nm; near infrared: 740-940 nm) with 2.8 m GSD. The swath width of Pléiades image data is 20 km on ground [1-3]. The satellite agility is of importance with respect to 3D data extraction from the Pléiades image data. Similar to the present very high resolution missions of Ikonos, Quickbird, Worldview, or GeoEye, stereo data can be acquired during one overflight (single pass) through appropriate forward and backward arrangement of the sensor. A significant innovation and advantage of Pléiades, however, is the capability to acquire even three images for an area, taken from the same orbit at along track forward-, nadir-, and backward-view of the
Transcript of Very High Resolution Mapping with the Pléiades Satellite...

American Journal of Remote Sensing 2018; 6(2): 89-99 http://www.sciencepublishinggroup.com/j/ajrs doi: 10.11648/j.ajrs.20180602.14 ISSN: 2328-5788 (Print); ISSN: 2328-580X (Online)
Very High Resolution Mapping with the Pléiades Satellite Constellation
Roland Perko1, *
, Hannes Raggam1, Mathias Schardt
1, Peter Michael Roth
2
1Institute for Information and Communication Technologies, Joanneum Research, Graz, Austria 2Institute of Computer Graphics and Vision, Graz University of Technology, Graz, Austria
Email address:
*Corresponding author
To cite this article: Roland Perko, Hannes Raggam, Mathias Schardt, Peter Michael Roth. Very High Resolution Mapping with the Pléiades Satellite Constellation. American Journal of Remote Sensing. Vol. 6, No. 2, 2018, pp. 89-99. doi: 10.11648/j.ajrs.20180602.14
Received: August 16, 2018; Accepted: November 13, 2018; Published: December 24, 2018
Abstract: The Pléiades satellite constellation provides very high resolution multi-spectral optical data at a ground sampling distance of about 0.7 m at nadir direction. Due to the highly agile pointing angle capacity in the range of ±47 degrees the sensors are optimal for detailed earth observation. They are able to collect stereo and tri-stereo datasets in one overflight with a swath width of 20 km. Such images allow 3D mapping of any region on the Earth’s surface at very high resolution with high accuracy, where the reconstruction of the heights is based on along-track stereo. This work presents methodologies and workflows within the fields of remote sensing and computer vision that are used (1) to densely reconstruct digital surface models (DSM), (2) to derive digital terrain models (DTM), and (3) to generate multi-spectral ortho-rectified products. Within this process, the accuracy of the geometric sensor models, given as rational polynomial coefficient (RPC) models, plays a crucial role. Therefore, an assessment is performed on two distinct test sites discussing the initial 2D geo-location accuracy of the given sensor models. An optimization scheme is presented to adjust the given RPC models yielding 3D geo-location accuracies of 0.5 m in planimetry and 1 m in height. In the frame of surface model generation important issues like epipolar rectification, hierarchical stereo matching, and fusion of heights are reported. The main outcomes are that the sensor accuracy is within the range as defined by Astrium, but that a sensor model optimization is obligatory when it comes to highly accurate 3D mapping. The presented workflow generates mapping products with a GSD of 0.5m. The derived DSMs and DTMs show a high level of detail, thus enabling varying applications on a large scale, like land cover and land use classification, change detection, city modelling, or forest assessment.
Keywords: Pléiades, Sensor Model, Accuracy Analysis, 3D Mapping, Digital Surface Model, Digital Terrain Model
1. Introduction
The Pléiades satellite constellation is a dual system comprising the two identical satellites Pléiades-1A and Pléiades-1B. They have been launched in December 2011 and in December 2012, respectively, both providing very high resolution (VHR) image data (where VHR is defined for resolutions or ground sampling distances below 1 m). The satellites operate in the same orbit with an offset of 180 degrees to offer a daily revisit capacity. They are supplied with a remarkable agility, as the pointing angles can be triggered in a range of ±47 degrees (standard mode ±30 degrees). The sensors are capable of acquiring a
panchromatic band (470-830 nm) with 0.7 m ground sampling distance (GSD) at nadir and four multi-spectral bands (blue: 430-550 nm; green: 500-620 nm; red: 590-710 nm; near infrared: 740-940 nm) with 2.8 m GSD. The swath width of Pléiades image data is 20 km on ground [1-3].
The satellite agility is of importance with respect to 3D data extraction from the Pléiades image data. Similar to the present very high resolution missions of Ikonos, Quickbird, Worldview, or GeoEye, stereo data can be acquired during one overflight (single pass) through appropriate forward and backward arrangement of the sensor. A significant innovation and advantage of Pléiades, however, is the capability to acquire even three images for an area, taken from the same orbit at along track forward-, nadir-, and backward-view of the

90 Roland Perko et al.: Very High Resolution Mapping with the Pléiades Satellite Constellation
sensor and through the possibility of an across-track swipe. Such image triplets are also denoted as tri-stereo datasets. First assessments of the benefit of such arrangements have been made in [4] with respect to image triplets composed from multi-sensor and multi-temporal acquisitions, respectively.
Obviously, the swath length that can be acquired for a predefined base-to-height (B/H) ratio is limited and shorter for a triplet than for a stereo acquisition (e.g., 60 km vs. 175 km at a B/H-ratio of 0.4). However, large B/H-ratios, tentatively in the order of 0.7 to 1.0, should be aspired with regard to 3D mapping applications. Then, swaths with a length of up to about 200 km can be well acquired in tri-stereo mode.
In the context of 3D mapping applications the geo-location accuracy, which is inherent to or can be achieved for the image data being used, is of importance. For Pléiades products an a-priori geo-location accuracy in the order of 8.5 m CE90 only was proposed. Improvement, on the one hand, was expected from a recalibration of the Pléiades-1A satellite and can be on the other hand achieved through sensor model optimization using ground control points (GCPs).
This paper deals with a detailed accuracy assessment of panchromatic Pléiades image data for two test sites, where one is covered by a tri-stereo, whereas for the other only a pure stereo acquisition was used. The study contains an assessment of the 2D geo-location accuracy, employing the initial sensor models as well as optimized sensor models, and an assessment of the 3D mapping accuracy involving both stereo as well as tri-stereo datasets. Another focus of this paper is the extraction of dense digital surface models (DSM) and digital terrain models (DTM) from Pléiades image data, covering both theory and practical applications. DSMs extracted from stereo as well as tri-stereo datasets are presented, and first validation results achieved from a comparative analysis with reference LiDAR DSMs/DTMs are included. A scheme of such an end-to-end processing chain is shown in Figure 1. The whole study is performed with the commercial software package Remote Sensing
Software Graz (RSG)1, which was designed and implemented at JOANNEUM RESEARCH. It should be noted that the presented workflow was also already successfully applied by other research groups (e.g., in [5] or in [6]).
Figure 1. End-to-end 3D mapping workflow for tri-stereo Pléiades images.
2. Input Datasets
2.1. Test Sites and Pléiades Image Datasets
Two test sites were considered for this study, located in Trento (Italy) and Innsbruck (Austria), both showing
1 http://www.remotesensing.at/en/remote-sensing-software.html
mountainous topographic characteristics. The Trento test site covers rural as well as mountainous terrain, where the ellipsoidal heights range from 175 to 1550 meters, and spans over an area of 220 km2. A Pléiades-1A triplet was acquired, which, however, is far from being optimal for 3D reconstruction, since the first two images have a very small intersection angle of only 5.5°, while the second stereo pair has a huge intersection angle of 27.3°. For the Innsbruck test site, only a stereo acquisition from the Pléiades-1A satellite was available. This set was taken after the launch of Pléiades-1B and thus after the recalibration of the Pléiades-1A satellite. According to Astrium the 2D geo-location accuracy for this dataset should thus have improved. The test site covers urban, rural, and mountainous terrain, with ellipsoidal heights ranging from 560 to 2750 meters, and spans over an area of 435 km2.
All images were acquired with platform PHR 1A, in acquisition mode PX and spectral processing PA. Acquisition parameters of the image data, like along, across, and overall incidence angle are summarized in Table 1. In this study, only the VHR panchromatic bands are used, which originally are acquired with a GSD of 0.7 to 0.77 m, but always are delivered with an upsampled GSD of 0.5 m (2.0 m for multi-spectral bands). Pan-sharpening was just performed to allow a multi-spectral true ortho-image generation.
Figure 1 shows maps of the regions, ortho-rectified products, densely reconstructed DSMs and DTMs derived by our proposed method. The ortho-rectified products are generated from the pan-sharpened Pléiades IMG1 data, visualized as color-infrared (CIR) illustration for Trento and as true color RGB for Innsbruck. It is clearly visible that both test sites cover difficult terrain from urban areas to steep mountainous zones.
Table 1. Acquisition parameters of the Pléiades data.
Test site
acqu. date Name Time
Incidence Angles [°]
Across Along Overall
Trento 11-09-2011
IMG1 10:14:23.5 14.68 -16.86 21.83 IMG2 10:14:33.3 13.34 -11.25 17.20 IMG3 10:15:18.8 7.00 15.74 17.09
Innsbruck 13-07-2013
IMG1 10:16:41.4 8.96 -11.72 14.60 IMG2 10:17:25.8 2.35 14.48 14.66
Since the incidence angles of Pléiades images are given for across track (roll, r), for along track (pitch, p), and for the combined overall angle, we first define the two vectors v1 and v2. Then they are used to compute the stereo intersection angle δ (also called the convergence angle [9]) between two Pléiades scenes and accordingly their base-to-height ratio (B/H):
v1 = (tan(p1), tan(r1), 1)T (1)
v2 = (tan(p2), tan(r2), 1)T (2)
δ = acos((v1 ⋅ v2)/(|v1|⋅|v2|)) (3)
B/H = 2 tan (δ/2) (4)
In general, Eqs. (1)–(4) are a very useful tool when ordering data from the Pléiades catalogs as the intersection angle and the B/H ratio are not explicitly given.

American Journal of Remote Sensing 2018; 6(2): 89-99 91
2.2. Reference Data
For both test sites, airborne LiDAR DSMs were available as reference datasets (for Innsbruck also the LiDAR DTM was available), collected in 2006 and 2007 at 1.3 points/m2 for the Trento and at 2.0 points/m2 for the Innsbruck test site, respectively. The LiDAR DSMs are available as raster data in UTM 32 North map projection and WGS 84 datum at 1 m GSD with ellipsoidal heights and could be further used to measure GCPs. 3D discontinuities in the LiDAR data can be used to define and manually measure ground coordinates with a sufficiently high accuracy, i.e., with an estimated measurement error of less than 1 m. The purpose of GCP measurement was
1. to validate the quality of the initial Pléiades sensor models as provided along with the image data,
2. to optimize the Pléiades sensor models by means of least squares parameter adjustment procedures, and
3. to assess the 3D mapping potential of Pléiades stereo and triplet acquisitions.
In order to get a representative feedback on these issues, a fairly high number GCPs, homogeneously distributed in planimetry and height, were measured. Targets like road intersections, corners of houses, water bodies, or field boundaries served as candidates. Thus, for Trento and Innsbruck 21 and 30 points were acquired, respectively. Obviously, it would be beneficial to have terrestrial measured reference GCPs at high accuracy. However, such data were not available for this study.
Since the manual measurement of GCPs is the main bottleneck in the mapping procedure automatic procedures are envisaged in future. Our idea is to define a GCP-chip database such that ground control points could be retrieved therefrom automatically via area based image matching (also SAR-based GCP-chips are an option [7-8]).
3. Validation and Optimization of Sensor
Models
Validation of the geo-location accuracy can be realized via residuals of GCPs, which can be determined by means of the available sensor model. Therefore, first, the transformation of the map to the image coordinates, is computed. Then, point residuals in along and across track direction are determined, which represent the differences between the transformation results and the measured pixel coordinates.
3.1. Initial Geo-location Accuracy
The geo-location accuracy inherent to Pléiades panchromatic imagery is reported to be 8.5 m CE90 at nadir direction and 10.5 m CE90 within 30 degrees off-nadir when applying the provided rational polynomial coefficient (RPC) model [1].
For validation, these RPCs were used to determine “initial” residuals for all image datasets, representing the initial geo-location accuracy. The mean values as well as the standard deviations of across (x) and along (y) track pixel residuals are summarized in Table 2. Considering the 0.5 m GSD of the Pléiades image data, the geo-location accuracy of the Trento
dataset is up to about 18 pixels or 9 meters, which fairly well corresponds to the stated 8.5 m CE90. For the Innsbruck dataset, a geo-location accuracy of up to 10 pixels, corresponding to about 5 meters, is achieved. Sensor recalibration of Pléiades-1A could be the reason for this improvement, which on the other hand, is not sufficient to fulfil precision mapping requirements. However, it should be noted that the standard deviation residual values in along-track direction (y) have remarkably improved for the Innsbruck dataset.
Figure 2. The two test sites (left: Trento; right: Innsbruck): (a) topographic
map (opentopomap.org (CC-BY-SA)), (b) ortho-images (Trento CIR,
Innsbruck RGB), (c) relief shaded DSMs, and (d) relief shaded DTMs. (b-d)
were produced employing the proposed & implemented mapping workflow.
This is of importance with respect to 3D mapping, as height accuracy, in general, is more severely affected by along-track pixel errors.
It further should be noted that the initial mean error values are diverse for the two test sites with respect to sign and order
92 Roland Perko et al.: Very High Resolution Mapping with the Pléiades Satellite Constellation
of magnitude. Thus, the a-priori geo-location accuracy of Pléiades cannot be calibrated globally, e.g., by an appropriate pixel shift.
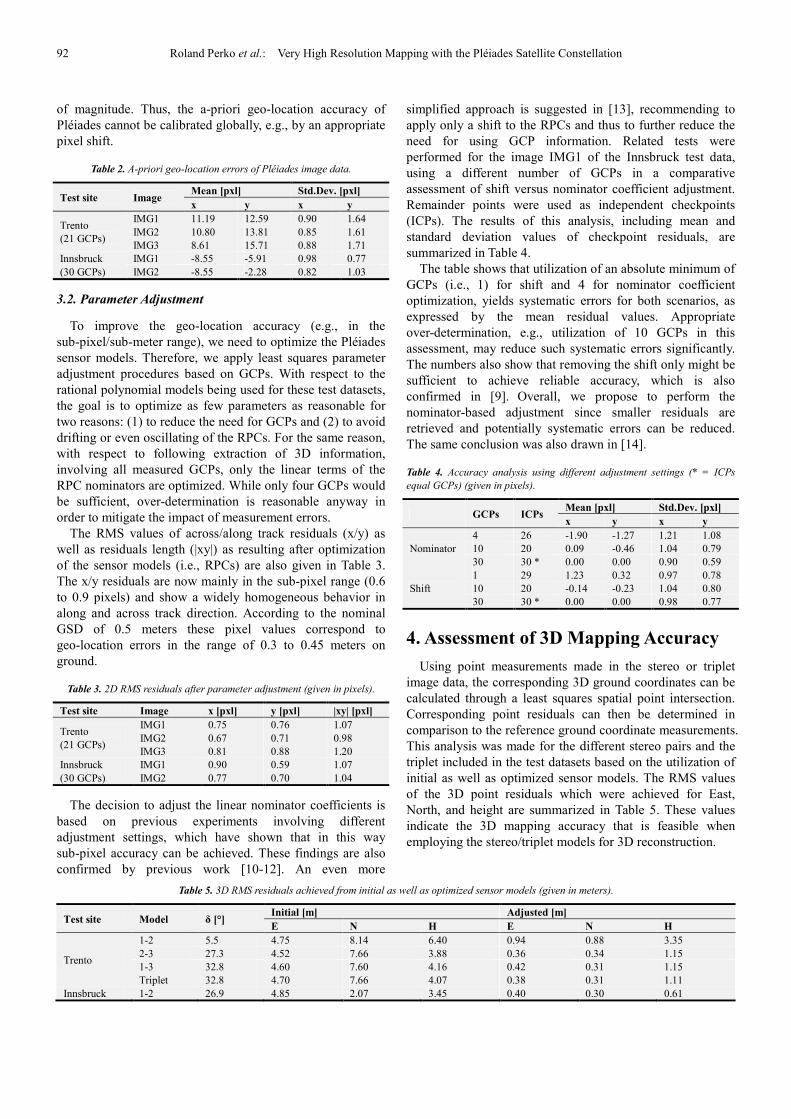
Table 2. A-priori geo-location errors of Pléiades image data.
Test site Image Mean [pxl] Std.Dev. [pxl]
x y x y
Trento (21 GCPs)
IMG1 11.19 12.59 0.90 1.64 IMG2 10.80 13.81 0.85 1.61 IMG3 8.61 15.71 0.88 1.71
Innsbruck (30 GCPs)
IMG1 -8.55 -5.91 0.98 0.77 IMG2 -8.55 -2.28 0.82 1.03
3.2. Parameter Adjustment
To improve the geo-location accuracy (e.g., in the sub-pixel/sub-meter range), we need to optimize the Pléiades sensor models. Therefore, we apply least squares parameter adjustment procedures based on GCPs. With respect to the rational polynomial models being used for these test datasets, the goal is to optimize as few parameters as reasonable for two reasons: (1) to reduce the need for GCPs and (2) to avoid drifting or even oscillating of the RPCs. For the same reason, with respect to following extraction of 3D information, involving all measured GCPs, only the linear terms of the RPC nominators are optimized. While only four GCPs would be sufficient, over-determination is reasonable anyway in order to mitigate the impact of measurement errors.
The RMS values of across/along track residuals (x/y) as well as residuals length (|xy|) as resulting after optimization of the sensor models (i.e., RPCs) are also given in Table 3. The x/y residuals are now mainly in the sub-pixel range (0.6 to 0.9 pixels) and show a widely homogeneous behavior in along and across track direction. According to the nominal GSD of 0.5 meters these pixel values correspond to geo-location errors in the range of 0.3 to 0.45 meters on ground.
Table 3. 2D RMS residuals after parameter adjustment (given in pixels).
Test site Image x [pxl] y [pxl] |xy| [pxl]
Trento (21 GCPs)
IMG1 0.75 0.76 1.07 IMG2 0.67 0.71 0.98 IMG3 0.81 0.88 1.20
Innsbruck (30 GCPs)
IMG1 0.90 0.59 1.07 IMG2 0.77 0.70 1.04
The decision to adjust the linear nominator coefficients is based on previous experiments involving different adjustment settings, which have shown that in this way sub-pixel accuracy can be achieved. These findings are also confirmed by previous work [10-12]. An even more
simplified approach is suggested in [13], recommending to apply only a shift to the RPCs and thus to further reduce the need for using GCP information. Related tests were performed for the image IMG1 of the Innsbruck test data, using a different number of GCPs in a comparative assessment of shift versus nominator coefficient adjustment. Remainder points were used as independent checkpoints (ICPs). The results of this analysis, including mean and standard deviation values of checkpoint residuals, are summarized in Table 4.
The table shows that utilization of an absolute minimum of GCPs (i.e., 1) for shift and 4 for nominator coefficient optimization, yields systematic errors for both scenarios, as expressed by the mean residual values. Appropriate over-determination, e.g., utilization of 10 GCPs in this assessment, may reduce such systematic errors significantly. The numbers also show that removing the shift only might be sufficient to achieve reliable accuracy, which is also confirmed in [9]. Overall, we propose to perform the nominator-based adjustment since smaller residuals are retrieved and potentially systematic errors can be reduced. The same conclusion was also drawn in [14].
Table 4. Accuracy analysis using different adjustment settings (* = ICPs
equal GCPs) (given in pixels).
GCPs ICPs Mean [pxl] Std.Dev. [pxl]
x y x y
Nominator 4 26 -1.90 -1.27 1.21 1.08 10 20 0.09 -0.46 1.04 0.79 30 30 * 0.00 0.00 0.90 0.59
Shift 1 29 1.23 0.32 0.97 0.78 10 20 -0.14 -0.23 1.04 0.80 30 30 * 0.00 0.00 0.98 0.77
4. Assessment of 3D Mapping Accuracy
Using point measurements made in the stereo or triplet image data, the corresponding 3D ground coordinates can be calculated through a least squares spatial point intersection. Corresponding point residuals can then be determined in comparison to the reference ground coordinate measurements. This analysis was made for the different stereo pairs and the triplet included in the test datasets based on the utilization of initial as well as optimized sensor models. The RMS values of the 3D point residuals which were achieved for East, North, and height are summarized in Table 5. These values indicate the 3D mapping accuracy that is feasible when employing the stereo/triplet models for 3D reconstruction.
Table 5. 3D RMS residuals achieved from initial as well as optimized sensor models (given in meters).
Test site Model δ [°] Initial [m] Adjusted [m]
E N H E N H
Trento
1-2 5.5 4.75 8.14 6.40 0.94 0.88 3.35 2-3 27.3 4.52 7.66 3.88 0.36 0.34 1.15 1-3 32.8 4.60 7.60 4.16 0.42 0.31 1.15 Triplet 32.8 4.70 7.66 4.07 0.38 0.31 1.11
Innsbruck 1-2 26.9 4.85 2.07 3.45 0.40 0.30 0.61

American Journal of Remote Sensing 2018; 6(2): 89-99 93
First, it is obvious, that the initial accuracy of the rational
polynomial models yields 3D displacements in the order of several meters, which is clearly beyond aspired precision. Next, the values given in the table show that the stereo intersection angle δ, as an equivalent for the base-to-height ratio, has a predominant impact onto the 3D geo-location accuracy. Higher accuracies are achieved for image pairs covering larger stereo intersection angles and vice versa. Thus, the Trento stereo pair with the small intersection angle of 5.5 degrees yields significant worse 3D geo-location than all other stereo (and tri-stereo) constellations.
For constellations involving larger stereo intersection angles the RMS values in planimetry are in a range of fewer than 0.5 meters. The RMS values in height are about 1.1 m from Trento and about 0.6 m for Innsbruck. Thus, when using appropriate geometric data acquisition arrangements, ideally comprising an image triplet and covering a wider
intersection angle range, sub-meter accuracy in planimetry as well as height is feasible with respect to 3D mapping.
Adequate to the 2D accuracy assessment, 3D mapping accuracy was analyzed for the Innsbruck stereo pair with respect to utilization of a different number of GCPs and ICPs as well as with respect to the comparison of shift versus nominator coefficients optimization. The results of this analysis, including mean and standard deviation values of checkpoint residuals, are summarized in Table 6. Again, the utilization of a minimum number of GCPs yields systematic geo-location errors in East, North, and height as manifested through the corresponding mean residual values. Over-determination as exemplarily given, e.g., by utilizing 10 GCPs, reduces these systematic errors to a more or less negligible order of magnitude and yields distinctly improved 3D RMS accuracy values, widely adequate for both optimization scenarios.
Table 6. 3D accuracy analysis using different adjustment settings (* = ICPs equal GCPs) (given in meters).
GCPs ICPs RMS [m] Mean [m]
E N H E N H
Nominator 4 26 1.41 0.88 0.72 1.25 -0.68 -0.16 10 20 0.46 0.48 0.75 -0.02 -0.30 -0.21 30 30 * 0.40 0.30 0.61 0.00 0.00 0.00
Shift 1 29 0.92 0.39 1.13 -0.79 -0.07 -0.93 10 20 0.50 0.45 0.70 0.10 -0.20 -0.33 30 30 * 0.48 0.38 0.65 0.00 0.00 0.00
With respect to the 3D mapping approach being applied to
the Pléiades datasets, it has to be emphasized that the optimization of the rational polynomial models is indispensable. In the respective workflow (see Section 5), accurate sensor models are a demand to generate strict epipolar image pairs (cf. [15]) with mutually corresponding image lines. This is a pre-requisite to apply 1D matching algorithms, like the semi-global matching approach [16].
5. Surface & Terrain Mapping Methods
In the following the 3D mapping procedures of JOANNEUM RESEARCH [17], which have been applied to the Pléiades test data, are described.
5.1. Stereo-processing Workflow
Starting from a pair of images to be used for the generation of a digital surface model (DSM), the following procedures are applied:
(a) Epipolar rectification of both stereo images based on the optimized sensor models such that a pre-defined point in the reference image can be found along a horizontal line in the search image, i.e., a line parallel to the image column direction: While the concept of epipolar geometry was first realized for perspective images, appropriate implementations were further made for Pléiades-like pushbroom geometries [18] and for SAR geometries [15]. In either case, the generation of epipolar image pairs is based on the underlying sensor
geometries and relies on accurate sensor models in order to achieve pairs with strictly corresponding image lines.
(b) Image matching in order to find correspondences of reference image pixels in the search image: In case of epipolar images, highly sophisticated image matching algorithms can be applied which utilize the fact that the search is restricted to one dimension and thus local and also global optimization methods can achieve highly accurate results at fast runtimes. A good overview and benchmark of such algorithms is given in [19]. For this work, a custom-tailored version of the semi-global matching (SGM) algorithm, which was introduced in [16], was used. Disparity predictions can be calculated based on the sensor models and coarse elevation data (e.g., the digital elevation model from the Shuttle Radar Topography Mission (SRTM)), such that the search range of the SGM algorithm can be limited. The cost function compares two image patches and is defined as the Hamming distance of the two Census transforms within 9x9 pixel windows on the epipolar images. Within the semi-global optimization, an adaptive penalty is used to preserve 3D breaklines. The image matching procedure yields two dense disparity maps pointing from the reference to the search image and vice versa. In future, a combined cost-function of Census transform and absolute difference measure is envisaged. In addition, replacing the Census transform by the generalized Census transform [20] is indented.
(c) Spatial point intersection, in order to calculate ground coordinates from the corresponding image pixels
94 Roland Perko et al.: Very High Resolution Mapping with the Pléiades Satellite Constellation
retrieved from image matching by means of a least squares approach: To some extent, unreliable matching results can be identified and rejected in this step. This procedure results in a “cloud” of 3D points, irregularly distributed on the ground.
(d) DSM resampling, i.e., interpolation of a regular grid of height values from these 3D points: Remaining gaps may be filled using an appropriate interpolation mechanism.
(e) DSM fusion to combine the information of forward and backward matching: Here the method described in [21] is applied, which takes all height measurements within a 3x3 neighborhood and extracts the mode of this probabilistic height distribution. Thus, local height errors can rather be eliminated than by a straightforward median-based approach [21]. Alternative fusion methods based on global optimizations like [22-23] would be of interest as well but are neglected in this study.
5.2. Utilization of Multiple Matching Results
A known trade-off in stereo data processing is that large intersection angles should be inherent to the stereo pair in order to imply higher geometric robustness and geo-location accuracy. On the other hand, the images should be similar, i.e., acquired under small stereo intersection angles, in order to assure successful matching. Utilization of multiple stereo pairs and fusion of multiple matching results can be applied to consider both requirements and thus increase the 3D reconstruction quality.
In this study each stereo pair was processed independently, yielding two DSMs according to the workflow described in Section 5.1. The fusion is then also done according to this workflow but integrates multiple stereo-derived DSMs retrieved from individual stereo pairs of the triplet. Thus, for the Trento test site all possible stereo pairs within a triplet, namely IMG1-IMG2, IMG2-IMG3, and IMG1-IMG3, were processed in both feasible stereo constellations, finally yielding six DSMs, which are then fused to one final DSM.
One advantage of this workflow is that each stereo pair can be processed individually on multiple computers. This is of particular importance with respect to image matching, which represents the workflow bottleneck in terms of runtime. Best feasible efficiency thus is achieved, because only the final DSM fusion step has to simultaneously access the multi-stereo processing results. It should be noted that this workflow can be used to process any other kinds of images as well, like in particular aerial images, e.g., Ultra Cam images [24].
5.3. Digital Terrain Model Extraction
To extract a DTM from the derived DSM, we apply the method presented in [25], which extends the approach in [26]
to be multi-directional and slope dependent, thus yielding appropriate filtering results also in non-flat terrain.
6. Surface & Terrain Mapping Results
In the following, the results of digital surface and terrain model extraction are described.
6.1. Digital Surface Models
For both test sites, dense DSMs were extracted using the Pléiades data and employing the workflow presented above. While for the Innsbruck test site only a stereo pair was available, a tri-stereo dataset could be processed for the Trento test site. For visual comparison and analysis, subsets of both test sites are presented below.
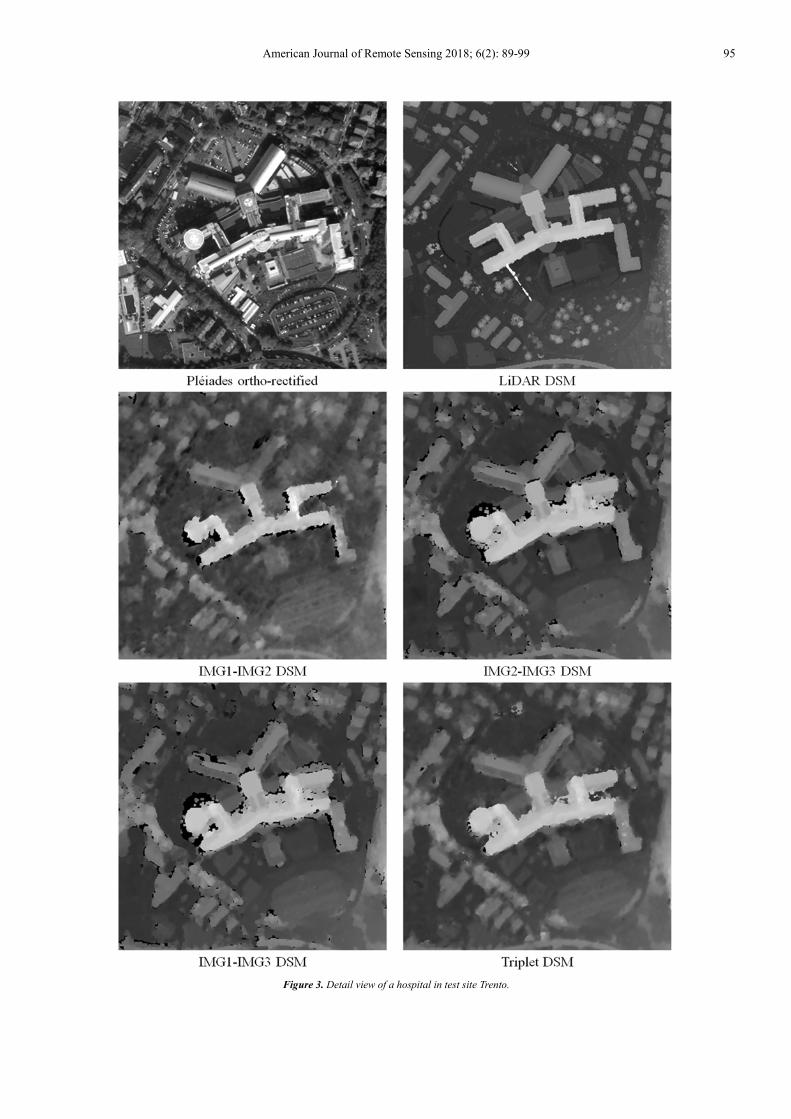
Figure 3 shows a subset of the Trento test site, which covers a hospital and its surrounding area of 360 x 360 m2. A Pléiades panchromatic ortho-image, the corresponding LiDAR DSM, the stereo-derived DSMs as well as the triplet-derived DSM are illustrated. The terrain heights of the DSMs are scaled between 240 (black) and 300 m (white). Infrastructural changes due to ongoing construction activities since the LiDAR acquisition can be seen. For instance, there is a new helipad (center-left) and a parking lot (center-down), which previously has been a park. The stereo-derived DSMs, in general, are affected by occlusion areas. In fact, they increase with increasing stereo intersection angle and almost vanish in the triplet-derived DSM. The DSM derived from the IMG1-IMG2 Pléiades stereo pair looks different in comparison to the others and seems to be more similar w.r.t. the LiDAR model. This is due to the small stereo intersection angle, which implies higher image similarity and thus a higher performance of the stereo matching with reduced occlusion areas. However, due to this weak geometric disposition, the height accuracy of this DSM is worse than for the other DSMs.
Exemplary quantitative analysis was made through comparison of LiDAR and stereo/triplet-derived DSMs. Due to the large temporal gap between LiDAR and Pléiades data acquisition only selected areas were analyzed which are not affected by temporal change due to construction, vegetation growth, or cloud cover. The results are summarized in Table 7. The standard deviations of the height differences confirm the interdependence of stereo intersection angles and 3D mapping accuracy, with worst accuracy achieved for the stereo pair discussed above. The triplet-derived DSM shows similar accuracy like the other stereo-derived DSMs. Nonetheless, it shows best consistency in comparison to the LiDAR DSM when considering its visual appearance. On the one hand, we can clearly see that the amount of occlusion areas is reduced, whereas, on the other hand, structures of buildings are improved and are more reliable.
American Journal of Remote Sensing 2018; 6(2): 89-99 95
Figure 3. Detail view of a hospital in test site Trento.
96 Roland Perko et al.: Very High Resolution Mapping with the Pléiades Satellite Constellation
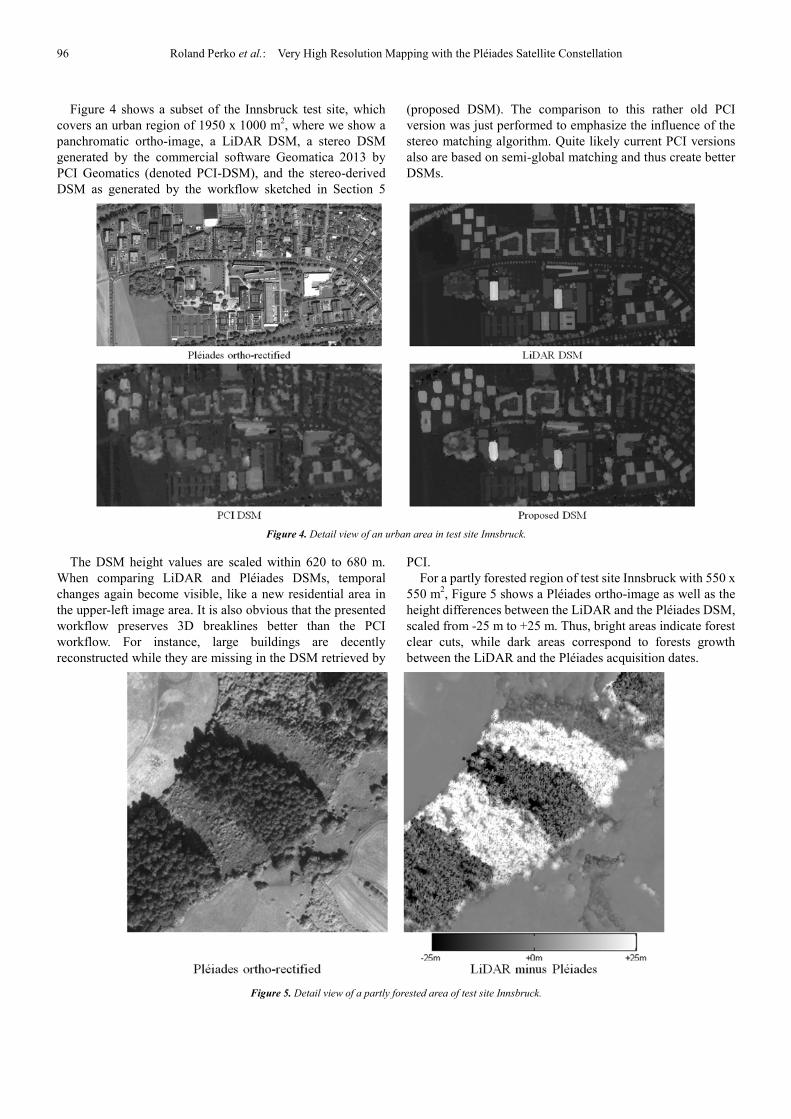
Figure 4 shows a subset of the Innsbruck test site, which covers an urban region of 1950 x 1000 m2, where we show a panchromatic ortho-image, a LiDAR DSM, a stereo DSM generated by the commercial software Geomatica 2013 by PCI Geomatics (denoted PCI-DSM), and the stereo-derived DSM as generated by the workflow sketched in Section 5
(proposed DSM). The comparison to this rather old PCI version was just performed to emphasize the influence of the stereo matching algorithm. Quite likely current PCI versions also are based on semi-global matching and thus create better DSMs.
Figure 4. Detail view of an urban area in test site Innsbruck.
The DSM height values are scaled within 620 to 680 m. When comparing LiDAR and Pléiades DSMs, temporal changes again become visible, like a new residential area in the upper-left image area. It is also obvious that the presented workflow preserves 3D breaklines better than the PCI workflow. For instance, large buildings are decently reconstructed while they are missing in the DSM retrieved by
PCI. For a partly forested region of test site Innsbruck with 550 x
550 m2, Figure 5 shows a Pléiades ortho-image as well as the height differences between the LiDAR and the Pléiades DSM, scaled from -25 m to +25 m. Thus, bright areas indicate forest clear cuts, while dark areas correspond to forests growth between the LiDAR and the Pléiades acquisition dates.
Figure 5. Detail view of a partly forested area of test site Innsbruck.

American Journal of Remote Sensing 2018; 6(2): 89-99 97
Table 7. Statistics of height differences between LiDAR and Pléiades DSMs on
non-forest regions.
Test Site Model Mean [m] Std.Dev. [m] Area [km2]
Trento
1-2 -0.62 4.53 10.8 2-3 -0.55 1.97 10.8 1-3 -0.53 2.25 10.8 Triplet -0.56 1.99 10.8
Innsbruck 1-2 0.25 1.68 26.5
6.2. Digital Terrain Models
First, the Pléiades DSM of Innsbruck is compared to the LiDAR DSM. Due to the large temporal gap between LiDAR and Pléiades data acquisitions only selected areas were analyzed, which are not affected by temporal change due to construction, vegetation growth, or cloud cover. Mean values as well as standard deviation of the height differences are summarized in Table 8 for an area of 25.4 km2. Here, the Pléiades-based DSM has a bias of 0.64 m and thus is actually too high. However, this is within the height uncertainty given for this sensor [27-28]. Consequently, the differences between LiDAR and Pléiades based DTMs will have the same bias, which, however, is not the fault of the presented DTM generation algorithm.
Second, the difference of the reference LiDAR DTM to the Pléiades DTM, which has been extracted using the proposed
algorithm, is analyzed. The results are also given in Table 8. The mean bias between both DTMs is indeed very similar to the one achieved for the DSMs. Since not all non-ground points are perfectly removed during the Pléiades DTM generation, the achieved DTM is locally above the LiDAR DTM, resulting in an additional mean height difference of 0.11 m. However, this bias is really small and it is below the absolute accuracy of LiDAR height measurement as well as Pléiades stereo height measurement.
Table 8. Statistics of height differences between LiDAR and Pléiades based
DSM and DTM.
Model Mean [m] Std.D. [m] Area [km2]
∆DSM -0.64 2.42 25.4 ∆DTM -0.75 1.10 25.4
Figure 6 shows DSMs and DTMs as generated from LiDAR and Pléiades data for two small areas of 100x100 m2 each, as well as profiles for a selected object, representing a round building. The analysis of the plotted profiles indicates that small structures, like the hole in the center of the round building, are not reconstructed using Pléiades data. The DTM generation is able to remove buildings and locally our DTM looks even better than the LiDAR DTM, e.g., on the left border of the round building where the LiDAR DTM is even below ground level.
Figure 6. Profile comparison of DSM and DTM from LiDAR and Pléiades for one small scene.
7. Conclusion
The presented assessment of the mapping potential of Pléiades stereo and tri-stereo data revealed that the 2D geo-location accuracy of the initial sensor model is within the range of 8.5 m CE90 as stated by Astrium. For accurate 3D mapping procedures, however, the sensor models have to be optimized employing ground control points. After such an optimization the 2D geo-location accuracy is in the range of 1 pixel, and the 3D geo-location accuracy is in the range of 0.5 m in planimetry and in the range of 1 m in height. Such
accuracy can be seen to be feasible at the best with respect to 3D models extracted from Pléiades data.
In this study also a tri-stereo Pléiades dataset was incorporated within a 3D mapping workflow. It could be in general shown that the increased over-determination resulting from multiple stereo matching results yields higher quality surface models. Due to the unfavorable intersection angle of this particular tri-stereo set, however, the potential of the triplet-based DSM generation could not be fully exploited. In future, tri-stereo sets should be acquired, which comprise a nadir image as well as forward and backward images, which are acquired at about the same forward and backward look
98 Roland Perko et al.: Very High Resolution Mapping with the Pléiades Satellite Constellation
angles. When thinking of processing large amounts of Pléiades
triplets for 3D mapping, the current bottleneck is the GCP measurement, if to be done manually, which is required to optimize the Pléiades sensor models. Thus, integration of automatic procedures for GCP acquisition would be the next logical step in order to realize a fully automatic pipeline. Our idea is to define a GCP-chip database such that ground control points could be retrieved therefrom automatically via area based image matching.
Optimizing the stereo matching technique is always an important research topic. In particular, a combined cost-function of Census transform and absolute difference measure is envisaged but also the replacement of Census transform with generalized Census transform is an issue.
Acknowledgements
This study partly was carried out within the research project “Highly versatile, New satellite Sensor applications – Building the Future of Austrian‘s Earth Observation Satellite Service Capacity“, funded by the Austrian research promotion agency (FFG). The Pléiades image data have been provided by GeoVille Information Systems GmbH, Austria. The support is gratefully acknowledged by the authors.
References
[1] Astrium (2012). Pleiades Imagery User Guide, V2.0. 118 pages.
[2] D. Poli, F. Remondino, E. Angiuli, and G. Agugiaro (2013). Evaluation of Pleiades-1A triplet on Trento Testfield. ISPRS Hannover Workshop, pp. 287-292.
[3] A. Gleyzes, L. Perret, and E. Cazala-Houcade (2013). Pleiades system fully operational in orbit. In EARSeL Symposium, number 33.
[4] H. Raggam (2006). Surface mapping using image triplets - Case studies and benefit assessment in comparison to stereo image processing. Photogrammetric Engineering and Remote Sensing, Vol. 72, Number 5, pp. 551-563.
[5] H. J. Persson, and R. Perko. Assessment of boreal forest height from WorldView-2 satellite stereo images. Remote Sensing Letters, 7 (12): 1150-1159, 2016.
[6] L. Himmelreich (2017). DHM Ableitungen aus Pléiades Tri-Stereo Satellitenbildern im Hochgebirge. Digitale Höhenmodelle verschiedener Softwareprodukte im Vergleich zu ALS Daten. Master Thesis, University of Innsbruck.
[7] R. Perko, H. Raggam, K. H. Gutjahr, and M. Schardt (2011). Using worldwide available TerraSAR-X data to calibrate the geo-location accuracy of optical sensors. In IEEE International Geoscience and Remote Sensing Symposium, pages 2551-2554.
[8] P. Reinartz, R. Müller, P. Schwind, S. Suri, and R. Bamler (2011). Orthorectification of VHR optical satellite data exploiting the geometric accuracy of TerraSAR-X data. ISPRS Journal of Photogrammetry and Remote Sensing, 66 (1),
124-132.
[9] K. Jacobsen, and H. Topan (2015). DEM generation with short base length Pleaides triplets. Int. Arch. Photogramm. Remote Sens. Spatial Inf. Sci., XL-3/W2, 81-86.
[10] G. Dial, and J. Grodecki (2002). Block adjustment with rational polynomial camera models. In ASCM-ASPRS Annual Conventions.
[11] P. J. Åstrand, M. Bongiorni, M. Crespi, F. Fratarcangeli, J. N. Da Costa, F. Pieralice, and A. Walczynska (2012). The potential of WorldView-2 for ortho-image production within the “Control with Remote Sensing Programme” of the European Commission. International Journal of Applied Earth Observation and Geoinformation, 19, 335-347.
[12] M. A. Aguilar, M. del Mar Saldaña, and F. J. Aguilar (2014). Generation and quality assessment of stereo-extracted DSM from GeoEye-1 and WorldView-2 imagery. IEEE Transactions on Geoscience and Remote Sensing, 52 (2), 1259-1271.
[13] C. S. Fraser, and H. Hanley (2003). Bias compensation in rational functions for IKONOS satellite imagery. Photogrammetric Engineering & Remote Sensing, 69 (1): 53-57.
[14] P. d’Angelo (2014). Assessing Multi-Angular Pleiades Data over Melbourne. In Pléiades Days.
[15] K. H. Gutjahr, R. Perko, H. Raggam, and M. Schardt (2014). The epipolarity constraint in stereo-radargrammetric DEM generation. IEEE Transactions on Geoscience and Remote Sensing, vol. 52 (8), pp. 5014-5022.
[16] H. Hirschmüller (2008). Stereo processing by semi-global matching and Mutual Information, IEEE Transactions on Pattern Analysis and Machine Intelligence, vol. 30 (2), pp. 328-341.
[17] R. Perko, H. Raggam, K. H. Gutjahr, and M. Schardt (2014). Assessment of the mapping potential of Pleiades stereo and triplet data. ISPRS Annals of Photogrammetry, Remote Sensing and Spatial Information Sciences, volume II-3, pages 103-109.
[18] M. Wang, F. Hu, and J. Li (2011). Epipolar resampling of linear pushbroom satellite imagery by a new epipolarity model, ISPRS Journal of Photogrammetry and Remote Sensing, vol. 66, no. 3, pp. 347–355.
[19] D. Scharstein, and R. Szeliski (2002). A taxonomy and evaluation of dense two frame stereo correspondence algorithms, International. Journal of Computer Vision, vol. 47, no. 1-3, pp. 7–42.
[20] W. S. Fife, and J. K Archibald (2013). Improved census transforms for resource-optimized stereo vision. IEEE Transactions on Circuits and Systems for Video Technology, 23 (1), 60-73.
[21] M. Rumpler, A. Wendel, and H. Bischof (2013). Probabilistic range image integration for DSM and true-orthophoto generation. Scandinavian Conference on Image Analysis, pp 533-544.
[22] R. Perko, and Ch. Zach (2016). Globally optimal robust DSM fusion. European Journal of Remote Sensing, 49: 489-511.
[23] T. Pock, L. Zebedin, and H. Bischof (2011). Rainbow of computer science. chapter TGV-fusion, pp. 245-258, Springer-Verlag, Berlin, Heidelberg.

American Journal of Remote Sensing 2018; 6(2): 89-99 99
[24] F. Leberl, M. Gruber, M. Ponticelli, S. Bernögger, and R. Perko (2003). The UltraCam large format aerial digital camera system. In American Society for Photogrammetry & Remote Sensing.
[25] R. Perko, H. Raggam, K. H. Gutjahr, and M. Schardt (2015). Advanced DTM generation from very high resolution satellite stereo images. In ISPRS Annals of the Photogrammetry, Remote Sensing and Spatial Information Sciences, volume II-3/W4, pages 165-172.
[26] X. Meng, L. Wang, J. L. Silván-Cárdenas, and N. Currit (2009). A multi-directional ground filtering algorithm for
airborne LIDAR, ISPRS Journal of Photogrammetry and Remote Sensing, 64 (1), pp. 117-124.
[27] A. Stumpf, J. P. Malet, P. Allemand, and P. Ulrich (2014). Surface reconstruction and landslide displacement measurements with Pléiades satellite images. ISPRS Journal of Photogrammetry and Remote Sensing, 95, pp. 1-12.
[28] E. Berthier, C. Vincent, E. Magnússon, Á. Gunnlaugsson, P. Pitte, E. Le Meur, M. Masiokas, L. Ruiz, F. Pálsson, J. M. C. Belart, and P. Wagnon (2014). Glacier topography and elevation changes from Pléiades very high resolution stereo images. The Cryosphere Discuss., 8, pp. 4849-4883.