Vertical Alignment -...
29
Vertical Alignment CE 2710 Spring 2009 Chris McCahill www.Exchange3D.com
Transcript of Vertical Alignment -...
Vertical
Alignment
CE 2710
Spring 2009
Chris McCahill
www.Exchange3D.com
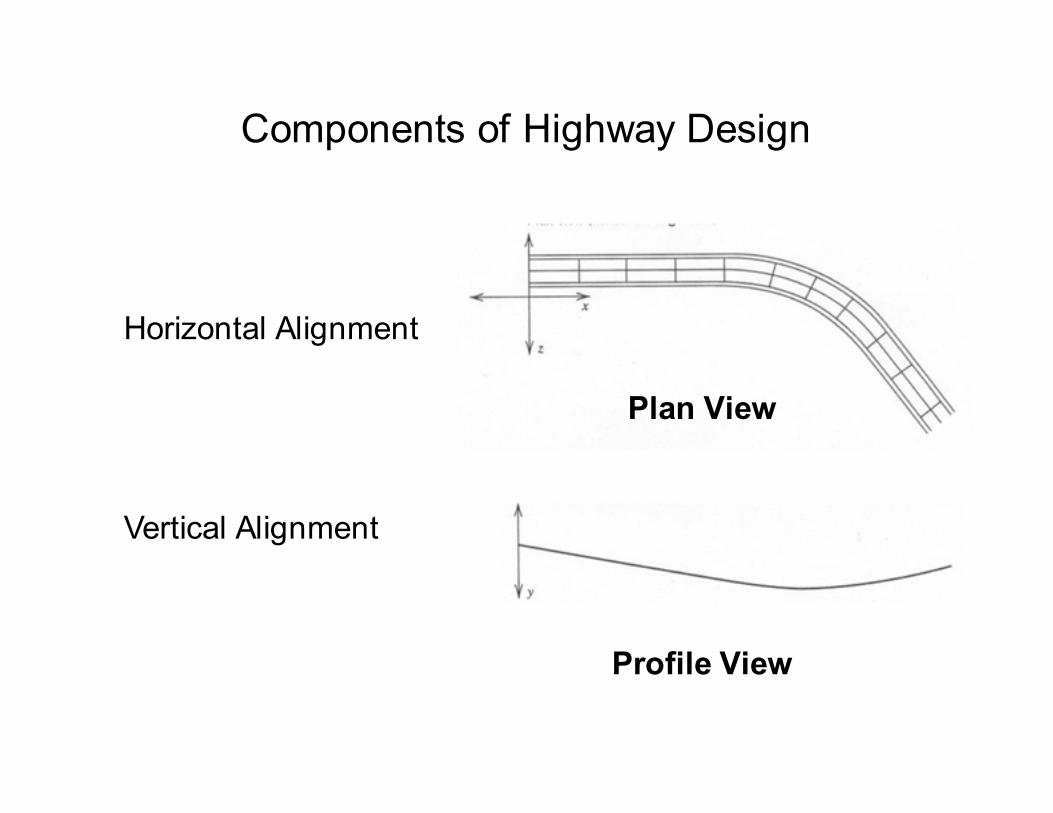
Components of Highway Design
Horizontal Alignment
Vertical Alignment
Plan View
Profile View
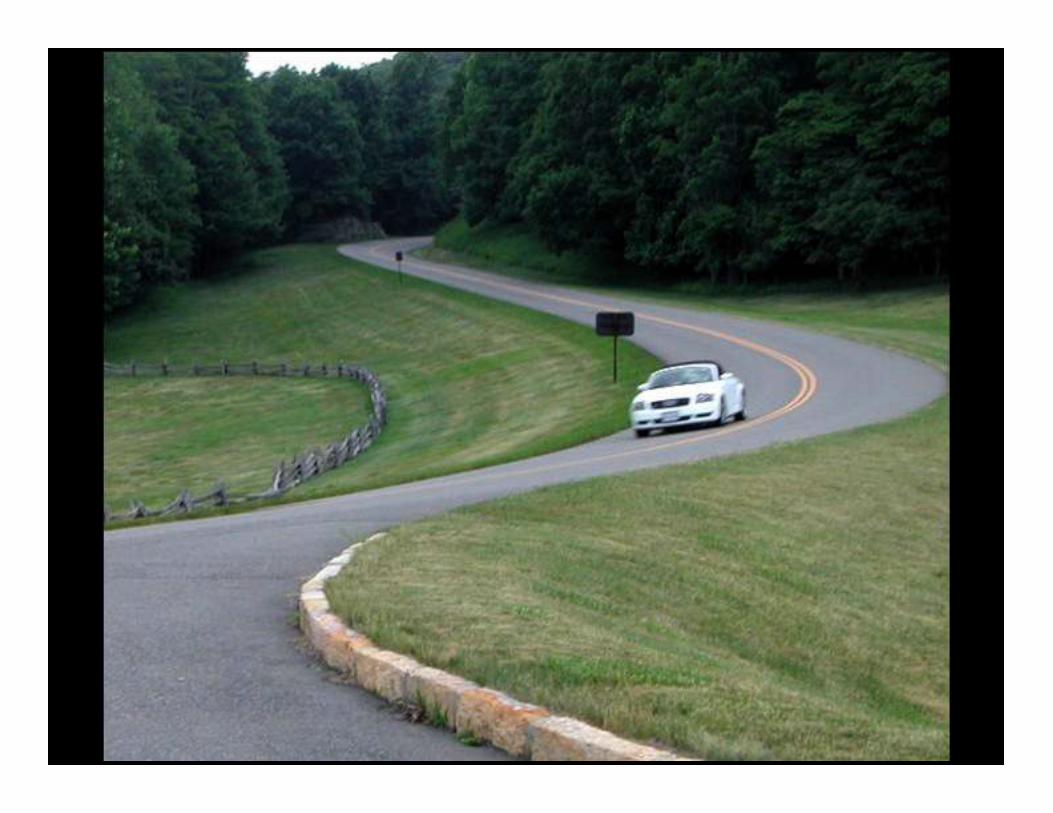


Vertical Alignment & Topography
Texas DOT

Today’s Class
• Properties of vertical curves (parabolic)
• Design of vertical curves
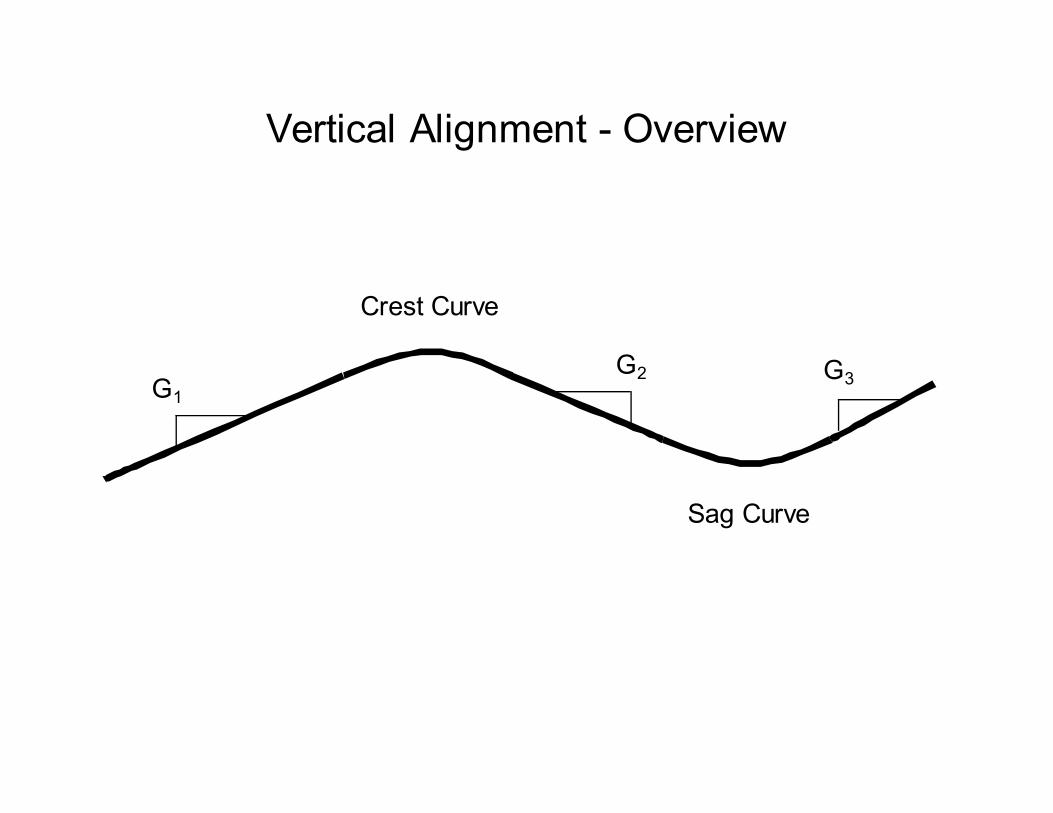
Crest Curve
Sag Curve
G1 G2 G3
Vertical Alignment - Overview
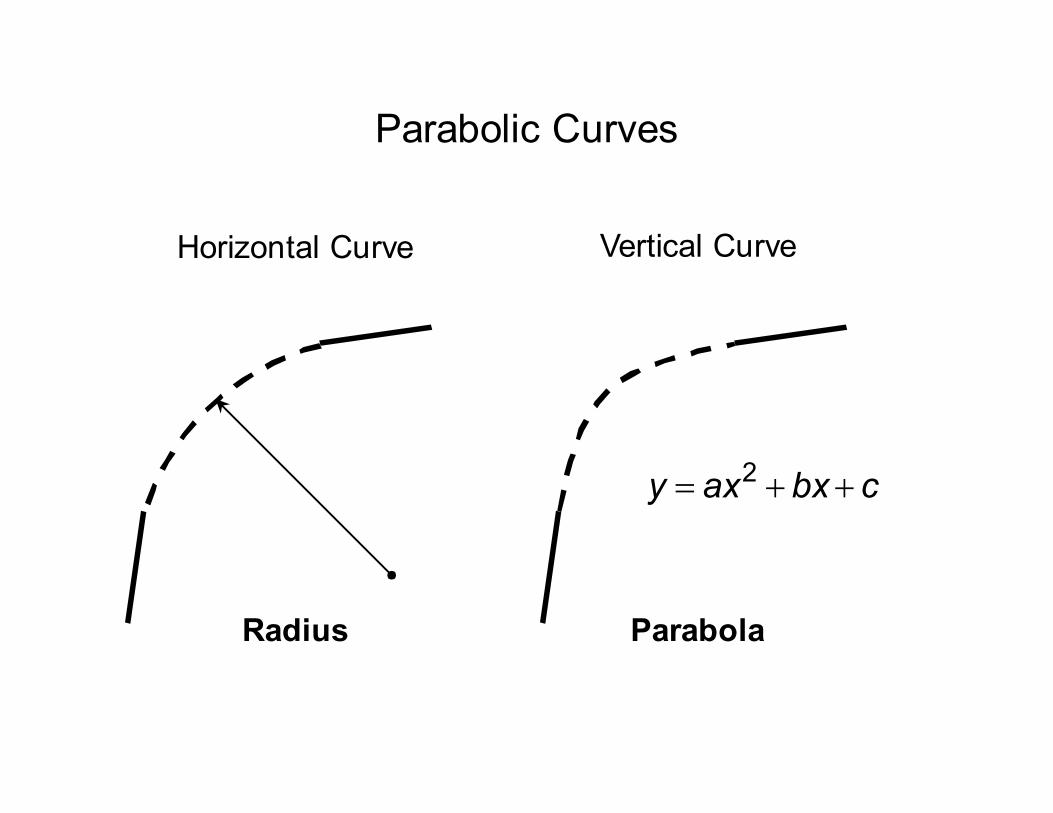
Parabolic Curves
Radius
Parabola
y = ax2 +bx + c
Horizontal Curve
Vertical Curve
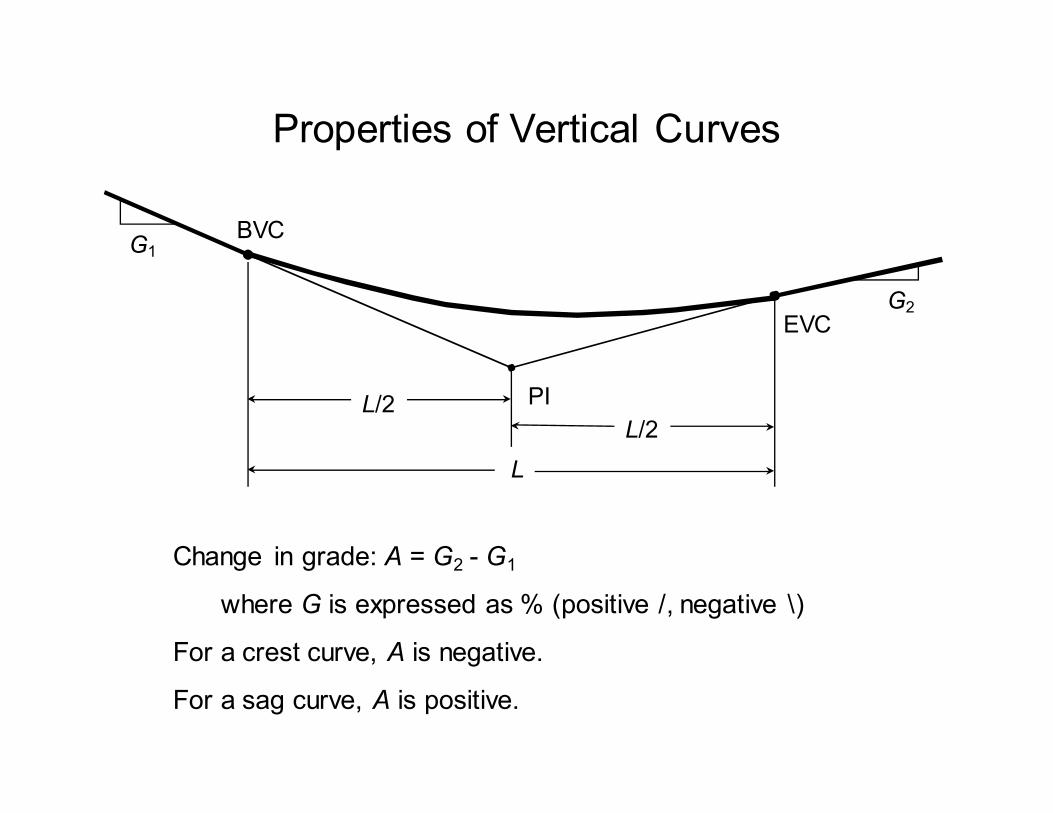
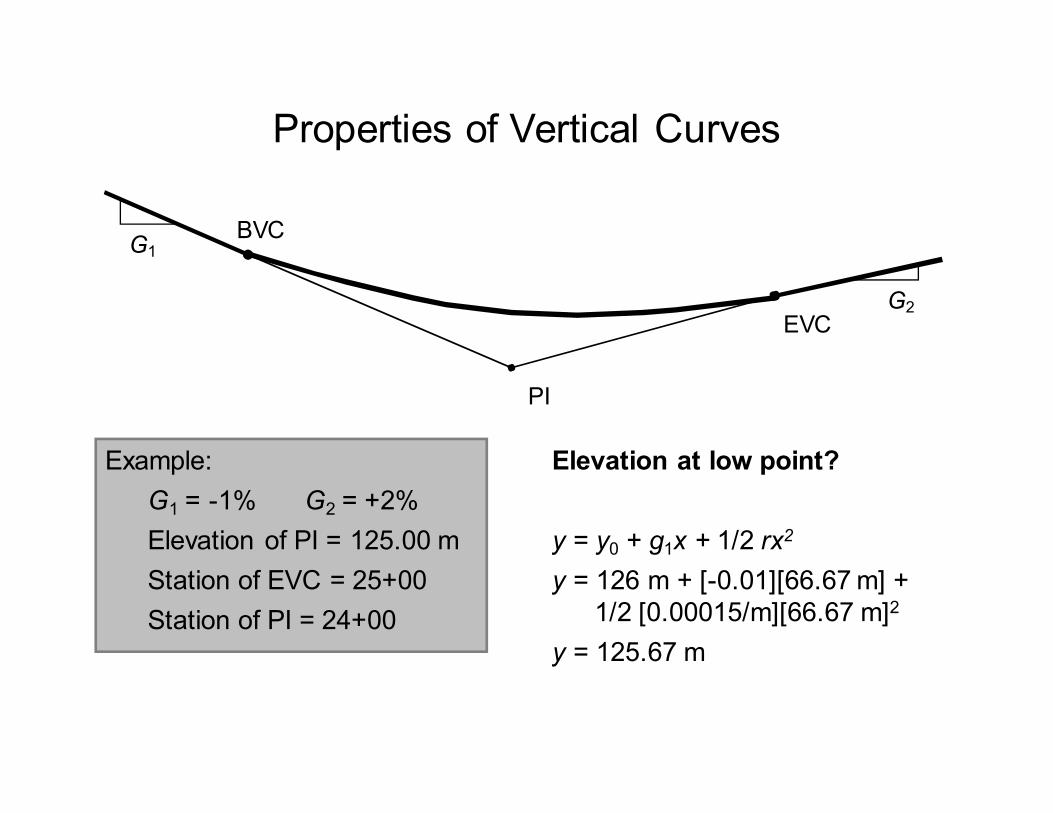
Properties of Vertical Curves
BVC
EVC
L
G2
G1
Change in grade: A = G2 - G1
where G is expressed as % (positive /, negative \)
For a crest curve, A is negative.
For a sag curve, A is positive.
L/2 L/2
PI
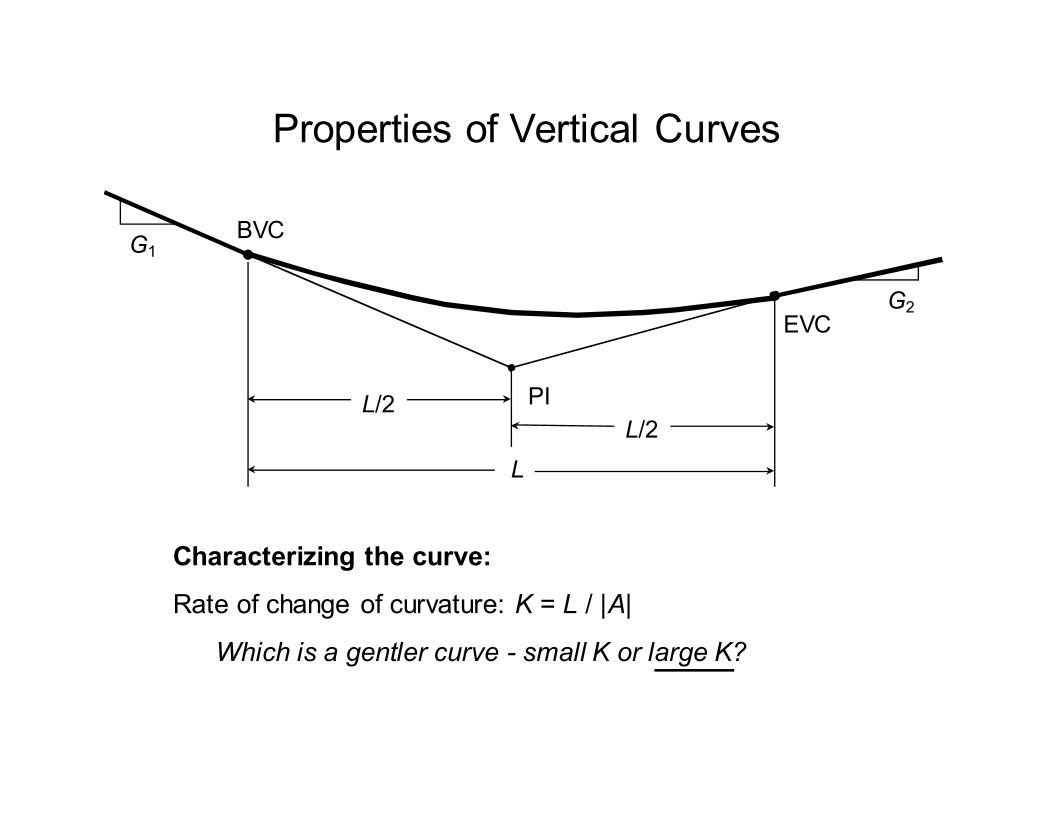
Properties of Vertical Curves
BVC
EVC
L
G2
G1
Characterizing the curve:
Rate of change of curvature: K = L / |A|
Which is a gentler curve - small K or large K?
L/2 L/2
PI
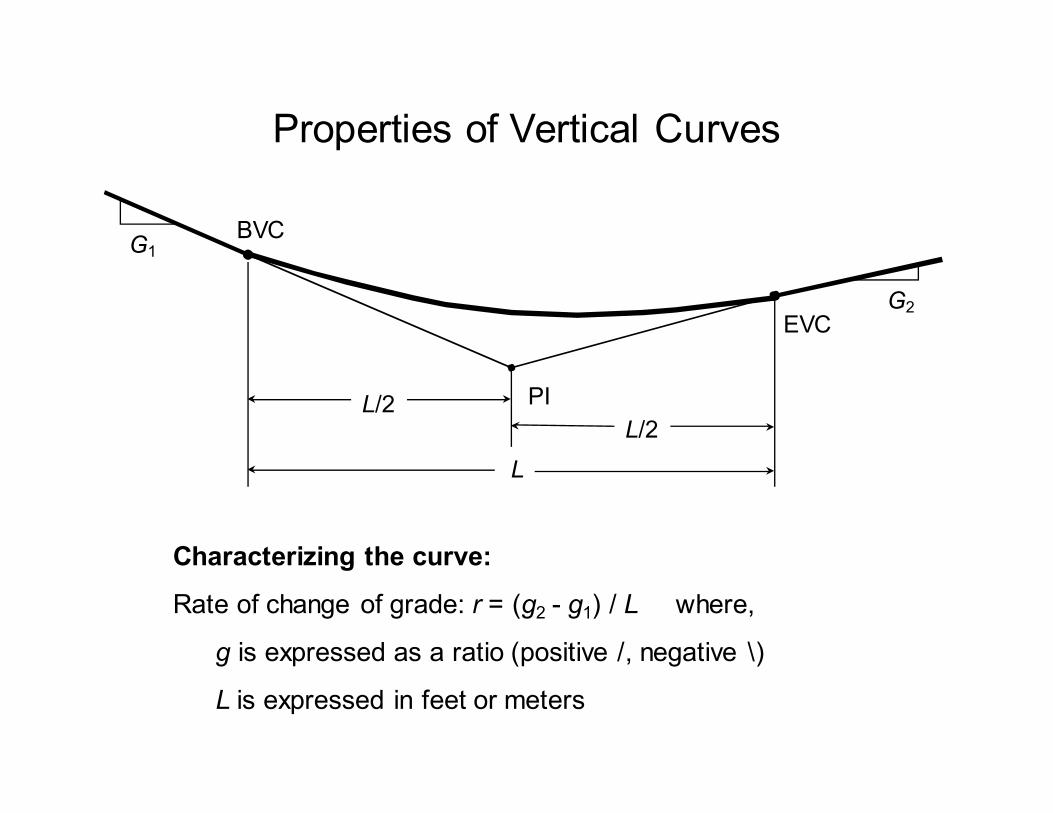
Properties of Vertical Curves
BVC
EVC
L
G2
G1
L/2 L/2
Characterizing the curve:
Rate of change of grade: r = (g2 - g1) / L where,
g is expressed as a ratio (positive /, negative \)
L is expressed in feet or meters
PI
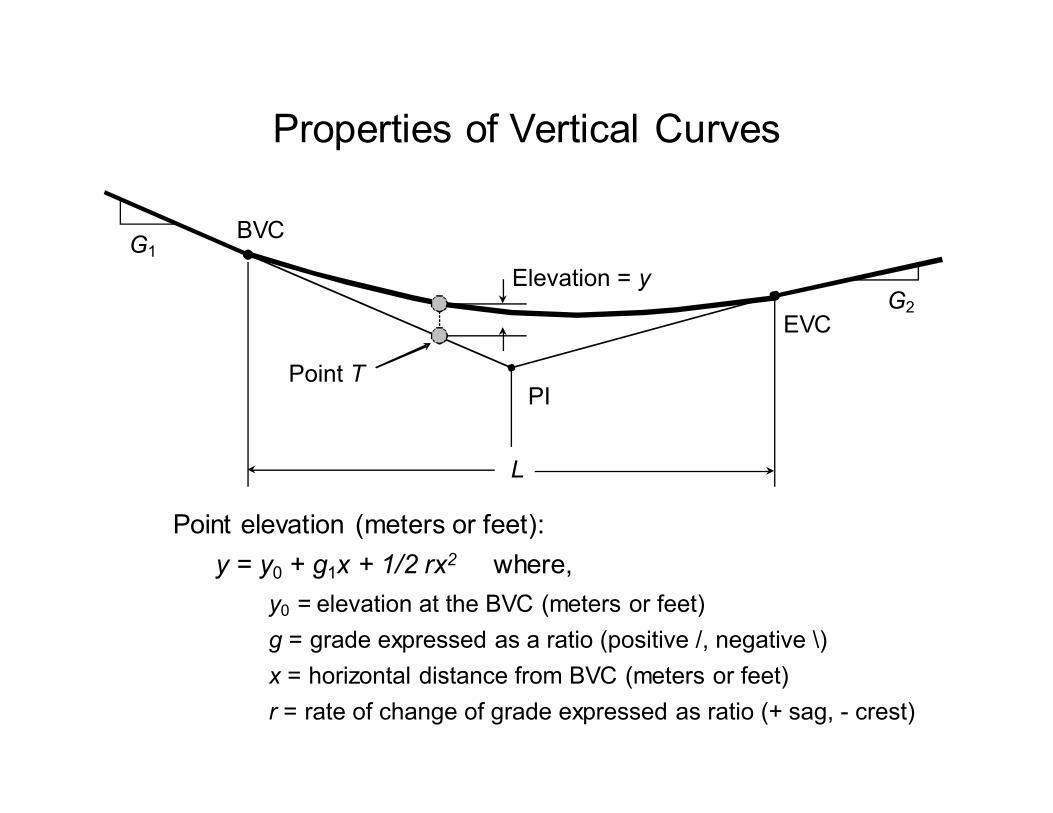
Properties of Vertical Curves
BVC
EVC
PI
L
G2
G1
Point elevation (meters or feet):
y = y0 + g1x + 1/2 rx2 where,
y0 = elevation at the BVC (meters or feet)
g = grade expressed as a ratio (positive /, negative \)
x = horizontal distance from BVC (meters or feet)
r = rate of change of grade expressed as ratio (+ sag, - crest)
Point T
Elevation = y
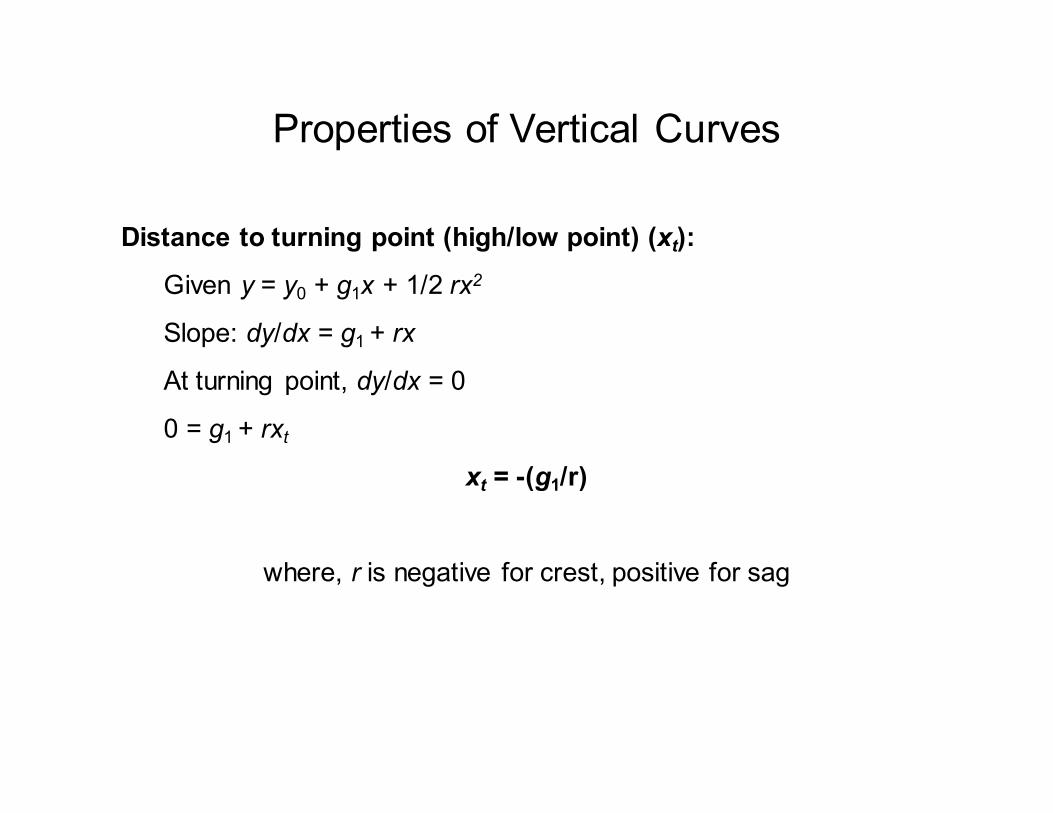
Properties of Vertical Curves
Distance to turning point (high/low point) (xt):
Given y = y0 + g1x + 1/2 rx2
Slope: dy/dx = g1 + rx
At turning point, dy/dx = 0
0 = g1 + rxt
xt = -(g1/r)
where, r is negative for crest, positive for sag
Properties of Vertical Curves
BVC
EVC
PI
G2
G1
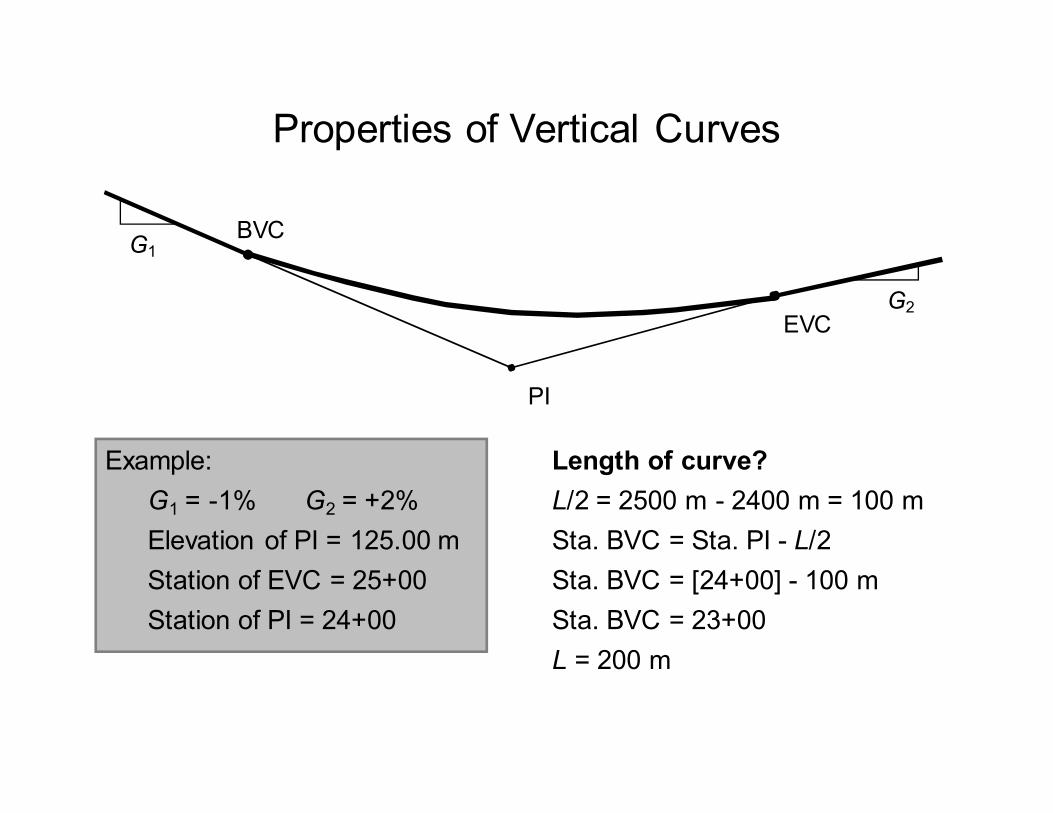
Example:
G1 = -1% G2 = +2%
Elevation of PI = 125.00 m
Station of EVC = 25+00
Station of PI = 24+00
Length of curve?
L/2 = 2500 m - 2400 m = 100 m
Sta. BVC = Sta. PI - L/2
Sta. BVC = [24+00] - 100 m
Sta. BVC = 23+00
L = 200 m
Properties of Vertical Curves
BVC
EVC
PI
G2
G1
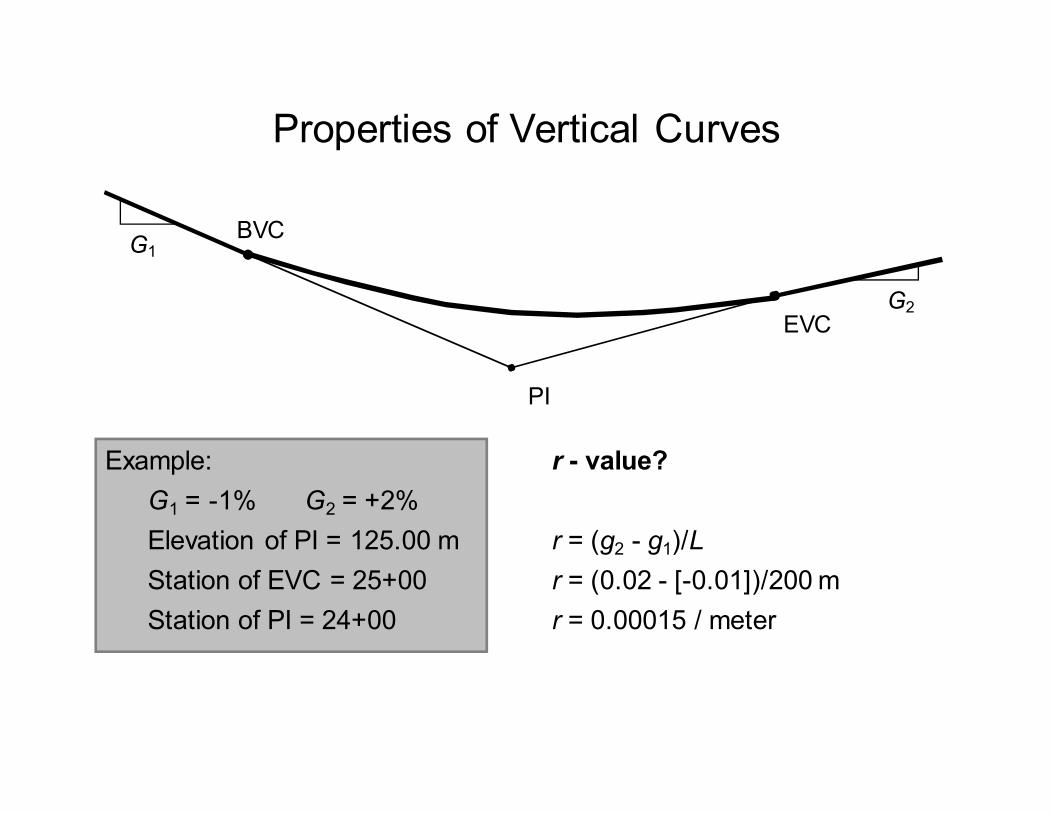
Example:
G1 = -1% G2 = +2%
Elevation of PI = 125.00 m
Station of EVC = 25+00
Station of PI = 24+00
r - value?
r = (g2 - g1)/L
r = (0.02 - [-0.01])/200 m
r = 0.00015 / meter

Properties of Vertical Curves
BVC
EVC
PI
G2
G1
Example:
G1 = -1% G2 = +2%
Elevation of PI = 125.00 m
Station of EVC = 25+00
Station of PI = 24+00
Station of low point?
x = -(g1/r)
x = -([-0.01] / [0.00015/m])
x = 66.67 m
Station = [23+00] + 67.67 m
Station 23+67
Properties of Vertical Curves
BVC
EVC
PI
G2
G1
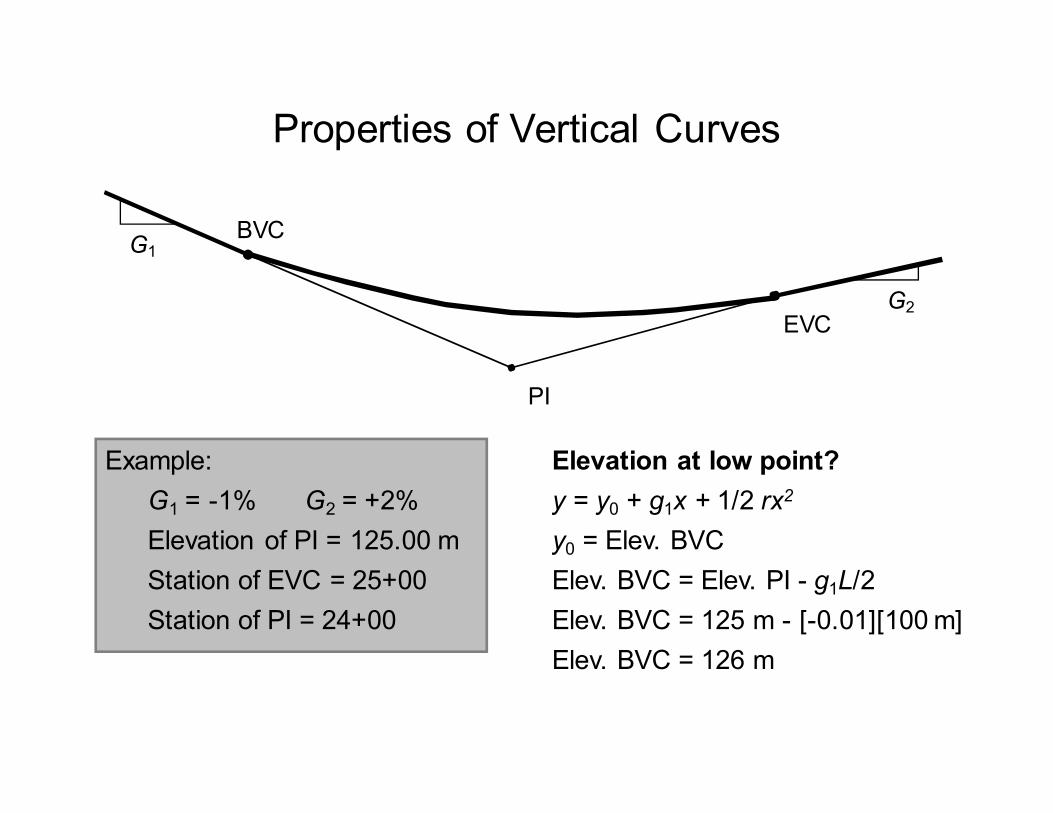
Example:
G1 = -1% G2 = +2%
Elevation of PI = 125.00 m
Station of EVC = 25+00
Station of PI = 24+00
Elevation at low point?
y = y0 + g1x + 1/2 rx2
y0 = Elev. BVC
Elev. BVC = Elev. PI - g1L/2
Elev. BVC = 125 m - [-0.01][100 m]
Elev. BVC = 126 m
Properties of Vertical Curves
BVC
EVC
PI
G2
G1
Example:
G1 = -1% G2 = +2%
Elevation of PI = 125.00 m
Station of EVC = 25+00
Station of PI = 24+00
Elevation at low point?
y = y0 + g1x + 1/2 rx2
y = 126 m + [-0.01][66.67 m] +
1/2 [0.00015/m][66.67 m]2
y = 125.67 m

Properties of Vertical Curves
BVC
EVC
PI
G2
G1
Example:
G1 = -1% G2 = +2%
Elevation of PI = 125.00 m
Station of EVC = 25+00
Station of PI = 24+00
Elevation at station 23+50?
y = 126 m + [-0.01][50 m] +
1/2 [0.00015/m][50 m]2
y = 125.69 m
Elevation at station 24+50?
y = 126 m + [-0.01][150 m] +
1/2 [0.00015/m][150 m]2
y = 126.19 m

Design of Vertical Curves

Design of Vertical Curves
• Determine the minimum length (or minimum K) for a
given design speed.
– Sufficient sight distance
– Driver comfort
– Appearance
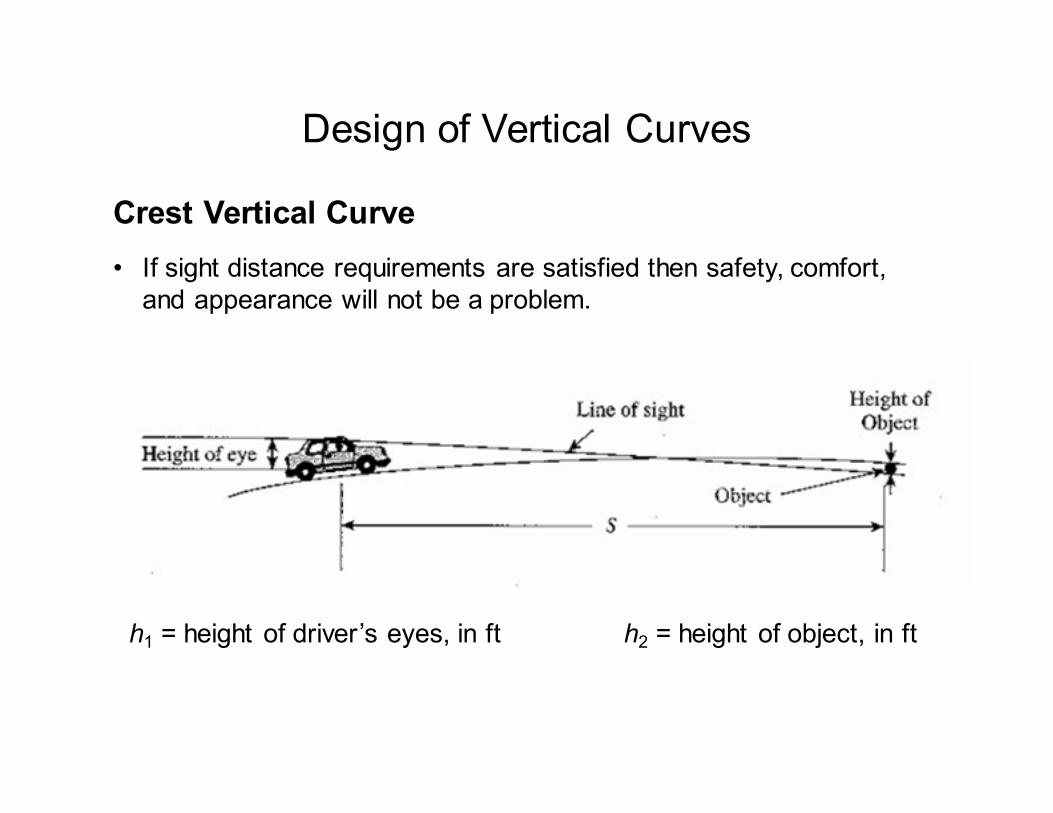
Design of Vertical Curves
Crest Vertical Curve
• If sight distance requirements are satisfied then safety, comfort,
and appearance will not be a problem.
h1 = height of driver’s eyes, in ft h2 = height of object, in ft
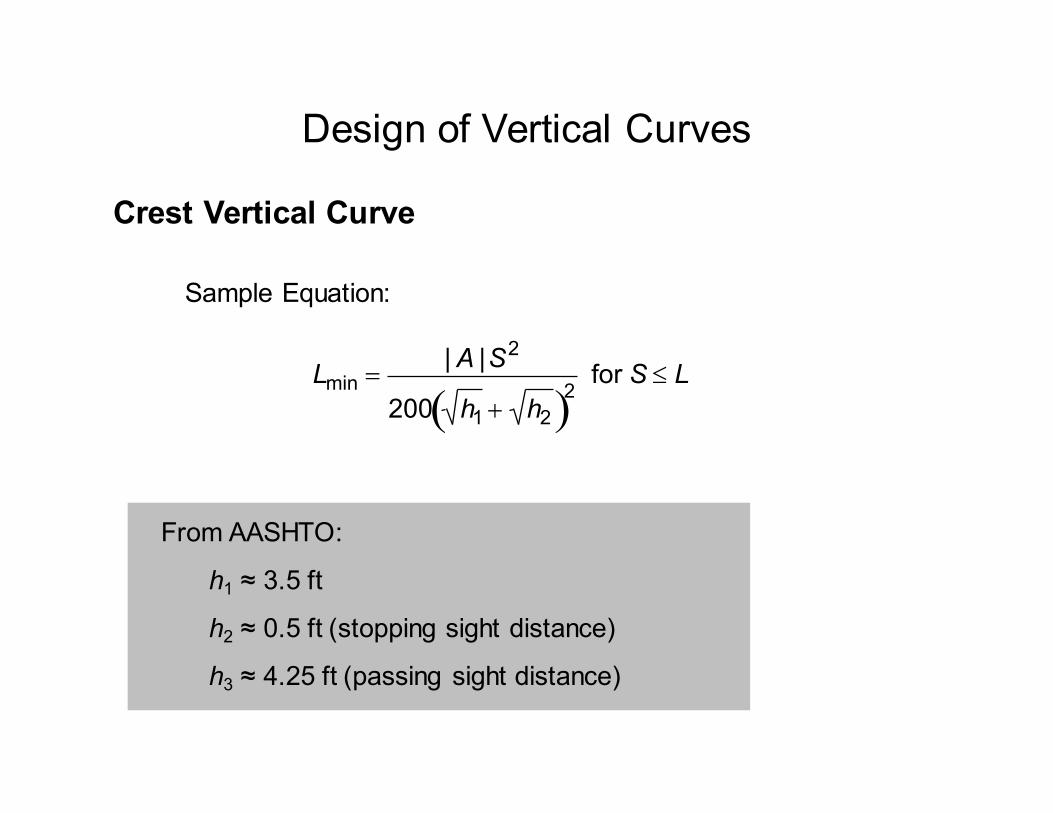
Design of Vertical Curves
Crest Vertical Curve
Lmin =|A |S2
200 h1 + h2( )2
for S ≤ L
Sample Equation:
From AASHTO:
h1 ≈ 3.5 ft
h2 ≈ 0.5 ft (stopping sight distance)
h3 ≈ 4.25 ft (passing sight distance)
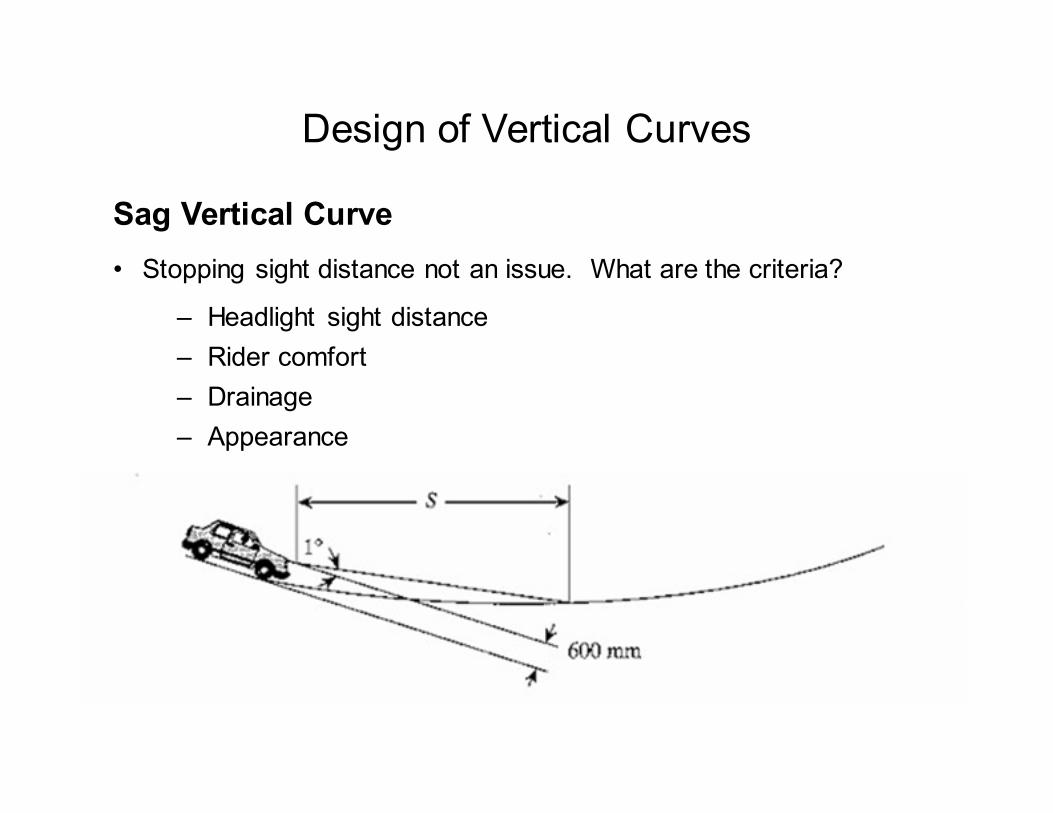
Design of Vertical Curves
Sag Vertical Curve
• Stopping sight distance not an issue. What are the criteria?
– Headlight sight distance
– Rider comfort
– Drainage
– Appearance
Sag Vertical Curve
Check also:
• Comfort
– Change in grade, A
– Design Speed
• Appearance
– Change in grade, A
Design of Vertical Curves

Maximum Grade
• Context
– Rural
– Urban
• Design Speed
• Terrain
– Level
– Rolling
– Mountainous
0.5% to 3.0%

Maximum Grade
Harlech, Gwynedd, UK (G = 34%) www.geograph.org.uk
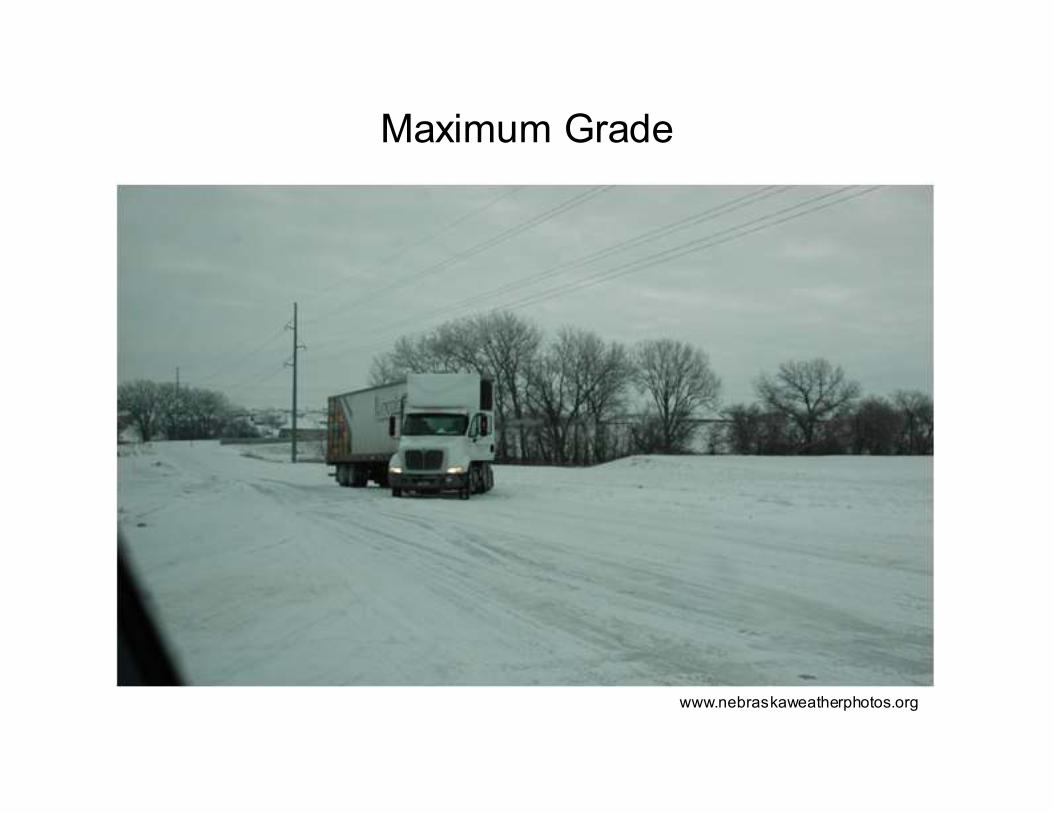
Maximum Grade
www.nebraskaweatherphotos.org
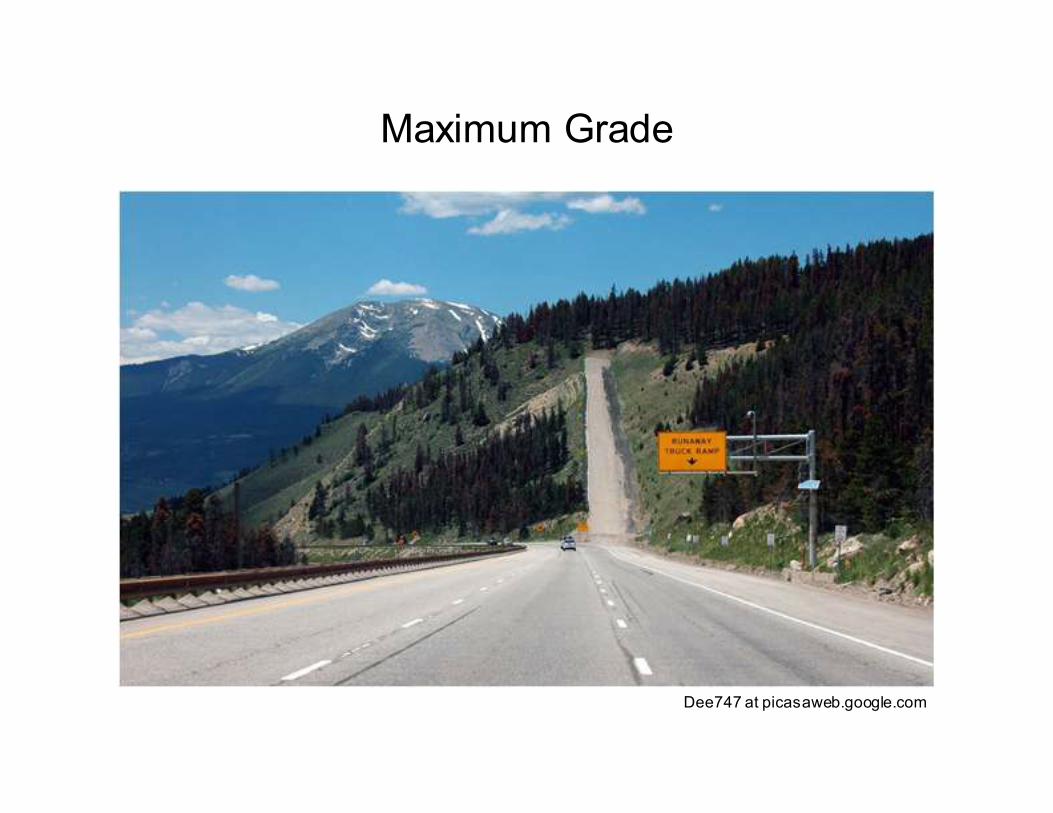
Maximum Grade
Dee747 at picasaweb.google.com