Ventura Water
158
2021 Water and Wastewater Cost of Service and Rate Design Study Final Report / March 16, 2021 Ventura Water
Transcript of Ventura Water

2021 Water and Wastewater Cost of Service andRate Design StudyFinal Report / March 16, 2021
VenturaWater

445 S Figueroa St, Suite 1925Los Angeles CA 90071www.raftelis.com
March 16, 2021
Ms. Susan RungrenGeneral ManagerVentura Water336 Sanjon RoadVentura, CA 93002
Subject: 2021 Water and Wastewater Cost of Service and Rate Design Study
Dear Ms. Rungren,
Raftelis is pleased to provide this 2021 Water and Wastewater Cost of Service and Rate Design Study Report toVentura Water. The overall purpose of the study was to develop a proposed five-year schedule of water andwastewater rates for Fiscal Year (FY) 2021/22 through FY 2025/26 that is fair, equitable, and in compliance withProposition 218 requirements.
The major goals of the study were to:
» Develop a ten-year financial plan for the City’s Water and Wastewater Enterprises to ensure financialsufficiency, meet operating costs, fund long-term capital needs including VenturaWaterPure, and maintainprudent reserves.
» Conduct water and wastewater cost of service analyses to ensure a strong nexus between proposed rates andthe cost to provide services to customers.
» Develop five years of water and wastewater rates in compliance with Proposition 218 requirements.
This report details results and recommendations related to the development of the proposed financial plans, cost ofservice analyses, and proposed rate calculations. It has been a pleasure working with you and we thank you andother Ventura Water staff for the support provided to Raftelis during this study.
Sincerely,
Sanjay Gaur Kevin Kostiuk Charles DiamondProject Director Project Manager Lead Analyst
2021 WATER AND WASTEWATER COST OF SERVICE AND RATE DESIGN STUDY
Table of Contents1. EXECUTIVE SUMMARY................................................................................................................... 11.1. Study Overview ................................................................................................................................. 1
1.2. Rate Study Process........................................................................................................................... 1
1.3. Proposed Water Financial Plan......................................................................................................... 2
1.4. Proposed Water Rates ...................................................................................................................... 4
1.5. Proposed Water Shortage Surcharges ............................................................................................. 8
1.6. Proposed Wastewater Financial Plan ............................................................................................. 10
1.7. Proposed Wastewater Rates........................................................................................................... 13
1.8. Combined Monthly Bill Impacts ....................................................................................................... 15
2. INTRODUCTION ............................................................................................................................. 172.1. Agency Overview............................................................................................................................. 17
2.2. Study Overview ............................................................................................................................... 17
3. LEGAL REQUIREMENTS AND RATE SETTING METHODOLOGY............................................ 203.1. Legal Requirements ........................................................................................................................ 20
3.2. Rate-Setting Methodology............................................................................................................... 21
4. WATER RATE STUDY ................................................................................................................... 234.1. Key Inputs and Assumptions........................................................................................................... 23
4.1.1. Current Water Rates........................................................................................................................ 23
4.1.2. Water Enterprise Financial Assumptions ........................................................................................ 25
4.1.3. Projected Water Service Connections ............................................................................................ 26
4.1.4. Projected Water Sales..................................................................................................................... 27
4.1.5. Projected Water Supply................................................................................................................... 29
4.2. Water Financial Plan ....................................................................................................................... 30
4.2.1. Water Enterprise Revenue under Current Rates ............................................................................ 30
4.2.2. Water Enterprise Operations & Maintenance Expenses ................................................................ 34
4.2.3. Water Enterprise Debt ..................................................................................................................... 38
4.2.4. Water Enterprise Capital Improvement Plan................................................................................... 38
4.2.5. Water Enterprise Financial Policies ................................................................................................ 42
4.2.6. Status Quo Water Financial Plan .................................................................................................... 43
4.2.7. Proposed Water Financial Plan....................................................................................................... 45
4.3. Water Cost of Service Analysis ....................................................................................................... 48
4.3.1. Methodology .................................................................................................................................... 48
4.3.2. Water Rate Revenue Requirement ................................................................................................. 49
4.3.3. Water System Peaking Factors....................................................................................................... 50

VENTURA WATER
4.3.4. Functionalization and Allocation of Expenses................................................................................. 50
4.3.5. Water Enterprise O&M Expense Allocation .................................................................................... 53
4.3.6. Water Enterprise Capital Allocation ................................................................................................ 55
4.3.7. Preliminary Water Cost of Service Allocation ................................................................................. 57
4.3.8. Allocation of Fire Protection Costs .................................................................................................. 58
4.3.9. Peaking Units of Service ................................................................................................................. 60
4.3.10. Adjusted Water Cost of Service ...................................................................................................... 62
4.3.11. Water Cost Allocation to Customer Classes ................................................................................... 64
4.4. Proposed Water Rate Structure Modifications................................................................................ 65
4.5. Proposed Water Rates .................................................................................................................... 67
4.5.1. Water Service Charges (Test Year FY 2020-21) ............................................................................ 67
4.5.2. Fire Line Service Charges (Test Year FY 2020-21)........................................................................ 69
4.5.3. Water Volume Rates (Test Year FY 2020-21) ................................................................................ 70
4.5.4. Proposed Five-Year Water Rate Schedule..................................................................................... 79
4.6. Proposed Water Shortage Surcharges ........................................................................................... 81
4.6.1. Water Shortage Event Contingency Plan Update........................................................................... 81
4.6.2. Proposed Changes to Water Shortage Rate Structure................................................................... 81
4.6.3. Calculation of Proposed Water Shortage Surcharges .................................................................... 82
5. WASTEWATER RATE STUDY ...................................................................................................... 865.1. Key Inputs and Assumptions........................................................................................................... 86
5.1.1. Current Wastewater Rates .............................................................................................................. 86
5.1.2. Wastewater Enterprise Financial Assumptions............................................................................... 88
5.1.3. Projected Wastewater Billing Units of Service ................................................................................ 89
5.2. Wastewater Financial Plan.............................................................................................................. 89
5.2.1. Wastewater Enterprise Revenue under Current Rates .................................................................. 90
5.2.2. Wastewater Enterprise Operations & Maintenance Expenses ....................................................... 93
5.2.3. Wastewater Enterprise Debt ........................................................................................................... 94
5.2.4. Wastewater Enterprise Capital Improvement Plan ......................................................................... 94
5.2.5. Wastewater Enterprise Financial Policies ....................................................................................... 97
5.2.6. Status Quo Wastewater Financial Plan........................................................................................... 97
5.2.7. Proposed Wastewater Financial Plan ............................................................................................. 99
5.3. Wastewater Cost of Service Analysis ........................................................................................... 103
5.3.1. Methodology .................................................................................................................................. 103
5.3.2. Wastewater Rate Revenue Requirement...................................................................................... 104
5.3.3. Functionalization and Allocation of Expenses............................................................................... 105
5.3.4. Wastewater Enterprise O&M Expense Allocation......................................................................... 106

2021 WATER AND WASTEWATER COST OF SERVICE AND RATE DESIGN STUDY
5.3.5. Wastewater Enterprise Capital Allocation ..................................................................................... 107
5.3.6. Wastewater Cost of Service Allocation ......................................................................................... 109
5.3.7. Mass Balance Analysis.................................................................................................................. 110
5.3.8. Wastewater Unit Costs .................................................................................................................. 112
5.3.9. Wastewater Cost Allocation to Customer Classes........................................................................ 112
5.4. Proposed Wastewater Rate Structure Modifications .................................................................... 114
5.5. Proposed Wastewater Rates......................................................................................................... 115
5.5.1. Proposed Wastewater Rates (Test Year FY 2020-21) ................................................................. 116
5.5.2. Proposed Five-Year Wastewater Rate Schedule ......................................................................... 118
6. CUSTOMER BILL IMPACTS........................................................................................................ 1196.1. Monthly Water Bill Impacts............................................................................................................ 119
6.2. Monthly Wastewater Bill Impacts .................................................................................................. 120
6.3. Combined Water & Wastewater Monthly Bill Impacts................................................................... 121
6.4. Combined Water & Wastewater Monthly Bill Comparisons.......................................................... 122
7. APPENDIX A: VENTURAWATERPURE ..................................................................................... 1237.1. VenturaWaterPure Background .................................................................................................... 123
7.2. VenturaWaterPure Capital Costs .................................................................................................. 123
7.3. VenturaWaterPure Capital Financing Plan ................................................................................... 126
7.4. VenturaWaterPure Capital Cost Allocation ................................................................................... 129
7.5. VenturaWaterPure Operating Costs ............................................................................................. 137
7.6. VenturaWaterPure Operating Cost Allocation .............................................................................. 137
7.7. VenturaWaterPure Cost Contribution to Financial Plans.............................................................. 138
8. APPENDIX B: TEN-YEAR WATER ENTERPRISE FINANCIAL PLAN...................................... 1399. APPENDIX C: TEN-YEAR WASTEWATER ENTERPRISE FINANCIAL PLAN ........................ 142

VENTURA WATER
List of TablesTable 1-1: Proposed Water Revenue Adjustments ......................................................................................................2Table 1-2: Proposed Changes to Residential Tier Allotments......................................................................................5Table 1-3: Proposed Five-Year Water Rate Schedule – Base Rates Only ..................................................................7Table 1-4: Proposed Five-Year Schedule of Water Shortage Surcharges...................................................................9Table 1-5: Proposed Wastewater Revenue Adjustments...........................................................................................10Table 1-6: Proposed Changes to Residential Wastewater Flow Charge Cap............................................................13Table 1-7: Proposed Five-Year Wastewater Rate Schedule......................................................................................14Table 4-1: Current Water Rates..................................................................................................................................24Table 4-2: Current Residential Tier Allotments for Water Volume Rates ...................................................................25Table 4-3: Water Enterprise Inflationary Assumptions ...............................................................................................25Table 4-4: Additional Water Enterprise Financial Assumptions..................................................................................26Table 4-5: Number of Water Meters and Fire Lines ...................................................................................................26Table 4-6: Projected Water Use Under Existing Rate Structure.................................................................................28Table 4-7: Projected Water Supply Mix ......................................................................................................................29Table 4-8: Projected Fixed Charge Revenue from Existing Rates .............................................................................30Table 4-9: Projected Commodity Charge Revenues Under Current Water Rates .....................................................31Table 4-10: Projected Miscellaneous Rate Revenues................................................................................................32Table 4-11: Other Water Enterprise Revenues ..........................................................................................................33Table 4-12: Summary of Projected Water Enterprise Revenues Under Current Rates .............................................34Table 4-13: Projected Water Supply Expenses – Groundwater Excluding Saticoy Country Club .............................35Table 4-14: Projected Water Supply Expenses – Saticoy Country Club Groundwater ..............................................36Table 4-15: Projected Water Supply Expenses – Casitas Municipal Water District...................................................36Table 4-16: Projected Water Enterprise O&M Expenses ...........................................................................................37Table 4-17: Water Enterprise Debt Service ................................................................................................................38Table 4-18: Water Enterprise – Use of Debt Proceeds ..............................................................................................38Table 4-19: Water Enterprise Capital Improvement Plan Excluding VenturaWaterPure ...........................................39Table 4-20: Water Enterprise Capital Improvement Plan - VenturaWaterPure..........................................................40Table 4-21: Water Enterprise Capital Improvement Plan Proposed Funding ............................................................41Table 4-22: Water Enterprise Financial Policies.........................................................................................................42Table 4-23: Projected Water Enterprise Reserve Targets..........................................................................................42Table 4-24: Water Operating Cash Flow (Fund 52) – Status Quo Financial Plan......................................................43Table 4-25: Status Quo Water Financial Plan Pro Forma (Funds 52 & 72) ...............................................................44Table 4-26: Proposed Water Revenue Adjustments ..................................................................................................45Table 4-27: Water Operating Cash Flow (Fund 52) – Proposed Financial Plan ........................................................45Table 4-28: Proposed Water Financial Plan Pro Forma (Funds 52 & 72) ..................................................................46Table 4-29: FY 2020-21 Water Rate Revenue Requirement .....................................................................................49Table 4-30: Water System Peaking Factor Allocations ..............................................................................................50Table 4-31: Allocation of Functional Categories to Water Cost Causation Components ...........................................52Table 4-32: Summary of Water Enterprise O&M Expenses by Functional Category.................................................53Table 4-33: Allocation of Water Enterprise O&M Expenses to Cost Causation Components ...................................54Table 4-34: Summary of Water Enterprise Capital Assets by Functional Category...................................................55Table 4-35: Allocation of Functionalized Water Capital Assets to Cost Causation Components...............................56Table 4-36: Preliminary Water Cost of Service Allocation (Test Year FY 2020-21)...................................................58Table 4-37: Equivalent Fire Demand ..........................................................................................................................60Table 4-38: Fire Protection Allocation Basis...............................................................................................................60Table 4-39: Peaking Units by Customer Class ...........................................................................................................61Table 4-40: Peaking Units for Fire Protection.............................................................................................................61Table 4-41: Allocation of Peaking Units to Public and Private Fire Protection ...........................................................62

2021 WATER AND WASTEWATER COST OF SERVICE AND RATE DESIGN STUDY
Table 4-42: Summary of Total Peaking Units .............................................................................................................62Table 4-43: Adjusted Cost of Service Allocation (Test Year FY 2020-21) .................................................................64Table 4-44: Recovery of Cost Causation Components by Charge Type ...................................................................64Table 4-45: Cost to Serve by Water Customer Class.................................................................................................65Table 4-46: Proposed Changes to Residential Tier Allotments..................................................................................66Table 4-47: Projected FY 2020-21 Residential Water Use by Tier – Current versus Proposed ................................67Table 4-48: Number of Equivalent Meters (Test Year FY 2020-21) ...........................................................................67Table 4-49: Water Service Charge Unit Charge Calculation (Test Year FY 2020-21) ...............................................68Table 4-50: Water Service Charge Calculation (Test Year FY 2020-21) ...................................................................68Table 4-51: Fire Line Service Charge Unit Charge Calculation (Test Year FY 2020-21) ..........................................69Table 4-52: Fire Line Service Charge Calculation (Test Year FY 2020-21)...............................................................69Table 4-53: Allocation of Unit Costs to Customer Classes.........................................................................................70Table 4-54: Preliminary Water Supply Unit Rate ........................................................................................................70Table 4-55: Residential Water Supply Cost Allocation by Tier (Test Year FY 2020-21) ............................................72Table 4-56: Residential Water Supply Unit Rates by Tier ..........................................................................................74Table 4-57: Water Supply Unit Rates by Customer Class and Tier ...........................................................................74Table 4-58: Base Delivery Unit Rate ..........................................................................................................................74Table 4-59: Peaking Unit Costs ..................................................................................................................................75Table 4-60: Peaking Unit Rates ..................................................................................................................................75Table 4-61: Preliminary Conservation Unit Rate ........................................................................................................76Table 4-62: Residential Conservation Unit Rates by Tier...........................................................................................76Table 4-63: Conservation Unit Rates by Customer Class and Tier............................................................................77Table 4-64: Revenue Offset Unit Rate........................................................................................................................77Table 4-65: Untreated Offset Unit Rate ......................................................................................................................78Table 4-66: Water Volume Rates Calculation (Test Year FY 2020-21) .....................................................................79Table 4-67: Proposed Five-Year Water Rate Schedule .............................................................................................80Table 4-68: Current versus Updated Water Shortage Stages....................................................................................81Table 4-69: Projected Water Use Reduction by Water Shortage Stage (FY 2020-21) ..............................................83Table 4-70: Calculation of Water Shortage Surcharges (Test Year FY 2020-21) ......................................................84Table 4-71: Calculated Water Shortage Stage Surcharges per HCF (Test Year FY 2020-21)..................................84Table 4-72: Proposed Five-Year Schedule of Water Shortage Surcharges...............................................................85Table 5-1: Current Wastewater Rate Schedule ..........................................................................................................87Table 5-2: Current Wastewater Commercial Customer Classification .......................................................................88Table 5-3: Wastewater Enterprise Inflationary Assumptions......................................................................................88Table 5-4: Additional Wastewater Enterprise Financial Assumptions ........................................................................88Table 5-5: Projected Wastewater Billing Units Under Existing Rate Structure...........................................................89Table 5-6: Projected Rate Revenues under Current Wastewater Rates....................................................................91Table 5-7: Other Wastewater Enterprise Revenues ...................................................................................................92Table 5-8: Summary of Projected Wastewater Enterprise Revenues Under Current Rates......................................92Table 5-9: Projected Wastewater Enterprise O&M Expenses....................................................................................93Table 5-10: Wastewater Enterprise Debt Service.......................................................................................................94Table 5-11: Wastewater Enterprise – Use of Debt Proceeds.....................................................................................94Table 5-12: Wastewater Enterprise Capital Improvement Plan Excluding VenturaWaterPure ..................................95Table 5-13: Wastewater Enterprise Capital Improvement Plan - VenturaWaterPure ................................................95Table 5-14: Wastewater Enterprise Capital Improvement Plan Proposed Funding ...................................................96Table 5-15: Wastewater Enterprise Financial Policies ...............................................................................................97Table 5-16: Projected Wastewater Enterprise Reserve Targets ................................................................................97Table 5-17: Wastewater Operating Cash Flow (Fund 51) – Status Quo Financial Plan ............................................98Table 5-18: Status Quo Wastewater Financial Plan Pro Forma (Funds 51, 71, & 75)...............................................99Table 5-19: Proposed Wastewater Revenue Adjustments .......................................................................................100

VENTURA WATER
Table 5-20: Wastewater Operating Cash Flow (Fund 51) – Proposed Financial Plan.............................................100Table 5-21: Proposed Wastewater Financial Plan Pro Forma (Funds 51, 71, & 75) ...............................................101Table 5-22: FY 2020-21 Wastewater Rate Revenue Requirement ..........................................................................104Table 5-23: Allocation of Functional Categories to Wastewater Cost Causation Components ...............................106Table 5-24: Summary of Wastewater Enterprise O&M Expenses by Functional Category .....................................106Table 5-25: Allocation of Wastewater Enterprise O&M Expenses to Cost Causation Components ........................107Table 5-26: Summary of Wastewater Enterprise Capital Assets by Functional Category .......................................107Table 5-27: Allocation of Functionalized Wastewater Capital Assets to Cost Causation Components ...................108Table 5-28: Wastewater Cost of Service Allocation (Test Year FY 2020-21) ..........................................................109Table 5-29: FY 2018-19 Mass Balance Analysis......................................................................................................111Table 5-30: Wastewater Unit Costs (Test Year FY 2020-21) ...................................................................................112Table 5-31: Wastewater Cost Allocation to Customer Classes (Test Year FY 2020-21) .........................................113Table 5-32: Cost to Serve by Wastewater Customer Class .....................................................................................114Table 5-33: Proposed Changes to Residential Wastewater Flow Charge Cap........................................................115Table 5-34: Projected FY 2020-21 Residential Variable Billing Units – Current versus Proposed ..........................115Table 5-35: Proposed Wastewater Rate Calculation (Test Year FY 2020-21).........................................................117Table 5-36: Proposed Five-Year Wastewater Rate Schedule..................................................................................118Table 6-1: FY 2018-19 Water Use per Account - Single Family Residential............................................................119Table 6-2: Commercial Water Bill Impacts (FY 2021-22) .........................................................................................120Table 6-3: Single Family Residential Variable Billing Units – Current versus Proposed..........................................121Table 6-4: Commercial Wastewater Bill Impacts (FY 2021-22)................................................................................121Table 7-1: VenturaWaterPure Capital Costs ............................................................................................................125Table 7-2: VenturaWaterPure Debt Financing Assumptions....................................................................................126Table 7-3: VenturaWaterPure Capital Funding Sources ..........................................................................................127Table 7-4: VenturaWaterPure Funding Summary ....................................................................................................127Table 7-5: VenturaWaterPure Financing Costs ........................................................................................................128Table 7-6: VenturaWaterPure Capital Cost Allocation Basis....................................................................................129Table 7-7: VenturaWaterPure Capital Cost Allocation to Water Enterprise .............................................................130Table 7-8: VenturaWaterPure Capital Cost Allocation to Wastewater Enterprise....................................................131Table 7-9: VenturaWaterPure Funding Sources for Water Enterprise Capital Allocation ........................................132Table 7-10: VenturaWaterPure Funding Sources for Wastewater Enterprise Capital Allocation.............................133Table 7-11: VenturaWaterPure Funding Sources for Wastewater Enterprise Capital Allocation.............................134Table 7-12: VenturaWaterPure Water Enterprise Financing Costs..........................................................................135Table 7-13: VenturaWaterPure Wastewater Enterprise Financing Costs ................................................................136Table 7-14: VenturaWaterPure Additional O&M Expenses......................................................................................137Table 7-15: VenturaWaterPure Additional O&M Expenses......................................................................................137Table 7-16: VenturaWaterPure Cost Contribution to Water Enterprise Financial Plan ............................................138Table 7-17: VenturaWaterPure Cost Contribution to Wastewater Enterprise Financial Plan ..................................138Table 8-1: Ten-Year Water Enterprise Financial Plan Assumptions ........................................................................139Table 9-1: Ten-Year Wastewater Enterprise Financial Plan Assumptions...............................................................142

2021 WATER AND WASTEWATER COST OF SERVICE AND RATE DESIGN STUDY
List of FiguresFigure 1-1: Water Enterprise Capital Improvement Plan..............................................................................................2Figure 1-2: Proposed vs. Status Quo Water Financial Plan .........................................................................................3Figure 1-3: Proposed Water Financial Plan – Projected Ending Balances ..................................................................3Figure 1-4: Proposed Water Financial Plan - Debt Coverage ......................................................................................4Figure 1-5: Single Family Residential Monthly Water Bill Impacts (FY 2021-22).......................................................10Figure 1-6: Wastewater Enterprise Capital Improvement Plan ..................................................................................11Figure 1-7: Proposed vs. Status Quo Wastewater Financial Plan..............................................................................11Figure 1-8: Proposed Wastewater Financial Plan – Projected Ending Balances.......................................................12Figure 1-9: Proposed Wastewater Financial Plan - Debt Coverage...........................................................................12Figure 1-10: Single Family Residential Monthly Wastewater Bill Impacts (FY 2021-22) ...........................................15Figure 1-11: Five-Year Combined Monthly Bill Impacts for Single Family Residential (9 HCF/Month) .....................15Figure 1-12: Combined Monthly Bill Comparison for Single Family Residential (9 HCF/Month) ...............................16Figure 4-1: Water Enterprise Capital Improvement Plan............................................................................................41Figure 4-2: Proposed Water Financial Plan - Debt Coverage ....................................................................................47Figure 4-3: Proposed Water Financial Plan – Projected Ending Balances ................................................................47Figure 4-4: Proposed vs. Status Quo Water Financial Plan .......................................................................................48Figure 5-1: Wastewater Enterprise Capital Improvement Plan ..................................................................................96Figure 5-2: Proposed Wastewater Financial Plan - Debt Coverage.........................................................................102Figure 5-3: Proposed Wastewater Financial Plan – Projected Ending Balances.....................................................102Figure 5-4: Proposed vs. Status Quo Wastewater Financial Plan............................................................................103Figure 6-1: Single Family Residential Monthly Water Bill Impacts (FY 2021-22).....................................................119Figure 6-2: Single Family Residential Monthly Wastewater Bill Impacts (FY 2021-22) ...........................................120Figure 6-3: Five-Year Combined Monthly Bill Impacts for Single Family Residential (9 HCF/Month) .....................121Figure 6-4: Combined Monthly Bill Comparison for Single Family Residential (9 HCF/Month) ...............................122Figure 8-1: 10-Year Water Enterprise Capital Improvement Plan (incl. VenturaWaterPure) ...................................140Figure 8-2: 10-Year Water Enterprise Debt Coverage Projections ..........................................................................140Figure 8-3: 10-Year Water Enterprise Projected Ending Balances ..........................................................................141Figure 8-4: 10-Year Water Enterprise Operating Financial Plan ..............................................................................141Figure 9-1: 10-Year Wastewater Enterprise Capital Improvement Plan (incl. VenturaWaterPure)..........................143Figure 9-2: 10-Year Wastewater Enterprise Debt Coverage Projections .................................................................143Figure 9-3: 10-Year Wastewater Enterprise Projected Ending Balances.................................................................144Figure 9-4: 10-Year Wastewater Enterprise Operating Financial Plan.....................................................................144

VENTURA WATER
List of AbbreviationsADA: Average Daily AttendanceAF: Acre-feetAFY: Acre-feet per yearAWWA: American Water Works AssociationAWPF: Advance Water Purification FacilityBOD: Biological Oxygen DemandCasitas MWD: Casitas Municipal Water DistrictCIP: Capital Improvement PlanCity: City of San BuenaventuraCOS: Cost of ServiceCPI: Consumer Price IndexFY: Fiscal yearGPCD: Gallons per capita per dayGPM: Gallons per minuteGW: GroundwaterHCF: One hundred cubic feetK: ThousandLbs: PoundsM: MillionManual M1: American Water Works Association’s Principles of Water Rates, Fees, and Charges: Manual of WaterSupply Practices - M1 Seventh EditionMax Day: Maximum day water demandMax Hour: Maximum hour water demandMG: One million gallonsMg/L: Milligrams per LiterMGD: One million gallons per dayNPDES Permit: National Pollutant Discharge Elimination System PermitO&M: Operations and maintenancePPM: Parts per millionR&R: Repair and replacementRCLD: Replacement cost less depreciationSCADA: Supervisory control and data acquisitionSRF Loan: Clean Water State Revolving Fund LoanSS: Suspended SolidsStudy Period: the rate-setting period of this study which extends through fiscal year 2025-26Ventura Water: The City of San Buenaventura’s water and wastewater departmentVWP: VenturaWaterPureVWRF: Ventura Water Reclamation FacilityWEF: Water Environment FederationWIFIA: Water Infrastructure Finance and Innovation ActWWTP: Wastewater treatment plant

2021 WATER AND WASTEWATER COST OF SERVICE AND RATE DESIGN STUDY
Fund Structure

VENTURA WATER
This page intentionally left blank to facilitate two-sided printing.


2021 WATER AND WASTEWATER COST OF SERVICE AND RATE DESIGN STUDY 1
1.Executive Summary1.1.Study OverviewPublic water and wastewater utilities in California typically perform a cost of service analysis every five to ten yearsto ensure that customers are appropriately charged for service commensurate with the cost to provide service.Ventura Water last conducted a water and wastewater cost of service study in 2014, which established proposedrates over a four-year period through Fiscal Year (FY) 2017-18. No rate increases have been implemented since thelast year of adopted rates went into effect in July 2017. Ventura Water engaged Raftelis to conduct a water andwastewater cost of service study to establish a proposed five-year schedule of water and wastewater rates throughFY 2025-26. Note that proposed rates cannot be implemented until formally adopted by City Council after a publichearing, absent a majority protest by parcels served by the City. Proposition 218 requires that Ventura Watercustomers be mailed a public hearing notice detailing proposed rate changes no fewer than 45 days before thepublic hearing.
The major objectives of this study are to:
» Develop a ten-year financial plan that sufficiently funds Ventura Water’s water and wastewater operationsand maintenance (O&M) expenses, debt service payments, and capital expenditures while adequatelyfunding reserves and achieving debt coverage requirements.
» Conduct cost of service analyses that establishes a clear nexus between the cost to serve water andwastewater customers and the rates charged to customers, per Proposition 218 and industry standards.
» Review Ventura Water’s existing water and wastewater rate structures and recommend changes asnecessary to ensure that proposed rates achieve the financial and policy objectives of the agency.
» Develop a five-year schedule of water and wastewater rates that are fair, equitable, and compliant withProposition 218.
» Develop a five-year schedule of water shortage rates that consider the City’s Water Shortage EventContingency Plan.
1.2.Rate Study ProcessThis study was conducted using industry-standard principles outlined by the American Water Works Association’sManual M1 and the Water Environment Federation’s Financing and Charges for Wastewater Systems. The overallprocess outlined below applies to the development of both water and wastewater rates.
1. Financial Plan: Develop cash flow projections for the Water and Wastewater Enterprise to determine theamount of revenue required from water and wastewater rates.
2. Cost of Service Analysis: Allocate costs to system components and then to various customer classes basedon user characteristics.
3. Rate Design: Develop rates that generate sufficient revenues based on the results of the financial plan andcost of service analyses and communicate the policy preferences of the agency.
4. Administrative Record Preparation: Develop an administrative record (this Study report) to document theresults of the rate study.
5. Rate Adoption: Proposed rates may be adopted by City Council only after holding a public hearing inaccordance with Proposition 218 requirements.

2 VENTURA WATER
1.3.Proposed Water Financial PlanRaftelis conducted a status quo cash flow analysis to evaluate whether existing water rates adequately fund theWater Enterprise’s various expenses over the five-year study period. Annual projections of revenues, O&Mexpenses, debt service payments, and capital expenditures through FY 2025-26 were developed with VenturaWater, Public Works, and Finance staff. Projected operating and capital costs resulting from VenturaWaterPure(VWP) are accounted for in the financial plan. Raftelis projects that with no rate increases over the five-year studyperiod, the Water Enterprise’s reserves will fall below the target reserve policy by FY 2024-25 and fail to meetminimum debt coverage in all years beginning in FY 2021-22. This demonstrates a clear need for revenueadjustments (i.e. gross water rate revenue increases relative to existing rate revenues). Raftelis worked with VenturaWater staff and the Water Commission to develop the following proposed revenue adjustments over the five-yearstudy period (see Table 1-1).
Table 1-1: Proposed Water Revenue AdjustmentsDescription FY 2021-22 FY 2022-23 FY 2023-24 FY 2024-25 FY 2025-26Effective Date July 1, 2021 July 1, 2022 July 1, 2023 July 1, 2024 July 1, 2025
Revenue Adjustment 7.0% 7.0% 7.0% 7.0% 7.0%
Key factors influencing the need for proposed revenue adjustments include:
» Cost inflation: Operating costs continue to increase year over year due to inflationary pressures.» Reduction in baseline water demand: Water sales are significantly lower relative to pre-drought years,
resulting in lower baseline variable water rate revenues.» Planned capital expenditures: CIP project expenditures through FY 2025-26, including substantial repair
and replacement (R&R) capital projects as well as VenturaWaterPure, the State Water InterconnectionProject, and the Eastside to Westside Waterline Interconnection Projects, total approximately $34.5million (M) per year on average.
Figure 1-1 shows the proposed CIP financing plan over the study period. All CIP exclusive of VenturaWaterPureis assumed to be funded by cash reserves. VenturaWaterPure CIP is assumed to be funded by a mix of low interestState and Federal government loans, revenue bonds, grants, and cash reserves.
Figure 1-1: Water Enterprise Capital Improvement Plan
2021 WATER AND WASTEWATER COST OF SERVICE AND RATE DESIGN STUDY 3
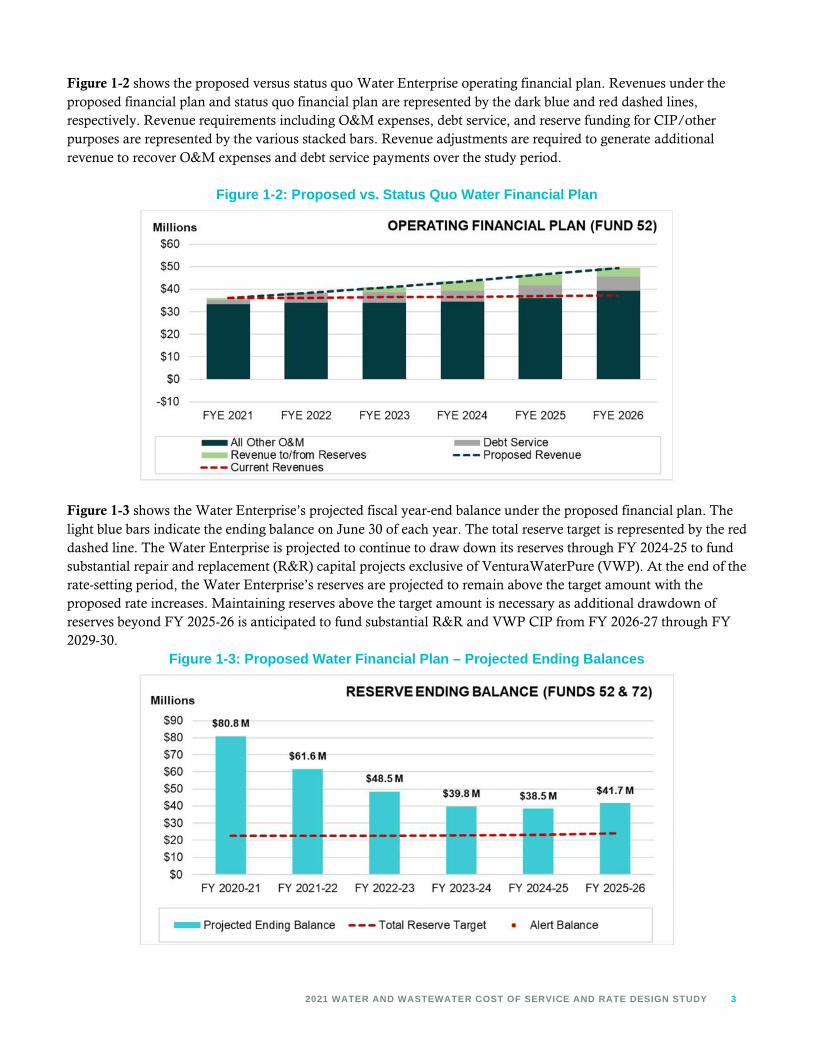
Figure 1-2 shows the proposed versus status quo Water Enterprise operating financial plan. Revenues under theproposed financial plan and status quo financial plan are represented by the dark blue and red dashed lines,respectively. Revenue requirements including O&M expenses, debt service, and reserve funding for CIP/otherpurposes are represented by the various stacked bars. Revenue adjustments are required to generate additionalrevenue to recover O&M expenses and debt service payments over the study period.
Figure 1-2: Proposed vs. Status Quo Water Financial Plan
Figure 1-3 shows the Water Enterprise’s projected fiscal year-end balance under the proposed financial plan. Thelight blue bars indicate the ending balance on June 30 of each year. The total reserve target is represented by the reddashed line. The Water Enterprise is projected to continue to draw down its reserves through FY 2024-25 to fundsubstantial repair and replacement (R&R) capital projects exclusive of VenturaWaterPure (VWP). At the end of therate-setting period, the Water Enterprise’s reserves are projected to remain above the target amount with theproposed rate increases. Maintaining reserves above the target amount is necessary as additional drawdown ofreserves beyond FY 2025-26 is anticipated to fund substantial R&R and VWP CIP from FY 2026-27 through FY2029-30.
Figure 1-3: Proposed Water Financial Plan – Projected Ending Balances

4 VENTURA WATER
Figure 1-4 shows projected debt coverage (blue line) relative to the debt coverage requirement (red line) over thestudy period. Debt coverage is expected to drop sharply in FY 2021-22 due to new debt issuances to finance aportion of VenturaWaterPure CIP project costs. This demonstrates the need for revenue adjustments early on inthe study period to ensure sufficient debt capacity to finance VenturaWaterPure. Failure to meet debt servicecoverage results in a technical default, which without foreseeable remedial action such as implementing rateincreases, could result in a downgrade of credit rating, higher costs in future debt issuance, or even denial of credit.
Figure 1-4: Proposed Water Financial Plan - Debt Coverage
1.4.Proposed Water RatesVentura Water’s existing water rate structure consists of fixed Water Service Charges (based on meter size), fixedFire Line Service Charges (based on fire line size), and variable Water Volume Rates (per hundred cubic feet [HCF]of water delivered). Raftelis worked closely with Ventura Water staff and the Water Commission to evaluatepotential changes to the existing water rate structure. The following changes are proposed:
» Adjust Rate Schedule to Reflect Monthly Billing Basis: Ventura Water plans to transition from billing ona bimonthly basis (every two months) to a monthly basis beginning in July 2021.
» Customer Class Consolidation: Raftelis recommends that the Institutional/Interruptible customer classand Non-Residential Irrigation customer classes are consolidated into a single Non-Residential Irrigationcustomer class.
» Eliminate Outside City Limits Surcharge.» Refinement to Fire Line Service Charges: Private fire lines associated with single family residential
accounts do not receive a separate bill for the Fire Line Service Charge. Therefore, Raftelis recommendsthat single family residential customers with U-branch fire lines are charged a unique rate to properly offsetbilling costs already paid by those customers via the Water Service Charge.
» Update Residential Tier Allotments: Raftelis recommends that the rate structure for residential WaterVolume Rates be consolidated from four tiers down to three tiers for both base rates and water shortage
2021 WATER AND WASTEWATER COST OF SERVICE AND RATE DESIGN STUDY 5
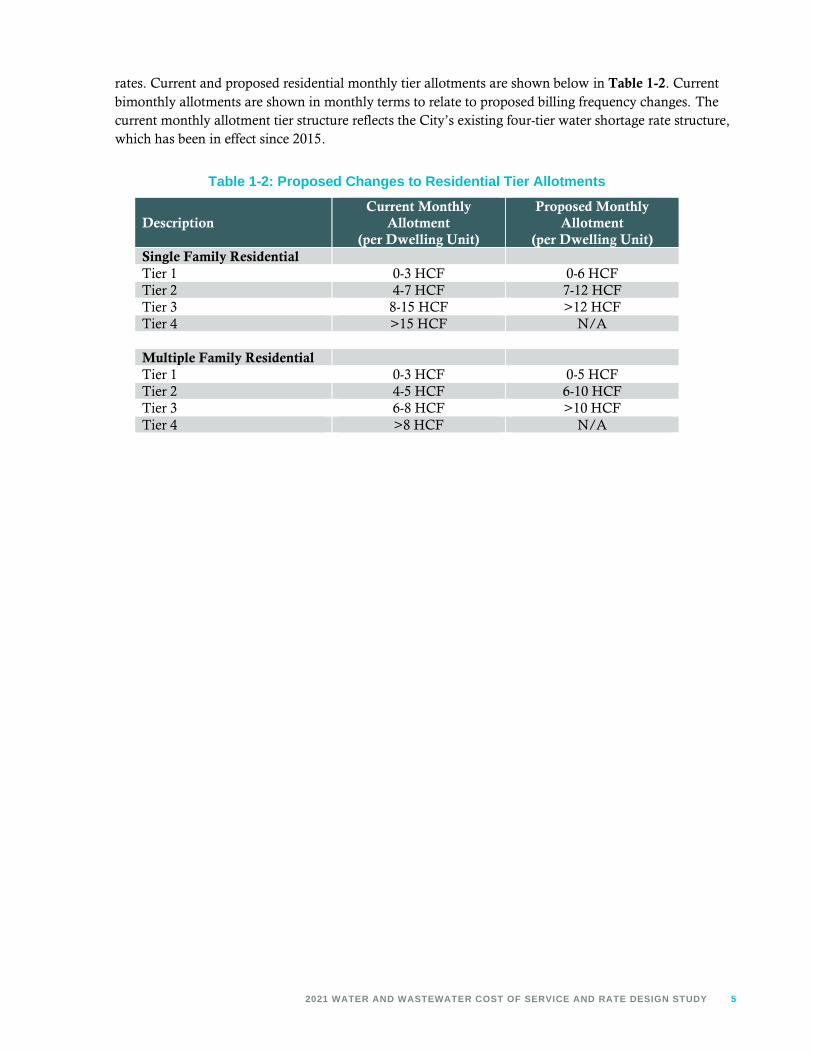
rates. Current and proposed residential monthly tier allotments are shown below in Table 1-2. Currentbimonthly allotments are shown in monthly terms to relate to proposed billing frequency changes. Thecurrent monthly allotment tier structure reflects the City’s existing four-tier water shortage rate structure,which has been in effect since 2015.
Table 1-2: Proposed Changes to Residential Tier Allotments
DescriptionCurrent Monthly
Allotment(per Dwelling Unit)
Proposed MonthlyAllotment
(per Dwelling Unit)Single Family ResidentialTier 1 0-3 HCF 0-6 HCFTier 2 4-7 HCF 7-12 HCFTier 3 8-15 HCF >12 HCFTier 4 >15 HCF N/A
Multiple Family ResidentialTier 1 0-3 HCF 0-5 HCFTier 2 4-5 HCF 6-10 HCFTier 3 6-8 HCF >10 HCFTier 4 >8 HCF N/A

6 VENTURA WATER
Table 1-3 shows proposed Water Service Charges, Fire Line Service Charges, and Water Volume Rates throughFY 2025-26. All fixed charges and tier allotments are shown on a monthly basis, as Ventura Water plans totransition to monthly billing beginning in July 2021. Current fixed charges are shown on a monthly basis. CurrentWater Volume Rates are Water Shortage Stage 2 rates. Proposed rates reflect non-shortage / new baseline supplyand demand conditions.

2021 WATER AND WASTEWATER COST OF SERVICE AND RATE DESIGN STUDY 7
Table 1-3: Proposed Five-Year Water Rate Schedule – Base Rates Only
Description CurrentProposedJuly 2021
ProposedJuly 2022
ProposedJuly 2023
ProposedJuly 2024
ProposedJuly 2025
Monthly Water Service Charge3/4-inch water meter $16.85 $18.50 $19.79 $21.18 $22.66 $24.251-inch water meter $25.52 $27.16 $29.06 $31.09 $33.27 $35.591.5-inch water meter $47.19 $48.80 $52.21 $55.87 $59.78 $63.962-inch water meter $73.21 $74.77 $80.00 $85.60 $91.60 $98.013-inch water meter $155.59 $157.02 $168.01 $179.77 $192.35 $205.814-inch water meter $276.99 $278.22 $297.69 $318.53 $340.83 $364.696-inch water meter $567.49 $568.24 $608.01 $650.57 $696.11 $744.848-inch water meter $1,044.42 $1,044.39 $1,117.50 $1,195.72 $1,279.42 $1,368.9810-inch water meter $1,651.43 $1,650.40 $1,765.93 $1,889.54 $2,021.81 $2,163.3412-inch water meter $2,171.72 $2,169.84 $2,321.73 $2,484.25 $2,658.14 $2,844.21
Monthly Fire Line Service Charge1-inch single family residential U-branch fire line
$4.40 $3.58 $3.83 $4.10 $4.39 $4.69
1-inch fire line $4.40 $9.09 $9.73 $10.41 $11.13 $11.912-inch fire line $4.40 $9.09 $9.73 $10.41 $11.13 $11.913-inch fire line $12.75 $15.90 $17.02 $18.21 $19.48 $20.844-inch fire line $27.15 $27.65 $29.59 $31.66 $33.88 $36.256-inch fire line $78.84 $69.83 $74.72 $79.95 $85.54 $91.538-inch fire line $168.01 $142.58 $152.56 $163.24 $174.66 $186.8910-inch fire line $302.13 $252.00 $269.64 $288.52 $308.71 $330.3212-inch fire line $488.01 $403.66 $431.92 $462.15 $494.50 $529.11
Water Volume Rates (per HCF)Single Family ResidentialTier 1 (Current: 0-3 HCF per month /Proposed: 0-6 HCF per month) $2.77 $2.92 $3.13 $3.34 $3.58 $3.83
Tier 2 (Current: 4-7 HCF per month /Proposed: 7-12 HCF per month) $3.12 $4.82 $5.16 $5.52 $5.90 $6.31
Tier 3 (Current: 8-15 HCF per month/ Proposed: >12 HCF per month) $4.62 $6.24 $6.67 $7.14 $7.64 $8.17
Tier 4 (Current: >15 HCF per month/ Proposed: N/A) $7.73 N/A N/A N/A N/A N/A
Multiple Family ResidentialTier 1 (Current: 0-3 HCF per month /Proposed: 0-5 HCF per month) $2.77 $2.92 $3.13 $3.34 $3.58 $3.83
Tier 2 (Current: 4-5 HCF per month /Proposed: 6-10 HCF per month) $3.12 $4.82 $5.16 $5.52 $5.90 $6.31
Tier 3 (Current: 6-8 HCF per month /Proposed: >10 HCF per month) $4.62 $6.24 $6.67 $7.14 $7.64 $8.17
Tier 4 (Current: >8 HCF per month /Proposed: N/A per month) $7.73 N/A N/A N/A N/A N/A
Non-Residential $3.98 $4.54 $4.85 $5.19 $5.56 $5.94Non-Residential Irrigation $4.25 $5.16 $5.52 $5.91 $6.32 $6.76Institutional/Interruptible $3.29 N/A N/A N/A N/A N/AUntreated Water $3.44 $3.08 $3.30 $3.53 $3.78 $4.04Reclaimed Water $0.95 $1.16 $1.23 $1.31 $1.38 $1.47
Outside City Limits Surcharge (per HCF)All Customer Classes $0.60 N/A N/A N/A N/A N/A

8 VENTURA WATER
1.5.Proposed Water Shortage SurchargesVentura Water conducted a Water Shortage Rate Study in 2015 to implement a schedule of increasing WaterVolume Rates during declared water shortage stages. This was necessary to recover revenue shortfalls resultingfrom reduced water sales during the recent drought. Water shortage stages are currently declared based on criteriaoutlined in Ventura Water’s 2015 Water Shortage Event Contingency Plan. Ventura Water is in the process ofupdating the 2015 Water Shortage Event Contingency Plan, which will incorporate updated criteria for declaringwater shortage stages. The 2020 Water Shortage Event Contingency Plan compares current supply and currentdemand, instead of current supply and normal supply as was done in the 2015 Water Shortage Event ContingencyPlan. Current demand will be estimated using the most recent five years of customer demands plus projecteddemands due to annual growth. The key impact of the update will be that water shortage stages are less likely to bedeclared under the new criteria. Based on new baseline water demand and projected supply conditions, it isanticipated that the current Stage 2 declaration will be rescinded, and no Water Shortage rates will be implementedin FY 2021-22.
Raftelis recommends that Ventura Water update the existing Water Shortage Rates. Under the current system ofWater Shortage Rates, Water Volume Rates increase with each subsequent water shortage stage beginning withStage 2. In place of adjusting Water Volume Rates with each stage, Raftelis recommends that Ventura Watermaintain the base-condition Water Volume Rates at each stage, and communicate the shortage conditions asWater Shortage Surcharges during Stages 2-6. This change does not affect the revenue needs during shortageconditions; it is recommended to more clearly communicate to customers the impact of water shortage conditionson each bill. Additionally, Raftelis recommends harmonizing the tier allotments in shortage and non-shortage ratesto simplify the schedule of shortage surcharges and to improve customer understanding. It also aligns with the costof service analysis behind the updated tier breakpoints, which is explained in later sections of this report. Currently,in shortage conditions, the first Residential tier is split in to two tiers, which yields a four-tier rate structure inshortage and a three-tier structure in non-shortage. The proposed Water Shortage Surcharges maintain the samethree-tier structure and the same allotments in shortage and non-shortage conditions. Table 1-4 shows proposedWater Shortage Surcharges for water shortage stage through FY 2025-26.
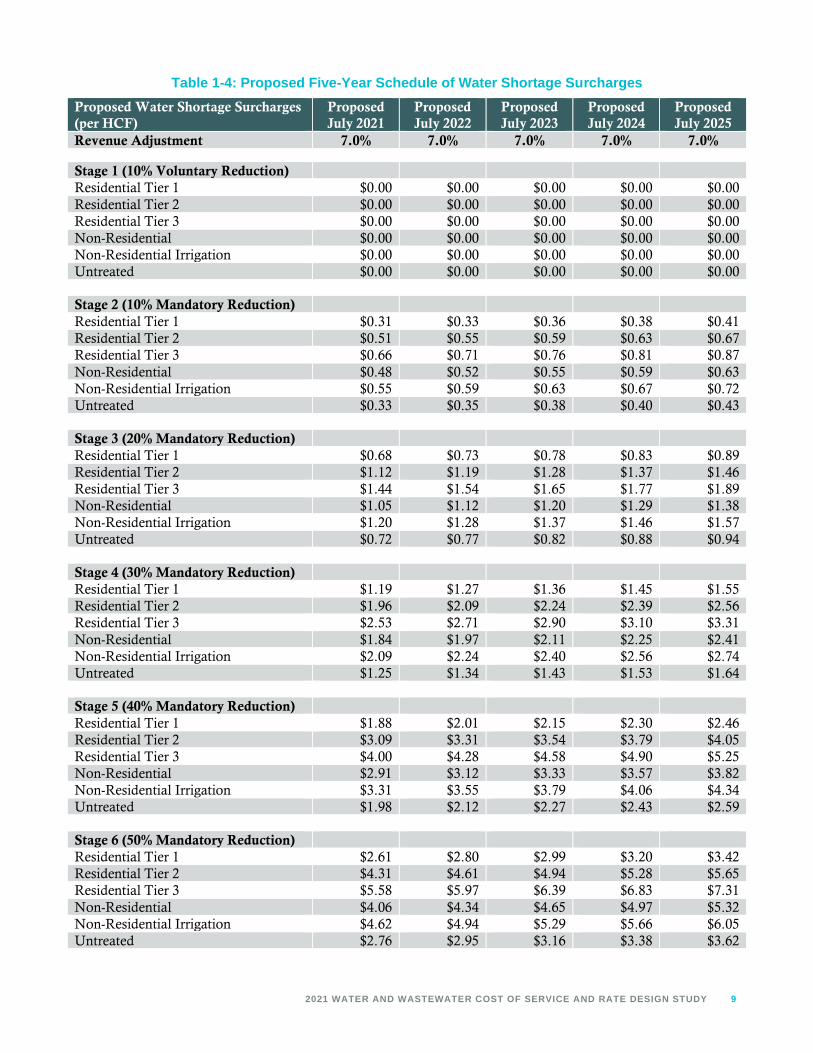
2021 WATER AND WASTEWATER COST OF SERVICE AND RATE DESIGN STUDY 9
Table 1-4: Proposed Five-Year Schedule of Water Shortage SurchargesProposed Water Shortage Surcharges(per HCF)
ProposedJuly 2021
ProposedJuly 2022
ProposedJuly 2023
ProposedJuly 2024
ProposedJuly 2025
Revenue Adjustment 7.0% 7.0% 7.0% 7.0% 7.0%
Stage 1 (10% Voluntary Reduction)Residential Tier 1 $0.00 $0.00 $0.00 $0.00 $0.00Residential Tier 2 $0.00 $0.00 $0.00 $0.00 $0.00Residential Tier 3 $0.00 $0.00 $0.00 $0.00 $0.00Non-Residential $0.00 $0.00 $0.00 $0.00 $0.00Non-Residential Irrigation $0.00 $0.00 $0.00 $0.00 $0.00Untreated $0.00 $0.00 $0.00 $0.00 $0.00
Stage 2 (10% Mandatory Reduction)Residential Tier 1 $0.31 $0.33 $0.36 $0.38 $0.41Residential Tier 2 $0.51 $0.55 $0.59 $0.63 $0.67Residential Tier 3 $0.66 $0.71 $0.76 $0.81 $0.87Non-Residential $0.48 $0.52 $0.55 $0.59 $0.63Non-Residential Irrigation $0.55 $0.59 $0.63 $0.67 $0.72Untreated $0.33 $0.35 $0.38 $0.40 $0.43
Stage 3 (20% Mandatory Reduction)Residential Tier 1 $0.68 $0.73 $0.78 $0.83 $0.89Residential Tier 2 $1.12 $1.19 $1.28 $1.37 $1.46Residential Tier 3 $1.44 $1.54 $1.65 $1.77 $1.89Non-Residential $1.05 $1.12 $1.20 $1.29 $1.38Non-Residential Irrigation $1.20 $1.28 $1.37 $1.46 $1.57Untreated $0.72 $0.77 $0.82 $0.88 $0.94
Stage 4 (30% Mandatory Reduction)Residential Tier 1 $1.19 $1.27 $1.36 $1.45 $1.55Residential Tier 2 $1.96 $2.09 $2.24 $2.39 $2.56Residential Tier 3 $2.53 $2.71 $2.90 $3.10 $3.31Non-Residential $1.84 $1.97 $2.11 $2.25 $2.41Non-Residential Irrigation $2.09 $2.24 $2.40 $2.56 $2.74Untreated $1.25 $1.34 $1.43 $1.53 $1.64
Stage 5 (40% Mandatory Reduction)Residential Tier 1 $1.88 $2.01 $2.15 $2.30 $2.46Residential Tier 2 $3.09 $3.31 $3.54 $3.79 $4.05Residential Tier 3 $4.00 $4.28 $4.58 $4.90 $5.25Non-Residential $2.91 $3.12 $3.33 $3.57 $3.82Non-Residential Irrigation $3.31 $3.55 $3.79 $4.06 $4.34Untreated $1.98 $2.12 $2.27 $2.43 $2.59
Stage 6 (50% Mandatory Reduction)Residential Tier 1 $2.61 $2.80 $2.99 $3.20 $3.42Residential Tier 2 $4.31 $4.61 $4.94 $5.28 $5.65Residential Tier 3 $5.58 $5.97 $6.39 $6.83 $7.31Non-Residential $4.06 $4.34 $4.65 $4.97 $5.32Non-Residential Irrigation $4.62 $4.94 $5.29 $5.66 $6.05Untreated $2.76 $2.95 $3.16 $3.38 $3.62

10 VENTURA WATER
Figure 1-5 shows sample monthly water bills for single family residential customers with a 3/4-inch water meter atvarying levels of water use under both current rates and proposed FY 2021-22 rates. Note that approximately 95percent of single family residential customers have a 3/4-inch water meter. The five water use levels shown arerepresentative of single family residential customer monthly water use at the 10th, 25th, 50th, 75th, and 90th
percentile.
Figure 1-5: Single Family Residential Monthly Water Bill Impacts (FY 2021-22)
1.6.Proposed Wastewater Financial PlanRaftelis conducted a status quo cash flow analysis to evaluate whether existing wastewater rates adequately fundthe Wastewater Enterprise’s various expenses over the rate-setting period. Projected operating and capital costsresulting from VenturaWaterPure are accounted for in the financial plan analysis. Raftelis projects that with no rateincreases over the five-year study period, the Wastewater Enterprise’s reserves will fall below the target reservepolicy by FY 2023-24 and fail to meet its debt coverage requirement beginning in FY 2024-25. This demonstrates aneed for revenue adjustments for the Wastewater Enterprise. Raftelis worked with Ventura Water, Public Works,and Finance staff and the Water Commission to develop the following schedule of proposed revenue adjustmentsover the five-year study period (see Table 1-5).
Table 1-5: Proposed Wastewater Revenue AdjustmentsDescription FY 2021-22 FY 2022-23 FY 2023-24 FY 2024-25 FY 2025-26Effective Date July 1, 2021 July 1, 2022 July 1, 2023 July 1, 2024 July 1, 2025
Revenue Adjustment 6.0% 6.0% 6.0% 6.0% 6.0%
Key factors influencing the need for proposed Wastewater Enterprise revenue adjustments include:
» Cost inflation: Operating costs continue to increase year over year due to inflationary pressures.
2021 WATER AND WASTEWATER COST OF SERVICE AND RATE DESIGN STUDY 11
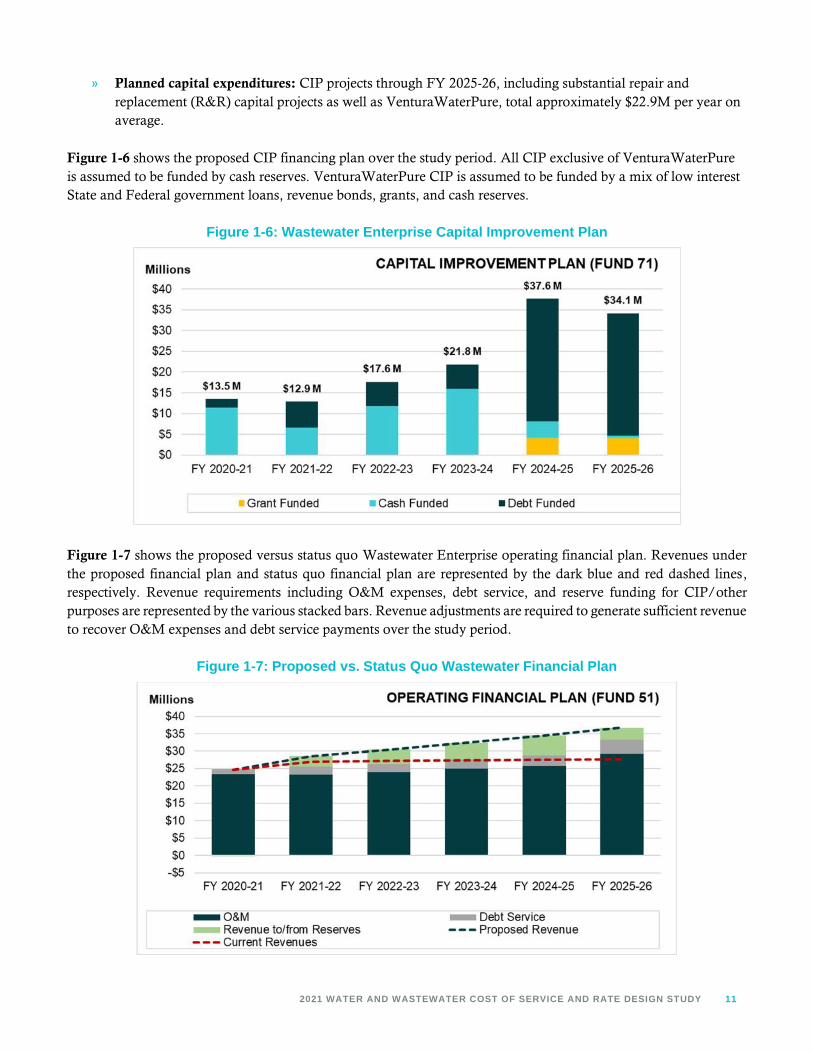
» Planned capital expenditures: CIP projects through FY 2025-26, including substantial repair andreplacement (R&R) capital projects as well as VenturaWaterPure, total approximately $22.9M per year onaverage.
Figure 1-6 shows the proposed CIP financing plan over the study period. All CIP exclusive of VenturaWaterPureis assumed to be funded by cash reserves. VenturaWaterPure CIP is assumed to be funded by a mix of low interestState and Federal government loans, revenue bonds, grants, and cash reserves.
Figure 1-6: Wastewater Enterprise Capital Improvement Plan
Figure 1-7 shows the proposed versus status quo Wastewater Enterprise operating financial plan. Revenues underthe proposed financial plan and status quo financial plan are represented by the dark blue and red dashed lines,respectively. Revenue requirements including O&M expenses, debt service, and reserve funding for CIP/otherpurposes are represented by the various stacked bars. Revenue adjustments are required to generate sufficient revenueto recover O&M expenses and debt service payments over the study period.
Figure 1-7: Proposed vs. Status Quo Wastewater Financial Plan

12 VENTURA WATER
Figure 1-8 shows the Wastewater Enterprise’s projected fiscal year-end balance under the proposed financial plan.The light blue bars indicate the ending balance on June 30 of each year. The total reserve target is represented bythe red dashed line. The Wastewater Enterprise is projected to draw down its reserves through FY 2023-24 to fundsubstantial R&R capital projects exclusive of VenturaWaterPure (VWP). By the end of the rate-setting period, theWastewater Enterprise’s reserves are projected to remain above the target amount with the proposed rate increases.Maintaining reserves above the target amount is necessary as additional drawdown of reserves beyond FY 2025-26is anticipated to fund substantial R&R and VWP CIP from FY 2026-27 through FY 2029-30.
Figure 1-8: Proposed Wastewater Financial Plan – Projected Ending Balances
Figure 1-9 shows projected debt coverage (blue line) relative to the debt coverage requirement (red line) over thestudy period. Fluctuations in debt coverage over the study period are largely due to new debt service assumed tofinance VenturaWaterPure CIP project costs. Debt coverage remains above the requirement throughout the studyperiod.
Figure 1-9: Proposed Wastewater Financial Plan - Debt Coverage

2021 WATER AND WASTEWATER COST OF SERVICE AND RATE DESIGN STUDY 13
1.7.Proposed Wastewater RatesVentura Water’s wastewater rate structure currently consists of Fixed Charges and Flow Charges for most customerclasses including residential, commercial, and churches. Schools are subject to a Fixed Charge only based on averagedaily attendance (ADA). Industrial customers are charged based on actual flow and strength measurements ofwastewater discharge. Raftelis worked closely with Ventura Water staff and the Water Commission to evaluatepotential changes to the existing wastewater rate structure. Raftelis recommends the following proposed changes:
» Adjust Rate Schedule to Reflect Monthly Billing Basis: Ventura Water plans to transition from billing ona bimonthly basis to a monthly basis beginning in July 2021.
» Eliminate Estuary Protection Charge: Raftelis recommends that Ventura Water eliminate the currentEstuary Protection Charge. This proposed change was supported by the Water Commission as a means tosimplify the wastewater rate structure and improve customer understanding. Note that there is no netrevenue impact resulting from this proposed change, as the proposed rates are designed to collectadditional revenue to offset the loss of Estuary Protection Charge revenue.
» Update Residential Flow Charge Basis: Raftelis recommends that Ventura Water modify existing FlowCharge basis for residential customers. Proposed changes to the residential Flow Charge basis aredescribed in detail in Table 1-6.
Table 1-6: Proposed Changes to Residential Wastewater Flow Charge Cap
Residential Wastewater Flow ChargeCurrent Bimonthly
Billing UnitsProposed Monthly
Billing UnitsSingle Family Residential Prior year winter average water
use for two full bimonthly billingcycles from approximatelyFebruary-May (in HCF) subjectto 30 HCF bimonthly cap.
Actual water use each monthlybilling period (in HCF) subject to12 HCF monthly cap.
Multiple Family Residential Prior year winter average wateruse for two full bimonthly billingcycles from approximatelyFebruary-May (in HCF) subjectto 24 HCF per dwelling unitbimonthly cap.
Actual water use each monthlybilling period (in HCF) subject to10 HCF per dwelling unitmonthly cap.
Table 1-7 shows proposed wastewater rates through FY 2025-26. All Fixed Charges and residential wastewaterflow caps are shown on a monthly basis, as Ventura Water plans to transition to monthly billing beginning in July2021.

14 VENTURA WATER
Table 1-7: Proposed Five-Year Wastewater Rate Schedule
Description Current1 ProposedJuly 2021
ProposedJuly 2022
ProposedJuly 2023
ProposedJuly 2024
ProposedJuly 2025
Single Family ResidentialMonthly Fixed Charge $12.84 $15.91 $16.86 $17.87 $18.94 $20.08Flow Charge (per HCF)2 $3.76 $3.75 $3.97 $4.21 $4.46 $4.73
Multiple Family ResidentialMonthly Fixed Charge(per dwelling unit)
$9.51 $11.73 $12.43 $13.17 $13.97 $14.80
Flow Charge (per HCF)3 $3.76 $3.75 $3.97 $4.21 $4.46 $4.73
CommercialMonthly Fixed Charge $12.84 $15.91 $16.86 $17.87 $18.94 $20.08Flow Charge (per HCF)
Group 1 $4.94 $5.22 $5.53 $5.86 $6.21 $6.59Group 2 $5.63 $5.53 $5.86 $6.21 $6.58 $6.98Group 3 $7.24 $6.75 $7.16 $7.59 $8.04 $8.53Group 4 $8.94 $8.05 $8.53 $9.04 $9.59 $10.16Group 5 $7.94 $7.44 $7.88 $8.36 $8.86 $9.39Group 6 $1.73 $1.57 $1.66 $1.76 $1.87 $1.98
ChurchesMonthly Fixed Charge $12.84 $15.91 $16.86 $17.87 $18.94 $20.08Flow Charge (per HCF) $3.70 $3.94 $4.17 $4.43 $4.69 $4.97
SchoolsMonthly Charge (per ADA) $100.64 $104.80 $111.09 $117.76 $124.82 $132.31
IndustrialFlow (per million gallons) $5,814.85 $6,148.36 $6,517.26 $6,908.30 $7,322.80 $7,762.16Chemical Oxygen Demand(per 1,000 lbs.)
$224.18 $170.87 $181.12 $191.99 $203.50 $215.71
Suspended Solids(per 1,000 lbs.)
$484.93 $350.30 $371.32 $393.59 $417.21 $442.24
Estuary Protection ChargeAll Customer Classes(% of WW Bill)
10% N/A N/A N/A N/A N/A
1All current rates shown on a monthly basis to provide a direct comparison to proposed rates.2 Single family residential wastewater customers are currently charged based on average winter water usage subject to a cap of 15 HCFper month. Beginning in FY 2021-22 it is proposed that single family residential wastewater customers will be charged based on actualwater usage each billing period subject to a cap of 12 HCF per month.3 Multiple family residential wastewater customers are currently charged based on average winter water usage subject to a cap of 12HCF per dwelling unit per month. Beginning in FY 2021-22 it is proposed that single family residential wastewater customers will becharged based on actual water usage each billing period subject to a cap of 10 HCF per dwelling unit per month.
2021 WATER AND WASTEWATER COST OF SERVICE AND RATE DESIGN STUDY 15
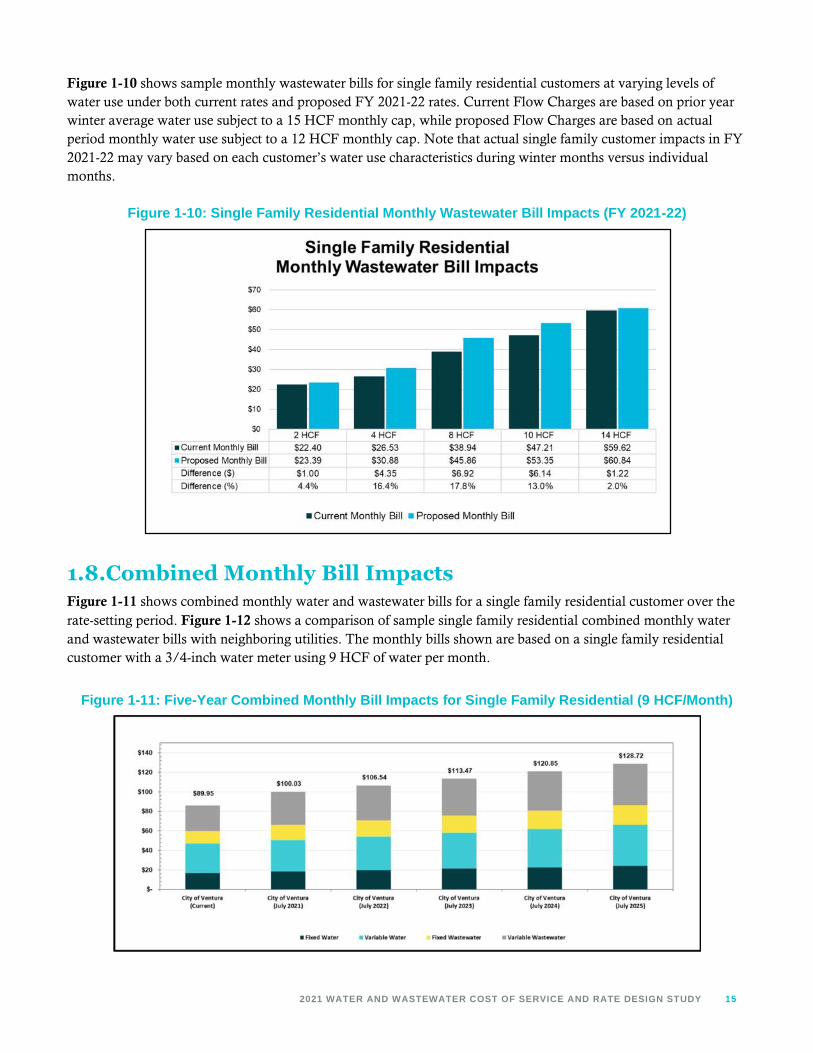
Figure 1-10 shows sample monthly wastewater bills for single family residential customers at varying levels ofwater use under both current rates and proposed FY 2021-22 rates. Current Flow Charges are based on prior yearwinter average water use subject to a 15 HCF monthly cap, while proposed Flow Charges are based on actualperiod monthly water use subject to a 12 HCF monthly cap. Note that actual single family customer impacts in FY2021-22 may vary based on each customer’s water use characteristics during winter months versus individualmonths.
Figure 1-10: Single Family Residential Monthly Wastewater Bill Impacts (FY 2021-22)
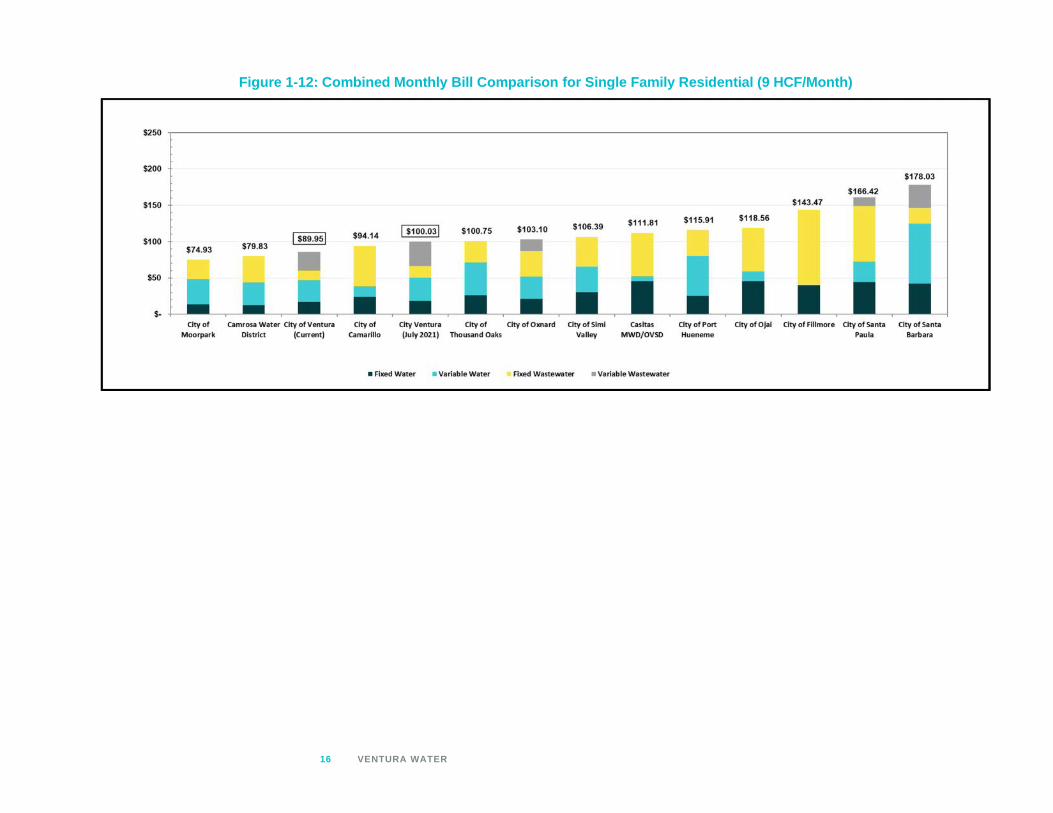
1.8.Combined Monthly Bill ImpactsFigure 1-11 shows combined monthly water and wastewater bills for a single family residential customer over therate-setting period. Figure 1-12 shows a comparison of sample single family residential combined monthly waterand wastewater bills with neighboring utilities. The monthly bills shown are based on a single family residentialcustomer with a 3/4-inch water meter using 9 HCF of water per month.
Figure 1-11: Five-Year Combined Monthly Bill Impacts for Single Family Residential (9 HCF/Month)
16 VENTURA WATER
Figure 1-12: Combined Monthly Bill Comparison for Single Family Residential (9 HCF/Month)
2021 WATER AND WASTEWATER COST OF SERVICE AND RATE DESIGN STUDY 17
2.Introduction2.1.Agency OverviewThe City of San Buenaventura’s (Ventura) water and wastewater department (Ventura Water) provides water andwastewater service to a population of over 109,000 people through about 30,000 metered water connections andsewer connections. Most Ventura Water customers are located within city limits. Additionally, about 1,000metered water connections served by Ventura Water are located outside of city limits, mainly within the City’sSphere of Influence. Ventura Water’s water system consists of three water treatment plants, 385 miles ofdistribution pipelines, over 20 pump stations, and over 30 storage reservoirs. The wastewater system consists of awastewater treatment plant, 290 miles of collection pipelines, 10 miles of sewer mains, and over 10 lifts stations.
Ventura Water’s current potable water supply sources include the Ventura River at Foster Park, MoundGroundwater Bain, Oxnard Plain Groundwater Basin, Santa Paula Groundwater Basin, and treated water fromCasitas Municipal Water District (Casitas MWD). Future supply sources will include imported water from theState Water Project upon completion of the State Water Interconnection Project and indirect potable reuse uponcompletion of the VenturaWaterPure project. Ventura Water customers significantly reduced water demandthrough conservation and efficiency measures in response to pervasive drought conditions since 2015. Waterdemand has been consistent at lower levels through 2019.
Ventura Water also maintains a wastewater collection system which transports wastewater discharge fromcustomers to its Ventura Water Reclamation Facility (VWRF), which provides tertiary wastewater treatment. Aportion of treated wastewater is delivered to reclaimed water customers for non-potable Non-Residential Irrigationand the remainder is discharged to the Santa Clara River Estuary. To meet regulatory wastewater dischargerequirements (both the VWRF National Pollutant Discharge Elimination System (NPDES) Permit and TertiaryTreated Flows Federal Consent Decree (Consent Decree)), Ventura Water is planning to construct a newAdvanced Water Purification Facility (AWPF) over the next five years as part of its VenturaWaterPure Program.Upon completion, tertiary treated wastewater currently discharged to the Santa Clara River Estuary will be treatedto a higher standard through a multi-stage purification process before being conveyed to local injection sites intothe local groundwater basin. This program – VenturaWaterPure - will achieve the requirements of the VWRFNPDES Permit and the Consent Decree while adding an additional source of local and reliable potable watersupply.
2.2. Study OverviewPublic water and wastewater utilities in California typically perform a cost of service analysis every five to ten yearsto ensure that customers are appropriately charged for service commensurate with the cost to provide service.Ventura Water last conducted a water and wastewater cost of service study in 2014, which established proposedrates over a four-year period through Fiscal Year (FY) 2017-18. Additionally, Ventura Water conducted a watershortage rate study in 2015 to establish water shortage rates to recover sufficient rate revenue during periods ofdrought or other water supply shortages. No rate increases have been implemented since the last year of adoptedrates went into effect in July 2017.
Ventura Water engaged Raftelis in 2020 to conduct a water and wastewater cost of service study to establish aproposed five-year schedule of water and wastewater rates through FY 2025-26. The results of the study aredocumented within this report. Note that proposed rates cannot be implemented until formally adopted by City

18 VENTURA WATER
Council after a public hearing. Proposition 218 requires that Ventura Water customers must be mailed a publichearing notice detailing any proposed rate changes no fewer than 45 days before the public hearing. The noticeincludes a customer’s right to protest the rate proposal.
Study Objectives
The major objectives of this study are to:
» Develop a ten-year financial plan that sufficiently funds Ventura Water’s water and wastewater operationsand maintenance (O&M) expenses, debt service payments, and capital expenditures while adequatelyfunding reserves and achieving debt coverage requirements.
» Conduct cost of service analyses that establish a clear nexus between the cost to serve water andwastewater customers and the rates charged to customers, per Proposition 218 and industry standards.
» Review Ventura Water’s existing water and wastewater rate structures to ensure that proposed ratesachieve the financial and policy objectives of the agency.
» Develop a five-year schedule of water and wastewater rates that are fair, equitable, and compliant withProposition 218 requirements.
» Develop a five-year schedule of updated water shortage rates that consider the City’s Water Shortage EventContingency Plan.
Key Changes Since Prior Rate Study
Reduction in baseline water demand: Since the prior cost of service study was conducted in 2014, Ventura Wateroperations have undergone substantial changes. Most notably, drought conditions through 2016 in Californiaresulted in significant reductions in baseline water demand. Total water demand in FY 2019-20 was approximately18 percent lower than in FY 2012-13 (which water demand projections in the 2014 rate study were based on).Ventura Water collects approximately 70 percent of its water rate revenues through Water Volume Rates chargedper unit of water delivered and 75 percent of its wastewater rate revenues though Flow Charges based on wateruse. Reductions in baseline water demand therefore result in the need to increase variable rates to offset reductionsin variable billing units. Water shortage rates in effect over the last five years mitigated the impact of reduced waterdemand on rate revenues. Because water demand has hardened because of changes in customer water conservationpractices since 2015, proposed water and wastewater rates are designed to reflect new normal water demand.
Capital Expenditures: Ten-year projected water and wastewater capital expenditures (through FY 2029-30) in thisstudy are over $16.8M higher per year than the prior study’s ten-year projected capital expenditures (through FY2022-23). This represents greater than a 50 percent increase in annual average water and wastewater capitalexpenditures relative to the prior study (which current rates are based on). Slightly over half of ten-year projectedwater and wastewater capital expenditures through FY 2029-30 are associated with the VenturaWaterPureProgram components. A significant portion of the remaining R&R capital program represents a backlog of delayedprojects.
VenturaWaterPure Program: In the interim years since the last rate study the VenturaWaterPure Program hasbeen selected by the City as the preferred alternative project to achieve the requirements of the VWRF NPDESPermit and the Consent Decree. As designed, the multi-benefit program has an estimated value of approximately$260M across all project components and phases (Phases 1a and 1b). The project components consist of severalcapital improvement projects including land acquisition for the Advanced Water Purification Facility (AWPF),Advanced Water Purification Facility, Brine line and Ocean Outfall, Aquifer Storage and Recovery, pipelines,

2021 WATER AND WASTEWATER COST OF SERVICE AND RATE DESIGN STUDY 19
pump stations and Wetlands Improvements. The program is larger in scale and value than the alternatives modeledin the prior rate study because it is now a multi-benefit program comprised of several project components. Themulti-benefits include meeting the City’s regulatory and legal requirements, improved system water quality, and anew drought-resilient water supply source. Moderating the effects of this change are current favorable terms andinterest rates for public debt and low-interest government loans.

20 VENTURA WATER
3.Legal Requirements andRate Setting Methodology
3.1.Legal RequirementsCalifornia Constitution - Article XIII D, Section 6 (Proposition 218)Proposition 218, reflected in the California Constitution as Article XIII D, was enacted in 1996 to ensure that ratesand fees are reasonable and proportional to the cost of providing service. The principal requirements, as they relateto public water and wastewater service are as follows:
1. A property-related charge (which include water or wastewater rates) imposed by a public agency on a parcelshall not exceed the costs required to provide the property-related service.
2. Revenues derived by the charge shall not be used for any purpose other than that for which the charge wasimposed.
3. The amount of the charge imposed upon any parcel shall not exceed the proportional cost of serviceattributable to the parcel.
4. No charge may be imposed for a service unless that service is actually used or immediately available to theowner of the property.
5. A written notice of the proposed charge shall be mailed to both the customer of record and owner of recordof each parcel at least 45 days prior to the public hearing, when the agency considers all written protestsagainst the charge.
As stated in the American Water Works Association’s (AWWA) Principles of Water Rates, Fees, and Charges: Manualof Water Supply Practices - M1 Seventh Edition (Manual M1), “water rates and charges should be recovered fromclasses of customers in proportion to the cost of serving those customers.” Raftelis follows industry standard ratesetting methodologies set forth by the AWWA’s Manual M1 to ensure the water cost of service analysis presentedin this study meets Proposition 218 requirements and establishes rates that do not exceed the proportionate cost ofproviding water services on a parcel basis. The methodology in the Manual M1 is a nationally recognized industryratemaking standard which courts have recognized as consistent with Proposition 218. Similarly, the wastewatercost of service presented in this study was conducted in accordance with principles established by the WaterEnvironment Federation (WEF) and described in Financing and Charges for Wastewater Systems.
California Constitution Article X, Section 2California Constitution Article X, Section 2 mandates that water resources be put to beneficial use and that thewaste or unreasonable use of water be prevented. Section 106 of the Water Code declares that the highest priorityuse of water is for domestic purposes, with Non-Residential Irrigation the next highest priority. Thus, managementof water resources is part of the property-related service provided by public water suppliers to ensure the resource isavailable over time. Ventura Water currently has inclining tiered (also known as inclining block) water rates toincentivize residential customers to conserve water. The inclining tiered rates must be based on the proportionatecosts incurred to provide water to customers to achieve compliance with Proposition 218. “Inclining” tiered ratestructures (which are synonymous with “increasing” tier rate structures and “tiered” rates), when properlydesigned, allow a water utility to send conservation price signals to customers. Due to heightened interest in waterconservation and efficiency of water use, tiered water rates have gained widespread use, especially in relatively

2021 WATER AND WASTEWATER COST OF SERVICE AND RATE DESIGN STUDY 21
water-scarce regions like Southern California. Tiered rates meet the requirements of Proposition 218 as long as theyreasonably reflect the proportionate cost of providing service for each tier.
3.2.Rate-Setting MethodologyThis study was conducted using industry-standard principles outlined by the AWWA’s Manual M1 and WEF’sFinancing and Charges for Wastewater Systems. The process and approach Raftelis utilized in the study to determinerates is informed by Ventura Water’s policy objectives, the current system of rates, and the legal requirements inCalifornia (namely, Proposition 218). The resulting financial plans, cost of service analyses, and rate design processfollows five key steps, outlined below, to determine proposed rates that fulfill Ventura Water’s objectives, meetindustry standards, and comply with relevant regulations. The overall process outlined below applies to the cost ofservice analyses for both water and wastewater.
1. Financial Plan: The first study step is to develop a multi-year financial plan that projects the Water andWastewater Enterprises’ revenues, expenses, capital project financing, annual debt service, and reservefunding. The financial plan is used to determine revenue adjustments needed to recover adequate revenuesto fund expenses and reserves.
2. Revenue Requirement Determination: After completing the financial plan, the rate-making process beginswith the determination of the revenue requirement for the test year, also known as the cost-of service year.The test year for this study is FY 2020-21. The revenue requirement should sufficiently fund the Water andWastewater Enterprises’ operating costs, annual debt service (including coverage requirements), capitalexpenditures, and reserve funding needs.
3. Cost of Service Analysis: The annual cost of providing water or wastewater service (i.e. the revenuerequirement) is then distributed to customer classes commensurate with their use of and burden on thesystem. A cost of service analysis involves the following steps:
» Functionalize costs – the different components of the revenue requirement are categorized intofunctions such as supply, transmission, storage, customer service, etc. (for water) and collection,treatment, customer, etc. (for wastewater)
» Allocate to cost causation components – the functionalized costs are then allocated to costcausation components such as supply, base delivery, peaking, etc. (for water) and flow, strength,etc. (for wastewater)
» Develop unit costs – unit costs for each cost causation component are determined using units ofservice
» Distribute cost components – the cost components are allocated to each customer class and tierusing the unit costs in proportion to their demand and burden on the system.
A water cost of service analysis considers both the average water demand and peak demand. Peaking, orextra-capacity, costs are incurred during periods of peak consumption, most often coinciding with summerwater use. There are additional capacity-related costs associated with designing, constructing, operating,maintaining, and replacing facilities to meet peak demand. Patterns of use impose additional costs on awater utility and are used to determine the cost burden on peaking-related facilities. Similarly, awastewater cost of service analysis considers the amount of wastewater treatment plant influentcontributed by each customer class in order to account for customer differences in the quantity andstrength of wastewater discharges.
22 VENTURA WATER
4. Rate Design: After allocating the revenue requirement to each customer class, the rate design and calculationprocess can begin. Rates do more than simply recover costs; within the legal framework and industrystandards, properly designed rates should support and optimize Ventura Water’s policy objectives. Ratesalso act as a public information tool in communicating policy objectives to customers. This process alsoincludes a bill impact analysis.
5. Administrative Record Preparation and Rate Adoption: The final step in a rate study is to develop theadministrative record in conjunction with the rate adoption process. This report serves as the administrativerecord for this study. The administrative record documents the study results and presents the methodologies,rationale, justifications, and calculations used to determine the proposed rates. A thorough andmethodological administrative record serves two important functions: maintaining defensibility in a stringentlegal environment and communicating the rationale for revenue adjustments and proposed rates tocustomers and key stakeholders.

2021 WATER AND WASTEWATER COST OF SERVICE AND RATE DESIGN STUDY 23
4.Water Rate Study4.1.Key Inputs and AssumptionsRaftelis developed a water rate model in Microsoft Excel to project financial calculations over the next ten fiscalyears with projections shown in this report through the five-year rate-setting period of FY 2025-26 (i.e. the “studyperiod”). Please refer to Appendix B for ten-year financial plan projections through FY 2029-30. The City’s fiscalyear spans from July 1 through June 30. Projections in future years were generally made based on actual orestimated data for FY 2018-19 or FY 2019-20 or the adopted budget for FY 2020-21 using key assumptionsoutlined below. Assumptions were discussed with, and reviewed by, Ventura Water, Public Works, and Financestaff to ensure that the City water system’s unique characteristics are accurately accounted for. Note that most tablevalues shown throughout this report are rounded to the last digit shown and may therefore not sum precisely to thetotals shown.
4.1.1.CURRENT WATER RATES
Table 4-1 shows the rates currently in effect in FY 2020-21, which were developed during the prior rate study in2014. Customers are currently billed bimonthly for two primary charges: 1) Water Service Charges and 2) WaterVolume Rates per hundred cubic feet (HCF)4 of water delivered. The Water Service Charge is a fixed bimonthlycharge that varies based on meter size. Additionally, customers with private fire lines are subject to a fixedbimonthly Fire Line Service Charge. Water Volume Rates vary based on customer classes. Residential customersare subject to a four-tiered Water Volume Rate structure. All other customer classes are subject to a uniform WaterVolume Rate. Base water rates have not changed since July 2017. However, Water Volume Rates were reduced atend of FY 2019-20 when a Stage 3 water shortage was downgraded to Stage 2. Current Water Volume Ratesshown throughout this study reflect Stage 2 shortage rates. All current rates and tier allotments are shown on abimonthly basis. However, Ventura Water plans to transition from bimonthly to monthly billing beginning in July2021. All proposed rates and tier allotments presented in subsequent sections of this report are therefore shown inmonthly terms.
4 One HCF equals approximately 748 gallons.

24 VENTURA WATER
Table 4-1: Current Water RatesDescription FY 2020-21Bimonthly Water Service Charge3/4-inch water meter $33.691-inch water meter $51.031.5-inch water meter $94.382-inch water meter $146.423-inch water meter $311.184-inch water meter $553.986-inch water meter $1,134.978-inch water meter $2,088.8410-inch water meter $3,302.8512-inch water meter $4,343.44
Bimonthly Fire Line Service Charge1-inch fire line $8.792-inch fire line $8.793-inch fire line $25.494-inch fire line $54.296-inch fire line $157.688-inch fire line $336.0110-inch fire line $604.2512-inch fire line $976.02
Stage 2 Water Volume Rates (per HCF)Single Family ResidentialTier 1 (0-6 HCF per bimonthly billing period) $2.77Tier 2 (7-14 HCF per bimonthly billing period) $3.12Tier 3 (15-30 HCF per bimonthly billing period) $4.62Tier 4 (>30HCF per bimonthly billing period) $7.73
Multiple Family ResidentialTier 1 (0-6 HCF per bimonthly billing period) $2.77Tier 2 (7 -10 HCF per bimonthly billing period) $3.12Tier 3 (11-16HCF per bimonthly billing period) $4.62Tier 4 (>16 HCF per bimonthly billing period) $7.73
Non-Residential $3.98Non-Residential Irrigation $4.25Institutional/Interruptible $3.29Untreated Water $3.44Reclaimed Water $0.95
Outside City Limits Surcharge (per HCF)All Customer Classes $0.60
Current residential tier allotments are shown in Table 4-2. For single family residential customers: the first 6 HCFused each bimonthly billing period is charged at the lowest rate (Tier 1), the next 8 HCF at a higher rate (Tier 2),the next 16 HCF at an even higher rate (Tier 3), and any additional use at the highest rate (Tier 4). For multiplefamily residential customers: the first 6 HCF used per dwelling unit each bimonthly billing period is charged at thelowest rate (Tier 1), the next 4 HCF at a higher rate (Tier 2), the next 6 HCF at an even higher rate (Tier 3), and

2021 WATER AND WASTEWATER COST OF SERVICE AND RATE DESIGN STUDY 25
any additional use at the highest rate (Tier 4). Multiple family residential customers have smaller tier allotmentsdue to smaller average household size and reduced outdoor water use on a per dwelling unit basis.
Table 4-2: Current Residential Tier Allotments for Water Volume Rates
Bimonthly TierAllotments
Single FamilyResidential
Multiple FamilyResidential
(per Dwelling Unit)Tier 1 0-6 HCF 0-6 HCFTier 2 7-14 HCF 7-10 HCFTier 3 15-30 HCF 11-16 HCFTier 4 >30 HCF >16 HCF
Some water utilities include elevation electricity surcharges for customer parcels in elevated zones, but only ifwarranted by the water system’s design, if the costs applicable to the elevated zones can feasibly be calculated andassigned with relative certainty and consistent with cost of service principles, and if the relative differential costs arenot outweighed by the administrative costs of evaluating and administering the elevation surcharge. Most utilitiesin California do not have these surcharges due to their complexity. Ventura Water’s existing water rate structuredoes not include electricity surcharges for Ventura Water’s elevated distribution zones and we do not recommendthat they be added for this study period. Raftelis reviewed the issue with Ventura Water staff and confirmed that itis not feasible to reasonably assign electrical costs to specific zones due the complex nature of the City’s watersystem and its 16 pressure zones, and the movement of water throughout that system. Additionally, the lowerpressure zones receive a storage benefit from the storage in tanks and reservoirs in the elevated zones, especially inthe event of an emergency. Finally, it is anticipated that any modest cost differential that might exist if anelevation electricity surcharge could be calculated is outweighed by the administrative costs of determining,administering, and applying such a surcharge.
4.1.2.WATER ENTERPRISE FINANCIAL ASSUMPTIONS
Inflationary assumptions shown in Table 4-3 are used to escalate projected non-rate revenues and operations andmaintenance (O&M) expenses beyond FY 2020-21. For O&M expenses, the general inflation rate is consistent withlong-term changes in the Consumer Price Index (CPI). Salary and benefit inflationary increases were provided byVentura Water and Finance staff, as water utility personnel cost increases are typically agency-specific. All otherO&M expense inflationary assumptions were developed by Raftelis based on professional judgement and availableindustry indices. The capital inflation factor is used to adjust uninflated capital project cost estimates provided toRaftelis by Ventura Water and Public Works staff.
Table 4-3: Water Enterprise Inflationary AssumptionsInflationary Categories FY 2021-22 FY 2022-23 FY 2023-24 FY 2024-25 FY 2025-26Non-Rate RevenuesMiscellaneous 0.00% 0.00% 0.00% 0.00% 0.00%
ExpensesGeneral 3.00% 3.00% 3.00% 3.00% 3.00%Salaries 5.38% 3.87% 3.53% 3.53% 1.08%Benefits 5.38% 3.87% 3.53% 3.53% 1.08%Utilities 5.00% 5.00% 5.00% 5.00% 5.00%Chemicals 5.00% 5.00% 5.00% 5.00% 5.00%Water Supply 3.00% 3.00% 3.00% 3.00% 3.00%Capital 4.00% 4.00% 4.00% 4.00% 4.00%

26 VENTURA WATER
Additional financial assumptions relating to interest earnings are shown in Table 4-4. Interest earnings on cashreserves are projected assuming a one percent annual interest rate.
Table 4-4: Additional Water Enterprise Financial AssumptionsDescription ValueInterest EarningsAnnual Interest Rate 1.0%
4.1.3.PROJECTED WATER SERVICE CONNECTIONS
Water connection growth projections are necessary to estimate water demand and rate revenues over the studyperiod. Ventura Water staff provided Raftelis with the number of water meters and fire lines by size for FY 2019-20.Raftelis then applied a 0.54% annual account growth rate5 to all connection types to project the number of watermeters and fire lines in each year over the study period (see Table 4-5).
Table 4-5: Number of Water Meters and Fire Lines
DescriptionActual
FY 2019-20Projected
FY 2020-21Projected
FY 2021-22Projected
FY 2022-23Projected
FY 2023-24Projected
FY 2024-25Projected
FY 2025-26Projected Annual Growth N/A 0.54% 0.54% 0.54% 0.54% 0.54% 0.54%
Number of Water Meters3/4-inch water meter 25,063 25,198 25,334 25,471 25,609 25,747 25,8861-inch water meter 2,487 2,500 2,514 2,528 2,541 2,555 2,5691.5-inch water meter 951 956 961 966 972 977 9822-inch water meter 734 738 742 746 750 754 7583-inch water meter 115 116 116 117 118 118 1194-inch water meter 70 70 71 71 72 72 726-inch water meter 74 74 75 75 76 76 768-inch water meter 7 7 7 7 7 7 710-inch water meter 2 2 2 2 2 2 212-inch water meter 0 0 0 0 0 0 0Temporary meters onhydrant
69 69 70 70 71 71 71
Total 29,572 29,732 29,892 30,054 30,216 30,379 30,543
Number of Fire Lines1-inch fire line 2,451 2,464 2,478 2,491 2,504 2,518 2,5312-inch fire line 27 27 27 27 28 28 283-inch fire line 2 2 2 2 2 2 24-inch fire line 328 330 332 333 335 337 3396-inch fire line 267 268 270 271 273 274 2768-inch fire line 117 118 118 119 120 120 12110-inch fire line 16 16 16 16 16 16 1712-inch fire line 0 0 0 0 0 0 0Total 3,208 3,225 3,243 3,260 3,278 3,296 3,313
5 From Ventura Water’s 2020 Comprehensive Water Resources Report. The growth rate is provided to Ventura Water staff byPlanning staff and is based on the Department of Finance historical data for population.

2021 WATER AND WASTEWATER COST OF SERVICE AND RATE DESIGN STUDY 27
4.1.4.PROJECTED WATER SALES
Ventura Water staff provided Raftelis with total annual water use data by customer class for FY 2016-17 through FY2019-20. Raftelis worked closely with Ventura Water staff to develop water use projections over the study period.Water demand projections depend on two key assumptions: new connection growth and water demand perconnection. Beginning in FY 2020-21, annual water use was projected at the customer class level by increasing prioryear water use based on both assumed connection growth and water demand per connection. Table 4-6 showsprojected water use by customer class over the study period based on the current water rate structure. A five percentincrease in demand per connection is assumed in FY 2020-21 because of the downgrade from a Stage 3 water shortageto Stage 2 at the end of FY 2019-20. It is assumed that after FY 2020-21 there will be no further increases in waterdemand per connection. Total water use is shown in both hundred cubic feet and acre-feet (AF).

28 VENTURA WATER
Table 4-6: Projected Water Use Under Existing Rate Structure
DescriptionActual
FY 2019-20Projected
FY 2020-21Projected
FY 2021-22Projected
FY 2022-23Projected
FY 2023-24Projected
FY 2024-25Projected
FY 2025-26Growth AssumptionsAccount Growth N/A 0.54% 0.54% 0.54% 0.54% 0.54% 0.54%Demand per Connection N/A 5.00% 0.00% 0.00% 0.00% 0.00% 0.00%Water Sales Increase6 N/A 5.57% 0.54% 0.54% 0.54% 0.54% 0.54%
Water Sales (HCF) - Inside City LimitsResidential Tier 1 1,511,080 1,595,202 1,603,816 1,612,477 1,621,184 1,629,939 1,638,740Residential Tier 2 1,078,603 1,138,649 1,144,798 1,150,980 1,157,195 1,163,444 1,169,727Residential Tier 3 745,692 787,204 791,455 795,729 800,026 804,346 808,690Residential Tier 4 211,416 223,185 224,390 225,602 226,820 228,045 229,277Non-Residential 1,363,580 1,439,490 1,447,264 1,455,079 1,462,936 1,470,836 1,478,779Non-ResidentialIrrigation
5,994 6,328 6,362 6,396 6,431 6,465 6,500
Institutional/Interruptible 150,475 158,852 159,710 160,572 161,439 162,311 163,188Untreated Water 0 0 0 0 0 0 0Reclaimed Water 244,429 258,036 259,430 260,831 262,239 263,655 265,079Casitas Direct 4 4 4 4 4 4 4Other7 987 1,042 1,048 1,053 1,059 1,065 1,070Subtotal 5,312,260 5,607,994 5,638,277 5,668,723 5,699,334 5,730,111 5,761,053
Water Sales (HCF) - Outside City Limits excluding Saticoy Country Club SystemResidential Tier 1 35,367 37,336 37,538 37,741 37,944 38,149 38,355Residential Tier 2 26,886 28,383 28,536 28,690 28,845 29,001 29,157Residential Tier 3 22,443 23,692 23,820 23,949 24,078 24,208 24,339Residential Tier 4 19,092 20,155 20,263 20,373 20,483 20,593 20,705Non-Residential 96,152 101,504 102,053 102,604 103,158 103,715 104,275Non-ResidentialIrrigation
1,717 1,813 1,822 1,832 1,842 1,852 1,862
Untreated Water 25,260 26,666 26,810 26,955 27,101 27,247 27,394Casitas Direct 33,953 35,843 36,037 36,231 36,427 36,624 36,821Other1 5,009 5,288 5,316 5,345 5,374 5,403 5,432Subtotal 265,879 280,680 282,196 283,720 285,252 286,792 288,341
Water Sales (HCF) - Saticoy Country Club SystemResidential Tier 1 5,704 6,022 6,054 6,087 6,120 6,153 6,186Residential Tier 2 5,018 5,297 5,325 5,354 5,383 5,412 5,441Residential Tier 3 3,713 3,920 3,941 3,962 3,984 4,005 4,027Residential Tier 4 3,848 4,062 4,084 4,106 4,128 4,150 4,173Non-ResidentialIrrigation
3,396 3,585 3,605 3,624 3,644 3,664 3,683
Golf Course8 113,612 113,612 113,612 113,612 113,612 113,612 113,612Subtotal 135,291 136,497 136,621 136,745 136,870 136,996 137,122
Total Water Sales (HCF) 5,713,429 6,025,171 6,057,093 6,089,188 6,121,456 6,153,899 6,186,516Total Water Sales (AF) 13,116 13,832 13,905 13,979 14,053 14,127 14,202
6 Equal to the compounded percent increase from both account growth and demand per connection.7 Other includes water use associated with fire training and other miscellaneous water use.8 Growth assumptions are not applied to water use associated with The Saticoy Club’s golf course.

2021 WATER AND WASTEWATER COST OF SERVICE AND RATE DESIGN STUDY 29
4.1.5.PROJECTED WATER SUPPLY
Table 4-7 shows the water supply mix projected to meet water demand over the study period. Ventura Water staffprovided Raftelis with the anticipated amount of water available from each source of supply over the study period.Raftelis then determined the projected supply mix based on the amount of water supply required to satisfy demand,after water loss (due to physical leakage and apparent losses). Water supply availability is not shown for reclaimedwater (which is supplied by the Ventura Water Reclamation Facility) or for the Saticoy Country Club System(which is supplied by the Saticoy Country Club System wells and which cannot physically receive water from othersources). The remaining potable water supply mix was determined based on the following assumed prioritization:first VenturaWaterPure (no production until FY 2025-26), then groundwater production from the three basins,then Ventura River - Foster Park, and lastly Casitas Municipal Water District (Casitas). State Water is anticipatedto be available by FY 2025-26. Due to the uncertainty of the allocation from year to year, Table 4-7 does notinclude State Water in the total available supply amounts. State Water will be used to make up for losses in othersupply sources and to improve water quality when available. Ventura Water’s supply mix can vary significantlyfrom year to year and is not based on a rigid prioritization policy. However, simplifying assumptions are necessaryto develop reasonable supply mix projections over the study, assuming normal conditions on average.
Table 4-7: Projected Water Supply Mix
DescriptionProjected
FY 2020-21Projected
FY 2021-22Projected
FY 2022-23Projected
FY 2023-24Projected
FY 2024-25Projected
FY 2025-26Potable Water Supply Availability (AF)Ventura River - Foster Park 1,573 1,298 1,573 1,573 1,573 1,573Groundwater - Mound 2,400 4,000 4,000 4,000 4,000 4,000Groundwater - Santa Paula 2,450 2,450 2,450 3,041 3,041 3,041Groundwater - Oxnard Plain 4,827 4,700 4,573 4,446 4,319 4,192Purchased Water - Casitas 3,858 3,922 3,985 4,049 4,071 4,094VenturaWaterPure 0 0 0 0 0 2,800State Water Project 0 0 0 0 0 0Total (AF) 15,108 16,370 16,581 17,109 17,004 19,700
Water Supply Required to Meet DemandWater Demand (AF) 13,832 13,905 13,979 14,053 14,127 14,202Water Loss 7.00% 7.00% 7.00% 7.00% 7.00% 7.00%Required Water Supply (AF)9 14,873 14,952 15,031 15,111 15,191 15,271
Projected Water Supply Mix (AF)Reclaimed Water 637 640 644 647 651 654Surface Water - Foster Park 1,573 1,298 1,573 1,573 1,573 155Groundwater - Mound 2,400 4,000 4,000 4,000 4,000 4,000Groundwater - Santa Paula 2,450 2,450 2,450 3,041 3,041 3,041Groundwater - Oxnard Plain 4,827 4,700 4,573 4,446 4,319 4,192Groundwater – Saticoy CC 337 337 338 338 338 338Purchased Water - Casitas Direct 88 89 89 90 90 91Purchased Water – Casitas Other 2,561 1,437 1,364 976 1,178 0VenturaWaterPure 0 0 0 0 0 2,800State Water Project 0 0 0 0 0 0Total (AF) 14,873 14,952 15,031 15,111 15,191 15,271
9 Equal to water demand divided by (100%-7%)

30 VENTURA WATER
4.2.Water Financial PlanSection 4.2 details the development of a proposed Water Enterprise financial plan for Ventura Water over the studyperiod. The following subsections include estimates and projections of annual revenues, O&M expenses, debt servicepayments, capital expenditures, and reserve funding through FY 2025-26. The overall purpose of the financial planis to determine annual water rate revenues required to achieve sufficient cash flow, maintain adequate reserves, andmeet debt coverage requirements.
4.2.1.WATER ENTERPRISE REVENUE UNDER CURRENT RATES
The Water Enterprise’s revenue sources consist of water rates, developer fees, miscellaneous fees, interest earningson cash reserves, and other non-rate revenues. The rate revenue projections shown in this section assume thatcurrent FY 2020-21 water rates are effective throughout the study period, and therefore represent estimatedrevenues in the absence of any water rate increases. This status quo scenario provides a baseline from whichRaftelis evaluated the need for revenue adjustments (i.e. gross rate revenue increases).
Calculated Water Rate RevenuesRaftelis projected annual water rate revenues from Water Service Charges, Fire Line Service Charges, and WaterVolume Rates over the study period based on current FY 2020-21 water rates (from Table 4-1), projected numberof water meters/private fire lines (from Table 4-5), and projected annual water use (from Table 4-6). Table 4-8shows projected Water Service Charge and Fire Line Service Charge revenues under current rates over the studyperiod, calculated as follows:
Fixed Charge Revenue = [ FY 2020-21 bimonthly charge] × [Number of connections] × [6 Bills per year]
Table 4-8: Projected Fixed Charge Revenue from Existing Rates
DescriptionProjected
FY 2020-21Projected
FY 2021-22Projected
FY 2022-23Projected
FY 2023-24Projected
FY 2024-25Projected
FY 2025-26Water Service Charges3/4-inch water meter $5,093,592 $5,121,098 $5,148,752 $5,176,555 $5,204,508 $5,232,6131-inch water meter $765,582 $769,716 $773,872 $778,051 $782,253 $786,4771.5-inch water meter $541,440 $544,364 $547,304 $550,259 $553,231 $556,2182-inch water meter $648,316 $651,817 $655,336 $658,875 $662,433 $666,0103-inch water meter $215,874 $217,039 $218,211 $219,390 $220,574 $221,7664-inch water meter $233,928 $235,191 $236,461 $237,738 $239,022 $240,3136-inch water meter $506,648 $509,384 $512,134 $514,900 $517,680 $520,4768-inch water meter $88,205 $88,681 $89,160 $89,642 $90,126 $90,61210-inch water meter $39,848 $40,063 $40,280 $40,497 $40,716 $40,93612-inch water meter $0 $0 $0 $0 $0 $0Subtotal $8,133,433 $8,177,354 $8,221,511 $8,265,907 $8,310,543 $8,355,420Fire Line Service Charges1-inch fire line $129,964 $130,666 $131,371 $132,081 $132,794 $133,5112-inch fire line $1,432 $1,439 $1,447 $1,455 $1,463 $1,4713-inch fire line $308 $309 $311 $313 $314 $3164-inch fire line $107,420 $108,000 $108,583 $109,169 $109,759 $110,3516-inch fire line $253,967 $255,339 $256,718 $258,104 $259,498 $260,8998-inch fire line $237,153 $238,433 $239,721 $241,015 $242,317 $243,62510-inch fire line $58,321 $58,636 $58,953 $59,271 $59,591 $59,91312-inch fire line $0 $0 $0 $0 $0 $0Subtotal $788,564 $792,822 $797,104 $801,408 $805,736 $810,086Total $8,921,997 $8,970,176 $9,018,615 $9,067,315 $9,116,279 $9,165,507

2021 WATER AND WASTEWATER COST OF SERVICE AND RATE DESIGN STUDY 31
Table 4-9 shows projected Water Volume Rate revenue under current rates over the study period, calculated asfollows:
Water Volume Rate Revenue = [ FY 2020-21 rate per HCF] × [Annual Water Use in HCF]
Table 4-9: Projected Commodity Charge Revenues Under Current Water Rates
DescriptionProjected
FY 2020-21Projected
FY 2021-22Projected
FY 2022-23Projected
FY 2023-24Projected
FY 2024-25Projected
FY 2025-26Water Sales Revenue - Inside City LimitsResidential Tier 1 $4,418,710 $4,442,571 $4,466,561 $4,490,680 $4,514,930 $4,539,310Residential Tier 2 $3,552,586 $3,571,770 $3,591,057 $3,610,449 $3,629,945 $3,649,547Residential Tier 3 $3,636,884 $3,656,523 $3,676,268 $3,696,120 $3,716,079 $3,736,146Residential Tier 4 $1,725,222 $1,734,538 $1,743,905 $1,753,322 $1,762,790 $1,772,309Non-Residential $5,729,172 $5,760,110 $5,791,214 $5,822,487 $5,853,928 $5,885,540Non-ResidentialIrrigation
$26,893 $27,038 $27,184 $27,331 $27,478 $27,627
Institutional/Interruptible $522,623 $525,445 $528,282 $531,135 $534,003 $536,887Untreated Water $0 $0 $0 $0 $0 $0Reclaimed Water10 N/A N/A N/A N/A N/A N/ACasitas Direct11 N/A N/A N/A N/A N/A N/AOther N/A N/A N/A N/A N/A N/ASubtotal $19,612,089 $19,717,994 $19,824,471 $19,931,524 $20,039,154 $20,147,365
Water Sales Revenue - Outside City Limits excluding Saticoy Country Club SystemResidential Tier 1 $125,823 $126,503 $127,186 $127,873 $128,563 $129,258Residential Tier 2 $105,583 $106,153 $106,726 $107,303 $107,882 $108,465Residential Tier 3 $123,674 $124,342 $125,014 $125,689 $126,367 $127,050Residential Tier 4 $167,888 $168,794 $169,706 $170,622 $171,544 $172,470Non-Residential $464,890 $467,401 $469,925 $472,462 $475,013 $477,578Non-ResidentialIrrigation
$8,791 $8,839 $8,886 $8,934 $8,982 $9,031
Untreated Water $107,732 $108,313 $108,898 $109,486 $110,077 $110,672Casitas Direct N/A N/A N/A N/A N/A N/AOther N/A N/A N/A N/A N/A N/ASubtotal $1,104,381 $1,110,345 $1,116,341 $1,122,369 $1,128,430 $1,134,523
Water Sales Revenue – Saticoy Country Club SystemResidential Tier 1 $20,293 $20,403 $20,513 $20,624 $20,735 $20,847Residential Tier 2 $19,704 $19,811 $19,918 $20,025 $20,133 $20,242Residential Tier 3 $20,462 $20,572 $20,683 $20,795 $20,907 $21,020Residential Tier 4 $33,835 $34,018 $34,202 $34,386 $34,572 $34,759Non-ResidentialIrrigation
$16,421 $16,510 $16,599 $16,689 $16,779 $16,869
Golf Course Unmetered N/A N/A N/A N/A N/A N/ASubtotal $110,716 $111,314 $111,915 $112,520 $113,127 $113,738
Total $20,827,187 $20,939,653 $21,052,728 $21,166,412 $21,280,711 $21,395,627
10 Reclaimed water sales revenue is included within the City’s Wastewater Operating Fund (Fund 51). It is therefore accounted for inthe wastewater financial plan rather than the water financial plan.11 Casitas Direct customers are subject to Casitas Municipal Water District pass-through rates only.
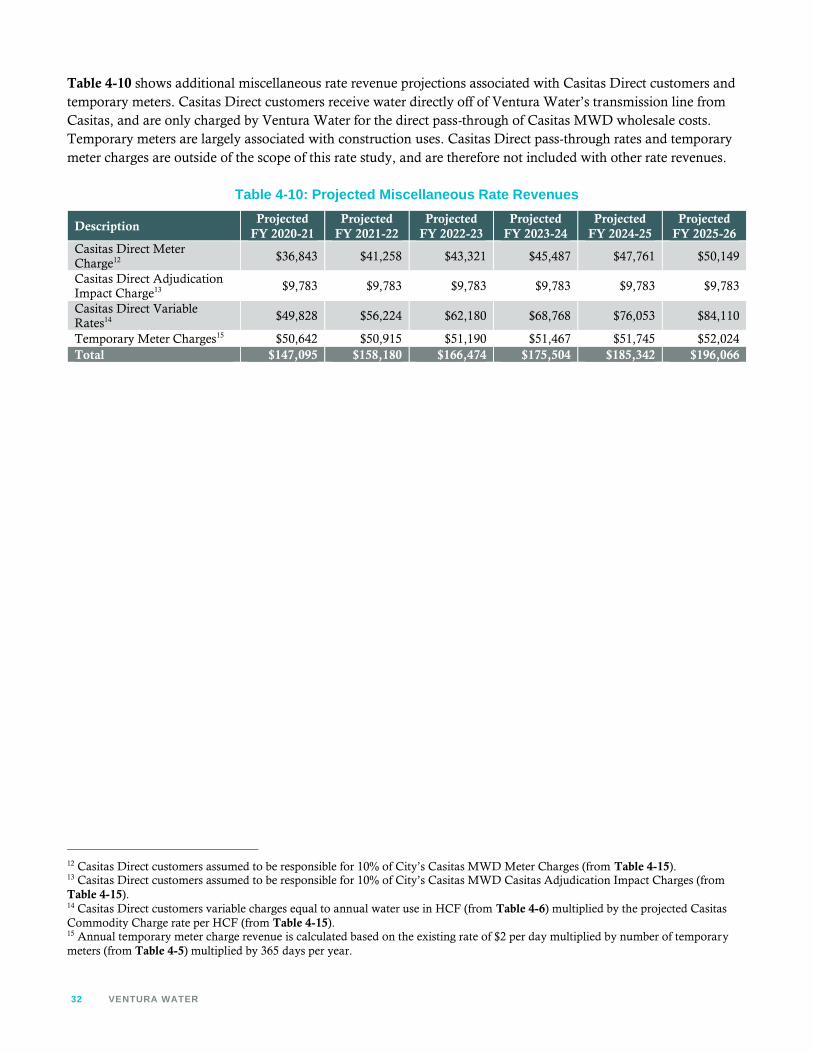
32 VENTURA WATER
Table 4-10 shows additional miscellaneous rate revenue projections associated with Casitas Direct customers andtemporary meters. Casitas Direct customers receive water directly off of Ventura Water’s transmission line fromCasitas, and are only charged by Ventura Water for the direct pass-through of Casitas MWD wholesale costs.Temporary meters are largely associated with construction uses. Casitas Direct pass-through rates and temporarymeter charges are outside of the scope of this rate study, and are therefore not included with other rate revenues.
Table 4-10: Projected Miscellaneous Rate Revenues
DescriptionProjected
FY 2020-21Projected
FY 2021-22Projected
FY 2022-23Projected
FY 2023-24Projected
FY 2024-25Projected
FY 2025-26Casitas Direct MeterCharge12 $36,843 $41,258 $43,321 $45,487 $47,761 $50,149
Casitas Direct AdjudicationImpact Charge13 $9,783 $9,783 $9,783 $9,783 $9,783 $9,783
Casitas Direct VariableRates14 $49,828 $56,224 $62,180 $68,768 $76,053 $84,110
Temporary Meter Charges15 $50,642 $50,915 $51,190 $51,467 $51,745 $52,024Total $147,095 $158,180 $166,474 $175,504 $185,342 $196,066
12 Casitas Direct customers assumed to be responsible for 10% of City’s Casitas MWD Meter Charges (from Table 4-15).13 Casitas Direct customers assumed to be responsible for 10% of City’s Casitas MWD Casitas Adjudication Impact Charges (fromTable 4-15).14 Casitas Direct customers variable charges equal to annual water use in HCF (from Table 4-6) multiplied by the projected CasitasCommodity Charge rate per HCF (from Table 4-15).15 Annual temporary meter charge revenue is calculated based on the existing rate of $2 per day multiplied by number of temporarymeters (from Table 4-5) multiplied by 365 days per year.
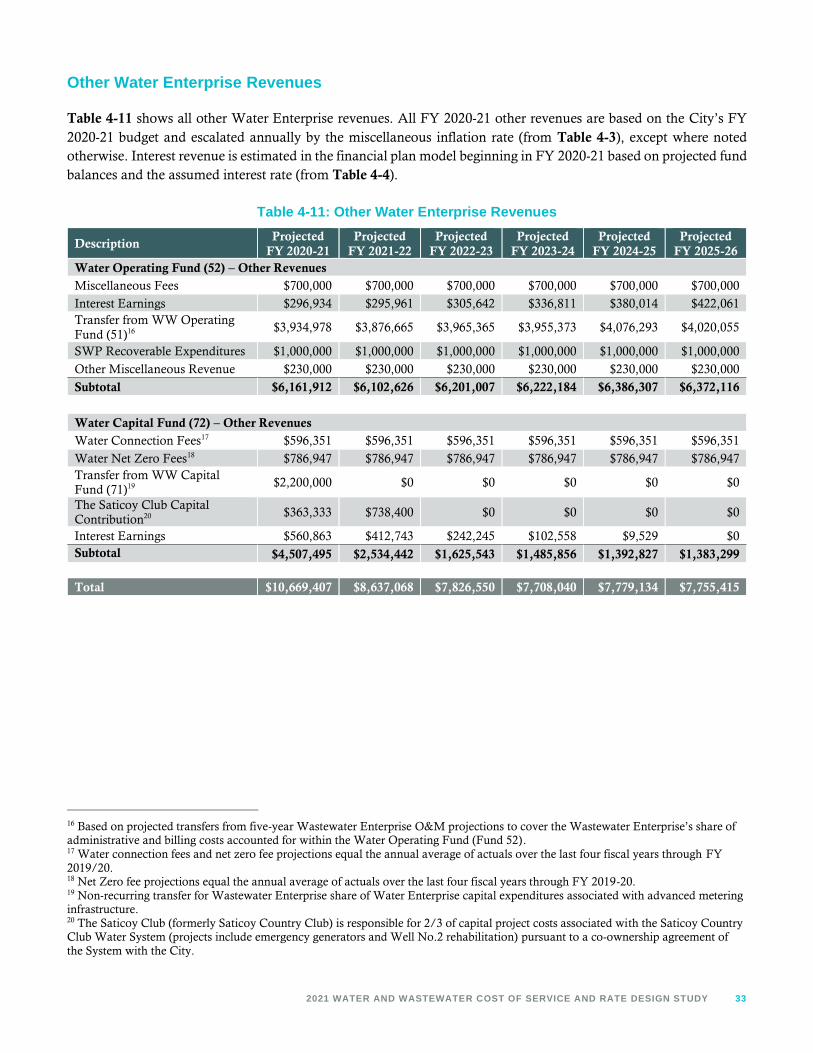
2021 WATER AND WASTEWATER COST OF SERVICE AND RATE DESIGN STUDY 33
Other Water Enterprise Revenues
Table 4-11 shows all other Water Enterprise revenues. All FY 2020-21 other revenues are based on the City’s FY2020-21 budget and escalated annually by the miscellaneous inflation rate (from Table 4-3), except where notedotherwise. Interest revenue is estimated in the financial plan model beginning in FY 2020-21 based on projected fundbalances and the assumed interest rate (from Table 4-4).
Table 4-11: Other Water Enterprise Revenues
DescriptionProjected
FY 2020-21Projected
FY 2021-22Projected
FY 2022-23Projected
FY 2023-24Projected
FY 2024-25Projected
FY 2025-26Water Operating Fund (52) – Other RevenuesMiscellaneous Fees $700,000 $700,000 $700,000 $700,000 $700,000 $700,000
Interest Earnings $296,934 $295,961 $305,642 $336,811 $380,014 $422,061Transfer from WW OperatingFund (51)16 $3,934,978 $3,876,665 $3,965,365 $3,955,373 $4,076,293 $4,020,055
SWP Recoverable Expenditures $1,000,000 $1,000,000 $1,000,000 $1,000,000 $1,000,000 $1,000,000
Other Miscellaneous Revenue $230,000 $230,000 $230,000 $230,000 $230,000 $230,000
Subtotal $6,161,912 $6,102,626 $6,201,007 $6,222,184 $6,386,307 $6,372,116
Water Capital Fund (72) – Other RevenuesWater Connection Fees17 $596,351 $596,351 $596,351 $596,351 $596,351 $596,351
Water Net Zero Fees18 $786,947 $786,947 $786,947 $786,947 $786,947 $786,947Transfer from WW CapitalFund (71)19 $2,200,000 $0 $0 $0 $0 $0
The Saticoy Club CapitalContribution20 $363,333 $738,400 $0 $0 $0 $0
Interest Earnings $560,863 $412,743 $242,245 $102,558 $9,529 $0Subtotal $4,507,495 $2,534,442 $1,625,543 $1,485,856 $1,392,827 $1,383,299
Total $10,669,407 $8,637,068 $7,826,550 $7,708,040 $7,779,134 $7,755,415
16 Based on projected transfers from five-year Wastewater Enterprise O&M projections to cover the Wastewater Enterprise’s share ofadministrative and billing costs accounted for within the Water Operating Fund (Fund 52).17 Water connection fees and net zero fee projections equal the annual average of actuals over the last four fiscal years through FY2019/20.18 Net Zero fee projections equal the annual average of actuals over the last four fiscal years through FY 2019-20.19 Non-recurring transfer for Wastewater Enterprise share of Water Enterprise capital expenditures associated with advanced meteringinfrastructure.20 The Saticoy Club (formerly Saticoy Country Club) is responsible for 2/3 of capital project costs associated with the Saticoy CountryClub Water System (projects include emergency generators and Well No.2 rehabilitation) pursuant to a co-ownership agreement ofthe System with the City.
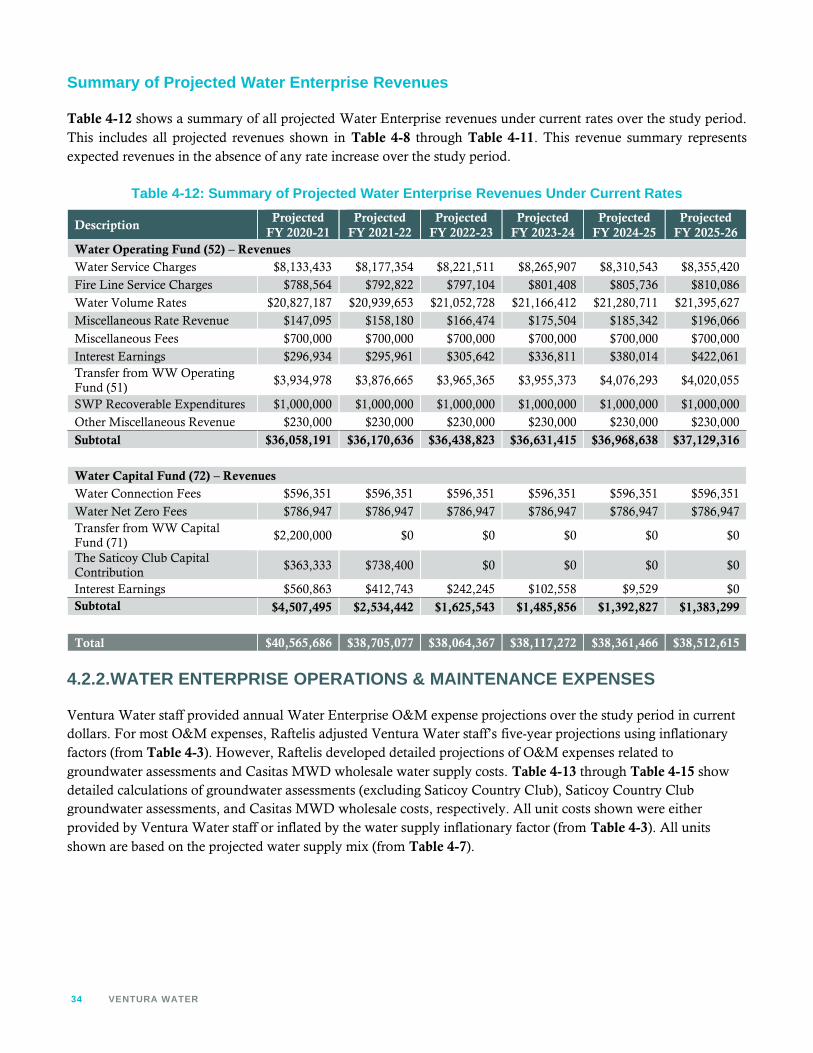
34 VENTURA WATER
Summary of Projected Water Enterprise Revenues
Table 4-12 shows a summary of all projected Water Enterprise revenues under current rates over the study period.This includes all projected revenues shown in Table 4-8 through Table 4-11. This revenue summary representsexpected revenues in the absence of any rate increase over the study period.
Table 4-12: Summary of Projected Water Enterprise Revenues Under Current Rates
DescriptionProjected
FY 2020-21Projected
FY 2021-22Projected
FY 2022-23Projected
FY 2023-24Projected
FY 2024-25Projected
FY 2025-26Water Operating Fund (52) – RevenuesWater Service Charges $8,133,433 $8,177,354 $8,221,511 $8,265,907 $8,310,543 $8,355,420
Fire Line Service Charges $788,564 $792,822 $797,104 $801,408 $805,736 $810,086
Water Volume Rates $20,827,187 $20,939,653 $21,052,728 $21,166,412 $21,280,711 $21,395,627
Miscellaneous Rate Revenue $147,095 $158,180 $166,474 $175,504 $185,342 $196,066
Miscellaneous Fees $700,000 $700,000 $700,000 $700,000 $700,000 $700,000
Interest Earnings $296,934 $295,961 $305,642 $336,811 $380,014 $422,061Transfer from WW OperatingFund (51)
$3,934,978 $3,876,665 $3,965,365 $3,955,373 $4,076,293 $4,020,055
SWP Recoverable Expenditures $1,000,000 $1,000,000 $1,000,000 $1,000,000 $1,000,000 $1,000,000
Other Miscellaneous Revenue $230,000 $230,000 $230,000 $230,000 $230,000 $230,000
Subtotal $36,058,191 $36,170,636 $36,438,823 $36,631,415 $36,968,638 $37,129,316
Water Capital Fund (72) – RevenuesWater Connection Fees $596,351 $596,351 $596,351 $596,351 $596,351 $596,351
Water Net Zero Fees $786,947 $786,947 $786,947 $786,947 $786,947 $786,947Transfer from WW CapitalFund (71)
$2,200,000 $0 $0 $0 $0 $0
The Saticoy Club CapitalContribution
$363,333 $738,400 $0 $0 $0 $0
Interest Earnings $560,863 $412,743 $242,245 $102,558 $9,529 $0Subtotal $4,507,495 $2,534,442 $1,625,543 $1,485,856 $1,392,827 $1,383,299
Total $40,565,686 $38,705,077 $38,064,367 $38,117,272 $38,361,466 $38,512,615
4.2.2.WATER ENTERPRISE OPERATIONS & MAINTENANCE EXPENSES
Ventura Water staff provided annual Water Enterprise O&M expense projections over the study period in currentdollars. For most O&M expenses, Raftelis adjusted Ventura Water staff’s five-year projections using inflationaryfactors (from Table 4-3). However, Raftelis developed detailed projections of O&M expenses related togroundwater assessments and Casitas MWD wholesale water supply costs. Table 4-13 through Table 4-15 showdetailed calculations of groundwater assessments (excluding Saticoy Country Club), Saticoy Country Clubgroundwater assessments, and Casitas MWD wholesale costs, respectively. All unit costs shown were eitherprovided by Ventura Water staff or inflated by the water supply inflationary factor (from Table 4-3). All unitsshown are based on the projected water supply mix (from Table 4-7).

2021 WATER AND WASTEWATER COST OF SERVICE AND RATE DESIGN STUDY 35
Table 4-13: Projected Water Supply Expenses – Groundwater Excluding Saticoy Country Club
DescriptionProjected
FY 2020-21Projected
FY 2021-22Projected
FY 2022-23Projected
FY 2023-24Projected
FY 2024-25Projected
FY 2025-26Water Production (63141) > UTILITIES - GROUND WATER EXTRACTION (53111)
United Water Conservation District - Mound & Santa Paula Basin: Zone A=M&I Water Conservation Fund Charge
Unit Rate ($/AF) $187.56 $206.32 $226.95 $249.64 $274.61 $302.07
Units (AF)21 4,850 6,450 6,450 7,041 7,041 7,041
Projected Charges $909,666 $1,330,738 $1,463,812 $1,757,732 $1,933,505 $2,126,856
United Water Conservation District - Oxnard Plain: Zone A=M&I Water Conservation Fund Charge
Unit Rate ($/AF) $187.56 $206.32 $226.95 $249.64 $274.61 $302.07
Units (AF) 4,827 4,700 4,573 4,446 4,319 4,192
Projected Charges $905,352 $969,685 $1,037,831 $1,109,910 $1,186,026 $1,266,266
United Water Conservation District - Oxnard Plain: Zone B=M&I Freeman Diversion Charge
Unit Rate ($/AF) $111.98 $123.18 $135.50 $149.05 $163.95 $180.34
Units (AF) 4,827 4,700 4,573 4,446 4,319 4,192
Projected Charges $540,527 $578,937 $619,622 $662,656 $708,100 $756,006
Fox Canyon Groundwater Management Agency – Oxnard Plain: Groundwater Extraction Fee
Unit Rate ($/AF) $6.00 $6.00 $6.00 $6.00 $6.00 $6.00
Units (AF) 4,827 4,700 4,573 4,446 4,319 4,192
Projected Charges $28,962 $28,200 $27,438 $26,676 $25,914 $25,152
Fox Canyon Groundwater Management Agency – Oxnard Plain: Groundwater Sustainability Fee
Unit Rate ($/AF) $14.00 $14.00 $16.00 $16.00 $19.00 $19.00
Units (AF) 4,827 4,700 4,573 4,446 4,319 4,192
Projected Charges $67,578 $65,800 $73,168 $71,136 $82,061 $79,648
Oxnard Plain Groundwater Sustainability Agency Pump/Extraction Fee
Unit Rate ($/AF) $100.00 $100.00 $100.00 $100.00 $100.00 $100.00
Units (AF) 4,827 4,700 4,573 4,446 4,319 4,192
Projected Charges $482,700 $470,000 $457,300 $444,600 $431,900 $419,200
Mound Groundwater Sustainability Agency Pump/Extraction Fee
Unit Rate ($/AF) $19.00 $18.00 $17.00 $17.00 $17.00 $17.00
Units (AF) 2,400 4,000 4,000 4,000 4,000 4,000
Projected Charges $45,600 $72,000 $68,000 $68,000 $68,000 $68,000
Total Charges $2,980,386 $3,515,360 $3,747,172 $4,140,710 $4,435,506 $4,741,127
% Change 17.9% 6.6% 10.5% 7.1% 6.9%
21 Equal to projected water supply from Mound Groundwater Basin and Santa Paula Groundwater Basin.

36 VENTURA WATER
Table 4-14: Projected Water Supply Expenses – Saticoy Country Club Groundwater
DescriptionProjected
FY 2020-21Projected
FY 2021-22Projected
FY 2022-23Projected
FY 2023-24Projected
FY 2024-25Projected
FY 2025-26Workorder-Saticoy Country Club (63133) > UTILITIES - GROUND WATER EXTRACTION (53111)
United Water Conservation District – Saticoy Country Club: Zone A=M&I Water Conservation Fund Charge
Unit Rate ($/AF) $187.56 $206.32 $226.95 $249.64 $274.61 $302.07
Units (AF) 337 337 338 338 338 338
Projected Charges $63,197 $69,579 $76,607 $84,344 $92,864 $102,245
United Water Conservation District - Saticoy Country Club: Zone B=M&I Freeman Diversion Charge
Unit Rate ($/AF) $111.98 $123.18 $135.50 $149.05 $163.95 $180.34
Units (AF) 337 337 338 338 338 338
Projected Charges $37,731 $41,541 $45,737 $50,357 $55,443 $61,044
Fox Canyon Groundwater Management Agency – Saticoy Country Club: Groundwater Extraction Fee
Unit Rate ($/AF) $6.00 $6.00 $6.00 $6.00 $6.00 $6.00
Units (AF) 337 337 338 338 338 338
Projected Charges $2,022 $2,023 $2,025 $2,027 $2,029 $2,031
Fox Canyon Groundwater Management Agency – Saticoy Country Club: Groundwater Sustainability Fee
Unit Rate ($/AF) $14.00 $14.00 $16.00 $16.00 $19.00 $19.00
Units (AF) 337 337 338 338 338 338
Projected Charges $4,717 $4,721 $5,401 $5,406 $6,425 $6,431
Total Charges $107,666 $117,865 $129,770 $142,134 $156,761 $171,750
% Change 9.5% 10.1% 9.5% 10.3% 9.6%
Table 4-15: Projected Water Supply Expenses – Casitas Municipal Water District
DescriptionProjected
FY 2020-21Projected
FY 2021-22Projected
FY 2022-23Projected
FY 2023-24Projected
FY 2024-25Projected
FY 2025-26Water Purification (63151) > UTILITIES - WATER (53103)
Casitas Municipal Water District Charge
Projected Charges $368,430 $412,581 $433,210 $454,871 $477,614 $501,495
Casitas Municipal Water District Commodity Charge
Unit Rate ($/HCF) $1.39 $1.56 $1.72 $1.89 $2.08 $2.28
Units (HCF) 1,153,949 664,794 633,196 464,125 552,673 39,598
Projected Charges $1,603,989 $1,037,078 $1,086,564 $876,083 $1,147,548 $90,441
Adjudication Impact Charge
Projected Charges $97,825 $97,825 $97,825 $97,825 $97,825 $97,825
Upper Ventura Pump/Extraction Fee (for Casitas Water)Unit Rate ($/AF) $80.00 $80.00 $80.00 $80.00 $80.00 $80.00Units (AF) 2,649 1,526 1,454 1,065 1,269 91Projected Charges $211,928 $122,093 $116,289 $85,239 $101,501 $7,272
Total Charges $2,282,172 $1,669,577 $1,733,888 $1,514,017 $1,824,488 $697,033
% Change -26.8% 3.9% -12.7% 20.5% -61.8%

2021 WATER AND WASTEWATER COST OF SERVICE AND RATE DESIGN STUDY 37
Table 4-16 shows a summary of all Water Enterprise O&M expenses over the study period. It is projected thatO&M expenses will increase by approximately 3.3 percent per year on average over the study period. Groundwaterassessments and Casitas MWD wholesale costs shown are from Raftelis’ detailed projections in Table 4-13through Table 4-15. All other O&M expense projections were provided by Ventura Staff in current dollars andadjusted by Raftelis for estimated future inflation. Additional Water Enterprise O&M expenses associated withVenturaWaterPure are shown in detail in Appendix A. Note the approximate $3.5M increase in additional O&Min FY 20225-26 when VenturaWaterPure is anticipated to begin operations.
Table 4-16: Projected Water Enterprise O&M Expenses
O&M ExpensesProjected
FY 2020-21Projected
FY 2021-22Projected
FY 2022-23Projected
FY 2023-24Projected
FY 2024-25Projected
FY 2025-26Rev Mgmt-Water (22052) $500,000 $515,000 $530,450 $546,364 $562,754 $579,637
Ventura Water GM (63051) $1,385,434 $1,450,220 $1,609,443 $1,670,817 $1,557,716 $1,583,394
Ventura Water Support (63052) $1,873,597 $1,954,439 $2,020,235 $1,976,119 $2,040,086 $2,083,684
Customer Care (63053) $1,599,676 $1,614,444 $1,696,471 $1,792,621 $1,896,558 $1,987,900
Water Conservation (63080) $920,000 $360,520 $371,357 $382,519 $394,018 $405,863
Water Operations (63101) $3,299,689 $3,449,268 $3,564,520 $3,681,598 $3,802,558 $3,911,256
Ventura Water SCADA (63102) $917,200 $957,469 $990,917 $1,023,645 $1,303,795 $1,090,308
Water Distribution (63130) $4,179,649 $4,455,200 $4,499,585 $4,645,934 $4,797,007 $4,897,235
Workorder-City (63131) $50,000 $51,500 $53,045 $54,636 $56,275 $57,964
Workorder-Saticoy CC (63133) $157,666 $169,365 $129,770 $142,134 $156,761 $171,750
GW Supply (Saticoy CC) $107,666 $117,865 $129,770 $142,134 $156,761 $171,750
Other Workorder–Saticoy CC) $50,000 $51,500 $0 $0 $0 $0
Water Production (63141) $6,230,656 $7,128,002 $7,506,487 $8,050,265 $8,501,594 $8,949,572
GW Supply (excl. Saticoy CC) $2,980,386 $3,515,360 $3,747,172 $4,140,710 $4,435,506 $4,741,127
Other Water Production $3,250,270 $3,612,642 $3,759,315 $3,909,555 $4,066,089 $4,208,445
Water Purification (63151) $7,998,095 $6,338,992 $5,503,180 $5,085,776 $5,521,322 $4,489,287
Casitas MWD Supply $2,282,172 $1,669,577 $1,733,888 $1,514,017 $1,824,488 $697,033
Other Water Purification $5,715,923 $4,669,415 $3,769,292 $3,571,758 $3,696,833 $3,792,254
Water resource planning (63170) $2,168,620 $2,117,574 $2,082,652 $2,040,714 $2,106,932 $2,151,358
State Waterline (63171)22 $2,110,000 $3,080,000 $3,060,000 $3,034,000 $3,060,000 $3,010,000
VenturaWaterPure O&M $49,981 $271,273 $281,302 $290,943 $300,908 $3,842,678
Total O&M Expenses $33,440,262 $33,913,267 $33,899,413 $34,418,084 $36,058,286 $39,211,887
% Change 1.4% 0.0% 1.5% 4.8% 8.7%
22 Costs incurred to maintain State Water Project entitlement share of 10,000 AFY.

38 VENTURA WATER
4.2.3.WATER ENTERPRISE DEBT
Table 4-17 shows the Water Enterprise’s projected debt service obligations over the study period. Existing debtservice consists of the City’s 2020 Water Refunding Bonds, which were recently issued to refinance the City’s 2012Water Revenue Bonds, 2014 Water Revenue Bonds, and 2005 State Drinking Water Loan . This refinancing ofexisting bonds is projected to reduce the Water Enterprise’s existing debt service payments by approximately$556K per year over the study period. Proposed Water Enterprise debt service associated with VenturaWaterPureis also shown (see Appendix A for details). Note that proposed debt service for VenturaWaterPure representspreliminary projections based on the best information available at the time this study.
Table 4-17: Water Enterprise Debt ServiceDebt Service FY 2020-21 FY 2021-22 FY 2022-23 FY 2023-24 FY 2024-25 FY 2025-26Existing Debt Service2020 Water RevenueRefunding Bonds - Series A
$1,598,783 $4,446,677 $4,448,045 $4,449,443 $4,446,672 $3,717,610
Subtotal $1,598,783 $4,446,677 $4,448,045 $4,449,443 $4,446,672 $3,717,610
Proposed Debt Service for VenturaWaterPureWIFIA Loan $0 $119,101 $288,224 $463,303 $1,233,859 $1,233,859SRF Loan $0 $0 $0 $0 $97,723 $780,871Revenue Bond $0 $0 $0 $0 $0 $615,313Subtotal $1,598,783 $119,101 $288,224 $463,303 $1,331,582 $2,630,044
Total $1,598,783 $4,565,778 $4,736,270 $4,912,746 $5,778,254 $6,347,653
Table 4-18 shows existing debt proceeds available to fund capital expenditures (excluding VenturaWaterPure) andproposed debt proceeds to fund VenturaWaterPure Program projects (see Appendix A for details). Amounts areshown in the year the proceeds are assumed to be spent to fund capital projects.
Table 4-18: Water Enterprise – Use of Debt ProceedsUse of Debt Proceeds FY 2020-21 FY 2021-22 FY 2022-23 FY 2023-24 FY 2024-25 FY 2025-26Existing Debt Proceeds $4,965,902 $2,880,720 $0 $0 $0 $0Proposed Debt Proceedsfor VenturaWaterPure
$0 $5,772,000 $8,440,000 $8,940,000 $43,427,115 $43,427,115
Total $4,965,902 $8,652,720 $8,440,000 $8,940,000 $43,427,115 $43,427,115
4.2.4.WATER ENTERPRISE CAPITAL IMPROVEMENT PLAN
Table 4-19 shows Ventura Water’s planned capital improvement plan (CIP) for the Water Enterprise excludingVenturaWaterPure, amounting to approximately $16.9M per year on average over the study period. SignificantCIP expenditures exclusive of VenturaWaterPure are anticipated to continue over the next ten years, highlightingthe need to maintain adequate reserves to fund substantial CIP projects beyond FY 2025-26.
Table 4-20 shows the Water Enterprise’s share of VenturaWaterPure Program CIP project costs, amounting toapproximately $21.1M per year on average over the study period. VenturaWaterPure capital projects includeinjection/extraction wells, pump stations, a new advanced water purification facility, conveyance pipelines, oceanoutfall, and land acquisitions to site the new treatment plant (see Appendix A for details).
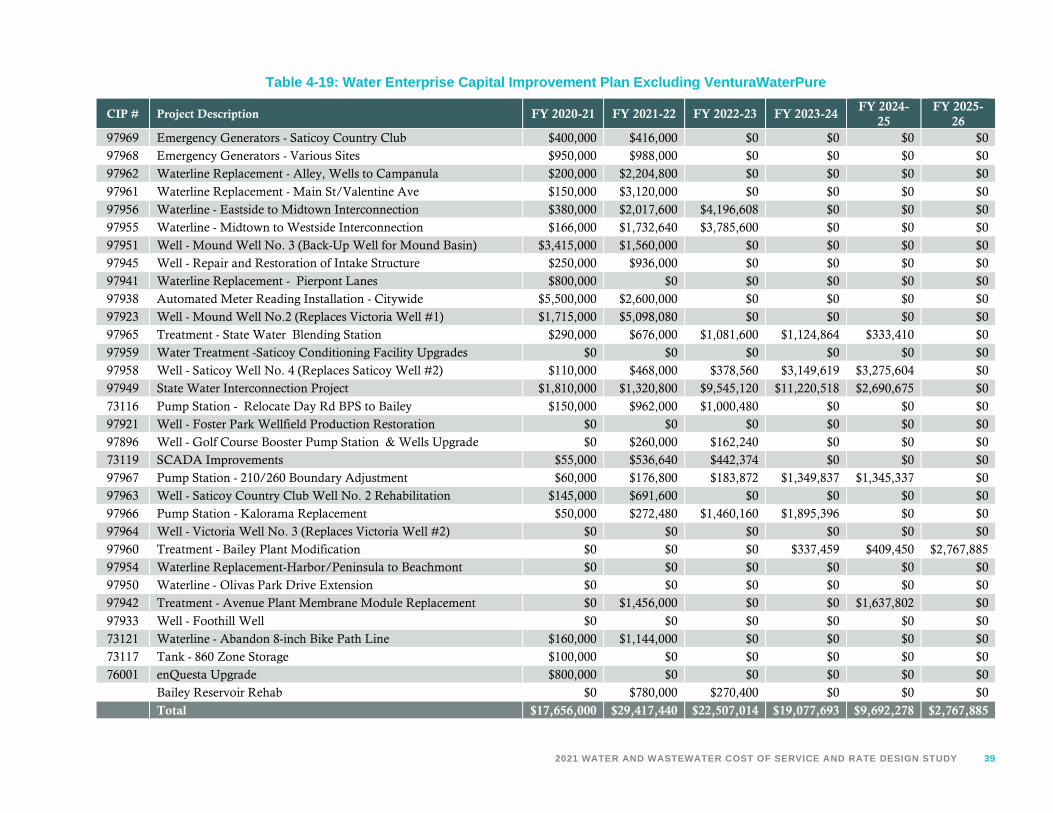
2021 WATER AND WASTEWATER COST OF SERVICE AND RATE DESIGN STUDY 39
Table 4-19: Water Enterprise Capital Improvement Plan Excluding VenturaWaterPure
CIP # Project Description FY 2020-21 FY 2021-22 FY 2022-23 FY 2023-24FY 2024-
25FY 2025-
2697969 Emergency Generators - Saticoy Country Club $400,000 $416,000 $0 $0 $0 $0
97968 Emergency Generators - Various Sites $950,000 $988,000 $0 $0 $0 $0
97962 Waterline Replacement - Alley, Wells to Campanula $200,000 $2,204,800 $0 $0 $0 $0
97961 Waterline Replacement - Main St/Valentine Ave $150,000 $3,120,000 $0 $0 $0 $0
97956 Waterline - Eastside to Midtown Interconnection $380,000 $2,017,600 $4,196,608 $0 $0 $0
97955 Waterline - Midtown to Westside Interconnection $166,000 $1,732,640 $3,785,600 $0 $0 $0
97951 Well - Mound Well No. 3 (Back-Up Well for Mound Basin) $3,415,000 $1,560,000 $0 $0 $0 $0
97945 Well - Repair and Restoration of Intake Structure $250,000 $936,000 $0 $0 $0 $0
97941 Waterline Replacement - Pierpont Lanes $800,000 $0 $0 $0 $0 $0
97938 Automated Meter Reading Installation - Citywide $5,500,000 $2,600,000 $0 $0 $0 $0
97923 Well - Mound Well No.2 (Replaces Victoria Well #1) $1,715,000 $5,098,080 $0 $0 $0 $0
97965 Treatment - State Water Blending Station $290,000 $676,000 $1,081,600 $1,124,864 $333,410 $0
97959 Water Treatment -Saticoy Conditioning Facility Upgrades $0 $0 $0 $0 $0 $0
97958 Well - Saticoy Well No. 4 (Replaces Saticoy Well #2) $110,000 $468,000 $378,560 $3,149,619 $3,275,604 $0
97949 State Water Interconnection Project $1,810,000 $1,320,800 $9,545,120 $11,220,518 $2,690,675 $0
73116 Pump Station - Relocate Day Rd BPS to Bailey $150,000 $962,000 $1,000,480 $0 $0 $0
97921 Well - Foster Park Wellfield Production Restoration $0 $0 $0 $0 $0 $0
97896 Well - Golf Course Booster Pump Station & Wells Upgrade $0 $260,000 $162,240 $0 $0 $0
73119 SCADA Improvements $55,000 $536,640 $442,374 $0 $0 $0
97967 Pump Station - 210/260 Boundary Adjustment $60,000 $176,800 $183,872 $1,349,837 $1,345,337 $0
97963 Well - Saticoy Country Club Well No. 2 Rehabilitation $145,000 $691,600 $0 $0 $0 $0
97966 Pump Station - Kalorama Replacement $50,000 $272,480 $1,460,160 $1,895,396 $0 $0
97964 Well - Victoria Well No. 3 (Replaces Victoria Well #2) $0 $0 $0 $0 $0 $0
97960 Treatment - Bailey Plant Modification $0 $0 $0 $337,459 $409,450 $2,767,885
97954 Waterline Replacement-Harbor/Peninsula to Beachmont $0 $0 $0 $0 $0 $0
97950 Waterline - Olivas Park Drive Extension $0 $0 $0 $0 $0 $0
97942 Treatment - Avenue Plant Membrane Module Replacement $0 $1,456,000 $0 $0 $1,637,802 $0
97933 Well - Foothill Well $0 $0 $0 $0 $0 $0
73121 Waterline - Abandon 8-inch Bike Path Line $160,000 $1,144,000 $0 $0 $0 $0
73117 Tank - 860 Zone Storage $100,000 $0 $0 $0 $0 $0
76001 enQuesta Upgrade $800,000 $0 $0 $0 $0 $0
Bailey Reservoir Rehab $0 $780,000 $270,400 $0 $0 $0
Total $17,656,000 $29,417,440 $22,507,014 $19,077,693 $9,692,278 $2,767,885

40 VENTURA WATER
Table 4-20: Water Enterprise Capital Improvement Plan - VenturaWaterPureCIP # Project Description FY 2020-21 FY 2021-22 FY 2022-23 FY 2023-24 FY 2024-25 FY 2025-2697934 Injection/Extraction Wells $700,000 $1,000,000 $2,000,000 $2,500,000 $11,500,000 $11,500,000
73122 Pump Stations $37,500 $250,000 $350,000 $350,000 $1,700,000 $1,700,000
96945 Advanced Water Purification Facility $725,000 $2,500,000 $3,500,000 $3,500,000 $21,000,000 $21,000,000
96940 Pipelines $636,500 $1,072,000 $1,340,000 $1,340,000 $8,040,000 $8,040,000
96939 Wetlands Improvements $0 $0 $0 $0 $0 $0
96938 Outfall $375,000 $950,000 $1,250,000 $1,250,000 $7,000,000 $7,000,000
96935 Land $100,000 $2,367,500 $0 $0 $0 $0
Total $2,574,000 $8,139,500 $8,440,000 $8,940,000 $49,240,000 $49,240,000

2021 WATER AND WASTEWATER COST OF SERVICE AND RATE DESIGN STUDY 41
Table 4-21 shows the assumed funding sources for Water Enterprise CIP projects over the study period. Estimatedgrant funding for the Water Enterprise’s share of VenturaWaterPure CIP is included in FY 2024-25 and FY 2025-26 (see Appendix A for details). Existing debt proceeds (from Table 4-18) are assumed to fund CIP projectsexclusive of VenturaWaterPure in FY 2020-21 and FY 2021-22. Proposed debt proceeds (from Table 4-18) areassumed to fund most of the Water Enterprise’s VenturaWaterPure Program CIP projects over the next five years.All remaining CIP not funded by grants or debt is assumed to be funded by Water Enterprise cash reservesgenerated from rates (i.e. pay-as-you-go funding). Figure 4-1 shows a summary of total Water Enterprise CIPexpenditures (including VenturaWaterPure) by funding source over the study period.
Table 4-21: Water Enterprise Capital Improvement Plan Proposed Funding
Description FY 2020-21 FY 2021-22 FY 2022-23 FY 2023-24 FY 2024-25 FY 2025-26Capital Improvement Plan Excluding VenturaWaterPureGrant Funded $0 $0 $0 $0 $0 $0Debt Funded $4,965,902 $2,880,720 $0 $0 $0 $0Pay-as-you-go $12,690,098 $19,182,360 $16,880,261 $14,308,270 $7,269,209 $2,075,914Subtotal $17,656,000 $22,063,080 $16,880,261 $14,308,270 $7,269,209 $2,075,914
Capital Improvement Plan - VenturaWaterPureGrant Funded $0 $0 $0 $0 $5,812,885 $5,812,885Debt Funded $0 $5,772,000 $8,440,000 $8,940,000 $43,427,115 $43,427,115Pay-as-you-go $2,574,000 $2,367,500 $0 $0 $0 $0Subtotal $2,574,000 $8,139,500 $8,440,000 $8,940,000 $49,240,000 $49,240,000
Total $20,230,000 $30,202,580 $25,320,261 $23,248,270 $56,509,209 $51,315,914
Figure 4-1: Water Enterprise Capital Improvement Plan
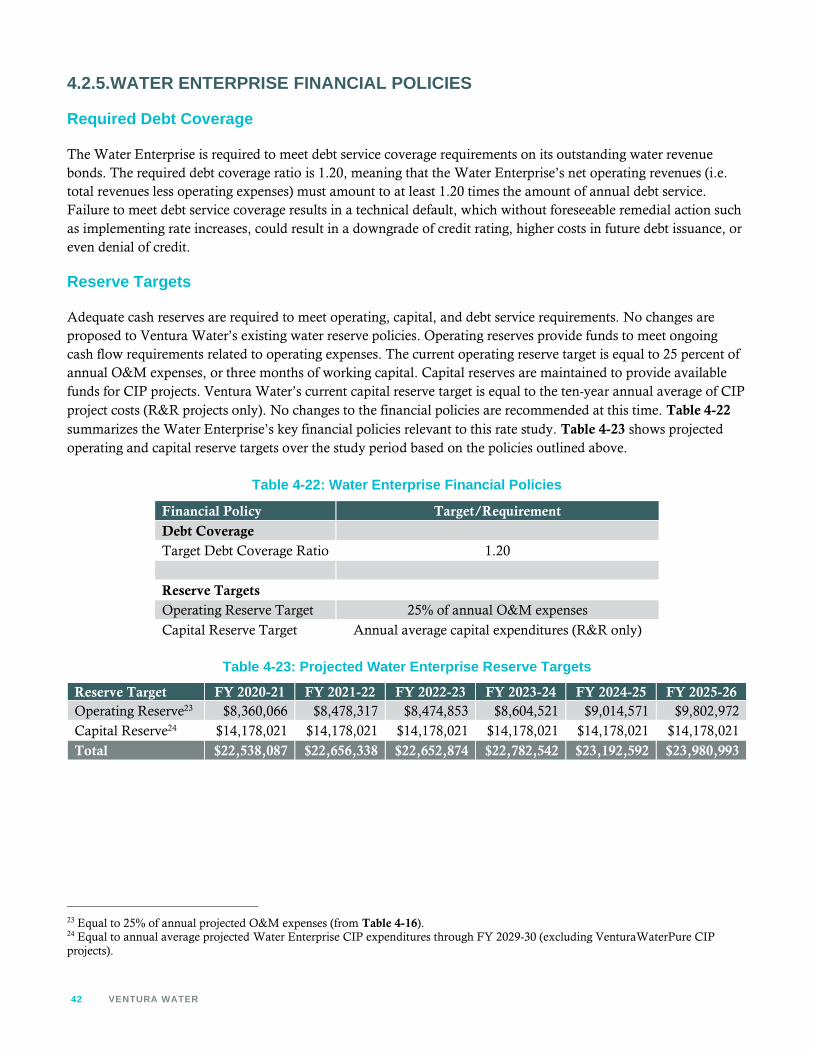
42 VENTURA WATER
4.2.5.WATER ENTERPRISE FINANCIAL POLICIES
Required Debt Coverage
The Water Enterprise is required to meet debt service coverage requirements on its outstanding water revenuebonds. The required debt coverage ratio is 1.20, meaning that the Water Enterprise’s net operating revenues (i.e.total revenues less operating expenses) must amount to at least 1.20 times the amount of annual debt service.Failure to meet debt service coverage results in a technical default, which without foreseeable remedial action suchas implementing rate increases, could result in a downgrade of credit rating, higher costs in future debt issuance, oreven denial of credit.
Reserve Targets
Adequate cash reserves are required to meet operating, capital, and debt service requirements. No changes areproposed to Ventura Water’s existing water reserve policies. Operating reserves provide funds to meet ongoingcash flow requirements related to operating expenses. The current operating reserve target is equal to 25 percent ofannual O&M expenses, or three months of working capital. Capital reserves are maintained to provide availablefunds for CIP projects. Ventura Water’s current capital reserve target is equal to the ten-year annual average of CIPproject costs (R&R projects only). No changes to the financial policies are recommended at this time. Table 4-22summarizes the Water Enterprise’s key financial policies relevant to this rate study. Table 4-23 shows projectedoperating and capital reserve targets over the study period based on the policies outlined above.
Table 4-22: Water Enterprise Financial Policies
Financial Policy Target/RequirementDebt CoverageTarget Debt Coverage Ratio 1.20
Reserve TargetsOperating Reserve Target 25% of annual O&M expenses
Capital Reserve Target Annual average capital expenditures (R&R only)
Table 4-23: Projected Water Enterprise Reserve Targets
Reserve Target FY 2020-21 FY 2021-22 FY 2022-23 FY 2023-24 FY 2024-25 FY 2025-26Operating Reserve23 $8,360,066 $8,478,317 $8,474,853 $8,604,521 $9,014,571 $9,802,972Capital Reserve24 $14,178,021 $14,178,021 $14,178,021 $14,178,021 $14,178,021 $14,178,021
Total $22,538,087 $22,656,338 $22,652,874 $22,782,542 $23,192,592 $23,980,993
23 Equal to 25% of annual projected O&M expenses (from Table 4-16).24 Equal to annual average projected Water Enterprise CIP expenditures through FY 2029-30 (excluding VenturaWaterPure CIPprojects).

2021 WATER AND WASTEWATER COST OF SERVICE AND RATE DESIGN STUDY 43
4.2.6.STATUS QUO WATER FINANCIAL PLAN
To evaluate the need for revenue adjustments (i.e. increases to gross rate revenues), Raftelis first developed a statusquo financial plan. The status quo financial plan assumes that current FY 2020-21 rates remain unchanged over thestudy period. Table 4-24 combines projected Fund 52 revenues (from Table 4-12), O&M expenses (from Table4-16), and debt service (from Table 4-17) to generate operating cash flow projections under the status quo. In theabsence of any revenue adjustments, the Water Operating Fund (Fund 52) will fail to generate sufficient revenue torecover O&M expenses and debt service, and net cash generation becomes increasingly negative in subsequentyears.
Table 4-24: Water Operating Cash Flow (Fund 52) – Status Quo Financial PlanLine Description FY 2020-21 FY 2021-22 FY 2022-23 FY 2023-24 FY 2024-25 FY 2025-26
1 Water Rate Revenue under Current Rates
2Water Rates Subject toRevenue Adjustments
$29,749,184 $29,909,829 $30,071,342 $30,233,728 $30,396,990 $30,561,133
3Water Rates not Subject toRevenue Adjustments25 $147,095 $158,180 $166,474 $175,504 $185,342 $196,066
4
5 Revenue Adjustments
6 Fiscal YearRevenue
Adjustment7 FY 2020-21 0.00% $0 $0 $0 $0 $0 $0
8 FY 2021-22 0.00% $0 $0 $0 $0 $0
9 FY 2022-23 0.00% $0 $0 $0 $0
10 FY 2023-24 0.00% $0 $0 $0
11 FY 2024-25 0.00% $0 $0
12 FY 2025-26 0.00% $0
13 Total Adjustments $0 $0 $0 $0 $0 $0
14
15 Revenue Summary
16Water Rates (includingRevenue Adjustments)
$29,896,279 $30,068,009 $30,237,817 $30,409,232 $30,582,331 $30,757,200
17 Other Fund 52 Revenue26 $6,161,912 $6,092,158 $6,158,178 $6,123,121 $6,204,998 $6,080,246
18 Total Revenue $36,058,191 $36,160,167 $36,395,995 $36,532,353 $36,787,329 $36,837,445
19
20 O&M Expenses $33,440,262 $33,913,267 $33,899,413 $34,418,084 $36,058,286 $39,211,887
21
22 Debt Service $1,598,783 $4,565,778 $4,736,270 $4,912,746 $5,778,254 $6,347,653
23
24Net Operating CashFlow27 $1,019,146 ($2,318,878) ($2,239,688) ($2,798,478) ($5,049,211) ($8,722,095)
25 Includes Casitas Direct pass-through charges and Temporary Meter Daily Charges.26 Status quo “other revenue” is less than what is shown in Table 4-12 (which reflects the proposed financial plan) to account forreduced interest earnings due to depletion of interest-bearing reserves. Interest earnings under the status quo and proposed financialplan scenarios are calculated by averaging the beginning and ending reserve balance in each year and then multiplying by the assumedinterest rate.27 Equal to [Line 18 – Line 20 – Line 22].

44 VENTURA WATER
Table 4-25 shows projected reserve balances and debt coverage under the status quo financial plan for the entireWater Enterprise, including both the Water Operating Fund (Fund 52) and Water Capital Fund (Fund 72).Sources of funds include revenues (from Table 4-12) as well as grants and debt proceeds (from Table 4-21). Use offunds include O&M expenses (from Table 4-16), debt service (from Table 4-17), and CIP expenditures (from Table4-21). The FY 2020-21 beginning balance reflects actual Water Enterprise reserve balances as of July 1, 2020. Allending balance and debt coverage figures are projected values. Target reserve balances shown are from Table 4-23.
Under the status-quo financial plan, reserves are projected to fall below target by the end of FY 2024-25. Debtcoverage is projected to fall well below the required ratio in all years following FY 2020-21, in part due to significantincreases in debt service for VenturaWaterPure. The status quo financial plan is insufficient to meet the WaterEnterprise’s financial needs over the study period. This demonstrates a clear need for revenue adjustments over thestudy period to increase rate revenues and ensure financial sustainability.
Table 4-25: Status Quo Water Financial Plan Pro Forma (Funds 52 & 72)Line Description FY 2020-21 FY 2021-22 FY 2022-23 FY 2023-24 FY 2024-25 FY 2025-26
1 Beginning Balance $90,577,325 $80,839,868 $59,505,571 $42,011,166 $26,390,275 $15,464,683
2
3 Source of Funds
4Water Rates (includingRevenue Adjustments)
$29,896,279 $30,068,009 $30,237,817 $30,409,232 $30,582,331 $30,757,200
5 Other Fund 52 Revenue28 $6,161,912 $6,092,158 $6,158,178 $6,123,121 $6,204,998 $6,080,246
6 Other Fund 72 Revenue $4,507,495 $2,534,442 $1,625,543 $1,485,856 $1,392,827 $1,383,299
7 Grants $0 $0 $0 $0 $5,812,885 $5,812,885
8 Use of Debt Proceeds $4,965,902 $8,652,720 $8,440,000 $8,940,000 $43,427,115 $43,427,115
9 Total Source of Funds $45,531,587 $47,347,329 $46,461,538 $46,958,209 $87,420,156 $87,460,744
10
11 Use of Funds
12 O&M Expenses $33,440,262 $33,913,267 $33,899,413 $34,418,084 $36,058,286 $39,211,887
13 Debt Service $1,598,783 $4,565,778 $4,736,270 $4,912,746 $5,778,254 $6,347,653
14Capital Improvement PlanExpenditures
$20,230,000 $30,202,580 $25,320,261 $23,248,270 $56,509,209 $51,315,914
15 Total Use of Funds $55,269,045 $68,681,625 $63,955,944 $62,579,100 $98,345,749 $96,875,455
16
17 Ending Balance29 $80,839,868 $59,505,571 $42,011,166 $26,390,275 $15,464,683 $6,049,972
18 Target Balance $22,538,087 $22,656,338 $22,652,874 $22,782,542 $23,192,592 $23,980,993
19
20 Debt Coverage
21 Net Revenue30 $7,125,423 $4,781,342 $4,122,125 $3,600,125 $2,121,871 ($991,143)
22 Debt Service $1,598,783 $4,565,778 $4,736,270 $4,912,746 $5,778,254 $6,347,653
23 Projected Debt Coverage31 4.46 1.05 0.87 0.73 0.37 -0.16
24 Required Debt Coverage 1.20 1.20 1.20 1.20 1.20 1.20
28 Status quo “other revenue” is less than what is shown in Table 4-12 (which reflects the proposed financial plan) to account forreduced interest earnings due to depletion of interest-bearing reserves. Interest earnings under the status quo and proposed financialplan scenarios are calculated by averaging the beginning and ending reserve balance in each year and then multiplying by the assumedinterest rate.29 Equal to [Line 1 + Line 9 – Line 15]30 Equal to [( Sum of Lines 4-6) – Line 12]31 Equal to [Line 21 ÷ Line 22]

2021 WATER AND WASTEWATER COST OF SERVICE AND RATE DESIGN STUDY 45
4.2.7.PROPOSED WATER FINANCIAL PLAN
The Water Enterprise must increase its revenues from water rates over the study period to adequately fund its operatingand capital expenditures, meet required debt coverage, and maintain sufficient reserve funding. Raftelis worked closelywith Ventura Water staff to identify financial plan options for the Water Commission’s consideration. The selected optionof proposed annual revenue adjustments are shown in Table 4-26. Revenue adjustments represent annual percentincreases in total rate revenue relative to rate revenue generated by the prior year’s water rates.
Table 4-26: Proposed Water Revenue AdjustmentsDescription FY 2021-22 FY 2022-23 FY 2023-24 FY 2024-25 FY 2025-26Effective Date July 1, 2021 July 1, 2022 July 1, 2023 July 1, 2024 July 1, 2025Revenue Adjustment 7.0% 7.0% 7.0% 7.0% 7.0%
Table 4-27 combines projected Fund 52 revenues (from Table 4-12), O&M expenses (from Table 4-16), and debtservice (from Table 4-17) to generate operating cash flow projections under the proposed financial plan. Byimplementing the proposed revenue adjustments, we project that the Water Operating Fund (Fund 52) willmaintain sufficient operating cash flow through the end of the study period.
Table 4-27: Water Operating Cash Flow (Fund 52) – Proposed Financial PlanLine Description FY 2020-21 FY 2021-22 FY 2022-23 FY 2023-24 FY 2024-25 FY 2025-26
1 Water Rate Revenue under Current Rates
2Water Rates Subject toRevenue Adjustments
$29,749,184 $29,909,829 $30,071,342 $30,233,728 $30,396,990 $30,561,133
3Water Rates not Subject toRevenue Adjustments
$147,095 $158,180 $166,474 $175,504 $185,342 $196,066
45 Revenue Adjustments32
6 Fiscal YearRevenue
Adjustment7 FY 2020-21 0.00% $0 $0 $0 $0 $0 $0
8 FY 2021-22 7.00% $2,093,688 $2,104,994 $2,116,361 $2,127,789 $2,139,279
9 FY 2022-23 7.00% $2,252,344 $2,264,506 $2,276,735 $2,289,029
10 FY 2023-24 7.00% $2,423,022 $2,436,106 $2,449,261
11 FY 2024-25 7.00% $2,606,633 $2,620,709
12 FY 2025-26 7.00% $2,804,159
13 Total Adjustments $0 $2,093,688 $4,357,338 $6,803,889 $9,447,263 $12,302,4371415 Revenue Summary
16Water Rates (includingRevenue Adjustments)
$29,896,279 $32,161,697 $34,595,154 $37,213,120 $40,029,594 $43,059,637
17 Other Fund 52 Revenue $6,161,912 $6,102,626 $6,201,007 $6,222,184 $6,386,307 $6,372,116
18 Total Revenue $36,058,191 $38,264,324 $40,796,161 $43,435,304 $46,415,901 $49,431,7531920 O&M Expenses $33,440,262 $33,913,267 $33,899,413 $34,418,084 $36,058,286 $39,211,8872122 Debt Service $1,598,783 $4,565,778 $4,736,270 $4,912,746 $5,778,254 $6,347,6532324 Net Operating Cash Flow33 $1,019,146 ($214,722) $2,160,478 $4,104,474 $4,579,361 $3,872,213
32 The increase in rate revenues resulting from each year’s revenue adjustment is calculated individually in Lines 7-12. This isnecessary to account for revenue increases resulting from prior year revenue adjustments.33 Equal to [Line 18 – Line 20 – Line 22]

46 VENTURA WATER
Table 4-28 shows projected reserve balances and debt coverage under the proposed financial plan for the entireWater Enterprise, including both the Water Operating Fund (Fund 52) and Water Capital Fund (Fund 72).Sources of funds include status quo revenues (from Table 4-12), revenue adjustments (from Table 4-27), and grantsand debt proceeds (from Table 4-21). Use of funds include O&M expenses (from Table 4-16), debt service (fromTable 4-17), and CIP expenditures (from Table 4-21). The FY 2020-21 beginning balance reflects actual WaterEnterprise reserve balances as of July 1, 2020. All ending balance and debt coverage figures are projected values.Target reserve balances shown are from Table 4-23. Under the proposed financial plan, reserve balances and debtcoverage are projected to achieve target policies in all years of the rate-setting period.
Table 4-28: Proposed Water Financial Plan Pro Forma (Funds 52 & 72)Line Description FY 2020-21 FY 2021-22 FY 2022-23 FY 2023-24 FY 2024-25 FY 2025-26
1 Beginning Balance $90,577,325 $80,839,868 $61,609,728 $48,515,488 $39,797,549 $38,500,528
2
3 Source of Funds
4Water Rates (includingRevenue Adjustments)
$29,896,279 $32,161,697 $34,595,154 $37,213,120 $40,029,594 $43,059,637
5 Other Fund 52 Revenue $6,161,912 $6,102,626 $6,201,007 $6,222,184 $6,386,307 $6,372,116
6 Other Fund 72 Revenue $4,507,495 $2,534,442 $1,625,543 $1,485,856 $1,392,827 $1,383,299
7 Grants $0 $0 $0 $0 $5,812,885 $5,812,885
8 Use of Debt Proceeds $4,965,902 $8,652,720 $8,440,000 $8,940,000 $43,427,115 $43,427,115
9 Total Source of Funds $45,531,587 $49,451,485 $50,861,704 $53,861,160 $97,048,729 $100,055,052
10
11 Use of Funds
12 O&M Expenses $33,440,262 $33,913,267 $33,899,413 $34,418,084 $36,058,286 $39,211,887
13 Debt Service $1,598,783 $4,565,778 $4,736,270 $4,912,746 $5,778,254 $6,347,653
14Capital Improvement PlanExpenditures
$20,230,000 $30,202,580 $25,320,261 $23,248,270 $56,509,209 $51,315,914
15 Total Use of Funds $55,269,045 $68,681,625 $63,955,944 $62,579,100 $98,345,749 $96,875,455
16
17 Ending Balance34 $80,839,868 $61,609,728 $48,515,488 $39,797,549 $38,500,528 $41,680,126
18 Target Balance $22,538,087 $22,656,338 $22,652,874 $22,782,542 $23,192,592 $23,980,993
19
20 Debt Coverage
21 Net Revenue35 $7,125,423 $6,885,498 $8,522,291 $10,503,076 $11,750,443 $11,603,165
22 Debt Service $1,598,783 $4,565,778 $4,736,270 $4,912,746 $5,778,254 $6,347,653
23 Projected Debt Coverage36 4.46 1.51 1.80 2.14 2.03 1.83
24 Required Debt Coverage 1.20 1.20 1.20 1.20 1.20 1.20
34 Equal to [Line 1 + Line 9 – Line 15]35 Equal to [( Sum of Lines 4-6) – Line 12]36 Equal to [Line 21 ÷ Line 22]

2021 WATER AND WASTEWATER COST OF SERVICE AND RATE DESIGN STUDY 47
Figure 4-2 shows projected debt coverage (blue line) relative to the debt coverage requirement (red line) over thestudy period. Debt coverage is expected to drop sharply in FY 2021-22 due to additional debt service from ananticipated Water Infrastructure Finance and Innovation Act (WIFIA) loan to finance a portion ofVenturaWaterPure CIP project costs. Note that debt coverage is projected to drop sharply beyond FY 2025-26 dueto the anticipated need for additional debt to finance CIP (see Appendix B for ten-year financial plan projections).
Figure 4-2: Proposed Water Financial Plan - Debt Coverage
Figure 4-3 shows the Water Enterprise’s projected ending balance under the proposed financial plan. The light bluebars indicate the ending balance. The total reserve target is represented by the red dashed line. The Water Enterpriseis projected to continue to draw down its reserves through FY 2024-25 to fund substantial R&R CIP projects exclusiveof VenturaWaterPure. By the end of the study period, the Water Enterprise’s reserves are projected to remain abovethe target amount with the proposed rate increases. Maintaining reserves above the target amount is necessary asadditional drawdown of reserves beyond FY 2025-26 is anticipated to fund substantial R&R CIP from FY 2026-27through FY 2029-30 (see Appendix B for ten-year financial plan projections).
Figure 4-3: Proposed Water Financial Plan – Projected Ending Balances

48 VENTURA WATER
Figure 4-4 shows the proposed versus status quo operating financial plan. Revenues under the proposed financialplan and status quo financial plan are represented by the green and red dashed lines, respectively. Revenuerequirements including O&M expenses, debt service, and reserve funding for CIP/other purposes are represented bythe various stacked bars. Revenue adjustments are required to generate sufficient revenue to recover O&M expensesand debt service payments over the study period.
Figure 4-4: Proposed vs. Status Quo Water Financial Plan
4.3.Water Cost of Service AnalysisSection 4.3 details the cost of service (COS) analysis performed for the Water Enterprise for FY 2020-21. The COSanalysis allocates the overall rate revenue requirement to customer classes based on their proportion of use of and burdenon the water system. This provides the basis for the development of proposed water rates through FY 2025-26.
4.3.1.METHODOLOGY
The first step in a COS analysis is to determine the revenue required from water rates. The total revenue requirementresults from the financial plan in Section 4.2. The framework and methodology utilized to develop the COS analysisand to apportion the revenue requirement to each customer class and tier is informed by the processes outlined inthe AWWA’s Manual M1.
COS analyses are tailored to meet the specific needs of each water system. However, there are four distinct steps inevery COS analysis to recover costs from customers in an accurate, equitable, and defensible manner:
1. Cost functionalization: O&M expenses and capital assets are categorized by their function in the system.Sample functions may include water supply, treatment, distribution, transmission, customer service, etc.

2021 WATER AND WASTEWATER COST OF SERVICE AND RATE DESIGN STUDY 49
2. Cost causation component allocation: Functionalized costs are then allocated to cost causation componentsbased on their burden on the system. The cost causation components include water supply, base delivery,extra-capacity, meters, and customer, among others. The revenue requirement is allocated accordingly tothe cost causation components and results in the total share of the revenue requirement attributable to eachcost component.
3. Unit cost development: The revenue requirement for each cost causation component is divided by theappropriate units of service to determine the unit cost of each.
4. Revenue requirement distribution: The unit cost is utilized to distribute the revenue requirement for eachcost causation component to customer classes based on each customer class’s individual service units.
This method of functionalizing costs is consistent with the AWWA’s Manual M1 and is widely used in the waterindustry to perform COS analyses.
4.3.2.WATER RATE REVENUE REQUIREMENT
Table 4-29 shows the rate revenue requirement for FY 2020-21 (also referred to as the test year). The revenuerequirement is split into operating, capital, and revenue offset categories (Columns C-E), which are later allocated basedon O&M expenses and capital assets. The revenue requirements (Lines 2-3) are equal to FY 2020-21 operating expensesplus debt service. The revenue offsets (Lines 7-8) include miscellaneous rate revenue not subject to revenue adjustmentsand all Fund 52 non-rate revenues. These revenues are applied as offsets to the final rate revenue requirement. Thereserve transfer adjustment (Line 12) is equal to FY 2020-21 negative net operating cash flow and represents theadditional rate revenue required to build up operating reserves in FY 2020-21. All values are from the proposed financialplan operating cash flow (Table 4-27). The final rate revenue requirement (Line 15) is calculated as follows:
Total revenue required from rates (Line 15) = Revenue requirements (Line 4) - Revenue offsets (Line 9) - Adjustments (Line 13)
Table 4-29: FY 2020-21 Water Rate Revenue Requirement[A] [B] [C] [D] [E] [F]
Line DescriptionOperatingRevenue
Requirement
CapitalRevenue
Requirement
RevenueOffsets
Total
1 Revenue Requirements2 O&M Expenses $33,440,262 $0 $0 33,440,2623 Debt Service $0 $1,598,783 $0 $1,598,7834 Total Revenue Requirements $33,440,262 $1,598,783 $0 $35,039,04556 Less Revenue Offsets
7Water Rates not Subject toRevenue Adjustments
$0 $0 $147,095 $147,095
8 Other Fund 52 Revenue $0 $0 $6,161,912 $6,161,9129 Total Revenue Offsets $0 $0 $6,309,008 $6,309,008
1011 Less Adjustments12 Transfer from (to) Reserves $0 ($1,019,146) $0 ($1,019,146)13 Total Adjustments $0 ($1,019,146) $0 ($1,019,146)1415 Water Rate Revenue Requirement $33,440,262 $2,617,929 ($6,309,008) $29,749,184

50 VENTURA WATER
4.3.3.WATER SYSTEM PEAKING FACTORS
A significant portion of the costs of the water system are based on the peaking characteristics of the different customerclasses. A water system is designed to meet different requirements, including extra-capacity / peaking costs. Peakingcosts are divided into maximum day (Max Day) and maximum hour (Max Hour) demand. The Max Day demandis the maximum amount of water used in a single day over a full year. The Max Hour demand is the maximum usein an hour on the Max Day. For example, storage and treatment components of the water system are designed tohandle Max Day requirements while the distribution system is designed for Max Hour demands.
Table 4-30 shows system-wide peaking factors for Ventura Water’s water system, which are used to derive the costcomponent allocation bases for Base Delivery, Max Day, and Max Hour costs. Base Delivery use is consideredaverage daily demand over one year, which has been normalized to a factor of 1.00 (Column C, Line 1). The MaxDay peaking factor (Column C, Line 2) indicates that the Max Day demand is 1.52 times greater than the averagedaily demand. Similarly, the Max Hour peaking factor (Column C, Line 3) shows that the Max Hour demand is3.97 times greater than average demand. The allocation bases (Columns D-F) are calculated using the equationsoutlined below. Columns are represented in these equations as letters, and lines are represented as numbers. Forexample, Column D, Line 2 is shown as D2.
The Max Day allocations are calculated as follows:» Base Delivery: C1 / C2 x 100% = D2» Max Day: (C2 - C1) / C2 x 100% = E2
The Max Hour allocations are calculated as follows:» Base Delivery: C1 / C3 x 100% = D3» Max Day: (C2 - C1) / C3 x 100% = E3» Max Hour: (C3 - C2) / C3 x 100% = F3
Table 4-30: Water System Peaking Factor Allocations
[A] [B] [C] [D] [E] [F] [G]Line Description Factor37 Base Max Day Max Hour Total
1 Base 1.00 100.0% 0.0% 0.0% 100.0%2 Max Day 1.52 65.8% 34.2% 0.0% 100.0%3 Max Hour 3.97 25.2% 13.1% 61.7% 100.0%
4.3.4.FUNCTIONALIZATION AND ALLOCATION OF EXPENSES
After determining the revenue requirement and systemwide peaking allocation basis, the next step of the waterCOS analysis is to allocate O&M expenses and capital assets to the following functional categories:
» Water Supply: water supply costs relating to Ventura River - Foster Park water, groundwater production,Casitas MWD wholesale water purchases, the State Water Project, and VenturaWaterPure
» Storage: costs related to water storage tanks and reservoirs» Treatment: costs associated with treating water to drinking water standards» Storage/Treatment: costs associated specifically with supervisory control and data acquisition (SCADA)» Transmission: costs associated with the water transmission system (pump stations, etc.)
37 From 2010 Water Master Plan.
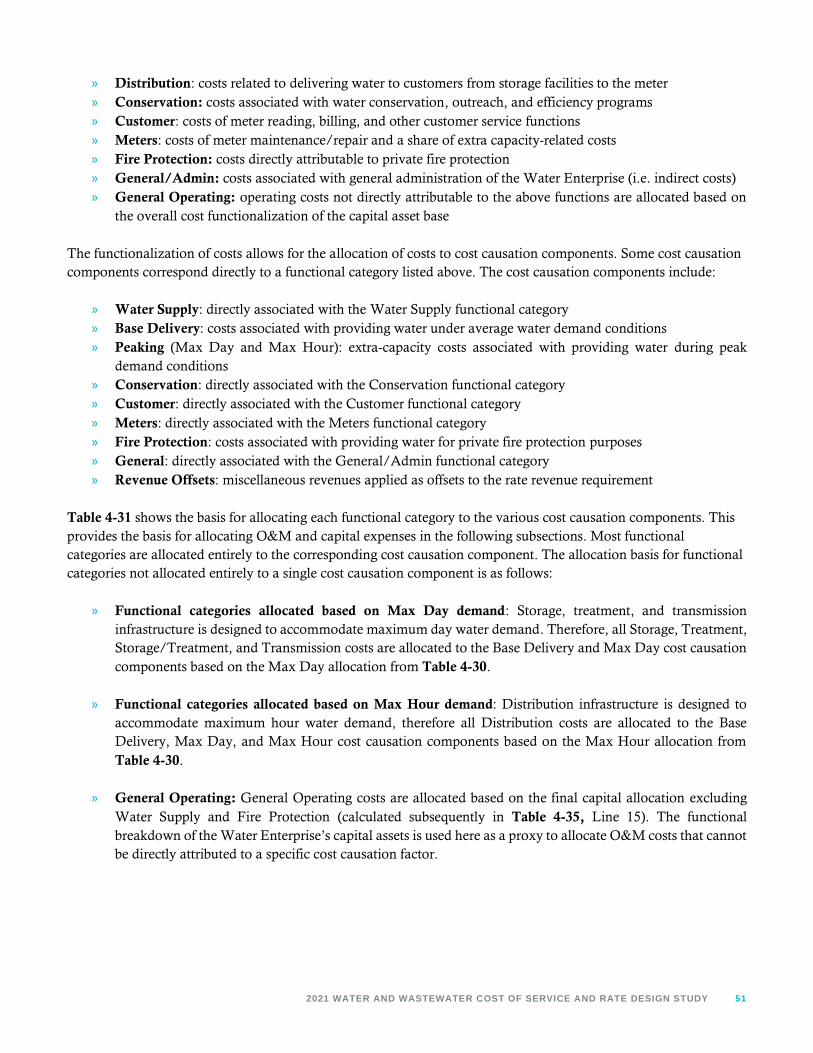
2021 WATER AND WASTEWATER COST OF SERVICE AND RATE DESIGN STUDY 51
» Distribution: costs related to delivering water to customers from storage facilities to the meter» Conservation: costs associated with water conservation, outreach, and efficiency programs» Customer: costs of meter reading, billing, and other customer service functions» Meters: costs of meter maintenance/repair and a share of extra capacity-related costs» Fire Protection: costs directly attributable to private fire protection» General/Admin: costs associated with general administration of the Water Enterprise (i.e. indirect costs)» General Operating: operating costs not directly attributable to the above functions are allocated based on
the overall cost functionalization of the capital asset base
The functionalization of costs allows for the allocation of costs to cost causation components. Some cost causationcomponents correspond directly to a functional category listed above. The cost causation components include:
» Water Supply: directly associated with the Water Supply functional category» Base Delivery: costs associated with providing water under average water demand conditions» Peaking (Max Day and Max Hour): extra-capacity costs associated with providing water during peak
demand conditions» Conservation: directly associated with the Conservation functional category» Customer: directly associated with the Customer functional category» Meters: directly associated with the Meters functional category» Fire Protection: costs associated with providing water for private fire protection purposes» General: directly associated with the General/Admin functional category» Revenue Offsets: miscellaneous revenues applied as offsets to the rate revenue requirement
Table 4-31 shows the basis for allocating each functional category to the various cost causation components. Thisprovides the basis for allocating O&M and capital expenses in the following subsections. Most functionalcategories are allocated entirely to the corresponding cost causation component. The allocation basis for functionalcategories not allocated entirely to a single cost causation component is as follows:
» Functional categories allocated based on Max Day demand: Storage, treatment, and transmissioninfrastructure is designed to accommodate maximum day water demand. Therefore, all Storage, Treatment,Storage/Treatment, and Transmission costs are allocated to the Base Delivery and Max Day cost causationcomponents based on the Max Day allocation from Table 4-30.
» Functional categories allocated based on Max Hour demand: Distribution infrastructure is designed toaccommodate maximum hour water demand, therefore all Distribution costs are allocated to the BaseDelivery, Max Day, and Max Hour cost causation components based on the Max Hour allocation fromTable 4-30.
» General Operating: General Operating costs are allocated based on the final capital allocation excludingWater Supply and Fire Protection (calculated subsequently in Table 4-35, Line 15). The functionalbreakdown of the Water Enterprise’s capital assets is used here as a proxy to allocate O&M costs that cannotbe directly attributed to a specific cost causation factor.

52 VENTURA WATER
Table 4-31: Allocation of Functional Categories to Water Cost Causation Components[A] [B] [C] [D] [E] [F] [G] [H] [I] [J] [K] [L]
Line Functional CategoryWaterSupply
BaseDelivery
Max Day Max HourConserv-
ationCustomer Meters
FireProtection
General Total
1 Water Supply 100.0% 100.0%
2Storage(Max Day basis) 65.8% 34.2% 0.0% 100.0%
3Treatment(Max Day basis) 65.8% 34.2% 0.0% 100.0%
4Storage/Treatment(Max Day basis) 65.8% 34.2% 0.0% 100.0%
5Transmission(Max Day basis) 65.8% 34.2% 0.0% 100.0%
6Distribution(Max Hour basis) 25.2% 13.1% 61.7% 100.0%
7 Conservation 100.0% 100.0%
8 Customer 100.0% 100.0%
9 Meters 100.0% 100.0%
10 Fire Protection 100.0% 100.0%
11 General/Admin 100.0% 100.0%
12 General Operating 0.0% 41.7% 21.7% 26.0% 0.0% 0.0% 5.2% 0.0% 5.5% 100.0%

2021 WATER AND WASTEWATER COST OF SERVICE AND RATE DESIGN STUDY 53
4.3.5.WATER ENTERPRISE O&M EXPENSE ALLOCATION
The next step of the COS analysis is to develop an allocation basis for the operating revenue requirement based onthe functionalization of the Water Enterprise’s O&M expenses. Raftelis worked with Ventura Water staff to assignO&M expenses, by line item, to the most closely associated functional category. Table 4-32 shows a summary of FY2020-21 O&M expenses by functional category. This intermediate step is necessary to allocate total O&M expensesto individual cost causation components.
Table 4-32: Summary of Water Enterprise O&M Expenses by Functional Category[A] [B] [C] [D]
Line Functional CategoryFY 2020-21
O&M ExpensesPercent of Total
1 Water Supply $7,598,205 22.7%2 Storage $3,000 0.01%3 Treatment $5,735,923 17.2%4 Storage/Treatment $929,200 2.8%5 Transmission $0 0.0%6 Distribution $4,812,003 14.4%7 Conservation $962,842 2.9%8 Customer $1,599,676 4.8%9 Meters $0 0.0%10 Fire Protection $0 0.0%11 General/Admin $3,648,189 10.9%12 General Operating $8,151,225 24.4%13 Total O&M Expenses $33,440,262 100.0%
Table 4-33 shows the allocation of FY 2020-21 O&M expenses by functional category to each cost causationcomponent. The percentage allocation of each functional category (Columns C-K) to the various cost causationcomponents was determined in Table 4-31. Total O&M expenses associated with each functional category(Column L) was determined in Table 4-32. The total dollar amount allocated to each cost causation component(Line 13) is determined by multiplying the total expense associated with each functional category by thecorresponding percentage allocation and summing across all functional categories.
For example, 100 percent (Column C, Line 1) of Water Supply costs (Column L, Line 1) are allocated to the WaterSupply cost causation factor total (Column C, Line 13). The same calculation is performed for the remainingfunctional categories (i.e. Column C × Column L in Lines 2-12). The subtotals of Column C × Column L in Lines1-12 are summed to determine the total dollar amount allocated to the Water Supply cost causation factor (ColumnC, Line 13). The same calculations are repeated for the remaining cost causation components (Columns D-K) todetermine the allocation of O&M expenses to each cost causation component (Line 13). The total operatingrevenue requirement (Column L, Line 13) equals the operating revenue requirement from Table 4-29, Column C,Line 15. The O&M allocation percentages (Line 15) represent the proportion of total O&M expenses allocated toeach cost causation component (Line 13).

54 VENTURA WATER
Table 4-33: Allocation of Water Enterprise O&M Expenses to Cost Causation Components[A] [B] [C] [D] [E] [F] [G] [H] [I] [J] [K] [L]
Line Functional CategoryWaterSupply
BaseDelivery
Max Day Max HourConserv-
ationCustomer Meters
FireProtection
GeneralFY 2020-21
O&M1 Water Supply 100.0% $7,598,205
2 Storage 65.8% 34.2% 0.0% $3,000
3 Treatment 65.8% 34.2% 0.0% $5,735,923
4 Storage/Treatment 65.8% 34.2% 0.0% $929,200
5 Transmission 65.8% 34.2% 0.0% $0
6 Distribution 25.2% 13.1% 61.7% $4,812,003
7 Conservation 100.0% $962,842
8 Customer 100.0% $1,599,676
9 Meters 100.0% $0
10 Fire Protection 100.0% $0
11 General/Admin 100.0% $3,648,189
12 General Operating 0.0% 41.7% 21.7% 26.0% 0.0% 0.0% 5.2% 0.0% 5.5% $8,151,225
13 Total O&M $7,598,205 $8,995,767 $4,677,799 $5,085,054 $962,842 $1,599,676 $423,065 $0 $4,097,854 $33,440,262
14
15 O&M Allocation 22.7% 26.9% 14.0% 15.2% 2.9% 4.8% 1.3% 0.0% 12.3% 100.0%

2021 WATER AND WASTEWATER COST OF SERVICE AND RATE DESIGN STUDY 55
4.3.6.WATER ENTERPRISE CAPITAL ALLOCATION
Capital assets are utilized in COS analyses to allocate the capital revenue requirement to the various cost causationcomponents. The distribution of short-term CIP project costs can be heavily weighted to specific cost causationcomponents based on the type of projects. Use of short-term plans to allocate capital costs may cause rates tofluctuate and result in customer confusion. The overall water asset base however is considerably stable in the long-term, and therefore is more representative of long-term capital investment in Ventura Water’s water system. Thus,functionalized capital assets are used to allocate capital costs.
Ventura Water staff provided Raftelis with a detailed asset listing that included the original cost of each individualasset. Raftelis calculated the replacement cost less depreciation (RCLD) of each asset based on net book valueusing the Engineering News-Record’s 20-City Average Cost Construction Index (CCI) to account for capital costinflation. As part of the capital asset analysis, Raftelis assigned each individual asset to a functional category withthe assistance of Ventura Water staff. Total water asset value (RCLD) by functional category is shown in Table4-34. Percentages are rounded to the nearest one-tenth of one percent.
Table 4-34: Summary of Water Enterprise Capital Assets by Functional Category
[A] [B] [C] [D]
Line Functional CategoryAsset Value
(RCLD)Percent of Total
1 Water Supply $13,702,285 7.7%2 Storage $33,726,107 19.0%3 Treatment $34,939,452 19.7%4 Storage/Treatment $782,222 0.4%5 Transmission $7,642,042 4.3%6 Distribution $68,625,891 38.7%7 Conservation $0 0.0%8 Customer $0 0.0%9 Meters $8,469,784 4.8%10 Fire Protection $342,769 0.2%11 General/Admin $9,002,312 5.1%12 Total Asset Value (RCLD) $177,232,866 100.0%
Table 4-35 shows the allocation of capital assets by functional category to each cost causation component. Thepercentage allocation of each functional category (Columns C-K) to the various cost causation components wasdetermined in Table 4-31. Total asset value associated with each functional category (Column L) was determinedin Table 4-34. The total dollar amount allocated to each cost causation component (Line 12) is determined bymultiplying the total asset value associated with each functional category by the corresponding percentageallocation and summing across all functional categories. This is consistent with the methodology used to determinethe allocation of O&M expenses to cost causation components in Table 4-33 (described in detail in Section 4.3.5).The final capital allocation percentages (Line 14) represent the proportion of total capital assets allocated to eachcost causation component (Line 12).
The capital allocation percentages (Line 14) are used to allocate the total capital revenue requirement. The totalcapital revenue requirement (Column L, Line 17) equals the capital revenue requirement from Table 4-29, ColumnD, Line 15. This total is allocated to each cost causation component (Columns C-K, Line 17) based on the finalcapital allocation percentages (Columns C-K, Line 14).

56 VENTURA WATER
Table 4-35: Allocation of Functionalized Water Capital Assets to Cost Causation Components[A] [B] [C] [D] [E] [F] [G] [H] [I] [J] [K] [L]
LineFunctionalCategory
WaterSupply
BaseDelivery
Max Day Max HourConserv-
ationCustomer Meters
FireProtection
GeneralAsset Value
(RCLD)1 Water Supply 100.0% $13,702,285
2 Storage 65.8% 34.2% 0.0% $33,726,107
3 Treatment 65.8% 34.2% 0.0% $34,939,452
4Storage/Treatment
65.8% 34.2% 0.0% $782,222
5 Transmission 65.8% 34.2% 0.0% $7,642,042
6 Distribution 25.2% 13.1% 61.7% $68,625,891
7 Conservation 100.0% $0
8 Customer 100.0% $0
9 Meters 100.0% $8,469,784
10FireProtection
100.0% $342,769
11General/Admin
100.0% $9,002,312
12 Total Assets $13,702,285 $68,003,109 $35,361,616 $42,350,991 $0 $0 $8,469,784 $342,769 $9,002,312 $177,232,866
13
14CapitalAllocation 7.7% 38.4% 20.0% 23.9% 0.0% 0.0% 4.8% 0.2% 5.1% 100.0%
15GeneralOperating38 N/A 41.7% 21.7% 26.0% 0.0% 0.0% 5.2% N/A 5.5% 100.0%
16
17CapitalRevenueRequirement
$202,398 $1,004,482 $522,331 $625,572 $0 $0 $125,108 $5,063 $132,974 $2,617,929
38 Equal to the percent of total assets allocated to each cost causation component excluding Water Supply and Fire Protection. These percentages are used to allocate O&Mexpenses assigned to the General Operating functional category (in Table 4-33, Line 12)
2021 WATER AND WASTEWATER COST OF SERVICE AND RATE DESIGN STUDY 57
4.3.7.PRELIMINARY WATER COST OF SERVICE ALLOCATION
Table 4-36 shows the preliminary allocation of the total FY 2020-21 rate revenue requirement to the various costcausation components. The preliminary COS allocations (Column G) are subject to further adjustments based onadditional reallocations developed in the following subsections. The results shown in Table 4-36 are calculated asfollows based on intermediate results developed in the preceding subsections:
1. Operating Revenue Requirement (Column C): The total operating revenue requirement consists solely ofthe Water Enterprise’s O&M expenses. The allocation of the total operating revenue requirement to eachcost causation component was previously determined in Table 4-33, Columns C-K, Line 13.
2. Capital Revenue Requirement (Column D): The total capital revenue requirement consists of debt serviceand reserve funding for future CIP. The allocation of the total capital revenue requirement to each costcausation component was previously determined in Table 4-35, Columns C-K, Line 17).
3. Revenue Offsets (Column E): Total revenue offsets (from Table 4-29, Column E, Line 15) are allocatedfully to a Revenue Offsets cost causation factor (Column E, Line 10). Note that the Revenue Offsets costcausation factor was not included within the operation or capital revenue requirement allocation, as itpertains exclusively to miscellaneous revenues used to offset the total revenue required from rates.
4. Reallocation of General Costs (Column F): The total General cost allocation equals the operating revenuerequirement (Column C, Line 9) and capital revenue requirement (Column D, Line 10) allocated to theGeneral cost causation component. The total General revenue requirement (Column, F, Line 13) is fullyreallocated to all other cost causation components on a pro rata basis39 (Column F, Lines 2-8) excludingthe Water Supply and Revenue Offsets cost causation components (which General costs do not pertain to).Note that the reallocation results in a shifting of costs between cost causation components but does notchange the total rate revenue requirement.
5. Preliminary Cost of Service Allocation (Column G): The preliminary COS allocation to each costcausation component (Column G, Lines 1-10) equals the sum of Columns C-F. Note that the total COSallocation (Column G, Line 11) equals the total FY 2020-21 rate revenue requirement (from Table 4-29,Column F, Line 15).
39 The operating (Column C) and capital (Column D) revenue requirements are summed for each cost causation component shown inLines 2-8. The percentage of the sum falling within each cost causation component (Lines 2-8) is multiplied by total reallocatedGeneral costs (Column F, Line 9) to determine the share of General costs reallocated to each cost causation component (Column F,Lines 2-8).

58 VENTURA WATER
Table 4-36: Preliminary Water Cost of Service Allocation (Test Year FY 2020-21)
[A] [B] [C] [D] [E] [F] [G]
LineCost CausationComponent
OperatingRevenue
Requirement
CapitalRevenue
Requirement
RevenueOffsets
Reallocationof General
Costs
PreliminaryCOS
Allocation1 Water Supply $7,598,205 $202,398 $7,800,6032 Base Delivery $8,995,767 $1,004,482 $1,760,926 $11,761,1753 Max Day $4,677,799 $522,331 $915,681 $6,115,8114 Max Hour $5,085,054 $625,572 $1,005,574 $6,716,2005 Conservation $962,842 $0 $169,545 $1,132,3876 Customer $1,599,676 $0 $281,684 $1,881,3617 Meters $423,065 $125,108 $96,527 $644,7008 Fire Protection $0 $5,063 $892 $5,9559 General $4,097,854 $132,974 ($4,230,829) $010 Revenue Offset ($6,309,008) ($6,309,008)11 Total $33,440,262 $2,617,929 ($6,309,008) $29,749,184 $29,749,184
4.3.8.ALLOCATION OF FIRE PROTECTION COSTS
Water systems provide two types of fire protection: fire flows for fire protection from fire hydrants for firefighting;and fire flows from fire lines for private structures with fire suppression sprinkler systems. In 2020, Senate Bill No.1386 was enacted into California law, and it added Section 53750.5 to the part of the California Government Codeknown as the Proposition 218 Omnibus Implementation Act, and it reads as follows:
(a) The Legislature finds and declares all of the following:
(1) Fire service is a different and distinct service from water service, which is one of several otherproperty-related services that aids in the provision of fire service provided to properties.
(2) Hydrants are part of the system of public improvements described in subdivision (n) of Section53750.
(3) Hydrants are generally designed, installed, and used to provide an immediately available waterservice to aid in extinguishing fires that threaten property served by a water service provider, and aregenerally not designed or installed to provide water service to aid in extinguishing fires that threatenproperty not served by a water service provider or wildfires. Hydrants are also used by a water serviceprovider for water system operations and maintenance.
(4) Hydrants are generally located in proximity to properties served by a water service provider tofacilitate water service to those properties. Hydrants and the water distributed through them have adirect relationship to property ownership because hydrants are generally sized based upon propertyuse and then are installed when parcels are developed or connected to a water system.
(5) Hydrants and the water distributed through them are not available to the public at large insubstantially the same manner as they are to property owners served by a water service providerbecause hydrants are designed, installed, and used to serve properties receiving water service, andthe public at large does not generally have access to water through those hydrants. Incidental or

2021 WATER AND WASTEWATER COST OF SERVICE AND RATE DESIGN STUDY 59
other de minimis use of hydrants and the water distributed through them for other purposes doesnot change their essential character as a property-related service.
(6) Hydrants and the water distributed through them are part of the property-related water serviceprovided to all property owners served by a water service provider. Through hydrants, water isimmediately available to those properties to aid in extinguishing a fire that directly threatens them.The cost associated with this aspect of water service is proportionately allocable among propertiesthat may receive a reasonably similar level of service from the immediate availability of water to aidin extinguishing fires that directly or indirectly threaten those properties.
(7) Property-related water service costs may include, but are not limited to, any costs associated withconstructing, maintaining, repairing, upgrading, and replacing hydrants, and costs associated withobtaining, treating, and distributing adequate volumes of water to meet the water demands ofproperties served by the water service provider, including water supplied for firefighting purposes.The fees or charges related to those costs are imposed upon a parcel or person as an incident ofproperty ownership.
(b) The fees or charges for property-related water service imposed or increased pursuant to Section6 of Article XIII D of the California Constitution may include the costs to construct, maintain,repair, or replace hydrants as needed or consistent with applicable fire codes and industry standards,and may include the cost of water distributed through hydrants. In addition to any other methodconsistent with Section 6 of Article XIII D of the California Constitution, fees or charges for theaspects of water service related to hydrants and the water distributed through them may be fixed andcollected as a separate fee or charge, or included in the other water rates and charges fixed andcollected by a public agency, as provided for in Section 53069.9 of the Government Code.
(c) For the purpose of this section, “hydrants” means all hydrants and other infrastructure used todistribute water that aids in the protection of property from fire, and all related or appurtenantinfrastructure and facilities owned by a water service provider necessary or convenient fordistributing water that aids in the protection of property from fire, including adequately sized andpressurized lines, pumps, and all appurtenances, but does not include privately owned hydrants orother private fire response related infrastructure.
(d) This section is declaratory of existing law.
This provision is declarative of existing law, and clarifies that the costs of water service chargeable to propertyowners include the cost of infrastructure, such as fire hydrants, that provide fire protection for nearby properties.Raftelis confirmed with Ventura Water staff that this provision is consistent with the City’s operations and use of firehydrants.
Raftelis performed a fire demand analysis to determine the share of Fire Protection costs allocated to fire hydrants(hydrant fire flow) versus private fire lines (private fire). Ventura Water provided Raftelis with a count of fire hydrantsconnected to its water system. The projected number of private fire lines in FY 2020-21 was previously shown inTable 4-5.
Table 4-37 shows the calculation of equivalent fire demand associated with fire hydrants and private fire lines.Each connection size has a fire flow demand factor similar to the hydraulic capacity factor of a water meter. The

60 VENTURA WATER
diameter of the connection (in inches) is divided by 6 (to normalize to a 6-inch hydrant connection) and then raisedto the power of 2.63 to determine the fire flow demand factor (Column C).40 The fire flow demand factor (ColumnC) is multiplied by the number of connections by size (Column D) to calculate equivalent fire demand (Column E).Total equivalent fire demand is shown for fire hydrants and private fire lines in Lines 3 and 14 respectively.
Table 4-37: Equivalent Fire Demand
[A] [B] [C] [D] [E]
Line Connection SizeDemandFactor
Unit CountEquivalent
Fire Demand1 Public Hydrants2 6-inch 1.00 3,341 3,3413 Subtotal 3,341 3,34145 Private Fire Lines6 1-inch 0.06 2,464 1377 2-inch 0.06 27 28 3-inch 0.16 2 09 4-inch 0.34 330 11410 6-inch 1.00 268 26811 8-inch 2.13 118 25112 10-inch 3.83 16 6213 12-inch 6.19 0 014 Subtotal 3,225 8331516 Total 6,566 4,174
Table 4-38 shows the number of equivalent fire demand units associated with fire hydrants and private fire lines(from Table 4-37). The proportional share of equivalent fire demand (Column D) provides the basis for which FireProtection costs are allocated in subsequent steps of the COS analysis.
Table 4-38: Fire Protection Allocation Basis[A] [B] [C] [D]
Line Connection SizeEquivalent
Fire Demand% of Equivalent
Fire Demand1 Fire Hydrants 3,341 80.0%2 Private Fire Lines 833 20.0%3 Total 4,174 100.0%
4.3.9.PEAKING UNITS OF SERVICE
Peaking units of service are developed to calculate unit peaking costs (Max Day and Max Hour) for select customerclasses and provide a basis to reallocate peaking costs to Fire Protection in subsequent steps of the COS analysis.Fire hydrants and private fire lines contribute to system capacity-related costs (i.e. peaking costs), and therefore arereallocated a portion of Max Day and Max Hour costs.
40 Per the Hazen-Williams equation and AWWA Manual M1

2021 WATER AND WASTEWATER COST OF SERVICE AND RATE DESIGN STUDY 61
Table 4-39 shows the calculation of peaking units of service for non-fire related water service. Note that reclaimedwater use is excluded because the reclaimed water system functions as an independent water system. Additionally,reclaimed water costs are associated with the Wastewater Enterprise. Therefore, reclaimed water is subject to thewastewater cost of service analysis (see Section 5.3). Table 4-39 shows calculations used to attribute peaking coststo specific customer classes based on actual water use patterns. Raftelis estimates Max Day (Column E) and MaxHour (Column H) factors based on actual FY 2018-19 water use and systemwide peaking factors (from Table 4-30).Projected FY 2020-21 water use in Column C (from Table 4-6)41 is divided by 365 days to determine average dailywater use (Column D). Average daily use in Column D is then multiplied by the Max Day factor (Column E) todetermine Max Day demand (Column F). Max Day requirements (Column G) are determined by subtracting averagedaily water use (Column D) from Max Day demand (Column F). Max Hour requirements (Column J) are similarlycalculated. Max Hour demand (Column I) equals average daily water use (Column D) multiplied by the Max Hourfactor (Column H). Max Hour requirements (Column J) equal Max Hour demand (Column I) less Max Day demand(Column F).
Table 4-39: Peaking Units by Customer Class[A] [B] [C] [D] [E] [F] [G] [H] [I] [J]
LineCustomerClass
AnnualWater
Use(HCF)
AverageDaily
Water Use(HCF)
MaxDay
Factor
Max DayDemand
(HCF/Day)
Max DayRequire-
ments(HCF/Day)
MaxHour
Factor
Max HourDemand
(HCF/Day)
Max HourRequire-
ments(HCF/Day)
1ResidentialTier 1
2,556,176 6,998 1.05 7,316 318 2.73 19,108 11,792
2ResidentialTier 2
833,762 2,283 1.30 2,968 685 3.40 7,751 4,784
3ResidentialTier 3
483,169 1,323 1.45 1,919 596 3.79 5,012 3,093
4Non-Residential
1,544,580 4,229 1.43 6,037 1,809 3.73 15,769 9,731
5Non-ResidentialIrrigation42
166,992 457 1.65 753 295 4.30 1,966 1,213
6 Untreated 26,666 73 1.43 104 31 3.74 273 168
Table 4-40 shows the methodology43 used to calculate peaking units of service associated with fire protection basedon assumptions regarding the duration and water flow rate in gallons per minute (gpm) associated with an urban fire:
Max Day Requirements (HCF/day) = Duration of Fire (hrs) × Water Use Rate (gpm) × 60 mins/hr ÷ 748.05 gallons/HCF
Max Hour Requirements (HCF/day) = [Water Use Rate (gpm) × 60 mins/hr × 24 hrs/day ÷ 748.05 gallons/HCF] – MaxDay Requirements (HCF/day)
Table 4-40: Peaking Units for Fire Protection[A] [B] [C]Line Description Value
1 Duration of Fire (Hours) 4.02 Water Use Rate (gallons per minute) 4,5003 Max Day Requirements (HCF/Day) 1,4444 Max Hour Requirements (HCF/Day) 7,219
41 Note Residential Tier 3 water use differs from the values shown in Table 4-6. The values shown account for proposed rate structurechanges discussed in further detail in Section 4.4 (see Table 4-47).42 Includes use from both Non-Residential Irrigation and Institutional/Interruptible (from Table 4-6), as the study proposes toconsolidate these two customer classes into a single Non-Residential Irrigation class (see Section 4.4).43 Per the AWWA Manual M1.

62 VENTURA WATER
Table 4-41 shows the distribution of Fire Protection Max Day and Max Hour requirements (from Table 4-40) topublic hydrants versus private fire lines based on proportional equivalent fire demand (from Table 4-38).
Table 4-41: Allocation of Peaking Units to Public and Private Fire Protection[A] [B] [C]
Line Description Value
1 Max Day Requirements (HCF/Day) 1,4442 Allocation to Hydrant Fire Protection (80.0%) 1,1563 Allocation to Private Fire Protection (20.0%) 2884
5 Max Hour Requirements (HCF/Day) 7,2196 Allocation to Hydrant Fire Protection (80.0%) 5,7787 Allocation to Private Fire Protection (20.0%) 1,441
Peaking units of service (from Table 4-39 and Table 4-41) are summarized below in Table 4-42. The percentage ofMax Day and Max Hour Requirements attributed to each customer class is shown in Columns D and Erespectively.
Table 4-42: Summary of Total Peaking Units[A] [B] [C] [D] [E] [F]
Line Customer ClassMax Day
Requirements(HCF/Day)
% of Max DayRequirements
Max HourRequirements(HCF/Day)
% of Max HourRequirements
1 Residential Tier 1 318 6.1% 11,792 31.0%2 Residential Tier 2 685 13.2% 4,784 12.6%3 Residential Tier 3 596 11.5% 3,093 8.1%4 Non-Residential 1,809 34.9% 9,731 25.6%
5Non-ResidentialIrrigation
295 5.7% 1,213 3.2%
6 Untreated 31 0.6% 168 0.4%7 Fire Hydrants 1,156 22.3% 5,778 15.2%8 Private Fire Lines 288 5.6% 1,441 3.8%9 Total 5,178 100.0% 38,000 100.0%
4.3.10.ADJUSTED WATER COST OF SERVICE
Table 4-43 shows the adjusted allocation of the water rate revenue requirement to the various cost causationcomponents. The adjusted COS allocations (Column H) incorporates adjustments to the preliminary COSallocations developed in Section 4.3.7, and ultimately provides the underlying basis for FY 2020-21 ratecalculations shown subsequently in Section 4.5. The results shown in Table 4-43 are calculated as follows based onintermediate results developed in the preceding subsections:
1. Preliminary Cost of Service Allocation (Column C): The preliminary COS allocations were previouslydeveloped in Section 4.3.7. (see Table 4-36, Column G, Lines 1-11). The General cost causationcomponent is excluded because all General costs were previously reallocated to other cost causationcomponents.

2021 WATER AND WASTEWATER COST OF SERVICE AND RATE DESIGN STUDY 63
2. Reallocation of Fire Hydrant Costs (Column D): Fire protection costs associated with fire flow for firehydrants are reallocated to the Meters cost causation component to recover these extra-capacity costs fromall metered connections. Preliminary Max Day (Column C, Line 3) and Max Hour costs (Column C, Line4) associated with fire hydrants are reallocated from Max Day (Column D, Line 3) and Max Hour(Column D, Line 4) to Meters (Column D, Line 7) based on the percentage of peaking units associatedwith fire flow for fire hydrants (Table 4-42, Column D and F, Line 7). Note that the reallocation results ina shifting of costs between cost causation components but does not change the total rate revenuerequirement.
3. Reallocation of Private Fire Costs (Column E): Preliminary peaking costs (Column C, Lines 3-4)associated with private fire protection are reallocated from Max Day (Column E, Line 3) and Max Hour(Column E, Line 4) to Fire Protection (Column E, Line 8) based on the percentage of peaking unitsassociated with private fire lines (Table 4-42, Column D and F, Line 8). Note that the reallocation resultsin a shifting of costs between cost causation components but does not change the total rate revenuerequirement.
4. Reallocation of Peaking Costs to Meters (Column F): Ventura Water collects approximately 30 percentof its water rate revenues from fixed Water Service Charges and Fire Line Service Charges. Without anyadditional cost reallocation, this updated COS analysis would reduce the proportion of revenues from fixedcharges to approximately 19 percent. This would reduce revenue stability and increase the risk of revenueinsufficiency resulting from decreases in water sales. To maintain the existing proportion of 30 percentfixed (from Water Service Charges and Fire Line Service Charges) and 70 percent variable (from WaterVolume Rates), Raftelis reallocates one third of Max Day costs (sum of Columns C-E, Line 3) and MaxHour costs (sum of Columns C-E, Line 4) from Max Day (Column F, Line 3) and Max Hour (Column F,Line 4) to Meters (Column F, Line 7). Utilities invest in, and continuously maintain, facilities to providecapacity to meet all levels of water consumption, including peak demand. These costs must be recoveredregardless of the amount of water used during a given period, so peaking costs are generally considered asfixed water system costs. To balance between affordability and revenue stability, it is a common practicethat a portion of peaking, or extra-capacity, costs are recovered by fixed charges, along with customer-related costs and meter-related costs.
5. Reallocation of Revenue Offsets (Column G): Revenue offsets directly related to water supply-relatedfunctions are reallocated from the Revenue Offsets cost causation component (Column G, Line 9) to theWater Supply cost causation component (Column G, Line 1). Water supply-related revenue offsets includeState Water Project recoverable expenditures (from Table 4-12), Casitas Direct wholesale pass-throughrevenues (from Table 4-10), and The Saticoy Club’s estimated contribution to the golf course’s share ofSaticoy Country Club System groundwater assessments.44 A portion of revenue offsets are also reallocatedfrom the Revenue Offset cost causation component (Column G, Line 9) to the Untreated Offset costcausation component (Column G, Line 10). The addition of the Untreated Offset cost causationcomponent is necessary to isolate a portion of revenue offsets for the specific purpose of offsettingtreatments costs initially allocated to Untreated Water customers.45
44 Total Saticoy Country Club System groundwater supply costs (from Table 4-16) multiplied by the The Saticoy Club golf course’sprojected share of total Saticoy Country Club System water use in FY 2020-21. The Saticoy Club golf course is not directly metered –their usage is calculated by Ventura Water staff by subtracting billed residential customer usage from total System usage measuredfrom metered groundwater wells that serve the entire System; The Saticoy Club is invoiced directly by Ventura Water based on thetotal costs to operate and maintain the System, pursuant to the terms of a co-ownership agreement of the System with the City.45 The reallocation of revenue offsets to the Untreated Offset is calculated by multiplying total projected Untreated Water use in FY2020-21 (from Table 4-6) by the estimated average treatment cost per HCF (from Table 4-64).

64 VENTURA WATER
6. Adjusted Cost of Service Allocation (Column H): The final COS allocation (Column H) equals the sumof Columns C to G. This represents the final adjusted allocation of the total water revenue requirement(from Table 4-29, Column F, Line 15) to the various cost causation components.
Table 4-43: Adjusted Cost of Service Allocation (Test Year FY 2020-21)[A] [B] [C] [D] [E] [F] [G] [H]
LineCost CausationComponent
PreliminaryCOS
Allocation
Reallocationof Fire
HydrantCosts
Reallocationof PrivateFire Costs
Reallocationof Peakingto Meters
Reallocationof Revenue
Offsets
AdjustedCOS
Allocation
1 Water Supply $7,800,603 ($1,186,068) $6,614,5352 Base Delivery $11,761,175 $11,761,1753 Max Day $6,115,811 ($1,364,889) ($340,372) ($1,470,183) $2,940,3674 Max Hour $6,716,200 ($1,021,185) ($254,660) ($1,813,451) $3,626,9035 Conservation $1,132,387 $1,132,3876 Customer $1,881,361 $1,881,3617 Meters $644,700 $2,386,074 $3,283,635 $6,314,4108 Fire Protection $5,955 $595,032 $600,9879 Revenue Offset ($6,309,008) $1,222,516 ($5,086,491)10 Untreated Offset ($36,449) ($36,449)11 Total $29,749,184 $0 $0 $0 $0 $29,749,184
4.3.11.WATER COST ALLOCATION TO CUSTOMER CLASSES
The final cost of service allocation determines how much revenue must be generated from Ventura Water’s waterrates and charges. Each cost causation component is recovered by either a fixed charge or Water Volume Rate, bycustomer class (see Table 4-44). The basis for specific exclusions is described in further detail in Section 4.5.
Table 4-44: Recovery of Cost Causation Components by Charge Type
[A] [B] [C]
LineCost CausationComponent
Associated Charge
1 Water Supply Water Volume Rates (excluding reclaimed water)2 Base Delivery Water Volume Rates (excluding reclaimed water)3 Max Day Water Volume Rates (excluding reclaimed water)4 Max Hour Water Volume Rates (excluding reclaimed water)5 Conservation Water Volume Rates (excluding reclaimed water)6 Customer Water Service Charges; Fire Line Service Charges7 Meters Water Service Charges8 Fire Protection Fire Line Service Charges9 Revenue Offset Water Volume Rates (excluding reclaimed water)10 Untreated Offset Untreated Water Volume Rates
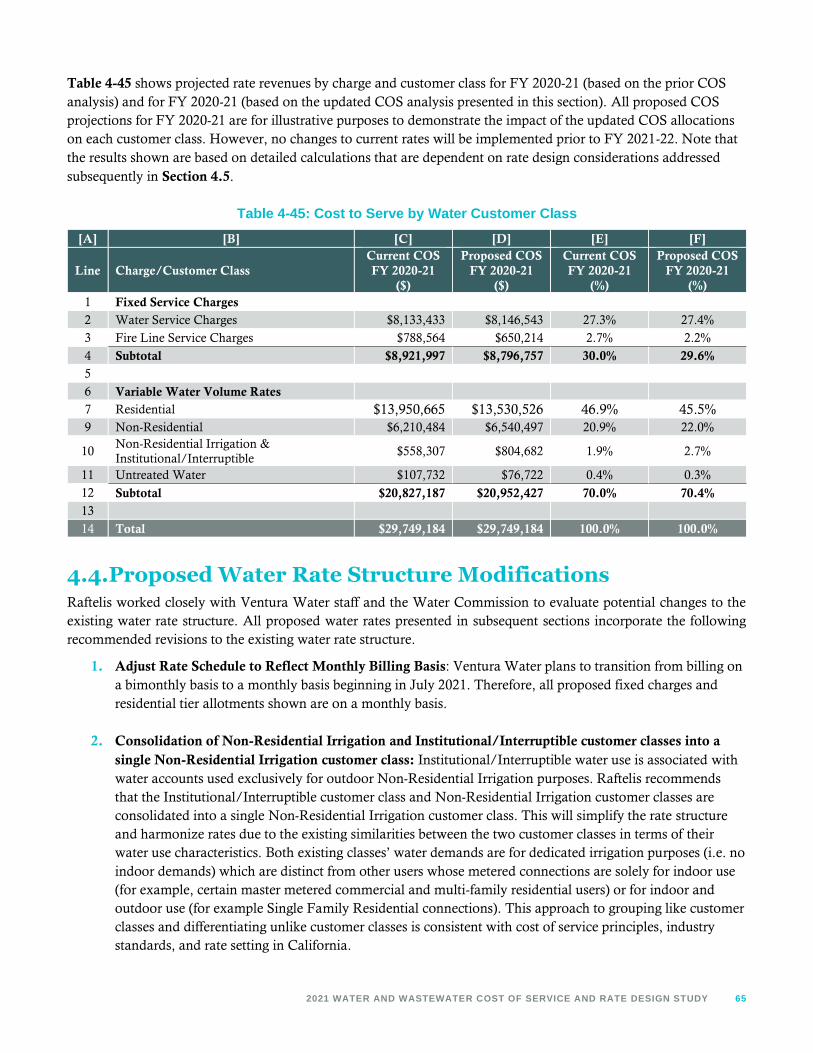
2021 WATER AND WASTEWATER COST OF SERVICE AND RATE DESIGN STUDY 65
Table 4-45 shows projected rate revenues by charge and customer class for FY 2020-21 (based on the prior COSanalysis) and for FY 2020-21 (based on the updated COS analysis presented in this section). All proposed COSprojections for FY 2020-21 are for illustrative purposes to demonstrate the impact of the updated COS allocationson each customer class. However, no changes to current rates will be implemented prior to FY 2021-22. Note thatthe results shown are based on detailed calculations that are dependent on rate design considerations addressedsubsequently in Section 4.5.
Table 4-45: Cost to Serve by Water Customer Class[A] [B] [C] [D] [E] [F]
Line Charge/Customer ClassCurrent COSFY 2020-21
($)
Proposed COSFY 2020-21
($)
Current COSFY 2020-21
(%)
Proposed COSFY 2020-21
(%)1 Fixed Service Charges2 Water Service Charges $8,133,433 $8,146,543 27.3% 27.4%
3 Fire Line Service Charges $788,564 $650,214 2.7% 2.2%
4 Subtotal $8,921,997 $8,796,757 30.0% 29.6%5
6 Variable Water Volume Rates7 Residential $13,950,665 $13,530,526 46.9% 45.5%9 Non-Residential $6,210,484 $6,540,497 20.9% 22.0%
10Non-Residential Irrigation &Institutional/Interruptible
$558,307 $804,682 1.9% 2.7%
11 Untreated Water $107,732 $76,722 0.4% 0.3%
12 Subtotal $20,827,187 $20,952,427 70.0% 70.4%13
14 Total $29,749,184 $29,749,184 100.0% 100.0%
4.4.Proposed Water Rate Structure ModificationsRaftelis worked closely with Ventura Water staff and the Water Commission to evaluate potential changes to theexisting water rate structure. All proposed water rates presented in subsequent sections incorporate the followingrecommended revisions to the existing water rate structure.
1. Adjust Rate Schedule to Reflect Monthly Billing Basis: Ventura Water plans to transition from billing ona bimonthly basis to a monthly basis beginning in July 2021. Therefore, all proposed fixed charges andresidential tier allotments shown are on a monthly basis.
2. Consolidation of Non-Residential Irrigation and Institutional/Interruptible customer classes into asingle Non-Residential Irrigation customer class: Institutional/Interruptible water use is associated withwater accounts used exclusively for outdoor Non-Residential Irrigation purposes. Raftelis recommendsthat the Institutional/Interruptible customer class and Non-Residential Irrigation customer classes areconsolidated into a single Non-Residential Irrigation customer class. This will simplify the rate structureand harmonize rates due to the existing similarities between the two customer classes in terms of theirwater use characteristics. Both existing classes’ water demands are for dedicated irrigation purposes (i.e. noindoor demands) which are distinct from other users whose metered connections are solely for indoor use(for example, certain master metered commercial and multi-family residential users) or for indoor andoutdoor use (for example Single Family Residential connections). This approach to grouping like customerclasses and differentiating unlike customer classes is consistent with cost of service principles, industrystandards, and rate setting in California.

66 VENTURA WATER
3. Elimination of Outside City (County) Surcharge: Raftelis recommends that Ventura Water eliminate thecurrent surcharge per HCF of water for customers residing outside of City Limits due to a reduced watercost differential compared to the previous Rate Study. This will simplify the rate structure and improve thedefensibility and customer understanding of future water rates, while having a minimal effect on InsideCity rates.
4. Differentiate Fire Line Service Charges for Single Family Residential Customers: Private fire linesassociated with single family residential accounts do not receive a separate bill for the Fire Line ServiceCharge. Therefore, Raftelis recommends that single family residential customers with U-branch fire linesare charged a unique rate to properly offset billing costs already paid by those customers via the WaterService Charge.
5. Update Residential Tier Allotments: Raftelis recommends that the rate structure for residential WaterVolume Rates be consolidated from four tiers to three tiers. A three-tier rate structure allows for tierallotments to be based on efficient indoor water use for Tier 1, average outdoor water demands for Tier 2,and all use greater than average outdoor use for Tier 3. A well-defined three-tier rate structure is typicallyeasier for customers to understand and may result in less revenue volatility compared to a four-tier ratestructure. Current and proposed residential monthly tier allotments and the underlying basis for each isdescribed in detail in Table 4-46.
Table 4-46: Proposed Changes to Residential Tier Allotments
Description
CurrentMonthly
Allotment(per
DwellingUnit)
Current Basis
ProposedMonthly
Allotment(per
DwellingUnit)
Proposed Basis
Single Family Residential
Tier 1 0-3 HCFEssential minimal indoor waterneeds for health and sanitation
0-6 HCFEfficient indoor water use (based on singlefamily residential average monthly wateruse during winter in FY 2018-19)
Tier 2 4-7 HCF Remaining indoor water use 7-12 HCF
Average peak summer water use (basedon single family residential averagemonthly water use during summer peak inFY 2018-19)
Tier 3 8-15 HCF Outdoor water use below Tier 4 >12 HCF All use in excess of Tier 2
Tier 4 >15 HCFTop 15% of water use targetedfor conservation
N/A N/A
Multiple Family Residential
Tier 1 0-3 HCFEssential minimal indoor wateruse
0-5 HCFProposed Single Family Residential Tier 1modified to account for smaller averagehousehold size, per dwelling unit
Tier 2 4-5 HCF Remaining indoor water use 6-10 HCFProposed Single Family Residential Tier 2modified to account for smaller averagehousehold size, per dwelling unit
Tier 3 6-8 HCF Outdoor water use below Tier 4 >10 HCF All use in excess of Tier 2
Tier 4 >8 HCFTop 10% of water use targetedfor conservation
N/A N/A

2021 WATER AND WASTEWATER COST OF SERVICE AND RATE DESIGN STUDY 67
Table 4-47 shows estimated residential water use by tier under the current four-tier rate structure and proposed three-tier rate structure. All projections are based on detailed account-level analysis of FY 2018-19 residential water use.Raftelis projects that nearly two thirds of all residential water use will fall within Tier 1 under the proposed three-tierresidential rate structure.
Table 4-47: Projected FY 2020-21 Residential Water Use by Tier – Current versus Proposed
DescriptionCurrent Water
Use by Tier (HCF)Proposed Water
Use by Tier (HCF)Current WaterUse by Tier (%)
Proposed WaterUse by Tier (%)
% Change
Residential Tier 1 1,638,560 2,556,176 42.3% 66.0% 56.0%Residential Tier 2 1,172,329 833,762 30.3% 21.5% -28.9%Residential Tier 3 814,817 483,169 21.0% 12.5% -40.7%Residential Tier 4 247,402 N/A 6.4% 0.0% -100.0%Total 3,873,107 3,873,107 100.0% 100.0% 0.0%
4.5.Proposed Water RatesSection 4.5 shows detailed calculations of proposed water rates through FY 2025-26. All proposed rates are firstcalculated directly from the results of the COS analysis (in Section 4.3) for FY 2020-21 (i.e. the “test year”). Notehowever that proposed rates will not be implemented until FY 2021-22. Therefore, all FY 2020-21 “COS” ratesand charges shown represent intermediate results of the rate design process but will not actually be implementedduring FY 2020-21. However, FY 2020-21 “COS” rates and charges must be calculated to provide a basis forproposed rates for FY 2021-22 through FY 2025-26 (shown in Section 0).
4.5.1.WATER SERVICE CHARGES (TEST YEAR FY 2020-21)
Table 4-48 shows the calculation of equivalent meters, which is necessary to differentiate Water Service Chargesby meter size. Meter capacity ratios (Column D) are first calculated by dividing meter capacity (Column C) by 30gallons per minute (gpm). Meter capacity ratios (Column D) are then multiplied by the number of water meters ateach meter size in Column E (from Table 4-5) to determine equivalent meters (Column F). Equivalent meters inthis study are based on AWWA-rated hydraulic capacities46 and are calculated to represent the potential demandon the water system relative to a base meter size.
Table 4-48: Number of Equivalent Meters (Test Year FY 2020-21)[A] [B] [C] [D] [E] [F]
Line Meter SizeMeter Capacity
(gpm)Meter Capacity
RatioNumber of
MetersNumber of
Equivalent Meters1 3/4-inch water meter 30 1.00 25,198 25,1982 1-inch water meter 50 1.67 2,500 4,1673 1.5-inch water meter 100 3.33 956 3,1874 2-inch water meter 160 5.33 738 3,9365 3-inch water meter 350 11.67 116 1,3496 4-inch water meter 630 21.00 70 1,4787 6-inch water meter 1,300 43.33 74 3,2248 8-inch water meter 2,400 80.00 7 5639 10-inch water meter 3,800 126.67 2 255
10 12-inch water meter 5,000 166.67 0 011 Total 29,662 43,357
46 From the AWWA’s Manual of Water Supply Practices M22: Sizing Water Service Lines and Meters (Third Edition).

68 VENTURA WATER
Water Service Charges are designed to recover costs associated with the Customer and Meters cost causationcomponents. Table 4-49 shows the calculation of unit charges for the Customer and Meters cost causationcomponents by dividing the total revenue requirement associated with each cost causation component (from Table4-43, Column H) by the number of billing units.
Customer unit charges are calculated per customer bill. Meter unit charges are calculated per equivalent meter.Equivalent meters are used to allocate meter-related costs appropriately and equitably. Larger meters impose largerdemand, are more expensive to install, maintain, and replace than smaller meters, and have greater capacitypotential within the water system.
Table 4-49: Water Service Charge Unit Charge Calculation (Test Year FY 2020-21)
Description Customer MetersCOS Allocation $1,881,361 $6,314,410
Billing Units 365,512 Bills47 520,286 Annual Equivalent Meters48
Unit Charge (per Month) $5.15 per Bill $12.14 per Equivalent Meter
Table 4-50 shows the detailed calculation of monthly Water Service Charges for the test year based on Customerand Meters unit charges. Customer costs do not vary by meter size. Therefore, the Customer unit rate is applieduniformly to all Water Service Charges (Column D). Because Meters costs vary by meter size based on hydrauliccapacity, AWWA capacity ratios in Column C (from Table 4-48, Columns D) are used to differentiate Meters unitcharges by meter size. The Meters charges (Column E) are calculated by multiplying the Meters unit charge (fromTable 4-49) by the AWWA capacity ratio (Column C). COS monthly Water Service Charges (Column F) equal thesum of Columns D-E, and are compared to current FY 2020-21 charges in Columns G-I.
Table 4-50: Water Service Charge Calculation (Test Year FY 2020-21)
[A] [B] [C] [D] [E] [F] [G] [H] [I]
Line Meter SizeMeter
CapacityRatio
Customer MetersCOS
MonthlyCharge
CurrentMonthlyCharge
Difference($)
Difference(%)
1 3/4-inch water meter 1.00 $5.15 $12.14 $17.28 $16.85 $0.44 2.6%2 1-inch water meter 1.67 $5.15 $20.23 $25.37 $25.52 ($0.14) -0.6%3 1.5-inch water meter 3.33 $5.15 $40.45 $45.60 $47.19 ($1.59) -3.4%4 2-inch water meter 5.33 $5.15 $64.73 $69.87 $73.21 ($3.34) -4.6%5 3-inch water meter 11.67 $5.15 $141.59 $146.74 $155.59 ($8.85) -5.7%6 4-inch water meter 21.00 $5.15 $254.86 $260.01 $276.99 ($16.98) -6.1%7 6-inch water meter 43.33 $5.15 $525.91 $531.06 $567.49 ($36.43) -6.4%8 8-inch water meter 80.00 $5.15 $970.91 $976.06 $1,044.42 ($68.36) -6.5%9 10-inch water meter 126.67 $5.15 $1,537.28 $1,542.43 $1,651.43 ($109.00) -6.6%
10 12-inch water meter 166.67 $5.15 $2,022.73 $2,027.88 $2,171.72 ($143.84) -6.6%
47 Equal to [29,662 water meters plus 797 fire lines not associated with Single Family Residential accounts] multiplied by 12 monthlybilling periods per year.48 Equal to 43,357 equivalent meter units multiplied by 12 monthly billing periods per year.

2021 WATER AND WASTEWATER COST OF SERVICE AND RATE DESIGN STUDY 69
4.5.2.FIRE LINE SERVICE CHARGES (TEST YEAR FY 2020-21)
Fire Service Charges are designed to recover costs associated with the Customer and Fire Protection cost causationcomponents. Table 4-51 shows the calculation of unit charges for the Customer and Fire Protection cost causationcomponents by dividing the total revenue requirement associated with each cost causation component (from Table4-43, Column H) by the number of billing units.
Customer unit charges were previously calculated in Table 4-49 but are shown again below. Fire Protection unitcharges are calculated per fire demand equivalent (from Table 4-37). Fire demand equivalents are used to allocateFire Protection costs by connection size because larger connections are more expensive to install, maintain, andreplace than smaller fire lines, and also have greater capacity potential on the water system.
Table 4-51: Fire Line Service Charge Unit Charge Calculation (Test Year FY 2020-21)Description Customer Fire ProtectionCOS Allocation $1,881,361 $600,987Billing Units 365,512 Bills49 9,998 Fire Demand Equivalents50
Unit Charge (per Month) $5.15 per Bill $60.11 per Fire Demand Equivalents
Table 4-52 shows the detailed calculation of monthly Fire Service Charges for the test year based on Customer and FireProtection unit charges. U-branch fire lines associated with single family residential accounts do not receive separate billsspecifically for the Fire Line Service Charge. Therefore, no Customer unit charge is applied to single family residentialU-branch fire lines. All other fire lines are subject to the Customer unit charge, which is applied uniformly to allconnection sizes (Column D). Because Fire Protection costs vary by connection size based on capacity, equivalent firedemand factors in Column C (from Table 4-37, Columns C) are used to differentiate Fire Protection unit charges byconnection size. The Fire Protection charges (Column E) are calculated by multiplying the Fire Protection unit charge(from Table 4-51) by the equivalent fire demand factors (Column C). COS monthly Fire Line Service Charges (ColumnF) equal the sum of Columns D-E, and are compared to current FY 2020-21 charges in Columns G-I.
Table 4-52: Fire Line Service Charge Calculation (Test Year FY 2020-21)[A] [B] [C] [D] [E] [F] [G] [H] [I]
Line Connection SizeEquivalent
FireDemand
CustomerFire
Protection
COSMonthlyCharge
CurrentMonthlyCharge
Difference($)
Difference(%)
11-inch singlefamily residentialU-branch fire line
0.06 $0.00 $3.34 $3.34 $4.40 ($1.05) -23.9%
2 1-inch fire line 0.06 $5.15 $3.34 $8.49 $4.40 $4.10 93.2%3 2-inch fire line 0.06 $5.15 $3.34 $8.49 $4.40 $4.10 93.2%4 3-inch fire line 0.16 $5.15 $9.71 $14.86 $12.75 $2.11 16.6%5 4-inch fire line 0.34 $5.15 $20.69 $25.84 $27.15 ($1.30) -4.8%6 6-inch fire line 1.00 $5.15 $60.11 $65.26 $78.84 ($13.58) -17.2%7 8-inch fire line 2.13 $5.15 $128.10 $133.24 $168.01 ($34.76) -20.7%8 10-inch fire line 3.83 $5.15 $230.36 $235.51 $302.13 ($66.61) -22.0%9 12-inch fire line 6.19 $5.15 $372.10 $377.25 $488.01 ($110.76) -22.7%
49 Equal to [29,662 water meters plus 797 fire lines not categorized as Single Family Residential U-branch lines] multiplied by 12monthly billing periods per year.50 Equal to 833 Fire Demand Equivalents multiplied by 12 monthly billing periods per year.
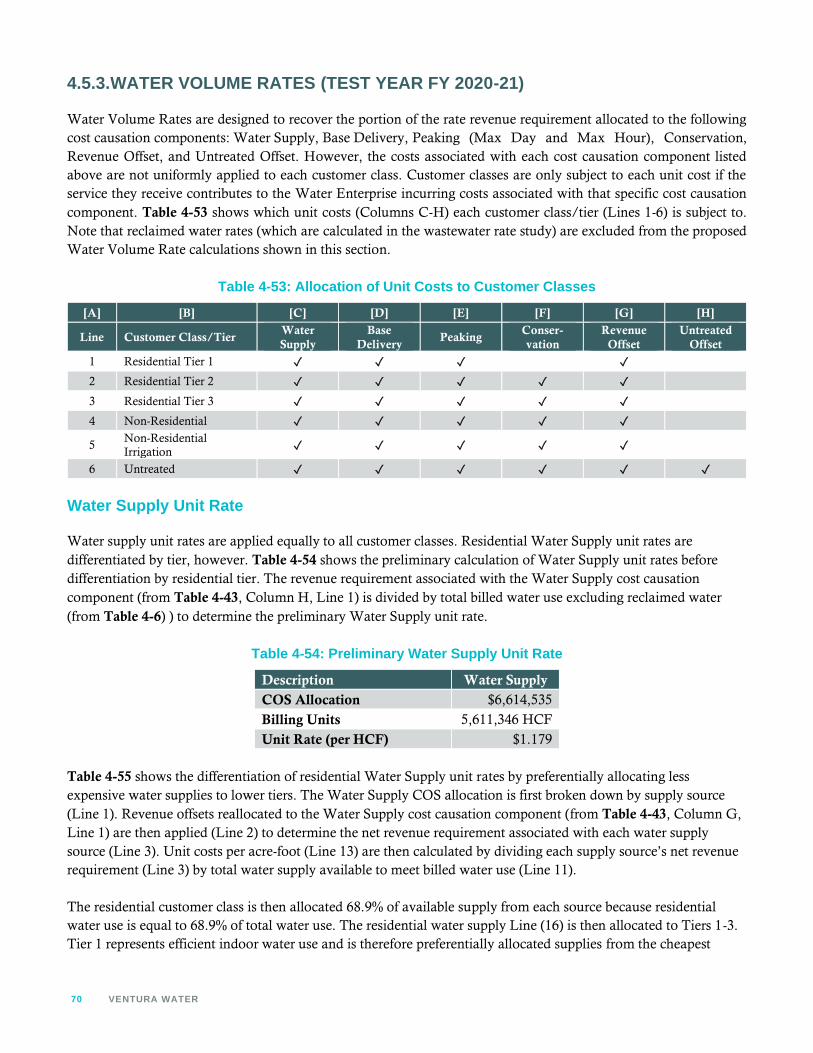
70 VENTURA WATER
4.5.3.WATER VOLUME RATES (TEST YEAR FY 2020-21)
Water Volume Rates are designed to recover the portion of the rate revenue requirement allocated to the followingcost causation components: Water Supply, Base Delivery, Peaking (Max Day and Max Hour), Conservation,Revenue Offset, and Untreated Offset. However, the costs associated with each cost causation component listedabove are not uniformly applied to each customer class. Customer classes are only subject to each unit cost if theservice they receive contributes to the Water Enterprise incurring costs associated with that specific cost causationcomponent. Table 4-53 shows which unit costs (Columns C-H) each customer class/tier (Lines 1-6) is subject to.Note that reclaimed water rates (which are calculated in the wastewater rate study) are excluded from the proposedWater Volume Rate calculations shown in this section.
Table 4-53: Allocation of Unit Costs to Customer Classes
[A] [B] [C] [D] [E] [F] [G] [H]
Line Customer Class/TierWaterSupply
BaseDelivery
PeakingConser-vation
RevenueOffset
UntreatedOffset
1 Residential Tier 1 ✓ ✓ ✓ ✓2 Residential Tier 2 ✓ ✓ ✓ ✓ ✓3 Residential Tier 3 ✓ ✓ ✓ ✓ ✓4 Non-Residential ✓ ✓ ✓ ✓ ✓5
Non-ResidentialIrrigation ✓ ✓ ✓ ✓ ✓
6 Untreated ✓ ✓ ✓ ✓ ✓ ✓
Water Supply Unit Rate
Water supply unit rates are applied equally to all customer classes. Residential Water Supply unit rates aredifferentiated by tier, however. Table 4-54 shows the preliminary calculation of Water Supply unit rates beforedifferentiation by residential tier. The revenue requirement associated with the Water Supply cost causationcomponent (from Table 4-43, Column H, Line 1) is divided by total billed water use excluding reclaimed water(from Table 4-6) ) to determine the preliminary Water Supply unit rate.
Table 4-54: Preliminary Water Supply Unit Rate
Description Water SupplyCOS Allocation $6,614,535
Billing Units 5,611,346 HCF
Unit Rate (per HCF) $1.179
Table 4-55 shows the differentiation of residential Water Supply unit rates by preferentially allocating lessexpensive water supplies to lower tiers. The Water Supply COS allocation is first broken down by supply source(Line 1). Revenue offsets reallocated to the Water Supply cost causation component (from Table 4-43, Column G,Line 1) are then applied (Line 2) to determine the net revenue requirement associated with each water supplysource (Line 3). Unit costs per acre-foot (Line 13) are then calculated by dividing each supply source’s net revenuerequirement (Line 3) by total water supply available to meet billed water use (Line 11).
The residential customer class is then allocated 68.9% of available supply from each source because residentialwater use is equal to 68.9% of total water use. The residential water supply Line (16) is then allocated to Tiers 1-3.Tier 1 represents efficient indoor water use and is therefore preferentially allocated supplies from the cheapest

2021 WATER AND WASTEWATER COST OF SERVICE AND RATE DESIGN STUDY 71
source (Ventura River - Foster Park) and then the next cheapest source (groundwater). Tier 2 represents averageoutdoor use of the class and is therefore allocated all remaining groundwater available to residential customers.Tier 3 represents use greater than the average of the class and is therefore allocated water from the highest costsource of supply (Casitas MWD).
Residential water supply costs (Lines 25-28) are then calculated by multiplying unit costs (Line 13) by the watersupply allocations by tier (Lines 19-21). Water supply costs associated with the State Water Project (Column F),VenturaWaterPure (Column G), and unbilled water use for fire training, etc. (Line 31) are uniformly allocated toall units of water regardless of customer class or tier. The adjusted water supply cost allocations by tier (Column H,Lines 40-42) is determined by adding unbilled water supply cost allocations (Lines 34-36) to water supply costs bytier (Lines 25-27). See Table 4-55 footnotes for additional information.

72 VENTURA WATER
Table 4-55: Residential Water Supply Cost Allocation by Tier (Test Year FY 2020-21)
[A] [B] [C] [D] [E] [F] [G] [H]
Line DescriptionVentura River(Foster Park)
Groundwater Casitas MWDState Water
ProjectVenturaWaterP
ureTotal
1 Water Supply Revenue Requirement $0 $3,358,450 $2,282,172 $2,110,000 $49,981 $7,800,603
2 Water Supply Offset $0 ($89,614)51 ($96,453)52 ($1,000,000)53 $0 ($1,186,068)
3 Net Water Supply Revenue Requirement $0 $3,268,836 $2,185,718 $1,110,000 $49,981 $6,614,535
4
5 Water Supply
6 Water Supply (AF) 1,573 10,014 2,561 0 0 14,148
7 Assumed Water Loss 7.0% 7.0% 7.0% 7.0% 7.0% 7.0%
8
9 Water Supply after Loss (AF)54 1,463 9,313 2,381 0 0 13,157
10Less Saticoy Country Club Golf CourseDemand (AF)
0 261 0 0 0 261
11Water Supply after Loss excl. SaticoyCountry Club Golf Course (AF)
1,463 9,052 2,381 0 0 12,896
12
13 Unit Cost after Loss ($/AF) $0.00 $361.11 $917.84 $86.07 $3.88 $512.90
14
15 Residential Water Supply Allocation (%) 68.9% 68.9% 68.9% 68.9% 68.9% 68.9%
16 Residential Water Supply Allocation (AF) 1,009 6,241 1,642 0 0 8,891
17
18 Residential Water Supply55
19 Tier 1 1,009 4,860 0 0 0 3,590
20 Tier 2 0 1,381 533 0 0 1,171
21 Tier 3 0 0 1,109 0 0 678
22 Total (AF) 1,009 6,241 1,642 0 0 8,891
23
24 Residential Water Supply Costs
51 The Saticoy Club golf course’s estimated share of groundwater assessment costs.52 Pass-through revenue from Casitas Direct customers.53 State Water Project recoverable expenditures.54 Equal to [Line 6 ÷ (100%-7%)]55 Residential water use equals 68.9% of total water use, and is therefore allocated 68.9% of the supply from each source.
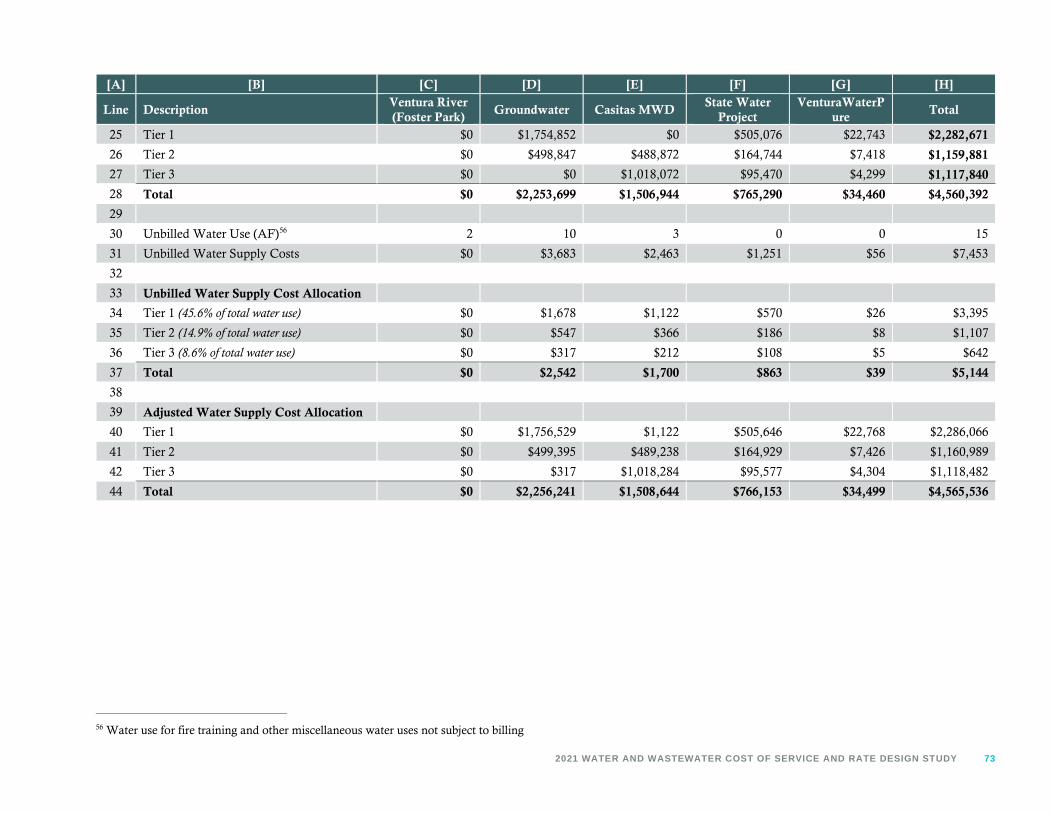
2021 WATER AND WASTEWATER COST OF SERVICE AND RATE DESIGN STUDY 73
[A] [B] [C] [D] [E] [F] [G] [H]
Line DescriptionVentura River(Foster Park)
Groundwater Casitas MWDState Water
ProjectVenturaWaterP
ureTotal
25 Tier 1 $0 $1,754,852 $0 $505,076 $22,743 $2,282,671
26 Tier 2 $0 $498,847 $488,872 $164,744 $7,418 $1,159,881
27 Tier 3 $0 $0 $1,018,072 $95,470 $4,299 $1,117,840
28 Total $0 $2,253,699 $1,506,944 $765,290 $34,460 $4,560,392
29
30 Unbilled Water Use (AF)56 2 10 3 0 0 15
31 Unbilled Water Supply Costs $0 $3,683 $2,463 $1,251 $56 $7,453
32
33 Unbilled Water Supply Cost Allocation
34 Tier 1 (45.6% of total water use) $0 $1,678 $1,122 $570 $26 $3,395
35 Tier 2 (14.9% of total water use) $0 $547 $366 $186 $8 $1,107
36 Tier 3 (8.6% of total water use) $0 $317 $212 $108 $5 $642
37 Total $0 $2,542 $1,700 $863 $39 $5,144
38
39 Adjusted Water Supply Cost Allocation
40 Tier 1 $0 $1,756,529 $1,122 $505,646 $22,768 $2,286,066
41 Tier 2 $0 $499,395 $489,238 $164,929 $7,426 $1,160,989
42 Tier 3 $0 $317 $1,018,284 $95,577 $4,304 $1,118,482
44 Total $0 $2,256,241 $1,508,644 $766,153 $34,499 $4,565,536
56 Water use for fire training and other miscellaneous water uses not subject to billing

74 VENTURA WATER
Table 4-56 shows the calculation of residential Water Supply unit rates by tier. Each tier’s water supply costallocation (from Table 4-55) is divided by the water use in the respective tier (from Table 4-47) to determine theWater Supply unit rate.
Table 4-56: Residential Water Supply Unit Rates by Tier
Residential TierWater Supply
CostAllocation
Water Use(HCF)
Water SupplyUnit Rate(per HCF)
Tier 1 $2,286,066 2,556,176 $0.894Tier 2 $1,160,989 833,762 $1.392Tier 3 $1,118,482 483,169 $2.315
Table 4-57 summarizes the proposed Water Supply unit rates by customer class and tier based on Table 4-56 forresidential customers and Table 4-54 for all other customer classes.
Table 4-57: Water Supply Unit Rates by Customer Class and Tier
Customer Class/TierWater Supply
Unit Rate(per HCF)
Residential Tier 1 $0.894
Residential Tier 2 $1.392Residential Tier 3 $2.315Non-Residential $1.179Non-Residential Irrigation $1.179Untreated $1.179
Base Delivery Unit Rate
Base Delivery unit rates are applied uniformly to all customer classes and tiers as these are costs for providingwater during average daily demand conditions. Table 4-58 shows the calculation of Base Delivery unit rates. Therevenue requirement associated with the Base Delivery cost causation component (from Table 4-43, Column H,Line 2) is divided by total billed water use excluding reclaimed water (from Table 4-6) to determine the BaseDelivery unit rate.
Table 4-58: Base Delivery Unit Rate
Description Base DeliveryCOS Allocation $11,761,175
Billing Units (HCF) 5,611,346
Unit Rate ($ / HCF) $2.096
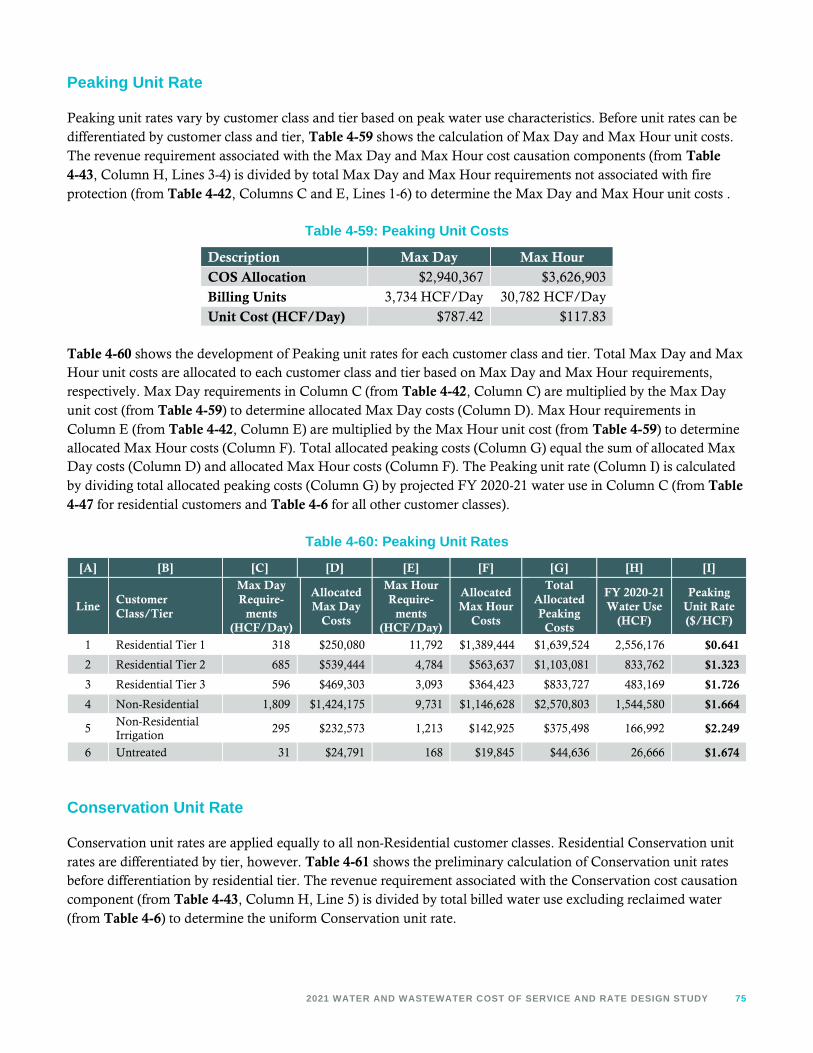
2021 WATER AND WASTEWATER COST OF SERVICE AND RATE DESIGN STUDY 75
Peaking Unit Rate
Peaking unit rates vary by customer class and tier based on peak water use characteristics. Before unit rates can bedifferentiated by customer class and tier, Table 4-59 shows the calculation of Max Day and Max Hour unit costs.The revenue requirement associated with the Max Day and Max Hour cost causation components (from Table4-43, Column H, Lines 3-4) is divided by total Max Day and Max Hour requirements not associated with fireprotection (from Table 4-42, Columns C and E, Lines 1-6) to determine the Max Day and Max Hour unit costs .
Table 4-59: Peaking Unit Costs
Description Max Day Max HourCOS Allocation $2,940,367 $3,626,903
Billing Units 3,734 HCF/Day 30,782 HCF/Day
Unit Cost (HCF/Day) $787.42 $117.83
Table 4-60 shows the development of Peaking unit rates for each customer class and tier. Total Max Day and MaxHour unit costs are allocated to each customer class and tier based on Max Day and Max Hour requirements,respectively. Max Day requirements in Column C (from Table 4-42, Column C) are multiplied by the Max Dayunit cost (from Table 4-59) to determine allocated Max Day costs (Column D). Max Hour requirements inColumn E (from Table 4-42, Column E) are multiplied by the Max Hour unit cost (from Table 4-59) to determineallocated Max Hour costs (Column F). Total allocated peaking costs (Column G) equal the sum of allocated MaxDay costs (Column D) and allocated Max Hour costs (Column F). The Peaking unit rate (Column I) is calculatedby dividing total allocated peaking costs (Column G) by projected FY 2020-21 water use in Column C (from Table4-47 for residential customers and Table 4-6 for all other customer classes).
Table 4-60: Peaking Unit Rates
[A] [B] [C] [D] [E] [F] [G] [H] [I]
LineCustomerClass/Tier
Max DayRequire-
ments(HCF/Day)
AllocatedMax Day
Costs
Max HourRequire-
ments(HCF/Day)
AllocatedMax Hour
Costs
TotalAllocatedPeaking
Costs
FY 2020-21Water Use
(HCF)
PeakingUnit Rate($/HCF)
1 Residential Tier 1 318 $250,080 11,792 $1,389,444 $1,639,524 2,556,176 $0.641
2 Residential Tier 2 685 $539,444 4,784 $563,637 $1,103,081 833,762 $1.323
3 Residential Tier 3 596 $469,303 3,093 $364,423 $833,727 483,169 $1.726
4 Non-Residential 1,809 $1,424,175 9,731 $1,146,628 $2,570,803 1,544,580 $1.664
5Non-ResidentialIrrigation
295 $232,573 1,213 $142,925 $375,498 166,992 $2.249
6 Untreated 31 $24,791 168 $19,845 $44,636 26,666 $1.674
Conservation Unit Rate
Conservation unit rates are applied equally to all non-Residential customer classes. Residential Conservation unitrates are differentiated by tier, however. Table 4-61 shows the preliminary calculation of Conservation unit ratesbefore differentiation by residential tier. The revenue requirement associated with the Conservation cost causationcomponent (from Table 4-43, Column H, Line 5) is divided by total billed water use excluding reclaimed water(from Table 4-6) to determine the uniform Conservation unit rate.

76 VENTURA WATER
Table 4-61: Preliminary Conservation Unit Rate
Description ConservationCOS Allocation $1,132,387
Billing Units 5,611,346 HCF
Unit Rate (per HCF) $0.202
Conservation costs are applied to all customer classes, but are differentiated by residential tier. This is necessarybecause conservation efforts are generally aimed at curtailing outdoor water use that is represented by Tier 2 andTier 3. Tier 1 use represents essential indoor use that conservation and efficiency efforts typically do not aim toaddress. Therefore, Raftelis recommends that no Conservation costs are allocated to Tier 1.The WaterCommission expressed support for this recommendation. Table 4-62 shows the calculation of Conservation unitrates for the residential tiers. Because Conservation costs are allocated to all customer classes proportionally, theresidential customer class must recover its fair share of Conservation costs based on total class water use.
Total Single Family Residential water use in Line 5 (from Table 4-47) is multiplied by the uniform Conservationunit rate in Line 7 (from Table 4-61) to determine the total Conservation revenue requirement for residentialcustomers (Line 9). Tier 1 water use (Line 1) is subtracted from total residential water use (Line 5) to determine theadjusted units of service (Line 11) subject to the Conservation component. The adjusted unit rate (Line 13) equalsthe residential Conservation revenue requirement (Line 9) divided by the adjusted units of service (Line 11). Thisrepresents the Conservation unit rate to be applied to Tier 2 and Tier 3 (Lines 16-17). Tier 1 is excluded fromConservation cost recovery (Line 15).
Table 4-62: Residential Conservation Unit Rates by Tier
[A] [B] [C] [D]
Line Description FY 2020-21 Notes
1 Residential Water Use (HCF)
2 Tier 1 2,556,176
3 Tier 2 833,762
4 Tier 3 483,169
5 Total Residential Water Use (HCF) 3,873,107
6
7 Conservation Unit Cost (per HCF) $0.202
8
9 Residential Conservation Revenue Requirement $781,605 = Line 5 × Line 7
10
11 Adjusted Units of Service (Tier 2-3 Water Use only) 1,316,931 = Line 5 - Line 1
12
13 Adjusted Unit Rate (Tier 2-3 only) $0.594 = Line 9 ÷ Line 11
14
15 Tier 1 Conservation Unit Rate $0.000
16 Tier 2 Conservation Unit Rate $0.594 = Line 13
17 Tier 3 Conservation Unit Rate $0.594 = Line 13

2021 WATER AND WASTEWATER COST OF SERVICE AND RATE DESIGN STUDY 77
Table 4-63 summarizes the proposed Conservation unit rates by customer class and tier based on Table 4-62 forresidential customers and Table 4-61 for all other customer classes.
Table 4-63: Conservation Unit Rates by Customer Class and Tier
Customer Class/TierConservation
Unit Rate(per HCF)
Residential Tier 1 $0.000Residential Tier 2 $0.594Residential Tier 3 $0.594Non-Residential $0.202
Non-Residential Irrigation $0.202Untreated $0.202
Revenue Offset Unit Rate
Revenue Offset unit rates are applied equally to all customer classes and tiers. Table 4-64 shows the calculation ofRevenue Offset unit rates. The revenue requirement associated with the Revenue Offset cost causation component(from Table 4-43, Column H, Line 9) is divided by total billed water use excluding reclaimed water (from Table4-6) to determine the Revenue Offset unit rate.
Table 4-64: Revenue Offset Unit Rate
DescriptionRevenue
OffsetCOS Allocation ($5,086,491)
Billing Units (HCF) 5,611,346
Unit Rate (per HCF) ($0.906)
Untreated Offset Unit Rate
The Untreated Offset unit rate is only applied to Untreated Water customers to offset any treatment-related costsallocated to the Untreated Water customer class via the Base Delivery, Max Day, and Max Hour cost causationcomponents. Table 4-65 shows the calculation of the Untreated Offset unit rate. Total operating and capitalrevenue requirements assigned to the Treatment functional category are divided by total water sales requiringtreatment by Ventura Water57 to determine an average unit cost of water treatment and therefore the UntreatedOffset unit rate.
57 Water supplied by Casitas MWD is treated before delivery to Ventura Water’s water system.

78 VENTURA WATER
Table 4-65: Untreated Offset Unit Rate
Description Untreated OffsetTreatment Functional CategoryO&M Revenue Requirement58 $5,735,923
Capital Revenue Requirement59 $516,095
Total $6,252,018
Water Sales (excl. Casitas Supply)60 4,574,021 HCF
Untreated Offset Unit Rate (per HCF) $1.367
Water Volume Rate Calculation (Test Year FY 2020-21)
Table 4-66 shows the calculation of Water Volume Rates for the test year. No revenue adjustments are incorporatedinto the COS rates shown, which are designed to collect the same amount of revenue as current water rates. Unitrates are applied to each customer class in accordance with Table 4-53. The COS rate (Column I) is calculated bysumming the following unit rates (Columns C-H):
» Water Supply Unit Rates (from Table 4-57)» Base Delivery Unit Rates (from Table 4-58)» Peaking Unit Rates (from Table 4-60)» Conservation Unit Rates (from Table 4-63)» Revenue Offset Unit Rates (from Table 4-64)» Untreated Offset Unit Rates (from Table 4-65)
58 From Table 4-32.59 Equal to total capital revenue requirement in FY 2020-21 ($2,617,929) multiplied by percent of total asset value associated with theTreatment functional category (19.7%).60 From Table 4-7.

2021 WATER AND WASTEWATER COST OF SERVICE AND RATE DESIGN STUDY 79
Table 4-66: Water Volume Rates Calculation (Test Year FY 2020-21)
[A] [B] [C] [D] [E] [F] [G] [H] [I] [J] [K] [L]
Line Customer ClassSupply
Unit Rate
BaseDeliveryUnit Rate
PeakingUnit Rate
Conserv-ation
Unit Rate
RevenueOffset Unit
Rate
UntreatedOffset Unit
Rate
COS RatePer HCF
CurrentRate per
HCF(Stage 2)
Difference($)
Difference(%)
1 Residential Tier 1 $0.894 $2.096 $0.641 $0.000 ($0.906) $0.000 $2.73 $2.77 ($0.04) -1.6%
2 Residential Tier 2 $1.392 $2.096 $1.323 $0.594 ($0.906) $0.000 $4.50 $3.12 $1.38 44.2%
3 Residential Tier 3 $2.315 $2.096 $1.726 $0.594 ($0.906) $0.000 $5.82 $4.62 $1.20 26.0%
4 Non-Residential $1.179 $2.096 $1.664 $0.202 ($0.906) $0.000 $4.23 $3.98 $0.25 6.4%
5Non-ResidentialIrrigation
$1.179 $2.096 $2.249 $0.202 ($0.906) $0.000 $4.82 $4.25 $0.57 13.4%
6 Untreated Water $1.179 $2.096 $1.674 $0.202 ($0.906) ($1.367) $2.88 $3.44 ($0.56) -16.4%
Proposed Five-Year Water Rate ScheduleTable 4-67 shows the proposed five-year schedule of water rates for FY 2021-22 to FY 2025-26. Proposed FY2021-22 water rates were calculated by increasing COS Water Service Charges (from Table 4-49), Fire Line Service Charges (from Table 4-50), andWater Volume Rates (from Table 4-66) by the proposed FY 2021-22 revenue adjustment of 7 percent (from Table 4-26). All proposed rates insubsequent years are then increased by 7 percent per year based on the schedule of proposed revenue adjustments (from Table 4-26). All proposed ratesare rounded up to the nearest cent to ensure adequate revenue recovery. Current FY 2020-21 water rates (from Table 4-1) are also shown. Current fixedcharges are shown on a monthly basis. Current Water Volume Rates are Water Shortage Stage 2 rates. Proposed rates reflect non-shortage / newbaseline supply and demand conditions. Note that Water Volume Rates for reclaimed water customers are presented in Table 4-67, but are calculated aspart of the wastewater rate study in Section 5.

80 VENTURA WATER
Table 4-67: Proposed Five-Year Water Rate Schedule
Description CurrentProposedJuly 2021
ProposedJuly 2022
ProposedJuly 2023
ProposedJuly 2024
ProposedJuly 2025
Monthly Water Service Charge3/4-inch water meter $16.85 $18.50 $19.79 $21.18 $22.66 $24.251-inch water meter $25.52 $27.16 $29.06 $31.09 $33.27 $35.591.5-inch water meter $47.19 $48.80 $52.21 $55.87 $59.78 $63.962-inch water meter $73.21 $74.77 $80.00 $85.60 $91.60 $98.013-inch water meter $155.59 $157.02 $168.01 $179.77 $192.35 $205.814-inch water meter $276.99 $278.22 $297.69 $318.53 $340.83 $364.696-inch water meter $567.49 $568.24 $608.01 $650.57 $696.11 $744.848-inch water meter $1,044.42 $1,044.39 $1,117.50 $1,195.72 $1,279.42 $1,368.9810-inch water meter $1,651.43 $1,650.40 $1,765.93 $1,889.54 $2,021.81 $2,163.3412-inch water meter $2,171.72 $2,169.84 $2,321.73 $2,484.25 $2,658.14 $2,844.21
Monthly Fire Line Service Charge1-inch single family residential U-branch fire line
$4.40 $3.58 $3.83 $4.10 $4.39 $4.69
1-inch fire line $4.40 $9.09 $9.73 $10.41 $11.13 $11.912-inch fire line $4.40 $9.09 $9.73 $10.41 $11.13 $11.913-inch fire line $12.75 $15.90 $17.02 $18.21 $19.48 $20.844-inch fire line $27.15 $27.65 $29.59 $31.66 $33.88 $36.256-inch fire line $78.84 $69.83 $74.72 $79.95 $85.54 $91.538-inch fire line $168.01 $142.58 $152.56 $163.24 $174.66 $186.8910-inch fire line $302.13 $252.00 $269.64 $288.52 $308.71 $330.3212-inch fire line $488.01 $403.66 $431.92 $462.15 $494.50 $529.11
Water Volume Rates (per HCF)Single Family ResidentialTier 1 (Current: 0-3 HCF per month /Proposed: 0-6 HCF per month) $2.77 $2.92 $3.13 $3.34 $3.58 $3.83
Tier 2 (Current: 4-7 HCF per month /Proposed: 7-12 HCF per month) $3.12 $4.82 $5.16 $5.52 $5.90 $6.31
Tier 3 (Current: 8-15 HCF per month/ Proposed: >12 HCF per month) $4.62 $6.24 $6.67 $7.14 $7.64 $8.17
Tier 4 (Current: >15 HCF per month/ Proposed: N/A) $7.73 N/A N/A N/A N/A N/A
Multiple Family ResidentialTier 1 (Current: 0-3 HCF per month /Proposed: 0-5 HCF per month) $2.77 $2.92 $3.13 $3.34 $3.58 $3.83
Tier 2 (Current: 4-5 HCF per month /Proposed: 6-10 HCF per month) $3.12 $4.82 $5.16 $5.52 $5.90 $6.31
Tier 3 (Current: 6-8 HCF per month /Proposed: >10 HCF per month) $4.62 $6.24 $6.67 $7.14 $7.64 $8.17
Tier 4 (Current: >8 HCF per month /Proposed: N/A per month) $7.73 N/A N/A N/A N/A N/A
Non-Residential $3.98 $4.54 $4.85 $5.19 $5.56 $5.94Non-Residential Irrigation $4.25 $5.16 $5.52 $5.91 $6.32 $6.76Institutional/Interruptible $3.29 N/A N/A N/A N/A N/AUntreated Water $3.44 $3.08 $3.30 $3.53 $3.78 $4.04Reclaimed Water $0.95 $1.16 $1.23 $1.31 $1.38 $1.47
Outside City Limits Surcharge (per HCF)All Customer Classes $0.60 N/A N/A N/A N/A N/A

2021 WATER AND WASTEWATER COST OF SERVICE AND RATE DESIGN STUDY 81
4.6.Proposed Water Shortage Surcharges4.6.1.WATER SHORTAGE EVENT CONTINGENCY PLAN UPDATE
Ventura Water conducted a Water Shortage Rate Study in 2015 to establish a system of implementing increasedWater Volume Rates during declared water shortage stages. This was necessary to recover revenue shortfallsresulting from reduced water sales during the recent drought. Water shortage stages are currently declared based oncriteria outlined in Ventura Water’s 2015 Water Shortage Event Contingency Plan. Stage 3 Water Volume Rateswere implemented upon adoption of the 2015 Water Shortage Rate Study and were in effect until June 2020. Stage2 rates have been effect since July 2020.
Ventura Water is in the process of updating the 2015 Water Shortage Event Contingency Plan, which willincorporate updated criteria for declaring water shortage stages (see Table 4-68). The 2020 Water ShortageContingency Plan compares current supply and current demand, instead of current supply and normal supply aswas done in the 2015 Water Shortage Event Contingency Plan. Current demand will be estimated using the mostrecent five years of customer demands plus projected demands due to annual growth. The key impact of the 2020Water Shortage Event Contingency Plan update will be that water shortage stages are less likely to be declared inthe future. Based on new baseline water demand and projected supply conditions, it is anticipated that the currentStage 2 declaration will be rescinded, and no Water Shortage rates will be implemented in FY 2021-22.
Table 4-68: Current versus Updated Water Shortage StagesWater
ShortageStage
DemandReduction
GoalTrigger
2015 Water Shortage Event Contingency Plan (Current supply and normal supply comparison)Stage 1 10% Voluntary Annual supply projection is 10% below baseline supplyStage 2 10% Mandatory Annual supply projection is 10-19% below baseline supplyStage 3 20% Mandatory Annual supply projection is 20-29% below baseline supplyStage 4 30% Mandatory Annual supply projection is 30-39% below baseline supplyStage 5 40% Mandatory Annual supply projection is 40-49% below baseline supplyStage 6 50% Mandatory Annual supply projection is below 50% baseline supply
Updated Water Shortage Event Contingency Plan (Current supply and current demand comparison)Stage 1 10% Voluntary Annual supply projection is between 0 and 10% below demand projection
Stage 2 10% MandatoryAnnual supply projection is greater than or equal to 10% and less than 20%below demand projection
Stage 3 20% MandatoryAnnual supply projection is greater than or equal to 20% and less than 30%below demand projection
Stage 4 30% MandatoryAnnual supply projection is greater than or equal to 30% and less than 40%below demand projection
Stage 5 40% MandatoryAnnual supply projection is greater than or equal to 40% and less than 50%below demand projection
Stage 6 50% MandatoryAnnual supply projection is greater than or equal to 50% below demandprojection
4.6.2.PROPOSED CHANGES TO WATER SHORTAGE RATE STRUCTURE
Raftelis recommends that Ventura Water update its existing structure of Water Shortage Rates to account forupdates to the 2015 Water Shortage Event Contingency Plan and also to simplify the existing water shortage ratestructure. Under the current schedule of Water Shortage Rates, Water Volume Rates increase with each subsequent
82 VENTURA WATER
water shortage stage beginning with Stage 2. In place of adjusting Water Volume Rates with each stage, Raftelisrecommends that Ventura Water maintain the same base condition Water Volume Rates (from Table 4-67) at eachstage, and communicate the shortage conditions as Water Shortage Surcharges, assessed separately duringShortage Stages 2-6. This change does not affect the revenue needs in shortage; it is recommended to more clearlycommunicate to customers the impact of water shortage conditions on each bill.
Additionally, Raftelis recommends harmonizing the tier allotments in shortage and non-shortage to simplify theschedule of shortage surcharges and to improve customer understanding. Currently, in shortage conditions, the firstResidential tier is split in to two tiers, which yields a four-tier rate structure in shortage and a three-tier structure innon-shortage. The proposed Water Shortage Surcharges maintain the same three-tier structure and the sameallotments in shortage and non-shortage conditions. These recommended changes to the structure are proposed totake effect in conjunction with the non-shortage / base rate proposal in FY 2021-22.
4.6.3.CALCULATION OF PROPOSED WATER SHORTAGE SURCHARGES
This subsection shows detailed calculations of proposed Water Shortage Surcharges through FY 2025-26. Allproposed surcharges are first calculated for FY 2020-21 (i.e. the “test year”) to maintain consistency with the waterCOS analysis. Note however that the first year that surcharges would be adopted (but not implemented) is FY2021-22. Therefore, all “proposed” FY 2020-21 surcharges shown represent cost of service results in the currentfiscal year. Surcharges must be calculated for the FY 2020-21 test year to provide a basis for proposed surchargesfor FY 2021-22 through FY 2025-26.
Water shortage rates are designed to recover net revenue shortfalls during periods of reduced water sales. The first step inthe development of Water Shortage Surcharges is to estimate reductions in water use at each water shortage stage. Table4-69 shows projected reductions in FY 2020-21 water use by customer class and tier. Reductions were estimated inconsultation with Ventura Water staff relying on a mix of prior study assumptions, actual reductions during recentshortage conditions, and professional judgment. All reductions shown are relative to “base” (non-shortage) water useprojections (from Table 4-47 for residential customers and Table 4-6 for all other customer classes).

2021 WATER AND WASTEWATER COST OF SERVICE AND RATE DESIGN STUDY 83
Table 4-69: Projected Water Use Reduction by Water Shortage Stage (FY 2020-21)Description Base Stage 2 Stage 3 Stage 4 Stage 5 Stage 6Water Use ReductionSingle Family Residential
Tier 1 N/A 8% 15% 23% 33% 45%Tier 2 N/A 15% 35% 55% 75% 85%Tier 3 N/A 30% 50% 75% 90% 95%
Multiple Family ResidentialTier 1 N/A 6% 11% 17% 24% 34%Tier 2 N/A 8% 18% 28% 38% 43%Tier 3 N/A 30% 50% 75% 90% 95%
Non-Residential N/A 7% 14% 21% 28% 35%Non-Residential Irrigation N/A 20% 35% 55% 75% 90%Untreated N/A 15% 35% 50% 65% 80%Total Water Use Reduction N/A 10% 20% 30% 40% 50%
Water Use (HCF)Single Family Residential
Tier 1 1,563,606 1,446,335 1,329,065 1,211,795 1,055,434 859,983Tier 2 510,010 433,509 331,507 229,505 127,503 76,502Tier 3 295,553 206,887 147,777 73,888 29,555 14,778
Multiple Family ResidentialTier 1 992,570 936,303 880,035 823,767 748,744 654,965
Tier 2 323,752 298,903 265,770 232,637 199,504 182,938Tier 3 187,616 131,331 93,808 46,904 18,762 9,381
Non-Residential 1,544,580 1,436,460 1,328,339 1,220,218 1,112,098 1,003,977
Non-Residential Irrigation 166,992 133,594 108,545 75,146 41,748 16,699
Untreated 26,666 22,666 17,333 13,333 9,333 5,333
Total Water Use (HCF) 5,611,346 5,045,987 4,502,177 3,927,193 3,342,680 2,824,554
Table 4-70 shows the detailed calculation of Water Shortage Surcharges as a percent of base Water Volume Rates.Stage 1 is omitted because Stage 1 calls for a voluntary 10 percent reduction in water demand. The net revenue lossto be recovered by Water Shortage Surcharges is based on three components:
1. Total rate revenue loss: As water sales decrease with each subsequent stage, revenues from Water VolumeRates also decline. Raftelis projected annualized Water Volume Rate revenues in FY 2020-21 under eachstage based on proposed FY 2020-21 Water Volume Rates (from Table 4-66) and projected water demandby customer class and stage (from Table 4-69).
2. Additional Water Shortage Costs: Ventura Water staff provided Raftelis with projected cost increases ateach stage to implement further conversation efforts.
3. Variable O&M Cost Savings: During periods of reduced water sales, the Water Enterprise will experiencemodest decreases in variable operating costs. Raftelis estimated variable weighted average costs of watersupply, electricity, and water treatment chemicals to project O&M costs savings at each stage.
The total net revenue loss equals the sum of the three aforementioned components and represents the additionalrevenue required from Water Shortage Surcharges at each stage. Dividing the net revenue loss by annualizedWater Volume Rate revenue under “base rates” results in the proposed FY 2020-21 Water Shortage Surcharges (asa percent of base rates).
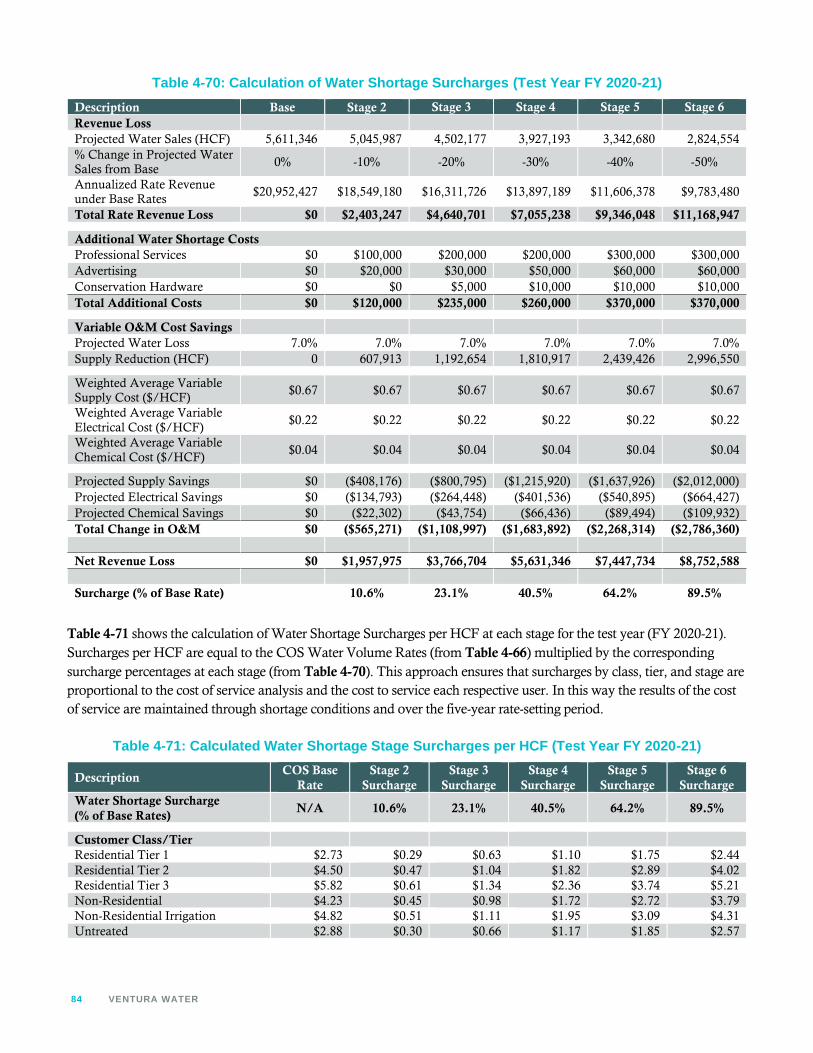
84 VENTURA WATER
Table 4-70: Calculation of Water Shortage Surcharges (Test Year FY 2020-21)Description Base Stage 2 Stage 3 Stage 4 Stage 5 Stage 6Revenue LossProjected Water Sales (HCF) 5,611,346 5,045,987 4,502,177 3,927,193 3,342,680 2,824,554% Change in Projected WaterSales from Base
0% -10% -20% -30% -40% -50%
Annualized Rate Revenueunder Base Rates
$20,952,427 $18,549,180 $16,311,726 $13,897,189 $11,606,378 $9,783,480
Total Rate Revenue Loss $0 $2,403,247 $4,640,701 $7,055,238 $9,346,048 $11,168,947
Additional Water Shortage CostsProfessional Services $0 $100,000 $200,000 $200,000 $300,000 $300,000Advertising $0 $20,000 $30,000 $50,000 $60,000 $60,000Conservation Hardware $0 $0 $5,000 $10,000 $10,000 $10,000Total Additional Costs $0 $120,000 $235,000 $260,000 $370,000 $370,000
Variable O&M Cost SavingsProjected Water Loss 7.0% 7.0% 7.0% 7.0% 7.0% 7.0%Supply Reduction (HCF) 0 607,913 1,192,654 1,810,917 2,439,426 2,996,550
Weighted Average VariableSupply Cost ($/HCF)
$0.67 $0.67 $0.67 $0.67 $0.67 $0.67
Weighted Average VariableElectrical Cost ($/HCF)
$0.22 $0.22 $0.22 $0.22 $0.22 $0.22
Weighted Average VariableChemical Cost ($/HCF)
$0.04 $0.04 $0.04 $0.04 $0.04 $0.04
Projected Supply Savings $0 ($408,176) ($800,795) ($1,215,920) ($1,637,926) ($2,012,000)Projected Electrical Savings $0 ($134,793) ($264,448) ($401,536) ($540,895) ($664,427)Projected Chemical Savings $0 ($22,302) ($43,754) ($66,436) ($89,494) ($109,932)Total Change in O&M $0 ($565,271) ($1,108,997) ($1,683,892) ($2,268,314) ($2,786,360)
Net Revenue Loss $0 $1,957,975 $3,766,704 $5,631,346 $7,447,734 $8,752,588
Surcharge (% of Base Rate) 10.6% 23.1% 40.5% 64.2% 89.5%
Table 4-71 shows the calculation of Water Shortage Surcharges per HCF at each stage for the test year (FY 2020-21).Surcharges per HCF are equal to the COS Water Volume Rates (from Table 4-66) multiplied by the correspondingsurcharge percentages at each stage (from Table 4-70). This approach ensures that surcharges by class, tier, and stage areproportional to the cost of service analysis and the cost to service each respective user. In this way the results of the costof service are maintained through shortage conditions and over the five-year rate-setting period.
Table 4-71: Calculated Water Shortage Stage Surcharges per HCF (Test Year FY 2020-21)
DescriptionCOS Base
RateStage 2
SurchargeStage 3
SurchargeStage 4
SurchargeStage 5
SurchargeStage 6
SurchargeWater Shortage Surcharge(% of Base Rates)
N/A 10.6% 23.1% 40.5% 64.2% 89.5%
Customer Class/TierResidential Tier 1 $2.73 $0.29 $0.63 $1.10 $1.75 $2.44Residential Tier 2 $4.50 $0.47 $1.04 $1.82 $2.89 $4.02Residential Tier 3 $5.82 $0.61 $1.34 $2.36 $3.74 $5.21Non-Residential $4.23 $0.45 $0.98 $1.72 $2.72 $3.79Non-Residential Irrigation $4.82 $0.51 $1.11 $1.95 $3.09 $4.31Untreated $2.88 $0.30 $0.66 $1.17 $1.85 $2.57

2021 WATER AND WASTEWATER COST OF SERVICE AND RATE DESIGN STUDY 85
Table 4-72 shows the proposed five-year schedule of Water Shortage Surcharges for FY 2021-22 to FY 2025-26.Proposed FY 2021-22 surcharges were calculated by increasing the COS surcharges for the test year (from Table4-71 by the proposed FY 2021-22 revenue adjustment of 7 percent (from Table 4-26). All proposed surcharges insubsequent years are then increased by 7 percent per year based on the schedule of proposed revenue adjustments(from Table 4-26). All proposed surcharges are rounded up to the nearest cent to ensure adequate revenuerecovery.
Table 4-72: Proposed Five-Year Schedule of Water Shortage SurchargesProposed Water Shortage Surcharges(per HCF)
ProposedJuly 2021
ProposedJuly 2022
ProposedJuly 2023
ProposedJuly 2024
ProposedJuly 2025
Revenue Adjustment 7.0% 7.0% 7.0% 7.0% 7.0%
Stage 1 (10% Voluntary Reduction)Residential Tier 1 $0.00 $0.00 $0.00 $0.00 $0.00Residential Tier 2 $0.00 $0.00 $0.00 $0.00 $0.00Residential Tier 3 $0.00 $0.00 $0.00 $0.00 $0.00Non-Residential $0.00 $0.00 $0.00 $0.00 $0.00Non-Residential Irrigation $0.00 $0.00 $0.00 $0.00 $0.00Untreated $0.00 $0.00 $0.00 $0.00 $0.00
Stage 2 (10% Mandatory Reduction)Residential Tier 1 $0.31 $0.33 $0.36 $0.38 $0.41Residential Tier 2 $0.51 $0.55 $0.59 $0.63 $0.67Residential Tier 3 $0.66 $0.71 $0.76 $0.81 $0.87Non-Residential $0.48 $0.52 $0.55 $0.59 $0.63Non-Residential Irrigation $0.55 $0.59 $0.63 $0.67 $0.72Untreated $0.33 $0.35 $0.38 $0.40 $0.43
Stage 3 (20% Mandatory Reduction)Residential Tier 1 $0.68 $0.73 $0.78 $0.83 $0.89Residential Tier 2 $1.12 $1.19 $1.28 $1.37 $1.46Residential Tier 3 $1.44 $1.54 $1.65 $1.77 $1.89Non-Residential $1.05 $1.12 $1.20 $1.29 $1.38Non-Residential Irrigation $1.20 $1.28 $1.37 $1.46 $1.57Untreated $0.72 $0.77 $0.82 $0.88 $0.94
Stage 4 (30% Mandatory Reduction)Residential Tier 1 $1.19 $1.27 $1.36 $1.45 $1.55Residential Tier 2 $1.96 $2.09 $2.24 $2.39 $2.56Residential Tier 3 $2.53 $2.71 $2.90 $3.10 $3.31Non-Residential $1.84 $1.97 $2.11 $2.25 $2.41Non-Residential Irrigation $2.09 $2.24 $2.40 $2.56 $2.74Untreated $1.25 $1.34 $1.43 $1.53 $1.64
Stage 5 (40% Mandatory Reduction)Residential Tier 1 $1.88 $2.01 $2.15 $2.30 $2.46Residential Tier 2 $3.09 $3.31 $3.54 $3.79 $4.05Residential Tier 3 $4.00 $4.28 $4.58 $4.90 $5.25Non-Residential $2.91 $3.12 $3.33 $3.57 $3.82Non-Residential Irrigation $3.31 $3.55 $3.79 $4.06 $4.34Untreated $1.98 $2.12 $2.27 $2.43 $2.59
Stage 6 (50% Mandatory Reduction)Residential Tier 1 $2.61 $2.80 $2.99 $3.20 $3.42Residential Tier 2 $4.31 $4.61 $4.94 $5.28 $5.65Residential Tier 3 $5.58 $5.97 $6.39 $6.83 $7.31Non-Residential $4.06 $4.34 $4.65 $4.97 $5.32Non-Residential Irrigation $4.62 $4.94 $5.29 $5.66 $6.05Untreated $2.76 $2.95 $3.16 $3.38 $3.62
86 VENTURA WATER
5.Wastewater Rate Study5.1.Key Inputs and AssumptionsRaftelis developed a wastewater rate model in Microsoft Excel to project financial calculations over the next tenfiscal years with projections shown in this section through the five-year rate-setting period of FY 2025-26 (i.e. the“study period”). Please refer to Appendix C for ten-year financial plan projections through FY 2029-30. The City’sfiscal year spans from July 1 through June 30. Projections in future years were generally made based on actual orestimated FY 2018-19 or FY 2019-20 data using key assumptions outlined below. Assumptions were discussedwith and reviewed by Ventura Water, Public Works, and Finance staff to ensure that the City wastewater system’sunique characteristics are accurately accounted for. Note that most table values shown throughout this report arerounded to the last digit shown and may therefore not sum precisely to the totals shown.
5.1.1.CURRENT WASTEWATER RATES
Table 5-1 shows the wastewater rates currently in effect in FY 2020-21, which were developed during the prior ratestudy in 2014. Rates and charges vary by customer class. Residential customers are subject to a bimonthly FixedCharge per dwelling unit plus a variable Flow Charge based on average winter water use (subject to a maximum or“cap”). Commercial customers and churches also pay a bimonthly Fixed Charge plus a variable Flow Chargebased on actual water use each billing period. Schools pay a bimonthly charge per average daily attendance(ADA). Industrial customers pay three different charges: per million gallons of wastewater flows, per 1,000 poundsof chemical oxygen demand (COD), and per 1,000 pounds of suspended solids (SS) based on actual measurementof each industrial customer’s wastewater discharge. All customers are currently subject to an Estuary ProtectionCharge equal to 10 percent of each wastewater bill. Wastewater rates have not changed since July 2017. All currentcharges are shown on a bimonthly basis. However, Ventura Water plans to transition from bimonthly to monthlybilling beginning in July 2021. All proposed rates and charges presented in subsequent sections of this report aretherefore shown in monthly terms.

2021 WATER AND WASTEWATER COST OF SERVICE AND RATE DESIGN STUDY 87
Table 5-1: Current Wastewater Rate ScheduleDescription FY 2020-21Single Family ResidentialBimonthly Fixed Charge $25.68Flow Charge (per HCF)61 $3.76
Multiple Family ResidentialBimonthly Fixed Charge (per dwelling unit) $19.01Flow Charge (per HCF)62 $3.76
CommercialBimonthly Fixed Charge $25.68Flow Charge (per HCF)
Group 1 $4.94Group 2 $5.63Group 3 $7.24Group 4 $8.94Group 5 $7.94Group 6 $1.73
ChurchesBimonthly Fixed Charge $25.68Flow Charge (per HCF) $3.70
SchoolsBimonthly Charge (per ADA) $201.28
IndustrialFlow (per million gallons) $5,814.85Chemical Oxygen Demand (per 1,000 lbs.) $224.18Suspended Solids (per 1,000 lbs.) $484.93
Estuary Protection ChargeAll Customer Classes (% of WW Bill) 10%
Commercial customers are currently subject to the same Fixed Charge. However, Flow Charges vary based oncommercial establishment type to account for differences in wastewater discharge flow and strength characteristics.Currently, the City classifies its non-residential users into six major groups. Churches, schools, and industrialcustomers are in their own separate groups. Group 1 consists of non-residential customers with low strengthwastewater, such as laundromats, car washes, professional offices, retail establishments, gym, theaters, etc. Group2 consists of customers with low-medium strength such as hotels and motels without dining facilities andcommercial laundries. Group 3 consists of customers with medium strength such as hotels with dining facilities.Group 4 consists of medium-high strength customers, including groceries with garbage grinders and mortuaries.Group 5 consists of high strength customers, such as restaurants, bakeries and multi-use shopping centers. Group 6consists of plant nurseries, which is considered low strength but typically uses a lot of water for Non-ResidentialIrrigation purposes. It is appropriate to consider nurseries, churches, and schools as separate customer classes sincetheir water usage and wastewater generation differs greatly from other non-residential customers. Raftelis finds that
61 Single family residential wastewater customers are currently charged based on average winter water usage subject to a cap of 30HCF per bimonthly billing period, or 15 HCF per month.62 Multiple family residential wastewater customers are currently charged based on average winter water usage subject to a cap of 24HCF per bimonthly billing period per dwelling unit, or 12 HCF per month.

88 VENTURA WATER
the existing non-residential customer classification is consistent with industry standards and publicly availablewastewater strength data; thus, Raftelis is not proposing any changes to the classifications. Table 5-2 defines the sixcommercial groups by establishment type.
Table 5-2: Current Wastewater Commercial Customer ClassificationCommercial Customer
ClassificationTypes of Establishments
Group 1Laundromats, Car Wash, Professional Offices, Convalescent Homes, Wholesale Establishments,Offices, Retail Establishments, Public Buildings, Barber & Beauty Shops, Gas Stations & Garages,Bars without Dining Facilities, Theaters, Gyms, Hospitals, Grocery Stores without Garbage Grinders
Group 2 Hotels & Motels w/o Dining Facilities, Commercial LaundriesGroup 3 Hotels with Dining FacilitiesGroup 4 Mortuaries, Grocery Stores with Garbage GrindersGroup 5 Bakeries, Restaurants, Multi-Use Shopping CentersGroup 6 Plant Nurseries
5.1.2.WASTEWATER ENTERPRISE FINANCIAL ASSUMPTIONS
Inflationary assumptions shown in Table 5-3 are used to escalate projected non-rate revenues and operations andmaintenance (O&M) expenses beyond FY 2020-21. For O&M expenses, the general inflation rate is consistent withlong-term changes in the Consumer Price Index (CPI). Salary and benefit inflationary increases were provided byVentura Water and Finance staff, as wastewater utility personnel cost increases are typically agency-specific. Allother O&M expense inflationary assumptions were developed by Raftelis based on professional judgement. Thecapital inflation factor is used to adjust uninflated capital project cost estimates provided to Raftelis by Ventura Waterstaff. All inflationary assumptions are consistent with inflationary assumptions used in the water rate study.
Table 5-3: Wastewater Enterprise Inflationary AssumptionsInflationary Categories FY 2021-22 FY 2022-23 FY 2023-24 FY 2024-25 FY 2025-26Non-Rate RevenuesMiscellaneous 0.00% 0.00% 0.00% 0.00% 0.00%
ExpensesGeneral 3.00% 3.00% 3.00% 3.00% 3.00%Salaries 5.38% 3.87% 3.53% 3.53% 1.08%Benefits 5.38% 3.87% 3.53% 3.53% 1.08%Utilities 5.00% 5.00% 5.00% 5.00% 5.00%Chemicals 5.00% 5.00% 5.00% 5.00% 5.00%Capital 4.00% 4.00% 4.00% 4.00% 4.00%
Additional financial assumptions relating to interest earnings are shown in Table 5-4. Interest earnings on cashreserves are projected assuming a one percent annual interest rate.
Table 5-4: Additional Wastewater Enterprise Financial AssumptionsDescription ValueInterest EarningsAnnual Interest Rate 1.0%

2021 WATER AND WASTEWATER COST OF SERVICE AND RATE DESIGN STUDY 89
5.1.3.PROJECTED WASTEWATER BILLING UNITS OF SERVICE
Wastewater connection growth projections are necessary to estimate wastewater rate revenues over the study period.Ventura Water staff provided Raftelis with the number of billing units by customer class for FY 2018-19. Raftelisthen applied a 0.54% annual account growth rate63 to all billing units to develop projections over the study period(see Table 5-5). No additional demand factor was applied to billed wastewater flows to ensure sufficientlyconservative rate revenue projections and to maintain consistency with water demand projections. All billing unitsshown below are based on the current wastewater rate structure.
Table 5-5: Projected Wastewater Billing Units Under Existing Rate Structure
DescriptionProjected
FY 2020-21Projected
FY 2021-22Projected
FY 2022-23Projected
FY 2023-24Projected
FY 2024-25Projected
FY 2025-26Projected Annual Growth 0.54% 0.54% 0.54% 0.54% 0.54% 0.54%
Fixed Charge Billing UnitsSingle Family Residential (# ofconnections)
21,680 21,797 21,915 22,033 22,152 22,272
Multiple Family Residential (# ofdwelling units)
20,686 20,797 20,910 21,023 21,136 21,250
Commercial (# of connections) 1,814 1,824 1,834 1,844 1,854 1,864Churches (# of connections) 59 59 60 60 60 61Schools (# of ADAs) 282 284 285 287 288 290
Billed Wastewater Flows (HCF)Single Family Residential 1,778,075 1,753,808 1,775,477 1,774,171 1,784,408 1,788,898Multiple Family Residential 1,260,388 1,267,194 1,274,037 1,280,916 1,287,833 1,294,788Commercial Group 1 645,694 649,181 652,687 656,211 659,755 663,317Commercial Group 2 58,536 58,852 59,170 59,490 59,811 60,134Commercial Group 3 42,020 42,247 42,475 42,705 42,935 43,167Commercial Group 4 18,241 18,340 18,439 18,539 18,639 18,739Commercial Group 5 196,453 197,513 198,580 199,652 200,730 201,814Commercial Group 6 0 0 0 0 0 0Churches 14,554 14,633 14,712 14,791 14,871 14,951
Industrial Billing UnitsFlow (million gallons) 31.90 32.08 32.25 32.42 32.60 32.78Chemical Oxygen Demand(1,000 lbs.)
171.81 172.74 173.67 174.61 175.55 176.50
Suspended Solids (1,000 lbs.) 82.98 83.43 83.88 84.33 84.78 85.24
Reclaimed Water Use (HCF)All Reclaimed Customers 258,036 259,430 260,831 262,239 263,655 265,079
5.2.Wastewater Financial PlanSection 5.2 details the development of a proposed Wastewater Enterprise financial plan for Ventura Water overthe study period. The following subsections include estimates and projections of annual revenues, O&M expenses,debt service payments, capital expenditures, and reserve funding through FY 2025-26. The overall purpose of the
63 Consistent with water connection growth assumptions from water rate study. Assumptions are from Ventura Water’s 2020Comprehensive Water Resources Report. The growth rate is provided to Ventura Water staff by Planning staff and is based on theDepartment of Finance historical data for population.

90 VENTURA WATER
financial plan is to determine annual wastewater rate revenues required to achieve sufficient cash flow, maintainadequate reserves, and meet debt coverage requirements.
5.2.1.WASTEWATER ENTERPRISE REVENUE UNDER CURRENT RATES
The Wastewater Enterprise’s revenue sources consist of wastewater rates, connection fees, interest earnings on cashreserves, and other non-rate revenues. The rate revenue projections shown in this section assume that current FY2020-21 wastewater rates are effective throughout the study period, and therefore represent estimated revenues inthe absence of any wastewater rate increases. This status quo scenario provides a baseline from which Raftelisevaluated the need for revenue adjustments (i.e. gross rate revenue increases).
Calculated Wastewater Rate Revenues
Raftelis projected annual wastewater rate revenues over the study period based on current FY 2020-21 water rates(from Table 5-2) and projected number of billing units (from Table 5-5). Table 4-8 shows projected wastewaterrate revenues under current rates over the study period, calculated as follows:
Fixed Charge Revenue = [ FY 2020-21 bimonthly charge] × [Number of connections or dwelling units] × [6 Bills per year]
Variable Rate Revenue = [ FY 2020-21 unit rate] × [Number of billing units]

2021 WATER AND WASTEWATER COST OF SERVICE AND RATE DESIGN STUDY 91
Table 5-6: Projected Rate Revenues under Current Wastewater Rates
DescriptionProjected
FY 2020-21Projected
FY 2021-22Projected
FY 2022-23Projected
FY 2023-24Projected
FY 2024-25Projected
FY 2025-26Fixed ChargesSingle Family Residential $3,340,495 $3,358,534 $3,376,670 $3,394,904 $3,413,236 $3,431,668Multiple FamilyResidential
$2,359,400 $2,372,141 $2,384,951 $2,397,829 $2,410,778 $2,423,796
Commercial $279,517 $281,026 $282,544 $284,069 $285,603 $287,146Churches $9,111 $9,160 $9,210 $9,260 $9,310 $9,360Schools $340,592 $342,431 $344,280 $346,139 $348,008 $349,887Subtotal $6,329,115 $6,363,292 $6,397,654 $6,432,201 $6,466,935 $6,501,857
Flow ChargesSingle Family Residential $6,685,561 $6,594,317 $6,675,794 $6,670,885 $6,709,375 $6,726,257Multiple FamilyResidential
$4,739,058 $4,764,649 $4,790,378 $4,816,246 $4,842,254 $4,868,402
Commercial Group 1 $3,189,730 $3,206,955 $3,224,273 $3,241,684 $3,259,189 $3,276,788Commercial Group 2 $329,558 $331,338 $333,127 $334,926 $336,735 $338,553Commercial Group 3 $304,226 $305,869 $307,521 $309,181 $310,851 $312,529Commercial Group 4 $163,078 $163,959 $164,844 $165,734 $166,629 $167,529Commercial Group 5 $1,559,834 $1,568,257 $1,576,726 $1,585,240 $1,593,800 $1,602,407Commercial Group 6 $0 $0 $0 $0 $0 $0Churches $53,849 $54,140 $54,433 $54,727 $55,022 $55,319Subtotal $17,024,895 $16,989,483 $17,127,095 $17,178,622 $17,273,855 $17,347,784
Industrial ChargesFlow $185,521 $186,522 $187,530 $188,542 $189,560 $190,584Chemical OxygenDemand
$38,516 $38,724 $38,933 $39,143 $39,355 $39,567
Suspended Solids $40,239 $40,456 $40,674 $40,894 $41,115 $41,337Subtotal $264,275 $265,702 $267,137 $268,579 $270,030 $271,488
Reclaimed Water SalesAll ReclaimedCustomers
$245,135 $246,458 $247,789 $249,127 $250,472 $251,825
Estuary ProtectionChargesAll Customers $2,386,342 $2,386,494 $2,403,967 $2,412,853 $2,426,129 $2,437,295
Total $26,249,761 $26,251,429 $26,443,642 $26,541,383 $26,687,422 $26,810,249
Other Wastewater Enterprise Revenues
Table 5-7 shows all other Wastewater Enterprise revenues. All FY 2020-21 other revenues are based on the City’sFY 2020-21 budget and escalated annually by the miscellaneous inflation rate (from Table 5-3), except where notedotherwise. Interest revenue is estimated in the financial plan model beginning in FY 2020-21 based on projected fundbalances and the assumed interest rate (from Table 5-4).

92 VENTURA WATER
Table 5-7: Other Wastewater Enterprise Revenues
DescriptionProjected
FY 2020-21Projected
FY 2021-22Projected
FY 2022-23Projected
FY 2023-24Projected
FY 2024-25Projected
FY 2025-26Wastewater Operating Fund (51) – Other RevenuesInterest Earnings $179,931 $193,366 $228,899 $273,806 $326,499 $372,591
Other Miscellaneous Revenue $531,700 $531,700 $531,700 $531,700 $531,700 $531,700
Subtotal $711,631 $725,066 $760,599 $805,506 $858,199 $904,291
Wastewater Capital Fund (71) – Other RevenuesWastewater Connection Fees64 $908,417 $908,417 $908,417 $908,417 $908,417 $908,417
Interest Earnings $255,019 $76,290 $0 $0 $0 $0Subtotal $1,163,436 $984,707 $908,417 $908,417 $908,417 $908,417
Estuary Protection Fund (75) – Other RevenuesInterest Earnings $135,712 $149,001 $150,491 $151,996 $153,516 $155,051Subtotal $135,712 $149,001 $150,491 $151,996 $153,516 $155,051
Total $2,010,780 $1,858,775 $1,819,507 $1,865,919 $1,920,132 $1,967,760
Summary of Projected Wastewater Enterprise Revenues
Table 5-8 shows a summary of all projected Wastewater Enterprise revenues under current rates over the studyperiod. This includes all projected revenues shown in Table 5-6 and Table 5-7. This revenue summary representsexpected revenues in the absence of any rate increase over the study period.
Table 5-8: Summary of Projected Wastewater Enterprise Revenues Under Current Rates
DescriptionProjected
FY 2020-21Projected
FY 2021-22Projected
FY 2022-23Projected
FY 2023-24Projected
FY 2024-25Projected
FY 2025-26Wastewater Operating Fund (51)Wastewater Rates $23,863,419 $23,864,936 $24,039,675 $24,128,530 $24,261,292 $24,372,954
Interest Earnings $179,931 $193,366 $228,899 $273,806 $326,499 $372,591
Other Miscellaneous Revenue $531,700 $531,700 $531,700 $531,700 $531,700 $531,700
Subtotal $24,575,050 $24,590,002 $24,800,274 $24,934,036 $25,119,491 $25,277,245
Wastewater Capital Fund (71)Wastewater Connection Fees $908,417 $908,417 $908,417 $908,417 $908,417 $908,417
Interest Earnings $255,019 $76,290 $0 $0 $0 $0Subtotal $1,163,436 $984,707 $908,417 $908,417 $908,417 $908,417
Estuary Protection Fund (75)Estuary Protection Charges $2,386,342 $2,386,494 $2,403,967 $2,412,853 $2,426,129 $2,437,295
Interest Earnings $135,712 $149,001 $150,491 $151,996 $153,516 $155,051Subtotal $2,522,054 $2,535,495 $2,554,459 $2,564,849 $2,579,645 $2,592,347
Total $28,260,541 $28,110,204 $28,263,150 $28,407,303 $28,607,554 $28,778,009
64 Wastewater connection fees equal the annual average of actuals over the last four fiscal years through FY 2019-20.

2021 WATER AND WASTEWATER COST OF SERVICE AND RATE DESIGN STUDY 93
5.2.2.WASTEWATER ENTERPRISE OPERATIONS & MAINTENANCE EXPENSES
Table 5-9 shows a summary of all Wastewater Enterprise O&M expenses over the study period. O&Mexpenditures include the cost of operating and maintaining wastewater collection, treatment, and disposal facilities.O&M expenses also include the costs of providing technical services such as laboratory services and otheradministrative costs of the wastewater system. These costs are a normal obligation of the system, and are met fromoperating revenues as they are incurred. It is projected that O&M expenses will increase by approximately 4.75percent per year on average over the study period. All five-year O&M expenses were provided by Ventura Waterand Finance staff in current dollars and then adjusted for inflation by Raftelis (based on inflationary assumptionsshown in Table 5-3). Additional Wastewater Enterprise O&M expenses associated with VenturaWaterPure areshown in detail in Appendix A. Note the approximate $2.5M increase in additional O&M in FY 20225-26 whenVenturaWaterPure is anticipated to begin operations.
Table 5-9: Projected Wastewater Enterprise O&M Expenses
O&M ExpensesProjected
FY 2020-21Projected
FY 2021-22Projected
FY 2022-23Projected
FY 2023-24Projected
FY 2024-25Projected
FY 2025-26Rev Mgmt - Wastewater (22051) $500,000 $515,000 $530,450 $546,364 $562,754 $579,637Wastewater Operations (64101) $8,875,521 $6,784,811 $7,017,603 $7,096,130 $7,257,484 $7,281,539Wastewater Maintenance(64111)
$5,569,530 $6,393,103 $6,347,698 $6,849,984 $7,320,589 $7,809,385
Wastewater Environmentalcompliance (64115)
$773,403 $994,639 $958,476 $1,098,807 $909,041 $927,399
Wastewater Treatment (64121) $5,552,243 $5,917,508 $6,281,542 $6,420,955 $6,688,063 $6,902,691Wastewater Estuary Phase III(64125)
$300,000 $618,000 $636,540 $655,636 $675,305 $695,564
Wastewater Laboratory (64131) $1,708,446 $1,873,426 $1,939,960 $2,163,154 $2,084,734 $2,297,487
VenturaWaterPure O&M $36,002 $195,402 $202,627 $209,571 $216,749 $2,767,943
Total O&M Expenses $23,315,145 $23,291,889 $23,914,896 $25,040,600 $25,714,720 $29,261,646% Change -0.10% 2.67% 4.71% 2.69% 13.79%
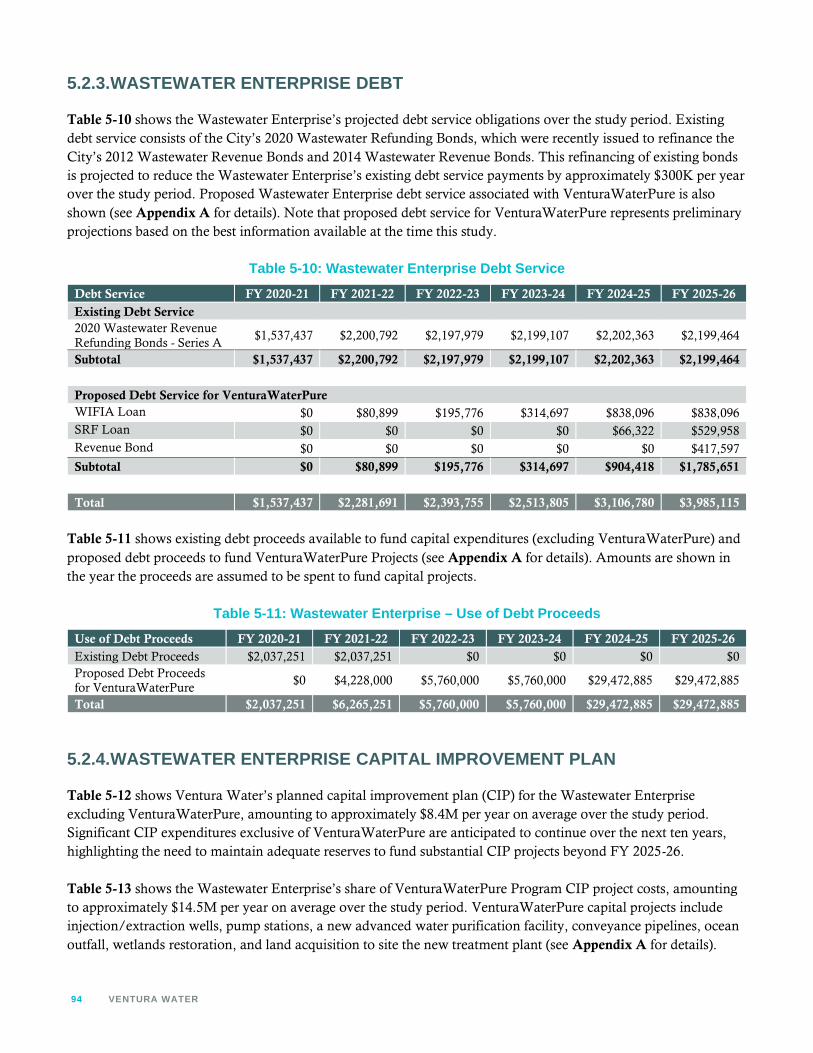
94 VENTURA WATER
5.2.3.WASTEWATER ENTERPRISE DEBT
Table 5-10 shows the Wastewater Enterprise’s projected debt service obligations over the study period. Existingdebt service consists of the City’s 2020 Wastewater Refunding Bonds, which were recently issued to refinance theCity’s 2012 Wastewater Revenue Bonds and 2014 Wastewater Revenue Bonds. This refinancing of existing bondsis projected to reduce the Wastewater Enterprise’s existing debt service payments by approximately $300K per yearover the study period. Proposed Wastewater Enterprise debt service associated with VenturaWaterPure is alsoshown (see Appendix A for details). Note that proposed debt service for VenturaWaterPure represents preliminaryprojections based on the best information available at the time this study.
Table 5-10: Wastewater Enterprise Debt ServiceDebt Service FY 2020-21 FY 2021-22 FY 2022-23 FY 2023-24 FY 2024-25 FY 2025-26Existing Debt Service2020 Wastewater RevenueRefunding Bonds - Series A
$1,537,437 $2,200,792 $2,197,979 $2,199,107 $2,202,363 $2,199,464
Subtotal $1,537,437 $2,200,792 $2,197,979 $2,199,107 $2,202,363 $2,199,464
Proposed Debt Service for VenturaWaterPureWIFIA Loan $0 $80,899 $195,776 $314,697 $838,096 $838,096SRF Loan $0 $0 $0 $0 $66,322 $529,958Revenue Bond $0 $0 $0 $0 $0 $417,597
Subtotal $0 $80,899 $195,776 $314,697 $904,418 $1,785,651
Total $1,537,437 $2,281,691 $2,393,755 $2,513,805 $3,106,780 $3,985,115
Table 5-11 shows existing debt proceeds available to fund capital expenditures (excluding VenturaWaterPure) andproposed debt proceeds to fund VenturaWaterPure Projects (see Appendix A for details). Amounts are shown inthe year the proceeds are assumed to be spent to fund capital projects.
Table 5-11: Wastewater Enterprise – Use of Debt ProceedsUse of Debt Proceeds FY 2020-21 FY 2021-22 FY 2022-23 FY 2023-24 FY 2024-25 FY 2025-26Existing Debt Proceeds $2,037,251 $2,037,251 $0 $0 $0 $0Proposed Debt Proceedsfor VenturaWaterPure
$0 $4,228,000 $5,760,000 $5,760,000 $29,472,885 $29,472,885
Total $2,037,251 $6,265,251 $5,760,000 $5,760,000 $29,472,885 $29,472,885
5.2.4.WASTEWATER ENTERPRISE CAPITAL IMPROVEMENT PLAN
Table 5-12 shows Ventura Water’s planned capital improvement plan (CIP) for the Wastewater Enterpriseexcluding VenturaWaterPure, amounting to approximately $8.4M per year on average over the study period.Significant CIP expenditures exclusive of VenturaWaterPure are anticipated to continue over the next ten years,highlighting the need to maintain adequate reserves to fund substantial CIP projects beyond FY 2025-26.
Table 5-13 shows the Wastewater Enterprise’s share of VenturaWaterPure Program CIP project costs, amountingto approximately $14.5M per year on average over the study period. VenturaWaterPure capital projects includeinjection/extraction wells, pump stations, a new advanced water purification facility, conveyance pipelines, oceanoutfall, wetlands restoration, and land acquisition to site the new treatment plant (see Appendix A for details).

2021 WATER AND WASTEWATER COST OF SERVICE AND RATE DESIGN STUDY 95
Table 5-12: Wastewater Enterprise Capital Improvement Plan Excluding VenturaWaterPureCIP # Project Description FY 2020-21 FY 2021-22 FY 2022-23 FY 2023-24 FY 2024-25 FY 2025-26
96947 Harbor Force Main - San Pedro to Figueroa $450,000 $0 $0 $0 $0 $096928 Wastewater Plant - Aeration Blowers $4,700,000 $4,524,000 $0 $0 $0 $096922 Transfer Station - Seaside Land Acquisition $100,000 $1,560,000 $0 $0 $0 $096918 Wastewater Plant - Digester Improvement $5,499,745 $0 $0 $0 $0 $0
96952Sewerlines Repair/Replacement - South VictoriaAvenue Area
$0 $520,000 $540,800 $2,924,646 $3,041,632 $0
96874 Wastewater Plant - Tertiary Filter Replacement $1,200,000 $1,248,000 $12,979,200 $13,498,368 $0 $074103 Upgrade of Co-Generation System $0 $520,000 $2,163,200 $2,812,160 $0 $0
74090Wastewater Plant - Secondary ClarifierImprovements
$0 $0 $108,160 $2,137,242 $2,222,731 $0
74098Wastewater Plant - Increase of Anoxic TankCapacity
$0 $0 $0 $0 $0 $608,326
Total $11,949,745 $8,372,000 $15,791,360 $21,372,416 $5,264,364 $608,326
Table 5-13: Wastewater Enterprise Capital Improvement Plan - VenturaWaterPureCIP # Project Description FY 2020-21 FY 2021-22 FY 2022-23 FY 2023-24 FY 2024-25 FY 2025-2697934 Injection/Extraction Wells $0 $0 $0 $0 $0 $073122 Pump Stations $37,500 $250,000 $350,000 $350,000 $1,700,000 $1,700,00096945 Advanced Water Purification Facility $725,000 $2,500,000 $3,500,000 $3,500,000 $21,000,000 $21,000,00096940 Pipelines $313,500 $528,000 $660,000 $660,000 $3,960,000 $3,960,00096939 Wetlands Improvements $0 $0 $0 $0 $0 $096938 Outfall $375,000 $950,000 $1,250,000 $1,250,000 $7,000,000 $7,000,00096935 Land $100,000 $2,367,500 $0 $0 $0 $0
Total $1,551,000 $6,595,500 $5,760,000 $5,760,000 $33,660,000 $33,660,000

96 VENTURA WATER
Table 5-14 shows the assumed funding sources for Wastewater Enterprise CIP projects over the study period.Estimated grant funding for the Wastewater Enterprise’s share of VenturaWaterPure CIP is included in FY 2024-25 and FY 2025-26 (see Appendix A for details). Existing debt proceeds (from Table 5-11) are assumed to fundCIP projects exclusive of VenturaWaterPure in FY 2020-21 and FY 2021-22. Proposed debt proceeds (from Table5-11) are assumed to fund most of the Wastewater Enterprise’s VenturaWaterPure Program CIP projects over thenext five years. All remaining CIP not funded by grants or debt is assumed to be funded by Wastewater Enterprisecash reserves generated from rates (i.e. pay-as-you-go). Figure 5-1 shows a summary of total WastewaterEnterprise CIP expenditures (including VenturaWaterPure) by funding source over the study period.
Table 5-14: Wastewater Enterprise Capital Improvement Plan Proposed Funding
Description FY 2020-21 FY 2021-22 FY 2022-23 FY 2023-24 FY 2024-25 FY 2025-26Capital Improvement Plan Excluding VenturaWaterPureGrant Funded $0 $0 $0 $0 $0 $0Debt Funded $2,037,251 $2,037,251 $0 $0 $0 $0Pay-as-you-go $9,912,494 $4,241,749 $11,843,520 $16,029,312 $3,948,273 $456,245Subtotal $11,949,745 $6,279,000 $11,843,520 $16,029,312 $3,948,273 $456,245
Capital Improvement Plan - VenturaWaterPureGrant Funded $0 $0 $0 $0 $4,187,115 $4,187,115Debt Funded $0 $4,228,000 $5,760,000 $5,760,000 $29,472,885 $29,472,885Pay-as-you-go $1,551,000 $2,367,500 $0 $0 $0 $0Subtotal $1,551,000 $6,595,500 $5,760,000 $5,760,000 $33,660,000 $33,660,000
Total $13,500,745 $12,874,500 $17,603,520 $21,789,312 $37,608,273 $34,116,245
Figure 5-1: Wastewater Enterprise Capital Improvement Plan

2021 WATER AND WASTEWATER COST OF SERVICE AND RATE DESIGN STUDY 97
5.2.5.WASTEWATER ENTERPRISE FINANCIAL POLICIES
Required Debt Coverage
The Wastewater Enterprise is required to meet debt service coverage requirements on its outstanding wastewaterrevenue bonds. The required debt coverage ratio is 1.20, meaning that the Wastewater Enterprise’s net operatingrevenues (i.e. total revenues less operating expenses) must amount to at least 1.20 times the amount of annual debtservice. Failure to meet debt service coverage results in a technical default, which without foreseeable remedialaction such as implementing rate increases, could result in a downgrade of credit rating, higher costs in future debtissuance, or even denial of credit.
Reserve Targets
Adequate cash reserves are required to meet operating, capital, and debt service requirements. No changes areproposed to Ventura Water’s existing wastewater reserve policies. Operating reserves provide funds to meetongoing cash flow requirements related to operating expenses. The current operating reserve target is equal to 25percent of annual O&M expenses, or three months of working capital. Capital reserves are maintained to provideavailable funds for CIP projects. Ventura Water’s current capital reserve target is equal to the ten-year annualaverage of CIP project costs (R&R projects only). Table 5-15 summarizes the Wastewater Enterprise’s keyfinancial policies relevant to this rate study. Table 5-16 shows projected operating and capital reserve targets overthe study period based on the policies outlined above.
Table 5-15: Wastewater Enterprise Financial Policies
Financial Policy Target/RequirementDebt CoverageTarget Debt Coverage Ratio 1.20
Reserve TargetsOperating Reserve Target 25% of annual O&M expensesCapital Reserve Target Annual average capital expenditures (R&R only)
Table 5-16: Projected Wastewater Enterprise Reserve Targets
Reserve Target FY 2020-21 FY 2021-22 FY 2022-23 FY 2023-24 FY 2024-25 FY 2025-26Operating Reserve65 $5,828,786 $5,822,972 $5,978,724 $6,260,150 $6,428,680 $7,315,411Capital Reserve66 $8,868,579 $8,868,579 $8,868,579 $8,868,579 $8,868,579 $8,868,579Total $14,697,365 $14,691,551 $14,847,303 $15,128,729 $15,297,259 $16,183,990
5.2.6.STATUS QUO WASTEWATER FINANCIAL PLAN
To evaluate the need for revenue adjustments (i.e. increases to gross rate revenues), Raftelis first developed a statusquo financial plan. The status quo financial plan assumes that current FY 2020-21 rates remain unchanged over thestudy period. Table 5-17 combines projected Fund 51 revenues (from Table 5-8), O&M expenses (from Table 5-9),and debt service (from Table 5-10) to generate operating cash flow projections under the status quo. In the absence
65 Equal to 25% of annual projected O&M expenses (from Table 5-9).66 Equal to annual average projected Wastewater Enterprise CIP expenditures through FY 2029-30 (excluding VenturaWaterPure CIPprojects).

98 VENTURA WATER
of any revenue adjustments, the Wastewater Operating Fund (Fund 51) will fail to generate sufficient revenue torecover O&M expenses and debt service over the study period.
Table 5-17: Wastewater Operating Cash Flow (Fund 51) – Status Quo Financial PlanLine Description FY 2020-21 FY 2021-22 FY 2022-23 FY 2023-24 FY 2024-25 FY 2025-26
1 Revenue
2WW Rates (excl. EstuaryProtection Charges)
$23,863,419 $23,864,936 $24,039,675 $24,128,530 $24,261,292 $24,372,954
3
4 Revenue Adjustments
5 Fiscal YearRevenue
Adjustment6 FY 2020-21 0.00% $0 $0 $0 $0 $0 $0
7 FY 2021-22 0.00% $0 $0 $0 $0 $0
8 FY 2022-23 0.00% $0 $0 $0 $0
9 FY 2023-24 0.00% $0 $0 $0
10 FY 2024-25 0.00% $0 $0
11 FY 2025-26 0.00% $0
12 Total Adjustments $0 $0 $0 $0 $0 $0
13
14 Revenue Summary
15WW Rates (incl. RevenueAdjustments)
$23,863,419 $23,864,936 $24,039,675 $24,128,530 $24,261,292 $24,372,954
16 Other Fund 51 Revenue67 $711,631 $705,258 $692,423 $670,873 $637,651 $576,858
17 Total Revenue $24,575,050 $24,570,194 $24,732,098 $24,799,403 $24,898,943 $24,949,812
18
19 O&M Expenses $23,315,145 $23,291,889 $23,914,896 $25,040,600 $25,714,720 $29,261,646
20
21 Debt Service $1,537,437 $2,281,691 $2,393,755 $2,513,805 $3,106,780 $3,985,115
22
23Net Operating CashFlow68 ($277,531) ($1,003,386) ($1,576,553) ($2,755,001) ($3,922,557) ($8,296,949)
Table 5-18 shows projected reserve balances and debt coverage under the status quo financial plan for the entireWastewater Enterprise, including the Wastewater Operating Fund (Fund 51), Wastewater Capital Fund (Fund 72),and Estuary Protection Fund (Fund 75). Sources of funds include revenues (from Table 5-8) as well as grants anddebt proceeds (from Table 5-14). Use of funds include O&M expenses (from Table 5-9), debt service (from Table5-10), and CIP expenditures (from Table 5-14). The FY 2020-21 beginning balance reflects actual WastewaterEnterprise reserve balances as of July 1, 2020. All ending balance and debt coverage figures are projected values.Target reserve balances shown are from Table 5-16.
Under the status-quo financial plan, reserves are projected to fall below target by the end of FY 2023-24. Debtcoverage is projected to fall below the required ratio beginning in FY 2024-25, in part due to significant increases indebt service for VenturaWaterPure. The status quo financial plan is insufficient to meet the Wastewater Enterprise’s
67 Status quo “other revenue” is less than what is shown in Table 5-8 (which reflects the proposed financial plan) to account forreduced interest earnings due to depletion of interest-bearing reserves. Interest earnings under the status quo and proposed financialplan scenarios are calculated by averaging the beginning and ending reserve balance in each year and then multiplying by the assumedinterest rate.68 Equal to [Line 17 – Line 19 – Line 21]

2021 WATER AND WASTEWATER COST OF SERVICE AND RATE DESIGN STUDY 99
financial needs over the study period. This demonstrates a clear need for revenue adjustments over the study periodto increase rate revenues and ensure financial sustainability.
Table 5-18: Status Quo Wastewater Financial Plan Pro Forma (Funds 51, 71, & 75)Line Description FY 2020-21 FY 2021-22 FY 2022-23 FY 2023-24 FY 2024-25 FY 2025-26
1 Beginning Balance $51,379,367 $43,323,832 $39,243,331 $29,322,138 $14,071,540 $9,774,021
2
3 Source of Funds
4WW Rates (includingRevenue Adjustments)
$23,863,419 $23,864,936 $24,039,675 $24,128,530 $24,261,292 $24,372,954
5 Estuary Protection Charges $2,386,342 $2,386,494 $2,403,967 $2,412,853 $2,426,129 $2,437,295
6 Other Fund 51 Revenue69 $711,631 $717,191 $728,427 $731,321 $722,899 $687,275
7 Other Fund 71 Revenue $1,163,436 $984,707 $908,417 $908,417 $908,417 $908,417
8 Other Fund 75 Revenue $135,712 $149,001 $150,491 $151,996 $153,516 $155,051
9 Grants $0 $0 $0 $0 $4,187,115 $4,187,115
10 Use of Debt Proceeds $2,037,251 $6,265,251 $5,760,000 $5,760,000 $29,472,885 $29,472,885
11 Total Source of Funds $30,297,792 $34,367,579 $33,990,978 $34,093,118 $62,132,254 $62,220,993
12
13 Use of Funds
14 O&M Expenses $23,315,145 $23,291,889 $23,914,896 $25,040,600 $25,714,720 $29,261,646
15 Debt Service $1,537,437 $2,281,691 $2,393,755 $2,513,805 $3,106,780 $3,985,115
16Capital Improvement PlanExpenditures
$13,500,745 $12,874,500 $17,603,520 $21,789,312 $37,608,273 $34,116,245
17 Total Use of Funds $38,353,327 $38,448,080 $43,912,171 $49,343,716 $66,429,773 $67,363,005
18
19 Ending Balance70 $43,323,832 $39,243,331 $29,322,138 $14,071,540 $9,774,021 $4,632,008
20 Target Balance $14,697,365 $14,691,551 $14,847,303 $15,128,729 $15,297,259 $16,183,990
21
22 Debt Coverage
23 Net Revenue71 $4,945,397 $4,810,440 $4,316,082 $3,292,518 $2,757,534 ($700,653)
24 Debt Service $1,537,437 $2,281,691 $2,393,755 $2,513,805 $3,106,780 $3,985,115
25 Projected Debt Coverage72 3.22 2.11 1.80 1.31 0.89 -0.18
26 Required Debt Coverage 1.20 1.20 1.20 1.20 1.20 1.20
5.2.7.PROPOSED WASTEWATER FINANCIAL PLAN
The Wastewater Enterprise must increase its revenues from wastewater rates over the study period to adequatelyfund its operating and capital expenditures, meet required debt coverage, and maintain sufficient reserve funding.Raftelis worked closely with Ventura Water and Finance staff to identify financial plan options for the WaterCommission’s consideration. The selected option of proposed annual revenue adjustments are shown in Table 5-19.Revenue adjustments represent annual percent increases in total rate revenue relative to rate revenue generated bythe prior year’s wastewater rates.
69 Status quo “other revenue” is less than what is shown in Table 5-8 (which reflects the proposed financial plan) to account forreduced interest earnings due to depletion of interest-bearing reserves. Interest earnings under the status quo and proposed financialplan scenarios are calculated by averaging the beginning and ending reserve balance in each year and then multiplying by the assumedinterest rate.70 Equal to [Line 1 + Line 11 – Line 17]71 Equal to [( Sum of Lines 4-8) – Line 14]72 Equal to [Line 23 ÷ Line 24]

100 VENTURA WATER
Table 5-19: Proposed Wastewater Revenue AdjustmentsDescription FY 2021-22 FY 2022-23 FY 2023-24 FY 2024-25 FY 2025-26Effective Date July 1, 2021 July 1, 2022 July 1, 2023 July 1, 2024 July 1, 2025
Revenue Adjustment 6.0% 6.0% 6.0% 6.0% 6.0%
Table 5-20 combines projected Fund 51 revenues (from Table 5-8), O&M expenses (from Table 5-9), and debtservice (from Table 5-10) to generate operating cash flow projections under the proposed financial plan. Byimplementing the proposed revenue adjustments, we project that the Wastewater Operating Fund (Fund 51) willmaintain sufficient operating cash flow through the end of the study period.
Table 5-20: Wastewater Operating Cash Flow (Fund 51) – Proposed Financial PlanLine Description FY 2020-21 FY 2021-22 FY 2022-23 FY 2023-24 FY 2024-25 FY 2025-26
1 Revenue
2 WW Rates73 $23,863,419 $26,251,429 $26,443,642 $26,541,383 $26,687,422 $26,810,24934 Revenue Adjustments
5 Fiscal YearRevenue
Adjustment6 FY 2020-21 0.00% $0 $0 $0 $0 $0 $0
7 FY 2021-22 0.00% $1,575,086 $1,586,619 $1,592,483 $1,601,245 $1,608,615
8 FY 2022-23 0.00% $1,681,816 $1,688,032 $1,697,320 $1,705,132
9 FY 2023-24 0.00% $1,789,314 $1,799,159 $1,807,440
10 FY 2024-25 0.00% $1,907,109 $1,915,886
11 FY 2025-26 0.00% $2,030,839
12 Total Adjustments $0 $1,575,086 $3,268,434 $5,069,829 $7,004,833 $9,067,9121314 Revenue Summary
15WW Rates (incl. RevenueAdjustments)
$23,863,419 $27,826,515 $29,712,077 $31,611,212 $33,692,255 $35,878,161
16 Other Fund 51 Revenue $711,631 $725,066 $760,599 $805,506 $858,199 $904,291
17 Total Revenue $24,575,050 $28,551,581 $30,472,675 $32,416,718 $34,550,454 $36,782,453
18
19 O&M Expenses $23,315,145 $23,291,889 $23,914,896 $25,040,600 $25,714,720 $29,261,646
20
21 Debt Service $1,537,437 $2,281,691 $2,393,755 $2,513,805 $3,106,780 $3,985,11522
23Net Operating CashFlow74 ($277,531) $2,978,002 $4,164,025 $4,862,314 $5,728,953 $3,535,693
Table 5-21 shows projected reserve balances and debt coverage under the proposed financial plan for the entireWastewater Enterprise, including the Wastewater Operating Fund (Fund 51), Wastewater Capital Fund (Fund 72),and Estuary Protection Fund (Fund 75). Sources of funds include revenues (from Table 5-8), revenue adjustments(from Table 5-20), and grants and debt proceeds (from Table 5-14). Use of funds include O&M expenses (fromTable 5-9), debt service (from Table 5-10), and CIP expenditures (from Table 5-14). The FY 2020-21 beginning
73 Includes Estuary Protection Charge revenue beginning in FY 2021-22. Beginning in FY 2021-22, the Estuary Protection Charge isproposed to be eliminated as a separate charge. Revenue currently recovered by the Estuary Protection Charge will be recovered by allother wastewater rates and charges.74 Equal to [Line 17 – Line 19 – Line 21]

2021 WATER AND WASTEWATER COST OF SERVICE AND RATE DESIGN STUDY 101
balance reflects actual Wastewater Enterprise reserve balances as of July 1, 2020. All ending balance and debtcoverage figures are projected values. Target reserve balances shown are from Table 5-16. Under the proposedfinancial plan, reserve balances and debt coverage are projected to achieve target policies in all years of the rate-setting period.
Table 5-21: Proposed Wastewater Financial Plan Pro Forma (Funds 51, 71, & 75)Line Description FY 2020-21 FY 2021-22 FY 2022-23 FY 2023-24 FY 2024-25 FY 2025-26
1 Beginning Balance $51,379,367 $43,323,832 $40,826,293 $34,205,706 $24,099,121 $26,941,735
2
3 Source of Funds
4WW Rates (includingRevenue Adjustments)
$23,863,419 $27,826,515 $29,712,077 $31,611,212 $33,692,255 $35,878,161
5 Estuary Protection Charges $2,386,342 N/A N/A N/A N/A N/A
6 Other Fund 51 Revenue $711,631 $725,066 $760,599 $805,506 $858,199 $904,291
7 Other Fund 71 Revenue $1,163,436 $984,707 $908,417 $908,417 $908,417 $908,417
8 Other Fund 75 Revenue $135,712 $149,001 $150,491 $151,996 $153,516 $155,051
9 Grants $0 $0 $0 $0 $4,187,115 $4,187,115
10 Use of Debt Proceeds $2,037,251 $6,265,251 $5,760,000 $5,760,000 $29,472,885 $29,472,885
11 Total Source of Funds $30,297,792 $35,950,540 $37,291,584 $39,237,131 $69,272,387 $71,505,922
12
13 Use of Funds
14 O&M Expenses $23,315,145 $23,291,889 $23,914,896 $25,040,600 $25,714,720 $29,261,646
15 Debt Service $1,537,437 $2,281,691 $2,393,755 $2,513,805 $3,106,780 $3,985,115
16Capital Improvement PlanExpenditures
$13,500,745 $12,874,500 $17,603,520 $21,789,312 $37,608,273 $34,116,245
17 Total Use of Funds $38,353,327 $38,448,080 $43,912,171 $49,343,716 $66,429,773 $67,363,005
18
19 Ending Balance75 $43,323,832 $40,826,293 $34,205,706 $24,099,121 $26,941,735 $31,084,651
20 Target Balance $14,697,365 $14,691,551 $14,847,303 $15,128,729 $15,297,259 $16,183,990
21
22 Debt Coverage
23 Net Revenue76 $4,945,397 $6,393,401 $7,616,688 $8,436,532 $9,897,667 $8,584,276
24 Debt Service $1,537,437 $2,281,691 $2,393,755 $2,513,805 $3,106,780 $3,985,115
25 Projected Debt Coverage77 3.22 2.80 3.18 3.36 3.19 2.15
26 Required Debt Coverage 1.20 1.20 1.20 1.20 1.20 1.20
75 Equal to [Line 1 + Line 11 – Line 17]76 Equal to [( Sum of Lines 4-8) – Line 14]77 Equal to [Line 23 ÷ Line 24]

102 VENTURA WATER
Figure 5-2 shows projected debt coverage (blue line) relative to the debt coverage requirement (red line) over thestudy period. Fluctuations in debt coverage over the study period are largely due to assumed new debt service tofinance VenturaWaterPure project costs. Debt coverage remains above the requirement throughout the studyperiod.
Figure 5-2: Proposed Wastewater Financial Plan - Debt Coverage
Figure 5-3 shows the Wastewater Enterprise’s projected ending balance under the proposed financial plan. The lightblue bars indicate the ending balance. The total reserve target is represented by the red dashed line. The WastewaterEnterprise is projected to draw down its reserves through FY 2023-24 to fund substantial R&R CIP projects exclusiveof VenturaWaterPure. By the end of the study period, the Wastewater Enterprise’s reserves are projected to remainabove the target amount with the proposed rate increases. Maintaining reserves above the target amount is necessaryas additional drawdown of reserves beyond FY 2025-26 is anticipated to fund substantial R&R CIP from FY 2026-27 through FY 2029-30 (see Appendix C for ten-year financial plan projections).
Figure 5-3: Proposed Wastewater Financial Plan – Projected Ending Balances

2021 WATER AND WASTEWATER COST OF SERVICE AND RATE DESIGN STUDY 103
Figure 5-4 shows the proposed versus status quo operating financial plan. Revenues under the proposed financialplan and status quo financial plan are represented by the green and red dashed lines, respectively. Revenuerequirements including O&M expenses, debt service, and reserve funding for CIP/other purposes are represented bythe various stacked bars. Revenue adjustments are required to generate sufficient revenue to recover O&M expensesand debt service payments over the study period.
Figure 5-4: Proposed vs. Status Quo Wastewater Financial Plan
5.3.Wastewater Cost of Service AnalysisSection 5.3 details the cost of service (COS) analysis performed for the Wastewater Enterprise for FY 2020-21. TheCOS analysis allocates the overall rate revenue requirement to customer classes based on their proportion of use ofand burden on the wastewater system. This provides the basis for the development of proposed wastewater ratesthrough FY 2025-26. Note that reclaimed water cost allocations are included in this section as part of the wastewaterCOS analysis rather than the water COS analysis.
5.3.1.METHODOLOGY
The first step in a COS analysis is to determine the revenue required from wastewater rates. The total revenuerequirement results from the wastewater financial plan in Section 5.2. The methodology to develop the COS analysisand to apportion the revenue requirement to user classes is informed by the WEF’s Manual of Practice (MOP) No.27 Financing and Charges for Wastewater Systems. COS analyses are tailored to meet the specific needs of eachwastewater system. However, there are four distinct steps in every COS analysis to recover costs from customers inan accurate, equitable, and defensible manner:
1. Cost functionalization: O&M expenses and capital assets are categorized by their function in thewastewater system. Sample functions may include collection, treatment, and customer service, amongothers.
2. Cost causation component allocation: Functionalized costs are then allocated to cost causation componentsbased on their burden on the wastewater system. The cost causation components include flow, biological

104 VENTURA WATER
oxygen demand (BOD), and suspended solids (SS), among other specific cost components. The revenuerequirement is allocated accordingly to the cost causation components and results in the total share of therevenue requirement attributable to each cost component.
3. Mass balance analysis: The flow and strength (BOD and SS) of wastewater treatment plant (WWTP)influent is attributed to each customer class based on water use data and wastewater generation and strengthassumptions that vary by user classification. This analysis estimates the burden each customer class placeson the wastewater system.
4. Revenue requirement distribution: The mass balance analysis is utilized to distribute the revenuerequirement for each cost causation component unit cost to customer classes based on each customer class’sindividual burden on the wastewater system.
5.3.2.WASTEWATER RATE REVENUE REQUIREMENT
Table 5-22 shows the determination of the wastewater rate revenue requirement for FY 2020-21 (also referred to asthe test year). The revenue requirement is split into operating and capital categories (Columns C-D), which are laterallocated based on O&M expenses and capital assets. The revenue requirements (Lines 2-4) include FY 2020-21O&M expenses, debt service, and Estuary Protection Charges.78 The revenue offsets (Line 8) include all Fund 51non-rate revenues. These revenues are applied as offsets to the final rate revenue requirement. The reserve transferadjustment (Line 12) is equal to FY 2020-21 negative net operating cash flow under the proposed financial plan, andaccounts for the drawdown of operating reserves in FY 2020-21. All values are from the proposed wastewaterfinancial plan operating cash flow (Table 5-20). The final rate revenue requirement (Line 15) is calculated as follows:
Total revenue required from rates (Line 15) = Revenue requirements (Line 5) - Revenue offsets (Line 9) - Adjustments (Line 13)
Table 5-22: FY 2020-21 Wastewater Rate Revenue Requirement
[A] [B] [C] [D] [E]
Line DescriptionOperatingRevenue
Requirement
CapitalRevenue
RequirementTotal
1 Revenue Requirements2 O&M Expenses $23,315,145 $0 $23,315,1453 Debt Service $0 $1,537,437 $1,537,4374 Estuary Protection Charges $0 $2,386,342 $2,386,3425 Total Revenue Requirements $23,315,145 $3,923,779 $27,238,92467 Less Revenue Offsets8 Other Fund 51 Revenue $711,631 $0 $711,6319 Total Revenue Offsets $711,631 $0 $711,6311011 Less Adjustments12 Transfer from (to) Reserves $0 $277,531 $277,53113 Total Adjustments $0 $277,531 $277,5311415 Water Rate Revenue Requirement $22,603,514 $3,646,248 $26,249,761
78 Because Estuary Protection Charges are to be eliminated, proposed wastewater rates must recover additional revenue currentlygenerated by Estuary Protection Charges. There is no effect however on the Wastewater Enterprise’s revenue requirement.

2021 WATER AND WASTEWATER COST OF SERVICE AND RATE DESIGN STUDY 105
5.3.3.FUNCTIONALIZATION AND ALLOCATION OF EXPENSES
After determining the revenue requirement, the next step of the wastewater COS analysis is to allocate O&Mexpenses and capital assets to the following functional categories:
» Treatment: costs associated with the wastewater treatment facilities to treat wastewater to tertiary standardsand disposal
» Collection: costs related to the system of collection and transport of wastewater discharges from customersto the wastewater treatment plan
» Customer: costs of billing, revenue collections, and other customer services functions» Reclaimed Water: costs directly attributable to the reclaimed water system only (such as reclaimed water
distribution)» General: costs for general administration and operational expenses or any other costs that do not clearly
relate to another functional category (i.e. indirect costs)
The functionalization of costs allows for the allocation of costs to cost causation components. Some cost causationcomponents correspond directly to a functional category listed above. The cost causation components include:
» Flow: costs that vary based on the quantity of wastewater generated» Biological Oxygen Demand: costs that vary based on the BOD strength parameter of wastewater; Biological
oxygen demand is a measure of wastewater strength based on the amount of organic matter contained inwastewater prior to treatment and generally defined in terms of milligrams per liter (mg/L) or parts permillion (ppm).
» Suspended Solids: costs that vary based on the SS strength parameter of wastewater; Suspended Solids area measure of wastewater strength based on the amount of solid particles in suspension in wastewater priorto treatment also generally expressed in milligrams per liter (mg/L) or parts per million (ppm).
» Customer: directly associated with the Customer functional category» General: directly associated with the General functional category
Table 5-23 shows the basis for allocating each functional category to the various cost causation components. Thisprovides the basis for allocating O&M and capital expenses in the following subsections. The Treatment functionalcategory is first allocated to the Reclaimed Water functional category based on reclaimed water’s share of costspertaining to tertiary treatment.79 Remaining Treatment costs are then allocated 60 percent to Flow, 20 percent toBiological Oxygen Demand, and 20 percent to Suspended Solids based on Raftelis’ estimate of the wastewatertreatment plant’s cost drivers to treat wastewater to tertiary standards. The Collection functional category isallocated entirely to the Flow cost causation component because collection-related costs depend on the quantity ofwastewater rather than the quality (strength) of wastewater. The Customer, Reclaimed Water, and Generalfunctional categories are allocated entirely to the corresponding cost causation component.
79 Tertiary wastewater treatment is necessary for Ventura Water to meet its VWRF NPDES Permit requirements and to producereclaimed water. Tertiary treatment capital assets comprise an estimated 36.5 percent of all treatment capital assets. Raftelis estimatesthat approximately 6.6 percent of wastewater influent from wastewater customers is delivered to customers as reclaimed water aftertertiary treatment. Therefore, the Reclaimed Water cost causation component is allocated [36.5% × 6.6% = 2.4%] of all treatment-related costs.

106 VENTURA WATER
Table 5-23: Allocation of Functional Categories to Wastewater Cost Causation Components[A] [B] [C] [D] [E] [F] [G] [H] [I]
LineFunctionalCategory
FlowBiological
OxygenDemand
SuspendedSolids
CustomerReclaimed
WaterGeneral Total
1 Treatment80 58.5% 19.5% 19.5% 2.4% 100.0%2 Collection 100.0% 0.0% 0.0% 100.0%3 Customer 100.0% 100.0%4 Reclaimed Water 100.0% 100.0%5 General 100.0% 100.0%
5.3.4.WASTEWATER ENTERPRISE O&M EXPENSE ALLOCATION
The next step of the COS analysis is to develop an allocation basis for the operating revenue requirement based onthe functionalization of the Water Enterprise’s O&M expenses. Raftelis worked with Ventura Water and Financestaff to assign wastewater O&M expenses by line item to the most closely associated functional category. Table 5-24summarizes FY 2020-21 wastewater O&M expenses by functional category. This intermediate step is necessary toallocate wastewater O&M expenses to individual cost causation components.
Table 5-24: Summary of Wastewater Enterprise O&M Expenses by Functional Category
[A] [B] [C] [D]
Line Functional CategoryFY 2020-21
O&M ExpensesPercent of Total
1 Treatment $7,296,691 31.3%2 Collection $6,050,362 26.0%3 Customer $6,192,044 26.6%4 Reclaimed Water $15,000 0.1%5 General $3,761,047 16.1%6 Total O&M Expenses $23,315,145 100.0%
Table 5-25 shows the allocation of FY 2020-21 O&M expenses by functional category to each cost causationcomponent. The percentage allocation of each functional category (Columns C-H) to the various cost causationcomponents was determined in Table 5-23. Total O&M expenses associated with each functional category(Column I) were determined in Table 5-24. The total dollar amount allocated to each cost causation component(Line 6) is determined by multiplying the total expense associated with each functional category by thecorresponding percentage allocation and summing across all functional categories.
For example, 58.5 percent (Column C, Line 1) of Treatment costs (Column I, Line 1) are allocated to the Flow costcausation factor total (Column C, Line 6). The same calculation is performed for the remaining functionalcategories (i.e. Column C × Column I in Lines 2-5). The subtotals of Column C × Column I in Lines 1-5 aresummed to determine the total dollar amount allocated to the Flow cost causation component (Column C, Line 6).The same calculations are repeated for the remaining cost causation components (Columns D-H) to determine theallocation of O&M expenses to each cost causation component (Line 6). The O&M allocation percentages (Line 8)represent the proportion of O&M expenses allocated to each cost causation component (Line 6). The O&Mallocation percentages (Line 8) are used to allocate the total operating revenue requirement (O&M expenses less
80 Flow = [(100%-2.4%) × 60%]; Biological oxygen demand = [(100%-2.4%) × 20%]; Suspended solids = [(100%-2.4%) × 20%].Reclaimed Water’s share of 2.4% is removed from each of the treatment-related cost causation components.
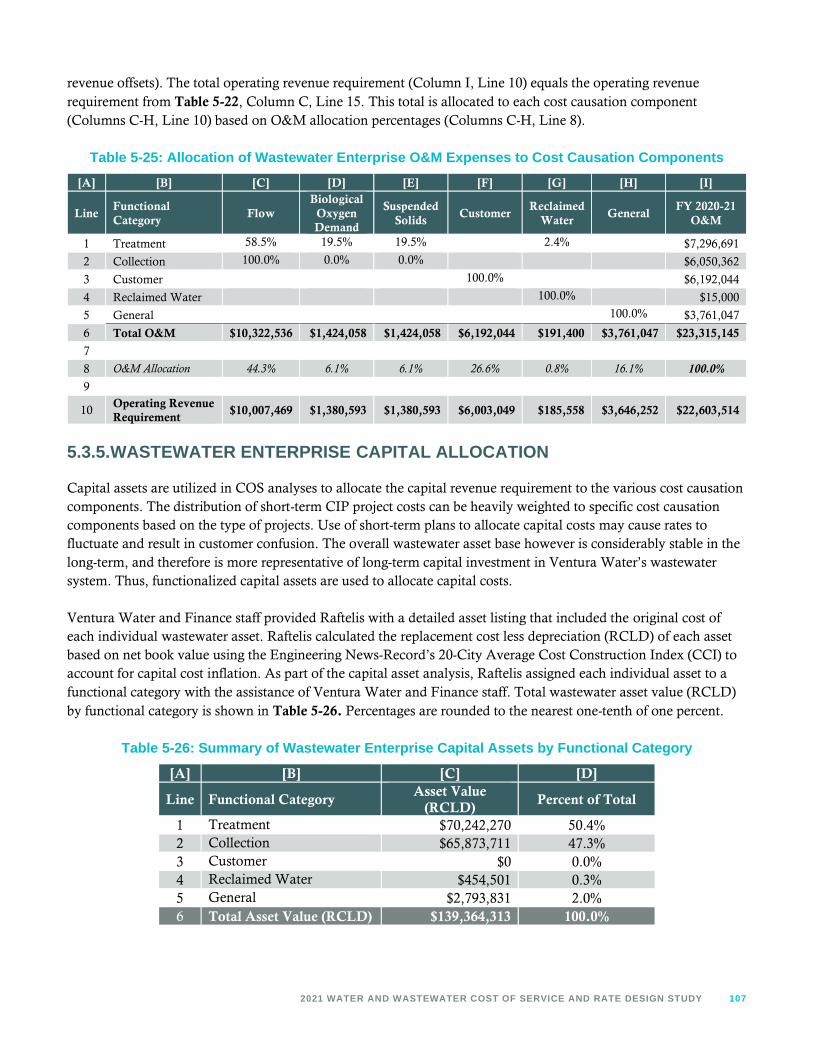
2021 WATER AND WASTEWATER COST OF SERVICE AND RATE DESIGN STUDY 107
revenue offsets). The total operating revenue requirement (Column I, Line 10) equals the operating revenuerequirement from Table 5-22, Column C, Line 15. This total is allocated to each cost causation component(Columns C-H, Line 10) based on O&M allocation percentages (Columns C-H, Line 8).
Table 5-25: Allocation of Wastewater Enterprise O&M Expenses to Cost Causation Components[A] [B] [C] [D] [E] [F] [G] [H] [I]
LineFunctionalCategory
FlowBiological
OxygenDemand
SuspendedSolids
CustomerReclaimed
WaterGeneral
FY 2020-21O&M
1 Treatment 58.5% 19.5% 19.5% 2.4% $7,296,691
2 Collection 100.0% 0.0% 0.0% $6,050,362
3 Customer 100.0% $6,192,044
4 Reclaimed Water 100.0% $15,000
5 General 100.0% $3,761,047
6 Total O&M $10,322,536 $1,424,058 $1,424,058 $6,192,044 $191,400 $3,761,047 $23,315,145
7
8 O&M Allocation 44.3% 6.1% 6.1% 26.6% 0.8% 16.1% 100.0%
9
10Operating RevenueRequirement
$10,007,469 $1,380,593 $1,380,593 $6,003,049 $185,558 $3,646,252 $22,603,514
5.3.5.WASTEWATER ENTERPRISE CAPITAL ALLOCATION
Capital assets are utilized in COS analyses to allocate the capital revenue requirement to the various cost causationcomponents. The distribution of short-term CIP project costs can be heavily weighted to specific cost causationcomponents based on the type of projects. Use of short-term plans to allocate capital costs may cause rates tofluctuate and result in customer confusion. The overall wastewater asset base however is considerably stable in thelong-term, and therefore is more representative of long-term capital investment in Ventura Water’s wastewatersystem. Thus, functionalized capital assets are used to allocate capital costs.
Ventura Water and Finance staff provided Raftelis with a detailed asset listing that included the original cost ofeach individual wastewater asset. Raftelis calculated the replacement cost less depreciation (RCLD) of each assetbased on net book value using the Engineering News-Record’s 20-City Average Cost Construction Index (CCI) toaccount for capital cost inflation. As part of the capital asset analysis, Raftelis assigned each individual asset to afunctional category with the assistance of Ventura Water and Finance staff. Total wastewater asset value (RCLD)by functional category is shown in Table 5-26. Percentages are rounded to the nearest one-tenth of one percent.
Table 5-26: Summary of Wastewater Enterprise Capital Assets by Functional Category
[A] [B] [C] [D]
Line Functional CategoryAsset Value
(RCLD)Percent of Total
1 Treatment $70,242,270 50.4%2 Collection $65,873,711 47.3%3 Customer $0 0.0%4 Reclaimed Water $454,501 0.3%5 General $2,793,831 2.0%6 Total Asset Value (RCLD) $139,364,313 100.0%

108 VENTURA WATER
Table 5-27 shows the allocation of capital assets by functional category to each cost causation component. Thepercentage allocation of each functional category (Columns C-H) to the various cost causation components wasdetermined in Table 5-23. Total capital assets associated with each functional category (Column I) weredetermined in Table 5-26. The total dollar amount allocated to each cost causation component (Line 6) isdetermined by multiplying the total asset value associated with each functional category by the correspondingpercentage allocation and summing across all functional categories. This is consistent with the methodology usedto determine the allocation of O&M expenses to cost causation components in Table 5-25.
The capital allocation percentages (Line 8) represent the proportion of capital assets allocated to each costcausation component (Line 6). The capital allocation percentages (Line 8) are used to allocate the total capitalrevenue requirement in Column I, Line 10 (which was calculated in Table 5-22, Column D, Line 15). This total isallocated to each cost causation component (Columns C-H, Line 10) based on capital allocation percentages(Columns C-H, Line 8).
Table 5-27: Allocation of Functionalized Wastewater Capital Assets to Cost Causation Components[A] [B] [C] [D] [E] [F] [G] [H] [I]
LineFunctionalCategory
FlowBiological
OxygenDemand
SuspendedSolids
CustomerReclaimed
WaterGeneral
Asset Value(RCLD)
1 Treatment 58.5% 19.5% 19.5% 2.4% $70,242,270
2 Collection 100.0% 0.0% 0.0% $65,873,711
3 Customer 100.0% $0
4 Reclaimed Water 100.0% $454,501
5 General 100.0% $2,793,831
6 Total Assets $107,000,194 $13,708,828 $13,708,828 $0 $2,152,633 $2,793,831 $139,364,313
7
8 Capital Allocation 76.8% 9.8% 9.8% 0.0% 1.5% 2.0% 100.0%
9
10Capital RevenueRequirement
$2,799,492 $358,670 $358,670 $0 $56,320 $73,096 $3,646,248

2021 WATER AND WASTEWATER COST OF SERVICE AND RATE DESIGN STUDY 109
5.3.6.WASTEWATER COST OF SERVICE ALLOCATION
Table 5-28 shows the allocation of the total FY 2020-21 wastewater rate revenue requirement to the various costcausation components. The COS allocations (Column F) provide the basis for FY 2020-21 rate calculations shownin Section 5.5 The results shown in Table 5-28 are calculated as follows based on intermediate results developed inthe preceding subsections:
1. Operating Revenue Requirement (Column C): The total operating revenue requirement consists of theWastewater Enterprise’s O&M expenses less revenue offsets. The allocation of the total operating revenuerequirement to each cost causation component was previously determined in Table 5-25, Columns C-H,Line 10.
2. Capital Revenue Requirement (Column D): The total capital revenue requirement consists of debt serviceand revenue currently generated by Estuary Protection Charges less projected draw down of operatingreserves. The allocation of the total capital revenue requirement to each cost causation component waspreviously determined in Table 5-27, Columns C-H, Line 10).
3. Reallocation of General Costs (Column E): The total General cost allocation equals the operatingrevenue requirement (Column C, Line 6) and capital revenue requirement (Column D, Line 6) allocated tothe General cost causation component. The total General revenue requirement (Column, E, Line 6) is fullyreallocated to all other cost causation components on a pro rata basis (Column F, Lines 2-5).81 Note thatthe reallocation results in a shifting of costs between cost causation components but does not change thetotal rate revenue requirement.
4. Final Cost of Service Allocation (Column F): The final COS allocation to each cost causation component(Column F, Lines 1-7) equals the sum of Columns C-E. Note that the total COS allocation (Column F,Line 7) equals the total FY 2020-21 wastewater rate revenue requirement (from Table 5-22, Column E,Line 15).
Table 5-28: Wastewater Cost of Service Allocation (Test Year FY 2020-21)
[A] [B] [C] [D] [E] [F]
Line Cost Causation ComponentOperatingRevenue
Requirement
CapitalRevenue
Requirement
Reallocation ofGeneral Costs
COSAllocation
1 Flow $10,007,469 $2,799,492 $2,114,189 $14,921,1502 Biological Oxygen Demand $1,380,593 $358,670 $287,120 $2,026,3823 Suspended Solids $1,380,593 $358,670 $287,120 $2,026,3824 Customer $6,003,049 $0 $990,991 $6,994,0395 Reclaimed Water $185,558 $56,320 $39,930 $281,8086 General $3,646,252 $73,096 ($3,719,348) $07 Total $22,603,514 $3,646,248 $0 $26,249,761
81 The operating (Column C) and capital (Column D) revenue requirements are summed for each cost causation component shown inLines 1-5. The percentage of this sum falling within each cost causation component (Lines 1-5) is multiplied by total reallocatedGeneral costs (Column E, Line 6) to determine the share of General costs reallocated to each cost causation component (Column E,Lines 1-5).

110 VENTURA WATER
5.3.7.MASS BALANCE ANALYSIS
The next step of the wastewater COS analysis is to attribute flow and strength loadings entering Ventura Water’swastewater treatment plant to various user classifications. This is necessary to eventually allocate the Flow,Biological Oxygen Demand, and Suspended Solids cost causation components to each customer class for recoveryby the proposed wastewater rates.
Table 5-29 shows Raftelis’ mass balance analysis of the Ventura Water Reclamation Facility based on plantinfluent data for FY 2018-19. The result is attribution of flow and strength loadings to each customer class. Allnumerical values in green represent inputs or assumptions to the analysis. All numerical values in black representvalues calculated by Raftelis based on inputs and assumptions in green. See footnotes to Table 5-29 for additionaldetail. Key inputs and assumptions include:
» Total FY 2018-19 wastewater flows entering the wastewater treatment plant (from Ventura Water staff)» Measurements of FY 2018-19 strength concentration for BOD and SS (from Ventura Water staff)» Detailed FY 2018-19 flow and strength measurements for all industrial customers (from Ventura Water
staff)» FY 2018-19 water use associated with non-residential wastewater customers (from Ventura Water staff)» Assumed strength concentrations for commercial (non-residential) customers, churches, and schools
(estimated by Raftelis based on wastewater loading factors used by Los Angeles County SanitationDistrict)
» Residual plant influent is attributable to Residential class wastewater generation. That is the differencebetween net plant influent and estimated wastewater generation from all non-residual sources isResidential wastewater flow. After applying all residual wastewater generation to Residential customers,Raftelis estimates that the residential wastewater discharge factor for Ventura Water’s wastewater servicearea is approximately 45 gallons per capita per day, which is well within the bounds of industry norms.

2021 WATER AND WASTEWATER COST OF SERVICE AND RATE DESIGN STUDY 111
Table 5-29: FY 2018-19 Mass Balance Analysis
[A] [B] [C] [D] [E] [F] [G] [H]
Line DescriptionFlow
(HCF)
BiologicalOxygenDemand(mg/L)
SuspendedSolids(mg/L)
Flow(MG)82
BiologicalOxygenDemand
(lbs)83
SuspendedSolids(lbs)
1 Treatment Plant Summary2 Total Plant Influent 3,581,345 286 280 2,679 6,385,989 6,266,6483 Less Inflow/Infiltration84 179,067 150 150 134 167,670 167,6704 Net Plant Influent 3,402,278 293 287 2,545 6,218,319 6,098,97756 Non-Residential Influent7 Commercial Group 1 638,777 174 112 478 691,932 448,0748 Commercial Group 2 57,909 310 120 43 112,198 43,4969 Commercial Group 3 41,570 600 400 31 155,697 103,79810 Commercial Group 4 18,046 800 800 13 90,120 90,12011 Commercial Group 5 194,348 812 506 145 985,352 613,99512 Commercial Group 685 0 174 112 0 0 013 Industrial86 42,196 323 313 32 84,984 82,53214 Schools 67,139 130 100 50 54,484 41,91115 Churches87 10,799 150 150 8 10,111 10,11116 Total Non-Residential Influent 1,070,784 327 215 801 2,184,878 1,434,0361718 Residual Influent19 Residential88 2,331,494 277 321 1,744 4,033,441 4,664,94120 Total Residential Influent89 2,331,494 277 321 1,744 4,033,441 4,664,941
Note: All values in green are inputs; all values in black are calculated
82 Conversion factor: one (1) hundred cubic feet = 0.000748 million gallons.83 Conversion factor: one (1) milligram per liter = 8.35 pounds per million gallons.84 Inflow and infiltration is assumed to contribute 5% of total wastewater treatment plant flows.85 Commercial Group 6 customers are assumed to have a 30% return factor (i.e. ratio of sewer flow to water use), as most nursery water is for plant use.86 Conversion factor: one (1) pound of COD per million gallons of flow = 0.5 pounds of BOD per million gallons of flow.87 Churches are assumed to have a 75% return factor (i.e. ratio of sewer flow to water use) to account for water use associated with outdoor irrigation.88 Residual flow and strength loadings are attributed to the residential customer class.89 Equal to [Line 4 – Line 16]

112 VENTURA WATER
5.3.8.WASTEWATER UNIT COSTS
The next step of the wastewater COS analysis is to develop unit costs for each cost causation component. This isnecessary to allocate the revenue requirement to each customer class in subsequent steps of the COS analysis.Table 5-30 shows the calculation of unit costs (Column E) by dividing the COS allocation for each cost causationcomponent in Column C (from Table 5-28) by the corresponding units of service in Column D. Flow, BiologicalOxygen Demand, and Suspended Solids units of service are based on net plant influent estimates from the massbalance analysis (see Table 5-29). Customer units of service equal the number of monthly wastewater bills in FY2020-21 after adjusting for multiple family residential customers, whose household density is lower than singlefamily residential customers. Reclaimed Water unit of service simply equal projected reclaimed water use in FY2020-21 (from Table 5-5). See footnotes to Table 5-30 for additional detail on units of service.
Table 5-30: Wastewater Unit Costs (Test Year FY 2020-21)
[A] [B] [C] [D] [E]
Line Cost Causation ComponentCOS
AllocationUnits of Service Unit Cost
1 Flow $14,921,150 3,402,278 HCF of Flow90 $4.39 per HCF2 Biological Oxygen Demand $2,026,382 6,218,319 lbs. of BOD91 $0.33 per lb.3 Suspended Solids $2,026,382 6,098,977 lbs. of SS92 $0.33 per lb.4 Customer $6,994,039 466,204 Weighted Bills93 $15.00 per Bill5 Reclaimed Water $281,808 258,036 HCF of Reclaimed Water Use $1.09 per HCF6 Total $26,249,761
5.3.9.WASTEWATER COST ALLOCATION TO CUSTOMER CLASSES
Table 5-31 shows the allocation of the rate revenue requirement by cost causation component to each customerclass based on units costs and units of service. The units of service shown for each customer class for the Flow,Biological Oxygen Demand, and Suspended Solids cost causation components (Columns C-E, Lines 2-12) werepreviously determined as part of the mass balance analysis (see Table 5-29). Number of bills (Column F, Lines 2-12) equal the number of accounts associated with each customer class multiplied by 12 monthly bill periods peryear. However, the number of bills shown for multiple family residential accounts (Column F, Line 3) is adjustedbased on the ratio of multiple family residential household density to single family residential household density(see footnote to Table 5-30 for more detail). Reclaimed Water units of service ( Column G, Line 13) simply equalprojected reclaimed water use in FY 2020-21 (from Table 5-5). Cost allocations to each customer class (Lines 19 -30) simply equal the unit cost (Line 16) multiplied by the corresponding units of service (Lines 2-13)
90 Net plant flows in FY 2018-19 (in HCF) from Table 5-29, Column C, Line 4.91 Net plant biological oxygen demand in FY 2018-19 (in pounds) from Table 5-29, Column G, Line 4.92 Net plant suspended solids in FY 2018-19 (in pounds) from Table 5-29, Column H, Line 4.93 Total projected weighted bills in FY 2020-21 equals ([44,289 connections × 12 monthly billing periods] - [20,686 multi-familyresidential dwelling units × (100%-73.7%)]) to account for reduced fixed charge for multi-family due to lower household density.Raftelis estimates that the household density of multiple family residential customers in Ventura Water’s service area is 73.7% ofsingle family residential household density.

2021 WATER AND WASTEWATER COST OF SERVICE AND RATE DESIGN STUDY 113
Table 5-31: Wastewater Cost Allocation to Customer Classes (Test Year FY 2020-21)
[A] [B] [C] [D] [E] [F] [G] [H]
Line Customer Class FlowBiological
OxygenDemand
SuspendedSolids
Customer Recycled Water Total
1 Units HCF LBS. LBS. Bills HCF2 Single Family Residential 1,368,844 2,368,074 2,738,834 260,1633 Multiple Family Residential 962,650 1,665,367 1,926,107 248,2274 Commercial Group 1 638,777 691,932 448,074 17,9285 Commercial Group 2 57,909 112,198 43,496 4856 Commercial Group 3 41,570 155,697 103,798 1277 Commercial Group 4 18,046 90,120 90,120 1648 Commercial Group 5 194,348 985,352 613,995 3,0659 Commercial Group 6 0 0 0 010 Churches 10,799 10,111 10,111 71011 Schools 67,139 54,484 41,911 56412 Industrial 42,196 84,984 82,532 3613 Reclaimed Water N/A N/A N/A N/A 258,03614 Total 3,402,278 6,218,319 6,098,977 531,469 258,0361516 Unit Cost $4.39 $0.33 $0.33 $15.00 $1.091718 Cost Allocation19 Single Family Residential $6,003,249 $771,691 $909,976 $3,902,995 $0 $11,587,91220 Multiple Family Residential $4,221,833 $542,698 $639,948 $2,744,813 $0 $8,149,29221 Commercial Group 1 $2,801,443 $225,482 $148,872 $268,959 $0 $3,444,75622 Commercial Group 2 $253,968 $36,562 $14,451 $7,279 $0 $312,26023 Commercial Group 3 $182,311 $50,737 $34,487 $1,911 $0 $269,44624 Commercial Group 4 $79,143 $29,368 $29,942 $2,457 $0 $140,91025 Commercial Group 5 $852,339 $321,100 $204,000 $45,979 $0 $1,423,41826 Commercial Group 6 $0 $0 $0 $0 $0 $027 Churches $47,358 $3,295 $3,359 $10,646 $0 $64,65828 Schools $294,447 $17,755 $13,925 $8,462 $0 $334,58929 Industrial $185,057 $27,694 $27,421 $540 $0 $240,71330 Reclaimed Water $0 $0 $0 $0 $281,808 $281,80831 Total $14,921,150 $2,026,382 $2,026,382 $6,994,039 $281,808 $26,249,761

114 VENTURA WATER
Table 5-32 shows projected wastewater rate revenues by customer class for FY 2020-21 (based on the prior COSanalysis) and for FY 2020-21 (based on the updated COS analysis presented in this section). All proposed COSprojections for FY 2020-21 are for illustrative purposes to demonstrate the impact of the updated COS allocationson each customer class. However, no changes to current rates will be implemented prior to FY 2021-22. Note thatthe results shown are based on detailed calculations that are dependent on rate design considerations addressedsubsequently in Section 5.5.
Table 5-32: Cost to Serve by Wastewater Customer Class
[A] [B] [C] [D] [E] [F]
Line Charge/Customer ClassCurrent COSFY 2020-21
($)
Proposed COSFY 2020-21
($)
Current COSFY 2020-21
(%)
Proposed COSFY 2020-21
(%)1 Single Family Residential $10,026,056 $11,587,912 38.2% 44.1%2 Multiple Family Residential $7,098,458 $8,149,292 27.0% 31.0%3 Commercial Group 1 $3,419,927 $3,444,756 13.0% 13.1%4 Commercial Group 2 $335,788 $312,260 1.3% 1.2%5 Commercial Group 3 $305,861 $269,446 1.2% 1.0%6 Commercial Group 4 $165,181 $140,910 0.6% 0.5%7 Commercial Group 5 $1,599,186 $1,423,418 6.1% 5.4%8 Commercial Group 6 $0 $0 0.0% 0.0%9 Churches $62,961 $64,658 0.2% 0.2%10 Schools $340,592 $334,589 1.3% 1.3%11 Industrial $264,275 $240,713 1.0% 0.9%12 Reclaimed Water $245,135 $281,808 0.9% 1.1%13 Estuary Protection Charges $2,386,342 $0 9.1% 0.0%14 Total $26,249,761 $26,249,761 100.0% 100.0%
5.4.Proposed Wastewater Rate Structure ModificationsRaftelis worked closely with Ventura Water and Finance staff and the Water Commission to evaluate potentialchanges to the existing wastewater rate structure. All proposed wastewater rates presented in subsequent sectionsincorporate the following recommended revisions to the existing wastewater rate structure.
1. Adjust Rate Schedule to Reflect Monthly Billing Basis: Ventura Water plans to transition from billing ona bimonthly basis to a monthly basis beginning in July 2021. Therefore, all proposed Fixed Charges andFlow Charge caps shown are monthly.
2. Eliminate Estuary Protection Charge: Raftelis recommends that Ventura Water eliminate the currentEstuary Protection Charge equal to 10 percent of each customer’s wastewater bill. This proposed change issupported by the Water Commission to simplify the wastewater rate structure and improve customerunderstanding. Note that there is no net revenue impact resulting from this proposed change, as theproposed rates are designed to collect additional revenue to offset the loss of Estuary Protection Chargerevenue. There is also no change to the use of the revenue stream as the existing Estuary Protection Chargewas developed for meeting regulatory mandates for wastewater discharge and funding proposed projects toachieve compliance. This will be achieved with the VenturaWaterPure Program and revenues will be usedto finance and operate the project, as well as associated monitoring requirements.

2021 WATER AND WASTEWATER COST OF SERVICE AND RATE DESIGN STUDY 115
3. Update Residential Flow Charge Basis: Residential customers are currently subject to Flow Chargesbased on the prior fiscal year average winter water use. Each customer is subject to a cap of 15 HCF permonth for single family residential customers and 12 HCF per month for multiple family residentialcustomers. The current basis is administratively burdensome and is difficult for customers to understand.Raftelis therefore recommends that Ventura Water begin charging residential customers for Flow Chargesbased on actual water use each month and subject to a revised monthly cap. Raftelis recommends that themonthly cap be reduced from 15 HCF to 12 HCF per month for single family residential customers andfrom 12 HCF to 10 HCF per month for multiple family residential customers. This change will align thewastewater flow cap with the Tier 2 allotment for water and more accurately reflects changes in water useand estimated wastewater generation by residential users. Proposed changes to the residential Flow Chargebasis are described in detail in Table 5-33.
Table 5-33: Proposed Changes to Residential Wastewater Flow Charge Cap
Residential Wastewater Flow ChargeCurrent Bimonthly
Billing UnitsProposed Monthly
Billing UnitsSingle Family Residential Prior year winter average water
use for two full bimonthly billingcycles from approximatelyFebruary-May (in HCF) subjectto 30 HCF bimonthly cap.
Actual water use each monthlybilling period (in HCF) subject to12 HCF monthly cap.
Multiple Family Residential Prior year winter average wateruse for two full bimonthly billingcycles from approximatelyFebruary-May (in HCF) subjectto 24 HCF per dwelling unitbimonthly cap.
Actual water use each monthlybilling period (in HCF) subject to10 HCF per dwelling unitmonthly cap.
Table 5-34 shows estimated FY 2020-21 residential Flow Charge billing units based on the current and proposedcharge basis. Proposed billing units are based on detailed account-level analysis of FY 2018-19 residential water use.Raftelis projects that the proposed basis will result in a considerable increase in total residential Flow Charge billingunits. Note however that an increase in billing units does not increase the residential customer class’s share of therevenue requirement (which was previously determined as part of the wastewater COS analysis in Section 5.3), itsimply changes the denominator for determining the unit cost of wastewater flow.
Table 5-34: Projected FY 2020-21 Residential Variable Billing Units – Current versus Proposed
DescriptionCurrent Annual
Billing Units(HCF)
Proposed AnnualBilling Units
(HCF)Single Family Residential 1,778,075 2,157,337Multiple Family Residential 1,260,388 1,547,918Total 3,038,462 3,705,254
5.5.Proposed Wastewater RatesSection 5.5 shows detailed calculations of proposed wastewater rates through FY 2025-26. All proposed rates arefirst calculated directly from the results of the COS analysis (in Section 5.3) for FY 2020-21 (i.e. the “test year”).Note however that proposed rates will not be implemented until FY 2021-22. Therefore, all FY 2020-21 “COS”rates and charges shown represent intermediate results of the rate design process but will not actually be

116 VENTURA WATER
implemented during FY 2020-21. FY 2020-21 “COS” rates and charges must be calculated to provide a basis forproposed rates for FY 2021-22 through FY 2025-26 (shown in Section 5.5.2).
5.5.1.PROPOSED WASTEWATER RATES (TEST YEAR FY 2020-21)
Table 5-35 shows the calculation of COS wastewater rates for the test year. The revenue requirement associatedwith each charge Column C was determined from customer class cost allocations in Table 5-32. For mostcustomer classes, all Customer costs are recovered by Fixed Charges and all other cost causation components arerecovered by Flow Charges, with the exception of schools, industrial customers, and reclaimed customers. All unitsof service in Column D reflect the projected number of bills, water use (subject to the proposed caps for residentialcustomers), number of school ADAs, industrial loadings, and reclaimed water use in FY 2020-21. COS rates(Column E) are calculated by dividing the revenue requirement (Column C) by units of service (Column E).Proposed rates are compared to current charges in Columns F-H.
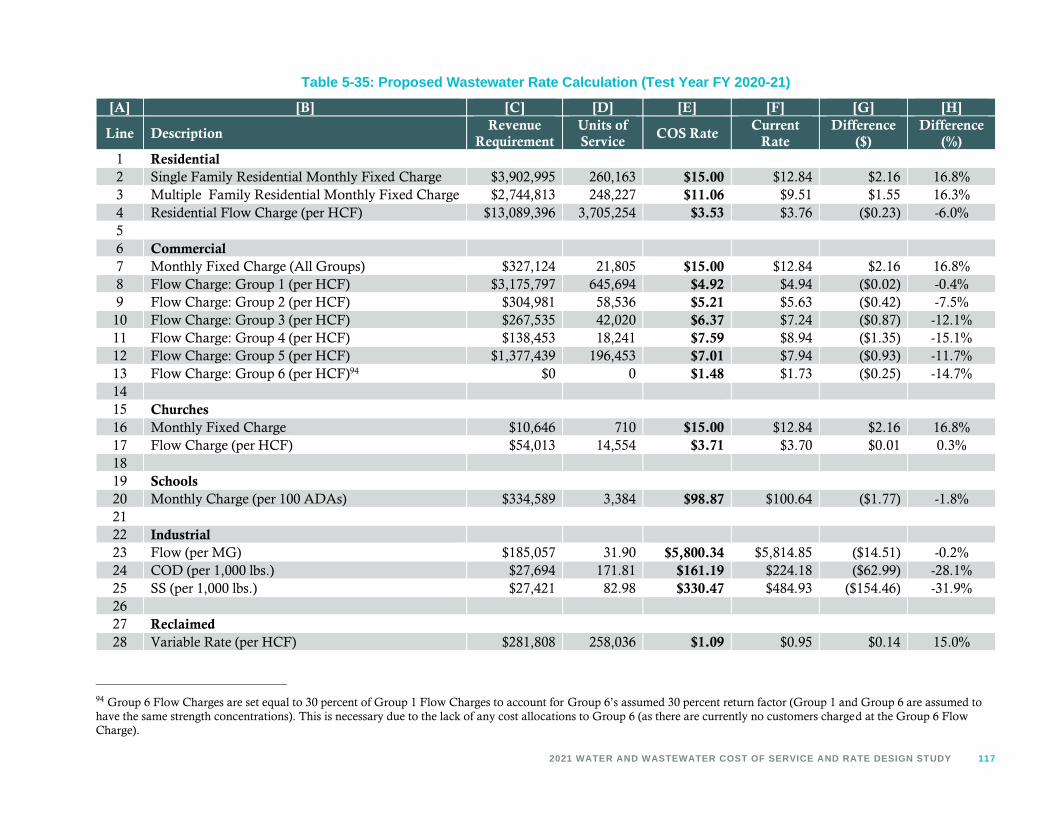
2021 WATER AND WASTEWATER COST OF SERVICE AND RATE DESIGN STUDY 117
Table 5-35: Proposed Wastewater Rate Calculation (Test Year FY 2020-21)
[A] [B] [C] [D] [E] [F] [G] [H]
Line DescriptionRevenue
RequirementUnits ofService
COS RateCurrent
RateDifference
($)Difference
(%)1 Residential2 Single Family Residential Monthly Fixed Charge $3,902,995 260,163 $15.00 $12.84 $2.16 16.8%3 Multiple Family Residential Monthly Fixed Charge $2,744,813 248,227 $11.06 $9.51 $1.55 16.3%4 Residential Flow Charge (per HCF) $13,089,396 3,705,254 $3.53 $3.76 ($0.23) -6.0%56 Commercial7 Monthly Fixed Charge (All Groups) $327,124 21,805 $15.00 $12.84 $2.16 16.8%8 Flow Charge: Group 1 (per HCF) $3,175,797 645,694 $4.92 $4.94 ($0.02) -0.4%9 Flow Charge: Group 2 (per HCF) $304,981 58,536 $5.21 $5.63 ($0.42) -7.5%10 Flow Charge: Group 3 (per HCF) $267,535 42,020 $6.37 $7.24 ($0.87) -12.1%11 Flow Charge: Group 4 (per HCF) $138,453 18,241 $7.59 $8.94 ($1.35) -15.1%12 Flow Charge: Group 5 (per HCF) $1,377,439 196,453 $7.01 $7.94 ($0.93) -11.7%13 Flow Charge: Group 6 (per HCF)94 $0 0 $1.48 $1.73 ($0.25) -14.7%1415 Churches16 Monthly Fixed Charge $10,646 710 $15.00 $12.84 $2.16 16.8%17 Flow Charge (per HCF) $54,013 14,554 $3.71 $3.70 $0.01 0.3%1819 Schools20 Monthly Charge (per 100 ADAs) $334,589 3,384 $98.87 $100.64 ($1.77) -1.8%2122 Industrial23 Flow (per MG) $185,057 31.90 $5,800.34 $5,814.85 ($14.51) -0.2%24 COD (per 1,000 lbs.) $27,694 171.81 $161.19 $224.18 ($62.99) -28.1%25 SS (per 1,000 lbs.) $27,421 82.98 $330.47 $484.93 ($154.46) -31.9%2627 Reclaimed28 Variable Rate (per HCF) $281,808 258,036 $1.09 $0.95 $0.14 15.0%
94 Group 6 Flow Charges are set equal to 30 percent of Group 1 Flow Charges to account for Group 6’s assumed 30 percent return factor (Group 1 and Group 6 are assumed tohave the same strength concentrations). This is necessary due to the lack of any cost allocations to Group 6 (as there are currently no customers charged at the Group 6 FlowCharge).

118 VENTURA WATER
5.5.2.PROPOSED FIVE-YEAR WASTEWATER RATE SCHEDULE
Table 5-36 shows the proposed five-year schedule of wastewater rates for FY 2021-22 to FY 2025-26. Proposed FY2021-22 wastewater rates were calculated by increasing COS wastewater rates (from Table 5-35) by the proposedFY 2021-22 revenue adjustment of 6 percent (from Table 5-19). All proposed rates in subsequent years are thenincreased by 6 percent per year based on the schedule of proposed revenue adjustments (from Table 5-19). Allproposed rates are rounded up to the nearest cent to ensure adequate revenue recovery. Current FY 2020-21wastewater rates (from Table 5-1) are adjusted to reflect monthly billing. Note that reclaimed water rates areomitted from Table 5-36 and included as part of the proposed five-year water rate schedule in Section 0.
Table 5-36: Proposed Five-Year Wastewater Rate Schedule
Description Current95 ProposedJuly 2021
ProposedJuly 2022
ProposedJuly 2023
ProposedJuly 2024
ProposedJuly 2025
Single Family ResidentialMonthly Fixed Charge $12.84 $15.91 $16.86 $17.87 $18.94 $20.08Flow Charge (per HCF)96 $3.76 $3.75 $3.97 $4.21 $4.46 $4.73
Multiple Family ResidentialMonthly Fixed Charge(per dwelling unit)
$9.51 $11.73 $12.43 $13.17 $13.97 $14.80
Flow Charge (per HCF)97 $3.76 $3.75 $3.97 $4.21 $4.46 $4.73
CommercialMonthly Fixed Charge $12.84 $15.91 $16.86 $17.87 $18.94 $20.08Flow Charge (per HCF)
Group 1 $4.94 $5.22 $5.53 $5.86 $6.21 $6.59Group 2 $5.63 $5.53 $5.86 $6.21 $6.58 $6.98Group 3 $7.24 $6.75 $7.16 $7.59 $8.04 $8.53Group 4 $8.94 $8.05 $8.53 $9.04 $9.59 $10.16Group 5 $7.94 $7.44 $7.88 $8.36 $8.86 $9.39Group 6 $1.73 $1.57 $1.66 $1.76 $1.87 $1.98
ChurchesMonthly Fixed Charge $12.84 $15.91 $16.86 $17.87 $18.94 $20.08Flow Charge (per HCF) $3.70 $3.94 $4.17 $4.43 $4.69 $4.97
SchoolsMonthly Charge (per ADA) $100.64 $104.80 $111.09 $117.76 $124.82 $132.31
IndustrialFlow (per million gallons) $5,814.85 $6,148.36 $6,517.26 $6,908.30 $7,322.80 $7,762.16Chemical Oxygen Demand(per 1,000 lbs.)
$224.18 $170.87 $181.12 $191.99 $203.50 $215.71
Suspended Solids(per 1,000 lbs.)
$484.93 $350.30 $371.32 $393.59 $417.21 $442.24
Estuary Protection ChargeAll Customer Classes(% of WW Bill)
10% N/A N/A N/A N/A N/A
95All current rates shown on a monthly basis to provide a direct comparison to proposed rates.96 Single family residential wastewater customers are currently charged based on average winter water usage subject to a cap of 15HCF per month. Beginning in FY 2021-22 it is proposed that single family residential wastewater customers will be charged based onactual water usage each billing period subject to a cap of 12 HCF per month.97 Multiple family residential wastewater customers are currently charged based on average winter water usage subject to a cap of 12HCF per dwelling unit per month. Beginning in FY 2021-22 it is proposed that single family residential wastewater customers will becharged based on actual water usage each billing period subject to a cap of 10 HCF per dwelling unit per month.

2021 WATER AND WASTEWATER COST OF SERVICE AND RATE DESIGN STUDY 119
6.Customer Bill Impacts6.1.Monthly Water Bill ImpactsFigure 6-1 shows sample monthly water bills for single family residential customers with a 3/4-inch water meter atvarying levels of water use under both current rates and proposed FY 2021-22 rates. Note that approximately 95percent of single family residential customers have a 3/4-inch water meter. The five water use levels shown aredefined in Table 6-1, and were calculated based on account-level single family residential water billing data for FY2018-19.
Figure 6-1: Single Family Residential Monthly Water Bill Impacts (FY 2021-22)
Table 6-1: FY 2018-19 Water Use per Account - Single Family ResidentialSingle Family ResidentialWater Use
HCF/Month
10th Percentile 2 HCF25th Percentile 4 HCFMedian 8 HCF75th Percentile 10 HCF90th Percentile 14 HCF

120 VENTURA WATER
Table 6-2 shows sample monthly water bills for two representative commercial water users under both currentrates and proposed FY 2021-22 rates. Water meter size was selected based on common commercial customercharacteristics. Monthly water use was determined based on water demand factors from Ventura Water’s 2020Water Demand Factor Study.
Table 6-2: Commercial Water Bill Impacts (FY 2021-22)
DescriptionSmall Retail
Establishment(1,000 square feet)
Restaurant(1,500 square feet)
Meter Size 1-inch meter 2-inch meterMonthly Water Use 4 HCF 40 HCFProposed Monthly Bill (FY 2021-22) $45.27 $256.00Current Monthly Bill (FY 2020-21) $41.44 $232.41Difference ($) $3.84 $23.59Difference (%) 9.3% 10.2%
6.2.Monthly Wastewater Bill ImpactsFigure 6-2 shows sample monthly wastewater bills for single family residential customers at varying levels of wateruse under both current rates and proposed FY 2021-22 rates. Current Flow Charges are based on prior year winteraverage water use subject to a 15 HCF monthly cap, while proposed Flow Charges are based on monthly water usesubject to a 12 HCF monthly cap (see Table 6-3). Winter monthly and monthly water use levels were calculatedbased on account-level single family residential water billing data for FY 2018-19. Note that actual single familycustomer impacts in FY 2021-22 may vary based on each customer’s water use characteristics during wintermonths versus the entire year.
Figure 6-2: Single Family Residential Monthly Wastewater Bill Impacts (FY 2021-22)
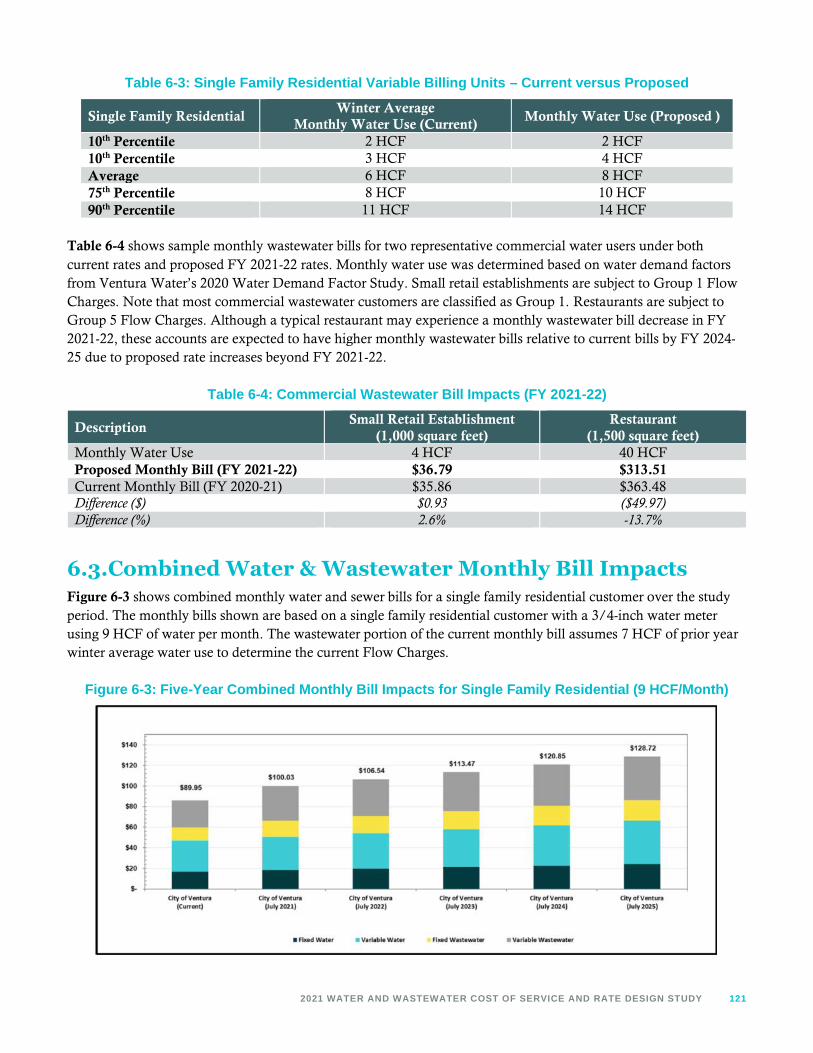
2021 WATER AND WASTEWATER COST OF SERVICE AND RATE DESIGN STUDY 121
Table 6-3: Single Family Residential Variable Billing Units – Current versus Proposed
Single Family ResidentialWinter Average
Monthly Water Use (Current)Monthly Water Use (Proposed )
10th Percentile 2 HCF 2 HCF10th Percentile 3 HCF 4 HCFAverage 6 HCF 8 HCF75th Percentile 8 HCF 10 HCF90th Percentile 11 HCF 14 HCF
Table 6-4 shows sample monthly wastewater bills for two representative commercial water users under bothcurrent rates and proposed FY 2021-22 rates. Monthly water use was determined based on water demand factorsfrom Ventura Water’s 2020 Water Demand Factor Study. Small retail establishments are subject to Group 1 FlowCharges. Note that most commercial wastewater customers are classified as Group 1. Restaurants are subject toGroup 5 Flow Charges. Although a typical restaurant may experience a monthly wastewater bill decrease in FY2021-22, these accounts are expected to have higher monthly wastewater bills relative to current bills by FY 2024-25 due to proposed rate increases beyond FY 2021-22.
Table 6-4: Commercial Wastewater Bill Impacts (FY 2021-22)
DescriptionSmall Retail Establishment
(1,000 square feet)Restaurant
(1,500 square feet)Monthly Water Use 4 HCF 40 HCFProposed Monthly Bill (FY 2021-22) $36.79 $313.51Current Monthly Bill (FY 2020-21) $35.86 $363.48Difference ($) $0.93 ($49.97)Difference (%) 2.6% -13.7%
6.3.Combined Water & Wastewater Monthly Bill ImpactsFigure 6-3 shows combined monthly water and sewer bills for a single family residential customer over the studyperiod. The monthly bills shown are based on a single family residential customer with a 3/4-inch water meterusing 9 HCF of water per month. The wastewater portion of the current monthly bill assumes 7 HCF of prior yearwinter average water use to determine the current Flow Charges.
Figure 6-3: Five-Year Combined Monthly Bill Impacts for Single Family Residential (9 HCF/Month)

122 VENTURA WATER
6.4.Combined Water & Wastewater Monthly Bill ComparisonsFigure 6-4 shows a comparison of sample single family residential combined monthly water and wastewater bills with neighboring utilities. All bills arecalculated based on a 3/4-inch water meter size and monthly water use of 9 HCF. The wastewater portion of the current monthly bill assumes 7 HCF ofwinter average monthly water use. Estimated monthly bills based on both Ventura Water’s current FY 2020-21 and proposed FY 2021-22 water andwastewater rates are lower than most other agency bills at current FY 2020-21 rates.
Figure 6-4: Combined Monthly Bill Comparison for Single Family Residential (9 HCF/Month)

2021 WATER AND WASTEWATER COST OF SERVICE AND RATE DESIGN STUDY 123
7.Appendix A:VenturaWaterPure
7.1.VenturaWaterPure BackgroundVentura Water faces significant regulatory challenges related to discharge of wastewater from its wastewatertreatment plant (the Ventura Water Reclamation Facility) into the Santa Clara River Estuary. The Consent Decreerequires reduction in discharge to the Estuary and requires that no less than 50 percent of treated effluent be put tobeneficial use. Reducing discharge to the Estuary and beneficially reusing the water is also a requirement of theVWRF NPDES Permit, the Water Quality Control Policy for the Enclosed Bays and Estuaries of California, andCalifornia’s Recycled Water Policy. This information is detailed further in the Ventura Water Supply ProjectsFinal Environmental Impact Report, which was certified by the Ventura City Council in October 2019.
The proposed solution is the VenturaWaterPure Program which will significantly reduce treated wastewaterdischarges to the Estuary and divert them to a new Advanced Water Purification Facility for indirect potable reuse.Indirect potable reuse refers to the process of taking tertiary treated wastewater and purifying it through anadditional multi-step treatment regime to meet drinking water standards before injecting the purified water into thegroundwater basin to augment the potable water supply. Injection into and residence time in the groundwater basinresults in additional filtration and purification. Once the water is pumped from groundwater wells, it must then betreated and blended with other supplies before delivery to water customers. The concentrate (brine) byproduct ofthe advanced treatment process will require the construction of a brine line and ocean outfall.
VenturaWaterPure is a multi-benefit program that benefits both the water system by increasing local reliability ofthe groundwater supplies for current and future users, providing a drought-resilient water supply source, andimproving water system water quality; and for the wastewater system by addressing the multiple regulatory andlegal mandates of wastewater discharge and reuse. Raftelis recommends that VenturaWaterPure operating andcapital costs be shared by the Water and Wastewater Enterprises based on the relative benefit to each enterprise.
All VenturaWaterPure operating costs, capital costs, and debt financing figures shown in this appendix arepreliminary estimates based on the best available information at the time of this study. Actual project costs andtiming may deviate from the projections presented in this study. However, it is necessary to incorporate reasonablecost estimates and the most likely financing strategy now due to the significant long-term costs that the project willimpose, beginning in the current fiscal year.
7.2.VenturaWaterPure Capital CostsVenturaWaterPure construction is separated into two phases: Phase 1A and Phase 1B. The projections presented inthis appendix assume that VenturaWaterPure will become operational in FY 2025-26 upon completion of Phase1A. Phase 1B consists of additional capital projects to be completed between FY 2026-27 and FY 2031-32,assuming VenturaWaterPure begins operations in FY 2025-26. Total VenturaWaterPure capital project coststhrough FY 2031-32 are projected at $259.1M (see Table 7-1 for details) and consist of the following projects:
» Advanced Water Purification Facility (AWPF): a new facility to treat tertiary treated wastewater effluentfrom the Ventura Water Reclamation Facility (VWRF) to higher water quality standards
» Land: land acquisitions required to site the AWPF
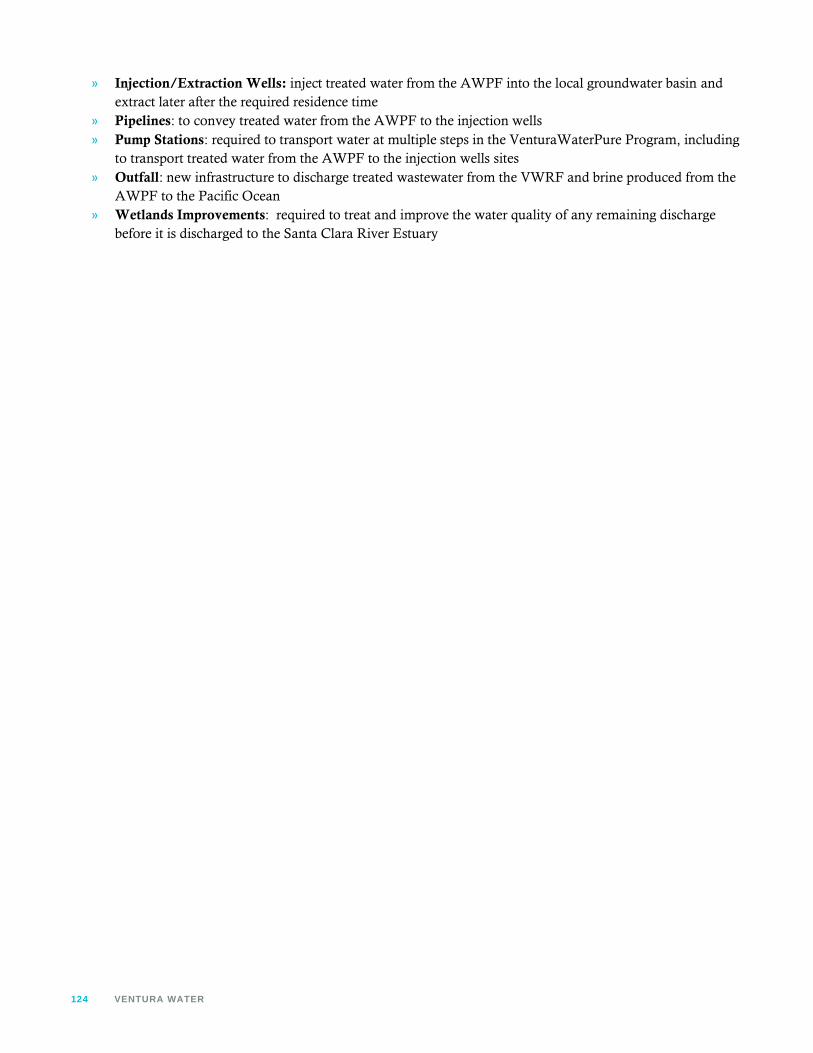
124 VENTURA WATER
» Injection/Extraction Wells: inject treated water from the AWPF into the local groundwater basin andextract later after the required residence time
» Pipelines: to convey treated water from the AWPF to the injection wells» Pump Stations: required to transport water at multiple steps in the VenturaWaterPure Program, including
to transport treated water from the AWPF to the injection wells sites» Outfall: new infrastructure to discharge treated wastewater from the VWRF and brine produced from the
AWPF to the Pacific Ocean» Wetlands Improvements: required to treat and improve the water quality of any remaining discharge
before it is discharged to the Santa Clara River Estuary

2021 WATER AND WASTEWATER COST OF SERVICE AND RATE DESIGN STUDY 125
Table 7-1: VenturaWaterPure Capital Costs
Fiscal Year
Injection/Extraction
Wells(97934)
PumpStations(73122)
AWPF(96945)
Pipeline(96940)
WetlandsImprovements
(96939)
Outfall(96938)
Land(96935)
Year Total
FY 2019-20 $159,000 $0 $2,050,000 $240,000 $230,000 $350,000 $65,000 $3,094,000FY 2020-21 $700,000 $75,000 $1,450,000 $950,000 $0 $750,000 $200,000 $4,125,000FY 2021-22 $1,000,000 $500,000 $5,000,000 $1,600,000 $0 $1,900,000 $4,735,000 $14,735,000FY 2022-23 $2,000,000 $700,000 $7,000,000 $2,000,000 $0 $2,500,000 $0 $14,200,000FY 2023-24 $2,500,000 $700,000 $7,000,000 $2,000,000 $0 $2,500,000 $0 $14,700,000FY 2024-25 $11,500,000 $3,400,000 $42,000,000 $12,000,000 $0 $14,000,000 $0 $82,900,000FY 2025-26 $11,500,000 $3,400,000 $42,000,000 $12,000,000 $0 $14,000,000 $0 $82,900,000FY 2026-27 $1,600,000 $300,000 $1,500,000 $0 $0 $0 $0 $3,400,000FY 2027-28 $1,600,000 $300,000 $1,500,000 $0 $0 $0 $0 $3,400,000FY 2028-29 $5,700,000 $1,100,000 $5,000,000 $0 $0 $0 $0 $11,800,000FY 2029-30 $5,700,000 $1,100,000 $5,000,000 $0 $500,000 $0 $0 $12,300,000FY 2030-31 $0 $0 $0 $0 $500,000 $0 $0 $500,000FY 2031-32 $0 $0 $0 $0 $11,070,000 $0 $0 $11,070,000Project Total $43,959,000 $11,575,000 $119,500,000 $30,790,000 $12,300,000 $36,000,000 $5,000,000 $259,124,000

126 VENTURA WATER
7.3.VenturaWaterPure Capital Financing PlanVentura Water is pursuing multiple funding sources for VenturaWaterPure capital projects. Debt financing options include a Water InfrastructureFinance and Innovation Act (WIFIA) loan, Clean Water State Revolving Fund (SRF) loan, and revenue bonds. The WIFIA program acceleratesinvestment in the nation’s infrastructure by providing long-term, low-cost supplemental loans for regionally and nationally significant projects. In 2020,Ventura Water submitted a letter of interest for a WIFIA loan for VenturaWaterPure. In January 2021, the U.S. Environmental Protection Agencyannounced that VenturaWaterPure was officially selected for Ventura Water to apply for up to a $125 million loan. Ventura Water will be submittingthe WIFIA application for VenturaWaterPure later in 2021. Additional funding sources include grants and rates/reserves (pay-as-you-go). Raftelisworked with Ventura Water staff to develop a funding scenario for incorporating into the ten-year financial plans and the rate study.
Table 7-2 shows debt financing assumptions for each type of instrument used. The assumptions include interest rate, the term of the financing, any costsof issuance, and notes on specific repayment or modeling assumptions for individual instruments. For example, not only do WIFIA and SRF loans havefavorable terms, but also allow for deferred repayment corresponding to substantial completion of the project. The financing strategy most likely to beused to fund Phase 1B construction is difficult to project at this time. Therefore, Phase 1B debt assumptions represent an averaging of SRF and revenuebond assumptions.
Table 7-2: VenturaWaterPure Debt Financing Assumptions
Funding OptionsInterest
RateTerm
(Years)Issuance
CostsNotes
WIFIA Loans 2.0% 35 0.0% Principal repayment begins one year after completion of Phase 1A constructionSRF Loans 2.0% 30 0.0% Principal repayment begins one year after completion of Phase 1A constructionRevenue Bonds 5.0% 30 2.0% Assumes level principal plus interest payments each year over life of loanPhase 1B Debt 3.5% 30 2.0% Principal repayment begins one year after completion of Phase 1B construction

2021 WATER AND WASTEWATER COST OF SERVICE AND RATE DESIGN STUDY 127
Table 7-3 shows assumed use of funds, by source, for VenturaWaterPure capital costs in each year. Raftelis developed this funding scenario based oninput and direction from City staff.
Table 7-3: VenturaWaterPure Capital Funding Sources
Fiscal Year GrantsWIFIA Loan
ProceedsSRF LoanProceeds
Revenue BondProceeds
Phase 1B DebtProceeds
Pay-as-you-go Year Total
FY 2019-20 $0 $0 $0 $0 $0 $3,094,000 $3,094,000FY 2020-21 $0 $0 $0 $0 $0 $4,125,000 $4,125,000FY 2021-22 $0 $10,000,000 $0 $0 $0 $4,735,000 $14,735,000FY 2022-23 $0 $14,200,000 $0 $0 $0 $0 $14,200,000FY 2023-24 $0 $14,700,000 $0 $0 $0 $0 $14,700,000FY 2024-25 $0 $64,697,760 $8,202,240 $0 $0 $0 $82,900,000FY 2025-26 $10,000,000 $0 $57,339,200 $15,560,800 $0 $0 $82,900,000FY 2026-27 $10,000,000 $0 $0 $0 $3,400,000 $0 $3,400,000FY 2027-28 $0 $0 $0 $0 $3,400,000 $0 $3,400,000FY 2028-29 $0 $0 $0 $0 $11,800,000 $0 $11,800,000FY 2029-30 $0 $0 $0 $0 $11,800,000 $500,000 $12,300,000FY 2030-31 $0 $0 $0 $0 $0 $500,000 $500,000FY 2031-32 $0 $0 $0 $0 $0 $11,070,000 $11,070,000Total $20,000,000 $103,597,760 $65,541,440 $15,560,800 $30,400,000 $24,024,000 $259,124,000
Table 7-4 summarizes total VenturaWaterPure capital costs by funding source.
Table 7-4: VenturaWaterPure Funding Summary
Funding Summary Total Amount % of TotalGrants $20,000,000 7.7%WIFIA Loan $103,597,760 40.0%SRF Loan $65,541,440 25.3%Bonds $15,560,800 6.0%Phase 1B Loans $30,400,000 11.7%PAYGO $24,024,000 9.3%Total $259,124,000 100.0%
Table 7-5 shows the projected debt (or loan) service for each instrument in Phase 1A, the assumed funding mix in Phase 1B, and pay-as-you-go funding.The individual debt services and repayment schedules are calculated by the Raftelis Excel Model using the terms and assumptions previously discussed.Debt service is inclusive of principal and interest as well as deferred repayments and capitalized interest.

128 VENTURA WATER
Table 7-5: VenturaWaterPure Financing Costs
Fiscal YearWIFIA
Debt ServiceSRF
Debt ServiceBond
Debt ServicePhase 1B
Debt ServicePay-as-you-
goYear Total
FY 2019-20 $0 $0 $0 $0 $3,094,000 $3,094,000FY 2020-21 $0 $0 $0 $0 $4,125,000 $4,125,000FY 2021-22 $200,000 $0 $0 $0 $4,735,000 $4,935,000FY 2022-23 $484,000 $0 $0 $0 $0 $484,000FY 2023-24 $778,000 $0 $0 $0 $0 $778,000FY 2024-25 $2,071,955 $164,045 $0 $0 $0 $2,236,000FY 2025-26 $2,071,955 $1,310,829 $1,032,911 $0 $0 $4,415,695FY 2026-27 $4,144,139 $2,926,420 $1,032,911 $1,085,714 $0 $9,189,184FY 2027-28 $4,144,139 $2,926,420 $1,032,911 $1,085,714 $0 $9,189,184FY 2028-29 $4,144,139 $2,926,420 $1,032,911 $1,085,714 $0 $9,189,184FY 2029-30 $4,144,139 $2,926,420 $1,032,911 $1,085,714 $500,000 $9,689,184FY 2030-31 $4,144,139 $2,926,420 $1,032,911 $1,686,621 $500,000 $10,290,091FY 2031-32 $4,144,139 $2,926,420 $1,032,911 $1,686,621 $11,070,000 $20,860,091FY 2032-33 $4,144,139 $2,926,420 $1,032,911 $1,686,621 $0 $9,790,091FY 2033-34 $4,144,139 $2,926,420 $1,032,911 $1,686,621 $0 $9,790,091FY 2034-35 $4,144,139 $2,926,420 $1,032,911 $1,686,621 $0 $9,790,091FY 2035-36 $4,144,139 $2,926,420 $1,032,911 $1,686,621 $0 $9,790,091FY 2036-37 $4,144,139 $2,926,420 $1,032,911 $1,686,621 $0 $9,790,091FY 2037-38 $4,144,139 $2,926,420 $1,032,911 $1,686,621 $0 $9,790,091FY 2038-39 $4,144,139 $2,926,420 $1,032,911 $1,686,621 $0 $9,790,091FY 2039-40 $4,144,139 $2,926,420 $1,032,911 $1,686,621 $0 $9,790,091FY 2040-41 $4,144,139 $2,926,420 $1,032,911 $1,686,621 $0 $9,790,091FY 2041-42 $4,144,139 $2,926,420 $1,032,911 $1,686,621 $0 $9,790,091FY 2042-43 $4,144,139 $2,926,420 $1,032,911 $1,686,621 $0 $9,790,091FY 2043-44 $4,144,139 $2,926,420 $1,032,911 $1,686,621 $0 $9,790,091FY 2044-45 $4,144,139 $2,926,420 $1,032,911 $1,686,621 $0 $9,790,091FY 2045-46 $4,144,139 $2,926,420 $1,032,911 $1,686,621 $0 $9,790,091FY 2046-47 $4,144,139 $2,926,420 $1,032,911 $1,686,621 $0 $9,790,091FY 2047-48 $4,144,139 $2,926,420 $1,032,911 $1,686,621 $0 $9,790,091FY 2048-49 $4,144,139 $2,926,420 $1,032,911 $1,686,621 $0 $9,790,091FY 2049-50 $4,144,139 $2,926,420 $1,032,911 $1,686,621 $0 $9,790,091FY 2050-51 $4,144,139 $2,926,420 $1,032,911 $1,686,621 $0 $9,790,091FY 2051-52 $4,144,139 $2,926,420 $1,032,911 $1,686,621 $0 $9,790,091FY 2052-53 $4,144,139 $2,926,420 $1,032,911 $1,686,621 $0 $9,790,091FY 2053-54 $4,144,139 $2,926,420 $1,032,911 $1,686,621 $0 $9,790,091FY 2054-55 $4,144,139 $2,926,420 $1,032,911 $1,686,621 $0 $9,790,091FY 2055-56 $4,144,139 $2,926,420 $0 $1,686,621 $0 $8,757,180FY 2056-57 $4,144,139 $0 $0 $1,686,621 $0 $5,830,760FY 2057-58 $4,144,139 $0 $0 $1,686,621 $0 $5,830,760FY 2058-59 $4,144,139 $0 $0 $1,686,621 $0 $5,830,760FY 2059-60 $4,144,139 $0 $0 $1,686,621 $0 $5,830,760FY 2060-61 $4,144,139 $0 $0 $0 $0 $4,144,139Total $150,650,785 $89,267,480 $30,987,317 $54,941,484 $24,024,000 $349,871,066

2021 WATER AND WASTEWATER COST OF SERVICE AND RATE DESIGN STUDY 129
7.4.VenturaWaterPure Capital Cost AllocationVenturaWaterPure provides benefits to both the water and wastewater systems and is therefore proposed to be jointly funded. We developed severalrationales for allocating a project component, for example, based on the length of pipeline benefiting each enterprise. Raftelis worked with VenturaWater staff to equitably allocate capital costs between the Water and Wastewater Enterprises based on the most appropriate rationale. Table 7-6 showsthe proposed allocation basis used to allocate each component of the VenturaWaterPure Program capital projects between the Water Enterprise andWastewater Enterprise. Two of the project components wholly benefit one enterprise and are therefore allocated 100 percent to either water orwastewater. The result is a percentage allocation attributable to each enterprise. This percentage is used as the basis to allocate the future debt and loanservice costs (modified to account for PAYGO capital costs) as well as for future VenturaWaterPure O&M costs.
Table 7-6: VenturaWaterPure Capital Cost Allocation Basis
VenturaWaterPureCapital Projects
Allocation BasisWater
Allocation(%)
WastewaterAllocation
(%)
WaterAllocation
($)
WastewaterAllocation
($)
Total($)
Injection/ExtractionWells (97934)
Relates to Water Enterprise only 100.0% 0.0% $43,959,000 $0 $43,959,000
Pump Stations(73122)
Share of pumping stations benefiting WaterEnterprise versus Wastewater Enterprise 50.0% 50.0% $5,787,500 $5,787,500 $11,575,000
AWPF (96945)Minimum of 50% of wastewater dischargemust be put to beneficial use 50.0% 50.0% $59,750,000 $59,750,000 $119,500,000
Pipeline (96940)Length of pipelines benefiting WaterEnterprise versus Wastewater Enterprise 67.0% 33.0% $20,629,300 $10,160,700 $30,790,000
Wetlands Improve-ments (96939)
Relates to Wastewater Enterprise only 0.0% 100.0% $0 $12,300,000 $12,300,000
Outfall (96938)Share of required outfall flow associated withAWPF versus VWRF 50.0% 50.0% $18,000,000 $18,000,000 $36,000,000
Land (96935) Same as AWPF 50.0% 50.0% $2,500,000 $2,500,000 $5,000,000Total 58.1% 41.9% $150,625,800 $108,498,200 $259,124,000

130 VENTURA WATER
Table 7-7 shows the proposed allocation of VenturaWaterPure capital project costs to the Water Enterprise based on the allocation basis defined inTable 7-6.
Table 7-7: VenturaWaterPure Capital Cost Allocation to Water Enterprise
Fiscal Year
Injection/Extraction
Wells(97934)
PumpStations(73122)
AWPF(96945)
Pipeline(96940)
Wetlands(96939)
Outfall(96938)
Land(96935)
Year Total
FY 2019-20 $159,000 $0 $1,025,000 $160,800 $0 $175,000 $32,500 $1,552,300FY 2020-21 $700,000 $37,500 $725,000 $636,500 $0 $375,000 $100,000 $2,574,000FY 2021-22 $1,000,000 $250,000 $2,500,000 $1,072,000 $0 $950,000 $2,367,500 $8,139,500FY 2022-23 $2,000,000 $350,000 $3,500,000 $1,340,000 $0 $1,250,000 $0 $8,440,000FY 2023-24 $2,500,000 $350,000 $3,500,000 $1,340,000 $0 $1,250,000 $0 $8,940,000FY 2024-25 $11,500,000 $1,700,000 $21,000,000 $8,040,000 $0 $7,000,000 $0 $49,240,000FY 2025-26 $11,500,000 $1,700,000 $21,000,000 $8,040,000 $0 $7,000,000 $0 $49,240,000FY 2026-27 $1,600,000 $150,000 $750,000 $0 $0 $0 $0 $2,500,000FY 2027-28 $1,600,000 $150,000 $750,000 $0 $0 $0 $0 $2,500,000FY 2028-29 $5,700,000 $550,000 $2,500,000 $0 $0 $0 $0 $8,750,000FY 2029-30 $5,700,000 $550,000 $2,500,000 $0 $0 $0 $0 $8,750,000FY 2030-31 $0 $0 $0 $0 $0 $0 $0 $0FY 2031-32 $0 $0 $0 $0 $0 $0 $0 $0Project Total $43,959,000 $5,787,500 $59,750,000 $20,629,300 $0 $18,000,000 $2,500,000 $150,625,800

2021 WATER AND WASTEWATER COST OF SERVICE AND RATE DESIGN STUDY 131
Table 7-8 shows the proposed allocation of VenturaWaterPure capital project costs to the Wastewater Enterprise based on the allocation basis defined inTable 7-6.
Table 7-8: VenturaWaterPure Capital Cost Allocation to Wastewater Enterprise
Fiscal Year
Injection/Extraction
Wells(97934)
PumpStations(73122)
AWPF(96945)
Pipeline(96940)
Wetlands(96939)
Outfall(96938)
Land(96935)
Year Total
FY 2019-20 $0 $0 $1,025,000 $79,200 $230,000 $175,000 $32,500 $1,541,700FY 2020-21 $0 $37,500 $725,000 $313,500 $0 $375,000 $100,000 $1,551,000FY 2021-22 $0 $250,000 $2,500,000 $528,000 $0 $950,000 $2,367,500 $6,595,500FY 2022-23 $0 $350,000 $3,500,000 $660,000 $0 $1,250,000 $0 $5,760,000FY 2023-24 $0 $350,000 $3,500,000 $660,000 $0 $1,250,000 $0 $5,760,000FY 2024-25 $0 $1,700,000 $21,000,000 $3,960,000 $0 $7,000,000 $0 $33,660,000FY 2025-26 $0 $1,700,000 $21,000,000 $3,960,000 $0 $7,000,000 $0 $33,660,000FY 2026-27 $0 $150,000 $750,000 $0 $0 $0 $0 $900,000FY 2027-28 $0 $150,000 $750,000 $0 $0 $0 $0 $900,000FY 2028-29 $0 $550,000 $2,500,000 $0 $0 $0 $0 $3,050,000FY 2029-30 $0 $550,000 $2,500,000 $0 $500,000 $0 $0 $3,550,000FY 2030-31 $0 $0 $0 $0 $500,000 $0 $0 $500,000FY 2031-32 $0 $0 $0 $0 $11,070,000 $0 $0 $11,070,000Project Total $0 $5,787,500 $59,750,000 $10,160,700 $12,300,000 $18,000,000 $2,500,000 $108,498,200
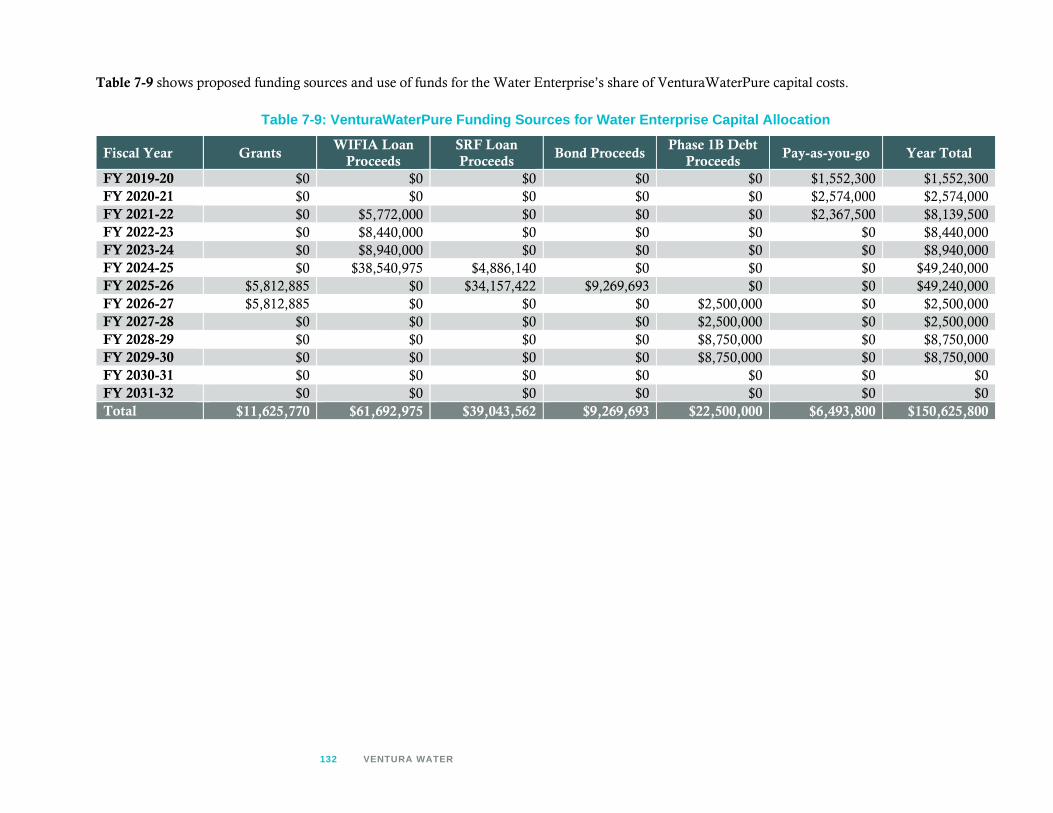
132 VENTURA WATER
Table 7-9 shows proposed funding sources and use of funds for the Water Enterprise’s share of VenturaWaterPure capital costs.
Table 7-9: VenturaWaterPure Funding Sources for Water Enterprise Capital Allocation
Fiscal Year GrantsWIFIA Loan
ProceedsSRF LoanProceeds
Bond ProceedsPhase 1B Debt
ProceedsPay-as-you-go Year Total
FY 2019-20 $0 $0 $0 $0 $0 $1,552,300 $1,552,300FY 2020-21 $0 $0 $0 $0 $0 $2,574,000 $2,574,000FY 2021-22 $0 $5,772,000 $0 $0 $0 $2,367,500 $8,139,500FY 2022-23 $0 $8,440,000 $0 $0 $0 $0 $8,440,000FY 2023-24 $0 $8,940,000 $0 $0 $0 $0 $8,940,000FY 2024-25 $0 $38,540,975 $4,886,140 $0 $0 $0 $49,240,000FY 2025-26 $5,812,885 $0 $34,157,422 $9,269,693 $0 $0 $49,240,000FY 2026-27 $5,812,885 $0 $0 $0 $2,500,000 $0 $2,500,000FY 2027-28 $0 $0 $0 $0 $2,500,000 $0 $2,500,000FY 2028-29 $0 $0 $0 $0 $8,750,000 $0 $8,750,000FY 2029-30 $0 $0 $0 $0 $8,750,000 $0 $8,750,000FY 2030-31 $0 $0 $0 $0 $0 $0 $0FY 2031-32 $0 $0 $0 $0 $0 $0 $0Total $11,625,770 $61,692,975 $39,043,562 $9,269,693 $22,500,000 $6,493,800 $150,625,800

2021 WATER AND WASTEWATER COST OF SERVICE AND RATE DESIGN STUDY 133
Table 7-10 shows proposed funding sources and use of funds for the Wastewater Enterprise’s share of VenturaWaterPure capital costs.
Table 7-10: VenturaWaterPure Funding Sources for Wastewater Enterprise Capital Allocation
Fiscal Year GrantsWIFIA Loan
ProceedsSRF LoanProceeds
Bond ProceedsPhase 1B Debt
ProceedsPay-as-you-go Year Total
FY 2019-20 $0 $0 $0 $0 $0 $1,541,700 $1,541,700FY 2020-21 $0 $0 $0 $0 $0 $1,551,000 $1,551,000FY 2021-22 $0 $4,228,000 $0 $0 $0 $2,367,500 $6,595,500FY 2022-23 $0 $5,760,000 $0 $0 $0 $0 $5,760,000FY 2023-24 $0 $5,760,000 $0 $0 $0 $0 $5,760,000FY 2024-25 $0 $26,156,785 $3,316,100 $0 $0 $0 $33,660,000FY 2025-26 $4,187,115 $0 $23,181,778 $6,291,107 $0 $0 $33,660,000FY 2026-27 $4,187,115 $0 $0 $0 $900,000 $0 $900,000FY 2027-28 $0 $0 $0 $0 $900,000 $0 $900,000FY 2028-29 $0 $0 $0 $0 $3,050,000 $0 $3,050,000FY 2029-30 $0 $0 $0 $0 $3,050,000 $500,000 $3,550,000FY 2030-31 $0 $0 $0 $0 $0 $500,000 $500,000FY 2031-32 $0 $0 $0 $0 $0 $11,070,000 $11,070,000Total $8,374,230 $41,904,785 $26,497,878 $6,291,107 $7,900,000 $17,530,200 $108,498,200

134 VENTURA WATER
Table 7-11 shows the proposed allocation of debt service between the Water and Wastewater Enterprises based onthe proportion of debt proceeds utilized by each enterprise. A greater proportion of Ventura Water CIP allocated tothe Water Enterprise is assumed to be debt financed. This is due primarily to the assumption that WetlandsImprovements costs (which are allocated entirely to the Wastewater Enterprise) will be funded via pay-as-you-go.Additionally, a majority of Phase 1B CIP is allocated to the Water Enterprise, resulting in an allocation of 74percent of Phase 1B debt service to the Water Enterprise. This is because nearly half of all Phase 1B CIP isassociated with injection/extraction wells, which are allocated entirely to the Water Enterprise.
Table 7-11: VenturaWaterPure Funding Sources for Wastewater Enterprise Capital Allocation
Funding Source[A]
WaterEnterprise
Debt Proceeds[B]
WastewaterEnterprise
Debt Proceeds[C]
Total Proceeds[D]
WaterEnterprise
Debt ServiceAllocation
[E = B ÷ D]
WastewaterEnterprise
Debt ServiceAllocation
[F = C ÷ D]WIFIA Loan $61,692,975 $41,904,785 $103,597,760 59.6% 40.4%SRF Loan $39,043,562 $26,497,878 $65,541,440 59.6% 40.4%Bonds $9,269,693 $6,291,107 $15,560,800 59.6% 40.4%Phase 1B Loan $22,500,000 $7,900,000 $30,400,000 74.0% 26.0%
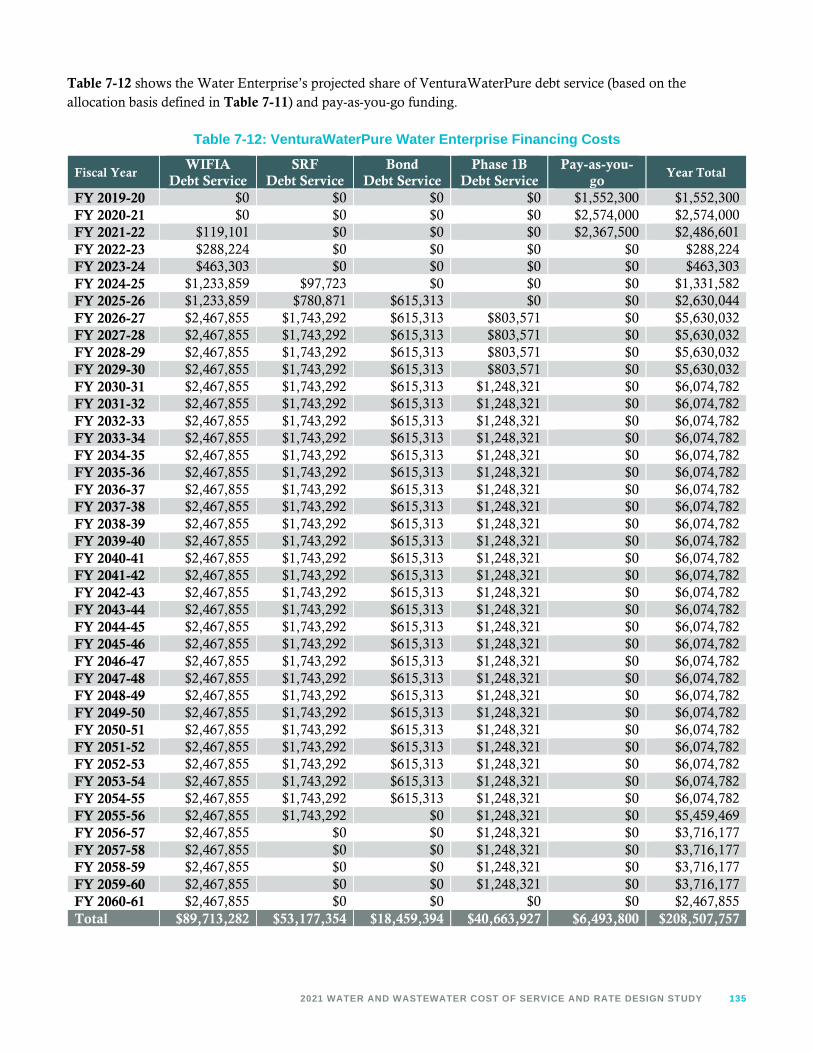
2021 WATER AND WASTEWATER COST OF SERVICE AND RATE DESIGN STUDY 135
Table 7-12 shows the Water Enterprise’s projected share of VenturaWaterPure debt service (based on theallocation basis defined in Table 7-11) and pay-as-you-go funding.
Table 7-12: VenturaWaterPure Water Enterprise Financing Costs
Fiscal YearWIFIA
Debt ServiceSRF
Debt ServiceBond
Debt ServicePhase 1B
Debt ServicePay-as-you-
goYear Total
FY 2019-20 $0 $0 $0 $0 $1,552,300 $1,552,300FY 2020-21 $0 $0 $0 $0 $2,574,000 $2,574,000FY 2021-22 $119,101 $0 $0 $0 $2,367,500 $2,486,601FY 2022-23 $288,224 $0 $0 $0 $0 $288,224FY 2023-24 $463,303 $0 $0 $0 $0 $463,303FY 2024-25 $1,233,859 $97,723 $0 $0 $0 $1,331,582FY 2025-26 $1,233,859 $780,871 $615,313 $0 $0 $2,630,044FY 2026-27 $2,467,855 $1,743,292 $615,313 $803,571 $0 $5,630,032FY 2027-28 $2,467,855 $1,743,292 $615,313 $803,571 $0 $5,630,032FY 2028-29 $2,467,855 $1,743,292 $615,313 $803,571 $0 $5,630,032FY 2029-30 $2,467,855 $1,743,292 $615,313 $803,571 $0 $5,630,032FY 2030-31 $2,467,855 $1,743,292 $615,313 $1,248,321 $0 $6,074,782FY 2031-32 $2,467,855 $1,743,292 $615,313 $1,248,321 $0 $6,074,782FY 2032-33 $2,467,855 $1,743,292 $615,313 $1,248,321 $0 $6,074,782FY 2033-34 $2,467,855 $1,743,292 $615,313 $1,248,321 $0 $6,074,782FY 2034-35 $2,467,855 $1,743,292 $615,313 $1,248,321 $0 $6,074,782FY 2035-36 $2,467,855 $1,743,292 $615,313 $1,248,321 $0 $6,074,782FY 2036-37 $2,467,855 $1,743,292 $615,313 $1,248,321 $0 $6,074,782FY 2037-38 $2,467,855 $1,743,292 $615,313 $1,248,321 $0 $6,074,782FY 2038-39 $2,467,855 $1,743,292 $615,313 $1,248,321 $0 $6,074,782FY 2039-40 $2,467,855 $1,743,292 $615,313 $1,248,321 $0 $6,074,782FY 2040-41 $2,467,855 $1,743,292 $615,313 $1,248,321 $0 $6,074,782FY 2041-42 $2,467,855 $1,743,292 $615,313 $1,248,321 $0 $6,074,782FY 2042-43 $2,467,855 $1,743,292 $615,313 $1,248,321 $0 $6,074,782FY 2043-44 $2,467,855 $1,743,292 $615,313 $1,248,321 $0 $6,074,782FY 2044-45 $2,467,855 $1,743,292 $615,313 $1,248,321 $0 $6,074,782FY 2045-46 $2,467,855 $1,743,292 $615,313 $1,248,321 $0 $6,074,782FY 2046-47 $2,467,855 $1,743,292 $615,313 $1,248,321 $0 $6,074,782FY 2047-48 $2,467,855 $1,743,292 $615,313 $1,248,321 $0 $6,074,782FY 2048-49 $2,467,855 $1,743,292 $615,313 $1,248,321 $0 $6,074,782FY 2049-50 $2,467,855 $1,743,292 $615,313 $1,248,321 $0 $6,074,782FY 2050-51 $2,467,855 $1,743,292 $615,313 $1,248,321 $0 $6,074,782FY 2051-52 $2,467,855 $1,743,292 $615,313 $1,248,321 $0 $6,074,782FY 2052-53 $2,467,855 $1,743,292 $615,313 $1,248,321 $0 $6,074,782FY 2053-54 $2,467,855 $1,743,292 $615,313 $1,248,321 $0 $6,074,782FY 2054-55 $2,467,855 $1,743,292 $615,313 $1,248,321 $0 $6,074,782FY 2055-56 $2,467,855 $1,743,292 $0 $1,248,321 $0 $5,459,469FY 2056-57 $2,467,855 $0 $0 $1,248,321 $0 $3,716,177FY 2057-58 $2,467,855 $0 $0 $1,248,321 $0 $3,716,177FY 2058-59 $2,467,855 $0 $0 $1,248,321 $0 $3,716,177FY 2059-60 $2,467,855 $0 $0 $1,248,321 $0 $3,716,177FY 2060-61 $2,467,855 $0 $0 $0 $0 $2,467,855Total $89,713,282 $53,177,354 $18,459,394 $40,663,927 $6,493,800 $208,507,757

136 VENTURA WATER
Table 7-13 shows the Wastewater Enterprise’s projected share of VenturaWaterPure debt service (based on theallocation basis defined in Table 7-11) and pay-as-you-go funding.
Table 7-13: VenturaWaterPure Wastewater Enterprise Financing Costs
Fiscal YearWIFIA
Debt ServiceSRF
Debt ServiceBond
Debt ServicePhase 1B
Debt ServicePay-as-you-
goYear Total
FY 2019-20 $0 $0 $0 $0 $1,541,700 $1,541,700FY 2020-21 $0 $0 $0 $0 $1,551,000 $1,551,000FY 2021-22 $80,899 $0 $0 $0 $2,367,500 $2,448,399FY 2022-23 $195,776 $0 $0 $0 $0 $195,776FY 2023-24 $314,697 $0 $0 $0 $0 $314,697FY 2024-25 $838,096 $66,322 $0 $0 $0 $904,418FY 2025-26 $838,096 $529,958 $417,597 $0 $0 $1,785,651FY 2026-27 $1,676,284 $1,183,128 $417,597 $282,143 $0 $3,559,153FY 2027-28 $1,676,284 $1,183,128 $417,597 $282,143 $0 $3,559,153FY 2028-29 $1,676,284 $1,183,128 $417,597 $282,143 $0 $3,559,153FY 2029-30 $1,676,284 $1,183,128 $417,597 $282,143 $500,000 $4,059,153FY 2030-31 $1,676,284 $1,183,128 $417,597 $438,300 $500,000 $4,215,309FY 2031-32 $1,676,284 $1,183,128 $417,597 $438,300 $11,070,000 $14,785,309FY 2032-33 $1,676,284 $1,183,128 $417,597 $438,300 $0 $3,715,309FY 2033-34 $1,676,284 $1,183,128 $417,597 $438,300 $0 $3,715,309FY 2034-35 $1,676,284 $1,183,128 $417,597 $438,300 $0 $3,715,309FY 2035-36 $1,676,284 $1,183,128 $417,597 $438,300 $0 $3,715,309FY 2036-37 $1,676,284 $1,183,128 $417,597 $438,300 $0 $3,715,309FY 2037-38 $1,676,284 $1,183,128 $417,597 $438,300 $0 $3,715,309FY 2038-39 $1,676,284 $1,183,128 $417,597 $438,300 $0 $3,715,309FY 2039-40 $1,676,284 $1,183,128 $417,597 $438,300 $0 $3,715,309FY 2040-41 $1,676,284 $1,183,128 $417,597 $438,300 $0 $3,715,309FY 2041-42 $1,676,284 $1,183,128 $417,597 $438,300 $0 $3,715,309FY 2042-43 $1,676,284 $1,183,128 $417,597 $438,300 $0 $3,715,309FY 2043-44 $1,676,284 $1,183,128 $417,597 $438,300 $0 $3,715,309FY 2044-45 $1,676,284 $1,183,128 $417,597 $438,300 $0 $3,715,309FY 2045-46 $1,676,284 $1,183,128 $417,597 $438,300 $0 $3,715,309FY 2046-47 $1,676,284 $1,183,128 $417,597 $438,300 $0 $3,715,309FY 2047-48 $1,676,284 $1,183,128 $417,597 $438,300 $0 $3,715,309FY 2048-49 $1,676,284 $1,183,128 $417,597 $438,300 $0 $3,715,309FY 2049-50 $1,676,284 $1,183,128 $417,597 $438,300 $0 $3,715,309FY 2050-51 $1,676,284 $1,183,128 $417,597 $438,300 $0 $3,715,309FY 2051-52 $1,676,284 $1,183,128 $417,597 $438,300 $0 $3,715,309FY 2052-53 $1,676,284 $1,183,128 $417,597 $438,300 $0 $3,715,309FY 2053-54 $1,676,284 $1,183,128 $417,597 $438,300 $0 $3,715,309FY 2054-55 $1,676,284 $1,183,128 $417,597 $438,300 $0 $3,715,309FY 2055-56 $1,676,284 $1,183,128 $0 $438,300 $0 $3,297,712FY 2056-57 $1,676,284 $0 $0 $438,300 $0 $2,114,583FY 2057-58 $1,676,284 $0 $0 $438,300 $0 $2,114,583FY 2058-59 $1,676,284 $0 $0 $438,300 $0 $2,114,583FY 2059-60 $1,676,284 $0 $0 $438,300 $0 $2,114,583FY 2060-61 $1,676,284 $0 $0 $0 $0 $1,676,284Total $60,937,503 $36,090,126 $12,527,924 $14,277,557 $17,530,200 $141,363,309

2021 WATER AND WASTEWATER COST OF SERVICE AND RATE DESIGN STUDY 137
7.5.VenturaWaterPure Operating CostsNew O&M expenses for VenturaWaterPure operations are minimal prior to commencement of operations in FY2025-26. Additional O&M expenses are projected for additional staffing, equipment, and other resources forVenturaWaterPure operations. Ventura Water staff provided the projected VenturaWaterPure additional O&Mexpenses shown in Table 7-14 and Raftelis worked with staff and the Water Commission to refine the O&Mestimates.
Table 7-14: VenturaWaterPure Additional O&M Expenses
Fiscal Year Salaries BenefitsWorkers
Compensation
Office Supplies,Technology,
Training, etc.
NewVehicles
Year Total
FY 2019-20 $0 $0 $0 $0 $0 $0FY 2020-21 $61,013 $24,782 $189 $0 $0 $85,984FY 2021-22 $255,969 $114,622 $3,384 $92,700 $0 $466,675FY 2022-23 $265,875 $119,058 $3,514 $95,481 $0 $483,929FY 2023-24 $275,267 $123,264 $3,639 $98,345 $0 $500,514FY 2024-25 $284,981 $127,614 $3,767 $101,296 $0 $517,658FY 2025-26 $2,085,083 $892,061 $45,756 $2,839,990 $747,732 $6,610,620FY 2026-27 $2,157,586 $923,079 $47,347 $2,925,189 $0 $6,053,201FY 2027-28 $2,232,610 $955,177 $48,993 $2,988,348 $0 $6,225,128FY 2028-29 $2,310,243 $988,391 $50,697 $3,077,998 $0 $6,427,328FY 2029-30 $2,390,575 $1,022,759 $52,460 $3,170,338 $0 $6,636,132
7.6.VenturaWaterPure Operating Cost AllocationTable 7-15 shows the allocation of projected VenturaWaterPure O&M expenses to each enterprise based on theoverall allocation of total VenturaWaterPure capital project costs (from Table 7-6).
Table 7-15: VenturaWaterPure Additional O&M Expenses
Fiscal YearAdditional WaterEnterprise O&M(58.1% of Total)
Additional WastewaterEnterprise O&M(41.9% of Total)
Total Additional O&M
FY 2019-20 $0 $0 $0FY 2020-21 $49,981 $36,002 $85,984FY 2021-22 $271,273 $195,402 $466,675FY 2022-23 $281,302 $202,627 $483,929FY 2023-24 $290,943 $209,571 $500,514FY 2024-25 $300,908 $216,749 $517,658FY 2025-26 $3,842,678 $2,767,943 $6,610,620FY 2026-27 $3,518,656 $2,534,545 $6,053,201FY 2027-28 $3,618,595 $2,606,533 $6,225,128FY 2028-29 $3,736,132 $2,691,196 $6,427,328FY 2029-30 $3,857,507 $2,778,625 $6,636,132
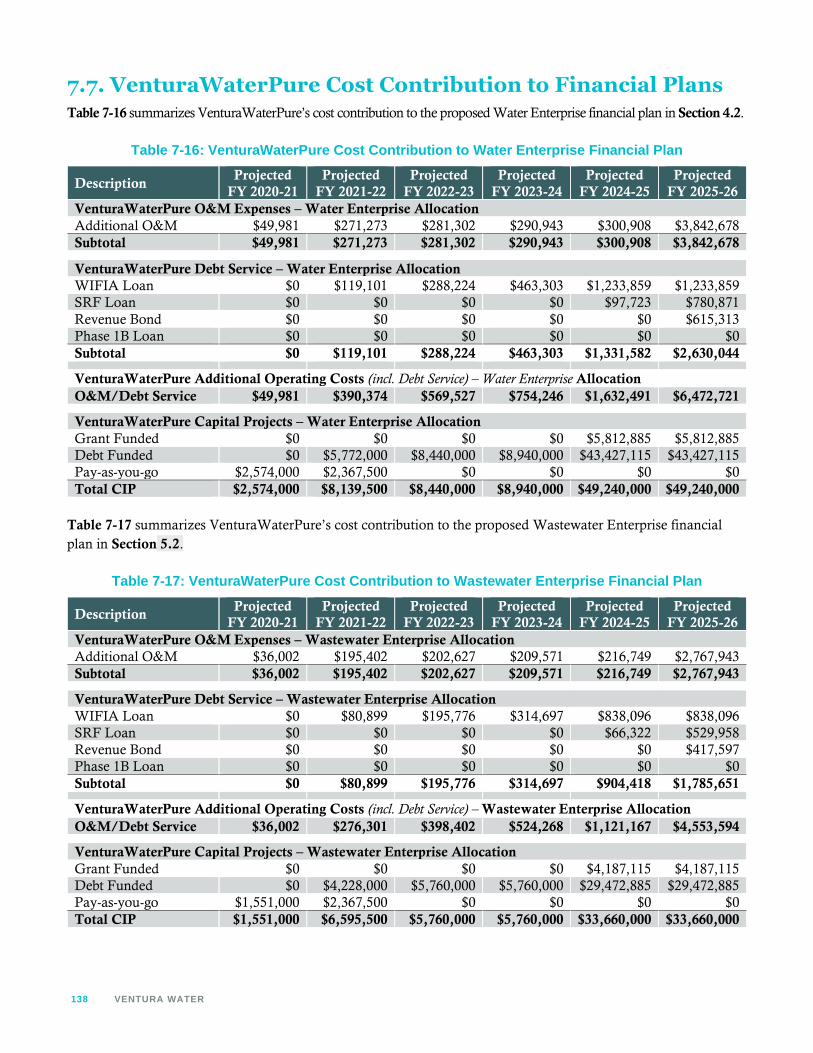
138 VENTURA WATER
7.7. VenturaWaterPure Cost Contribution to Financial PlansTable 7-16 summarizes VenturaWaterPure’s cost contribution to the proposed Water Enterprise financial plan in Section 4.2.
Table 7-16: VenturaWaterPure Cost Contribution to Water Enterprise Financial Plan
DescriptionProjected
FY 2020-21Projected
FY 2021-22Projected
FY 2022-23Projected
FY 2023-24Projected
FY 2024-25Projected
FY 2025-26VenturaWaterPure O&M Expenses – Water Enterprise AllocationAdditional O&M $49,981 $271,273 $281,302 $290,943 $300,908 $3,842,678Subtotal $49,981 $271,273 $281,302 $290,943 $300,908 $3,842,678
VenturaWaterPure Debt Service – Water Enterprise AllocationWIFIA Loan $0 $119,101 $288,224 $463,303 $1,233,859 $1,233,859SRF Loan $0 $0 $0 $0 $97,723 $780,871Revenue Bond $0 $0 $0 $0 $0 $615,313Phase 1B Loan $0 $0 $0 $0 $0 $0Subtotal $0 $119,101 $288,224 $463,303 $1,331,582 $2,630,044
VenturaWaterPure Additional Operating Costs (incl. Debt Service) – Water Enterprise AllocationO&M/Debt Service $49,981 $390,374 $569,527 $754,246 $1,632,491 $6,472,721
VenturaWaterPure Capital Projects – Water Enterprise AllocationGrant Funded $0 $0 $0 $0 $5,812,885 $5,812,885Debt Funded $0 $5,772,000 $8,440,000 $8,940,000 $43,427,115 $43,427,115Pay-as-you-go $2,574,000 $2,367,500 $0 $0 $0 $0Total CIP $2,574,000 $8,139,500 $8,440,000 $8,940,000 $49,240,000 $49,240,000
Table 7-17 summarizes VenturaWaterPure’s cost contribution to the proposed Wastewater Enterprise financialplan in Section 5.2.
Table 7-17: VenturaWaterPure Cost Contribution to Wastewater Enterprise Financial Plan
DescriptionProjected
FY 2020-21Projected
FY 2021-22Projected
FY 2022-23Projected
FY 2023-24Projected
FY 2024-25Projected
FY 2025-26VenturaWaterPure O&M Expenses – Wastewater Enterprise AllocationAdditional O&M $36,002 $195,402 $202,627 $209,571 $216,749 $2,767,943Subtotal $36,002 $195,402 $202,627 $209,571 $216,749 $2,767,943
VenturaWaterPure Debt Service – Wastewater Enterprise AllocationWIFIA Loan $0 $80,899 $195,776 $314,697 $838,096 $838,096SRF Loan $0 $0 $0 $0 $66,322 $529,958Revenue Bond $0 $0 $0 $0 $0 $417,597Phase 1B Loan $0 $0 $0 $0 $0 $0Subtotal $0 $80,899 $195,776 $314,697 $904,418 $1,785,651
VenturaWaterPure Additional Operating Costs (incl. Debt Service) – Wastewater Enterprise AllocationO&M/Debt Service $36,002 $276,301 $398,402 $524,268 $1,121,167 $4,553,594
VenturaWaterPure Capital Projects – Wastewater Enterprise AllocationGrant Funded $0 $0 $0 $0 $4,187,115 $4,187,115Debt Funded $0 $4,228,000 $5,760,000 $5,760,000 $29,472,885 $29,472,885Pay-as-you-go $1,551,000 $2,367,500 $0 $0 $0 $0Total CIP $1,551,000 $6,595,500 $5,760,000 $5,760,000 $33,660,000 $33,660,000

2021 WATER AND WASTEWATER COST OF SERVICE AND RATE DESIGN STUDY 139
8.Appendix B: Ten-Year WaterEnterprise Financial Plan
Raftelis evaluated proposed financial plan options with Ventura Water staff and the Water Commission based on aten-year planning horizon through FY 2029-30. Because the proposed water rate schedule presented in this reportis for the next five fiscal years only, financial plan results shown in Section 4.2 only extend through FY 2025-26 fordisplay purposes and to improve clarity. Appendix B provides ten-year Water Enterprise financial plan projectionsas a supplement. Note that all revenue adjustments and proposed debt issuances (to finance CIP exclusive ofVentura Pure) shown below beyond FY 2025-26 are for planning purposes only and will be revisited during thenext rate study (to establish proposed water rates beyond FY 2025-26).
The ten-year financial projections are based on the same set of assumptions as the five-year financial projectionsand are based on the best data available at the time of this Study. Assumptions become less reliable and moreuncertain over a long time horizon and new and refined data becomes available; additionally Proposition 218 onlyallows agencies to adopt and implement rates for a maximum period of five years. Actual revenue requirements forfiscal years beyond FY 2025-26 will be determined in the next five-year rate study. Depending on actual revenuesand expenses incurred during this five-year rate setting period, projected revenue increases in years 6-10 year maybe able to be reduced from today’s estimates. Items which will impact years 6-10 include future water supply anddemand conditions, actual capital costs incurred, actual cost inflation, future debt terms, as well as future SRF andWIFIA deferral and repayment schedules.
Table 8-1: Ten-Year Water Enterprise Financial Plan Assumptions
Fiscal YearRevenue
AdjustmentProposed Debt Issuance
(excl. VenturaWaterPure)98 Notes
FY 2020-21 N/A $0 Current Fiscal Year
FY 2021-22 7.0% $0 Proposed
FY 2022-23 7.0% $0 Proposed
FY 2023-24 7.0% $0 Proposed
FY 2024-25 7.0% $0 Proposed
FY 2025-26 7.0% $0 Proposed
FY 2026-27 7.0% $15,000,000 For planning purposes only
FY 2027-28 7.0% $0 For planning purposes only
FY 2028-29 7.0% $10,000,000 For planning purposes only
FY 2029-30 7.0% $0 For planning purposes only
98 All proposed debt issuances shown beyond FY 2025-26 are to finance CIP exclusive of VenturaWaterPure. Annualdebt service is estimated based on an assumed 5% interest rate for 30-year bond with 2% issuance costs.
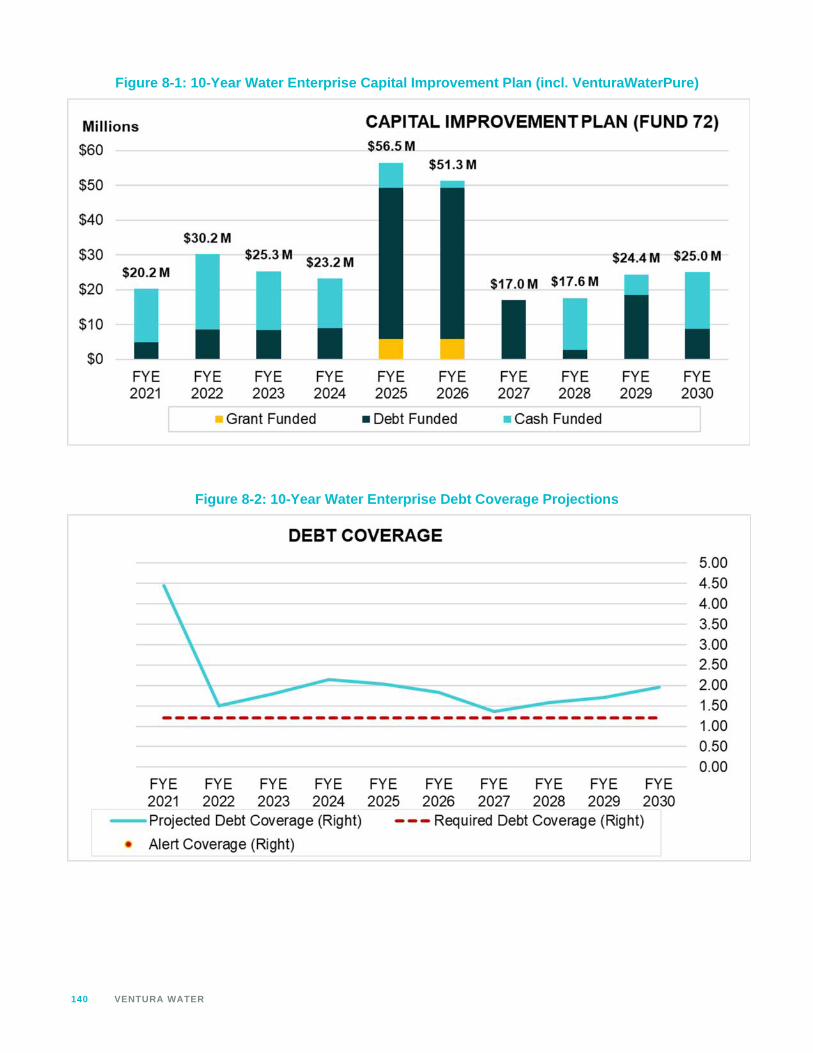
140 VENTURA WATER
Figure 8-1: 10-Year Water Enterprise Capital Improvement Plan (incl. VenturaWaterPure)
Figure 8-2: 10-Year Water Enterprise Debt Coverage Projections

2021 WATER AND WASTEWATER COST OF SERVICE AND RATE DESIGN STUDY 141
Figure 8-3: 10-Year Water Enterprise Projected Ending Balances
Figure 8-4: 10-Year Water Enterprise Operating Financial Plan

142 VENTURA WATER
9.Appendix C: Ten-YearWastewater EnterpriseFinancial Plan
Raftelis evaluated proposed financial plan options with Ventura Water staff and the Water Commission based on aten-year planning horizon through FY 2029-30. Because the proposed wastewater rate schedule presented in thisreport is for the next five fiscal years only, financial plan results shown in Section 5.2 only extend through FY2025-26 for display purposes and to improve clarity. Appendix C provides ten-year Wastewater Enterprisefinancial plan projections as a supplement. Note that all revenue adjustments and proposed debt issuances (tofinance CIP exclusive of Ventura Pure) shown below beyond FY 2025-26 are for planning purposes only, and willbe revisited during the next rate study (to establish proposed wastewater rates beyond FY 2025-26).
The ten-year financial projections are based on the same set of assumptions as the five-year financial projectionsand are based on the best data available at the time of this Study. Assumptions become less reliable and moreuncertain over a long time horizon and new and refined data becomes available; additionally Proposition 218 onlyallows agencies to adopt and implement rates for a maximum period of five years. Actual revenue requirements forfiscal years beyond FY 2025-26 will be determined in the next five-year rate study. Depending on actual revenuesand expenses incurred during this five-year rate setting period, projected revenue increases in years 6-10 year maybe able to be reduced from today’s estimates. Items which will impact years 6-10 include future wastewater flowgeneration, actual capital costs incurred, actual cost inflation, future debt terms, as well as future SRF and WIFIAdeferral and repayment schedules.
Table 9-1: Ten-Year Wastewater Enterprise Financial Plan Assumptions
Fiscal YearRevenue
AdjustmentProposed Debt Issuance
(excl. VenturaWaterPure)99 Notes
FY 2020-21 N/A $0 Current Fiscal Year
FY 2021-22 6.0% $0 Proposed
FY 2022-23 6.0% $0 Proposed
FY 2023-24 6.0% $0 Proposed
FY 2024-25 6.0% $0 Proposed
FY 2025-26 6.0% $0 Proposed
FY 2026-27 6.0% $0 For planning purposes only
FY 2027-28 6.0% $0 For planning purposes only
FY 2028-29 6.0% $0 For planning purposes only
FY 2029-30 6.0% $0 For planning purposes only
99 The ten-year proposed wastewater financial plan projections assume that no new debt will be issued to finance CIP(exclusive of VenturaWaterPure) through FY 2029-30.
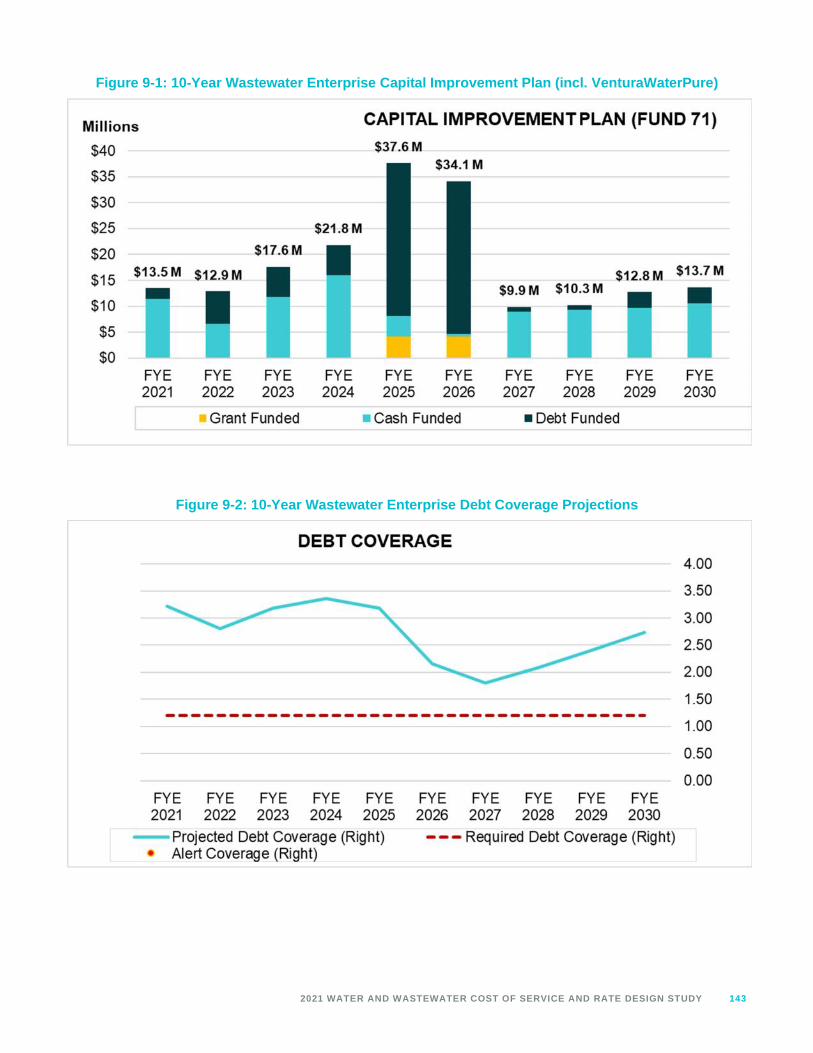
2021 WATER AND WASTEWATER COST OF SERVICE AND RATE DESIGN STUDY 143
Figure 9-1: 10-Year Wastewater Enterprise Capital Improvement Plan (incl. VenturaWaterPure)
Figure 9-2: 10-Year Wastewater Enterprise Debt Coverage Projections

144 VENTURA WATER
Figure 9-3: 10-Year Wastewater Enterprise Projected Ending Balances
Figure 9-4: 10-Year Wastewater Enterprise Operating Financial Plan


![OCTOBER 10 , 2011 [Revision 1] - California State Water ...€¦ · VCAILG MRP 2 April 7, 2011 October 10, 2011 Revision Ventura County Agriculture Ventura County covers 1,843 square](https://static.fdocuments.in/doc/165x107/604cc492ec72ba143b200ede/october-10-2011-revision-1-california-state-water-vcailg-mrp-2-april-7.jpg)