Vastned Q1 2014 update
32
Vastned Focus on growth in premium city high street shop June 2014 Taco de Groot, CEO Vastned
-
Upload
annekehoijtink -
Category
Investor Relations
-
view
56 -
download
0
Transcript of Vastned Q1 2014 update

Vastned Focus on growth in premium city high street shopsJune 2014Taco de Groot, CEO Vastned

Vastned makes significant progress in executing the premium city high street strategy
Occupancy rate increased from 94.0% year-end 2013 to 96.5% end of Q1 2014
Premium city high street shops: 99.1%
High street shops: 95.1% Non-high street shops: 94.0%
Estimated 2014 direct investment result between € 2.10 - € 2.30 per share
2
Divestments increase quality of the portfolio
Total divestments in Q1 2014: € 48.7 million
Sale of Spanish shopping centres/galleries and retail park successfully finalised
Leasing activity includes 31 leases and amounts to € 2.2 million
Share of non-bank loans increased to over 30%
Successful placement of convertible bond of € 110 million

Q1 2014 update: Vastned’s premium city strategy improves occupancy rate

Occupancy rate increases from 94.0% to 96.5%
4
Total portfolio € 1.5 billion
Premium city high
street shops
High street shops
Non-high
street shops
Total
% % % %
The Netherlands 97.8 95.2 95.8 96.1
France 99.9 100 72.9 96.8
Belgium 98.7 89.7 95.2 95.3
Spain/ Portugal 100 100 100 100
Turkey 100 n.a. n.a. 100
Total 99.1 95.1 94.0 96.5

Leasing activity in Q1 2014 amounts to € 2.2 million
Total leasing activity € 2.2 million
A total of 31 lease contracts were signed
On average leasing contracts were signed 4.6% below old rents mainly due to rent declines in shopping centers in Tongeren and Limoges
Premium city high street shop leases at 7.4% higher rents
5
Premium city high street
shops
High street shops
Non-high street shops
Total
Leasing activity € 0.8 million € 0.9 million € 0.5 million € 2.2 million
Change in rent on new and renewed
leases7.4% 6.7% (33.3)% (4.6)%
Leasing activity in Q1 2014

Divestments increase the quality of the portfolio
Total divestments in Q1 2014: € 48.7 million Netherlands: € 0.6 million France: € 45.2 million Belgium: € 2.9 million
On average 2.6% below book value year-end 2013
Share of premium city high street shops increases from 51% to 52%
Occupancy rate improves significantly from 94.0% to 96.5%
6

Divestment Spanish shopping centres/galleries and retail park successfully finalised
Seven shopping centres/galleries and one retail park Average occupancy rate of the sold assets: 84.5% Leasing activity in 2013 on average at 33% lower rents Selling price: € 160 million Net sales proceeds: € 157.9 million
Current Spanish portfolio*: € 63 million Occupancy rate at end Q1 2014: 100%
7
* Including the Portuguese portfolio
Q1 2014 country performance

The Netherlands: Market remains a challenge for retailers
9
Dutch consumer confidence improves slightly but still low
19 leases signed for € 1.1 million: Credo Men’s fashion De Tuinen MANGO
New leases and lease renewals result in 8.7% rent increase
Divestment of non-strategic assets for € 0.6 million
Occupancy rate slightly lower from 96.8% year-end 2013 to 96.1% end Q1 2014
Developments in Q1 2014
Dutch portfolio: € 623 million Year-end 2013

France: Share of premium city high street shops increases to 77%
10
Polarisation in the French retail market
4 leases signed for a total of € 0.1 million, including 2 leases for shopping centre Corgnac in Limoges
Total divestments: € 45.2 million
Occupancy increases from 95.4% year-end 2013 to 96.8% end Q1 2014
Developments in Q1 2014
French portfolio: about € 310 million After divestments in Q1 2014

Belgium: Stable progress
11
Leasing activity € 0.3 million including 7 contracts of which two in shopping centre Julianus in Tongeren
Divestment of non-strategic assets for € 2.9 million
Occupancy rate stable at 95.3% end Q1 2014 (year-end 2013: 95.4%)
Developments in Q1 2014Belgian portfolio: about € 360 million After divestments in Q1 2014

Spain: Focus on premium city high street shops
12
Successful finalisation of the Spanish shopping centres and retail park at the end of Q1 2014
Occupancy rate improves from 86.6% year-end 2013 to 100% end Q1 2014
Developments in Q1 2014
Spanish/Portuguese portfolio: about € 63 million after divestments

Turkey: Stable results Q1 2014
13
Lease renewal with Topshop for Istiklal Caddesi 18 with 4.6% rent increase
Stable occupancy rate at 100%
Developments in Q1 2014
Turkish portfolio: € 129 million Year-end 2013

Strategy update: Focus on growth in premium city high streets

Sharpened high street strategy: Focus on growth in premium cities
Premium city high street shops have the highest preference of retailers and consumers
Premium cities are selected cities with: Positive demographic development Strong purchasing power Historic inner city Tourist destination Presence of national and international
institutions and universities
Growth of high street shops in premium cities to 75% of the total portfolio
15

Strong performance premium city high street shops
In %
Premium city high street
shops
High street shops
Non high street shops Total
Spot occupancy
end Q1 201499.1 95.1 94.0 96.5
2013 Like-for-like rental
growth 4.2 (1.1) (3.6) (1.1)
2013 Value movements* 2.2 (2.0) (13.7) (5.8)
16
* Excluding acquisitions
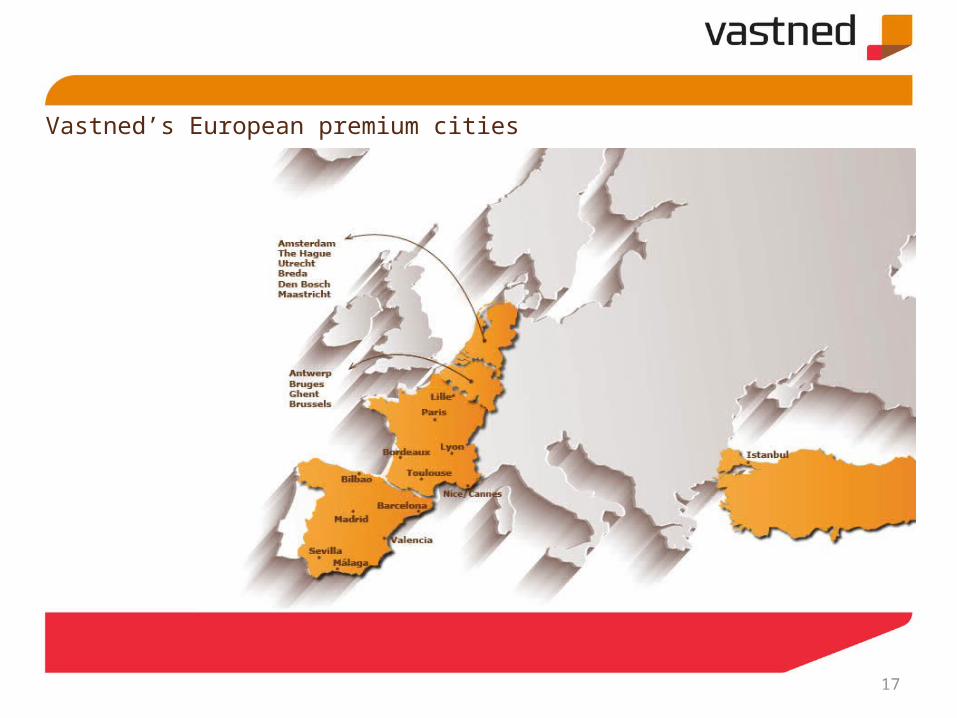
Vastned’s European premium cities
17

Examples of execution of premium city high street strategy

19
Realisation upwards potential: 42% rent increase
P.C. Hooftstraat 49-51
Old tenant New tenant
Old rent € 317,000 per year
Retailer Hugo Boss
New rent € 450,000 per year
Duration 10 years
Rent increase + 42%
RetailersSchaap en Citroen and
IWC Schaffhausen

Vastned increases footprint in historical inner city of Utrecht
20
€ 59 million 17 high street shops
Property portfolio Utrecht

Vastned creates cluster of high street shops in Golden Triangle of Bordeaux
21
€ 84 million 17 high street shops
Property portfolio Bordeaux

2013 financial results

Despite difficult retail market positive like-for-like gross rental growth for premium city high street shops
Premium city high streets
High street other Other Total
portfolio
% % % %
The Netherlands 4.8 (0.6) (3.9) (1.1)
France 3.8 (4.9) 1.0 0.6
Belgium 0.4 1.4 2.0 1.4
Spain/ Portugal 18.8 3.4 (6.8) (4.7)
Turkey 3.3 n.a. n.a. 3.3
Total 4.2 (1.1) (3.6) (1.1)
23

Positive value movements for premium city high street shops in 2013
ValuePremium city high streets
High street other
Other Total
In € million % % % %
The Netherlands 623 1.9 (5.7) (5.3) (3.7)
France 359 1.7 (0.8) (3.1) (0.4)
Belgium 362 8.2 9.6 6.2 7.6
Spain/Portugal 221* 0.6 (4.5) (39.8) (33.2)
Turkey 129 (1.8) n.a. n.a. (1.8)
Total 1.694 2.2 (2.0) (13.7) (5.8)
24
* After the divestment of the seven shopping centres/galleries and the retail park in Spain the value of the portfolio will be € 63 million.

Divestment of non-strategic assets resulted in lower rental income
25
Annualised rent
(€ 1 million)
Annualised
rent e
nd Q4 2012
Loss
of tenan
ts
New Le
ttings
Acquisiti
ons and tr
ansfe
r fro
m pipeline
Divestm
ents
Other
Annualised
rent e
nd Q4 2013
105000000.000
110000000.000
115000000.000
120000000.000
125000000.000
130000000.000
135000000.000
140000000.000
145000000.000
150000000.000
134.6(8.7) 7.8
6.5 (19.2)
0.0 121.0

Strong financial position
26
Roll over 2014 2015 2016 2017 2018 20190
50
100
150
200
250
300
Contract revision by year
Interest revision by year
Average interest rate
1.6%
3.8%
4.9%
4.8%
4.4% 4.2%
4.9%
5.3%
Average interest rate year-end 2013: 4.3%
Interest cover ratio year-end 2013: 2.8
Loan to value: 39.7% after sale Spanish shopping centres/galleries
Significant risk profile improvement
Current unused credit facility more than € 200 million
Total amount of non-bank loans over 30% after placement of € 110 million convertible
2020 ev.
At year-end 2013

Successful placement of convertible bond of € 110 million
Key points: Total placement: € 110 million 30% above reference price Interest coupon: 1.875% Duration: five year
Result: Over 30% non-bank loans Improved negotiation position towards other financiers Contributes to lower average financing costs
27

Net divestments improved quality of the portfolio and reduced direct investment result 2013
In € million FY 2013 FY 2012 Δ
Gross rental income 123.2 133.5 (10.3)
Operating expenses (16.5) (17.8) 1.3
Net financing costs (34.4) (35.9) 1.5
General expenses/taxes (11.3) (10.5) (0.8)
Non-controlling interests (6.8) (6.7) (0.1)
Direct investment result 54.2 62.6 (8.4)
28
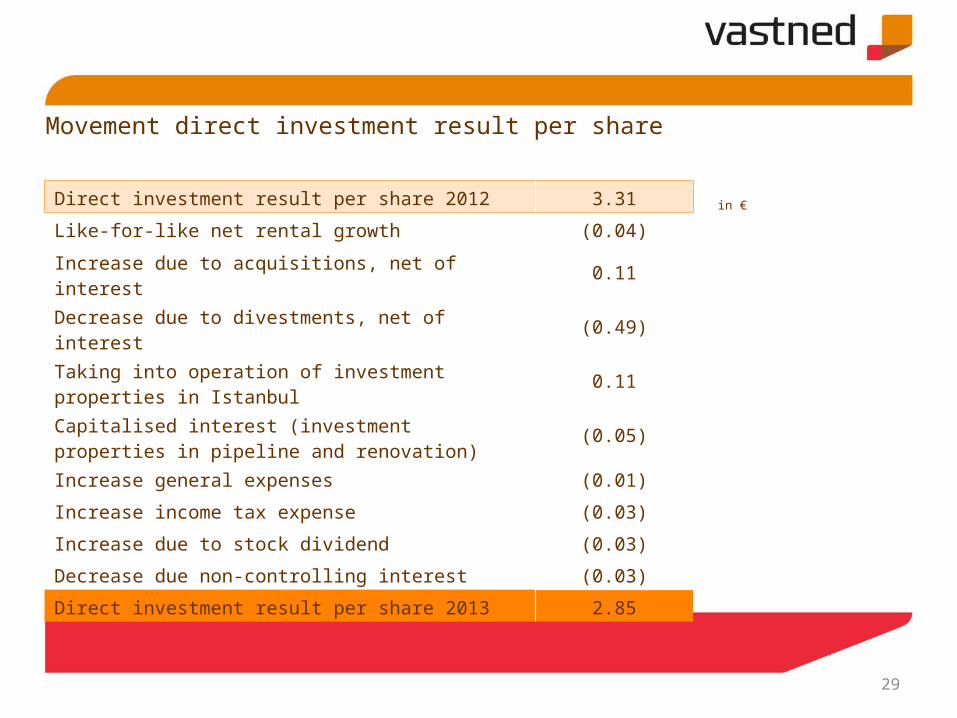
Movement direct investment result per share
in €Direct investment result per share 2012 3.31
Like-for-like net rental growth (0.04)
Increase due to acquisitions, net of interest 0.11
Decrease due to divestments, net of interest (0.49)
Taking into operation of investment properties in Istanbul
0.11
Capitalised interest (investment properties in pipeline and renovation)
(0.05)
Increase general expenses (0.01)
Increase income tax expense (0.03)
Increase due to stock dividend (0.03)
Decrease due non-controlling interest (0.03)
Direct investment result per share 2013 2.85
29

Outlook 2014: Improved quality portfolio enables forecast for 2014 direct investment result Vastned will continue to pragmatically execute the premium city high street
strategy with focus on growth in premium cities
Execution of the strategy has significantly improved quality of the portfolio to more stable and predictable results
As announced before, the premium city high street strategy will lead to lower direct investment result in the short term, but to more stable and predictable results in the long term
Current quality of the portfolio provides sufficient ground to estimate direct investment result per share 2014 between € 2.10 - € 2.30, barring unforeseen circumstances
30

Dividend 2013: € 2.55 per share
Total dividend: € 2.55 per share Pay-out ratio: 89% Ex-dividend date: 19 May 2014 Payment date final dividend: 29 May 2014 Dividend policy unchanged:
pay-out ratio at least 75% of the direct investment result
31

Contact details
Vastned Investor Relations
Anneke Hoijtink
+ 31 10 24 24 368
+ 31 6 31637374
www.vastned.com
32


![Result Update Presentation Q1 FY 16 [Company Update]](https://static.fdocuments.in/doc/165x107/577cb2961a28aba7118c175a/result-update-presentation-q1-fy-16-company-update.jpg)