VARIATIONS IN SHALLOW COASTAL PLAIN LAKE ... files/Littoral...Waite 2000, Leland and Porter 2000,...
76
MONITORING THE ECOLOGICAL INTEGRITY OF PINELANDS WETLANDS VARIATIONS IN SHALLOW, COASTAL PLAIN LAKE COMMUNITIES ASSOCIATED WITH LAND-USE-DEGRADATION GRADIENTS AND THRESHOLDS FINAL REPORT SUBMITTED TO THE U.S. ENVIRONMENTAL PROTECTION AGENCY DECEMBER 2007
Transcript of VARIATIONS IN SHALLOW COASTAL PLAIN LAKE ... files/Littoral...Waite 2000, Leland and Porter 2000,...

MONITORING THE ECOLOGICAL INTEGRITY OF PINELANDS WETLANDS
VARIATIONS IN SHALLOW, COASTAL PLAIN LAKE COMMUNITIES ASSOCIATED WITH LAND-USE-DEGRADATION GRADIENTS AND THRESHOLDS
FINAL REPORT SUBMITTED TO THE U.S. ENVIRONMENTAL PROTECTION AGENCY
DECEMBER 2007
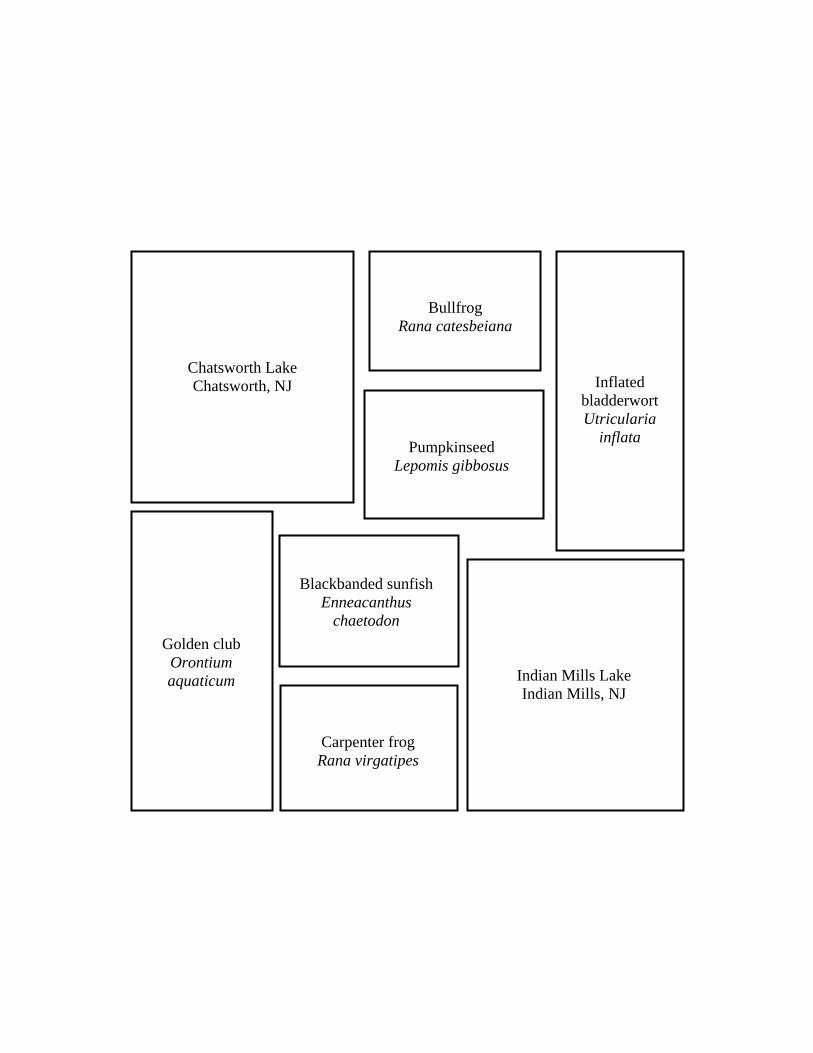
Chatsworth Lake Chatsworth, NJ
Bullfrog Rana catesbeiana
Pumpkinseed Lepomis gibbosus
Inflated bladderwort Utricularia
inflata
Golden club Orontium aquaticum
Blackbanded sunfish Enneacanthus
chaetodon
Carpenter frog Rana virgatipes
Indian Mills Lake Indian Mills, NJ
MONITORING THE ECOLOGICAL INTEGRITY OF PINELANDS WETLANDS
VARIATIONS IN SHALLOW, COASTAL PLAIN LAKE COMMUNITIES ASSOCIATED WITH LAND-USE-DEGRADATION GRADIENTS AND THRESHOLDS
Prepared By
ROBERT A. ZAMPELLA, JOHN F. BUNNELL, KIM J. LAIDIG, AND NICHOLAS A. PROCOPIO
THE NEW JERSEY PINELANDS COMMISSION
Betty Wilson, Chairperson Norman F. Tomasello, Vice Chair
Candace McKee Ashmun Hon. Robert Hagaman William J. Brown Daniel Kennedy
Dr. Guy Campbell, Jr. Stephen V. Lee III Leslie M. Ficcaglia Edward Lloyd
Paul Galletta Robert W. McIntosh, Jr. John A. Haas Francis A. Witt
John C. Stokes, Executive Director
FINAL REPORT SUBMITTED TO THE U. S. ENVIRONMENTAL PROTECTION AGENCY
December 2007

VARIATIONS IN SHALLOW, COASTAL PLAIN LAKE COMMUNITIES ASSOCIATED WITH LAND-USE-DEGRADATION GRADIENTS AND THRESHOLDS
INTRODUCTION
The concept of degradation thresholds has been used to describe the level of urbanization and
associated impervious surface that results in stream impairment (Klein 1979, Steedman 1988, Arnold and Gibbons 1996, May et al. 1997). Although the concept is valid in areas dominated by urban-land use, it fails to account for the effect of agriculture on the ecological integrity of surface waters in areas with mixed land uses since both urban land and agriculture can result in water-quality degradation (Osborne and Wiley 1988, Johnson et al. 1997, Carpenter et al. 1998, Herlihy et al. 1998, Rhodes et al. 2001, Sliva and Williams 2001, Tufford et al. 2003) and associated changes in the composition of aquatic communities (Lenat and Crawford 1994, Wang et al. 1997, Carpenter and Waite 2000, Leland and Porter 2000, Waite and Carpenter 2000, Stepenuck et al. 2002).
New Jersey Pinelands streams are representative of blackwater coastal plain streams found along the east coast and Gulf Coast of the United States (Patrick 1996). Urban land and upland agriculture are generally good predictors of Pinelands stream-water quality when considered separately, but both land uses must be considered together to more fully describe the relationship between watershed disturbance and water quality (Zampella et al. 2007a). Pinelands water-quality and diatom-, macrophyte-, anuran-, and fish-community gradients are associated with variations in the extent of altered land (combined percentage of urban land and upland agriculture) in a watershed (Zampella 1994, Zampella and Laidig 1997, Zampella and Bunnell 1998, Dow and Zampella 2000, Zampella et al. 2001, 2003, 2005, 2006a, 2006b, 2007b). The purpose of this paper is to describe land-use gradients and thresholds associated with changes in water quality and the composition of diatom-, plant-, fish-, and anuran-assemblages found in Pinelands lakes.
METHODS
Land use and study-site selection
Most Pinelands lakes are artificial stream impoundments that were created for sawmills, ironworks, papermaking, and cranberry production (Patrick et al. 1979, Wacker 1979). Other lakes and ponds were created by sand mining and beaver activity. Although a prominent feature of the Pinelands landscape, these water bodies have received relatively little study compared to streams. There are nearly four hundred impoundments in the region. These impoundments are typically less than four hectares and are generally shallow with a mean depth of about one meter (New Jersey Division of Fish and Game 1950, 1951, 1957).
From a pool of 43 stream impoundments initially considered for the study, we selected 30 impoundments that represented a range of watershed conditions characterized by the percentage of developed land and upland-agricultural land (Figure 1, Appendix 1). Land-use/land-cover profiles for the entire watershed associated with each impoundment and for eight variable-width buffers surrounding each impoundment (0-25 m, 0-50 m,…0-200 m) were prepared using ArcView software (Environmental Systems Research Institute Inc., Redlands, CA, 1999-2006) and digital land-use/land-cover data obtained from the New Jersey Department of Environmental Protection (NJDEP, 1995/97 Land Use/Land Cover Update 2001). The NJDEP data set classifies land uses using a modified Anderson et al. (1976) system.
1
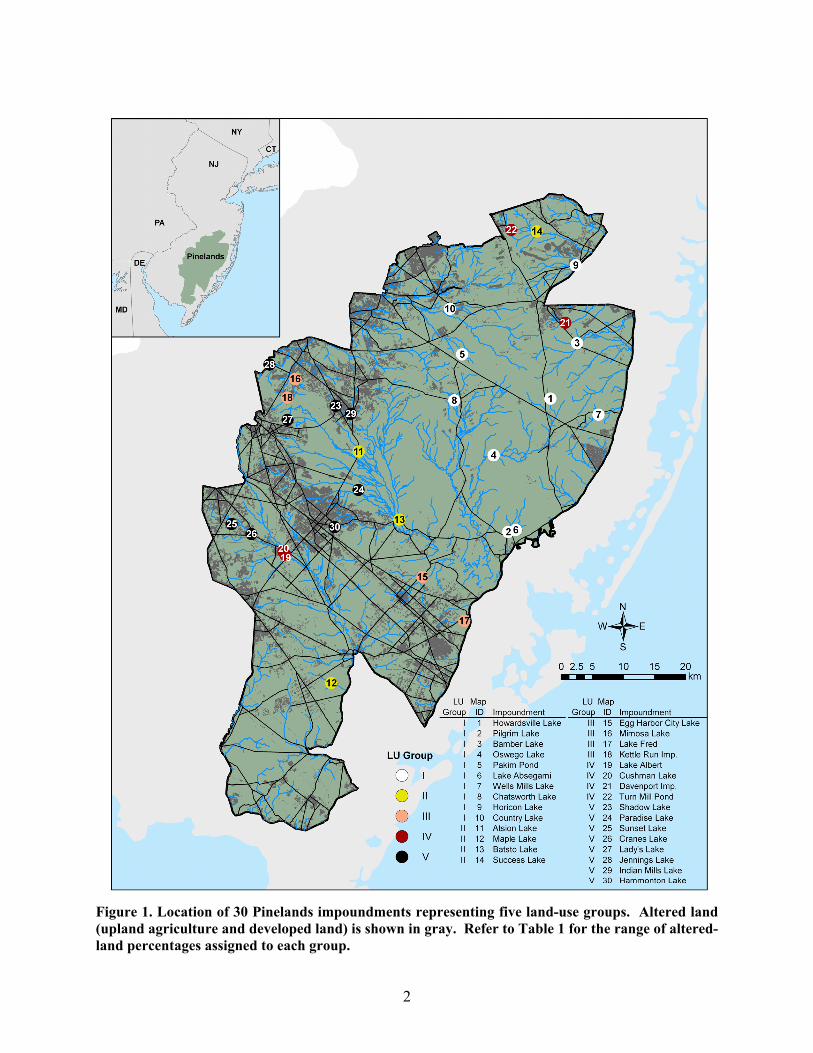
Figure 1. Location of 30 Pinelands impoundments representing five land-use groups. Altered land (upland agriculture and developed land) is shown in gray. Refer to Table 1 for the range of altered-land percentages assigned to each group.
2

In this paper, we refer to the Anderson-type land-use classes of urban land and agriculture as developed land and upland agriculture, respectively. Collectively, we refer to developed land and upland agriculture as altered land. Each impoundment was placed in one of five groups based on the percentage of altered land in the associated drainage basin (Table 1, Appendix 2). The five land-use groups were < 10%, 10-19.9%, 20-29.9%, 30-39.9%, and ≥ 40% altered land, with each group represented by a Roman numeral (I-V). The percentage of altered land in the 30 study basins ranged from an average of 3.4% for Group I impoundments to 49.1% for Group V impoundments (Table 1). Altered land was absent in one watershed. On average, developed land and upland agriculture represented 69% and 31% of altered land in the other 29 drainage basins. Table 1. Land-use, water-quality, impoundment-area, and nearshore-habitat characteristics of 30 Pinelands stream impoundments. The five land-use groups are defined by the percentage of altered land (developed land and upland agriculture) in the associated watersheds. Water-quality and vegetation-cover-rank values are group medians. All other values are group means (± 1 SD). Both pH and specific conductance values are based on samples collected over a three-year period (2003-2005).
Land-use groups and the percentage of altered land (developed land
and upland agriculture) associated with each land-use group. I II III IV V <10% 10-19.9% 20-29.9% 30-39.9% ≥40% Land-use/habitat factors n = 10 n = 4 n = 4 n = 4 n = 8 Developed land (%) 2.8 ± 2.5 8.2 ± 2.6 18.8 ± 7.9 18.7 ± 11.9 33.3 ± 13.2Upland agriculture (%) 0.6 ± 0.8 5.8 ± 3.7 6.7 ± 7.0 16.1 ± 11.1 15.9 ± 11.0Altered land (%) 3.4 ± 3.0 14.0 ± 1.3 25.5 ± 4.6 34.8 ± 2.1 49.1 ± 6.5Impoundment area (ha) 19.0 ± 13.3 26.2 ± 11.9 7.4 ± 5.5 18.0 ± 10.6 11.4 ± 8.3pH 4.4 5.1 5.8 6.2 6.6Specific conductance (µS cm-1) 51.8 50.3 68.5 63.2 104.4Nearshore-water depth (cm) 40.3 ± 9.0 41.0 ± 9.1 38.9 ± 17.3 40.2 ± 5.7 45.1 ± 5.9Sand (%) 73.0 ± 17.4 82.5 ± 12.9 86.7 ± 13.6 84.2 ± 13.6 48.1 ± 38.0Emergent-cover rank 1.0 0.8 0.0 0.3 0.7Floating-cover rank 0.0 0.0 0.3 0.3 0.5Submerged-cover rank 2.3 1.8 4.0 1.3 3.3
Environmental factors Water quality. We sampled pH, specific conductance, and temperature monthly at all 30 impoundments from April through October 2003, March through October 2004, and March through September 2005 (Appendix 3). The period March through October represents the growing season. From April through December 2006, we measured the same variables at 24 of the 30 impoundments (Appendix 2). Nitrite as nitrogen (NO2-N), nitrate as nitrogen (NO3-N), orthophosphate as phosphorus (PO4-P), sulfate as sulfur (SO4-S), and chloride (Cl) also were measured at the 24 impoundments during the June, August, October, and December 2006 water-quality-sampling rounds. All water-quality measurements were completed under baseflow conditions.
Specific conductance was measured with an Orion model-122 meter and pH was measured using an Orion model-250A meter. Anion analyses were completed using a Dionex ICS90 ion chromatograph following Standard Methods (1998).
3

Shoreline habitats. At each impoundment, we established ten 4 x 10-m plots along representative shoreline habitats. Each plot extended 1-m above (terrestrial portion) and 3-m below (aquatic portion) the water line. To characterize the dominant-nearshore sediment, we subjectively classified substrate as gravel, sand, detritus, or mud (muck and silt) at 1-m intervals along transects located perpendicular to the water line at the middle and ends of each plot for a total of 9 measurements per plot. Based on the number of points where each type of substrate was found, we calculated the frequency of occurrence of each sediment type within each plot. We also measured water depth at the same 9 sampling points and used these data to calculate a mean water depth for each plot. Biological surveys
Plants. At the 30 impoundments, we surveyed vegetation on a single occasion during the latter part of the growing season (July through early October). All surveys were conducted from 2003 through 2005. Separate presence/absence tallies were completed for each 4 x 10-m plot, resulting in ten sampling areas for each impoundment. These tallies were used to calculate a frequency of occurrence value for each species for each impoundment.
We used the Braun-Blanquet cover scale (Mueller-Dombois and Ellenberg 1974), where + = < 1%, 1 = 1-5%, 2 = 5-25%, 3 = 25-50%, 4 = 50-75%, and 5 = > 75% cover, to estimate the total abundance of emergent, floating-leaved, and submerged/free-floating vegetation within the aquatic portion of each plot. The plot values were used to calculate median cover values for each impoundment. Frequency of occurrence data for all plant species encountered in each impoundment are presented in Appendix 4. Taxonomic nomenclature follows Gleason and Cronquist (1991).
Diatoms. We used periphyton samplers that held 16 glass microscope slides to collect diatom samples at the outlet of 20 of the 30 impoundments. The samplers were placed in the stream below each impoundment for a 14-day period in July 2006 and again in September 2006. A spherical densiometer was used to measure canopy cover directly above the points where diatoms were sampled. Mean canopy cover for each site was based on four spherical-densiometer readings. Slides from the two dates were pooled as a single sample and the samples were prepared following the methods described in Zampella et al. (2007b). Using a light microscope, diatoms were identified to species and enumerated until a total of at least 500 diatoms were counted. Species richness and relative abundance measures were based on all taxa collected, including those taxa identified only to genus. The complete diatom-data set is presented in Appendix 5.
Fish. We surveyed fish at the 30 impoundments on the same day that plant surveys were conducted. Using a 4-mm mesh nylon seine extending 3-m from the shore, we made two passes within each plot.
The number of individuals collected from each plot was used to determine presence/absence and relative abundance for each species in each plot. Relative abundance was calculated as: (number of individuals of a species/total number of individuals) × 100. Some juvenile Esox species (E. niger or E. americanus), Enneacanthus species (E. obesus or E. gloriosus), and Lepomis species (L. gibbosus or L. macrochirus) could not be identified to species and were not included in subsequent data analyses. Plot values were used to calculate frequency of occurrence and mean relative abundance for each species in each impoundment. The fish-survey data, which include the number of individuals of each species collected at each plot and the frequency of occurrence and mean relative abundance of each species for each
4
impoundment, are presented in Appendices 6 - 8. Taxonomic nomenclature follows that used in Page and Burr (1991).
Anurans. We conducted nighttime vocalization surveys at the 30 impoundments in June 2005. June is the calling season for both bullfrogs and carpenter frogs (Zampella et al. 2001), the two species that were the focus of our surveys. Each site was visited on one occasion. The number of calling individuals of all anuran species heard during a five-minute period was recorded. No attempt was made to count beyond 10 individuals of a given species so the maximum number for these species may be conservative. The time, temperature, and relative humidity were also recorded during each visit.
Tadpoles collected during the fish surveys were identified to species. No bullfrog or carpenter frog tadpoles were found at several sites where vocalizing bullfrogs or carpenter frogs were previously heard. These sites were revisited in September 2005 and a dip net was used to intensely sample nearshore habitats for tadpoles. The anuran-survey data, which includes the number of individuals of each anuran species heard and the time, air temperature, relative humidity, and weather conditions recorded during site visits, are presented in Appendix 9. The presence of carpenter frog and bullfrog tadpoles at each site is also indicated. Taxonomic nomenclature follows Conant and Collins (1998). Voucher collection
The Pinelands Commission maintains voucher collections for diatoms, plants, and fish. The diatoms found at each site are mounted in Naphrax on microscope slides. The herbarium collection includes voucher specimens for many of the plant species encountered during the surveys. The fish collection includes voucher specimens for all species collected at each impoundment. Biogeography and wetland plant status
Following Zampella et al. (2006a), we refer to plant, fish, and anuran species whose distribution is limited to the Pinelands as restricted-native species, species that are native to both the Pinelands and other areas of New Jersey as widespread-native species, and species that are native to regions outside the Pinelands, including exotics, as nonnative species (Table 2). In the Pinelands, nonnative plant, fish, and anuran species are associated with watershed disturbance and water-quality degradation (Zampella and Laidig 1997, Zampella and Bunnell 1998, 2000, Zampella et al. 2006a). Diatom pH categories
Pinelands streams draining developed lands and upland agriculture are dominated by diatom assemblages that are characteristic of circumneutral conditions, whereas acid-water diatoms dominate assemblages found in streams with little altered land in the watershed (Zampella et al. 2007b). Using Meriläinen (1967), Lowe (1974), van Dam et al. (1994), Charles (1985), and Dixit et al. (1999) and the methods described in Zampella et al. (2007b), we assigned diatom taxa to pH classes that describe the occurrence of diatoms in relation to pH. Indifferent or circumneutral species (pH around 7) were classified as indifferent. Acidobiontic (pH < 7), acidophilous (pH ≤ 7), and acidophilous-indifferent taxa were classified as acidobiontic-acidophilous. Alkaliphilous (pH ≥ 7), alkalibiontic (pH > 7), and indifferent-alkaliphilous diatoms were classified as alkalibiontic-alkaliphilous.
5
Table 2. Biogeographic classification of plant, fish, and anuran species based on Stone (1911), Hastings (1984), and Conant (1979), respectively. Nonnative-plant species also include species described as exotic by Gleason and Cronquist (1991). Classification Plants Fish Anurans Restricted-native species
Pine Barrens District species
Restricted- characteristic species
Pine Barrens species
Widespread-native species
Species common to the Pine Barrens and Middle Districts
Widespread- characteristic species
Wide-ranging species
Nonnative species
Species restricted to the Middle District
Peripheral and introduced species
Border-entrant species
Data analysis
Analysis of variance. We used Kruskal-Wallis ANOVA tests to assess differences in mean water depth, mean sediment frequency, median pH, median specific conductance, mean canopy cover at diatom-sampling sites, median NO3-N concentrations, diatom-, plant-, fish-, and anuran-species richness, and the percentage of plant, fish, and anuran species classified as restricted native, widespread native, and nonnative between the five land-use groups. Kruskal-Wallis ANOVAs were also used to compare fish- and anuran-relative abundance and the percentage of dominant diatoms classified as acidobiontic-acidophilous, alkalibiontic-alkaliphilous, and indifferent between groups. Dominant diatoms were those species that comprised more than 75% of a sample. Plant-species-richness attributes included herbaceous- and woody-species richness. The percentage of acidobiontic-acidophilous, alkalibiontic-alkaliphilous, and indifferent species was based on the number of species assigned a classification rather than the total number of dominant species. Similarly for plants, the percentage of restricted-native, widespread-native, and nonnative species was based on the number of species assigned a classification. Unclassified diatoms represented 7.0% of all dominant-diatom species. Plants not assigned a biogeographic classification represented 11.7% and 6.3% of the total number of all herbaceous and woody species, respectively. Separate Kruskal-Wallis ANOVAs were performed using median growing season (March through October) pH and specific conductance values for the 2003-2005 and 2006 periods. Post-hoc comparisons were conducted using multiple comparisons of mean ranks (Siegel and Castellan 1988).
Correlations. Spearman rank correlation was used to relate altered land in entire watersheds to median pH and median specific conductance based on 2003–2005 growing season data, and median pH, specific conductance, NO3-N, SO4-S, and chloride based on data collected in June, August, October, and December in 2006 at the subset of 24 impoundments. Specific conductance and pH were also related to altered land in the variable-width buffers surrounding all 30 impoundments. We also used rank correlation to evaluate the relationship of diatom-species richness and pH classification and plant, fish, and anuran richness and biogeography to land-use and water-quality factors. Water-quality data collected during the 2003-2005 period were used in the analysis of plants, fish, and anurans. For diatoms, we used pH and specific conductance data collected in 2006.
MRPP. Nonparametric multi-response permutation procedures (MRPP, McCune and Mefford 1999) were used to compare selected biological attributes between the five land-use groups. Biological attributes included relative abundance for diatoms and anurans, frequency of occurrence for plants and fish, and mean relative abundance for fish. The MRPP analyses were
6
based on Euclidean distance. We report the p and A values for each significant result. The p value describes the likelihood that an observed difference is due to chance. The A statistic (chance-corrected within-group agreement) describes agreement within land-use groups. A = 1 when all attributes within a group are identical, A = 0 when within group heterogeneity equals that expected by chance, and A < 0 when within-group heterogeneity is greater than expected by chance.
Indicator-species analysis. We used indicator-species analysis, a method that complements MRPP by describing how well each species separates among groups (Dufrêne and Legendre 1997, McCune and Grace 2002, McCune and Mefford 1999), to contrast diatom, plant, fish, and anuran species present in the five land-use-based impoundment groups. Indicator values, which are usually based on relative-abundance and relative-frequency values, can range from zero to 100. We used relative-abundance data for diatoms, fish, and anurans and frequency of occurrence data for plants in the indicator-species analyses. A maximum indicator value is obtained when a species is unique to a group and is found in all samples of that group.
Logistic regression. Using logistic regression, we determined the probability of finding various percentages of nonnative-plant species, nonnative-fish species, and alkalibiontic-alkaliphilous or indifferent diatom species in relation to the percentage of altered land in a drainage basin. The nonnative-species percentage cutoffs were ≥ 10%, ≥ 20%, ≥ 30%, and ≥ 40% of total classified-species richness. The same cutoff values were applied to the percentage of diatom species characterized as either alkalibiontic-alkaliphilous or indifferent. For anurans, we determined the probability of encountering restricted-native carpenter frogs and nonnative bullfrogs.
Statistical significance. An alpha level of 0.05 was used to assess significance for the Kruskal-Wallis ANOVAs and the MRPP and correlation analyses. Significance levels for related correlation tests and Kruskal-Wallis ANOVAs and the multiple MRPP post-hoc tests were adjusted using the sequential Bonferroni method (Rice 1989, 1990). In these cases, we used a single asterisk to denote tests significant at the initial p value and a double asterisk for those tests that were significant following the Bonferroni adjustment. Statistical significance of the indicator-species values was determined by a Monte Carlo method using 1,000 randomizations. We used p = 0.10 as the criteria for identifying species indicative of a particular land-use group. MRPP and indicator species analyses were performed using PC-ORD for Windows Version 5.0 (MjM Software, Gleneden Beach, OR). The ANOVA and correlation analyses were completed using Statistica 7.1 (StatSoft, Inc., Tulsa, OK).
RESULTS
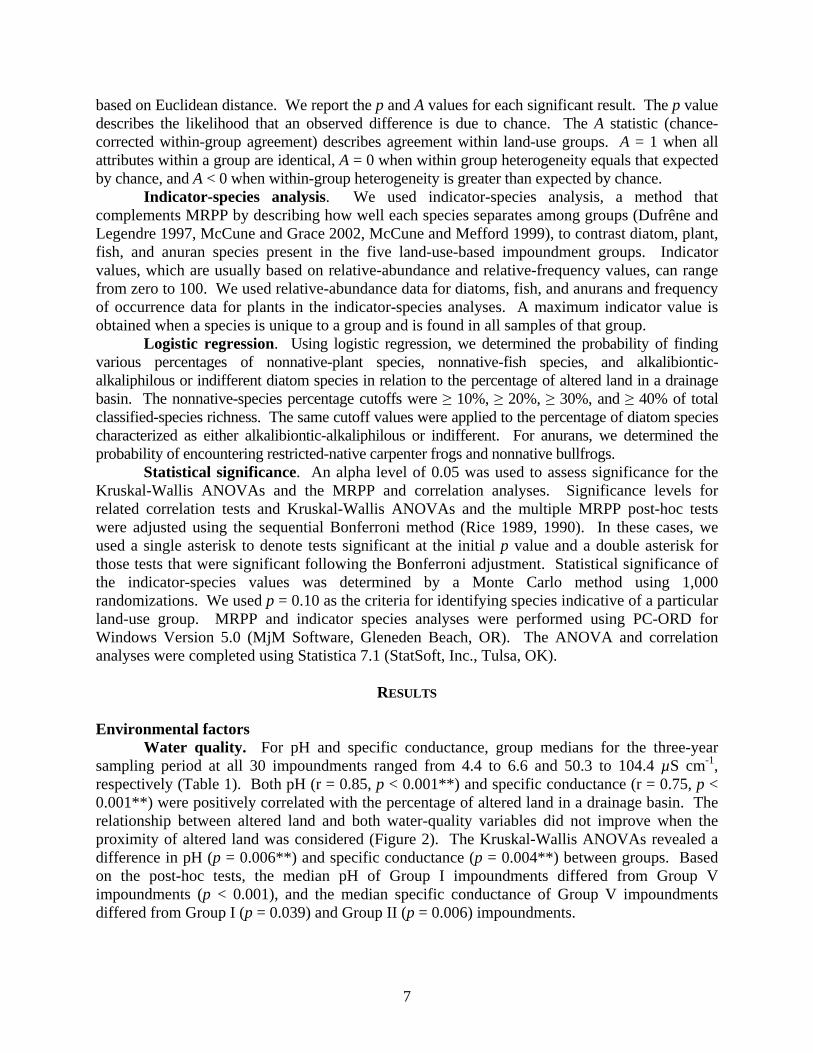
Environmental factors Water quality. For pH and specific conductance, group medians for the three-year sampling period at all 30 impoundments ranged from 4.4 to 6.6 and 50.3 to 104.4 µS cm-1, respectively (Table 1). Both pH (r = 0.85, p < 0.001**) and specific conductance (r = 0.75, p < 0.001**) were positively correlated with the percentage of altered land in a drainage basin. The relationship between altered land and both water-quality variables did not improve when the proximity of altered land was considered (Figure 2). The Kruskal-Wallis ANOVAs revealed a difference in pH (p = 0.006**) and specific conductance (p = 0.004**) between groups. Based on the post-hoc tests, the median pH of Group I impoundments differed from Group V impoundments (p < 0.001), and the median specific conductance of Group V impoundments differed from Group I (p = 0.039) and Group II (p = 0.006) impoundments.
7
pH
0.00
0.10
0.20
0.30
0.40
0.50
0.60
0.70
0.80
0.90
25 50 75 100 125 150 175 200 WBuffer Width (m)
Spea
rman
rSpecific Conductance
0.00
0.10
0.20
0.30
0.40
0.50
0.60
0.70
0.80
0.90
25 50 75 100 125 150 175 200 W
Buffer Width (m)
Spea
rman
r
Figure 2. Spearman rank correlations (r) relating pH and specific conductance to the percentage of altered land in cumulative buffers ranging from 0-25 m, 0-50 m, etc. and to the percentage of altered land in the entire upstream watershed (W). Solid squares denote Spearman rank correlations that were significant at an initial p value of 0.05.
For the subset of 24 impoundments, median nitrite concentrations were below detection
at all sites (Appendix 3). Phosphorus concentrations were below detection at all but two of these sites (Appendix 3). The other water-quality variables sampled over four months in 2006 varied in relation to the percentage of altered land in a basin and most were intercorrelated (Table 3 and 4). Although concentrations of NO3-N, chloride, and SO4-S were positively correlated with altered land, based on the Kruskal-Wallis ANOVAs, only NO3-N differed between land-use groups (p = 0.003**). The post-hoc tests indicated that NO3-N differed between Group I and Group V (p = 0.003) impoundments. The results of the Kruskal-Wallis ANOVAs based on the subset of 20 diatom-sampling sites were similar to those obtained using the full data set. The ANOVAs revealed a difference in pH (p = 0.006**) and specific conductance (p = 0.042**) between land-use groups. Based on the post-hoc tests, the pH (p = 0.021) and specific conductance (p = 0.029) of Group I impoundments differed from Group V. As with the full data set, both pH (r = 0.77, p < 0.001**) and specific conductance (r = 0.73, p < 0.001**) were positively correlated with the percentage of altered land in a basin. Canopy cover at the 20 diatom-sampling sites did not differ between land-use groups (p = 0.833).
Shoreline habitats. Mean nearshore-water depth for the 30 impoundments was similar across groups, with group means (± 1 SD) ranging from 38.9 ± 17.3 cm for the Group III sites to 45.1 ± 5.9 cm for the Group V sites (Table 1). Sediments other than sand or mud (muck or silt) were rarely encountered. Sand was the dominant sediment at most sites, whereas mud was dominant at only four sites. Because mud values are generally the inverse of the sand values, the substrate analysis was limited to the frequency of occurrence of sand. The Kruskal-Wallis ANOVAs revealed no difference in water depth, substrate, or vegetation cover between land-use groups.
8

Table 3. Spearman rank correlations between water-quality variables and the percentage of altered land (developed land and upland agriculture) in a basin for a subset of 24 impoundments. Median values used in the correlations were based on four samples collected in June, August, October, and December 2006. For all correlations, n = 24. All correlations except pH vs. specific conductance and SO4-S were significant following the Bonferroni adjustment. The three-year (2003-2005) median pH and specific conductance values for the full set of 30 impoundments were also positively correlated with the percentage of altered land in a drainage basin (pH: r = 0.85, p < 0.001** and specific conductance: r = 0.75, p < 0.001**).
Altered Land pH
Specific conductance NO3-N SO4-S
pH 0.82 Specific conductance 0.62 0.40 NO3-N 0.76 0.69 0.52 SO4-S 0.54 0.24 0.69 0.56 Chloride 0.64 0.53 0.92 0.59 0.57
Table 4. Group median water-quality values (mg L-1) from a subset of 24 impoundments. The five land-use groups are characterized by the percentage of altered land (developed land and upland agriculture) in the associated watersheds. Significance levels (p) are shown for each Kruskal-Wallis ANOVA. Only nitrate-nitrogen (NO3-N) differed significantly between groups both before and after the Bonferroni adjustment. Refer to Table 1 for the range of altered-land percentages assigned to each group. I II III IV V Variable p n = 8 n = 3 n = 3 n = 3 n = 7 NO3-N 0.003** 0.04 0.07 0.24 0.18 0.27 SO4-S 0.071 1.2 1.3 1.8 1.3 1.9 Chloride 0.099 5.5 6.9 11.1 8.4 13.7
Vegetation
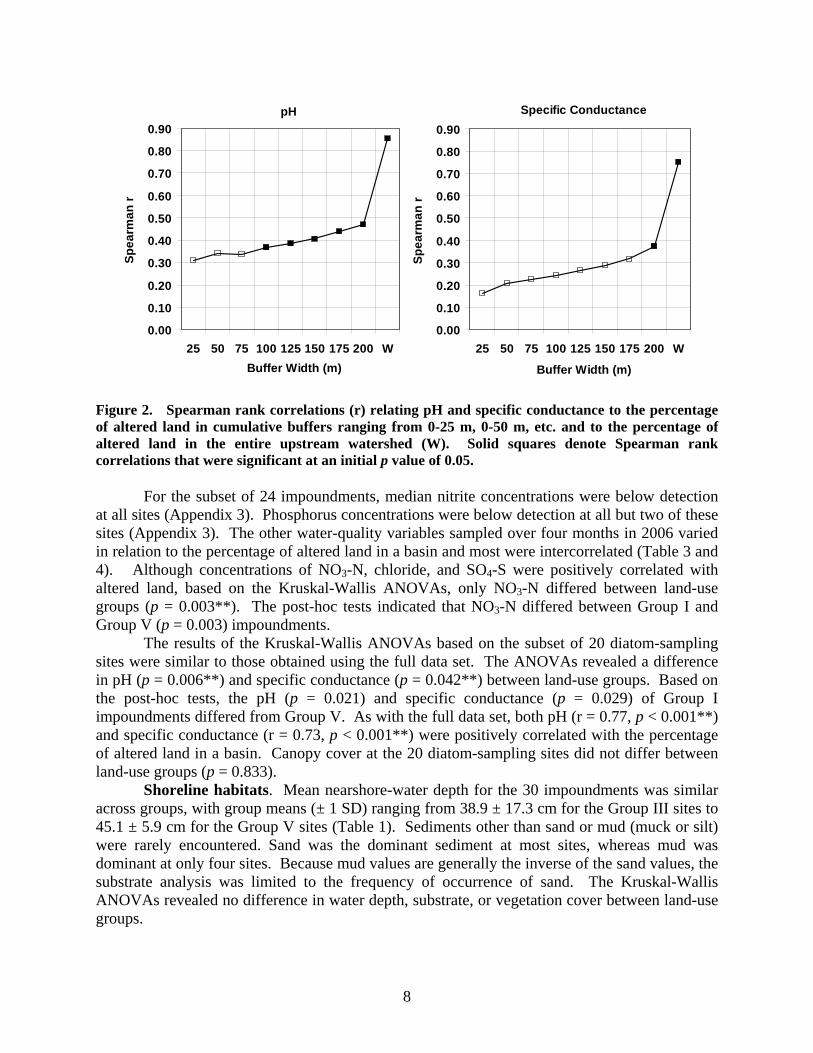
Herbaceous species. A total of 188 herbaceous species were encountered in the vegetation surveys (Appendix 4). The overall mean (± 1 SD) herbaceous richness for all impoundments was 33.9 ± 10.8. Mean herbaceous-species richness ranged from 26.4 ± 8.0 for Group I impoundments to 42.5 ± 14.0 for Group IV impoundments (Figure 3). Although species richness did not differ between groups (p = 0.053), between-group differences in the percentage of restricted-native (p = 0.036*), widespread-native (p = 0.024*), and nonnative (p = 0.002**) species were observed. Post-hoc tests attributed these differences to a higher percentage of restricted-native species in Group I compared to Group V (p = 0.019) impoundments, a lower percentage of nonnative species in Group I compared to Group V (p < 0.001) impoundments, and a higher percentage of widespread-native species in Group IV compared to Group V (p = 0.034) impoundments.
Richness and biogeographical attributes also varied along water-quality and land-use gradients (Table 5). Herbaceous-species richness increased, the percentage of restricted-native species decreased, and the percentage of nonnative species increased as pH and the percentage of altered land in a watershed increased. The percentage of restricted-native and nonnative species
9
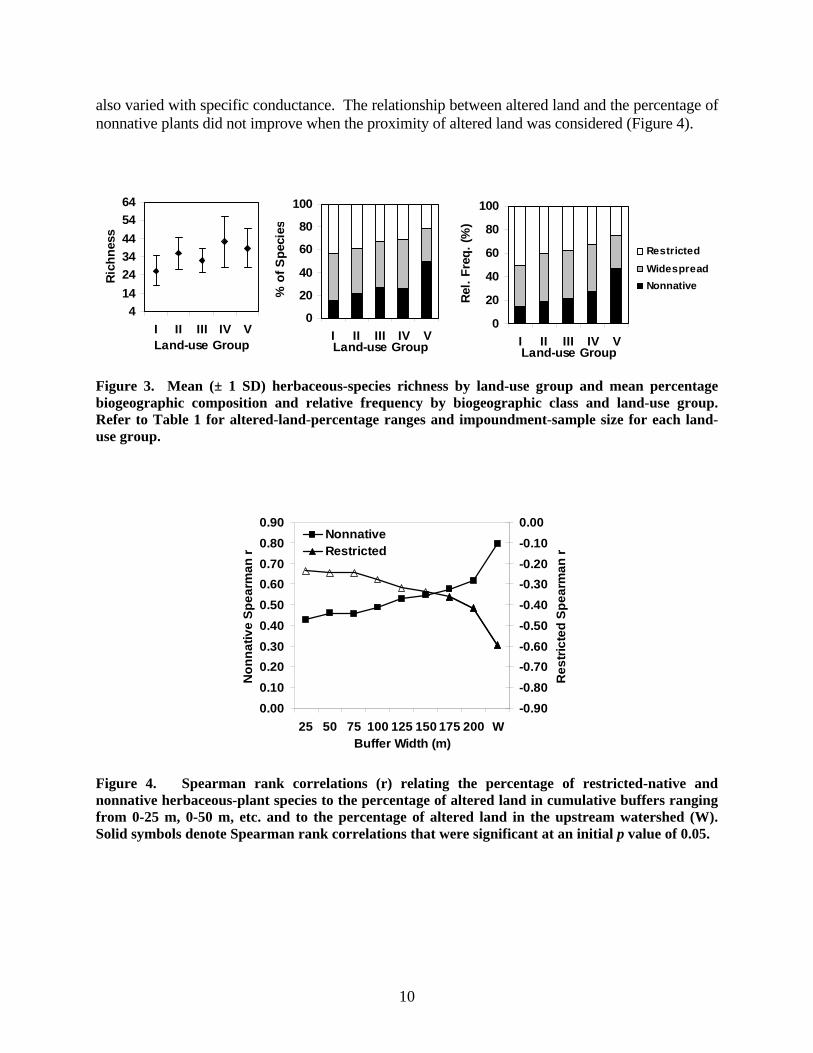
also varied with specific conductance. The relationship between altered land and the percentage of nonnative plants did not improve when the proximity of altered land was considered (Figure 4).
0
20
40
60
80
100
I II III IV VLand-use Group
% o
f Spe
cies
4142434445464
I II III IV VLand-use Group
Ric
hnes
s
0
20
40
60
80
100
I II III IV VLand-use Group
Rel
. Fre
q. (%
)
RestrictedWidespreadNonnative
Figure 3. Mean (± 1 SD) herbaceous-species richness by land-use group and mean percentage biogeographic composition and relative frequency by biogeographic class and land-use group. Refer to Table 1 for altered-land-percentage ranges and impoundment-sample size for each land-use group.
0.000.100.200.300.400.500.600.700.800.90
25 50 75 100 125 150 175 200 WBuffer Width (m)
Non
nativ
e Sp
earm
an r
-0.90-0.80-0.70-0.60-0.50-0.40-0.30-0.20-0.100.00
Res
trict
ed S
pear
man
r
NonnativeRestricted
Figure 4. Spearman rank correlations (r) relating the percentage of restricted-native and nonnative herbaceous-plant species to the percentage of altered land in cumulative buffers ranging from 0-25 m, 0-50 m, etc. and to the percentage of altered land in the upstream watershed (W). Solid symbols denote Spearman rank correlations that were significant at an initial p value of 0.05.
10
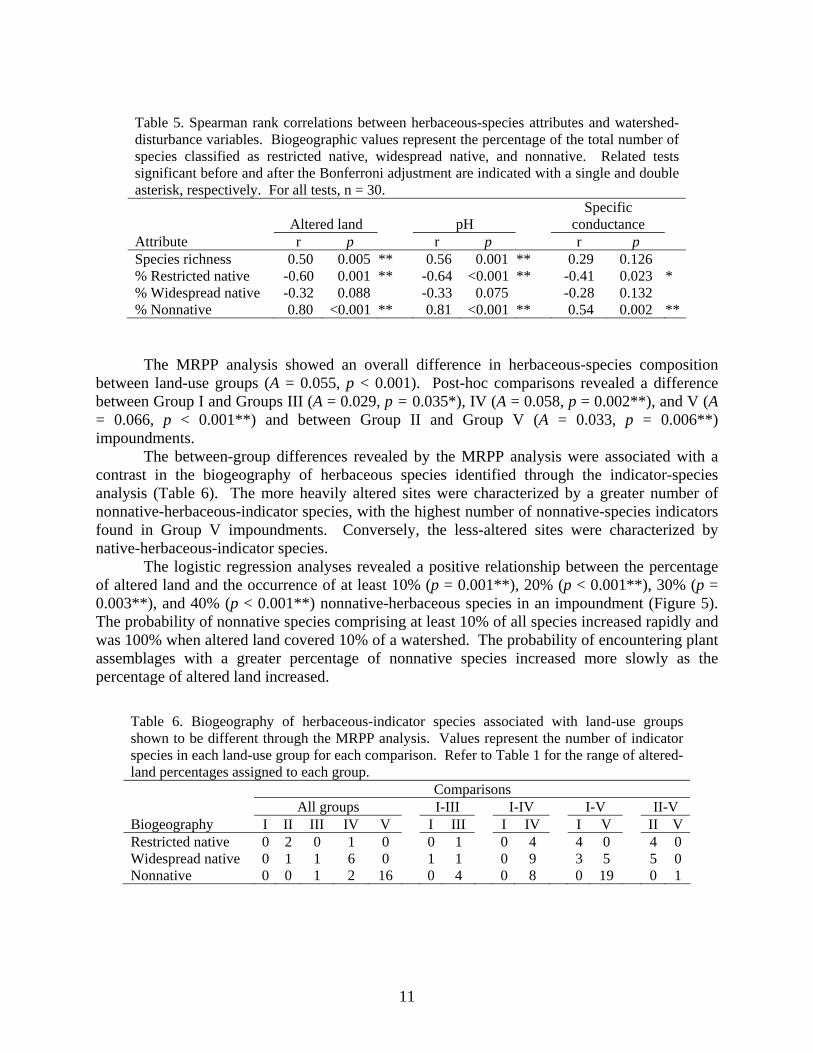
Table 5. Spearman rank correlations between herbaceous-species attributes and watershed-disturbance variables. Biogeographic values represent the percentage of the total number of species classified as restricted native, widespread native, and nonnative. Related tests significant before and after the Bonferroni adjustment are indicated with a single and double asterisk, respectively. For all tests, n = 30.
Altered land pH Specific
conductance Attribute r p r p r p Species richness 0.50 0.005 ** 0.56 0.001 ** 0.29 0.126 % Restricted native -0.60 0.001 ** -0.64 <0.001 ** -0.41 0.023 * % Widespread native -0.32 0.088 -0.33 0.075 -0.28 0.132 % Nonnative 0.80 <0.001 ** 0.81 <0.001 ** 0.54 0.002 **
The MRPP analysis showed an overall difference in herbaceous-species composition
between land-use groups (A = 0.055, p < 0.001). Post-hoc comparisons revealed a difference between Group I and Groups III (A = 0.029, p = 0.035*), IV (A = 0.058, p = 0.002**), and V (A = 0.066, p < 0.001**) and between Group II and Group V (A = 0.033, p = 0.006**) impoundments.
The between-group differences revealed by the MRPP analysis were associated with a contrast in the biogeography of herbaceous species identified through the indicator-species analysis (Table 6). The more heavily altered sites were characterized by a greater number of nonnative-herbaceous-indicator species, with the highest number of nonnative-species indicators found in Group V impoundments. Conversely, the less-altered sites were characterized by native-herbaceous-indicator species.
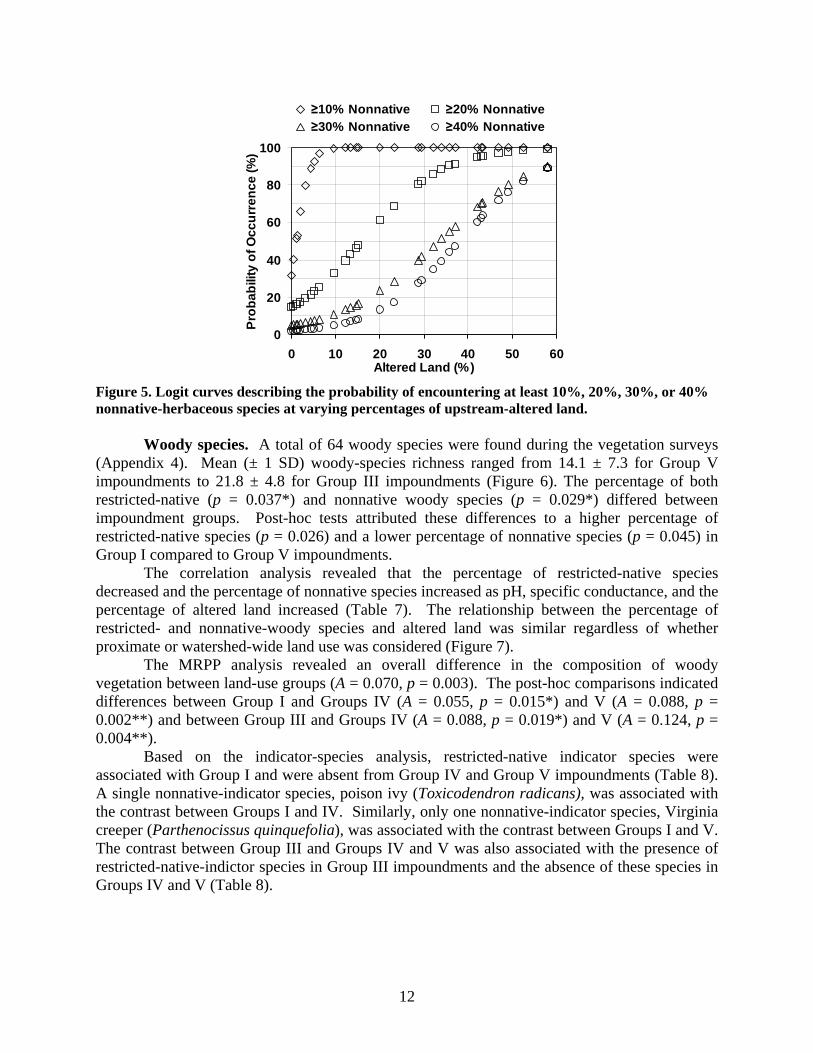
The logistic regression analyses revealed a positive relationship between the percentage of altered land and the occurrence of at least 10% (p = 0.001**), 20% (p < 0.001**), 30% (p = 0.003**), and 40% (p < 0.001**) nonnative-herbaceous species in an impoundment (Figure 5). The probability of nonnative species comprising at least 10% of all species increased rapidly and was 100% when altered land covered 10% of a watershed. The probability of encountering plant assemblages with a greater percentage of nonnative species increased more slowly as the percentage of altered land increased.
Table 6. Biogeography of herbaceous-indicator species associated with land-use groups shown to be different through the MRPP analysis. Values represent the number of indicator species in each land-use group for each comparison. Refer to Table 1 for the range of altered-land percentages assigned to each group. Comparisons
All groups I-III I-IV I-V II-V Biogeography I II III IV V I III I IV I V II V Restricted native 0 2 0 1 0 0 1 0 4 4 0 4 0 Widespread native 0 1 1 6 0 1 1 0 9 3 5 5 0 Nonnative 0 0 1 2 16 0 4 0 8 0 19 0 1
11
0
20
40
60
80
100
0 10 20 30 40 50 60Altered Land (%)
Prob
abili
ty o
f Occ
urre
nce
(%)
≥10% Nonnative ≥20% Nonnative ≥30% Nonnative ≥40% Nonnative
Figure 5. Logit curves describing the probability of encountering at least 10%, 20%, 30%, or 40% nonnative-herbaceous species at varying percentages of upstream-altered land.
Woody species. A total of 64 woody species were found during the vegetation surveys (Appendix 4). Mean (± 1 SD) woody-species richness ranged from 14.1 ± 7.3 for Group V impoundments to 21.8 ± 4.8 for Group III impoundments (Figure 6). The percentage of both restricted-native (p = 0.037*) and nonnative woody species (p = 0.029*) differed between impoundment groups. Post-hoc tests attributed these differences to a higher percentage of restricted-native species (p = 0.026) and a lower percentage of nonnative species (p = 0.045) in Group I compared to Group V impoundments.
The correlation analysis revealed that the percentage of restricted-native species decreased and the percentage of nonnative species increased as pH, specific conductance, and the percentage of altered land increased (Table 7). The relationship between the percentage of restricted- and nonnative-woody species and altered land was similar regardless of whether proximate or watershed-wide land use was considered (Figure 7).
The MRPP analysis revealed an overall difference in the composition of woody vegetation between land-use groups (A = 0.070, p = 0.003). The post-hoc comparisons indicated differences between Group I and Groups IV (A = 0.055, p = 0.015*) and V (A = 0.088, p = 0.002**) and between Group III and Groups IV (A = 0.088, p = 0.019*) and V (A = 0.124, p = 0.004**).
Based on the indicator-species analysis, restricted-native indicator species were associated with Group I and were absent from Group IV and Group V impoundments (Table 8). A single nonnative-indicator species, poison ivy (Toxicodendron radicans), was associated with the contrast between Groups I and IV. Similarly, only one nonnative-indicator species, Virginia creeper (Parthenocissus quinquefolia), was associated with the contrast between Groups I and V. The contrast between Group III and Groups IV and V was also associated with the presence of restricted-native-indictor species in Group III impoundments and the absence of these species in Groups IV and V (Table 8).
12

0
20
40
60
80
100
I II III IV VLand-use Group
% o
f Spe
cies
4
9
14
19
24
29
I II III IV VLand-use Group
Rich
ness
0
20
40
60
80
100
I II III IV VLand-use Group
Rel
. Fre
q. (%
)
RestrictedWidespreadNonnative
Figure 6. Mean (± 1 SD) woody-species richness by land-use group and mean percentage biogeographic composition and relative frequency by biogeographic class and land-use group. Refer to Table 1 for altered-land-percentage ranges and impoundment-sample size for each land-use group.
0.000.100.200.300.400.500.600.700.800.90
25 50 75 100 125 150 175 200 WBuffer Width (m)
Non
nativ
e Sp
earm
an r
-0.90-0.80-0.70-0.60-0.50-0.40-0.30-0.20-0.100.00
Res
trict
ed S
pear
man
r
NonnativeRestricted
Figure 7. Spearman rank correlations (r) relating the percentage of restricted-native and nonnative woody-plant species to the percentage of altered land in cumulative buffers ranging from 0-25 m, 0-50 m, etc. and to the percentage of altered land in the upstream watershed (W). All correlations were significant at the initial p value of 0.05.
As with herbaceous species, a positive relationship was found between the percentage of altered land and the occurrence of ≥ 10% (p = 0.003**) and ≥ 20% (p = 0.035**) nonnative-woody species in an impoundment (Figure 8). However, unlike herbaceous species, the probability of nonnative species comprising at least 10% or 20% of all classified species increased more slowly as the percentage of altered land in a watershed increased and did not reach 100%. The probability of encountering ≥ 30% or ≥ 40% nonnative species was not modeled because nonnative-woody species exceeded 30% at only one impoundment.
13
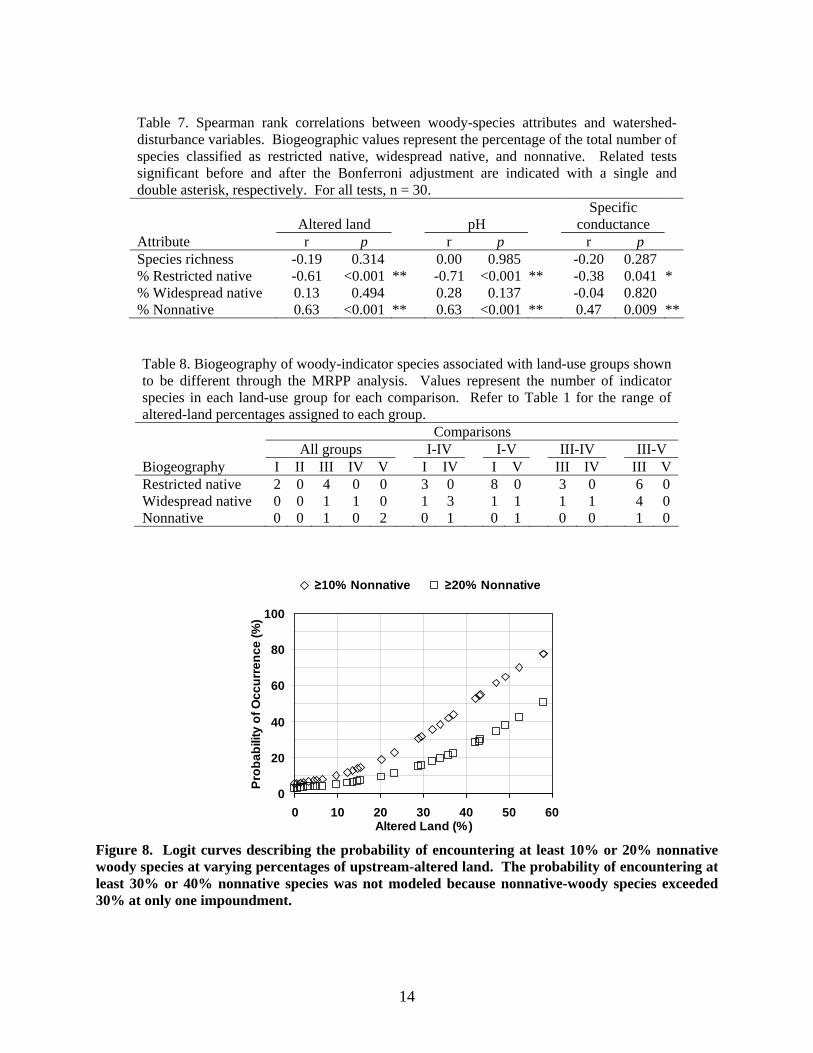
Table 7. Spearman rank correlations between woody-species attributes and watershed-disturbance variables. Biogeographic values represent the percentage of the total number of species classified as restricted native, widespread native, and nonnative. Related tests significant before and after the Bonferroni adjustment are indicated with a single and double asterisk, respectively. For all tests, n = 30.
Altered land pH Specific
conductance Attribute r p r p r p Species richness -0.19 0.314 0.00 0.985 -0.20 0.287 % Restricted native -0.61 <0.001 ** -0.71 <0.001 ** -0.38 0.041 * % Widespread native 0.13 0.494 0.28 0.137 -0.04 0.820 % Nonnative 0.63 <0.001 ** 0.63 <0.001 ** 0.47 0.009 **
Table 8. Biogeography of woody-indicator species associated with land-use groups shown to be different through the MRPP analysis. Values represent the number of indicator species in each land-use group for each comparison. Refer to Table 1 for the range of altered-land percentages assigned to each group. Comparisons
All groups I-IV I-V III-IV III-V Biogeography I II III IV V I IV I V III IV III VRestricted native 2 0 4 0 0 3 0 8 0 3 0 6 0 Widespread native 0 0 1 1 0 1 3 1 1 1 1 4 0 Nonnative 0 0 1 0 2 0 1 0 1 0 0 1 0
0
20
40
60
80
100
0 10 20 30 40 50 60Altered Land (%)
Prob
abili
ty o
f Occ
urre
nce
(%)
≥10% Nonnative ≥20% Nonnative
Figure 8. Logit curves describing the probability of encountering at least 10% or 20% nonnative woody species at varying percentages of upstream-altered land. The probability of encountering at least 30% or 40% nonnative species was not modeled because nonnative-woody species exceeded 30% at only one impoundment.
14

Diatoms A total of 169 taxa, including 16 identified only to genus, were collected from the 20 sites (Appendix 5). Three small and difficult to distinguish species of Aulacoseira, including A. distans, A. paraglabra, and A. distans var. septentrionalis, were combined as one composite species in the analysis. For similar reasons, Staurosirella pinnata and Staurosirella pinnata var. lancettula were combined, as were Stauroforma sp. and Stauroforma exiguaformis. Combining these species resulted in a final total of 165 taxa. Neither richness nor pH classes were found to differ between land-use groups (Figure 9). Analysis of dominant species indicated that the percentage of species classified as acidobiontic-acidophilous diatoms decreased as the percentage of altered land in a watershed increased (Table 9). The opposite trend was observed for indifferent species. Specific conductance was positively correlated with species richness and the percentage of both indifferent and alkalibiontic-alkaliphilous species and negatively correlated with the percentage of acidobiontic-acidophilous species. An increase in the percentage of indifferent species was the only trend found for pH. The logistic regression analysis also revealed a positive relationship between the percentage of altered land and the probability of encountering diatom assemblages in which the combined percentage of indifferent and alkalibiontic-alkaliphilous species comprised at least 10% (p = 0.005**) and 20% (p = 0.013**) of the total number of dominant-diatom species (Figure 10). Although the probability of encountering assemblages in which the indifferent and alkalibiontic-alkaliphilous species together comprised at least 30% (p = 0.113) and 40% (p = 0.067) of the total number of dominant species is also shown in Figure 10, the relationships were not significant.
Results of the MRPP analysis of the diatom data showed an overall difference in composition between land-use groups (A = 0.084, p < 0.031). Post-hoc comparisons revealed differences between Group I and Groups IV (A = 0.093, p = 0.029*) and V (A = 0.105, p = 0.006*). The separation of groups in the MRPP analysis was associated with a contrast in the pH class of species identified through the indicator-species analysis (Table 10). The contrast between Group I and Group IV was characterized by the presence of Group IV indicator species classified as indifferent and alkalibiontic-alkaliphilous. In the comparison between Group I and Group V, all six Group I indicators were acidobiontic-acidophilous diatoms, whereas eight of 10 Group V indicator species were indifferent or alkalibiontic-alkaliphilous diatoms.
0
20
40
60
80
100
I II III IV VLand-use Group
% o
f Spe
cies
Acidophilous
Indifferent
Alkaliphilous
4
14
24
34
44
54
I II III IV VLand-use Group
Rich
ness
Figure 9. Mean (± 1 SD) diatom-species richness by land-use group and mean relative abundance by pH class and land-use group. Refer to Table 1 for altered-land-percentage ranges. The number of impoundments (n) for each land-use group was: Group I (7), II (2), III (2), IV (3), and V (6).
15

Table 9. Spearman rank correlations between diatom-species attributes and watershed-disturbance variables. The pH-category values represent the percentage of the total number of dominant-diatom species classified as acidobiontic-acidophilous, alkalibiontic-alkaliphilous, and indifferent (circumneutral). Related tests significant before and after the Bonferroni adjustment are indicated with a single and double asterisk, respectively. For all tests, n = 20.
Altered land pH Specific
conductance Attribute r p r p r p Species richness 0.41 0.075 0.35 0.127 0.70 0.001 ** % acidobiontic- acidophilous -0.54 0.013 ** -0.33 0.159 -0.69 0.001 ** % indifferent (circumneutral) 0.71 <0.001 ** 0.52 0.019 * 0.53 0.016 ** % alkalibiontic- alkaliphilous 0.34 0.148 0.25 0.282 0.61 0.005 **
Table 10. Diatom pH classes associated with land-use groups shown to be different through the MRPP analysis. Values represent the number of dominant pH-indicator species in each land-use group for each comparison. Refer to Table 1 for the range of altered-land percentages assigned to each group. Comparisons
All groups I-IV I-V pH Class I II III IV V I IV I V Acidobiontic-acidophilous 0 4 2 1 0 1 6 6 1 Indifferent 0 0 2 0 2 0 5 0 5 Alkalibiontic-alkaliphilous 0 0 1 1 0 0 2 0 3 Unclassified 0 1 1 1 1 0 1 0 1
0
20
40
60
80
100
0 10 20 30 40 50 60Altered Land (%)
Prob
abili
ty o
f Occ
urre
nce
(%)
≥10% Non-acid ≥20% Non-acid≥30% Non-acid ≥40% Non-acid
Figure 10. Logit curves describing the probability of encountering diatom assemblages in which non-acid (indifferent and alkalibiontic-alkaliphilous) species comprised at least 10%, 20%, 30%, or 40% of the total number of dominant-diatom species at varying percentages of upstream-altered land.
16

Fish Twenty fish species were collected during the surveys, including six restricted species,
six widespread species, and eight nonnative species (Table 11). A total of 8,300 individual fish were collected from the 30 impoundments, including 5,712 individuals identified to the species level and 2,588 individuals identified only to the genus level. Those identified only to genus (i.e., Esox, Enneacanthus, and Lepomis) were excluded from the analysis. The overall relative abundance of restricted, widespread, and nonnative species was 18%, 59%, and 23%, respectively.
Of the four species-richness measures, only nonnative-species richness differed between land-use groups (p = 0.003**). Post-hoc tests revealed that nonnative-species richness was lower for Group I impoundments compared to Group V impoundments (p = 0.005).
The percentage of restricted species (p = 0.017**), widespread species (p = 0.015**), and nonnative species (p = 0.005**) differed between land-use groups (Figure 11). Based on post-hoc tests, the percentage of restricted species was higher (p = 0.027) and the percentage of nonnative species was lower (p = 0.011) in Group I impoundments compared to Group V impoundments. Post-hoc tests also indicated that the percentage of widespread species was higher (p = 0.023) for Group I impoundments compared to Group III impoundments.
Table 11. Fish species collected from 30 Pinelands impoundments. Refer to Table 2 for explanation of biogeographic classifications. Restricted Species Acantharchus pomotis mud sunfish Ameiurus natalis yellow bullhead Aphredoderus sayanus pirate perch Enneacanthus chaetodon blackbanded sunfish Enneacanthus obesus banded sunfish Etheostoma fusiforme swamp darter Widespread Species Anguilla rostrata American eel Enneacanthus gloriosus bluespotted sunfish Erimyzon oblongus creek chubsucker Esox niger chain pickerel Noturus gyrinus tadpole madtom Umbra pygmaea eastern mudminnow Nonnative Species Ameiurus nebulosus brown bullhead Fundulus diaphanus banded killifish Lepomis gibbosus pumpkinseed Notemigonus crysoleucas golden shiner Perca flavescens yellow perch Lepomis macrochirus bluegill Micropterus salmoides largemouth bass Pomoxis nigromaculatus black crappie
17

The relative abundance of restricted species (p = 0.003**) and nonnative species (p = 0.001**) also differed between land-use groups (Figure 11). Based on post-hoc tests, the relative abundance of restricted species was higher in Group I impoundments compared to Groups IV (p = 0.037) and V (p = 0.008) impoundments. In contrast, the relative abundance of nonnative species was lower in Group I compared to Groups IV (p = 0.004) and V (p = 0.011).
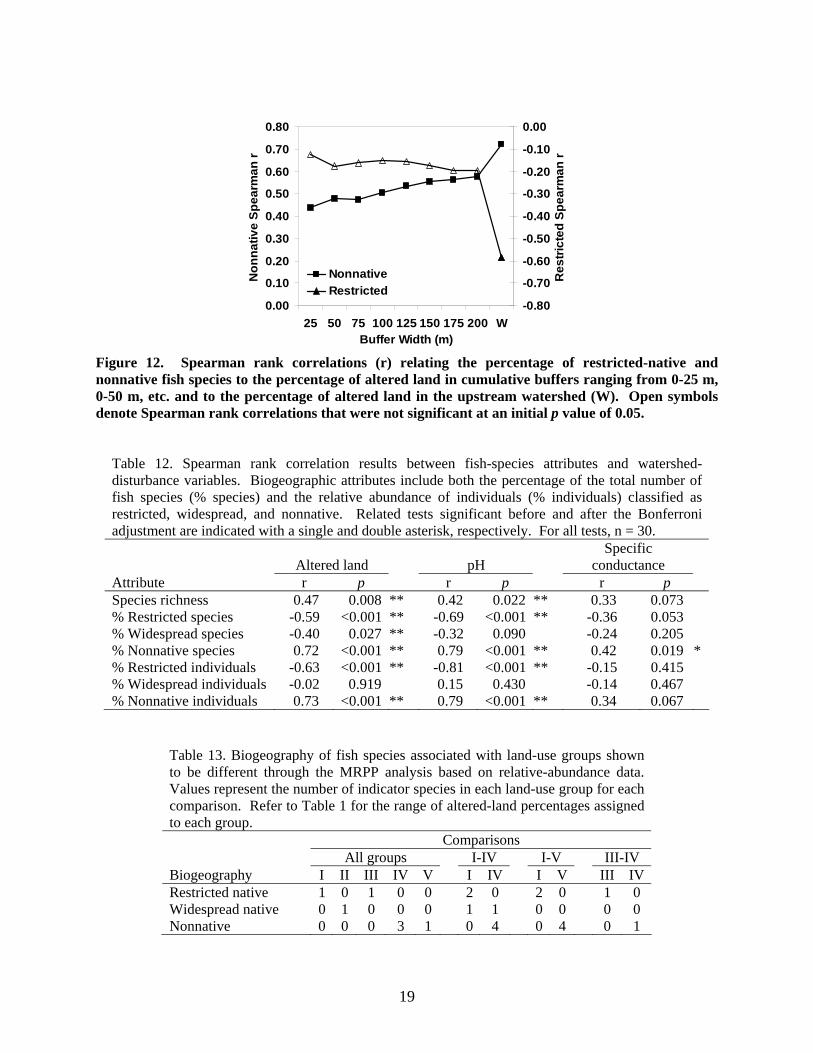
Total species richness and the percentage and relative abundance of nonnative species increased and the percentage and relative abundance of restricted species decreased as the percentage of upstream-altered land and pH increased (Table 12). Altered land and the percentage of widespread species were also positively correlated. Specific conductance was positively correlated only with the percentage of nonnative species. As with herbaceous-plant species, the strongest relationship between altered land and the percentage of restricted- and nonnative-fish species was found at the watershed level (Figure 12).
The MRPP analyses revealed an overall difference in both the frequency of occurrence (A = 0.087, p = 0.001) and relative abundance (A = 0.076, p = 0.006) of fish species between the five land-use groups. Post-hoc comparisons based on frequency of occurrence data revealed differences between land-use Group I and Groups II (A = 0.035, p = 0.038*), IV (A = 0.122, p < 0.001**), and V (A = 0.103, p < 0.001**), Groups III and IV (A = 0.081, p = 0.036*), and Groups III and V (A = 0.069, p = 0.016**). Post-hoc comparisons based on relative-abundance data indicated differences between impoundment Group I and Groups IV (A = 0.140, p = 0.001**) and V (A = 0.075, p = 0.002**) and between Group III and IV (A = 0.185, p = 0.021*). Similar results were obtained when individuals that were identified only to genus were also included in the two MRPP analyses.
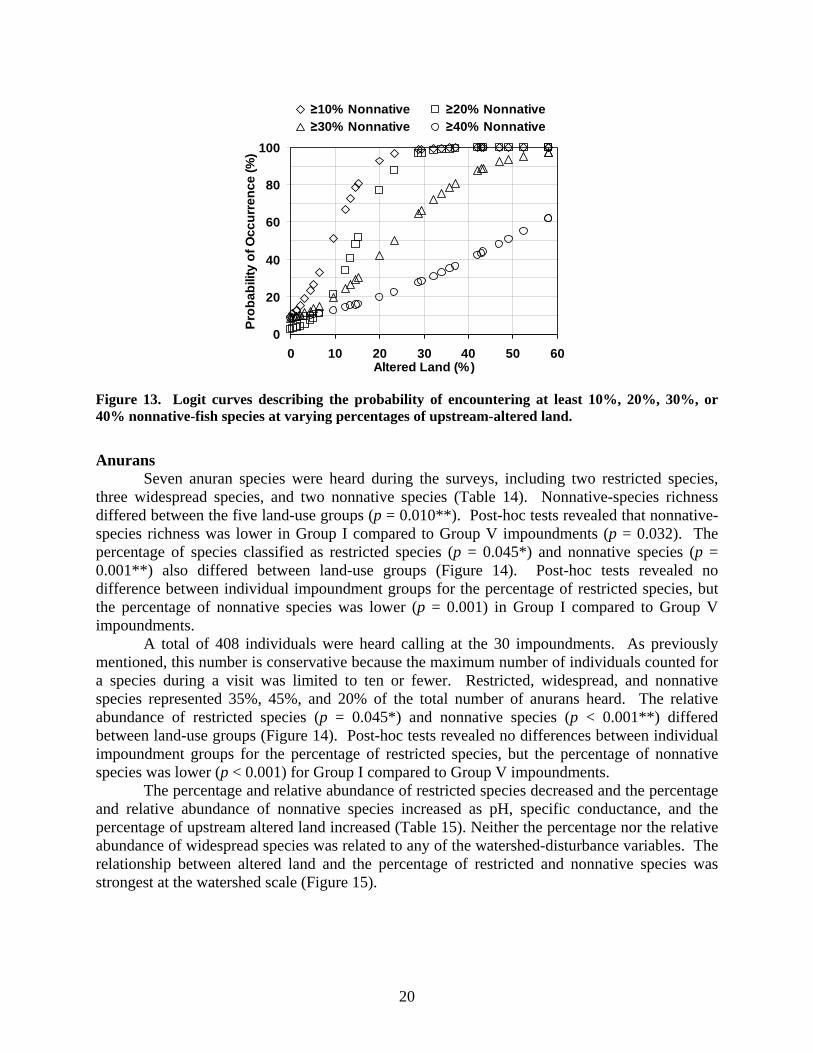
Differences between impoundment groups revealed by the MRPP analysis of relative-abundance data reflected the contrast in the biogeography of fish species identified through the indicator-species analysis (Table 13). Impoundments in the least altered drainages were characterized by native-fish-indicator species, whereas impoundments in more heavily altered basins were characterized by a greater number of nonnative-fish-indicator species. Logistic regression results revealed a positive relationship between the percentage of upstream-altered land and the occurrence of at least 10% (p < 0.001**), 20% (p < 0.001**), 30% (p < 0.001**), and 40% (p = 0.036**) nonnative-fish species in an assemblage (Figure 13). For example, the probability of encountering a fish assemblage comprised of at least 10% or 20% non-native fish is about 100% when altered land covers 30% of a watershed.
0
20
40
60
80
100
I II III IV VLand-use Group
% o
f Spe
cies
4
6
8
10
12
I II III IV VLand-use Group
Rich
ness
0
20
40
60
80
100
I II III IV VLand-use Groups
Rel.
Abun
d. (%
)
Restricted
Widespread
Nonnative
Figure 11. Mean (± 1 SD) fish-species richness by land-use group and mean percentage biogeographic composition and relative abundance by biogeographic class and land-use group. Refer to Table 1 for altered-land-percentage ranges and impoundment-sample size for each land-use group.
18
0.00
0.10
0.20
0.30
0.40
0.50
0.60
0.70
0.80
25 50 75 100 125 150 175 200 WBuffer Width (m)
Non
nativ
e Sp
earm
an r
-0.80
-0.70
-0.60
-0.50
-0.40
-0.30
-0.20
-0.10
0.00
Res
trict
ed S
pear
man
r
NonnativeRestricted
Figure 12. Spearman rank correlations (r) relating the percentage of restricted-native and nonnative fish species to the percentage of altered land in cumulative buffers ranging from 0-25 m, 0-50 m, etc. and to the percentage of altered land in the upstream watershed (W). Open symbols denote Spearman rank correlations that were not significant at an initial p value of 0.05.
Table 12. Spearman rank correlation results between fish-species attributes and watershed-disturbance variables. Biogeographic attributes include both the percentage of the total number of fish species (% species) and the relative abundance of individuals (% individuals) classified as restricted, widespread, and nonnative. Related tests significant before and after the Bonferroni adjustment are indicated with a single and double asterisk, respectively. For all tests, n = 30.
Altered land pH Specific
conductance Attribute r p r p r p Species richness 0.47 0.008 ** 0.42 0.022 ** 0.33 0.073 % Restricted species -0.59 <0.001 ** -0.69 <0.001 ** -0.36 0.053 % Widespread species -0.40 0.027 ** -0.32 0.090 -0.24 0.205 % Nonnative species 0.72 <0.001 ** 0.79 <0.001 ** 0.42 0.019 * % Restricted individuals -0.63 <0.001 ** -0.81 <0.001 ** -0.15 0.415 % Widespread individuals -0.02 0.919 0.15 0.430 -0.14 0.467 % Nonnative individuals 0.73 <0.001 ** 0.79 <0.001 ** 0.34 0.067
Table 13. Biogeography of fish species associated with land-use groups shown to be different through the MRPP analysis based on relative-abundance data. Values represent the number of indicator species in each land-use group for each comparison. Refer to Table 1 for the range of altered-land percentages assigned to each group. Comparisons
All groups I-IV I-V III-IV Biogeography I II III IV V I IV I V III IV Restricted native 1 0 1 0 0 2 0 2 0 1 0 Widespread native 0 1 0 0 0 1 1 0 0 0 0 Nonnative 0 0 0 3 1 0 4 0 4 0 1
19
0
20
40
60
80
100
0 10 20 30 40 50 60Altered Land (%)
Prob
abili
ty o
f Occ
urre
nce
(%)
≥10% Nonnative ≥20% Nonnative ≥30% Nonnative ≥40% Nonnative
Figure 13. Logit curves describing the probability of encountering at least 10%, 20%, 30%, or 40% nonnative-fish species at varying percentages of upstream-altered land.
Anurans
Seven anuran species were heard during the surveys, including two restricted species, three widespread species, and two nonnative species (Table 14). Nonnative-species richness differed between the five land-use groups (p = 0.010**). Post-hoc tests revealed that nonnative-species richness was lower in Group I compared to Group V impoundments (p = 0.032). The percentage of species classified as restricted species (p = 0.045*) and nonnative species (p = 0.001**) also differed between land-use groups (Figure 14). Post-hoc tests revealed no difference between individual impoundment groups for the percentage of restricted species, but the percentage of nonnative species was lower (p = 0.001) in Group I compared to Group V impoundments.
A total of 408 individuals were heard calling at the 30 impoundments. As previously mentioned, this number is conservative because the maximum number of individuals counted for a species during a visit was limited to ten or fewer. Restricted, widespread, and nonnative species represented 35%, 45%, and 20% of the total number of anurans heard. The relative abundance of restricted species (p = 0.045*) and nonnative species (p < 0.001**) differed between land-use groups (Figure 14). Post-hoc tests revealed no differences between individual impoundment groups for the percentage of restricted species, but the percentage of nonnative species was lower (p < 0.001) for Group I compared to Group V impoundments.
The percentage and relative abundance of restricted species decreased and the percentage and relative abundance of nonnative species increased as pH, specific conductance, and the percentage of upstream altered land increased (Table 15). Neither the percentage nor the relative abundance of widespread species was related to any of the watershed-disturbance variables. The relationship between altered land and the percentage of restricted and nonnative species was strongest at the watershed scale (Figure 15).
20

Table 14. Anuran species heard calling from 30 Pinelands impoundments. Refer to Table 2 for explanation of biogeographic classifications. Restricted Species Hyla andersonii Pine Barrens treefrog Rana virgatipes carpenter frog Widespread Species Bufo woodhousei fowleri Fowler’s toad Rana clamitans melanota green frog Rana utricularia southern leopard frog Nonnative Species Acris c. crepitans northern cricket frog Rana catesbeiana bullfrog
0
20
40
60
80
100
I II III IV VLand-use Groups
Rel.
Abun
d. (%
)
Restricted
Widespread
Nonnative
0
20
4060
80
100
I II III IV VLand-use Groups
% o
f Spe
cies
01
23
45
I II III IV VLand-use Groups
Rich
ness
Figure 14. Mean (± 1 SD) anuran-species richness by land-use group and mean percentage biogeographic composition and relative abundance by biogeographic class and land-use group. Refer to Table 1 for altered-land-percentage ranges and impoundment-sample size for each land-use group.
0.000.100.200.300.400.500.600.700.800.90
25 50 75 100 125 150 175 200 WBuffer Width (m)
Non
nativ
e Sp
earm
an r
-0.90-0.80-0.70-0.60-0.50-0.40-0.30-0.20-0.100.00
Res
trict
ed S
pear
man
r
NonnativeRestricted
Figure 15. Spearman rank correlation (r) relating the percentage of nonnative-anuran species to the percentage of altered land in cumulative buffers ranging from 0-25 m, 0-50 m, etc. and to the percentage of altered land in the upstream watershed (W). Open symbols denote Spearman rank correlations that are not significant at an initial p value of 0.05.
21

Results of the MRPP analyses indicated an overall difference in both the presence-
absence (A = 0.097, p = 0.005) and relative abundance (A = 0.101, p = 0.013) of anuran species between the five land-use groups. Post-hoc comparisons completed on anuran presence-absence data revealed differences between impoundment Group I and Groups IV (A = 0.102, p = 0.006*) and V (A = 0.120, p = 0.001**). Post-hoc comparisons of relative-abundance data indicated differences between land-use Groups I and V (A = 0.221, p < 0.001**) and between Group II and V (A = 0.116, p = 0.020*). Differences between impoundment groups revealed by the MRPP analysis of anuran relative abundance were associated with a contrast in the biogeography of anuran species identified through the indicator-species analysis (Table 16). Group I impoundments were characterized by two native-anuran indicator species, including the restricted carpenter frog and the widespread Fowler’s toad, whereas the most heavily altered Group V impoundments were characterized by the nonnative bullfrog.
Table 15. Spearman rank correlation results between anuran-species attributes and watershed-disturbance variables. Biogeographic attributes include both the percentage of the total number of anuran species (% species) and the relative abundance of individuals (% individuals) classified as restricted, widespread, and nonnative. Related tests significant before and after the Bonferroni adjustment are indicated with a single and double asterisk, respectively. For all tests, n = 30.
Altered Land pH Specific
Conductance Attribute r p r p r p Species richness -0.32 0.088 -0.29 0.118 -0.21 0.274 % Restricted species -0.62 <0.001 ** -0.64 <0.001 ** -0.39 0.031 * % Widespread species -0.24 0.194 -0.20 0.298 -0.09 0.622 % Nonnative species 0.78 <0.001 ** 0.74 <0.001 ** 0.45 0.013 **% Restricted individuals -0.59 0.001 ** -0.65 <0.001 ** -0.44 0.014 * % Widespread individuals -0.03 0.866 0.02 0.923 0.17 0.381 % Nonnative individuals 0.80 <0.001 ** 0.81 <0.001 ** 0.39 0.032 *
The restricted carpenter frog was heard calling from 16 impoundments and the nonnative
bullfrog was heard at 20 impoundments. These two species were heard calling together at eight sites, including at least one impoundment from each of the five land-use groups. Carpenter frog larvae were collected from 12 impoundments and bullfrog larvae were found at 14 impoundments. Tadpoles were present only at sites where adults of the species were heard calling. Tadpoles of both species were found together at one Group IV impoundment and two Group V impoundments.
The frequency of occurrence of carpenter frog adults and larvae decreased, whereas the frequency of occurrence of bullfrog adults and larvae increased along the watershed-disturbance gradient represented by the five impoundment groups (Figure 16). Logistic regression results revealed a negative relationship between the percentage of upstream-altered land and the occurrence of carpenter frog adults (p = 0.003**) and tadpoles (p = 0.046**) and a positive relationship between upstream altered land and the occurrence of bullfrog adults (p < 0.001**) and tadpoles (p < 0.001**) (Figure 17). For both species, the predicted probability of hearing adults was higher than the predicted probability of finding larvae, but the adult and larval probabilities converged for each species as the percentage of upstream-altered land increased. The probability of encountering adult and larval carpenter frogs was about 10% for impoundments in the most degraded watersheds, whereas the probability of encountering adult and larval bullfrogs was nearly 100% at these sites.
22

Table 16. Biogeography of anuran species associated with land-use groups shown to be different through the MRPP analysis. Values represent the number of indicator species in each land-use group for each comparison. Refer to Table 1 for the range of altered-land percentages assigned to each group. Comparisons
All groups I-V II-V Biogeography I II III IV V I V II V Restricted 0 0 0 0 0 1 0 1 0 Widespread 0 0 1 0 0 1 0 1 0 Nonnative 0 0 0 0 2 0 1 0 1
Carpenter Frog
0
25
50
75
100
I II III IV VLand-use Groups
Freq
uenc
y (%
) Bullfrog
0
25
50
75
100
I II III IV VLand-use Groups
Freq
uenc
y (%
) Adults Larvae
Adults
Tadpoles
Figure 16. Frequency of occurrence of carpenter frog and bullfrog adults and tadpoles for five impoundment land-use groups. Refer to Table 1 for altered-land-percentage ranges associated with each land-use group.
Carpenter Frogs
0
20
40
60
80
100
0 10 20 30 40 50 60Altered Land (%)
Prob
abili
ty o
f Occ
urre
nce
(%)
Adults TadpolesBullfrogs
0
20
40
60
80
100
0 10 20 30 40 50 6Altered Land (%)
Prob
abili
ty o
f Occ
urre
nce
(%)
0
Adults Tadpoles
Figure 17. Logit curves describing the probability of encountering carpenter frog and bullfrog adults and tadpoles at varying percentages of upstream-altered land.
23

SUMMARY
Differences in water-quality and species-composition between land-use groups were most apparent when comparing impoundments in watersheds with less than 10% altered land and those in watersheds with ≥ 40% altered land (Table 17). Differences in community composition between impoundments in the least-altered watersheds and both Group IV (30-39.9% altered land) and Group V (≥ 40% altered land) impoundments were evident across taxonomic groups, suggesting that at least for the impoundments we studied, community-composition variables are more sensitive measures of degradation thresholds than either water-quality or species-richness measures.
Table 17. Summary of water-quality, species-richness, and species-composition variables that differed between land-use groups. Water-quality and species-richness results were based on Kruskal-Wallis ANOVAs. Species-richness results are due to differences in restricted-, widespread-, and/or nonnative-species richness. Species-composition results were based on MRPP analyses, with results based on fish-frequency and anuran-presence/absence data represented by open symbols and results based on fish- and anuran-relative-abundance data represented by closed symbols. Land-use-group comparisons are ordered according to the number of variables shown to differ. Refer to Table 1 for the range of altered-land percentages assigned to each group. Land-use Group Comparisons Variables I-V I-IV II-V III-IV III-V I-III I-II IV-V
pH ■ Specific conductance ■ ■
Wat
er
Qua
lity
NO3-N ■ Herbaceous plants ■ ■ Woody plants ■ Fish ■ ■ Sp
ecie
s R
ichn
ess
Anurans ■ Herbaceous plants ■ ■ ■ ■ Woody plants ■ ■ ■ ■ Diatoms ■ ■ Fish □■ □■ □■ □ □ Sp
ecie
s C
ompo
sitio
n
Anurans □■ □ ■ The relationships between both biological-community and water-quality gradients and
watershed-disturbance gradients were similar to those reported in other Pinelands studies (Zampella and Laidig 1997, Zampella and Bunnell 1998, Zampella et al. 2006a, 2006b, 2007a, 2007b). Specific conductance, pH, and NO3-N thresholds were also similar to those reported by Zampella et al. (2007a) for streams in the Mullica River Basin. Unlike the present study, chloride and sulfate concentrations in the Mullica River Basin streams differed between different altered-land-use classes. The finding that the relationship between altered land and both pH and
24
specific conductance did not improve when the proximity of altered land was considered is also similar to that reported by Zampella et al. (2007a).
The contrast in species composition between reference sites, represented by impoundments with less than 10% altered land in the associated watersheds, and the more highly altered impoundments was consistent across taxonomic groups. Restricted-native plant, fish, and anuran species, and diatoms more typical of acid waters, characterized the reference-site impoundments, whereas nonnative plant and animal species and diatoms typical of circumneutral and alkaline waters were associated with the more degraded impoundments.
The relationship between altered land and pH, specific conductance, and nonnative herbaceous-plant, fish, and anuran species was stronger when using watershed-wide land use rather than adjacent land use. Species richness was not a consistent indicator of watershed disturbance across all taxonomic groups.
Even though the contrast between land-use groups from opposite ends of the watershed-disturbance gradient was most evident, the correlation, logistic regression, and graphical analyses indicated that variations in environmental and biological conditions occurred along a disturbance gradient represented by an increase in the percentage of upstream-altered land associated with each impoundment. As Booth et al. (2002) indicated, although a progressive decline in biological conditions may be evident only in more heavily altered watersheds, significant degradation can occur at any level of disturbance, and biological indicators typically demonstrate a continuum of responses to human disturbance rather than a threshold response.
ACKNOWLEDGEMENTS
Jennifer Ciraolo and Kimberly Spiegel assisted with various aspects of the study, including the collection of water-quality samples and data entry. Rex Lowe identified all diatoms. Funding for this study was provided by a grant from the U. S. Environmental Protection Agency (Wetlands Protection State Development Grant CD98237801-0) with additional funding from the National Park Service and the Pinelands Commission. The views and conclusions contained in this document are those of the authors and should not be interpreted as representing the opinions or policies of the U. S. Government. Mention of trade names or commercial products does not constitute their endorsement by the U. S. Government.
25
LITERATURE CITED Anderson, J. R., E. E. Hardy, J. T. Roach, and R. E. Witmer. 1976. A land use and land cover
classification system for use with remote sensor data. U.S. Geological Survey Professional Paper 964.
Arnold, C. L. and C. J. Gibbons. 1996. Impervious surface coverage: the emergence of a key environmental indicator. Journal of the American Planning Association 62:243-258.
Booth, D. B., D. Hartley, and R. Jackson. 2002. Forest cover, impervious-surface area, and the mitigation of stormwater impacts. Journal of the American Water Resources Association 38:835-845.
Carpenter, K. D. and I. R. Waite. 2000. Relations of habitat-specific algal assemblages to land use and water chemistry in the Willamette Basin, Oregon. Environmental Monitoring and Assessment 64:247-257.
Carpenter, S. R., N. F. Caraco, D. L. Correll, R. W. Howarth, A. N. Sharpley, and V. H. Smith. 1998. Nonpoint pollution of surface waters with phosphorus and nitrogen. Ecological Applications 8:559-568.
Charles D. F. 1985. Relationships between surface sediment diatom assemblages and lakewater characteristics in Adirondack lakes. Ecology 66:994-1011.
Conant, R. 1979. A zoogeographical review of the amphibians and reptiles of southern New Jersey, with emphasis on the Pine Barrens. Pages 467-488 in R.T.T. Forman, editor. Pine Barrens: ecosystem and landscape. Academic Press, New York, New York, USA.
Conant, R. and J. T. Collins. 1998. A field guide to reptiles and amphibians of eastern and central North America, 3rd Edition. Houghton Mifflin Co., Boston, Massachusetts, USA.
Dixit, S. S., J. P. Smol, D. F. Charles, R. M. Hughes, S. G. Paulsen, and G. B. Collins. 1999. Assessing water quality changes in the lakes of the northeastern United States using sediment diatoms. Canadian Journal of Fisheries and Aquatic Sciences 56:131-152.
Dow, C. L. and R. A. Zampella. 2000. Specific conductance and pH as indicators of watershed disturbance in streams of the New Jersey Pinelands, USA. Environmental Management 26:437-445.
Dufrêne, M. and P. Legendre. 1997. Species assemblages and indicator species: the need for a flexible asymmetrical approach. Ecological Monographs 67:345-366.
Gleason, H. A. and A. Cronquist. 1991. Manual of vascular plants of northeastern United States and adjacent Canada, 2nd Edition. New York Botanical Garden, Bronx, New York, USA.
Hastings, R.W. 1984. The fishes of the Mullica River, a naturally acid water system of the New Jersey Pine Barrens. Bulletin of the New Jersey Academy of Science 29:9-23.
Herlihy, A. T., J. L. Stoddard, and C. B. Johnson. 1998. The relationship between stream chemistry and watershed land cover data in the Mid-Atlantic Region, U.S. Water, Air, and Soil Pollution 105:377-386.
Johnson, L. B., C. Richards, G. E. Host, and J. W. Arthur. 1997. Landscape influences on water chemistry in midwestern stream ecosystems. Freshwater Biology 37:193-208.
Klein, R. D. 1979. Urbanization and stream quality impairment. Water Resources Bulletin 15: 948-963.
Leland, H. V. and S. D. Porter. 2000. Distribution of benthic algae in the upper Illinois River basin in relation to geology and land use. Freshwater Biology 44:279-301.
Lenat, D. R. and J. K. Crawford. 1994. Effects of land use on water quality and aquatic biota of three North Carolina Piedmont streams. Hydrobiologia 294:185-199.
26

Lowe, R. L. 1974. Environmental requirements and pollution tolerance of freshwater diatoms. EP A-670/4-74-005. U. S. Environmental Protection Agency, Cincinnati, Ohio, USA.
May, C. W., R. R. Horner, J. R. Karr, B. W. Mar, and E. B. Welch. 1997. Effects of urbanization on small streams in the Puget Sound ecoregion. Watershed Protection Techniques 2:483-494.
McCune, B. and M. J. Mefford. 1999. PC-ORD. Multivariate analysis of ecological data, Version 4. MjM Software Design, Gleneden Beach, Oregon, USA.
McCune, B. and J. B. Grace. 2002. Analysis of ecological communities. MjM Software Design, Gleneden Beach, Oregon, USA.
Meriläinen, J. 1967. The diatom flora and the hydrogen-ion concentration of the water. Annales Botanici Fennici 4:51-58.
Mueller-Dombois, D. and H. Ellenberg. 1974. Aims and methods of vegetation ecology. John Wiley and Sons, Inc., New York, New York, USA.
New Jersey Division of Fish and Game. 1950. Fisheries survey report no. 1. Lakes and ponds. New Jersey Department of Conservation and Economic Development, Trenton, New Jersey, USA.
New Jersey Division of Fish and Game. 1951. Fisheries survey report no. 2. Lakes and ponds. New Jersey Department of Conservation and Economic Development, Trenton, New Jersey, USA.
New Jersey Division of Fish and Game. 1957. Fisheries Survey Report no. 3. Lakes and ponds. New Jersey Department of Conservation and Economic Development, Trenton, New Jersey, USA.
Osborne, L. L. and M. J. Wiley. 1988. Empirical relationships between land use/cover and stream water quality in an agricultural watershed. Journal of Environmental Management 26:9-27.
Page, L. M. and B. M. Burr. 1991. A field guide to freshwater fishes of North America north of Mexico. Houghton Mifflin Co., New York, New York, USA.
Patrick, R. 1996. Rivers of the United States. Volume III: the eastern and southeastern states. John Wiley and Sons, Inc., New York, New York, USA.
Patrick, R., B. Matson, and L. Anderson. 1979. Streams and lakes in the Pine Barrens. Pages 169-193 in R.T.T. Forman, editor. Pine Barrens: ecosystem and landscape. Academic Press, New York, New York, USA.
Rhodes, A. L., R. M. Newton, and A. Pufall. 2001. Influences of land use on water quality of a diverse New England watershed. Environmental Science and Technology 35:3640-3645.
Rice, W. R. 1989. Analyzing tables of statistical tests. Evolution 43:223-225. Rice, W. R. 1990. A consensus combined p-value test and family-wide significance of
component tests. Biometrics 46:303-308. Siegel, S. and N. J. Castellan, Jr. 1988. Nonparametric statistics for the behavioral sciences.
Second Edition. McGraw-Hill Inc., New York, New York, USA. Sliva, L. and D. D. Williams. 2001. Buffer zone versus whole catchment approaches to studying
land use impact on river water quality. Water Research 35:3462-3472. Standard Methods for the Examination of Water and Wastewater. 1998. 20th Edition. American
Public Health Association, American Water Works Association, Water Environment Federation, Washington D.C., USA.
Steedman, R. J. 1988. Modification and assessment of an index of biotic integrity to quantify stream quality in southern Ontario. Canadian Journal of Fisheries and Aquatic Sciences 45:492-501.
Stepenuck, K. F., R. L. Crunkilton and L. Wang. 2002. Impacts of urban landuse on macroinvertebrate communities in southeastern Wisconsin streams. Journal of the American Water Resources Association 38:1041-1051.
Stone, W. 1911. The plants of southern New Jersey. Report of the New Jersey State Museum 1910. Trenton, New Jersey, USA.
27
28
Tufford, D. L., C. L. Samarghitan, H. N. Mckellar, Jr., D. E. Porter, and J. R. Hussey. 2003. Impacts of urbanization on nutrient concentrations in small southeastern coastal streams. Journal of the American Water Resources Association 39:301-312.
van Dam, H., A. Mertens, and J. Sinkeldam. 1994. A coded checklist and ecological indicator values of freshwater diatoms from The Netherlands. Netherlands Journal of Aquatic Ecology 28:117-133.
Wacker, P. O. 1979. Human exploitation of the New Jersey Pine Barrens before 1900. Pine Barrens: ecosystem and landscape. Pages 3-23 in R.T.T. Forman, editor. Pine Barrens: ecosystem and landscape. Academic Press, New York, New York, USA.
Waite, I. R., and K. D. Carpenter. 2000. Associations among fish assemblage structure and environmental variables in Willamette Basin Streams, Oregon. Transactions of the American Fisheries Society 129:754-770.
Wang, L., J. Lyons, P. Kanehl, and R. Gatti. 1997. Influences of watershed land use on habitat quality and biotic integrity in Wisconsin streams. Fisheries 22:6-12.
Zampella, R. A. 1994. Characterization of surface water quality along a watershed disturbance gradient. Water Resources Bulletin 30:605-611.
Zampella, R. A. and J. F. Bunnell. 1998. Use of reference-site fish assemblages to assess aquatic degradation in Pinelands streams. Ecological Applications 8:645-658.
Zampella, R. A. and J. F. Bunnell. 2000. The distribution of anurans in two river systems of a Coastal Plain watershed. Journal of Herpetology 34:210-221.
Zampella, R. A. and K. J. Laidig. 1997. Effect of watershed disturbance on Pinelands stream vegetation. Journal of the Torrey Botanical Society 124:52-66.
Zampella, R. A., J. F. Bunnell, K. J. Laidig, and C. L. Dow. 2001. The Mullica River Basin: a report to the Pinelands Commission on the status of the landscape and selected aquatic and wetland resources. Pinelands Commission, New Lisbon, New Jersey, USA.
Zampella, R. A., J. F. Bunnell, K. J. Laidig, and N. A. Procopio. 2003. The Rancocas Creek Basin: a report to the Pinelands Commission on the status of selected aquatic and wetland resources. Pinelands Commission, New Lisbon, New Jersey, USA.
Zampella, R. A., J. F. Bunnell, K. J. Laidig, and N. A. Procopio. 2005. The Great Egg Harbor River Watershed Management Area: a report to the Pinelands Commission on the status of selected aquatic and wetland resources. Pinelands Commission, New Lisbon, New Jersey, USA.
Zampella, R. A., J. F. Bunnell, K. J. Laidig, and N. A. Procopio. 2006a. Using multiple indicators to evaluate the ecological integrity of a coastal plain stream system. Ecological Indicators 6:644-663.
Zampella, R. A., J. F. Bunnell, K. J. Laidig, and N. A. Procopio. 2006b. The Barnegat Bay Watershed: a report to the Pinelands Commission on the status of selected aquatic and wetland resources. Pinelands Commission, New Lisbon, New Jersey, USA.
Zampella, R. A., N. A. Procopio, R. G. Lathrop, and C. L. Dow. 2007a. Relationship of land-use/land-cover patterns and surface-water quality in the Mullica River Basin. Journal of the American Water Resources Association 43:594-604.
Zampella, R. A., K. J. Laidig, and R. L. Lowe. 2007b. Distribution of diatoms in relation to land use and pH in blackwater Coastal Plain streams. Environmental Management 39:369-384.

Appendix 1. Site-location information for 43 impoundments in the New Jersey Pinelands. An asterisk next to the site code denotes the 13 impoundments that were not selected for biological surveys. With one exception (HHOCUSHM), site codes match those used in previous Pinelands Commission reports. Latitude, longitude, and USGS 7.5 minute topographic quadrangle names are in parentheses. Latitude and longitude represent the water-quality sampling points. Sites are ordered alphabetically by impoundment name.
Impoundment Name and Description Site Code Atco Lake MHAATCOL*
Waterford Twp., Camden Co. (lat 39°45'32.42", long 74°53'00.58", Clementon quad). Atsion Lake MMUATSIO
Waterford Twp., Camden Co. (lat 39°44'25.42", long 74°43'35.57", Atsion quad). Bamber Lake CCEBAMBR
Lacey Twp., Ocean Co. (lat 39°53'50.25", long 74°18'58.63", Keswick Grove quad). Batsto Lake BBATLAKE
Washington Twp., Burlington Co. (lat 39°38'31.50", long 74°38'59.62", Atsion quad). Breeches Branch Impoundment OBRESTRM*
Washington Twp., Burlington Co. (lat 39°44'04.20", long 74°29'31.47", Oswego Lake quad). Cedar Lake HMAJACKS*
Buena Vista Twp., Atlantic Co. (lat 39°35'07.29", long 74°54'06.21", Buena quad). Centennial Lake WHACENTL*
Medford Twp., Burlington Co. (lat 39°50'31.91", long 74°50'58.25", Medford Lakes quad). Chatsworth Lake WWE532LK
Woodland Twp., Burlington Co. (lat 39°48'51.99", long 74°32'49.34", Chatsworth quad). Country Lake GPOWISSA
Pemberton Twp., Burlington Co. (lat 39°56'48.68", long 74°33'20.12", Browns Mills quad). Cranes Lake HHORT538
Monroe Twp., Gloucester Co. (lat 39°37'14.09", long 74°55'37.29", Buena quad). Cushman Lake HHOCUSHM
Folsom Boro, Gloucester Co. (lat 39°35'44.03", long 74°52'00.64", Newtonville quad). Davenport Impoundment RDALACEL
Lacey Twp., Ocean Co. (lat 39°55'35.97", long 74°20'17.97", Keswick Grove quad). Diamond Lake HHODIAMO*
Monroe Twp., Gloucester Co. (lat 39°36'42.06", long 74°55'08.27", Buena quad). Egg Harbor City Lake LINLAKEU
Egg Harbor City Twp., Atlantic Co. (lat 39°33'33.20", long 74°36'24.18", Green Bank quad) Hammonton Lake LHAMLAKE
Hammonton Twp., Atlantic Co. (lat 39°37'51.67", long 74°46'16.13", Hammonton quad). Harrisville Pond OOSHARLK*
Washington/Bass River Twp., Burlington Co. (lat 39°39'48.45", long 74°31'24.44", Jenkins quad). Horicon Lake TUNHORIC
Lakehurst Twp., Ocean Co. (lat 40°00'34.82", long 74°19'06.74", Lakehurst quad). Howardsville Impoundment OOSHOWIM
Barnegat Twp., Ocean Co. (lat 39°49'01.34", long 74°21'59.93", Brookville quad). Indian Mills Lake BMULAKED
Shamong Twp., Burlington Co. (lat 39°47'41.70", long 74°44'29.73", Indian Mills quad). Jennings Lake WBAJENNL
Evesham Twp., Burlington Co. (lat 39°51'56.45", long 74°53'40.96", Clementon quad). Kettle Run Impoundment WKEGIRLS
Medford Twp., Burlington Co. (lat 39°49'05.01", long 74°51'40.11", Medford Lakes quad). Lady's Lake MMULADYL
Waterford/Medford Twp., Camden/Burlington Co. (lat 39°47'09.39", long 74°51'36.53", Medford Lakes quad). Lake Absegami AEAABSDW
Bass River Twp., Burlington Co. (lat 39°37'37.79", long 74°25'54.80", New Gretna quad).
29
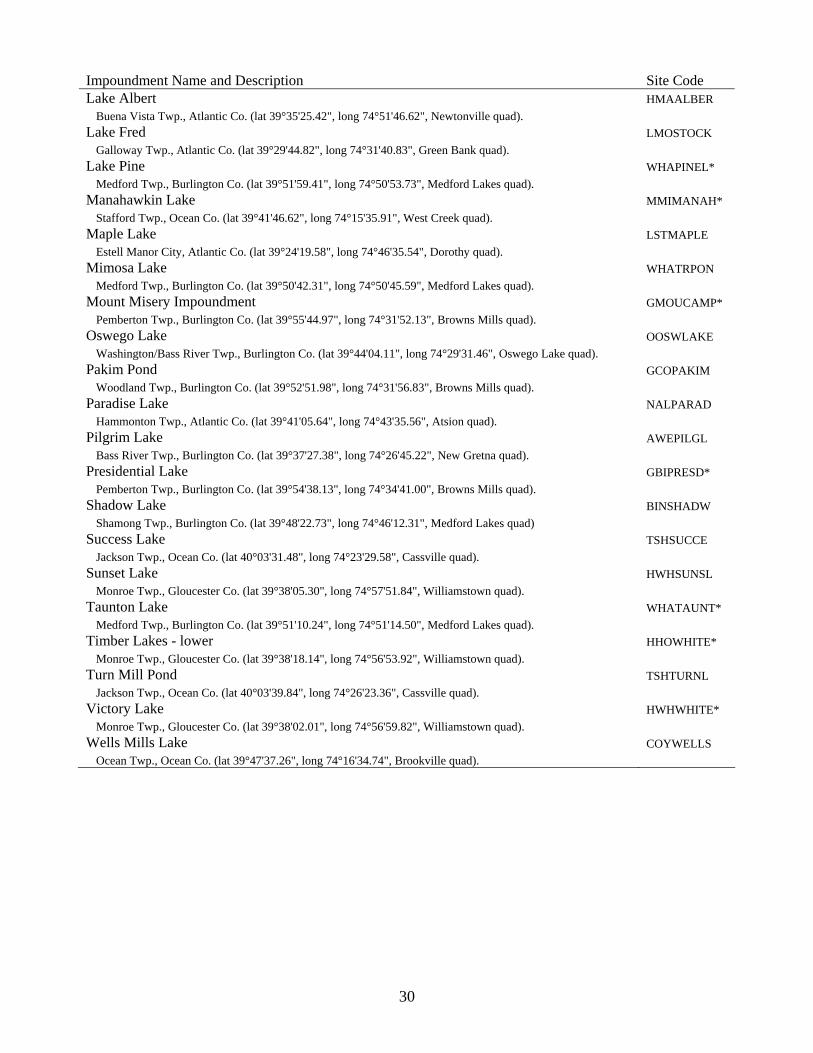
30
Impoundment Name and Description Site Code Lake Albert HMAALBER
Buena Vista Twp., Atlantic Co. (lat 39°35'25.42", long 74°51'46.62", Newtonville quad). Lake Fred LMOSTOCK
Galloway Twp., Atlantic Co. (lat 39°29'44.82", long 74°31'40.83", Green Bank quad). Lake Pine WHAPINEL*
Medford Twp., Burlington Co. (lat 39°51'59.41", long 74°50'53.73", Medford Lakes quad). Manahawkin Lake MMIMANAH*
Stafford Twp., Ocean Co. (lat 39°41'46.62", long 74°15'35.91", West Creek quad). Maple Lake LSTMAPLE
Estell Manor City, Atlantic Co. (lat 39°24'19.58", long 74°46'35.54", Dorothy quad). Mimosa Lake WHATRPON
Medford Twp., Burlington Co. (lat 39°50'42.31", long 74°50'45.59", Medford Lakes quad). Mount Misery Impoundment GMOUCAMP*
Pemberton Twp., Burlington Co. (lat 39°55'44.97", long 74°31'52.13", Browns Mills quad). Oswego Lake OOSWLAKE
Washington/Bass River Twp., Burlington Co. (lat 39°44'04.11", long 74°29'31.46", Oswego Lake quad). Pakim Pond GCOPAKIM
Woodland Twp., Burlington Co. (lat 39°52'51.98", long 74°31'56.83", Browns Mills quad). Paradise Lake NALPARAD
Hammonton Twp., Atlantic Co. (lat 39°41'05.64", long 74°43'35.56", Atsion quad). Pilgrim Lake AWEPILGL
Bass River Twp., Burlington Co. (lat 39°37'27.38", long 74°26'45.22", New Gretna quad). Presidential Lake GBIPRESD*
Pemberton Twp., Burlington Co. (lat 39°54'38.13", long 74°34'41.00", Browns Mills quad). Shadow Lake BINSHADW
Shamong Twp., Burlington Co. (lat 39°48'22.73", long 74°46'12.31", Medford Lakes quad) Success Lake TSHSUCCE
Jackson Twp., Ocean Co. (lat 40°03'31.48", long 74°23'29.58", Cassville quad). Sunset Lake HWHSUNSL
Monroe Twp., Gloucester Co. (lat 39°38'05.30", long 74°57'51.84", Williamstown quad). Taunton Lake WHATAUNT*
Medford Twp., Burlington Co. (lat 39°51'10.24", long 74°51'14.50", Medford Lakes quad). Timber Lakes - lower HHOWHITE*
Monroe Twp., Gloucester Co. (lat 39°38'18.14", long 74°56'53.92", Williamstown quad). Turn Mill Pond TSHTURNL
Jackson Twp., Ocean Co. (lat 40°03'39.84", long 74°26'23.36", Cassville quad). Victory Lake HWHWHITE*
Monroe Twp., Gloucester Co. (lat 39°38'02.01", long 74°56'59.82", Williamstown quad). Wells Mills Lake COYWELLS
Ocean Twp., Ocean Co. (lat 39°47'37.26", long 74°16'34.74", Brookville quad).

Appendix 2. Environmental variables for 30 impoundments in the New Jersey Pinelands. Specific conductance and pH were measured during 2003-2005. Plants, fish, and anurans were sampled at all 30 impoundments. An “x” indicates impoundments where diatoms and nutrients were also sampled. Impoundments are ordered by increasing percentage of altered land within each land-use group. Altered land represents the combined percentages of developed land and upland agriculture. Refer to Table 1 for the range of altered-land percentages assigned to each group and Appendix 1 for impoundment-site descriptions.
Site Name Land
-use
Gro
up
Dev
elop
ed L
and
(%)
Upl
and
Agr
icul
ture
(%)
Alte
red
Land
(%)
Lake
Are
a (h
a)
Med
ian
pH
Med
ian
Spec
ific
Con
duct
ance
(µS
cm-1)
Mea
n W
ater
D
epth
(cm
)
Mea
n Fr
eque
ncy
of
Occ
urre
nce
of S
and
(%)
Med
ian
Emer
gent
- co
ver R
ank
Med
ian
Floa
ting-
co
ver R
ank
Med
ian
Subm
erge
d-
cove
r Ran
k
Dia
tom
s
Nut
rient
s
Howardsville Imp. I 0.0 0.0 0.0 5.7 4.38 45.9 30.1 81.1 0.0 0.0 5.0 Pilgrim Lake I 0.4 0.2 0.6 8.6 4.58 35.2 42.3 75.6 1.0 0.0 5.0 x x Bamber Lake I 0.8 0.5 1.3 24.4 4.76 30.2 45.5 64.4 0.0 2.0 5.0 x x Oswego Lake I 1.0 0.4 1.4 44.2 4.42 40.0 41.6 60.0 2.0 0.5 0.0 x Pakim Pond I 2.2 0.0 2.2 1.8 4.14 51.5 49.6 53.3 1.5 0.0 1.5 Lake Absegami I 3.3 0.0 3.3 21.3 4.40 80.0 34.1 100.0 2.0 0.0 0.0 x x Wells Mills Lake I 4.0 0.4 4.4 9.6 4.68 52.7 38.9 58.9 1.0 0.0 3.0 x x Chatsworth Lake I 2.9 2.3 5.2 34.0 4.31 52.1 37.1 90.0 2.0 0.0 0.0 x x Horicon Lake I 5.7 0.7 6.4 24.0 4.34 57.6 56.9 53.3 0.0 0.3 3.5 x x Country Lake I 8.0 1.6 9.6 16.3 4.48 58.5 26.8 93.3 0.0 0.0 0.0 x x Atsion Lake II 9.5 2.8 12.3 41.3 4.69 53.3 46.9 91.1 0.0 0.0 2.0 x x Maple Lake II 11.1 2.4 13.5 12.4 5.98 38.2 49.6 88.9 1.0 0.0 3.0 Batsto Lake II 5.4 9.3 14.7 27.4 5.54 47.2 37.9 86.7 3.0 0.5 1.5 x Success Lake II 6.7 8.6 15.3 23.6 4.49 55.5 29.6 63.3 0.5 0.0 0.0 x x Egg Harbor City Lake III 11.0 9.1 20.1 7.3 4.29 62.0 21.5 96.7 0.0 0.0 5.0 x Mimosa Lake III 23.0 0.2 23.2 2.9 5.78 57.1 60.1 100.0 0.0 0.0 3.0 Lake Fred III 13.4 15.5 28.9 15.1 5.72 74.9 28.5 74.4 0.3 0.5 5.0 x x Kettle Run Imp. III 27.7 1.9 29.6 4.1 6.12 77.9 45.3 75.6 0.0 2.0 1.5 x x Lake Albert IV 7.6 24.6 32.2 7.7 6.22 49.5 44.1 93.3 0.5 0.0 0.5 x x Cushman Lake IV 18.9 15.1 34.0 26.8 6.26 56.8 33.9 97.8 0.0 0.0 1.0 x x Davenport Imp. IV 35.1 0.8 35.9 9.9 4.84 69.5 45.9 68.9 0.5 1.0 1.5 Turn Mill Pond IV 13.1 23.9 37.0 27.5 6.27 84.1 37.0 76.7 0.0 0.5 4.0 x x Shadow Lake V 28.7 13.4 42.1 3.5 6.03 87.3 47.8 28.9 0.3 0.5 2.0 x x Paradise Lake V 18.8 24.2 43.0 8.9 6.17 76.8 56.6 21.1 1.5 0.0 2.0 x x Sunset Lake V 25.3 18.1 43.4 19.4 6.65 53.3 40.2 76.7 1.5 0.0 1.5 x x Cranes Lake V 24.3 22.7 47.0 15.3 6.63 61.8 39.7 93.3 1.5 2.0 4.5 x x Lady's Lake V 42.2 6.9 49.1 4.6 6.63 164.2 46.4 66.7 0.0 0.5 5.0 Jennings Lake V 50.8 1.6 52.4 1.2 6.78 173.7 43.0 1.7 1.0 1.0 5.0 x x Indian Mills Lake V 23.8 34.2 58.0 13.2 6.57 214.5 47.7 5.6 0.0 4.5 0.0 x x Hammonton Lake V 52.3 5.8 58.1 24.8 6.64 121.5 39.1 91.1 0.0 0.0 5.0 x
3
31

32
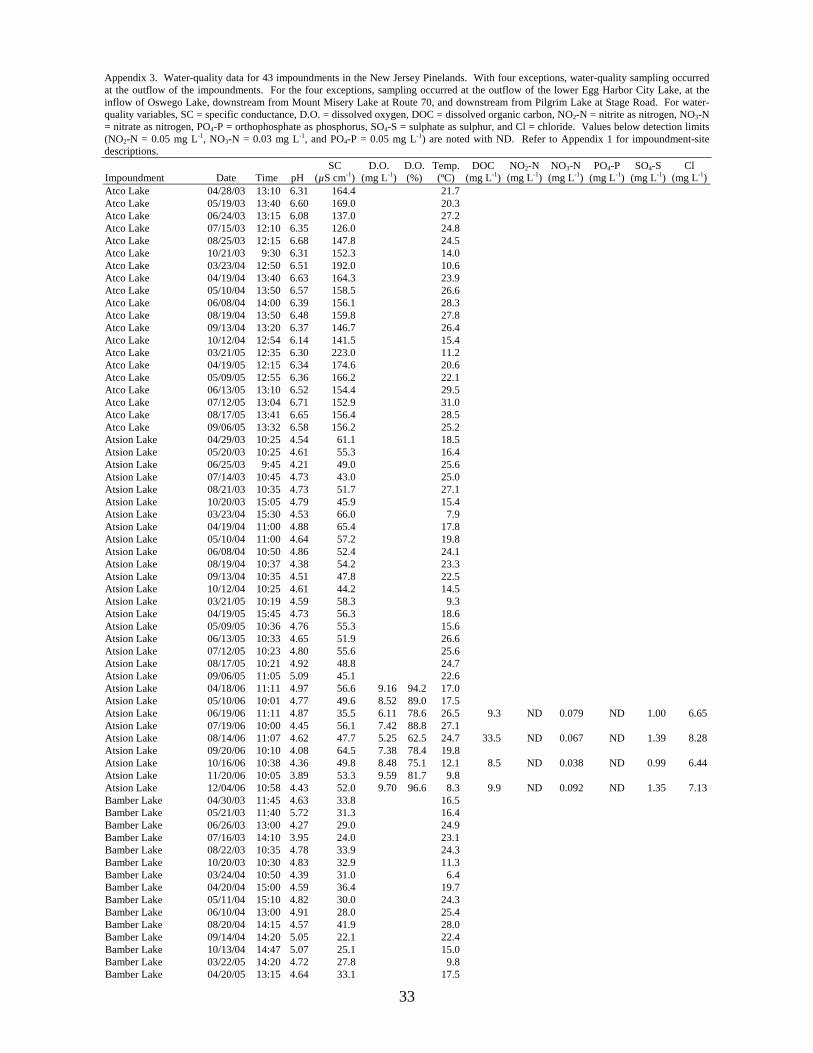
Appendix 3. Water-quality data for 43 impoundments in the New Jersey Pinelands. With four exceptions, water-quality sampling occurredat the outflow of the impoundments. For the four exceptions, sampling occurred at the outflow of the lower Egg Harbor City Lake, at the inflow of Oswego Lake, downstream from Mount Misery Lake at Route 70, and downstream from Pilgrim Lake at Stage Road. For water-quality variables, SC = specific conductance, D.O. = dissolved oxygen, DOC = dissolved organic carbon, NO2-N = nitrite as nitrogen, NO3-N = nitrate as nitrogen, PO4-P = orthophosphate as phosphorus, SO4-S = sulphate as sulphur, and Cl = chloride. Values below detection limits (NO2-N = 0.05 mg L-1, NO3-N = 0.03 mg L-1, and PO4-P = 0.05 mg L-1) are noted with ND. Refer to Appendix 1 for impoundment-site descriptions.
Impoundment Date Time pH SC
(µS cm-1)D.O.
(mg L-1)D.O. (%)
Temp.(ºC)
DOC (mg L-1)
NO2-N (mg L-1)
NO3-N (mg L-1)
PO4-P (mg L-1)
SO4-S (mg L-1)
Cl (mg L-1)
Atco Lake 04/28/03 13:10 6.31 164.4 21.7 Atco Lake 05/19/03 13:40 6.60 169.0 20.3 Atco Lake 06/24/03 13:15 6.08 137.0 27.2 Atco Lake 07/15/03 12:10 6.35 126.0 24.8 Atco Lake 08/25/03 12:15 6.68 147.8 24.5 Atco Lake 10/21/03 9:30 6.31 152.3 14.0 Atco Lake 03/23/04 12:50 6.51 192.0 10.6 Atco Lake 04/19/04 13:40 6.63 164.3 23.9 Atco Lake 05/10/04 13:50 6.57 158.5 26.6 Atco Lake 06/08/04 14:00 6.39 156.1 28.3 Atco Lake 08/19/04 13:50 6.48 159.8 27.8 Atco Lake 09/13/04 13:20 6.37 146.7 26.4 Atco Lake 10/12/04 12:54 6.14 141.5 15.4 Atco Lake 03/21/05 12:35 6.30 223.0 11.2 Atco Lake 04/19/05 12:15 6.34 174.6 20.6 Atco Lake 05/09/05 12:55 6.36 166.2 22.1 Atco Lake 06/13/05 13:10 6.52 154.4 29.5 Atco Lake 07/12/05 13:04 6.71 152.9 31.0 Atco Lake 08/17/05 13:41 6.65 156.4 28.5 Atco Lake 09/06/05 13:32 6.58 156.2 25.2 Atsion Lake 04/29/03 10:25 4.54 61.1 18.5 Atsion Lake 05/20/03 10:25 4.61 55.3 16.4 Atsion Lake 06/25/03 9:45 4.21 49.0 25.6 Atsion Lake 07/14/03 10:45 4.73 43.0 25.0 Atsion Lake 08/21/03 10:35 4.73 51.7 27.1 Atsion Lake 10/20/03 15:05 4.79 45.9 15.4 Atsion Lake 03/23/04 15:30 4.53 66.0 7.9 Atsion Lake 04/19/04 11:00 4.88 65.4 17.8 Atsion Lake 05/10/04 11:00 4.64 57.2 19.8 Atsion Lake 06/08/04 10:50 4.86 52.4 24.1 Atsion Lake 08/19/04 10:37 4.38 54.2 23.3 Atsion Lake 09/13/04 10:35 4.51 47.8 22.5 Atsion Lake 10/12/04 10:25 4.61 44.2 14.5 Atsion Lake 03/21/05 10:19 4.59 58.3 9.3 Atsion Lake 04/19/05 15:45 4.73 56.3 18.6 Atsion Lake 05/09/05 10:36 4.76 55.3 15.6 Atsion Lake 06/13/05 10:33 4.65 51.9 26.6 Atsion Lake 07/12/05 10:23 4.80 55.6 25.6 Atsion Lake 08/17/05 10:21 4.92 48.8 24.7 Atsion Lake 09/06/05 11:05 5.09 45.1 22.6 Atsion Lake 04/18/06 11:11 4.97 56.6 9.16 94.2 17.0 Atsion Lake 05/10/06 10:01 4.77 49.6 8.52 89.0 17.5 Atsion Lake 06/19/06 11:11 4.87 35.5 6.11 78.6 26.5 9.3 ND 0.079 ND 1.00 6.65Atsion Lake 07/19/06 10:00 4.45 56.1 7.42 88.8 27.1 Atsion Lake 08/14/06 11:07 4.62 47.7 5.25 62.5 24.7 33.5 ND 0.067 ND 1.39 8.28Atsion Lake 09/20/06 10:10 4.08 64.5 7.38 78.4 19.8 Atsion Lake 10/16/06 10:38 4.36 49.8 8.48 75.1 12.1 8.5 ND 0.038 ND 0.99 6.44Atsion Lake 11/20/06 10:05 3.89 53.3 9.59 81.7 9.8 Atsion Lake 12/04/06 10:58 4.43 52.0 9.70 96.6 8.3 9.9 ND 0.092 ND 1.35 7.13Bamber Lake 04/30/03 11:45 4.63 33.8 16.5 Bamber Lake 05/21/03 11:40 5.72 31.3 16.4 Bamber Lake 06/26/03 13:00 4.27 29.0 24.9 Bamber Lake 07/16/03 14:10 3.95 24.0 23.1 Bamber Lake 08/22/03 10:35 4.78 33.9 24.3 Bamber Lake 10/20/03 10:30 4.83 32.9 11.3 Bamber Lake 03/24/04 10:50 4.39 31.0 6.4 Bamber Lake 04/20/04 15:00 4.59 36.4 19.7 Bamber Lake 05/11/04 15:10 4.82 30.0 24.3 Bamber Lake 06/10/04 13:00 4.91 28.0 25.4 Bamber Lake 08/20/04 14:15 4.57 41.9 28.0 Bamber Lake 09/14/04 14:20 5.05 22.1 22.4 Bamber Lake 10/13/04 14:47 5.07 25.1 15.0 Bamber Lake 03/22/05 14:20 4.72 27.8 9.8 Bamber Lake 04/20/05 13:15 4.64 33.1 17.5
33

Impoundment Date Time pH SC
(µS cm-1)D.O.
(mg L-1)D.O. (%)
Temp.(ºC)
DOC (mg L-1)
NO2-N (mg L-1)
NO3-N (mg L-1)
PO4-P (mg L-1)
SO4-S (mg L-1)
Cl (mg L-1)
Bamber Lake 05/10/05 14:28 4.73 30.3 17.8 Bamber Lake 06/14/05 12:31 4.98 29.8 27.6 Bamber Lake 07/13/05 13:08 4.64 32.8 25.1 Bamber Lake 08/18/05 14:15 5.03 25.5 25.3 Bamber Lake 09/07/05 12:27 5.72 29.0 22.2 Bamber Lake 04/19/06 12:25 4.82 25.5 9.47 98.3 16.7 Bamber Lake 05/11/06 11:41 5.04 22.2 8.65 89.9 16.6 Bamber Lake 06/20/06 12:31 5.00 19.3 8.21 87.2 24.9 3.8 ND ND ND 0.48 3.31Bamber Lake 07/20/06 12:20 4.98 25.4 8.01 83.2 26.9 Bamber Lake 08/15/06 12:40 4.92 23.0 8.13 93.5 23.3 4.0 ND ND ND 0.54 4.48Bamber Lake 09/21/06 12:26 4.86 38.8 7.94 78.3 17.2 Bamber Lake 10/17/06 9:06 4.67 34.3 9.07 83.7 11.0 6.5 ND ND ND 0.68 4.07Bamber Lake 11/21/06 12:25 3.98 35.6 9.01 93.2 8.3 Bamber Lake 12/05/06 12:10 4.34 36.1 8.65 70.3 5.4 6.3 ND ND ND 0.91 3.99Batsto Lake 04/29/03 15:00 4.75 52.1 17.2 Batsto Lake 05/20/03 13:50 5.83 45.8 15.7 Batsto Lake 06/25/03 12:35 4.65 41.0 22.4 Batsto Lake 07/14/03 13:35 5.51 33.0 22.2 Batsto Lake 08/21/03 13:45 5.87 50.3 24.1 Batsto Lake 10/20/03 14:30 5.56 38.6 13.3 Batsto Lake 03/24/04 14:30 4.54 60.0 6.8 Batsto Lake 04/20/04 10:50 4.08 57.5 18.5 Batsto Lake 05/11/04 11:25 5.62 52.2 20.9 Batsto Lake 06/09/04 14:00 5.88 42.7 23.0 Batsto Lake 08/20/04 10:12 5.12 51.3 23.1 Batsto Lake 09/14/04 11:05 5.48 44.6 19.8 Batsto Lake 10/13/04 11:00 5.40 37.0 13.1 Batsto Lake 03/22/05 11:05 5.34 50.8 8.8 Batsto Lake 04/20/05 9:25 4.55 52.1 15.9 Batsto Lake 05/10/05 10:51 5.67 47.6 16.0 Batsto Lake 06/14/05 9:02 5.83 46.8 24.4 Batsto Lake 07/13/05 9:21 5.60 66.7 23.8 Batsto Lake 08/17/05 16:00 5.92 46.2 23.6 Batsto Lake 09/07/05 8:35 5.77 32.2 17.8 Batsto Lake 04/18/06 13:55 5.61 38.0 8.94 90.2 15.9 Batsto Lake 05/10/06 13:33 6.11 34.9 8.91 89.5 16.8 Batsto Lake 06/20/06 9:11 5.93 30.5 8.08 93.5 23.2 5.4 ND 0.239 ND 0.89 5.31Batsto Lake 07/19/06 13:35 5.77 41.2 7.83 79.8 28.9 Batsto Lake 08/14/06 14:47 6.33 27.0 6.45 78.4 20.8 5.6 ND 0.084 ND 0.95 4.67Batsto Lake 09/20/06 13:58 4.45 51.2 7.65 73.8 17.2 Batsto Lake 10/16/06 14:55 4.50 54.1 8.75 86.6 10.4 7.8 ND 0.086 ND 1.65 6.98Batsto Lake 11/20/06 13:40 4.13 54.1 9.32 98.1 9.5 Batsto Lake 12/04/06 10:11 4.83 52.6 9.55 78.7 7.3 9.0 ND 0.193 ND 1.58 6.48Breeches Branch Imp. 05/21/03 13:50 4.66 48.2 17.3 Breeches Branch Imp. 06/26/03 15:25 4.05 39.0 31.2 Breeches Branch Imp. 07/16/03 11:40 3.11 35.0 19.5 Breeches Branch Imp. 08/22/03 12:50 4.25 43.9 29.2 Breeches Branch Imp. 10/20/03 12:35 4.34 42.3 14.2 Breeches Branch Imp. 03/24/04 13:15 4.12 49.0 9.9 Breeches Branch Imp. 04/20/04 12:30 4.15 51.7 21.4 Breeches Branch Imp. 05/11/04 12:52 4.30 44.4 26.0 Breeches Branch Imp. 06/10/04 9:20 4.74 34.9 25.3 Breeches Branch Imp. 08/20/04 11:43 4.36 45.1 27.8 Breeches Branch Imp. 09/14/04 12:05 4.42 37.6 23.7 Breeches Branch Imp. 10/13/04 12:20 4.30 42.6 15.7 Breeches Branch Imp. 03/22/05 12:05 4.18 45.1 11.2 Breeches Branch Imp. 04/20/05 11:10 4.08 49.7 18.2 Breeches Branch Imp. 05/10/05 12:14 4.30 42.1 19.5 Breeches Branch Imp. 06/14/05 10:14 4.29 41.7 28.6 Breeches Branch Imp. 07/13/05 10:28 4.33 43.8 26.3 Breeches Branch Imp. 08/18/05 11:20 4.31 44.7 25.3 Breeches Branch Imp. 09/07/05 9:46 4.55 40.3 22.1 Breeches Branch Imp. 04/19/06 10:26 4.30 38.3 8.53 87.5 17.0 Breeches Branch Imp. 05/11/06 10:00 4.38 37.6 7.45 81.4 18.0 Breeches Branch Imp. 06/20/06 10:58 4.36 27.7 5.85 70.9 27.2 5.4 ND ND ND 0.80 3.31Breeches Branch Imp. 07/20/06 10:40 4.25 40.1 6.89 77.9 28.0 Breeches Branch Imp. 08/15/06 11:14 4.16 37.3 7.48 91.9 24.9 4.8 ND ND ND 1.41 4.56Breeches Branch Imp. 09/21/06 10:46 4.18 45.3 6.55 74.3 18.3 Breeches Branch Imp. 10/16/06 13:10 4.25 44.6 6.78 80.5 16.8 9.5 ND ND ND 0.88 4.54Breeches Branch Imp. 11/21/06 10:45 3.75 50.1 7.89 87.9 9.0 Breeches Branch Imp. 12/05/06 9:50 3.87 48.9 7.39 58.2 5.7 14.3 ND ND ND 0.83 3.63
34
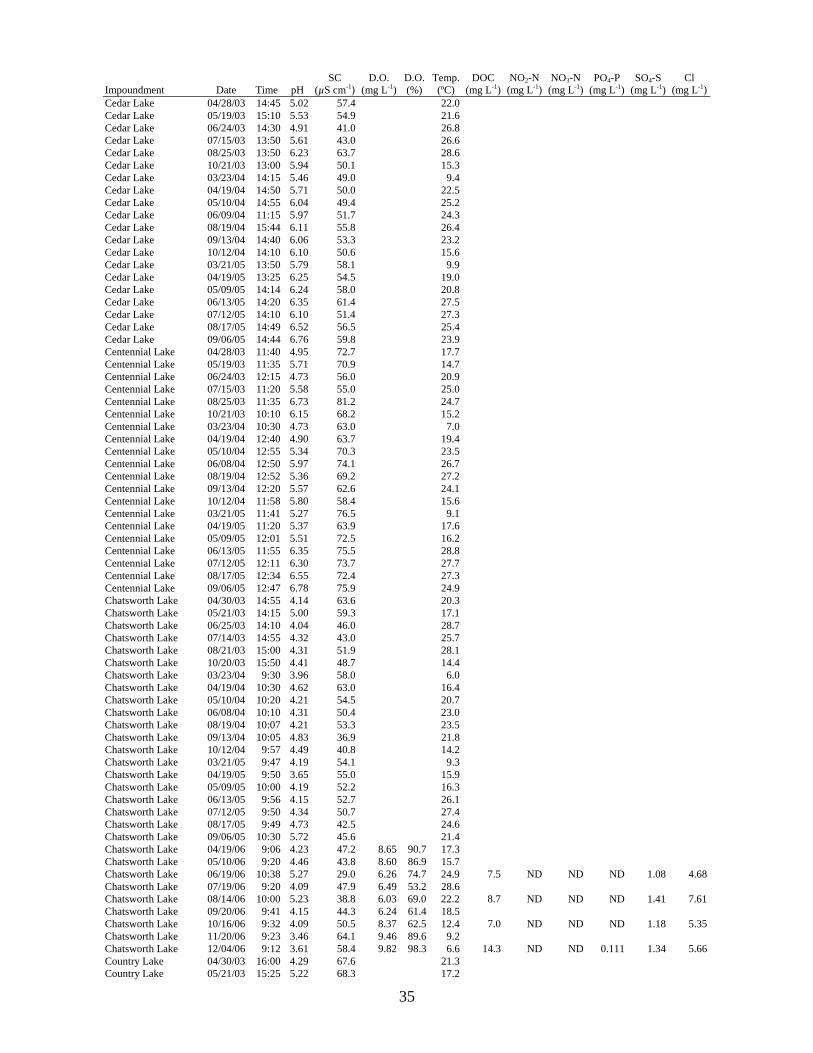
Impoundment Date Time pH SC
(µS cm-1)D.O.
(mg L-1)D.O. (%)
Temp.(ºC)
DOC (mg L-1)
NO2-N (mg L-1)
NO3-N (mg L-1)
PO4-P (mg L-1)
SO4-S (mg L-1)
Cl (mg L-1)
Cedar Lake 04/28/03 14:45 5.02 57.4 22.0 Cedar Lake 05/19/03 15:10 5.53 54.9 21.6 Cedar Lake 06/24/03 14:30 4.91 41.0 26.8 Cedar Lake 07/15/03 13:50 5.61 43.0 26.6 Cedar Lake 08/25/03 13:50 6.23 63.7 28.6 Cedar Lake 10/21/03 13:00 5.94 50.1 15.3 Cedar Lake 03/23/04 14:15 5.46 49.0 9.4 Cedar Lake 04/19/04 14:50 5.71 50.0 22.5 Cedar Lake 05/10/04 14:55 6.04 49.4 25.2 Cedar Lake 06/09/04 11:15 5.97 51.7 24.3 Cedar Lake 08/19/04 15:44 6.11 55.8 26.4 Cedar Lake 09/13/04 14:40 6.06 53.3 23.2 Cedar Lake 10/12/04 14:10 6.10 50.6 15.6 Cedar Lake 03/21/05 13:50 5.79 58.1 9.9 Cedar Lake 04/19/05 13:25 6.25 54.5 19.0 Cedar Lake 05/09/05 14:14 6.24 58.0 20.8 Cedar Lake 06/13/05 14:20 6.35 61.4 27.5 Cedar Lake 07/12/05 14:10 6.10 51.4 27.3 Cedar Lake 08/17/05 14:49 6.52 56.5 25.4 Cedar Lake 09/06/05 14:44 6.76 59.8 23.9 Centennial Lake 04/28/03 11:40 4.95 72.7 17.7 Centennial Lake 05/19/03 11:35 5.71 70.9 14.7 Centennial Lake 06/24/03 12:15 4.73 56.0 20.9 Centennial Lake 07/15/03 11:20 5.58 55.0 25.0 Centennial Lake 08/25/03 11:35 6.73 81.2 24.7 Centennial Lake 10/21/03 10:10 6.15 68.2 15.2 Centennial Lake 03/23/04 10:30 4.73 63.0 7.0 Centennial Lake 04/19/04 12:40 4.90 63.7 19.4 Centennial Lake 05/10/04 12:55 5.34 70.3 23.5 Centennial Lake 06/08/04 12:50 5.97 74.1 26.7 Centennial Lake 08/19/04 12:52 5.36 69.2 27.2 Centennial Lake 09/13/04 12:20 5.57 62.6 24.1 Centennial Lake 10/12/04 11:58 5.80 58.4 15.6 Centennial Lake 03/21/05 11:41 5.27 76.5 9.1 Centennial Lake 04/19/05 11:20 5.37 63.9 17.6 Centennial Lake 05/09/05 12:01 5.51 72.5 16.2 Centennial Lake 06/13/05 11:55 6.35 75.5 28.8 Centennial Lake 07/12/05 12:11 6.30 73.7 27.7 Centennial Lake 08/17/05 12:34 6.55 72.4 27.3 Centennial Lake 09/06/05 12:47 6.78 75.9 24.9 Chatsworth Lake 04/30/03 14:55 4.14 63.6 20.3 Chatsworth Lake 05/21/03 14:15 5.00 59.3 17.1 Chatsworth Lake 06/25/03 14:10 4.04 46.0 28.7 Chatsworth Lake 07/14/03 14:55 4.32 43.0 25.7 Chatsworth Lake 08/21/03 15:00 4.31 51.9 28.1 Chatsworth Lake 10/20/03 15:50 4.41 48.7 14.4 Chatsworth Lake 03/23/04 9:30 3.96 58.0 6.0 Chatsworth Lake 04/19/04 10:30 4.62 63.0 16.4 Chatsworth Lake 05/10/04 10:20 4.21 54.5 20.7 Chatsworth Lake 06/08/04 10:10 4.31 50.4 23.0 Chatsworth Lake 08/19/04 10:07 4.21 53.3 23.5 Chatsworth Lake 09/13/04 10:05 4.83 36.9 21.8 Chatsworth Lake 10/12/04 9:57 4.49 40.8 14.2 Chatsworth Lake 03/21/05 9:47 4.19 54.1 9.3 Chatsworth Lake 04/19/05 9:50 3.65 55.0 15.9 Chatsworth Lake 05/09/05 10:00 4.19 52.2 16.3 Chatsworth Lake 06/13/05 9:56 4.15 52.7 26.1 Chatsworth Lake 07/12/05 9:50 4.34 50.7 27.4 Chatsworth Lake 08/17/05 9:49 4.73 42.5 24.6 Chatsworth Lake 09/06/05 10:30 5.72 45.6 21.4 Chatsworth Lake 04/19/06 9:06 4.23 47.2 8.65 90.7 17.3 Chatsworth Lake 05/10/06 9:20 4.46 43.8 8.60 86.9 15.7 Chatsworth Lake 06/19/06 10:38 5.27 29.0 6.26 74.7 24.9 7.5 ND ND ND 1.08 4.68Chatsworth Lake 07/19/06 9:20 4.09 47.9 6.49 53.2 28.6 Chatsworth Lake 08/14/06 10:00 5.23 38.8 6.03 69.0 22.2 8.7 ND ND ND 1.41 7.61Chatsworth Lake 09/20/06 9:41 4.15 44.3 6.24 61.4 18.5 Chatsworth Lake 10/16/06 9:32 4.09 50.5 8.37 62.5 12.4 7.0 ND ND ND 1.18 5.35Chatsworth Lake 11/20/06 9:23 3.46 64.1 9.46 89.6 9.2 Chatsworth Lake 12/04/06 9:12 3.61 58.4 9.82 98.3 6.6 14.3 ND ND 0.111 1.34 5.66Country Lake 04/30/03 16:00 4.29 67.6 21.3 Country Lake 05/21/03 15:25 5.22 68.3 17.2
35

Impoundment Date Time pH SC
(µS cm-1)D.O.
(mg L-1)D.O. (%)
Temp.(ºC)
DOC (mg L-1)
NO2-N (mg L-1)
NO3-N (mg L-1)
PO4-P (mg L-1)
SO4-S (mg L-1)
Cl (mg L-1)
Country Lake 06/26/03 11:05 4.15 50.0 25.9 Country Lake 07/16/03 10:15 4.73 48.0 24.6 Country Lake 08/22/03 14:15 4.52 58.9 26.7 Country Lake 10/20/03 16:35 4.91 56.1 13.6 Country Lake 03/24/04 8:30 4.25 56.0 6.6 Country Lake 04/19/04 8:45 3.84 64.1 15.5 Country Lake 05/10/04 9:10 3.84 63.5 20.1 Country Lake 06/08/04 9:05 4.68 68.9 22.0 Country Lake 08/19/04 9:10 4.46 54.6 24.0 Country Lake 09/13/04 9:00 4.83 56.4 21.5 Country Lake 10/12/04 8:55 4.50 52.0 14.7 Country Lake 03/21/05 8:57 4.16 61.7 8.2 Country Lake 04/19/05 8:45 4.40 54.7 15.9 Country Lake 05/09/05 9:05 4.39 56.3 15.4 Country Lake 06/13/05 9:01 4.54 58.1 27.0 Country Lake 07/12/05 8:55 4.44 83.2 26.0 Country Lake 08/17/05 8:52 5.06 59.9 24.5 Country Lake 09/06/05 9:18 4.91 62.4 22.7 Country Lake 04/19/06 8:35 4.25 53.6 8.45 85.8 16.4 Country Lake 05/10/06 8:55 4.51 55.6 7.68 80.3 16.9 Country Lake 06/19/06 10:10 4.60 43.6 6.57 79.7 24.3 13.9 ND ND ND 1.46 7.16Country Lake 07/19/06 8:40 4.31 53.4 6.65 72.1 27.8 Country Lake 08/15/06 14:40 4.81 57.0 7.04 84.5 25.9 19.1 ND ND ND 1.51 13.38Country Lake 09/20/06 9:00 4.24 46.5 6.43 64.8 17.8 Country Lake 10/16/06 8:58 3.92 61.0 8.69 84.9 12.7 12.9 ND 0.042 0.085 1.54 7.06Country Lake 11/21/06 15:30 4.45 62.3 7.82 85.3 8.8 Country Lake 12/05/06 14:35 4.44 67.3 8.42 68.9 7.6 18.7 ND 0.073 ND 1.49 6.54Cranes Lake 04/29/03 12:10 6.44 70.4 19.9 Cranes Lake 05/19/03 15:45 6.35 65.9 15.6 Cranes Lake 06/24/03 15:10 5.99 53.0 27.1 Cranes Lake 07/15/03 14:40 6.53 54.0 26.6 Cranes Lake 08/25/03 14:35 6.83 61.0 26.7 Cranes Lake 10/21/03 12:45 6.76 59.1 16.0 Cranes Lake 03/23/04 14:00 6.20 64.0 7.6 Cranes Lake 04/19/04 14:30 6.48 61.8 21.5 Cranes Lake 05/10/04 14:35 6.73 65.6 24.7 Cranes Lake 06/09/04 11:50 6.64 61.8 25.7 Cranes Lake 08/19/04 15:17 6.80 66.7 27.8 Cranes Lake 09/13/04 14:20 6.75 58.3 25.7 Cranes Lake 10/12/04 13:50 6.56 54.9 15.6 Cranes Lake 03/21/05 13:30 6.44 81.8 9.4 Cranes Lake 04/19/05 13:10 6.62 67.1 19.2 Cranes Lake 05/09/05 13:54 6.86 72.4 20.2 Cranes Lake 06/13/05 13:58 7.00 66.3 29.3 Cranes Lake 07/12/05 13:52 6.37 60.7 30.0 Cranes Lake 08/17/05 14:31 6.78 60.4 28.0 Cranes Lake 09/06/05 14:28 6.82 61.4 25.1 Cranes Lake 04/19/06 15:32 6.72 69.4 8.73 98.5 20.5 Cranes Lake 05/10/06 15:25 5.40 69.8 8.89 89.0 20.1 Cranes Lake 06/19/06 14:25 6.72 50.7 7.28 91.3 27.5 6.8 ND 0.136 ND 0.95 7.17Cranes Lake 07/19/06 15:30 5.38 67.2 8.42 80.3 28.1 Cranes Lake 08/14/06 15:41 6.16 59.1 5.10 68.8 26.5 6.4 ND 0.069 ND 1.57 10.16Cranes Lake 09/20/06 16:00 5.18 68.5 8.12 74.6 18.3 Cranes Lake 10/16/06 17:28 5.71 55.4 7.80 73.7 14.9 7.5 ND 0.164 ND 1.20 7.18Cranes Lake 11/20/06 15:35 4.23 52.4 9.68 89.5 8.1 Cranes Lake 12/04/06 15:40 5.58 39.7 9.24 85.2 7.3 10.2 ND 0.387 ND 1.44 7.35Cushman Lake 04/28/03 14:30 5.43 63.0 19.1 Cushman Lake 05/19/03 14:45 5.93 59.1 15.6 Cushman Lake 06/24/03 14:15 5.18 50.0 23.1 Cushman Lake 07/15/03 13:25 6.16 47.0 24.8 Cushman Lake 08/25/03 13:30 6.44 58.0 27.9 Cushman Lake 10/21/03 13:45 6.37 56.7 16.5 Cushman Lake 03/23/04 14:40 5.62 60.0 8.2 Cushman Lake 04/19/04 15:20 5.48 56.5 20.4 Cushman Lake 05/10/04 15:30 6.28 56.5 26.2 Cushman Lake 06/09/04 11:00 6.29 53.6 25.9 Cushman Lake 08/19/04 16:15 6.56 59.8 28.6 Cushman Lake 09/13/04 15:15 6.34 55.1 28.1 Cushman Lake 10/12/04 14:38 6.50 53.2 16.9 Cushman Lake 03/21/05 14:24 5.86 72.4 9.7 Cushman Lake 04/19/05 13:45 6.24 59.8 18.8
36
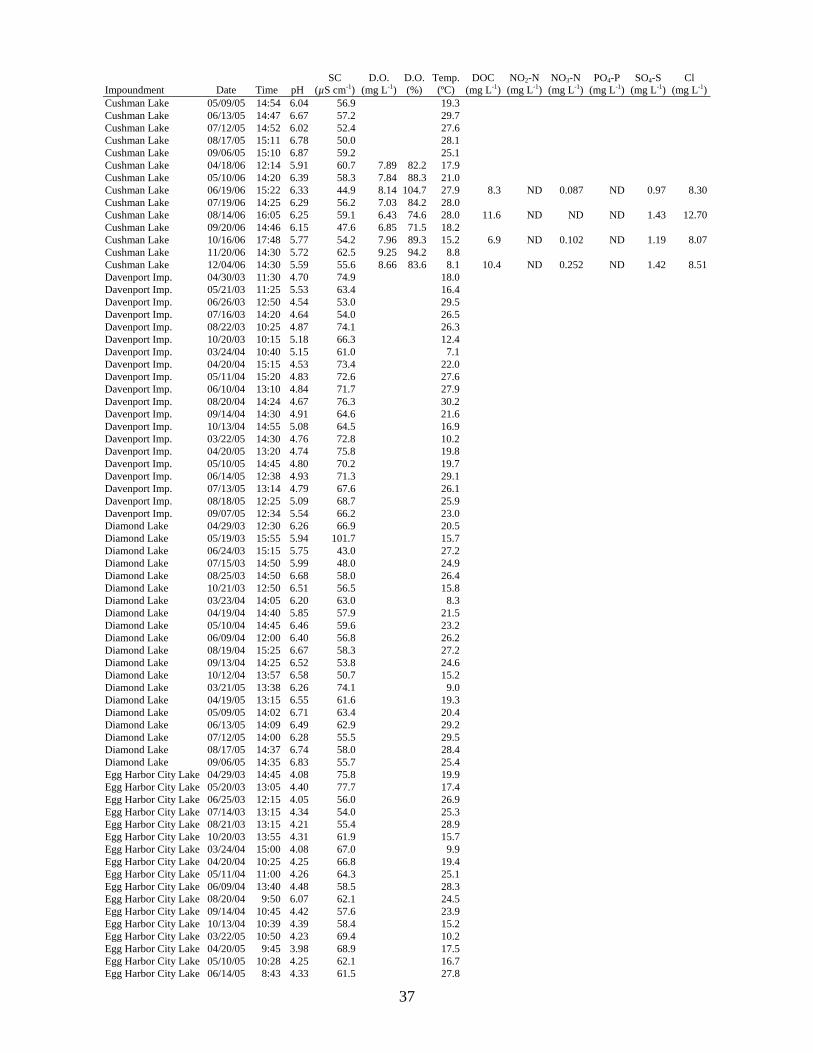
Impoundment Date Time pH SC
(µS cm-1)D.O.
(mg L-1)D.O. (%)
Temp.(ºC)
DOC (mg L-1)
NO2-N (mg L-1)
NO3-N (mg L-1)
PO4-P (mg L-1)
SO4-S (mg L-1)
Cl (mg L-1)
Cushman Lake 05/09/05 14:54 6.04 56.9 19.3 Cushman Lake 06/13/05 14:47 6.67 57.2 29.7 Cushman Lake 07/12/05 14:52 6.02 52.4 27.6 Cushman Lake 08/17/05 15:11 6.78 50.0 28.1 Cushman Lake 09/06/05 15:10 6.87 59.2 25.1 Cushman Lake 04/18/06 12:14 5.91 60.7 7.89 82.2 17.9 Cushman Lake 05/10/06 14:20 6.39 58.3 7.84 88.3 21.0 Cushman Lake 06/19/06 15:22 6.33 44.9 8.14 104.7 27.9 8.3 ND 0.087 ND 0.97 8.30Cushman Lake 07/19/06 14:25 6.29 56.2 7.03 84.2 28.0 Cushman Lake 08/14/06 16:05 6.25 59.1 6.43 74.6 28.0 11.6 ND ND ND 1.43 12.70Cushman Lake 09/20/06 14:46 6.15 47.6 6.85 71.5 18.2 Cushman Lake 10/16/06 17:48 5.77 54.2 7.96 89.3 15.2 6.9 ND 0.102 ND 1.19 8.07Cushman Lake 11/20/06 14:30 5.72 62.5 9.25 94.2 8.8 Cushman Lake 12/04/06 14:30 5.59 55.6 8.66 83.6 8.1 10.4 ND 0.252 ND 1.42 8.51Davenport Imp. 04/30/03 11:30 4.70 74.9 18.0 Davenport Imp. 05/21/03 11:25 5.53 63.4 16.4 Davenport Imp. 06/26/03 12:50 4.54 53.0 29.5 Davenport Imp. 07/16/03 14:20 4.64 54.0 26.5 Davenport Imp. 08/22/03 10:25 4.87 74.1 26.3 Davenport Imp. 10/20/03 10:15 5.18 66.3 12.4 Davenport Imp. 03/24/04 10:40 5.15 61.0 7.1 Davenport Imp. 04/20/04 15:15 4.53 73.4 22.0 Davenport Imp. 05/11/04 15:20 4.83 72.6 27.6 Davenport Imp. 06/10/04 13:10 4.84 71.7 27.9 Davenport Imp. 08/20/04 14:24 4.67 76.3 30.2 Davenport Imp. 09/14/04 14:30 4.91 64.6 21.6 Davenport Imp. 10/13/04 14:55 5.08 64.5 16.9 Davenport Imp. 03/22/05 14:30 4.76 72.8 10.2 Davenport Imp. 04/20/05 13:20 4.74 75.8 19.8 Davenport Imp. 05/10/05 14:45 4.80 70.2 19.7 Davenport Imp. 06/14/05 12:38 4.93 71.3 29.1 Davenport Imp. 07/13/05 13:14 4.79 67.6 26.1 Davenport Imp. 08/18/05 12:25 5.09 68.7 25.9 Davenport Imp. 09/07/05 12:34 5.54 66.2 23.0 Diamond Lake 04/29/03 12:30 6.26 66.9 20.5 Diamond Lake 05/19/03 15:55 5.94 101.7 15.7 Diamond Lake 06/24/03 15:15 5.75 43.0 27.2 Diamond Lake 07/15/03 14:50 5.99 48.0 24.9 Diamond Lake 08/25/03 14:50 6.68 58.0 26.4 Diamond Lake 10/21/03 12:50 6.51 56.5 15.8 Diamond Lake 03/23/04 14:05 6.20 63.0 8.3 Diamond Lake 04/19/04 14:40 5.85 57.9 21.5 Diamond Lake 05/10/04 14:45 6.46 59.6 23.2 Diamond Lake 06/09/04 12:00 6.40 56.8 26.2 Diamond Lake 08/19/04 15:25 6.67 58.3 27.2 Diamond Lake 09/13/04 14:25 6.52 53.8 24.6 Diamond Lake 10/12/04 13:57 6.58 50.7 15.2 Diamond Lake 03/21/05 13:38 6.26 74.1 9.0 Diamond Lake 04/19/05 13:15 6.55 61.6 19.3 Diamond Lake 05/09/05 14:02 6.71 63.4 20.4 Diamond Lake 06/13/05 14:09 6.49 62.9 29.2 Diamond Lake 07/12/05 14:00 6.28 55.5 29.5 Diamond Lake 08/17/05 14:37 6.74 58.0 28.4 Diamond Lake 09/06/05 14:35 6.83 55.7 25.4 Egg Harbor City Lake 04/29/03 14:45 4.08 75.8 19.9 Egg Harbor City Lake 05/20/03 13:05 4.40 77.7 17.4 Egg Harbor City Lake 06/25/03 12:15 4.05 56.0 26.9 Egg Harbor City Lake 07/14/03 13:15 4.34 54.0 25.3 Egg Harbor City Lake 08/21/03 13:15 4.21 55.4 28.9 Egg Harbor City Lake 10/20/03 13:55 4.31 61.9 15.7 Egg Harbor City Lake 03/24/04 15:00 4.08 67.0 9.9 Egg Harbor City Lake 04/20/04 10:25 4.25 66.8 19.4 Egg Harbor City Lake 05/11/04 11:00 4.26 64.3 25.1 Egg Harbor City Lake 06/09/04 13:40 4.48 58.5 28.3 Egg Harbor City Lake 08/20/04 9:50 6.07 62.1 24.5 Egg Harbor City Lake 09/14/04 10:45 4.42 57.6 23.9 Egg Harbor City Lake 10/13/04 10:39 4.39 58.4 15.2 Egg Harbor City Lake 03/22/05 10:50 4.23 69.4 10.2 Egg Harbor City Lake 04/20/05 9:45 3.98 68.9 17.5 Egg Harbor City Lake 05/10/05 10:28 4.25 62.1 16.7 Egg Harbor City Lake 06/14/05 8:43 4.33 61.5 27.8
37
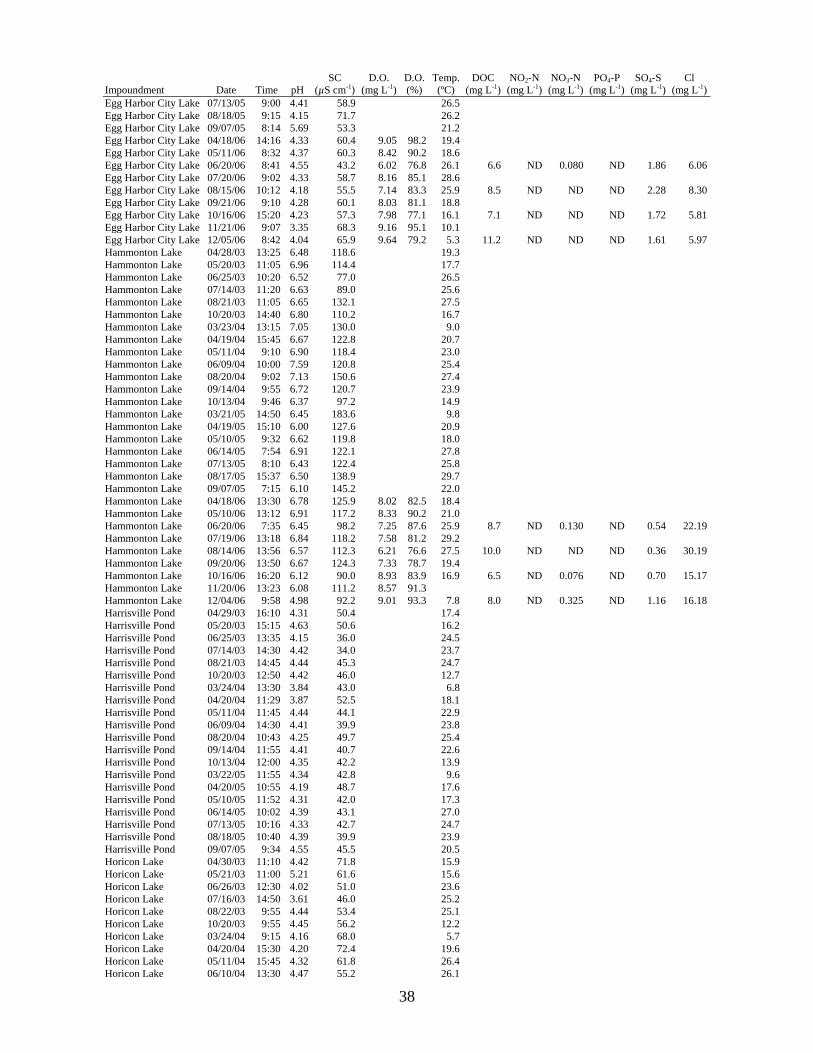
Impoundment Date Time pH SC
(µS cm-1)D.O.
(mg L-1)D.O. (%)
Temp.(ºC)
DOC (mg L-1)
NO2-N (mg L-1)
NO3-N (mg L-1)
PO4-P (mg L-1)
SO4-S (mg L-1)
Cl (mg L-1)
Egg Harbor City Lake 07/13/05 9:00 4.41 58.9 26.5 Egg Harbor City Lake 08/18/05 9:15 4.15 71.7 26.2 Egg Harbor City Lake 09/07/05 8:14 5.69 53.3 21.2 Egg Harbor City Lake 04/18/06 14:16 4.33 60.4 9.05 98.2 19.4 Egg Harbor City Lake 05/11/06 8:32 4.37 60.3 8.42 90.2 18.6 Egg Harbor City Lake 06/20/06 8:41 4.55 43.2 6.02 76.8 26.1 6.6 ND 0.080 ND 1.86 6.06Egg Harbor City Lake 07/20/06 9:02 4.33 58.7 8.16 85.1 28.6 Egg Harbor City Lake 08/15/06 10:12 4.18 55.5 7.14 83.3 25.9 8.5 ND ND ND 2.28 8.30Egg Harbor City Lake 09/21/06 9:10 4.28 60.1 8.03 81.1 18.8 Egg Harbor City Lake 10/16/06 15:20 4.23 57.3 7.98 77.1 16.1 7.1 ND ND ND 1.72 5.81Egg Harbor City Lake 11/21/06 9:07 3.35 68.3 9.16 95.1 10.1 Egg Harbor City Lake 12/05/06 8:42 4.04 65.9 9.64 79.2 5.3 11.2 ND ND ND 1.61 5.97Hammonton Lake 04/28/03 13:25 6.48 118.6 19.3 Hammonton Lake 05/20/03 11:05 6.96 114.4 17.7 Hammonton Lake 06/25/03 10:20 6.52 77.0 26.5 Hammonton Lake 07/14/03 11:20 6.63 89.0 25.6 Hammonton Lake 08/21/03 11:05 6.65 132.1 27.5 Hammonton Lake 10/20/03 14:40 6.80 110.2 16.7 Hammonton Lake 03/23/04 13:15 7.05 130.0 9.0 Hammonton Lake 04/19/04 15:45 6.67 122.8 20.7 Hammonton Lake 05/11/04 9:10 6.90 118.4 23.0 Hammonton Lake 06/09/04 10:00 7.59 120.8 25.4 Hammonton Lake 08/20/04 9:02 7.13 150.6 27.4 Hammonton Lake 09/14/04 9:55 6.72 120.7 23.9 Hammonton Lake 10/13/04 9:46 6.37 97.2 14.9 Hammonton Lake 03/21/05 14:50 6.45 183.6 9.8 Hammonton Lake 04/19/05 15:10 6.00 127.6 20.9 Hammonton Lake 05/10/05 9:32 6.62 119.8 18.0 Hammonton Lake 06/14/05 7:54 6.91 122.1 27.8 Hammonton Lake 07/13/05 8:10 6.43 122.4 25.8 Hammonton Lake 08/17/05 15:37 6.50 138.9 29.7 Hammonton Lake 09/07/05 7:15 6.10 145.2 22.0 Hammonton Lake 04/18/06 13:30 6.78 125.9 8.02 82.5 18.4 Hammonton Lake 05/10/06 13:12 6.91 117.2 8.33 90.2 21.0 Hammonton Lake 06/20/06 7:35 6.45 98.2 7.25 87.6 25.9 8.7 ND 0.130 ND 0.54 22.19Hammonton Lake 07/19/06 13:18 6.84 118.2 7.58 81.2 29.2 Hammonton Lake 08/14/06 13:56 6.57 112.3 6.21 76.6 27.5 10.0 ND ND ND 0.36 30.19Hammonton Lake 09/20/06 13:50 6.67 124.3 7.33 78.7 19.4 Hammonton Lake 10/16/06 16:20 6.12 90.0 8.93 83.9 16.9 6.5 ND 0.076 ND 0.70 15.17Hammonton Lake 11/20/06 13:23 6.08 111.2 8.57 91.3 Hammonton Lake 12/04/06 9:58 4.98 92.2 9.01 93.3 7.8 8.0 ND 0.325 ND 1.16 16.18Harrisville Pond 04/29/03 16:10 4.31 50.4 17.4 Harrisville Pond 05/20/03 15:15 4.63 50.6 16.2 Harrisville Pond 06/25/03 13:35 4.15 36.0 24.5 Harrisville Pond 07/14/03 14:30 4.42 34.0 23.7 Harrisville Pond 08/21/03 14:45 4.44 45.3 24.7 Harrisville Pond 10/20/03 12:50 4.42 46.0 12.7 Harrisville Pond 03/24/04 13:30 3.84 43.0 6.8 Harrisville Pond 04/20/04 11:29 3.87 52.5 18.1 Harrisville Pond 05/11/04 11:45 4.44 44.1 22.9 Harrisville Pond 06/09/04 14:30 4.41 39.9 23.8 Harrisville Pond 08/20/04 10:43 4.25 49.7 25.4 Harrisville Pond 09/14/04 11:55 4.41 40.7 22.6 Harrisville Pond 10/13/04 12:00 4.35 42.2 13.9 Harrisville Pond 03/22/05 11:55 4.34 42.8 9.6 Harrisville Pond 04/20/05 10:55 4.19 48.7 17.6 Harrisville Pond 05/10/05 11:52 4.31 42.0 17.3 Harrisville Pond 06/14/05 10:02 4.39 43.1 27.0 Harrisville Pond 07/13/05 10:16 4.33 42.7 24.7 Harrisville Pond 08/18/05 10:40 4.39 39.9 23.9 Harrisville Pond 09/07/05 9:34 4.55 45.5 20.5 Horicon Lake 04/30/03 11:10 4.42 71.8 15.9 Horicon Lake 05/21/03 11:00 5.21 61.6 15.6 Horicon Lake 06/26/03 12:30 4.02 51.0 23.6 Horicon Lake 07/16/03 14:50 3.61 46.0 25.2 Horicon Lake 08/22/03 9:55 4.44 53.4 25.1 Horicon Lake 10/20/03 9:55 4.45 56.2 12.2 Horicon Lake 03/24/04 9:15 4.16 68.0 5.7 Horicon Lake 04/20/04 15:30 4.20 72.4 19.6 Horicon Lake 05/11/04 15:45 4.32 61.8 26.4 Horicon Lake 06/10/04 13:30 4.47 55.2 26.1
38

Impoundment Date Time pH SC
(µS cm-1)D.O.
(mg L-1)D.O. (%)
Temp.(ºC)
DOC (mg L-1)
NO2-N (mg L-1)
NO3-N (mg L-1)
PO4-P (mg L-1)
SO4-S (mg L-1)
Cl (mg L-1)
Horicon Lake 08/20/04 14:47 4.25 72.4 28.2 Horicon Lake 09/14/04 14:45 4.29 49.6 20.9 Horicon Lake 10/13/04 15:12 4.38 51.7 15.6 Horicon Lake 03/22/05 14:45 4.26 61.0 9.5 Horicon Lake 04/20/05 13:40 4.33 65.8 18.7 Horicon Lake 05/10/05 15:03 4.34 57.2 18.3 Horicon Lake 06/14/05 12:54 4.44 58.0 28.1 Horicon Lake 07/13/05 13:31 4.32 58.3 26.1 Horicon Lake 08/18/05 15:25 4.56 48.0 25.2 Horicon Lake 09/07/05 13:08 4.74 51.1 24.2 Horicon Lake 04/19/06 12:56 4.27 60.4 8.97 94.3 18.0 Horicon Lake 05/11/06 12:00 4.41 53.1 8.25 83.9 16.4 Horicon Lake 06/20/06 12:55 4.41 41.5 7.22 87.7 25.2 5.2 ND 0.042 ND 1.03 7.53Horicon Lake 07/20/06 12:35 4.38 48.7 7.92 78.8 27.8 Horicon Lake 08/15/06 13:00 4.47 46.1 7.09 89.5 24.2 6.6 ND ND ND 1.18 9.66Horicon Lake 09/21/06 12:40 4.22 51.2 7.65 77.8 18.1 Horicon Lake 10/17/06 9:25 4.26 68.7 8.49 87.7 12.0 8.9 ND ND ND 1.42 7.81Horicon Lake 11/21/06 12:40 3.84 54.5 8.93 88.7 8.7 Horicon Lake 12/05/06 12:30 4.20 72.9 9.72 75.3 5.8 10.3 ND ND ND 1.39 7.60Howardsville Imp. 04/30/03 13:50 4.52 44.7 16.3 Howardsville Imp. 05/21/03 13:00 4.29 50.5 16.5 Howardsville Imp. 06/26/03 14:40 4.35 34.0 29.4 Howardsville Imp. 07/16/03 12:10 5.13 26.0 25.4 Howardsville Imp. 08/22/03 12:10 4.38 49.3 28.5 Howardsville Imp. 10/20/03 12:05 4.51 42.3 13.4 Howardsville Imp. 03/24/04 12:55 4.38 40.0 8.5 Howardsville Imp. 04/20/04 13:40 4.36 47.1 19.8 Howardsville Imp. 05/11/04 14:35 4.87 36.8 23.5 Howardsville Imp. 06/10/04 11:40 5.56 39.1 23.0 Howardsville Imp. 08/20/04 12:45 4.70 48.2 27.6 Howardsville Imp. 09/14/04 12:55 4.27 46.2 24.9 Howardsville Imp. 10/13/04 13:15 4.35 45.6 16.5 Howardsville Imp. 03/22/05 13:55 4.22 50.0 9.9 Howardsville Imp. 04/20/05 12:50 4.41 48.4 20.2 Howardsville Imp. 05/10/05 13:02 4.43 39.6 18.9 Howardsville Imp. 06/14/05 11:08 4.34 48.5 29.5 Howardsville Imp. 07/13/05 11:22 4.90 33.4 24.6 Howardsville Imp. 08/18/05 12:10 4.16 46.1 26.8 Howardsville Imp. 09/07/05 10:46 4.30 53.5 23.8 Indian Mills Lake 04/29/03 9:55 6.41 216.0 19.0 Indian Mills Lake 05/20/03 9:55 6.94 207.0 17.9 Indian Mills Lake 06/25/03 9:10 6.40 155.0 25.6 Indian Mills Lake 07/14/03 10:20 6.96 171.0 26.3 Indian Mills Lake 08/21/03 10:05 8.12 205.0 26.4 Indian Mills Lake 10/20/03 15:20 6.72 210.0 15.2 Indian Mills Lake 03/23/04 10:00 6.56 284.0 6.1 Indian Mills Lake 04/19/04 11:15 6.51 210.0 19.1 Indian Mills Lake 05/10/04 11:10 8.76 226.0 21.7 Indian Mills Lake 06/08/04 11:10 9.03 219.0 23.8 Indian Mills Lake 08/19/04 10:50 6.70 215.0 25.6 Indian Mills Lake 09/13/04 10:45 6.54 214.0 24.3 Indian Mills Lake 10/12/04 10:37 6.12 208.0 14.0 Indian Mills Lake 03/21/05 10:30 6.26 252.0 10.0 Indian Mills Lake 04/19/05 10:15 6.36 231.0 18.1 Indian Mills Lake 05/09/05 10:47 9.76 221.0 17.6 Indian Mills Lake 06/13/05 10:44 6.80 230.0 28.3 Indian Mills Lake 07/12/05 10:57 6.47 176.9 29.3 Indian Mills Lake 08/17/05 10:58 6.53 209.0 25.9 Indian Mills Lake 09/06/05 11:44 6.57 244.0 24.8 Indian Mills Lake 04/18/06 10:53 7.02 222.0 10.10 101.3 16.4 Indian Mills Lake 05/10/06 11:02 8.98 218.0 11.39 121.5 17.2 Indian Mills Lake 06/19/06 12:07 7.16 180.6 12.10 154.5 28.3 9.1 ND 1.510 ND 6.64 30.85Indian Mills Lake 07/19/06 11:08 6.42 141.2 10.05 118.3 28.8 Indian Mills Lake 08/14/06 12:14 6.52 238.0 6.11 62.1 25.1 11.4 ND 0.660 ND 11.06 52.42Indian Mills Lake 09/20/06 11:30 6.22 153.6 9.48 89.9 19.2 Indian Mills Lake 10/16/06 10:55 5.68 184.9 8.34 77.1 12.2 10.3 ND 2.069 ND 5.92 24.00Indian Mills Lake 11/20/06 11:13 5.33 132.5 10.14 101.3 10.2 Indian Mills Lake 12/04/06 11:06 5.27 221.0 9.26 88.3 6.9 7.0 ND 2.684 ND 5.37 25.64Jennings Lake 04/28/03 10:25 6.59 163.3 15.7 Jennings Lake 05/19/03 11:10 7.01 169.5 13.4 Jennings Lake 06/24/03 11:40 6.81 139.0 23.5
39
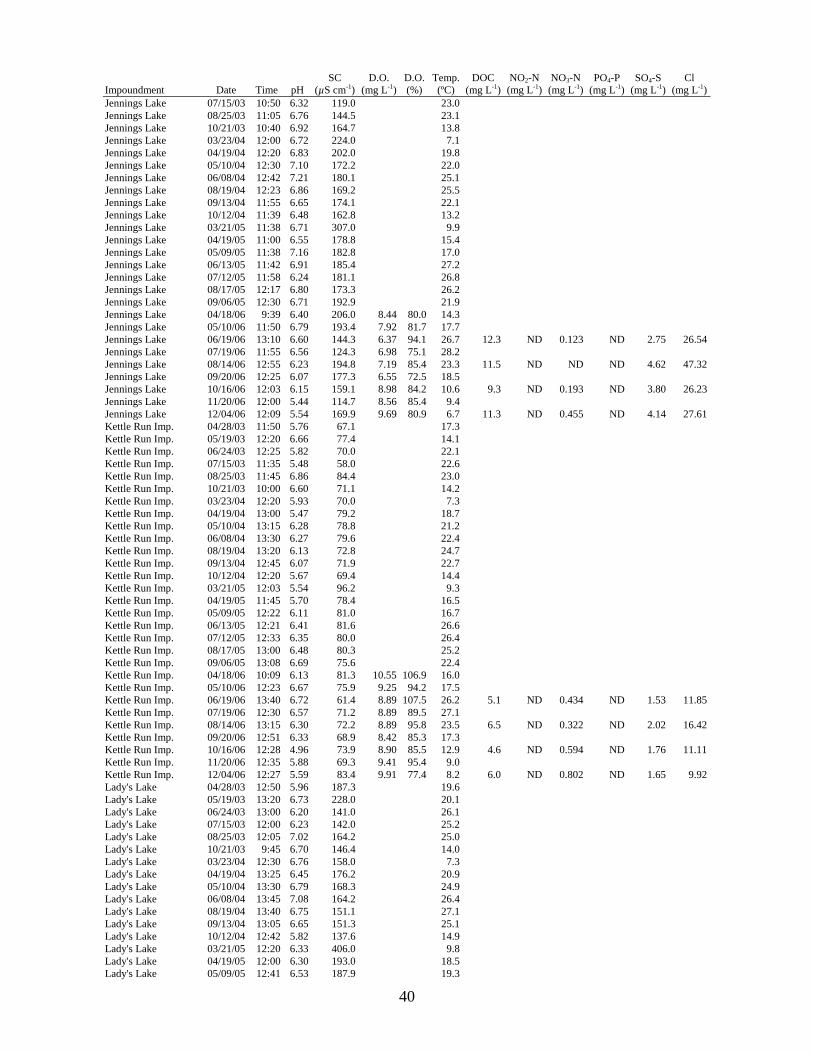
Impoundment Date Time pH SC
(µS cm-1)D.O.
(mg L-1)D.O. (%)
Temp.(ºC)
DOC (mg L-1)
NO2-N (mg L-1)
NO3-N (mg L-1)
PO4-P (mg L-1)
SO4-S (mg L-1)
Cl (mg L-1)
Jennings Lake 07/15/03 10:50 6.32 119.0 23.0 Jennings Lake 08/25/03 11:05 6.76 144.5 23.1 Jennings Lake 10/21/03 10:40 6.92 164.7 13.8 Jennings Lake 03/23/04 12:00 6.72 224.0 7.1 Jennings Lake 04/19/04 12:20 6.83 202.0 19.8 Jennings Lake 05/10/04 12:30 7.10 172.2 22.0 Jennings Lake 06/08/04 12:42 7.21 180.1 25.1 Jennings Lake 08/19/04 12:23 6.86 169.2 25.5 Jennings Lake 09/13/04 11:55 6.65 174.1 22.1 Jennings Lake 10/12/04 11:39 6.48 162.8 13.2 Jennings Lake 03/21/05 11:38 6.71 307.0 9.9 Jennings Lake 04/19/05 11:00 6.55 178.8 15.4 Jennings Lake 05/09/05 11:38 7.16 182.8 17.0 Jennings Lake 06/13/05 11:42 6.91 185.4 27.2 Jennings Lake 07/12/05 11:58 6.24 181.1 26.8 Jennings Lake 08/17/05 12:17 6.80 173.3 26.2 Jennings Lake 09/06/05 12:30 6.71 192.9 21.9 Jennings Lake 04/18/06 9:39 6.40 206.0 8.44 80.0 14.3 Jennings Lake 05/10/06 11:50 6.79 193.4 7.92 81.7 17.7 Jennings Lake 06/19/06 13:10 6.60 144.3 6.37 94.1 26.7 12.3 ND 0.123 ND 2.75 26.54Jennings Lake 07/19/06 11:55 6.56 124.3 6.98 75.1 28.2 Jennings Lake 08/14/06 12:55 6.23 194.8 7.19 85.4 23.3 11.5 ND ND ND 4.62 47.32Jennings Lake 09/20/06 12:25 6.07 177.3 6.55 72.5 18.5 Jennings Lake 10/16/06 12:03 6.15 159.1 8.98 84.2 10.6 9.3 ND 0.193 ND 3.80 26.23Jennings Lake 11/20/06 12:00 5.44 114.7 8.56 85.4 9.4 Jennings Lake 12/04/06 12:09 5.54 169.9 9.69 80.9 6.7 11.3 ND 0.455 ND 4.14 27.61Kettle Run Imp. 04/28/03 11:50 5.76 67.1 17.3 Kettle Run Imp. 05/19/03 12:20 6.66 77.4 14.1 Kettle Run Imp. 06/24/03 12:25 5.82 70.0 22.1 Kettle Run Imp. 07/15/03 11:35 5.48 58.0 22.6 Kettle Run Imp. 08/25/03 11:45 6.86 84.4 23.0 Kettle Run Imp. 10/21/03 10:00 6.60 71.1 14.2 Kettle Run Imp. 03/23/04 12:20 5.93 70.0 7.3 Kettle Run Imp. 04/19/04 13:00 5.47 79.2 18.7 Kettle Run Imp. 05/10/04 13:15 6.28 78.8 21.2 Kettle Run Imp. 06/08/04 13:30 6.27 79.6 22.4 Kettle Run Imp. 08/19/04 13:20 6.13 72.8 24.7 Kettle Run Imp. 09/13/04 12:45 6.07 71.9 22.7 Kettle Run Imp. 10/12/04 12:20 5.67 69.4 14.4 Kettle Run Imp. 03/21/05 12:03 5.54 96.2 9.3 Kettle Run Imp. 04/19/05 11:45 5.70 78.4 16.5 Kettle Run Imp. 05/09/05 12:22 6.11 81.0 16.7 Kettle Run Imp. 06/13/05 12:21 6.41 81.6 26.6 Kettle Run Imp. 07/12/05 12:33 6.35 80.0 26.4 Kettle Run Imp. 08/17/05 13:00 6.48 80.3 25.2 Kettle Run Imp. 09/06/05 13:08 6.69 75.6 22.4 Kettle Run Imp. 04/18/06 10:09 6.13 81.3 10.55 106.9 16.0 Kettle Run Imp. 05/10/06 12:23 6.67 75.9 9.25 94.2 17.5 Kettle Run Imp. 06/19/06 13:40 6.72 61.4 8.89 107.5 26.2 5.1 ND 0.434 ND 1.53 11.85Kettle Run Imp. 07/19/06 12:30 6.57 71.2 8.89 89.5 27.1 Kettle Run Imp. 08/14/06 13:15 6.30 72.2 8.89 95.8 23.5 6.5 ND 0.322 ND 2.02 16.42Kettle Run Imp. 09/20/06 12:51 6.33 68.9 8.42 85.3 17.3 Kettle Run Imp. 10/16/06 12:28 4.96 73.9 8.90 85.5 12.9 4.6 ND 0.594 ND 1.76 11.11Kettle Run Imp. 11/20/06 12:35 5.88 69.3 9.41 95.4 9.0 Kettle Run Imp. 12/04/06 12:27 5.59 83.4 9.91 77.4 8.2 6.0 ND 0.802 ND 1.65 9.92Lady's Lake 04/28/03 12:50 5.96 187.3 19.6 Lady's Lake 05/19/03 13:20 6.73 228.0 20.1 Lady's Lake 06/24/03 13:00 6.20 141.0 26.1 Lady's Lake 07/15/03 12:00 6.23 142.0 25.2 Lady's Lake 08/25/03 12:05 7.02 164.2 25.0 Lady's Lake 10/21/03 9:45 6.70 146.4 14.0 Lady's Lake 03/23/04 12:30 6.76 158.0 7.3 Lady's Lake 04/19/04 13:25 6.45 176.2 20.9 Lady's Lake 05/10/04 13:30 6.79 168.3 24.9 Lady's Lake 06/08/04 13:45 7.08 164.2 26.4 Lady's Lake 08/19/04 13:40 6.75 151.1 27.1 Lady's Lake 09/13/04 13:05 6.65 151.3 25.1 Lady's Lake 10/12/04 12:42 5.82 137.6 14.9 Lady's Lake 03/21/05 12:20 6.33 406.0 9.8 Lady's Lake 04/19/05 12:00 6.30 193.0 18.5 Lady's Lake 05/09/05 12:41 6.53 187.9 19.3
40
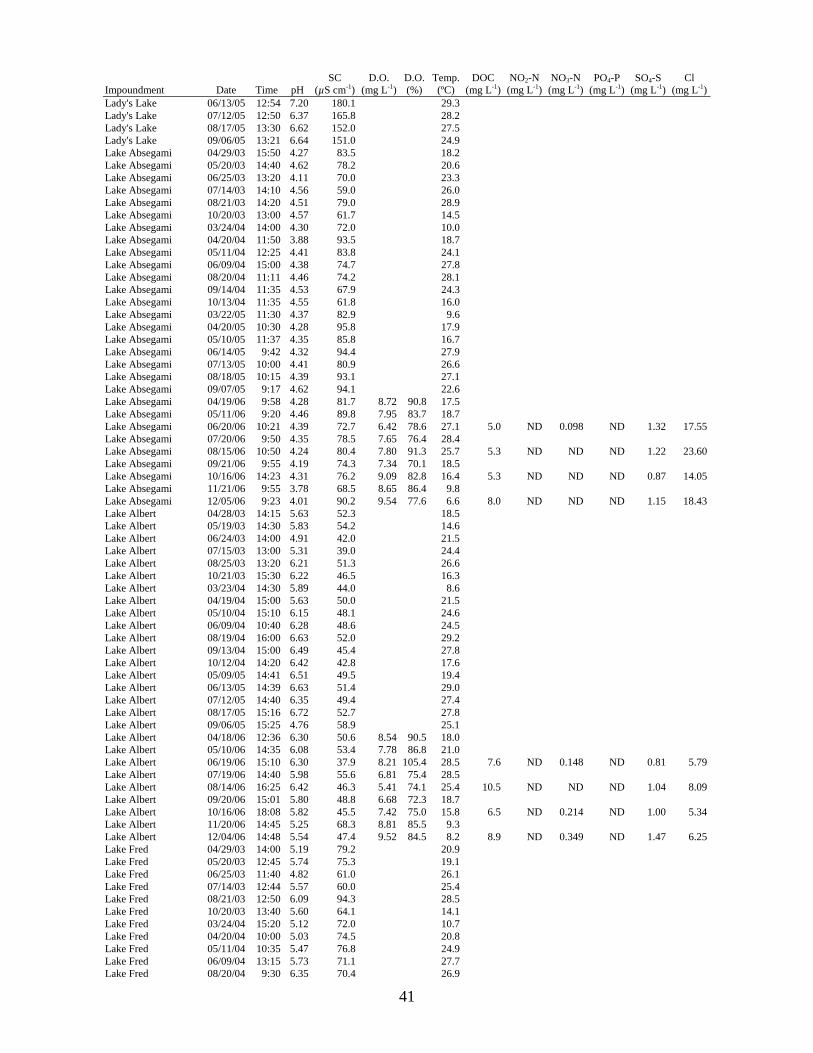
Impoundment Date Time pH SC
(µS cm-1)D.O.
(mg L-1)D.O. (%)
Temp.(ºC)
DOC (mg L-1)
NO2-N (mg L-1)
NO3-N (mg L-1)
PO4-P (mg L-1)
SO4-S (mg L-1)
Cl (mg L-1)
Lady's Lake 06/13/05 12:54 7.20 180.1 29.3 Lady's Lake 07/12/05 12:50 6.37 165.8 28.2 Lady's Lake 08/17/05 13:30 6.62 152.0 27.5 Lady's Lake 09/06/05 13:21 6.64 151.0 24.9 Lake Absegami 04/29/03 15:50 4.27 83.5 18.2 Lake Absegami 05/20/03 14:40 4.62 78.2 20.6 Lake Absegami 06/25/03 13:20 4.11 70.0 23.3 Lake Absegami 07/14/03 14:10 4.56 59.0 26.0 Lake Absegami 08/21/03 14:20 4.51 79.0 28.9 Lake Absegami 10/20/03 13:00 4.57 61.7 14.5 Lake Absegami 03/24/04 14:00 4.30 72.0 10.0 Lake Absegami 04/20/04 11:50 3.88 93.5 18.7 Lake Absegami 05/11/04 12:25 4.41 83.8 24.1 Lake Absegami 06/09/04 15:00 4.38 74.7 27.8 Lake Absegami 08/20/04 11:11 4.46 74.2 28.1 Lake Absegami 09/14/04 11:35 4.53 67.9 24.3 Lake Absegami 10/13/04 11:35 4.55 61.8 16.0 Lake Absegami 03/22/05 11:30 4.37 82.9 9.6 Lake Absegami 04/20/05 10:30 4.28 95.8 17.9 Lake Absegami 05/10/05 11:37 4.35 85.8 16.7 Lake Absegami 06/14/05 9:42 4.32 94.4 27.9 Lake Absegami 07/13/05 10:00 4.41 80.9 26.6 Lake Absegami 08/18/05 10:15 4.39 93.1 27.1 Lake Absegami 09/07/05 9:17 4.62 94.1 22.6 Lake Absegami 04/19/06 9:58 4.28 81.7 8.72 90.8 17.5 Lake Absegami 05/11/06 9:20 4.46 89.8 7.95 83.7 18.7 Lake Absegami 06/20/06 10:21 4.39 72.7 6.42 78.6 27.1 5.0 ND 0.098 ND 1.32 17.55Lake Absegami 07/20/06 9:50 4.35 78.5 7.65 76.4 28.4 Lake Absegami 08/15/06 10:50 4.24 80.4 7.80 91.3 25.7 5.3 ND ND ND 1.22 23.60Lake Absegami 09/21/06 9:55 4.19 74.3 7.34 70.1 18.5 Lake Absegami 10/16/06 14:23 4.31 76.2 9.09 82.8 16.4 5.3 ND ND ND 0.87 14.05Lake Absegami 11/21/06 9:55 3.78 68.5 8.65 86.4 9.8 Lake Absegami 12/05/06 9:23 4.01 90.2 9.54 77.6 6.6 8.0 ND ND ND 1.15 18.43Lake Albert 04/28/03 14:15 5.63 52.3 18.5 Lake Albert 05/19/03 14:30 5.83 54.2 14.6 Lake Albert 06/24/03 14:00 4.91 42.0 21.5 Lake Albert 07/15/03 13:00 5.31 39.0 24.4 Lake Albert 08/25/03 13:20 6.21 51.3 26.6 Lake Albert 10/21/03 15:30 6.22 46.5 16.3 Lake Albert 03/23/04 14:30 5.89 44.0 8.6 Lake Albert 04/19/04 15:00 5.63 50.0 21.5 Lake Albert 05/10/04 15:10 6.15 48.1 24.6 Lake Albert 06/09/04 10:40 6.28 48.6 24.5 Lake Albert 08/19/04 16:00 6.63 52.0 29.2 Lake Albert 09/13/04 15:00 6.49 45.4 27.8 Lake Albert 10/12/04 14:20 6.42 42.8 17.6 Lake Albert 05/09/05 14:41 6.51 49.5 19.4 Lake Albert 06/13/05 14:39 6.63 51.4 29.0 Lake Albert 07/12/05 14:40 6.35 49.4 27.4 Lake Albert 08/17/05 15:16 6.72 52.7 27.8 Lake Albert 09/06/05 15:25 4.76 58.9 25.1 Lake Albert 04/18/06 12:36 6.30 50.6 8.54 90.5 18.0 Lake Albert 05/10/06 14:35 6.08 53.4 7.78 86.8 21.0 Lake Albert 06/19/06 15:10 6.30 37.9 8.21 105.4 28.5 7.6 ND 0.148 ND 0.81 5.79Lake Albert 07/19/06 14:40 5.98 55.6 6.81 75.4 28.5 Lake Albert 08/14/06 16:25 6.42 46.3 5.41 74.1 25.4 10.5 ND ND ND 1.04 8.09Lake Albert 09/20/06 15:01 5.80 48.8 6.68 72.3 18.7 Lake Albert 10/16/06 18:08 5.82 45.5 7.42 75.0 15.8 6.5 ND 0.214 ND 1.00 5.34Lake Albert 11/20/06 14:45 5.25 68.3 8.81 85.5 9.3 Lake Albert 12/04/06 14:48 5.54 47.4 9.52 84.5 8.2 8.9 ND 0.349 ND 1.47 6.25Lake Fred 04/29/03 14:00 5.19 79.2 20.9 Lake Fred 05/20/03 12:45 5.74 75.3 19.1 Lake Fred 06/25/03 11:40 4.82 61.0 26.1 Lake Fred 07/14/03 12:44 5.57 60.0 25.4 Lake Fred 08/21/03 12:50 6.09 94.3 28.5 Lake Fred 10/20/03 13:40 5.60 64.1 14.1 Lake Fred 03/24/04 15:20 5.12 72.0 10.7 Lake Fred 04/20/04 10:00 5.03 74.5 20.8 Lake Fred 05/11/04 10:35 5.47 76.8 24.9 Lake Fred 06/09/04 13:15 5.73 71.1 27.7 Lake Fred 08/20/04 9:30 6.35 70.4 26.9
41

Impoundment Date Time pH SC
(µS cm-1)D.O.
(mg L-1)D.O. (%)
Temp.(ºC)
DOC (mg L-1)
NO2-N (mg L-1)
NO3-N (mg L-1)
PO4-P (mg L-1)
SO4-S (mg L-1)
Cl (mg L-1)
Lake Fred 09/14/04 10:25 6.08 79.0 23.2 Lake Fred 10/13/04 10:20 6.25 64.3 14.5 Lake Fred 03/22/05 10:30 5.45 78.8 10.8 Lake Fred 04/20/05 10:00 4.95 83.1 18.6 Lake Fred 05/10/05 10:00 5.83 73.6 17.1 Lake Fred 06/14/05 8:24 5.99 78.8 27.5 Lake Fred 07/13/05 8:38 6.10 81.2 26.3 Lake Fred 08/18/05 9:35 5.71 73.2 25.9 Lake Fred 09/07/05 7:53 6.15 85.6 20.2 Lake Fred 04/18/06 14:48 5.85 78.4 8.82 97.4 19.5 Lake Fred 05/11/06 7:55 5.83 72.3 8.33 88.6 18.3 Lake Fred 06/20/06 8:19 6.35 57.7 6.79 85.2 25.8 6.0 ND ND ND 2.08 10.79Lake Fred 07/20/06 8:30 5.42 68.9 8.01 81.0 28.3 Lake Fred 08/15/06 9:30 5.28 76.6 6.87 74.0 25.2 6.4 ND ND ND 3.09 18.34Lake Fred 09/21/06 8:28 5.32 64.5 7.98 78.4 18.6 Lake Fred 10/16/06 15:38 5.17 75.2 7.64 86.5 15.4 4.5 ND 0.155 ND 2.35 11.39Lake Fred 11/21/06 8:35 4.58 72.5 9.01 91.4 9.7 Lake Fred 12/05/06 8:12 4.18 83.6 9.91 68.4 5.0 8.7 ND 0.331 ND 2.50 10.85Lake Pine 04/28/03 10:10 5.82 90.5 16.8 Lake Pine 05/19/03 10:55 6.32 93.6 14.5 Lake Pine 06/24/03 11:25 5.21 26.0 20.9 Lake Pine 07/15/03 10:35 6.17 61.0 24.8 Lake Pine 08/25/03 10:55 6.39 76.6 24.6 Lake Pine 10/21/03 10:55 6.41 78.7 14.6 Lake Pine 03/23/04 10:55 5.50 72.0 5.2 Lake Pine 04/19/04 12:00 5.34 72.9 20.1 Lake Pine 05/10/04 12:05 5.94 78.3 22.4 Lake Pine 06/08/04 12:10 6.28 85.5 25.1 Lake Pine 08/19/04 12:00 5.75 80.1 25.2 Lake Pine 09/13/04 11:35 5.76 74.3 23.3 Lake Pine 10/12/04 11:10 5.98 72.7 14.0 Lake Pine 03/21/05 11:00 6.06 124.3 9.1 Lake Pine 04/19/05 10:45 5.95 77.4 16.4 Lake Pine 05/09/05 11:24 7.12 79.7 17.1 Lake Pine 06/13/05 11:20 6.18 83.7 28.2 Lake Pine 07/12/05 11:30 6.11 80.7 26.3 Lake Pine 08/17/05 11:28 6.33 79.8 26.6 Lake Pine 09/06/05 12:16 6.57 81.1 24.6 Manahawkin Lake 04/30/03 13:00 5.65 103.1 16.5 Manahawkin Lake 05/21/03 12:05 5.46 104.6 17.3 Manahawkin Lake 06/26/03 13:40 5.82 75.0 26.5 Manahawkin Lake 07/16/03 12:55 5.81 73.0 23.1 Manahawkin Lake 08/22/03 11:15 6.10 106.4 26.7 Manahawkin Lake 10/20/03 11:30 6.01 93.5 12.9 Manahawkin Lake 03/24/04 12:00 5.92 120.0 7.0 Manahawkin Lake 04/20/04 14:00 6.13 99.4 19.1 Manahawkin Lake 05/11/04 14:10 6.34 101.7 23.0 Manahawkin Lake 06/10/04 12:30 6.92 99.3 29.6 Manahawkin Lake 08/20/04 13:38 5.78 110.2 28.1 Manahawkin Lake 09/14/04 13:20 6.24 93.0 23.2 Manahawkin Lake 10/13/04 14:12 5.95 94.8 15.4 Manahawkin Lake 03/22/05 13:00 6.18 118.5 9.6 Manahawkin Lake 04/20/05 12:25 5.93 112.4 21.4 Manahawkin Lake 05/10/05 13:50 6.19 103.4 17.6 Manahawkin Lake 06/14/05 11:55 6.88 109.5 29.1 Manahawkin Lake 07/13/05 12:33 5.61 99.5 26.2 Manahawkin Lake 08/18/05 12:50 6.14 117.1 25.2 Manahawkin Lake 09/07/05 11:52 5.88 121.6 23.6 Maple Lake 04/29/03 13:20 4.73 40.5 20.4 Maple Lake 05/20/03 11:50 6.39 52.7 17.4 Maple Lake 06/25/03 11:00 4.73 35.0 25.6 Maple Lake 07/14/03 12:05 5.17 32.0 23.4 Maple Lake 08/21/03 11:55 5.86 42.9 26.6 Maple Lake 10/21/03 14:20 6.64 37.2 16.1 Maple Lake 03/24/04 16:00 5.32 34.0 9.4 Maple Lake 04/20/04 9:25 4.95 42.0 19.9 Maple Lake 05/11/04 10:00 5.82 94.3 22.5 Maple Lake 06/09/04 12:40 6.06 36.9 27.1 Maple Lake 08/20/04 7:52 6.32 35.9 25.9 Maple Lake 09/13/04 15:50 6.43 35.6 27.3 Maple Lake 10/12/04 15:10 6.39 33.1 17.0
42
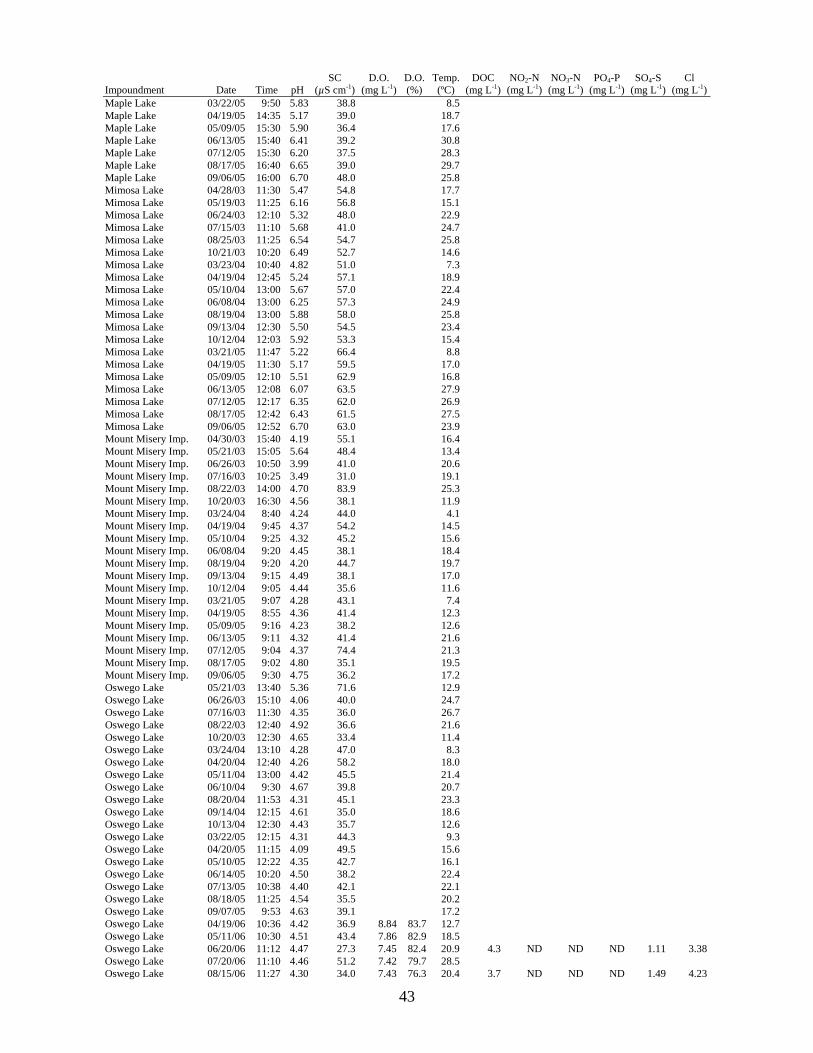
Impoundment Date Time pH SC
(µS cm-1)D.O.
(mg L-1)D.O. (%)
Temp.(ºC)
DOC (mg L-1)
NO2-N (mg L-1)
NO3-N (mg L-1)
PO4-P (mg L-1)
SO4-S (mg L-1)
Cl (mg L-1)
Maple Lake 03/22/05 9:50 5.83 38.8 8.5 Maple Lake 04/19/05 14:35 5.17 39.0 18.7 Maple Lake 05/09/05 15:30 5.90 36.4 17.6 Maple Lake 06/13/05 15:40 6.41 39.2 30.8 Maple Lake 07/12/05 15:30 6.20 37.5 28.3 Maple Lake 08/17/05 16:40 6.65 39.0 29.7 Maple Lake 09/06/05 16:00 6.70 48.0 25.8 Mimosa Lake 04/28/03 11:30 5.47 54.8 17.7 Mimosa Lake 05/19/03 11:25 6.16 56.8 15.1 Mimosa Lake 06/24/03 12:10 5.32 48.0 22.9 Mimosa Lake 07/15/03 11:10 5.68 41.0 24.7 Mimosa Lake 08/25/03 11:25 6.54 54.7 25.8 Mimosa Lake 10/21/03 10:20 6.49 52.7 14.6 Mimosa Lake 03/23/04 10:40 4.82 51.0 7.3 Mimosa Lake 04/19/04 12:45 5.24 57.1 18.9 Mimosa Lake 05/10/04 13:00 5.67 57.0 22.4 Mimosa Lake 06/08/04 13:00 6.25 57.3 24.9 Mimosa Lake 08/19/04 13:00 5.88 58.0 25.8 Mimosa Lake 09/13/04 12:30 5.50 54.5 23.4 Mimosa Lake 10/12/04 12:03 5.92 53.3 15.4 Mimosa Lake 03/21/05 11:47 5.22 66.4 8.8 Mimosa Lake 04/19/05 11:30 5.17 59.5 17.0 Mimosa Lake 05/09/05 12:10 5.51 62.9 16.8 Mimosa Lake 06/13/05 12:08 6.07 63.5 27.9 Mimosa Lake 07/12/05 12:17 6.35 62.0 26.9 Mimosa Lake 08/17/05 12:42 6.43 61.5 27.5 Mimosa Lake 09/06/05 12:52 6.70 63.0 23.9 Mount Misery Imp. 04/30/03 15:40 4.19 55.1 16.4 Mount Misery Imp. 05/21/03 15:05 5.64 48.4 13.4 Mount Misery Imp. 06/26/03 10:50 3.99 41.0 20.6 Mount Misery Imp. 07/16/03 10:25 3.49 31.0 19.1 Mount Misery Imp. 08/22/03 14:00 4.70 83.9 25.3 Mount Misery Imp. 10/20/03 16:30 4.56 38.1 11.9 Mount Misery Imp. 03/24/04 8:40 4.24 44.0 4.1 Mount Misery Imp. 04/19/04 9:45 4.37 54.2 14.5 Mount Misery Imp. 05/10/04 9:25 4.32 45.2 15.6 Mount Misery Imp. 06/08/04 9:20 4.45 38.1 18.4 Mount Misery Imp. 08/19/04 9:20 4.20 44.7 19.7 Mount Misery Imp. 09/13/04 9:15 4.49 38.1 17.0 Mount Misery Imp. 10/12/04 9:05 4.44 35.6 11.6 Mount Misery Imp. 03/21/05 9:07 4.28 43.1 7.4 Mount Misery Imp. 04/19/05 8:55 4.36 41.4 12.3 Mount Misery Imp. 05/09/05 9:16 4.23 38.2 12.6 Mount Misery Imp. 06/13/05 9:11 4.32 41.4 21.6 Mount Misery Imp. 07/12/05 9:04 4.37 74.4 21.3 Mount Misery Imp. 08/17/05 9:02 4.80 35.1 19.5 Mount Misery Imp. 09/06/05 9:30 4.75 36.2 17.2 Oswego Lake 05/21/03 13:40 5.36 71.6 12.9 Oswego Lake 06/26/03 15:10 4.06 40.0 24.7 Oswego Lake 07/16/03 11:30 4.35 36.0 26.7 Oswego Lake 08/22/03 12:40 4.92 36.6 21.6 Oswego Lake 10/20/03 12:30 4.65 33.4 11.4 Oswego Lake 03/24/04 13:10 4.28 47.0 8.3 Oswego Lake 04/20/04 12:40 4.26 58.2 18.0 Oswego Lake 05/11/04 13:00 4.42 45.5 21.4 Oswego Lake 06/10/04 9:30 4.67 39.8 20.7 Oswego Lake 08/20/04 11:53 4.31 45.1 23.3 Oswego Lake 09/14/04 12:15 4.61 35.0 18.6 Oswego Lake 10/13/04 12:30 4.43 35.7 12.6 Oswego Lake 03/22/05 12:15 4.31 44.3 9.3 Oswego Lake 04/20/05 11:15 4.09 49.5 15.6 Oswego Lake 05/10/05 12:22 4.35 42.7 16.1 Oswego Lake 06/14/05 10:20 4.50 38.2 22.4 Oswego Lake 07/13/05 10:38 4.40 42.1 22.1 Oswego Lake 08/18/05 11:25 4.54 35.5 20.2 Oswego Lake 09/07/05 9:53 4.63 39.1 17.2 Oswego Lake 04/19/06 10:36 4.42 36.9 8.84 83.7 12.7 Oswego Lake 05/11/06 10:30 4.51 43.4 7.86 82.9 18.5 Oswego Lake 06/20/06 11:12 4.47 27.3 7.45 82.4 20.9 4.3 ND ND ND 1.11 3.38Oswego Lake 07/20/06 11:10 4.46 51.2 7.42 79.7 28.5 Oswego Lake 08/15/06 11:27 4.30 34.0 7.43 76.3 20.4 3.7 ND ND ND 1.49 4.23
43

Impoundment Date Time pH SC
(µS cm-1)D.O.
(mg L-1)D.O. (%)
Temp.(ºC)
DOC (mg L-1)
NO2-N (mg L-1)
NO3-N (mg L-1)
PO4-P (mg L-1)
SO4-S (mg L-1)
Cl (mg L-1)
Oswego Lake 09/21/06 11:15 4.24 49.8 7.36 80.2 18.8 Oswego Lake 10/16/06 13:25 4.22 44.7 7.80 72.4 11.2 8.3 ND ND ND 0.80 4.94Oswego Lake 11/21/06 11:15 3.96 61.3 8.42 89.7 9.5 Oswego Lake 12/05/06 10:00 3.91 46.8 7.82 54.3 5.1 7.9 ND ND ND 1.22 4.83Pakim Pond 04/30/03 15:10 3.94 75.7 21.0 Pakim Pond 05/21/03 14:30 4.63 76.3 16.3 Pakim Pond 06/26/03 10:20 3.83 56.0 22.0 Pakim Pond 07/16/03 10:40 3.90 42.0 24.5 Pakim Pond 08/22/03 13:25 4.30 62.0 30.2 Pakim Pond 10/20/03 16:10 4.18 55.2 15.0 Pakim Pond 03/23/04 9:10 3.89 63.0 5.2 Pakim Pond 04/19/04 10:15 4.55 65.1 15.3 Pakim Pond 05/10/04 10:05 4.15 34.4 19.3 Pakim Pond 06/08/04 9:50 4.04 45.3 21.9 Pakim Pond 08/19/04 9:45 4.01 62.7 22.4 Pakim Pond 09/13/04 9:45 4.16 49.4 20.1 Pakim Pond 10/12/04 9:39 4.19 45.0 13.0 Pakim Pond 03/21/05 9:32 4.05 54.4 5.8 Pakim Pond 04/19/05 9:25 3.36 50.3 13.5 Pakim Pond 05/09/05 9:44 4.13 51.3 13.7 Pakim Pond 06/13/05 9:41 4.05 48.7 25.5 Pakim Pond 07/12/05 9:34 4.16 51.6 24.6 Pakim Pond 08/17/05 9:30 4.56 48.0 23.3 Pakim Pond 09/06/05 10:11 4.34 46.2 21.9 Paradise Lake 04/29/03 10:50 5.80 76.8 16.9 Paradise Lake 05/20/03 10:50 6.22 81.9 16.4 Paradise Lake 06/25/03 9:55 5.34 50.0 21.9 Paradise Lake 07/14/03 11:00 5.86 60.0 22.7 Paradise Lake 08/21/03 10:45 5.80 85.2 23.4 Paradise Lake 10/20/03 14:20 6.28 74.1 12.9 Paradise Lake 03/23/04 15:20 5.74 70.0 8.7 Paradise Lake 04/19/04 16:00 5.38 70.0 21.4 Paradise Lake 05/11/04 8:30 6.20 78.8 19.9 Paradise Lake 06/09/04 9:35 6.47 76.7 22.3 Paradise Lake 08/20/04 8:40 6.35 80.1 24.3 Paradise Lake 09/14/04 9:35 6.28 76.0 21.1 Paradise Lake 10/13/04 9:30 5.71 70.6 12.2 Paradise Lake 03/21/05 15:15 6.26 95.2 10.1 Paradise Lake 04/19/05 15:30 6.23 75.6 19.8 Paradise Lake 05/10/05 9:05 6.14 77.9 15.9 Paradise Lake 06/14/05 7:25 6.27 83.2 25.9 Paradise Lake 07/12/05 10:36 5.57 68.3 25.0 Paradise Lake 08/17/05 10:37 6.10 84.3 23.7 Paradise Lake 09/06/05 11:23 6.20 81.5 21.9 Paradise Lake 04/18/06 11:29 6.36 76.2 9.11 88.5 14.9 Paradise Lake 05/10/06 10:24 6.12 73.1 9.28 91.5 15.8 Paradise Lake 06/19/06 11:38 6.18 58.7 8.47 100.3 24.4 6.1 ND 0.402 ND 1.32 10.04Paradise Lake 07/19/06 10:22 5.70 72.9 7.14 88.2 26.7 Paradise Lake 08/14/06 11:26 5.78 74.4 8.24 92.1 21.0 6.6 ND 0.413 ND 1.95 15.29Paradise Lake 09/20/06 10:38 5.52 68.5 6.99 74.3 17.0 Paradise Lake 10/16/06 10:24 5.03 69.1 9.73 84.8 9.1 7.8 ND 0.464 ND 1.77 9.32Paradise Lake 11/20/06 10:27 4.17 65.8 8.74 89.5 8.6 Paradise Lake 12/04/06 10:35 4.99 74.1 9.83 81.8 7.0 7.3 ND 0.722 ND 2.12 10.81Pilgrim Lake 04/29/03 15:20 4.38 39.7 18.5 Pilgrim Lake 05/20/03 14:15 4.58 52.1 18.2 Pilgrim Lake 06/25/03 13:05 4.34 29.0 24.3 Pilgrim Lake 07/14/03 13:55 4.78 27.0 23.8 Pilgrim Lake 08/21/03 14:30 4.68 41.7 26.4 Pilgrim Lake 10/20/03 13:15 4.51 44.5 13.3 Pilgrim Lake 03/24/04 13:50 4.20 35.0 8.7 Pilgrim Lake 04/20/04 11:40 3.90 39.8 18.9 Pilgrim Lake 05/11/04 12:05 4.59 34.2 21.9 Pilgrim Lake 06/09/04 14:40 4.65 31.5 24.7 Pilgrim Lake 08/20/04 10:58 4.48 42.4 25.5 Pilgrim Lake 09/14/04 11:45 4.72 29.6 22.7 Pilgrim Lake 10/13/04 11:46 4.59 31.3 14.3 Pilgrim Lake 03/22/05 11:40 4.58 34.4 9.5 Pilgrim Lake 04/20/05 10:45 4.24 36.9 16.5 Pilgrim Lake 05/10/05 11:21 4.58 32.4 16.3 Pilgrim Lake 06/14/05 9:24 4.68 30.8 25.8 Pilgrim Lake 07/13/05 9:44 4.65 35.8 25.1
44
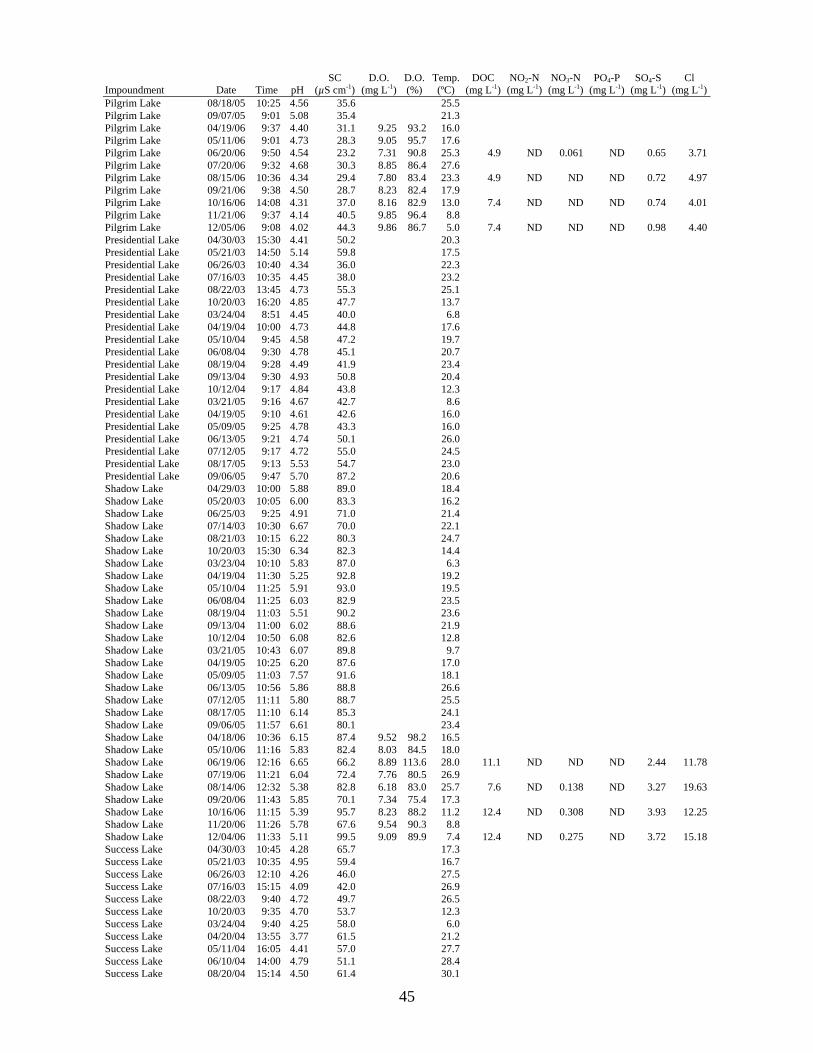
Impoundment Date Time pH SC
(µS cm-1)D.O.
(mg L-1)D.O. (%)
Temp.(ºC)
DOC (mg L-1)
NO2-N (mg L-1)
NO3-N (mg L-1)
PO4-P (mg L-1)
SO4-S (mg L-1)
Cl (mg L-1)
Pilgrim Lake 08/18/05 10:25 4.56 35.6 25.5 Pilgrim Lake 09/07/05 9:01 5.08 35.4 21.3 Pilgrim Lake 04/19/06 9:37 4.40 31.1 9.25 93.2 16.0 Pilgrim Lake 05/11/06 9:01 4.73 28.3 9.05 95.7 17.6 Pilgrim Lake 06/20/06 9:50 4.54 23.2 7.31 90.8 25.3 4.9 ND 0.061 ND 0.65 3.71Pilgrim Lake 07/20/06 9:32 4.68 30.3 8.85 86.4 27.6 Pilgrim Lake 08/15/06 10:36 4.34 29.4 7.80 83.4 23.3 4.9 ND ND ND 0.72 4.97Pilgrim Lake 09/21/06 9:38 4.50 28.7 8.23 82.4 17.9 Pilgrim Lake 10/16/06 14:08 4.31 37.0 8.16 82.9 13.0 7.4 ND ND ND 0.74 4.01Pilgrim Lake 11/21/06 9:37 4.14 40.5 9.85 96.4 8.8 Pilgrim Lake 12/05/06 9:08 4.02 44.3 9.86 86.7 5.0 7.4 ND ND ND 0.98 4.40Presidential Lake 04/30/03 15:30 4.41 50.2 20.3 Presidential Lake 05/21/03 14:50 5.14 59.8 17.5 Presidential Lake 06/26/03 10:40 4.34 36.0 22.3 Presidential Lake 07/16/03 10:35 4.45 38.0 23.2 Presidential Lake 08/22/03 13:45 4.73 55.3 25.1 Presidential Lake 10/20/03 16:20 4.85 47.7 13.7 Presidential Lake 03/24/04 8:51 4.45 40.0 6.8 Presidential Lake 04/19/04 10:00 4.73 44.8 17.6 Presidential Lake 05/10/04 9:45 4.58 47.2 19.7 Presidential Lake 06/08/04 9:30 4.78 45.1 20.7 Presidential Lake 08/19/04 9:28 4.49 41.9 23.4 Presidential Lake 09/13/04 9:30 4.93 50.8 20.4 Presidential Lake 10/12/04 9:17 4.84 43.8 12.3 Presidential Lake 03/21/05 9:16 4.67 42.7 8.6 Presidential Lake 04/19/05 9:10 4.61 42.6 16.0 Presidential Lake 05/09/05 9:25 4.78 43.3 16.0 Presidential Lake 06/13/05 9:21 4.74 50.1 26.0 Presidential Lake 07/12/05 9:17 4.72 55.0 24.5 Presidential Lake 08/17/05 9:13 5.53 54.7 23.0 Presidential Lake 09/06/05 9:47 5.70 87.2 20.6 Shadow Lake 04/29/03 10:00 5.88 89.0 18.4 Shadow Lake 05/20/03 10:05 6.00 83.3 16.2 Shadow Lake 06/25/03 9:25 4.91 71.0 21.4 Shadow Lake 07/14/03 10:30 6.67 70.0 22.1 Shadow Lake 08/21/03 10:15 6.22 80.3 24.7 Shadow Lake 10/20/03 15:30 6.34 82.3 14.4 Shadow Lake 03/23/04 10:10 5.83 87.0 6.3 Shadow Lake 04/19/04 11:30 5.25 92.8 19.2 Shadow Lake 05/10/04 11:25 5.91 93.0 19.5 Shadow Lake 06/08/04 11:25 6.03 82.9 23.5 Shadow Lake 08/19/04 11:03 5.51 90.2 23.6 Shadow Lake 09/13/04 11:00 6.02 88.6 21.9 Shadow Lake 10/12/04 10:50 6.08 82.6 12.8 Shadow Lake 03/21/05 10:43 6.07 89.8 9.7 Shadow Lake 04/19/05 10:25 6.20 87.6 17.0 Shadow Lake 05/09/05 11:03 7.57 91.6 18.1 Shadow Lake 06/13/05 10:56 5.86 88.8 26.6 Shadow Lake 07/12/05 11:11 5.80 88.7 25.5 Shadow Lake 08/17/05 11:10 6.14 85.3 24.1 Shadow Lake 09/06/05 11:57 6.61 80.1 23.4 Shadow Lake 04/18/06 10:36 6.15 87.4 9.52 98.2 16.5 Shadow Lake 05/10/06 11:16 5.83 82.4 8.03 84.5 18.0 Shadow Lake 06/19/06 12:16 6.65 66.2 8.89 113.6 28.0 11.1 ND ND ND 2.44 11.78Shadow Lake 07/19/06 11:21 6.04 72.4 7.76 80.5 26.9 Shadow Lake 08/14/06 12:32 5.38 82.8 6.18 83.0 25.7 7.6 ND 0.138 ND 3.27 19.63Shadow Lake 09/20/06 11:43 5.85 70.1 7.34 75.4 17.3 Shadow Lake 10/16/06 11:15 5.39 95.7 8.23 88.2 11.2 12.4 ND 0.308 ND 3.93 12.25Shadow Lake 11/20/06 11:26 5.78 67.6 9.54 90.3 8.8 Shadow Lake 12/04/06 11:33 5.11 99.5 9.09 89.9 7.4 12.4 ND 0.275 ND 3.72 15.18Success Lake 04/30/03 10:45 4.28 65.7 17.3 Success Lake 05/21/03 10:35 4.95 59.4 16.7 Success Lake 06/26/03 12:10 4.26 46.0 27.5 Success Lake 07/16/03 15:15 4.09 42.0 26.9 Success Lake 08/22/03 9:40 4.72 49.7 26.5 Success Lake 10/20/03 9:35 4.70 53.7 12.3 Success Lake 03/24/04 9:40 4.25 58.0 6.0 Success Lake 04/20/04 13:55 3.77 61.5 21.2 Success Lake 05/11/04 16:05 4.41 57.0 27.7 Success Lake 06/10/04 14:00 4.79 51.1 28.4 Success Lake 08/20/04 15:14 4.50 61.4 30.1
45
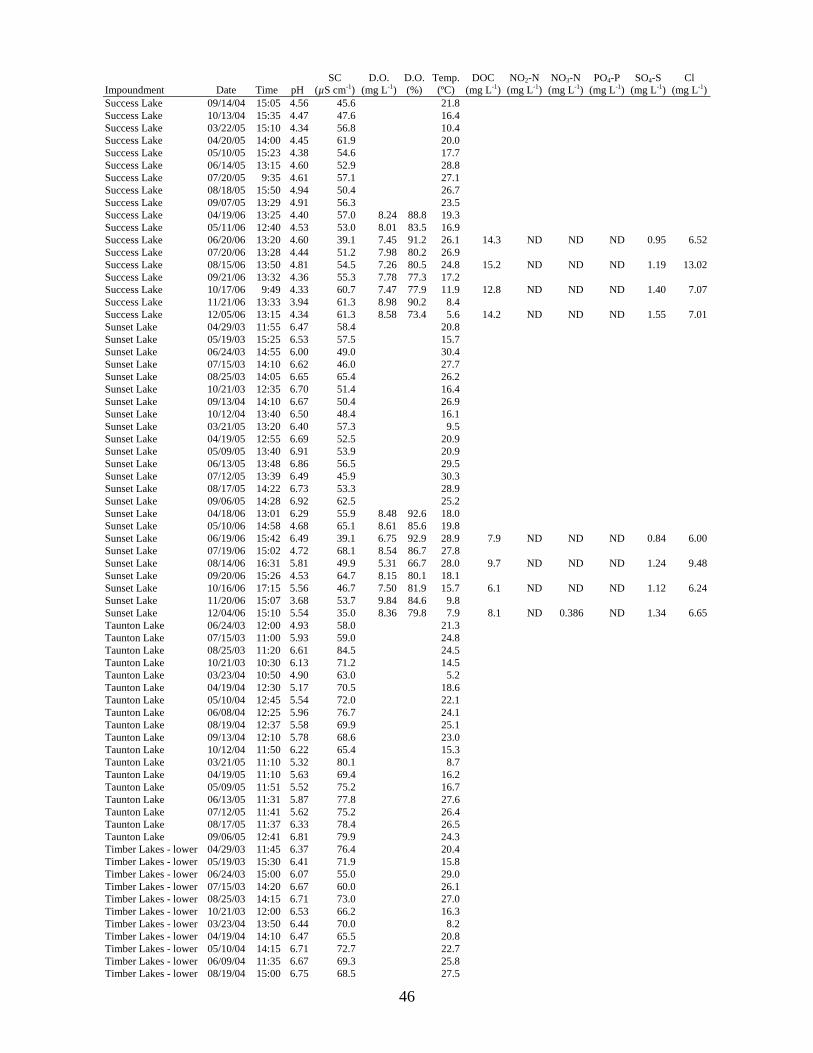
Impoundment Date Time pH SC
(µS cm-1)D.O.
(mg L-1)D.O. (%)
Temp.(ºC)
DOC (mg L-1)
NO2-N (mg L-1)
NO3-N (mg L-1)
PO4-P (mg L-1)
SO4-S (mg L-1)
Cl (mg L-1)
Success Lake 09/14/04 15:05 4.56 45.6 21.8 Success Lake 10/13/04 15:35 4.47 47.6 16.4 Success Lake 03/22/05 15:10 4.34 56.8 10.4 Success Lake 04/20/05 14:00 4.45 61.9 20.0 Success Lake 05/10/05 15:23 4.38 54.6 17.7 Success Lake 06/14/05 13:15 4.60 52.9 28.8 Success Lake 07/20/05 9:35 4.61 57.1 27.1 Success Lake 08/18/05 15:50 4.94 50.4 26.7 Success Lake 09/07/05 13:29 4.91 56.3 23.5 Success Lake 04/19/06 13:25 4.40 57.0 8.24 88.8 19.3 Success Lake 05/11/06 12:40 4.53 53.0 8.01 83.5 16.9 Success Lake 06/20/06 13:20 4.60 39.1 7.45 91.2 26.1 14.3 ND ND ND 0.95 6.52Success Lake 07/20/06 13:28 4.44 51.2 7.98 80.2 26.9 Success Lake 08/15/06 13:50 4.81 54.5 7.26 80.5 24.8 15.2 ND ND ND 1.19 13.02Success Lake 09/21/06 13:32 4.36 55.3 7.78 77.3 17.2 Success Lake 10/17/06 9:49 4.33 60.7 7.47 77.9 11.9 12.8 ND ND ND 1.40 7.07Success Lake 11/21/06 13:33 3.94 61.3 8.98 90.2 8.4 Success Lake 12/05/06 13:15 4.34 61.3 8.58 73.4 5.6 14.2 ND ND ND 1.55 7.01Sunset Lake 04/29/03 11:55 6.47 58.4 20.8 Sunset Lake 05/19/03 15:25 6.53 57.5 15.7 Sunset Lake 06/24/03 14:55 6.00 49.0 30.4 Sunset Lake 07/15/03 14:10 6.62 46.0 27.7 Sunset Lake 08/25/03 14:05 6.65 65.4 26.2 Sunset Lake 10/21/03 12:35 6.70 51.4 16.4 Sunset Lake 09/13/04 14:10 6.67 50.4 26.9 Sunset Lake 10/12/04 13:40 6.50 48.4 16.1 Sunset Lake 03/21/05 13:20 6.40 57.3 9.5 Sunset Lake 04/19/05 12:55 6.69 52.5 20.9 Sunset Lake 05/09/05 13:40 6.91 53.9 20.9 Sunset Lake 06/13/05 13:48 6.86 56.5 29.5 Sunset Lake 07/12/05 13:39 6.49 45.9 30.3 Sunset Lake 08/17/05 14:22 6.73 53.3 28.9 Sunset Lake 09/06/05 14:28 6.92 62.5 25.2 Sunset Lake 04/18/06 13:01 6.29 55.9 8.48 92.6 18.0 Sunset Lake 05/10/06 14:58 4.68 65.1 8.61 85.6 19.8 Sunset Lake 06/19/06 15:42 6.49 39.1 6.75 92.9 28.9 7.9 ND ND ND 0.84 6.00Sunset Lake 07/19/06 15:02 4.72 68.1 8.54 86.7 27.8 Sunset Lake 08/14/06 16:31 5.81 49.9 5.31 66.7 28.0 9.7 ND ND ND 1.24 9.48Sunset Lake 09/20/06 15:26 4.53 64.7 8.15 80.1 18.1 Sunset Lake 10/16/06 17:15 5.56 46.7 7.50 81.9 15.7 6.1 ND ND ND 1.12 6.24Sunset Lake 11/20/06 15:07 3.68 53.7 9.84 84.6 9.8 Sunset Lake 12/04/06 15:10 5.54 35.0 8.36 79.8 7.9 8.1 ND 0.386 ND 1.34 6.65Taunton Lake 06/24/03 12:00 4.93 58.0 21.3 Taunton Lake 07/15/03 11:00 5.93 59.0 24.8 Taunton Lake 08/25/03 11:20 6.61 84.5 24.5 Taunton Lake 10/21/03 10:30 6.13 71.2 14.5 Taunton Lake 03/23/04 10:50 4.90 63.0 5.2 Taunton Lake 04/19/04 12:30 5.17 70.5 18.6 Taunton Lake 05/10/04 12:45 5.54 72.0 22.1 Taunton Lake 06/08/04 12:25 5.96 76.7 24.1 Taunton Lake 08/19/04 12:37 5.58 69.9 25.1 Taunton Lake 09/13/04 12:10 5.78 68.6 23.0 Taunton Lake 10/12/04 11:50 6.22 65.4 15.3 Taunton Lake 03/21/05 11:10 5.32 80.1 8.7 Taunton Lake 04/19/05 11:10 5.63 69.4 16.2 Taunton Lake 05/09/05 11:51 5.52 75.2 16.7 Taunton Lake 06/13/05 11:31 5.87 77.8 27.6 Taunton Lake 07/12/05 11:41 5.62 75.2 26.4 Taunton Lake 08/17/05 11:37 6.33 78.4 26.5 Taunton Lake 09/06/05 12:41 6.81 79.9 24.3 Timber Lakes - lower 04/29/03 11:45 6.37 76.4 20.4 Timber Lakes - lower 05/19/03 15:30 6.41 71.9 15.8 Timber Lakes - lower 06/24/03 15:00 6.07 55.0 29.0 Timber Lakes - lower 07/15/03 14:20 6.67 60.0 26.1 Timber Lakes - lower 08/25/03 14:15 6.71 73.0 27.0 Timber Lakes - lower 10/21/03 12:00 6.53 66.2 16.3 Timber Lakes - lower 03/23/04 13:50 6.44 70.0 8.2 Timber Lakes - lower 04/19/04 14:10 6.47 65.5 20.8 Timber Lakes - lower 05/10/04 14:15 6.71 72.7 22.7 Timber Lakes - lower 06/09/04 11:35 6.67 69.3 25.8 Timber Lakes - lower 08/19/04 15:00 6.75 68.5 27.5
46
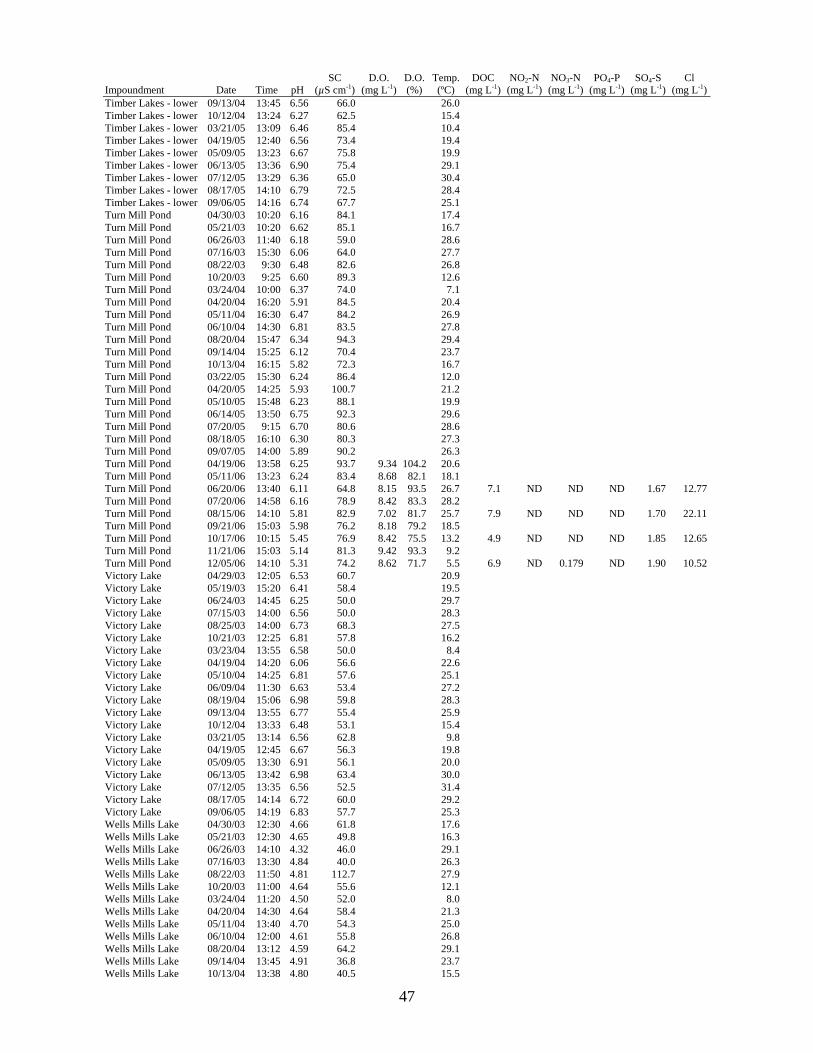
Impoundment Date Time pH SC
(µS cm-1)D.O.
(mg L-1)D.O. (%)
Temp.(ºC)
DOC (mg L-1)
NO2-N (mg L-1)
NO3-N (mg L-1)
PO4-P (mg L-1)
SO4-S (mg L-1)
Cl (mg L-1)
Timber Lakes - lower 09/13/04 13:45 6.56 66.0 26.0 Timber Lakes - lower 10/12/04 13:24 6.27 62.5 15.4 Timber Lakes - lower 03/21/05 13:09 6.46 85.4 10.4 Timber Lakes - lower 04/19/05 12:40 6.56 73.4 19.4 Timber Lakes - lower 05/09/05 13:23 6.67 75.8 19.9 Timber Lakes - lower 06/13/05 13:36 6.90 75.4 29.1 Timber Lakes - lower 07/12/05 13:29 6.36 65.0 30.4 Timber Lakes - lower 08/17/05 14:10 6.79 72.5 28.4 Timber Lakes - lower 09/06/05 14:16 6.74 67.7 25.1 Turn Mill Pond 04/30/03 10:20 6.16 84.1 17.4 Turn Mill Pond 05/21/03 10:20 6.62 85.1 16.7 Turn Mill Pond 06/26/03 11:40 6.18 59.0 28.6 Turn Mill Pond 07/16/03 15:30 6.06 64.0 27.7 Turn Mill Pond 08/22/03 9:30 6.48 82.6 26.8 Turn Mill Pond 10/20/03 9:25 6.60 89.3 12.6 Turn Mill Pond 03/24/04 10:00 6.37 74.0 7.1 Turn Mill Pond 04/20/04 16:20 5.91 84.5 20.4 Turn Mill Pond 05/11/04 16:30 6.47 84.2 26.9 Turn Mill Pond 06/10/04 14:30 6.81 83.5 27.8 Turn Mill Pond 08/20/04 15:47 6.34 94.3 29.4 Turn Mill Pond 09/14/04 15:25 6.12 70.4 23.7 Turn Mill Pond 10/13/04 16:15 5.82 72.3 16.7 Turn Mill Pond 03/22/05 15:30 6.24 86.4 12.0 Turn Mill Pond 04/20/05 14:25 5.93 100.7 21.2 Turn Mill Pond 05/10/05 15:48 6.23 88.1 19.9 Turn Mill Pond 06/14/05 13:50 6.75 92.3 29.6 Turn Mill Pond 07/20/05 9:15 6.70 80.6 28.6 Turn Mill Pond 08/18/05 16:10 6.30 80.3 27.3 Turn Mill Pond 09/07/05 14:00 5.89 90.2 26.3 Turn Mill Pond 04/19/06 13:58 6.25 93.7 9.34 104.2 20.6 Turn Mill Pond 05/11/06 13:23 6.24 83.4 8.68 82.1 18.1 Turn Mill Pond 06/20/06 13:40 6.11 64.8 8.15 93.5 26.7 7.1 ND ND ND 1.67 12.77Turn Mill Pond 07/20/06 14:58 6.16 78.9 8.42 83.3 28.2 Turn Mill Pond 08/15/06 14:10 5.81 82.9 7.02 81.7 25.7 7.9 ND ND ND 1.70 22.11Turn Mill Pond 09/21/06 15:03 5.98 76.2 8.18 79.2 18.5 Turn Mill Pond 10/17/06 10:15 5.45 76.9 8.42 75.5 13.2 4.9 ND ND ND 1.85 12.65Turn Mill Pond 11/21/06 15:03 5.14 81.3 9.42 93.3 9.2 Turn Mill Pond 12/05/06 14:10 5.31 74.2 8.62 71.7 5.5 6.9 ND 0.179 ND 1.90 10.52Victory Lake 04/29/03 12:05 6.53 60.7 20.9 Victory Lake 05/19/03 15:20 6.41 58.4 19.5 Victory Lake 06/24/03 14:45 6.25 50.0 29.7 Victory Lake 07/15/03 14:00 6.56 50.0 28.3 Victory Lake 08/25/03 14:00 6.73 68.3 27.5 Victory Lake 10/21/03 12:25 6.81 57.8 16.2 Victory Lake 03/23/04 13:55 6.58 50.0 8.4 Victory Lake 04/19/04 14:20 6.06 56.6 22.6 Victory Lake 05/10/04 14:25 6.81 57.6 25.1 Victory Lake 06/09/04 11:30 6.63 53.4 27.2 Victory Lake 08/19/04 15:06 6.98 59.8 28.3 Victory Lake 09/13/04 13:55 6.77 55.4 25.9 Victory Lake 10/12/04 13:33 6.48 53.1 15.4 Victory Lake 03/21/05 13:14 6.56 62.8 9.8 Victory Lake 04/19/05 12:45 6.67 56.3 19.8 Victory Lake 05/09/05 13:30 6.91 56.1 20.0 Victory Lake 06/13/05 13:42 6.98 63.4 30.0 Victory Lake 07/12/05 13:35 6.56 52.5 31.4 Victory Lake 08/17/05 14:14 6.72 60.0 29.2 Victory Lake 09/06/05 14:19 6.83 57.7 25.3 Wells Mills Lake 04/30/03 12:30 4.66 61.8 17.6 Wells Mills Lake 05/21/03 12:30 4.65 49.8 16.3 Wells Mills Lake 06/26/03 14:10 4.32 46.0 29.1 Wells Mills Lake 07/16/03 13:30 4.84 40.0 26.3 Wells Mills Lake 08/22/03 11:50 4.81 112.7 27.9 Wells Mills Lake 10/20/03 11:00 4.64 55.6 12.1 Wells Mills Lake 03/24/04 11:20 4.50 52.0 8.0 Wells Mills Lake 04/20/04 14:30 4.64 58.4 21.3 Wells Mills Lake 05/11/04 13:40 4.70 54.3 25.0 Wells Mills Lake 06/10/04 12:00 4.61 55.8 26.8 Wells Mills Lake 08/20/04 13:12 4.59 64.2 29.1 Wells Mills Lake 09/14/04 13:45 4.91 36.8 23.7 Wells Mills Lake 10/13/04 13:38 4.80 40.5 15.5
47

48
Impoundment Date Time pH SC
(µS cm-1)D.O.
(mg L-1)D.O. (%)
Temp.(ºC)
DOC (mg L-1)
NO2-N (mg L-1)
NO3-N (mg L-1)
PO4-P (mg L-1)
SO4-S (mg L-1)
Cl (mg L-1)
Wells Mills Lake 03/22/05 13:30 4.69 47.8 10.8 Wells Mills Lake 04/20/05 11:50 4.77 54.1 18.9 Wells Mills Lake 05/10/05 13:23 4.61 53.4 18.1 Wells Mills Lake 06/14/05 11:30 4.82 51.4 28.0 Wells Mills Lake 07/13/05 11:58 4.55 54.5 26.1 Wells Mills Lake 08/18/05 13:25 4.88 50.4 26.2 Wells Mills Lake 09/07/05 11:18 5.22 48.2 22.2 Wells Mills Lake 04/19/06 11:32 4.62 47.3 9.35 97.5 17.2 Wells Mills Lake 05/11/06 11:00 4.88 42.9 10.08 105.8 17.5 Wells Mills Lake 06/20/06 11:54 4.90 34.3 8.74 110.3 26.5 3.9 ND 0.061 ND 0.70 7.80Wells Mills Lake 07/20/06 11:37 4.78 38.7 9.87 101.2 27.5 Wells Mills Lake 08/15/06 12:02 4.72 36.2 8.76 89.1 24.9 3.9 ND ND ND 0.64 9.46Wells Mills Lake 09/21/06 11:43 4.67 42.8 8.92 92.7 17.8 Wells Mills Lake 10/17/06 8:30 4.62 51.5 9.47 85.5 11.5 5.2 ND ND ND 0.83 8.21Wells Mills Lake 11/21/06 11:42 4.24 48.8 9.94 142.7 8.7 Wells Mills Lake 12/05/06 11:40 4.33 57.4 9.12 68.9 5.1 6.1 ND ND ND 0.96 8.20
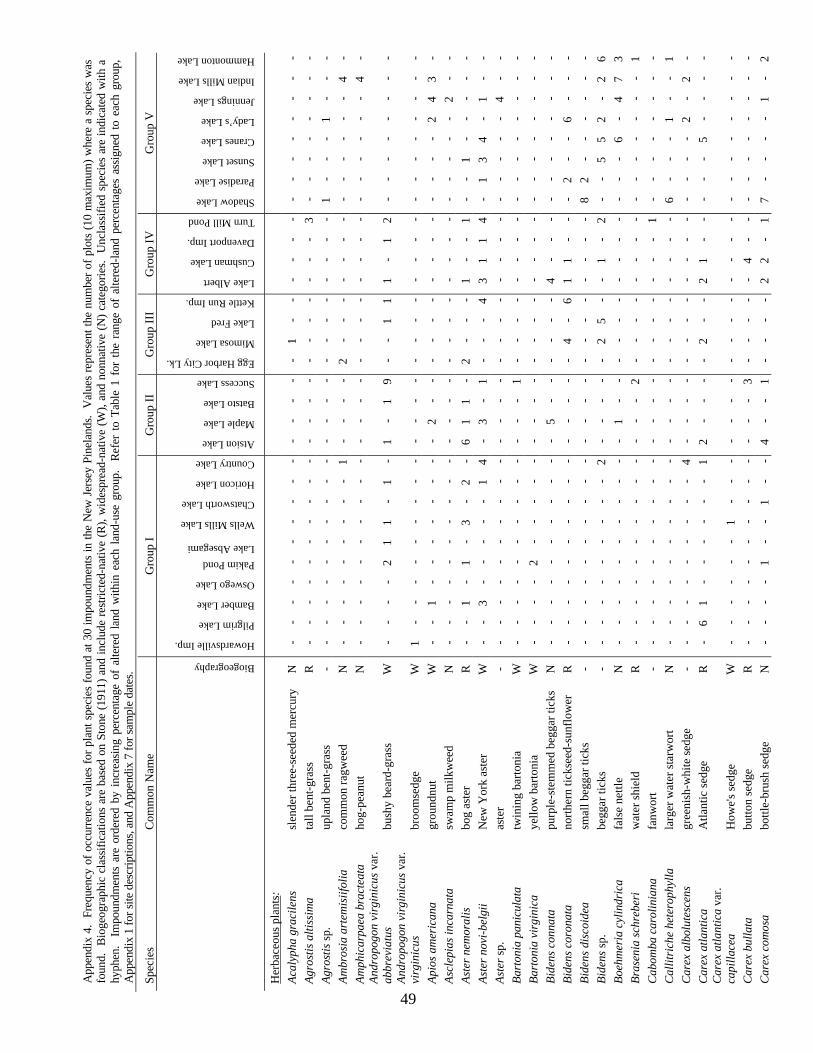
App
endi
x 4.
Fre
quen
cy o
f occ
urre
nce
valu
es fo
r pla
nt s
peci
es fo
und
at 3
0 im
poun
dmen
ts in
the
New
Jer
sey
Pine
land
s. V
alue
s re
pres
ent t
he n
umbe
r of p
lots
(10
max
imum
) whe
re a
spe
cies
was
fo
und.
Bio
geog
raph
ic c
lass
ifica
tions
are
bas
ed o
n St
one
(191
1) a
nd in
clud
e re
stric
ted-
nativ
e (R
), w
ides
prea
d-na
tive
(W),
and
nonn
ativ
e (N
) cat
egor
ies.
Unc
lass
ified
spe
cies
are
indi
cate
d w
ith a
hy
phen
. Im
poun
dmen
ts ar
e or
dere
d by
incr
easin
g pe
rcen
tage
of
alte
red
land
with
in e
ach
land
-use
gro
up.
Refe
r to
Tab
le 1
for
the
rang
e of
alte
red-
land
per
cent
ages
ass
igne
d to
eac
h gr
oup,
A
ppen
dix
1 fo
r site
des
crip
tions
, and
App
endi
x 7
for s
ampl
e da
tes.
Spec
ies
Com
mon
Nam
e
Gro
up I
Gro
up II
G
roup
III
Gro
up IV
G
roup
V
Biogeography
Howardsville Imp.
Pilgrim Lake
Bamber Lake
Oswego Lake
Pakim Pond Lake Absegami
Wells Mills Lake
Chatsworth Lake
Horicon Lake
Country Lake
Atsion Lake
Maple Lake
Batsto Lake
Success Lake
Egg Harbor City Lk.
Mimosa Lake
Lake Fred
Kettle Run Imp.
Lake Albert
Cushman Lake
Davenport Imp.
Turn Mill Pond
Shadow Lake
Paradise Lake
Sunset Lake
Cranes Lake
Lady’s Lake
Jennings Lake
Indian Mills Lake
Hammonton Lake
Her
bace
ous p
lant
s:
Acal
ypha
gra
cile
ns
slen
der t
hree
-see
ded
mer
cury
N
-
--
--
--
--
--
--
-1
--
--
--
--
--
--
--
-
Ag
rost
is a
ltiss
ima
ta
ll be
nt-g
ras
sR
-
--
--
--
--
--
--
--
--
--
-3
--
--
--
--
-
Ag
rost
is sp
.up
land
ben
t-gra
ss
- -
--
--
--
--
--
--
--
--
--
--
1-
--
1-
--
-
Am
bros
ia a
rtem
isiif
olia
co
mm
on ra
gwee
d N
-
--
--
--
--
1-
--
2-
--
--
--
--
--
--
4-
-
Am
phic
arpa
ea b
ract
eata
ho
g-pe
anut
N
-
--
--
--
--
--
- -
--
--
--
--
--
--
--
-4
- An
drop
ogon
vir
gini
cus v
ar.
abbr
evia
tus
bush
y be
ard-
gras
s W
-
--
-2
11
-1
-1
9-
-1
11
-1
2-
--
--
--
-1
-
Andr
opog
on v
irgi
nicu
s var
. vi
rgin
icus
br
oom
sedg
e W
1
--
--
--
--
--
--
--
--
--
--
--
--
--
--
-
Ap
ios a
mer
ican
a gr
ound
nut
W
--
1-
--
--
--
- 2
--
--
--
--
--
--
--
24
3-
Ascl
epia
s inc
arna
ta
swam
p m
ilkw
eed
N
--
--
--
--
--
--
--
--
--
--
--
--
--
2-
-
-
Aste
r nem
oral
is
bog
aste
r R
-
-1
-1
-3
-2
-6
1 1
-2
--
-1
--
1-
-1
--
--
- As
ter n
ovi-b
elgi
i N
ew Y
ork
aste
r W
-
-3
--
--
-1
4-
-1
--
-4
31
14
-1
34
-1
--
3
As
ter s
p .
aste
r-
--
--
--
--
--
--
--
--
--
--
--
--
--
4-
-
-
Bart
onia
pan
icul
ata
twin
ing
barto
nia
W
--
--
--
--
--
--
1-
--
--
--
--
--
--
--
-
-
Bart
onia
vir
gini
ca
yello
w b
arto
ni a
W
--
--
2-
--
--
--
--
--
--
--
--
--
--
--
-
-
Bide
ns c
onna
ta
purp
le-s
tem
med
beg
gar t
icks
N
-
--
--
--
--
--
--
--
--
4-
--
--
--
--
--
5
Bi
dens
cor
onat
a no
rther
n tic
ksee
d-su
nflo
we
rR
-
--
--
--
--
--
--
-4
-6
11
--
-2
--
6-
--
-
Bi
dens
dis
coid
ea
smal
l beg
gar t
ick
s-
--
--
--
--
--
--
--
--
--
--
-8
2-
--
--
-
-
Bide
ns sp
.be
ggar
tick
s-
--
--
--
--
-2
--
--
25
--
1-
2-
-5
52
-2
-
6 Bo
ehm
eria
cyl
indr
ica
fals
e ne
ttl e
N
--
--
--
--
--
--
--
--
--
--
--
--
6-
47
1
3 Br
asen
ia sc
hreb
eri
wat
er sh
ield
R
-
--
--
--
--
--
-2
--
--
--
--
--
--
--
-
- 1
Cab
omba
car
olin
iana
fa
nwor
t-
--
--
--
--
--
--
--
--
--
--
1-
--
--
--
-
-
Cal
litri
che
hete
roph
ylla
la
rger
wat
er st
arw
ort
N
--
--
--
--
--
--
--
--
--
--
-6
--
-1
--
-
1 C
arex
alb
olut
esce
ns
gree
nish
-whi
te se
dge
- -
--
--
--
--
4-
--
--
--
--
--
--
--
2-
2-
-
C
arex
atla
ntic
a A
tlant
ic se
dg e
R
-6
1-
--
--
-1
--
-2
--
21
--
--
-5
--
--
2 -
C
arex
atla
ntic
a va
r. ca
pilla
cea
How
e's se
dge
W
--
--
--
1-
--
--
--
--
--
--
--
--
--
--
-
-
Car
ex b
ulla
ta
butto
n se
dg e
R
--
--
--
--
--
--
3-
--
--
4-
--
--
--
--
-
-
Car
ex c
omos
a bo
ttle-
brus
h se
dge
N
--
--
1-
-1
--
4 -
-1
--
--
22
-1
7-
--
-1
-2
49

Spec
ies
Com
mon
Nam
e
Gro
up I
Gro
up II
G
roup
III
Gro
up IV
G
roup
V
Biogeography
Howardsville Imp.
Pilgrim Lake
Bamber Lake
Oswego Lake
Pakim Pond Lake Absegami
Wells Mills Lake
Chatsworth Lake
Horicon Lake
Country Lake
Atsion Lake
Maple Lake
Batsto Lake
Success Lake
Egg Harbor City Lk.
Mimosa Lake
Lake Fred
Kettle Run Imp.
Lake Albert
Cushman Lake
Davenport Imp.
Turn Mill Pond
Shadow Lake
Paradise Lake
Sunset Lake
Cranes Lake
Lady’s Lake
Jennings Lake
Indian Mills Lake
Hammonton Lake
Car
ex c
rini
ta
frin
ged
sedg
e N
-
--
--
--
--
--
--
--
--
--
--
--
--
--
-1
-
Car
ex e
xilis
co
ast s
edg
eR
-
-2
22
-5
--
--
-1
--
--
--
--
1-
--
--
-1
-
Car
ex fo
llicu
lata
lo
ng se
dge
W
--
--
--
1-
--
- -
--
--
--
--
--
--
--
--
--
Car
ex li
vida
liv
id se
dge
R
--
--
--
--
--
--
3-
--
--
--
--
--
--
--
-
-
Car
ex lu
rida
sa
llow
sedg
e N
-
--
--
--
--
--
--
-1
--
--
-1
--
1-
--
4-
-
C
arex
pen
sylv
anic
a Pe
nnsy
lvan
ia se
dge
W
--
--
--
--
--
--
--
1-
--
--
--
--
--
--
-
-
Car
ex st
riat
a W
alte
r's se
dg e
R
-8
34
61
73
5-
-1
2-
81
1-
4-
24
--
2-
-3
- -
Car
ex st
rict
a tu
ssoc
k se
dg e
N
--
--
--
--
-2
--
-6
-5
--
-2
--
--
-3
--
3 -
C
arex
tris
perm
a th
ree-
frui
ted
sedg
e R
-
--
--
-1
--
--
- -
--
--
--
--
--
--
--
--
- C
enta
urea
sp .
knap
wee
d-
--
--
--
--
--
--
--
--
--
--
--
--
--
-1
-
-
Cer
atop
hyllu
m e
chin
atum
pr
ickl
y ho
rnw
or t
--
--
--
--
--
--
--
--
--
--
--
--
--
8-
-N
-
Cha
sman
thiu
m la
xum
sl
ende
r spi
ke-g
rass
N
-
--
--
--
--
--
--
--
--
--
--
--
--
-5
--
-
C
hrys
opsi
s mar
iana
M
aryl
and
gold
en a
ster
W
-
--
--
--
--
--
--
2-
--
--
--
--
--
--
--
-
C
inna
aru
ndin
acea
w
ood-
ree
dN
-
--
--
--
--
--
--
--
--
--
--
--
--
-3
--
-
C
ladi
um m
aris
coid
es
twig
-rus
hR
-
12
-4
--
2-
--
21
--
--
--
13
--
--
--
--
-
C
omm
elin
a co
mm
unis
A
siat
ic d
ayflo
wer
N
-
--
--
--
--
--
--
--
--
--
--
--
--
1-
--
-
C
uscu
ta sp
. do
dder
-
1-
-1
--
--
--
- -
-3
-1
11
1-
42
3-
-6
22
71
Cyp
erus
den
tatu
s to
othe
d cy
peru
s R
-
7-
--
--
7-
-1
- 4
7-
16
-6
6-
22
-1
-3
--
- C
yper
us re
tror
sus
Pine
Bar
rens
cyp
erus
R
-
--
--
--
--
--
--
-1
--
--
--
--
--
--
--
-
C
yper
us st
rigo
sus
stra
w-c
olor
ed c
yper
us
N
--
1-
--
--
--
--
--
--
--
--
--
-1
--
13
-
-
Dau
cus c
arot
a w
ild c
arro
tN
-
--
--
--
--
1-
--
--
--
--
--
--
--
--
--
-
D
ecod
on v
ertic
illat
us
swam
p lo
oses
trife
W
-
-5
-2
-1
12
21
7-
19
44
20
58
17
89
30
- 9
11
4 D
esm
odiu
m sp
.tic
k tre
foi l
- -
--
--
--
--
--
--
--
--
--
--
--
--
-1
--
-
D
iodi
a te
res
butto
nwee
d W
-
--
--
--
--
--
--
2-
--
--
--
--
--
--
--
-
D
rose
ra fi
lifor
mis
th
read
-leav
ed su
ndew
R
-
--
-1
--
--
--
--
--
--
--
--
--
--
--
--
-
D
rose
ra in
term
edia
sp
atul
ate-
leav
ed su
ndew
W
2
78
45
14
23
-6
1 3
5-
-3
-3
-7
2-
--
1-
--
- D
rose
ra ro
tund
ifolia
ro
und-
leav
ed su
ndew
W
-
14
14
-4
-4
--
- 1
--
--
11
--
--
--
5-
--
- D
ulic
hium
aru
ndin
aceu
m
thre
e-w
ay se
dg e
N
88
72
71
-9
2-
69
21
25
1-
61
52
-1
64
-2
3 -
Echi
noch
loa
mur
icat
a A
mer
ican
bar
nyar
d gr
ass
- -
--
--
--
--
--
--
--
--
--
--
2-
--
--
--
-
Ec
lipta
pro
stra
ta
fals
e da
is y
- -
--
--
--
--
--
--
-1
--
--
--
--
--
-4
1-
-
El
atin
e m
inim
a
wat
erw
or t
--
--
--
--
--
--
--
--
--
--
3-
--
--
--
--
-
El
eoch
aris
aci
cula
ris
need
le sp
ike-
rush
N
-
--
--
--
--
--
1-
--
31
63
-4
--
--
63
--
-
El
eoch
aris
flav
esce
ns v
ar.
oliv
acea
gr
een
spik
e-ru
sh
W
--
--
1-
1-
--
-1
1-
--
--
--
-1
--
--
--
-
-
50
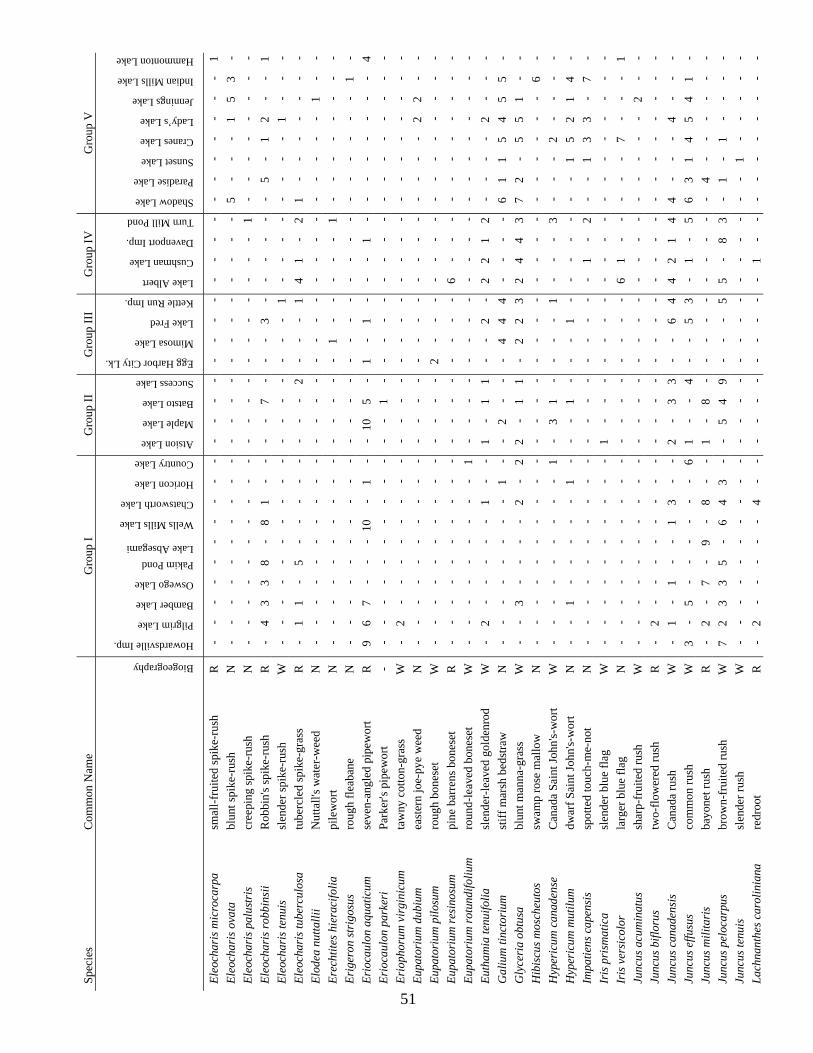
Spec
ies
Com
mon
Nam
e
Gro
up I
Gro
up II
G
roup
III
Gro
up IV
G
roup
V
Biogeography
Howardsville Imp.
Pilgrim Lake
Bamber Lake
Oswego Lake
Pakim Pond Lake Absegami
Wells Mills Lake
Chatsworth Lake
Horicon Lake
Country Lake
Atsion Lake
Maple Lake
Batsto Lake
Success Lake
Egg Harbor City Lk.
Mimosa Lake
Lake Fred
Kettle Run Imp.
Lake Albert
Cushman Lake
Davenport Imp.
Turn Mill Pond
Shadow Lake
Paradise Lake
Sunset Lake
Cranes Lake
Lady’s Lake
Jennings Lake
Indian Mills Lake
Hammonton Lake
Eleo
char
is m
icro
carp
a sm
all-f
ruite
d sp
ike-
rush
R
-
--
--
--
--
--
- -
--
--
--
--
--
--
--
--
1 El
eoch
aris
ova
ta
blun
t spi
ke-r
us h
N
--
--
--
--
--
--
--
--
--
--
-5
--
-1
53
-
-
Eleo
char
is p
alus
tris
cr
eepi
ng sp
ike-
rush
N
-
--
--
--
--
--
--
--
--
--
-1
--
--
--
--
-
El
eoch
aris
robb
insi
i R
obbi
n's s
pike
-rus
h
R
-4
33
8-
81
--
- -
7-
--
3-
--
--
-5
-1
2-
-1
Eleo
char
is te
nuis
sl
ende
r spi
ke-r
us h
W
--
--
--
--
--
--
--
--
1-
--
--
--
-1
--
-
-
Eleo
char
is tu
berc
ulos
a tu
berc
led
spik
e-gr
ass
R
-1
1-
5-
--
--
--
2-
--
14
1-
21
--
--
--
-
-
Elod
ea n
utta
llii
Nut
tall'
s wat
er-w
ee d
N
--
--
--
--
--
--
--
--
--
--
--
--
--
1-
-
-
Erec
htite
s hie
raci
folia
pi
lew
or t
N
--
--
--
--
--
--
--
1-
--
--
1-
--
--
--
-
-
Erig
eron
stri
gosu
s ro
ugh
fleab
ane
N
--
--
--
--
--
- -
--
--
--
--
--
--
--
--
1-
Erio
caul
on a
quat
icum
se
ven-
angl
ed p
ipew
ort
R
96
7-
--
10-
1-
- 10
5
-1
-1
--
-1
--
--
--
--
4 Er
ioca
ulon
par
keri
Pa
rker
's pi
pew
or t
- -
--
--
--
--
--
1-
--
--
--
--
--
--
--
--
-
Er
ioph
orum
vir
gini
cum
ta
wny
cot
ton-
gras
s W
-
2-
--
--
--
--
--
--
--
--
--
--
--
--
--
-
Eu
pato
rium
dub
ium
ea
ster
n jo
e-py
e w
eed
N
--
--
--
--
--
--
--
--
--
--
--
--
-2
2-
-
-
Eupa
tori
um p
ilosu
m
roug
h bo
nese
t W
-
--
--
--
--
--
- -
-2
--
--
--
--
--
--
--
- Eu
pato
rium
resi
nosu
m
pine
bar
rens
bon
eset
R
-
--
--
--
--
--
--
--
--
6-
--
--
--
--
--
-
Eu
pato
rium
rotu
ndifo
lium
ro
und-
leav
ed b
ones
et
W
--
--
--
--
-1
- -
--
--
--
--
--
--
--
--
--
Euth
amia
tenu
ifolia
sl
ende
r-le
aved
gol
denr
od
W
-2
--
--
-1
--
11
--
2-
22
12
--
--
2-
--
1 -
G
aliu
m ti
ncto
rium
st
iff m
arsh
bed
stra
w
N
--
--
--
--
1-
--
--
44
4-
--
-6
11
54
55
-
2
Gly
ceri
a ob
tusa
bl
unt m
anna
-gra
s s
W
--
3-
--
-2
-2
11
-2
23
24
43
72
-5
51
-2
- -
Hib
iscu
s mos
cheu
tos
swam
p ro
se m
allo
w
N
--
--
--
--
--
--
--
--
--
--
--
--
--
-6
-
-
Hyp
eric
um c
anad
ense
C
anad
a Sa
int J
ohn'
s-w
or t
--
--
--
--
-1
-1
--
--
1-
--
3-
--
2-
--
-W
3
Hyp
eric
um m
utilu
m
dwar
f Sai
nt Jo
hn's-
wor
tN
-
-1
--
--
-1
--
1-
--
1-
--
--
--
15
21
4-
-
Im
patie
ns c
apen
sis
spot
ted
touc
h-m
e-no
tN
-
--
--
--
--
--
--
--
--
-1
-2
--
13
3-
7-
-
Ir
is p
rism
atic
a sl
ende
r blu
e fla
gW
-
--
--
--
--
--
--
--
--
--
--
--
--
--
-1
-
Iris
ver
sico
lor
larg
er b
lue
fla g
N
--
--
--
--
--
--
--
--
-6
1-
--
--
7-
--
-
1 Ju
ncus
acu
min
atus
sh
arp-
frui
ted
rush
W
-
--
--
--
--
--
- -
--
--
--
--
--
--
--
2-
- Ju
ncus
bifl
orus
tw
o-flo
wer
ed ru
sh
R
-2
--
--
--
--
--
--
--
--
--
--
--
--
--
-
-
Junc
us c
anad
ensi
s C
anad
a ru
s h
W
-1
-1
--
13
--
33
--
64
42
14
4-
--
4-
-2
- -
Junc
us e
ffusu
s co
mm
on ru
sh
W
3-
5-
--
--
-6
-4
--
53
-1
-5
63
14
54
11
- -
Junc
us m
ilita
ris
bayo
net r
us h
R
-2
-7
-9
-8
--
8-
--
--
--
--
-4
--
--
--
1 -
Ju
ncus
pel
ocar
pus
brow
n-fr
uite
d ru
sh
W
72
33
5-
64
3-
- 5
49
--
-5
5-
83
-1
-1
--
--
Junc
us te
nuis
sl
ende
r rus
hW
-
--
--
--
--
--
--
--
--
--
--
--
1-
--
--
-
La
chna
nthe
s car
olin
iana
re
droo
tR
-
2-
--
--
4-
--
--
--
--
-1
--
--
--
--
--
-
51
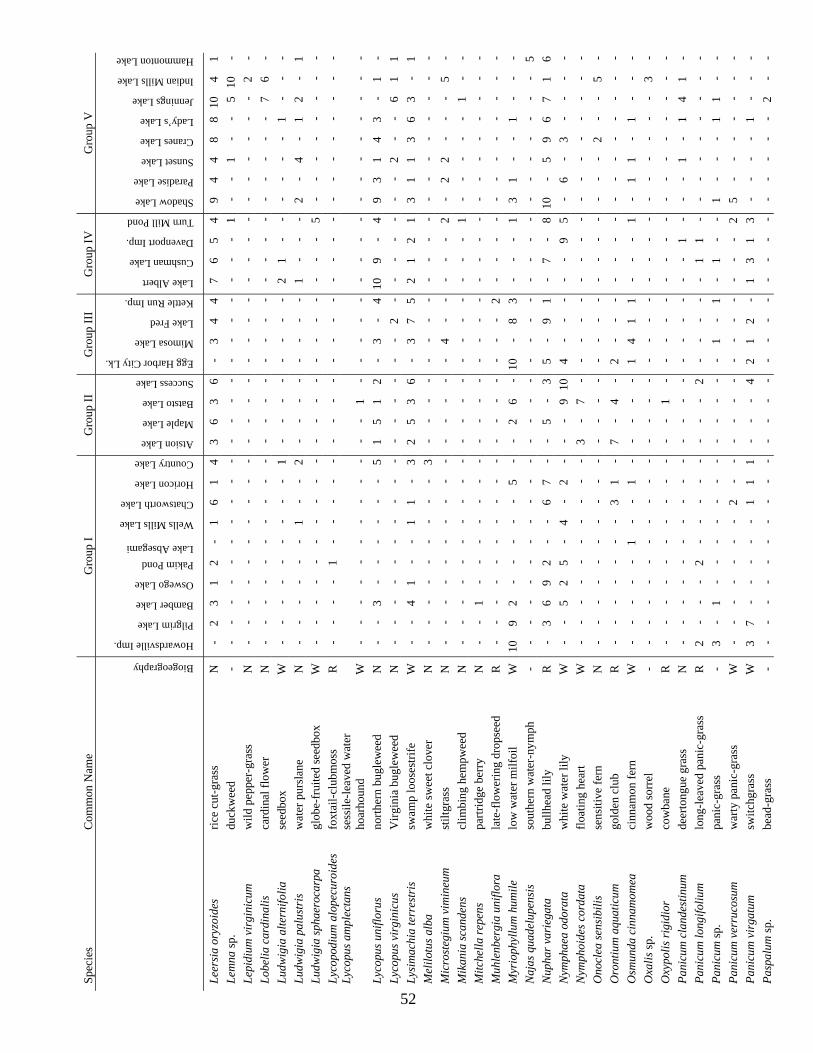
Spec
ies
Com
mon
Nam
e
Gro
up I
Gro
up II
G
roup
III
Gro
up IV
G
roup
V
Biogeography
Howardsville Imp.
Pilgrim Lake
Bamber Lake
Oswego Lake
Pakim Pond Lake Absegami
Wells Mills Lake
Chatsworth Lake
Horicon Lake
Country Lake
Atsion Lake
Maple Lake
Batsto Lake
Success Lake
Egg Harbor City Lk.
Mimosa Lake
Lake Fred
Kettle Run Imp.
Lake Albert
Cushman Lake
Davenport Imp.
Turn Mill Pond
Shadow Lake
Paradise Lake
Sunset Lake
Cranes Lake
Lady’s Lake
Jennings Lake
Indian Mills Lake
Hammonton Lake
Leer
sia
oryz
oide
s ric
e cu
t-gra
ss
N
-2
31
2-
16
14
36
-3
44
76
54
94
48
80
43
6 1
1 Le
mna
sp .
duck
wee
d-
--
--
--
--
--
--
--
--
--
--
1-
-1
--
0-
-
51
Le
pidi
um v
irgi
nicu
m
wild
pep
per-
gras
s N
-
--
--
--
--
--
--
--
--
--
--
--
--
--
2-
-
Lo
belia
car
dina
lis
card
inal
flow
e r
N
--
--
--
--
--
--
--
--
--
--
--
--
--
76
-
-
Ludw
igia
alte
rnifo
lia
seed
box
W
--
--
--
--
-1
- -
--
--
--
21
--
--
--
1-
--
Ludw
igia
pal
ustr
is
wat
er p
ursl
ane
N
--
--
--
1-
-2
--
--
--
-1
--
-2
-4
-1
2-
-
1 Lu
dwig
ia sp
haer
ocar
pa
glob
e-fr
uite
d se
edbo
x W
-
--
--
--
--
--
- -
--
--
--
--
5-
--
--
--
- Ly
copo
dium
alo
pecu
roid
es
foxt
ail-c
lubm
os s
R
--
--
1-
--
--
--
--
--
--
--
--
--
--
--
-
-
Lyco
pus a
mpl
ecta
ns
sess
ile-le
aved
wat
er
hoar
houn
d W
-
--
--
--
--
--
1-
--
--
--
--
--
--
--
--
-
Ly
copu
s uni
floru
s no
rther
n bu
glew
eed
N
--
3-
--
--
-5
1 5
12
-3
-4
109
-4
93
14
3-
1-
Lyco
pus v
irgi
nicu
s V
irgin
ia b
ugle
wee
d N
-
--
--
--
--
--
- -
--
-2
--
--
--
-2
--
61
1 Ly
sim
achi
a te
rres
tris
sw
amp
loos
estri
f e
W
--
41
--
11
-3
36
-3
75
21
21
31
13
63
-2
5 1
Mel
ilotu
s alb
a w
hite
swee
t clo
ver
N
--
--
--
--
-3
--
--
--
--
--
--
--
--
--
-
-
Mic
rost
egiu
m v
imin
eum
st
iltgr
ass
N
--
--
--
--
--
- -
--
-4
--
--
-2
-2
2-
--
5-
Mik
ania
scan
dens
cl
imbi
ng h
empw
eed
N
--
--
--
--
--
--
--
--
--
--
1-
--
--
1-
-
-
Mitc
hella
repe
ns
partr
idge
ber
r y
N
--
1-
--
--
--
--
--
--
--
--
--
--
--
--
-
-
Muh
lenb
ergi
a un
iflor
a la
te-f
low
erin
g dr
opse
ed
R
--
--
--
--
--
--
--
--
2-
--
--
--
--
--
-
-
Myr
ioph
yllu
m h
umile
lo
w w
ater
milf
oi l
W
109
2-
--
--
5-
-6
0-
83
--
-1
31
--
1-
--
2
-1
N
ajas
qua
delu
pens
is
sout
hern
wat
er-n
ymph
-
--
--
--
--
--
--
--
--
--
--
--
--
--
--
-
5 N
upha
r var
iega
ta
bullh
ead
lil y
R
-3
69
2-
-6
7-
-3
5-
91
-7
-8
0-
59
67
1-
5 1
6 N
ymph
aea
odor
ata
whi
te w
ater
lily
W
-
-5
25
-4
-2
--
- 9
104
--
--
-9
5-
6-
3-
--
- N
ymph
oide
s cor
data
flo
atin
g he
ar t
W
--
--
--
--
--
7-
--
--
--
--
--
--
--
--
3 -
O
nocl
ea se
nsib
ilis
sens
itive
fern
N
-
--
--
--
--
--
- -
--
--
--
--
--
--
2-
-5
- O
ront
ium
aqu
atic
um
gold
en c
lu b
R
--
--
--
-3
1-
4-
2-
--
--
--
--
--
--
--
7 -
O
smun
da c
inna
mom
ea
cinn
amon
fern
W
-
--
--
1-
-1
--
--
14
11
--
-1
-1
1-
1-
--
-
O
xalis
sp.
woo
d so
rrel
-
--
--
--
--
--
- -
--
--
--
--
--
--
--
--
3-
Oxy
polis
rigi
dior
co
wba
n e
R
--
--
--
--
--
-1
--
--
--
--
--
--
--
--
-
-
Pani
cum
cla
ndes
tinum
de
erto
ngue
gra
ss
N
--
--
--
--
--
- -
--
--
--
--
1-
--
1-
14
1-
Pani
cum
long
ifoliu
m
long
-leav
ed p
anic
-gra
ss
R
2-
--
2-
--
--
- -
-2
--
--
-1
1-
--
--
--
--
Pani
cum
sp .
pani
c-gr
as s
- 3
-1
--
--
--
--
--
-1
-1
-1
--
1-
--
11
--
-
Pa
nicu
m v
erru
cosu
m
war
ty p
anic
-gra
ss
W
--
--
--
-2
--
--
--
--
--
--
25
--
--
--
-
-
Pani
cum
vir
gatu
m
switc
hgra
s s
W
37
--
--
-1
11
-4
21
2-
13
13
--
--
1-
--
- -
Pasp
alum
sp .
bead
-gra
s s
- -
--
--
--
--
--
--
--
--
--
--
--
--
-2
--
-
52

Spec
ies
Com
mon
Nam
e
Gro
up I
Gro
up II
G
roup
III
Gro
up IV
G
roup
V
Biogeography
Howardsville Imp.
Pilgrim Lake
Bamber Lake
Oswego Lake
Pakim Pond Lake Absegami
Wells Mills Lake
Chatsworth Lake
Horicon Lake
Country Lake
Atsion Lake
Maple Lake
Batsto Lake
Success Lake
Egg Harbor City Lk.
Mimosa Lake
Lake Fred
Kettle Run Imp.
Lake Albert
Cushman Lake
Davenport Imp.
Turn Mill Pond
Shadow Lake
Paradise Lake
Sunset Lake
Cranes Lake
Lady’s Lake
Jennings Lake
Indian Mills Lake
Hammonton Lake
Pelta
ndra
vir
gini
ca
arro
w a
rum
N
-
-8
48
-3
15
-1
3-
-2
-2
3-
3-
4-
8-
62
3 7
1 Ph
alar
is a
rund
inac
ea
reed
can
ary
gras
s N
-
--
--
--
--
--
--
--
--
--
--
--
--
-4
--
-
Ph
ragm
ites a
ustr
alis
co
mm
on re
e d
N
--
--
--
--
-1
--
1-
-1
18
41
56
75
-7
-9
4
2 Pi
lea
pum
ila
clea
rwee
dN
-
--
--
--
--
--
--
--
--
--
--
--
--
-2
3-
-
Pl
anta
go a
rist
ata
brac
ted
plan
tain
N
-
--
--
--
--
--
--
--
--
--
--
--
--
--
3-
-
Po
goni
a op
hiog
loss
oide
s ro
se p
ogon
ia
W
--
--
1-
--
--
- -
--
--
--
--
--
--
--
--
--
Poly
gala
bre
vifo
lia
shor
t-lea
ved
milk
wor
t-
--
-3
--
--
--
--
--
--
--
--
--
--
--
--
R
-
Po
lyga
la c
ruci
ata
cros
s-le
aved
milk
wor
t R
-
--
--
--
--
--
--
--
--
--
--
--
--
--
-1
-
Poly
gonu
m a
rifo
lium
ha
lber
d-le
aved
tear
thum
b N
-
--
--
--
--
--
--
--
--
--
--
--
--
-1
2-
-
Po
lygo
num
hyd
ropi
pero
ides
m
ild w
ater
pep
pe r
N
--
--
--
--
--
--
--
--
--
--
24
--
-5
55
-
-
Poly
gonu
m la
path
ifoliu
m
dock
-leav
ed sm
artw
eed
N
--
--
--
--
--
--
--
--
--
--
--
--
--
-1
-
-
Poly
gonu
m p
ensy
lvan
icum
Pe
nnsy
lvan
ia sm
artw
eed
W
--
--
--
--
--
--
--
--
--
--
--
--
--
-1
-
-
Poly
gonu
m p
unct
atum
do
tted
smar
twee
dN
-
--
--
--
--
--
--
--
--
--
--
--
-1
--
--
-
Po
lygo
num
sagi
ttatu
m
arro
w-le
aved
tear
thum
b N
-
--
--
--
--
--
--
--
--
--
-3
2-
-2
39
4-
-
Po
lygo
num
sp .
smar
twee
d-
--
--
--
--
-1
--
--
--
--
--
--
-1
--
--
-
1 Po
nted
eria
cor
data
pi
cker
el-w
eed
W
--
--
--
--
--
-8
--
--
--
--
--
--
3-
7-
-
5 Po
tam
oget
on c
onfe
rvoi
des
alga
-like
pon
dwee
d R
-
-5
4-
7-
-10
--
- -
33
--
--
-5
--
--
--
--
- Po
tam
oget
on d
iver
sifo
lius
hair-
like
pond
wee
d N
-
--
--
--
--
--
- -
--
-2
1-
3-
69
-4
35
--
5 Po
tam
oget
on e
pihy
drus
N
utta
ll's p
ondw
eed
W
--
--
--
--
--
- -
--
--
--
--
--
--
--
-3
--
Pota
mog
eton
oak
esia
nus
Oak
es' p
ondw
eed
R
--
--
--
--
--
- -
1-
--
--
--
--
--
--
--
--
Pota
mog
eton
pus
illus
sm
all p
ondw
eed
N
--
--
--
--
--
- -
--
--
--
--
--
--
--
52
-1
Pota
mog
eton
sp.
pond
wee
d -
--
--
--
--
--
- -
--
--
--
1-
--
--
--
--
--
Pros
erpi
naca
pec
tinat
a cu
t-lea
ved
mer
mai
d-w
eed
R
--
2-
--
--
--
--
--
--
--
--
--
--
--
--
-
-
Pter
idiu
m a
quili
num
br
acke
n
W
--
--
-1
--
--
--
--
-2
22
--
--
--
2-
--
4 -
Rh
exia
mar
iana
M
aryl
and
mea
dow
bea
uty
R
--
--
--
--
--
--
--
--
--
--
--
--
--
1-
-
-
Rhex
ia v
irgi
nica
V
irgin
ia m
eado
w b
eaut
yW
2
1-
1-
--
--
--
-2
--
1-
21
-4
--
--
--
--
2
Rh
ynch
ospo
ra a
lba
whi
te b
eake
d-ru
s h
R
-5
2-
5-
7-
4-
46
1-
11
--
71
--
-5
--
--
5 1
Rh
ynch
ospo
ra c
apite
llata
sm
all-h
eade
d be
aked
-rus
h -
-1
2-
2-
--
--
--
7-
--
-2
1-
4-
--
-1
--
-
1
Rhyn
chos
pora
ch
alar
ocep
hala
lo
ose-
head
ed b
eake
d-ru
sh
R
-1
--
--
--
--
-2
--
-3
1-
--
-1
--
--
--
-
-
Rhyn
chos
pora
mac
rost
achy
a ho
rned
bea
ked-
rus
hW
-
--
--
--
--
--
--
--
--
22
--
--
--
--
--
-
Sa
batia
diff
orm
is
lanc
e-le
aved
saba
tia
R
--
-1
--
--
--
--
--
--
--
--
--
--
--
--
1 -
Sa
gitta
ria
enge
lman
nian
a En
gelm
ann'
s arro
whe
ad
R
--
-2
5-
-4
2-
46
1-
--
--
51
-1
-3
3-
-2
- -
Sagi
ttari
a la
tifol
ia
broa
d-le
aved
arr
owhe
ad
N
--
--
--
--
--
--
--
--
--
--
1-
--
--
4-
-
-
53
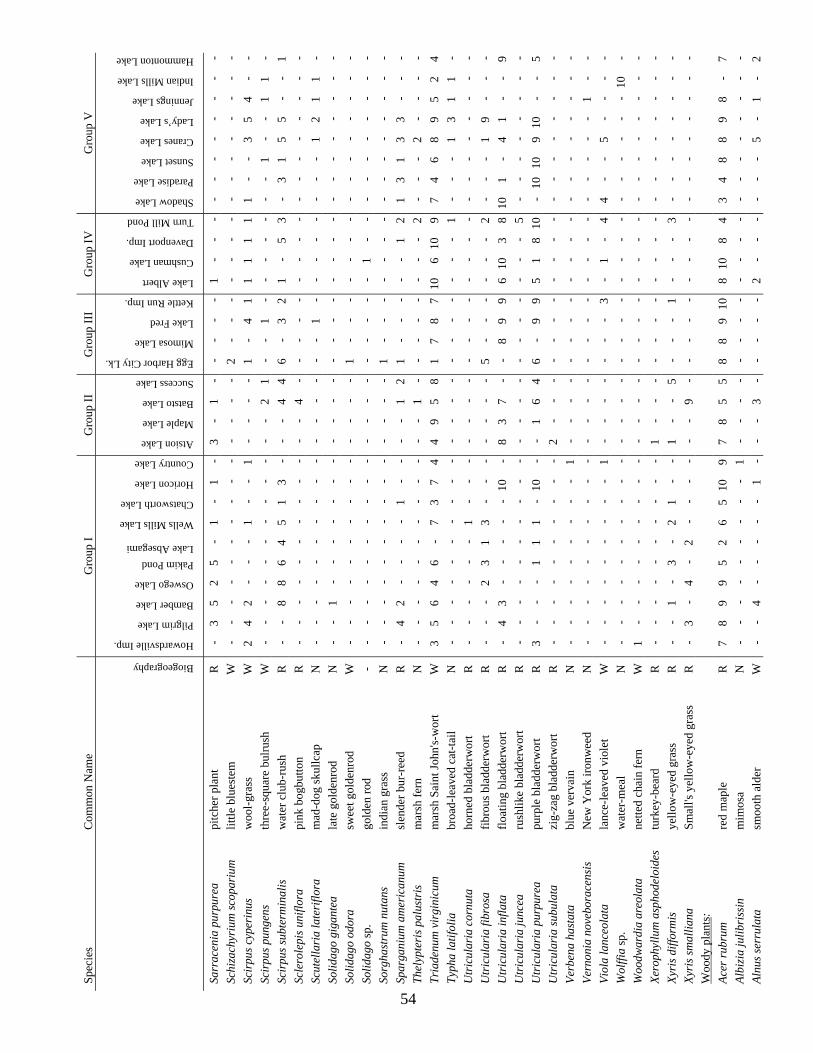
Spec
ies
Com
mon
Nam
e
Gro
up I
Gro
up II
G
roup
III
Gro
up IV
G
roup
V
Biogeography
Howardsville Imp.
Pilgrim Lake
Bamber Lake
Oswego Lake
Pakim Pond Lake Absegami
Wells Mills Lake
Chatsworth Lake
Horicon Lake
Country Lake
Atsion Lake
Maple Lake
Batsto Lake
Success Lake
Egg Harbor City Lk.
Mimosa Lake
Lake Fred
Kettle Run Imp.
Lake Albert
Cushman Lake
Davenport Imp.
Turn Mill Pond
Shadow Lake
Paradise Lake
Sunset Lake
Cranes Lake
Lady’s Lake
Jennings Lake
Indian Mills Lake
Hammonton Lake
Sarr
acen
ia p
urpu
rea
pitc
her p
lan
t-
35
25
-1
-1
-1
--
--
-1
--
--
--
--
--
-R
3
-
Schi
zach
yriu
m sc
opar
ium
lit
tle b
lues
tem
W
-
--
--
--
--
--
- -
-2
--
--
--
--
--
--
--
- Sc
irpu
s cyp
erin
us
woo
l-gra
s s
W
24
2-
--
1-
-1
--
1-
41
11
11
1-
-3
54
--
- -
Scir
pus p
unge
ns
thre
e-sq
uare
bul
rush
W
-
--
--
--
--
--
21
--
1-
--
--
--
1-
-1
1-
-
Sc
irpu
s sub
term
inal
is
wat
er c
lub-
rus
hR
-
-8
86
45
13
-4
46
-3
21
-5
3-
31
55
--
- -
1 Sc
lero
lepi
s uni
flora
pi
nk b
ogbu
tton
R
--
--
--
--
--
- -
4-
--
--
--
--
--
--
--
--
Scut
ella
ria
late
riflo
ra
mad
-dog
skul
lcap
N
-
--
--
--
--
--
- -
--
-1
--
--
--
--
12
11
- So
lidag
o gi
gant
ea
late
gol
denr
o d
N
--
1-
--
--
--
--
--
--
--
--
--
--
--
--
-
-
Solid
ago
odor
a sw
eet g
olde
nrod
W
-
--
--
--
--
--
--
1-
--
--
--
--
--
--
--
-
So
lidag
o sp
.go
lden
ro d
- -
--
--
--
--
--
--
--
--
-1
--
--
--
--
--
-
So
rgha
stru
m n
utan
s in
dian
gra
ss
N
--
--
--
--
--
--
-1
--
--
--
--
--
--
--
-
-
Spar
gani
um a
mer
ican
um
slen
der b
ur-r
eed
R
-4
2-
--
-1
--
-1
21
--
--
-1
21
31
33
--
-
-
Thel
ypte
ris p
alus
tris
m
arsh
fer
nN
-
--
--
--
--
--
1-
--
--
--
-2
--
-2
--
--
-
Tr
iade
num
vir
gini
cum
m
arsh
Sai
nt Jo
hn's-
wor
t W
3
56
46
-7
37
45
81
78
70
60
97
46
89
52
4 9
11
4 Ty
pha
latif
olia
br
oad-
leav
ed c
at-ta
i lN
-
--
--
--
--
--
--
--
--
--
-1
--
-1
31
1-
-
U
tric
ular
ia c
ornu
ta
horn
ed b
ladd
erw
or t
R
--
--
--
1-
--
--
--
--
--
--
--
--
--
--
-
-
Utr
icul
aria
fibr
osa
fibro
us b
ladd
erw
ort
R
--
-2
31
3-
--
--
-5
--
--
--
2-
--
19
--
-
-
Utr
icul
aria
infla
ta
float
ing
blad
derw
ort
R
-4
3-
--
--
10-
8 3
7-
-8
99
610
38
101
-4
1-
-9
Utr
icul
aria
junc
ea
rush
like
blad
derw
or t
--
--
--
--
--
--
--
--
--
--
5-
--
--
--
-R
-
Utr
icul
aria
pur
pure
a pu
rple
bla
dder
wor
t R
3
--
-1
11
-10
--
1 6
46
-9
95
18
10-
1010
910
--
5 U
tric
ular
ia su
bula
ta
zig-
zag
blad
derw
ort
R
--
--
--
--
--
--
--
--
--
--
--
--
--
--
2 -
Ve
rben
a ha
stat
a bl
ue v
erva
i n
N
--
--
--
--
-1
--
--
--
--
--
--
--
--
--
-
-
Vern
onia
nov
ebor
acen
sis
New
Yor
k iro
nwee
d N
-
--
--
--
--
--
--
--
--
--
--
--
--
-1
--
-
Vi
ola
lanc
eola
ta
lanc
e-le
aved
vio
le t
W
--
--
--
--
-1
--
--
--
3-
1-
44
--
5-
--
-
-
Wol
ffia
sp .
wat
er-m
ea l
N
--
--
--
--
--
--
--
--
--
--
--
--
--
0-
-
-1
W
oodw
ardi
a ar
eola
ta
nette
d ch
ain
fern
W
1
--
--
--
--
--
--
--
--
--
--
--
--
--
--
-
Xe
roph
yllu
m a
spho
delo
ides
tu
rkey
-bea
r d
R
--
--
--
--
--
--
--
--
--
--
--
--
--
--
1 -
Xy
ris d
iffor
mis
ye
llow
-eye
d gr
ass
R
--
1-
3-
21
--
-5
--
-1
--
-3
--
--
--
--
1 -
Xy
ris s
mal
liana
Sm
all's
yel
low
-eye
d gr
ass
R
-3
-4
-2
--
--
-9
--
--
--
--
--
--
--
--
-
-
Woo
dy p
lant
s:
Ac
er ru
brum
re
d m
aple
R
7
89
95
26
50
95
58
89
08
08
43
48
89
8-
17
8 1
17
Albi
zia
julib
riss
in
mim
os a
N
--
--
--
--
-1
--
--
--
--
--
--
--
--
--
-
-
Alnu
s ser
rula
ta
smoo
th a
lde
r-
-4
--
--
-1
--
3-
--
--
2-
--
--
-5
-1
-W
- 2
54
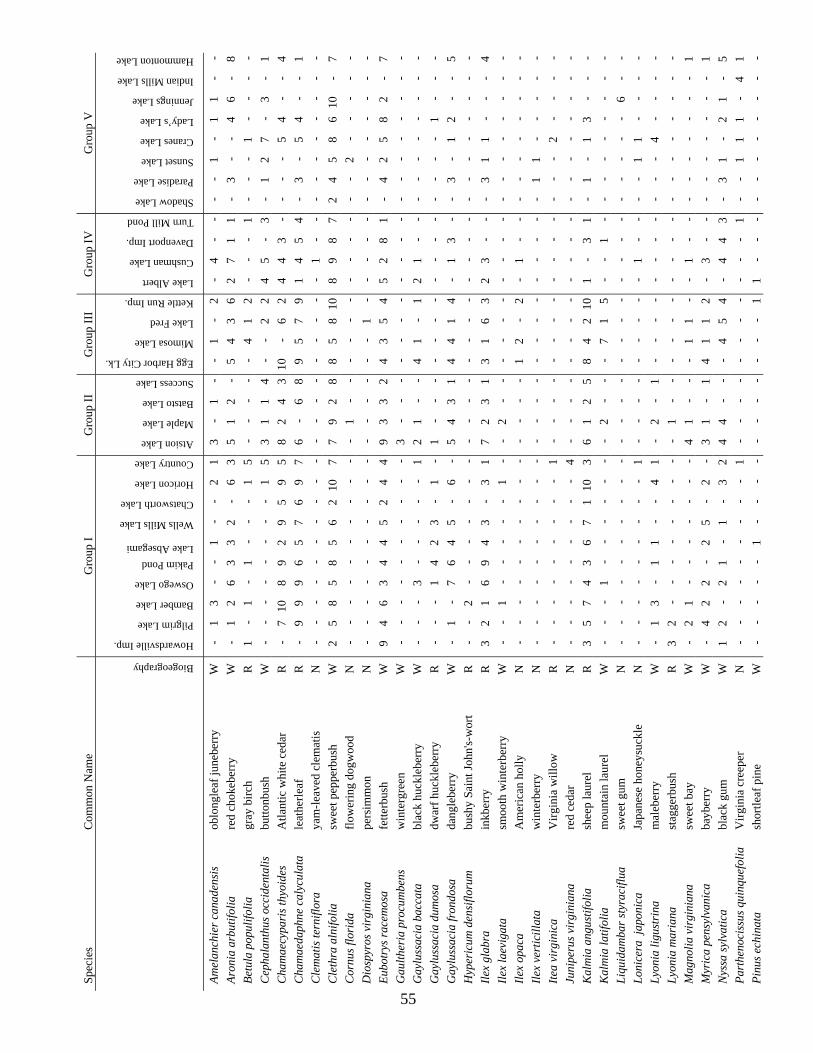
Spec
ies
Com
mon
Nam
e
Gro
up I
Gro
up II
G
roup
III
Gro
up IV
G
roup
V
Biogeography
Howardsville Imp.
Pilgrim Lake
Bamber Lake
Oswego Lake
Pakim Pond Lake Absegami
Wells Mills Lake
Chatsworth Lake
Horicon Lake
Country Lake
Atsion Lake
Maple Lake
Batsto Lake
Success Lake
Egg Harbor City Lk.
Mimosa Lake
Lake Fred
Kettle Run Imp.
Lake Albert
Cushman Lake
Davenport Imp.
Turn Mill Pond
Shadow Lake
Paradise Lake
Sunset Lake
Cranes Lake
Lady’s Lake
Jennings Lake
Indian Mills Lake
Hammonton Lake
Amel
anch
ier c
anad
ensi
s ob
long
leaf
june
berr
y W
-
13
--
1-
-2
13
- 1
--
1-
2-
4-
--
-1
-1
1-
- Ar
onia
arb
utifo
lia
red
chok
eber
r y
W
-1
26
33
2-
63
2-
54
36
27
11
-3
--
46
-5
1 8
Betu
la p
opul
ifolia
gr
ay b
irc h
R
1-
1-
1-
--
15
--
--
41
2-
--
1-
--
1-
--
-
-
Cep
hala
nthu
s occ
iden
talis
bu
ttonb
ush
W
--
--
--
--
15
3 1
14
--
22
45
-3
-1
27
-3
-1
Cha
mae
cypa
ris t
hyoi
des
Atla
ntic
whi
te c
edar
R
-
70
89
29
59
54
30
-6
24
43
--
--
54
--
18
2 1
4 C
ham
aeda
phne
cal
ycul
ata
leat
herle
a f
R
-9
99
65
76
97
68
95
79
14
54
-3
-5
4-
-6
- 1
Cle
mat
is te
rnifl
ora
yam
-leav
ed c
lem
atis
N
-
--
--
--
--
--
--
--
--
-1
--
--
--
--
--
-
C
leth
ra a
lnifo
lia
swee
t pep
perb
ush
W
25
85
85
62
107
7 9
28
85
810
89
87
24
58
610
-7
Cor
nus f
lori
da
flow
erin
g do
gwoo
d N
-
--
--
--
--
--
1 -
--
--
--
--
--
-2
--
--
- D
iosp
yros
vir
gini
ana
pers
imm
o n
N
--
--
--
--
--
--
--
-1
--
--
--
--
--
--
-
-
Eubo
trys
race
mos
a fe
tterb
ush
W
94
63
44
52
44
32
43
54
52
81
-4
25
82
-9
3 7
Gau
lther
ia p
rocu
mbe
ns
win
terg
reen
W
-
--
--
--
--
--
--
--
--
--
--
--
--
--
-3
-
Gay
luss
acia
bac
cata
bl
ack
huck
lebe
rry
W
--
-3
--
--
-1
--
41
-1
21
--
--
--
--
--
2 1
G
aylu
ssac
ia d
umos
a dw
arf h
uckl
eber
ry
R
--
-1
42
3-
1-
--
--
--
--
--
--
--
1-
--
1 -
G
aylu
ssac
ia fr
ondo
sa
dang
lebe
rry
W
-1
-7
64
5-
6-
31
44
14
-1
3-
-3
-1
2-
-5
4 5
Hyp
eric
um d
ensi
floru
m
bush
y Sa
int J
ohn'
s-w
ort
R
--
2-
--
--
--
--
--
--
--
--
--
--
--
--
-
-
Ilex
glab
ra
inkb
erry
R
3
21
69
43
-3
17
2 3
13
16
32
3-
--
31
1-
--
4 Ile
x la
evig
ata
smoo
th w
inte
rber
ry
W
--
1-
--
--
1-
--
--
--
--
--
--
--
--
--
-
2
Ilex
opac
a A
mer
ican
hol
l y
N
--
--
--
--
--
--
-1
2-
2-
1-
--
--
--
--
-
-
Ilex
vert
icill
ata
win
terb
err
yN
-
--
--
--
--
--
--
--
--
--
--
-1
1-
--
--
-
Ite
a vi
rgin
ica
Virg
inia
will
ow
R
--
--
--
--
-1
- -
--
--
--
--
--
--
-2
--
--
Juni
peru
s vir
gini
ana
red
ceda
rN
-
--
--
--
--
4-
--
--
--
--
--
--
--
--
--
-
K
alm
ia a
ngus
tifol
ia
shee
p la
urel
R
3
57
43
67
10
32
58
42
01
-3
1-
1-
13
--
16
1 1
- K
alm
ia la
tifol
ia
mou
ntai
n la
urel
W
-
--
1-
--
--
--
2 -
--
71
5-
-1
--
--
--
--
- Li
quid
amba
r sty
raci
flua
swee
t gu
m
N
--
--
--
--
--
--
--
--
--
--
--
--
--
6-
-
-
Loni
cera
jap
onic
a Ja
pane
se h
oney
suck
le
N
--
--
--
--
-1
--
--
--
--
1-
--
-1
1-
--
-
-
Lyon
ia li
gust
rina
m
aleb
err
yW
-
13
-1
1-
-4
1-
-1
--
--
--
--
--
-4
--
--
2
Ly
onia
mar
iana
st
agge
rbus
h R
3
2-
--
--
--
--
--
--
--
--
--
--
--
--
--
1
M
agno
lia v
irgi
nian
a sw
eet b
a y
W
-2
1-
--
--
--
--
-1
1-
-1
--
--
--
--
-4
1 1
Myr
ica
pens
ylva
nica
ba
yber
ry
W
-4
22
-2
5-
2-
-1
41
12
-3
--
--
--
--
-3
1 1
Nys
sa sy
lvat
ica
blac
k gu
m
W
12
-2
1-
1-
32
--
-4
54
-4
43
-3
1-
21
-4
4 5
Part
heno
ciss
us q
uinq
uefo
lia
Virg
inia
cre
epe
r-
--
--
--
--
1-
--
--
--
--
-1
--
11
1-
4N
- 1
Pinu
s ech
inat
a sh
ortle
af p
in e
W
--
--
-1
--
--
--
--
--
11
--
--
--
--
--
-
-
55

Spec
ies
Com
mon
Nam
e
Gro
up I
Gro
up II
G
roup
III
Gro
up IV
G
roup
V
Biogeography
Howardsville Imp.
Pilgrim Lake
Bamber Lake
Oswego Lake
Pakim Pond Lake Absegami
Wells Mills Lake
Chatsworth Lake
Horicon Lake
Country Lake
Atsion Lake
Maple Lake
Batsto Lake
Success Lake
Egg Harbor City Lk.
Mimosa Lake
Lake Fred
Kettle Run Imp.
Lake Albert
Cushman Lake
Davenport Imp.
Turn Mill Pond
Shadow Lake
Paradise Lake
Sunset Lake
Cranes Lake
Lady’s Lake
Jennings Lake
Indian Mills Lake
Hammonton Lake
Pinu
s rig
ida
pitc
h pi
ne
R
53
18
81
-1
25
12
34
75
48
11
-1
-1
--
-7
3 3
Pinu
s vir
gini
ana
Virg
inia
pin
e N
-
--
--
--
--
--
--
--
-1
--
--
--
--
--
--
-
Pr
unus
sero
tina
blac
k ch
err
yN
-
-1
--
--
--
1-
--
--
--
--
--
--
--
--
--
-
Q
uerc
us a
lba
whi
te o
a k
W
--
--
--
--
--
--
--
--
--
--
-1
--
--
--
-
-
Que
rcus
ilic
ifolia
sc
rub
oak
R
--
--
-1
--
2-
--
--
--
--
--
--
--
--
--
-
-
Que
rcus
mar
iland
ica
blac
k-ja
ck o
ak
R
--
2-
--
--
--
--
--
--
-1
--
--
--
--
--
-
-
Que
rcus
phe
llos
will
ow o
ak
N
--
--
--
--
--
- -
--
--
--
--
--
--
--
-2
--
Que
rcus
pri
nus
ches
tnut
oak
W
-
--
--
--
--
--
--
--
-1
--
--
--
--
--
--
-
Q
uerc
us sp
.oa
k-
--
--
1-
--
--
--
--
1-
--
--
--
--
--
--
-
-
Que
rcus
vel
utin
a bl
ack
oak
W
--
--
--
--
-1
-1
--
--
-1
2-
--
--
--
--
-
-
Rhod
oden
dron
vis
cosu
m
swam
p az
alea
R
1
47
75
44
-8
47
5 2
27
12
41
12
1-
22
2-
6-
6 Rh
us c
opal
lina
win
ged
sum
ac
N
--
1-
--
--
-1
--
2-
--
--
--
--
--
--
--
-
-
Robi
nia
pseu
doac
acia
bl
ack
locu
s t
N
--
--
--
--
-1
--
--
--
--
--
--
--
--
--
-
-
Rosa
mul
tiflo
ra
mul
tiflo
ra ro
se
N
--
--
--
--
-4
- -
--
--
--
--
--
--
--
--
--
Rosa
pal
ustr
is
swam
p ro
s e
N
--
--
--
--
--
--
--
--
--
--
3-
--
--
5-
-
-
Rubu
s his
pidu
s sw
amp
dew
berr
y W
-
--
--
--
--
--
--
-1
-1
3-
-1
--
1-
--
--
-
Ru
bus s
p .
blac
kber
r y
- -
--
--
--
--
--
--
--
--
--
--
--
-1
1-
2-
-
Sa
lix sp
. w
illow
-
--
--
--
--
-4
- -
--
--
1-
--
--
--
-1
-1
--
Sass
afra
s alb
idum
sa
ssaf
ras
W
-1
1-
--
--
11
-1
--
2-
1-
--
--
-1
--
--
-
-
Smila
x gl
auca
gl
auco
us g
reen
brie
r W
2
--
--
--
--
--
--
2-
--
--
--
1-
-1
--
-3
-
Smila
x ro
tund
ifolia
co
mm
on g
reen
brie
r W
-
2-
-2
--
-1
22
5 2
--
--
14
13
2-
2-
14
7-
2 Sp
irae
a sp
. Sp
iraea
-
--
--
--
--
-1
- -
--
--
--
--
--
--
--
--
--
Spir
aea
tom
ento
sa
stee
pleb
ush
N
--
--
--
--
--
--
--
--
--
--
1-
--
22
--
-
-
Toxi
code
ndro
n ra
dica
ns
pois
on iv
yN
-
--
--
--
--
--
--
11
--
1-
-1
--
--
1-
--
-
Va
ccin
ium
cor
ymbo
sum
hi
ghbu
sh b
lueb
erry
R
9
57
86
47
38
45
5 2
68
710
81
72
5-
33
67
5-
5 Va
ccin
ium
mac
roca
rpon
la
rge
cran
berr
yR
5
83
25
-2
12
3-
6-
--
2-
12
21
--
-1
--
1 -
- Vi
burn
um d
enta
tum
so
uthe
rn a
rrow
woo
d N
-
--
--
--
--
--
- -
--
--
--
--
--
--
--
1-
- Vi
burn
um n
udum
var
. nu
dum
na
ked
with
e-ro
d W
-
--
--
--
-1
--
1-
--
--
--
--
--
--
1-
--
-
56

App
endi
x 5.
Th
e nu
mbe
r of
dia
tom
cel
ls o
f ea
ch s
peci
es c
olle
cted
at
20 i
mpo
undm
ents
in
the
New
Jer
sey
Pine
land
s in
200
6.
Impo
undm
ents
are
ord
ered
by
incr
easi
ng
perc
enta
ge o
f alte
red
land
with
in e
ach
land
-use
gro
up.
Refe
r to
Tabl
e 1
for t
he ra
nge
of a
ltere
d-la
nd p
erce
ntag
es a
ssig
ned
to e
ach
grou
p. S
lides
at I
ndia
n M
ills L
ake
wer
e he
avily
co
loni
zed
by b
ryoz
oa a
nd th
e di
atom
cel
ls w
ere
larg
ely
brok
en.
Ref
er to
App
endi
x 1
for i
mpo
undm
ent-s
ite d
escr
iptio
ns.
Spec
ies
Gro
up I
Gro
up II
Gro
up II
IG
roup
IV
Gro
up V
Pilgrim Lake
Bamber Lake
Lake Absegami
Wells Mills Lake
Chatsworth Lake
Horicon Lake
Country Lake
Atsion Lake
Success Lake
Lake Fred
Kettle Run Imp.
Lake Albert
Cushman Lake
Turn Mill Pond
Shadow Lake
Paradise Lake
Sunset Lake
Cranes Lake
Jennings Lake
Indian Mills Lake
Achn
anth
es su
bato
moi
des (
Hus
t.) L
.-B. &
Arc
hb.
- -
- -
- -
- -
- -
- -
- -
- -
- -
1 1
Achn
anth
es sp
. -
- -
- -
- -
- -
- -
- -
- -
- 2
- -
- Ac
hnan
thid
ium
exi
guum
(Gru
n.) C
zarn
. -
- 4
- -
- -
- -
- -
- -
- -
- -
8 -
6 Ac
hnan
thid
ium
min
utis
sim
um (K
ütz.
) Cza
rn.
- -
12
- -
- -
- -
- 8
4 2
542
10
41
64
52
16
Actin
ella
pun
ctat
a Le
wis
50
6
2 3
6 57
-
17
- -
2 -
- -
8 -
- -
- -
Amph
iple
ura
pellu
cida
(Küt
z.) K
ütz.
-
- 2
- -
- -
- -
- -
- -
- -
- -
- -
- Am
phor
a ov
alis
(Küt
z.) K
ütz.
-
- -
- -
- -
- -
1 -
- -
- -
- -
- 1
- Am
phor
a pe
rpus
illa
(Gru
n.) G
run.
-
- 4
1 -
- -
- -
- -
- -
- -
- -
- -
3 As
teri
onel
la ra
lfsii
W. S
mith
16
2
27
- 3
- 2
- 52
- -
- -
- -
- -
- -
- Au
laco
seir
a am
bigu
a (G
run.
) Sim
ons.
- -
- -
- -
- -
- -
- -
- -
- -
6 -
- -
Aula
cose
ira
cras
sipu
ncta
ta K
ram
mer
-
- -
- 35
17
4 5
12
446
34-
2 13
16
2 1
- 1
2 Au
laco
seir
a di
stan
s (Eh
renb
.) Si
mon
s. -
- -
- -
- -
- -
- -
2 1
- -
- 19
-
- -
Aula
cose
ira
dist
ans v
ar. s
epte
ntri
onal
is C
ambu
rn a
nd C
harle
s -
1 -
- -
- -
- -
- -
- -
- -
- -
- -
- Au
laco
seir
a gr
anul
ata
(Ehr
.) Si
mon
s. -
- -
- -
- -
- -
- -
- -
- -
- -
- -
16
Aula
cose
ira
nyga
ardi
i (C
ambu
rn) C
ambu
rn &
Cha
rles
- -
- -
66
2 -
- -
- -
- -
- -
- -
- -
- Au
laco
seir
a pa
ragl
abra
Cam
b.
- -
- -
- -
- 18
3
- -
- 4
- 2
- -
- -
- Br
achy
sira
folli
s (Eh
r.) R
oss
- -
- -
- -
- -
- -
37-
- -
- -
- -
- -
Brac
hysi
ra se
rian
s (B
rébi
sson
ex
Küt
zing
) Rou
nd &
Man
n -
2 2
2 1
- -
- -
8 6
- 2
- -
- -
1 -
- Br
achy
sira
vitr
ea (G
run.
) R. R
oss
- 2
- -
- -
- -
- 34
63
7 5
2219
8
8 8
1 1
Cal
onei
s lew
isii
Patr.
-
- -
- -
- -
- -
- -
- -
- 1
- -
- -
- C
avin
ula
pseu
dosc
utifo
rmis
(Hus
t.) M
ann
& S
tickl
e -
- 1
- -
- -
- -
- -
- -
- -
- -
- -
- C
ham
aepi
nnul
aria
med
iocr
is (K
rass
ke) L
ange
-Ber
talo
t -
- -
- -
- -
- -
- -
- 1
- -
- -
- -
- C
ham
aepi
nnul
aria
sp.
- -
- -
- -
- -
2 -
- -
- -
- -
- -
- -
Coc
cone
is p
edic
ulus
Ehr
. -
- -
30
- -
- -
- -
- -
- -
- -
- -
- -
Coc
cone
is p
lace
ntul
a Eh
r. -
1 20
-
59
- -
1 1
4 4
- -
10-
- 1
2 24
15
C
occo
neis
cf.
pseu
doth
umen
sis R
eich
ardt
-
- 2
- -
- -
- -
- -
- -
- -
- -
- -
- C
ratic
ula
sp.
- -
- -
- -
- -
- -
- -
- -
- -
- -
- 3
Cte
noph
ora
pulc
hella
Bre
b.
- -
- -
- -
- -
- -
- -
- -
- -
- -
1 8
57

Spec
ies
Gro
up I
Gro
up II
Gro
up II
IG
roup
IV
Gro
up V
Pilgrim Lake
Bamber Lake
Lake Absegami
Wells Mills Lake
Chatsworth Lake
Horicon Lake
Country Lake
Atsion Lake
Success Lake
Lake Fred
Kettle Run Imp.
Lake Albert
Cushman Lake
Turn Mill Pond
Shadow Lake
Paradise Lake
Sunset Lake
Cranes Lake
Jennings Lake
Indian Mills Lake
Cyc
lote
lla a
tom
us H
ust.
- -
- -
- -
- -
- -
- -
- -
- -
- -
- 1
Cyc
lote
lla m
eneg
hini
ana
Küt
z.
- -
- -
- -
- -
- -
- -
- -
- -
- -
1 61
C
yclo
tella
oce
llata
Pan
t. -
- -
- -
- -
- -
1 -
- -
- -
- -
- -
- C
ymbe
lla a
ffini
s Küt
z.
- -
16
- -
- -
- -
- -
- -
- -
- -
- -
- C
ymbe
lla c
f. ae
qual
is W
. Sm
. ex
Gre
v.
- -
- -
- -
- 2
- -
- -
- -
- -
- -
- -
Cym
bella
cus
pida
ta K
ütz.
-
- -
- -
- -
- -
- -
- -
- -
- -
- 4
- C
ymbe
lla m
icro
ceph
ala
Gru
n.
- -
- -
- -
- -
- -
- -
1 5
- -
- -
- -
Cym
bella
per
pusi
lla A
. Cle
ve
- -
- -
- -
- -
2 -
- -
- -
- -
- -
- -
Dec
ussa
ta p
lace
nta
(Ehr
.) La
nge-
Ber
t. &
Met
zelti
n -
- -
- -
- -
- -
- -
- -
- -
- -
- 1
- D
iade
smis
con
ferv
acea
Küt
z.
- -
- -
- -
- -
- -
- -
- -
- 1
- -
2 1
Dis
cost
ella
pse
udos
telli
gera
(Hus
t.) H
ouk
& K
lee
- -
- -
- -
- -
- -
- -
- -
- -
- -
- 2
Dis
cost
ella
stel
liger
a (C
leve
& G
runo
w) H
ouk
& K
lee
- -
- -
- -
- -
- -
- -
- 2
- -
2 -
- -
Ency
onem
a lu
natu
m (W
. Sm
.) V
.H.
- -
- -
- -
- -
- 11
34
35
12
3 -
3 9
14
- -
Ency
onem
a m
inut
um (H
ilse
in R
aben
hors
t) M
ann
- -
2 -
- -
- -
- 2
- -
- 2
6 -
2 9
7 2
Ento
mon
eis o
rnat
a (J
. W. B
ail.)
Rei
m.
- -
- -
- -
- -
- -
- -
- -
- -
- -
- 1
Euco
ccon
eis f
lexe
lla (K
ütz.
) Cl.
- -
- -
- -
- -
- -
- -
2 -
- -
- -
- -
Euno
tia b
iden
tula
W. S
m.
- 30
-
6 -
1 -
- 1
- -
- 1
- -
- -
- -
- Eu
notia
big
ibba
var
. pum
ila G
run.
-
- -
- -
- -
- 2
- -
- -
- -
- -
- -
- Eu
notia
bilu
nari
s (Eh
renb
erg)
Mill
s 3
2 -
- -
6 16
7 3
- 4
- -
2 -
1 -
- 3
27
- Eu
notia
car
olin
a Pa
tr.
- -
2 -
- 16
2
- -
61
86-
3 -
6 -
69
4 -
1 Eu
notia
cur
vata
(Küt
z.) L
ager
st.
- -
- 1
- 2
- -
- -
- -
- 3
1 -
20
- -
- Eu
notia
cur
vata
fo. b
ergi
i Woo
dhea
d &
Tw
eed
- -
- -
7 -
- -
- -
- -
- -
- -
- -
- -
Euno
tia c
urva
ta v
ar. s
ubar
cuat
a (N
aege
li ex
Küt
z.) W
oodh
ead
& T
wee
d -
1 1
3 -
- -
- -
- 1
- -
- 1
- -
- -
- Eu
notia
den
ticul
ata
(Bre
b. e
x K
ütz.
) Rab
enh.
-
- -
- -
3 -
- -
- -
- -
- -
- -
- -
- Eu
notia
dia
don
Ehr.
- -
- -
- -
- -
- -
- 4
- -
- -
2 -
- -
Euno
tia e
xigu
a (B
rébi
sson
ex
Küt
zing
) Rab
enho
rst
- -
- -
11
- 15
7 2
- -
2 -
- -
- -
2 -
- 1
Euno
tia fa
llax
A. C
leve
4
- -
2 -
1 -
- -
- -
- -
- -
- -
- -
- Eu
notia
flex
uosa
Bre
b. e
x K
utz.
33
6
- 3
1 1
1 -
2 29
48
203
82
78-
170
3 44
-
- Eu
notia
form
ica
Ehr.
- -
2 -
- 4
- -
- -
- -
- -
1 -
2 -
- -
Euno
tia in
cisa
W. S
m. e
x G
reg.
-
- 2
53
1 -
105
2 39
- -
5 2
1763
21
-
36
118
3 Eu
notia
cf.
lapp
onic
a G
run.
ex
A. C
leve
-
- 4
- -
- -
- -
- -
- -
- -
- -
- -
-
58
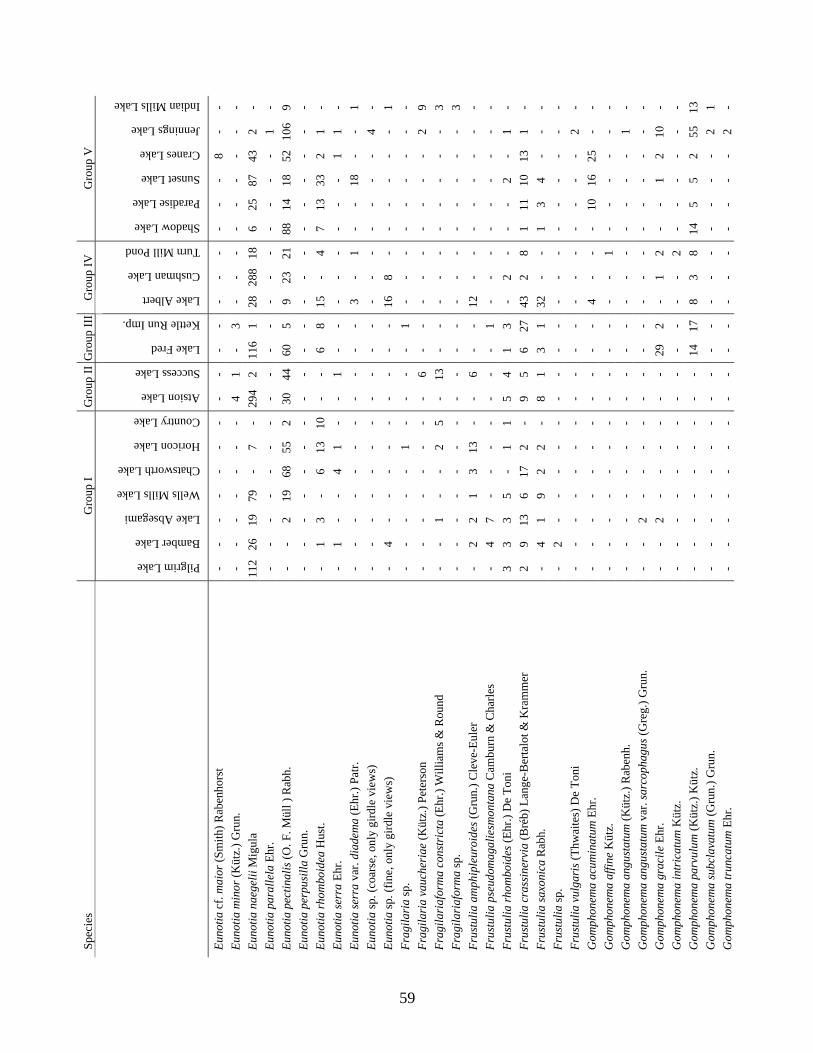
Spec
ies
Gro
up I
Gro
up II
Gro
up II
IG
roup
IV
Gro
up V
Pilgrim Lake
Bamber Lake
Lake Absegami
Wells Mills Lake
Chatsworth Lake
Horicon Lake
Country Lake
Atsion Lake
Success Lake
Lake Fred
Kettle Run Imp.
Lake Albert
Cushman Lake
Turn Mill Pond
Shadow Lake
Paradise Lake
Sunset Lake
Cranes Lake
Jennings Lake
Indian Mills Lake
Euno
tia c
f. m
aior
(Sm
ith) R
aben
hors
t -
- -
- -
- -
- -
- -
- -
- -
- -
8 -
- Eu
notia
min
or (K
ütz.
) Gru
n.
- -
- -
- -
- 4
1 -
3 -
- -
- -
- -
- -
Euno
tia n
aege
lii M
igul
a 11
226
19
79
-
7 -
294
2 11
61
28
288
186
25
87
43
2 -
Euno
tia p
aral
lela
Ehr
. -
- -
- -
- -
- -
- -
- -
- -
- -
- 1
- Eu
notia
pec
tinal
is (O
. F. M
üll )
Rab
h.
- -
2 19
68
55
2
30
4460
5
9 23
21
88
14
18
52
106
9 Eu
notia
per
pusi
lla G
run.
-
- -
- -
- -
- -
- -
- -
- -
- -
- -
- Eu
notia
rhom
boid
ea H
ust.
- 1
3 -
6 13
10
-
- 6
8 15
-
4 7
13
33
2 1
- Eu
notia
serr
a Eh
r. -
1 -
- 4
1 -
- 1
- -
- -
- -
- -
1 1
- Eu
notia
serr
a va
r. di
adem
a (E
hr.)
Patr.
-
- -
- -
- -
- -
- -
3 -
1 -
- 18
-
- 1
Euno
tia sp
. (co
arse
, onl
y gi
rdle
vie
ws)
-
- -
- -
- -
- -
- -
- -
- -
- -
- 4
- Eu
notia
sp. (
fine,
onl
y gi
rdle
vie
ws)
-
4 -
- -
- -
- -
- -
16
8 -
- -
- -
- 1
Frag
ilari
a sp
. -
- -
- -
1 -
- -
- 1
- -
- -
- -
- -
- Fr
agila
ria
vauc
heri
ae (K
ütz.
) Pet
erso
n -
- -
- -
- -
- 6
- -
- -
- -
- -
- 2
9 Fr
agila
riaf
orm
a co
nstr
icta
(Ehr
.) W
illia
ms &
Rou
nd
- -
1 -
- 2
5 -
13-
- -
- -
- -
- -
- 3
Frag
ilari
afor
ma
sp.
- -
- -
- -
- -
- -
- -
- -
- -
- -
- 3
Frus
tulia
am
phip
leur
oide
s (G
run.
) Cle
ve-E
uler
-
2 2
1 3
13
- -
6 -
- 12
-
- -
- -
- -
- Fr
ustu
lia p
seud
omag
alie
smon
tana
Cam
burn
& C
harle
s -
4 7
- -
- -
- -
- 1
- -
- -
- -
- -
- Fr
ustu
lia rh
ombo
ides
(Ehr
.) D
e To
ni
3 3
3 5
- 1
1 5
4 1
3 -
2 -
- -
2 -
1 -
Frus
tulia
cra
ssin
ervi
a (B
réb)
Lan
ge-B
erta
lot &
Kra
mm
er
2 9
13
6 17
2
- 9
5 6
2743
2
8 1
11
10
13
1 -
Frus
tulia
saxo
nica
Rab
h.
- 4
1 9
2 2
- 8
1 3
1 32
-
- 1
3 4
- -
- Fr
ustu
lia sp
. -
2 -
- -
- -
- -
- -
- -
- -
- -
- -
- Fr
ustu
lia v
ulga
ris (
Thw
aite
s) D
e To
ni
- -
- -
- -
- -
- -
- -
- -
- -
- -
2 -
Gom
phon
ema
acum
inat
um E
hr.
- -
- -
- -
- -
- -
- 4
- -
- 10
16
25
-
- G
omph
onem
a af
fine
Küt
z.
- -
- -
- -
- -
- -
- -
- 1
- -
- -
- -
Gom
phon
ema
angu
stat
um (K
ütz.
) Rab
enh.
-
- -
- -
- -
- -
- -
- -
- -
- -
- 1
- G
omph
onem
a an
gust
atum
var
. sar
coph
agus
(Gre
g.) G
run.
-
- 2
- -
- -
- -
- -
- -
- -
- -
- -
- G
omph
onem
a gr
acile
Ehr
. -
- 2
- -
- -
- -
29
2 -
1 2
- -
1 2
10
- G
omph
onem
a in
tric
atum
Küt
z.
- -
- -
- -
- -
- -
- -
- 2
- -
- -
- -
Gom
phon
ema
parv
ulum
(Küt
z.) K
ütz.
-
- -
- -
- -
- -
14
178
3 8
14
5 5
2 55
13
G
omph
onem
a su
bcla
vatu
m (G
run.
) Gru
n.
- -
- -
- -
- -
- -
- -
- -
- -
- -
2 1
Gom
phon
ema
trun
catu
m E
hr.
- -
- -
- -
- -
- -
- -
- -
- -
- -
2 -
59
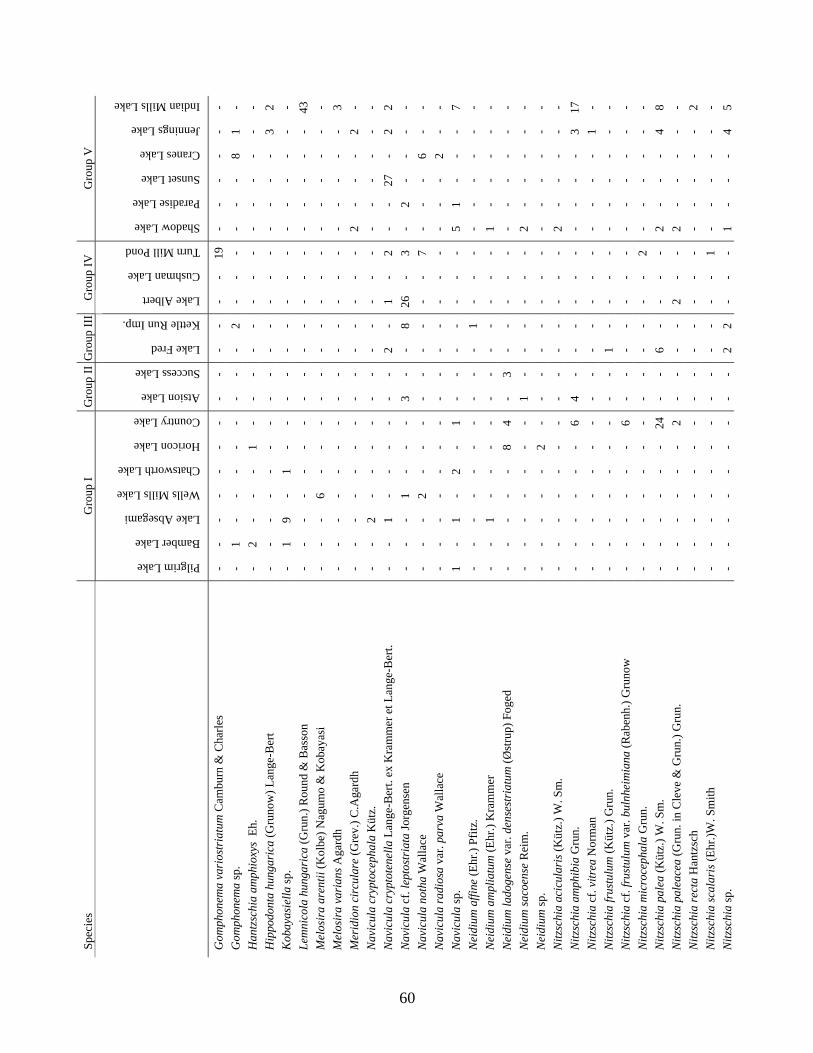
Spec
ies
Gro
up I
Gro
up II
Gro
up II
IG
roup
IV
Gro
up V
Pilgrim Lake
Bamber Lake
Lake Absegami
Wells Mills Lake
Chatsworth Lake
Horicon Lake
Country Lake
Atsion Lake
Success Lake
Lake Fred
Kettle Run Imp.
Lake Albert
Cushman Lake
Turn Mill Pond
Shadow Lake
Paradise Lake
Sunset Lake
Cranes Lake
Jennings Lake
Indian Mills Lake
Gom
phon
ema
vari
ostr
iatu
m C
ambu
rn &
Cha
rles
- -
- -
- -
- -
- -
- -
- 19
- -
- -
- -
Gom
phon
ema
sp.
- 1
- -
- -
- -
- -
2 -
- -
- -
- 8
1 -
Han
tzsc
hia
amph
ioxy
s Eh
. -
2 -
- -
1 -
- -
- -
- -
- -
- -
- -
- H
ippo
dont
a hu
ngar
ica
(Gru
now
) Lan
ge-B
ert
- -
- -
- -
- -
- -
- -
- -
- -
- -
3 2
Kob
ayas
iella
sp.
- 1
9 -
1 -
- -
- -
- -
- -
- -
- -
- -
Lem
nico
la h
unga
rica
(Gru
n.) R
ound
& B
asso
n -
- -
- -
- -
- -
- -
- -
- -
- -
- -
43
Mel
osir
a ar
entii
(Kol
be) N
agum
o &
Kob
ayas
i -
- -
6 -
- -
- -
- -
- -
- -
- -
- -
- M
elos
ira
vari
ans A
gard
h -
- -
- -
- -
- -
- -
- -
- -
- -
- -
3 M
erid
ion
circ
ular
e (G
rev.
) C.A
gard
h -
- -
- -
- -
- -
- -
- -
- 2
- -
- 2
- N
avic
ula
cryp
toce
phal
a K
ütz.
-
- 2
- -
- -
- -
- -
- -
- -
- -
- -
- N
avic
ula
cryp
tote
nella
Lan
ge-B
ert.
ex K
ram
mer
et L
ange
-Ber
t. -
- 1
- -
- -
- -
2 -
1 -
2 -
- 27
-
2 2
Nav
icul
a cf
. lep
tost
riat
a Jo
rgen
sen
- -
- 1
- -
- 3
- -
8 26
-
3 -
2 -
- -
- N
avic
ula
noth
a W
alla
ce
- -
- 2
- -
- -
- -
- -
- 7
- -
- 6
- -
Nav
icul
a ra
dios
a va
r. pa
rva
Wal
lace
-
- -
- -
- -
- -
- -
- -
- -
- -
2 -
- N
avic
ula
sp.
1 -
1 -
2 -
1 -
- -
- -
- -
5 1
- -
- 7
Nei
dium
affi
ne (E
hr.)
Pfitz
. -
- -
- -
- -
- -
- 1
- -
- -
- -
- -
- N
eidi
um a
mpl
iatu
m (E
hr.)
Kra
mm
er
- -
1 -
- -
- -
- -
- -
- -
1 -
- -
- -
Nei
dium
lado
gens
e va
r. de
nses
tria
tum
(Øst
rup)
Fog
ed
- -
- -
- 8
4 -
3 -
- -
- -
- -
- -
- -
Nei
dium
saco
ense
Rei
m.
- -
- -
- -
- 1
- -
- -
- -
2 -
- -
- -
Nei
dium
sp.
- -
- -
- 2
- -
- -
- -
- -
- -
- -
- -
Nitz
schi
a ac
icul
aris
(Küt
z.) W
. Sm
. -
- -
- -
- -
- -
- -
- -
- 2
- -
- -
- N
itzsc
hia
amph
ibia
Gru
n.
- -
- -
- -
6 4
- -
- -
- -
- -
- -
3 17
N
itzsc
hia
cf. v
itrea
Nor
man
-
- -
- -
- -
- -
- -
- -
- -
- -
- 1
- N
itzsc
hia
frus
tulu
m (K
ütz.
) Gru
n.
- -
- -
- -
- -
- 1
- -
- -
- -
- -
- -
Nitz
schi
a cf
. fru
stul
um v
ar. b
ulnh
eim
iana
(Rab
enh.
) Gru
now
-
- -
- -
- 6
- -
- -
- -
- -
- -
- -
- N
itzsc
hia
mic
roce
phal
a G
run.
-
- -
- -
- -
- -
- -
- -
2 -
- -
- -
- N
itzsc
hia
pale
a (K
ütz.
) W. S
m.
- -
- -
- -
24
- -
6 -
- -
- 2
- -
- 4
8 N
itzsc
hia
pale
acea
(Gru
n. in
Cle
ve &
Gru
n.) G
run.
-
- -
- -
- 2
- -
- -
2 -
- 2
- -
- -
- N
itzsc
hia
rect
a H
antz
sch
-
- -
- -
- -
- -
- -
- -
- -
- -
- -
2 N
itzsc
hia
scal
aris
(Ehr
.)W. S
mith
-
- -
- -
- -
- -
- -
- -
1 -
- -
- -
- N
itzsc
hia
sp.
- -
- -
- -
- -
- 2
2 -
- -
1 -
- -
4 5
60
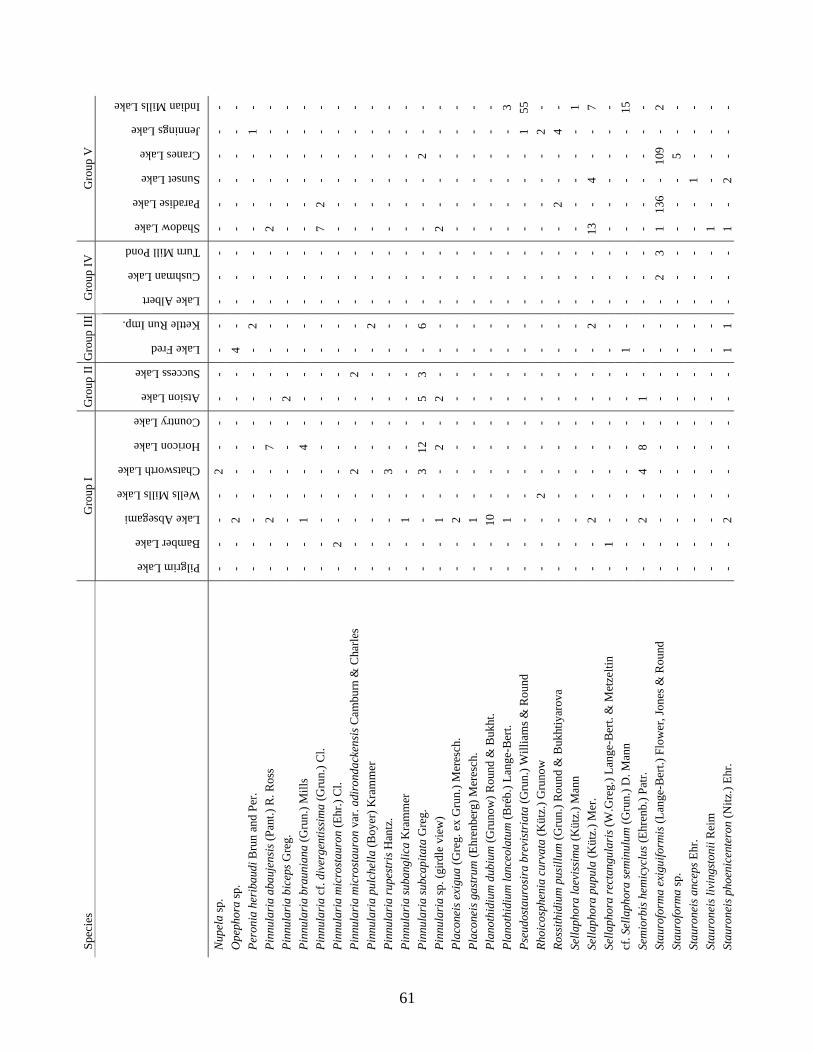
Spec
ies
Gro
up I
Gro
up II
Gro
up II
IG
roup
IV
Gro
up V
Pilgrim Lake
Bamber Lake
Lake Absegami
Wells Mills Lake
Chatsworth Lake
Horicon Lake
Country Lake
Atsion Lake
Success Lake
Lake Fred
Kettle Run Imp.
Lake Albert
Cushman Lake
Turn Mill Pond
Shadow Lake
Paradise Lake
Sunset Lake
Cranes Lake
Jennings Lake
Indian Mills Lake
Nup
ela
sp.
- -
- -
2 -
- -
- -
- -
- -
- -
- -
- -
Ope
phor
a sp
. -
- 2
- -
- -
- -
4 -
- -
- -
- -
- -
- Pe
roni
a he
riba
udi B
run
and
Per.
- -
- -
- -
- -
- -
2 -
- -
- -
- -
1 -
Pinn
ular
ia a
bauj
ensi
s (Pa
nt.)
R. R
oss
- -
2 -
- 7
- -
- -
- -
- -
2 -
- -
- -
Pinn
ular
ia b
icep
s Gre
g.
- -
- -
- -
- 2
- -
- -
- -
- -
- -
- -
Pinn
ular
ia b
raun
iana
(Gru
n.) M
ills
- -
1 -
- 4
- -
- -
- -
- -
- -
- -
- -
Pinn
ular
ia c
f. di
verg
entis
sim
a (G
run.
) Cl.
- -
- -
- -
- -
- -
- -
- -
7 2
- -
- -
Pinn
ular
ia m
icro
stau
ron
(Ehr
.) C
l. -
2 -
- -
- -
- -
- -
- -
- -
- -
- -
- Pi
nnul
aria
mic
rost
auro
n va
r. ad
iron
dack
ensi
s Cam
burn
& C
harle
s -
- -
- 2
- -
- 2
- -
- -
- -
- -
- -
- Pi
nnul
aria
pul
chel
la (B
oyer
) Kra
mm
er
- -
- -
- -
- -
- -
2 -
- -
- -
- -
- -
Pinn
ular
ia ru
pest
ris H
antz
. -
- -
- 3
- -
- -
- -
- -
- -
- -
- -
- Pi
nnul
aria
suba
nglic
a K
ram
mer
-
- 1
- -
- -
- -
- -
- -
- -
- -
- -
- Pi
nnul
aria
subc
apita
ta G
reg.
-
- -
- 3
12
- 5
3 -
6 -
- -
- -
- 2
- -
Pinn
ular
ia sp
. (gi
rdle
vie
w)
- -
1 -
- 2
- 2
- -
- -
- -
2 -
- -
- -
Plac
onei
s exi
gua
(Gre
g. e
x G
run.
) Mer
esch
. -
- 2
- -
- -
- -
- -
- -
- -
- -
- -
- Pl
acon
eis g
astr
um (E
hren
berg
) Mer
esch
. -
- 1
- -
- -
- -
- -
- -
- -
- -
- -
- Pl
anot
hidi
um d
ubiu
m (G
runo
w) R
ound
& B
ukht
. -
- 10
-
- -
- -
- -
- -
- -
- -
- -
- -
Plan
othi
dium
lanc
eola
tum
(Bré
b.) L
ange
-Ber
t. -
- 1
- -
- -
- -
- -
- -
- -
- -
- -
3 Ps
eudo
stau
rosi
ra b
revi
stri
ata
(Gru
n.) W
illia
ms &
Rou
nd
- -
- -
- -
- -
- -
- -
- -
- -
- -
1 55
Rh
oico
sphe
nia
curv
ata
(Küt
z.) G
runo
w
- -
- 2
- -
- -
- -
- -
- -
- -
- -
2 -
Ross
ithid
ium
pus
illum
(Gru
n.) R
ound
& B
ukht
iyar
ova
- -
- -
- -
- -
- -
- -
- -
- 2
- -
4 -
Sella
phor
a la
evis
sim
a (K
ütz.
) Man
n -
- -
- -
- -
- -
- -
- -
- -
- -
- -
1 Se
llaph
ora
pupu
la (K
ütz.
) Mer
. -
- 2
- -
- -
- -
- 2
- -
- 13
-
4 -
- 7
Sella
phor
a re
ctan
gula
ris (
W.G
reg.
) Lan
ge-B
ert.
& M
etze
ltin
- 1
- -
- -
- -
- -
- -
- -
- -
- -
- -
cf. S
ella
phor
a se
min
ulum
(Gru
n.) D
. Man
n
- -
- -
- -
- -
- 1
- -
- -
- -
- -
- 15
Se
mio
rbis
hem
icyc
lus (
Ehre
nb.)
Patr.
-
- 2
- 4
8 -
1 -
- -
- -
- -
- -
- -
- St
auro
form
a ex
igui
form
is (L
ange
-Ber
t.) F
low
er, J
ones
& R
ound
-
- -
- -
- -
- -
- -
- 2
3 1
136
- 10
9-
2 St
auro
form
a sp
. -
- -
- -
- -
- -
- -
- -
- -
- -
5 -
- St
auro
neis
anc
eps E
hr.
- -
- -
- -
- -
- -
- -
- -
- -
1 -
- -
Stau
rone
is li
ving
ston
ii R
eim
-
- -
- -
- -
- -
- -
- -
- 1
- -
- -
- St
auro
neis
pho
enic
ente
ron
(Nitz
.) Eh
r. -
- 2
- -
- -
- -
1 1
- -
- 1
- 2
- -
-
61

Spec
ies
Gro
up I
Gro
up II
Gro
up II
IG
roup
IV
Gro
up V
Pilgrim Lake
Bamber Lake
Lake Absegami
Wells Mills Lake
Chatsworth Lake
Horicon Lake
Country Lake
Atsion Lake
Success Lake
Lake Fred
Kettle Run Imp.
Lake Albert
Cushman Lake
Turn Mill Pond
Shadow Lake
Paradise Lake
Sunset Lake
Cranes Lake
Jennings Lake
Indian Mills Lake
Stau
rone
is sm
ithii
var.
inci
sa P
ant.
- -
- -
- -
- -
- -
- -
- -
- -
- 1
- -
Stau
rosi
ra c
onst
ruen
s Ehr
. -
- 85
-
- -
- -
- 26
-
- -
- -
- -
- -
- St
auro
sira
con
stru
ens v
ar. v
ente
r (Eh
r.) H
amilt
on
- -
- -
- -
- -
- 6
- -
- -
- -
5 -
- -
Stau
rosi
rella
pin
nata
var
. lan
cettu
la (S
chum
ann)
Siv
er &
Ham
ilton
-
- 75
-
4 -
- -
- -
33-
26
8333
-
59
- 3
1 St
auro
sire
lla p
inna
ta (E
hren
berg
) Will
iam
s & R
ound
-
- 27
-
- -
- -
- 4
- -
- 6
- -
5 -
3 -
Sten
opte
robi
a cu
rvul
a (W
. Sm
.) K
ram
. -
- -
- -
- -
- -
- 8
- -
- -
- 2
- -
- St
enop
tero
bia
delic
atis
sim
a (L
ewis
) Bré
b. e
x V
an H
. -
4 -
- 3
- -
2 2
2 -
- -
- -
- -
- -
- St
enop
tero
bia
dens
estr
iata
(Hus
t.) K
ram
mer
-
- -
- -
- -
1 -
- 10
18
2 -
- -
- -
- -
Sten
opte
robi
a sp
. -
- -
- -
- -
1 4
2 -
- -
- -
- 2
- -
- Su
rire
lla a
ngus
tata
Küt
z.
- -
- -
- -
- -
- -
- -
- -
- -
- -
1 -
Suri
rella
line
aris
W. S
m.
- -
2 -
6 3
- -
- -
- -
- -
- -
- -
- -
Syne
dra
cf. f
amel
ica
Kut
z.
- -
- -
- -
- -
- -
- -
- 2
- -
- -
1 -
Syne
dra
radi
ans K
utz.
-
- -
- -
- -
- -
- -
- 3
- -
- -
- 1
- Sy
nedr
a ru
mpe
ns K
ütz.
-
- -
- -
- -
- -
- -
- -
- -
- -
- 10
-
Syne
dra
rum
pens
var
. fra
gila
riod
es G
runo
w in
Van
Heu
rck
- -
- -
- -
- -
- -
- -
- -
- -
- -
- 14
2Sy
nedr
a ul
na (N
itzsc
h) E
hr.
- -
8 -
- -
- -
- -
- 4
- -
- -
- 27
21
-
Tabe
llari
a bi
nalis
(Ehr
.) G
run.
in V
an H
eurc
k -
- 9
1 25
15
-
5 35
1 -
- -
5 -
- -
- -
- Ta
bella
ria
flocc
ulos
a (R
oth.
) Küt
z.
- 5
- 1
- -
- -
2 22
12
18
4 57
140
45
6 3
- 7
Tabe
llari
a qu
adri
sept
ata
Knu
dson
27
637
597
26
415
574
-
66
218
24
171
14
3639
16
4
4 -
- To
tal n
umbe
r of d
iato
m c
ells
cou
nted
50
050
050
450
050
050
0 50
0 50
050
050
050
050
050
050
050
050
050
050
850
050
6
62
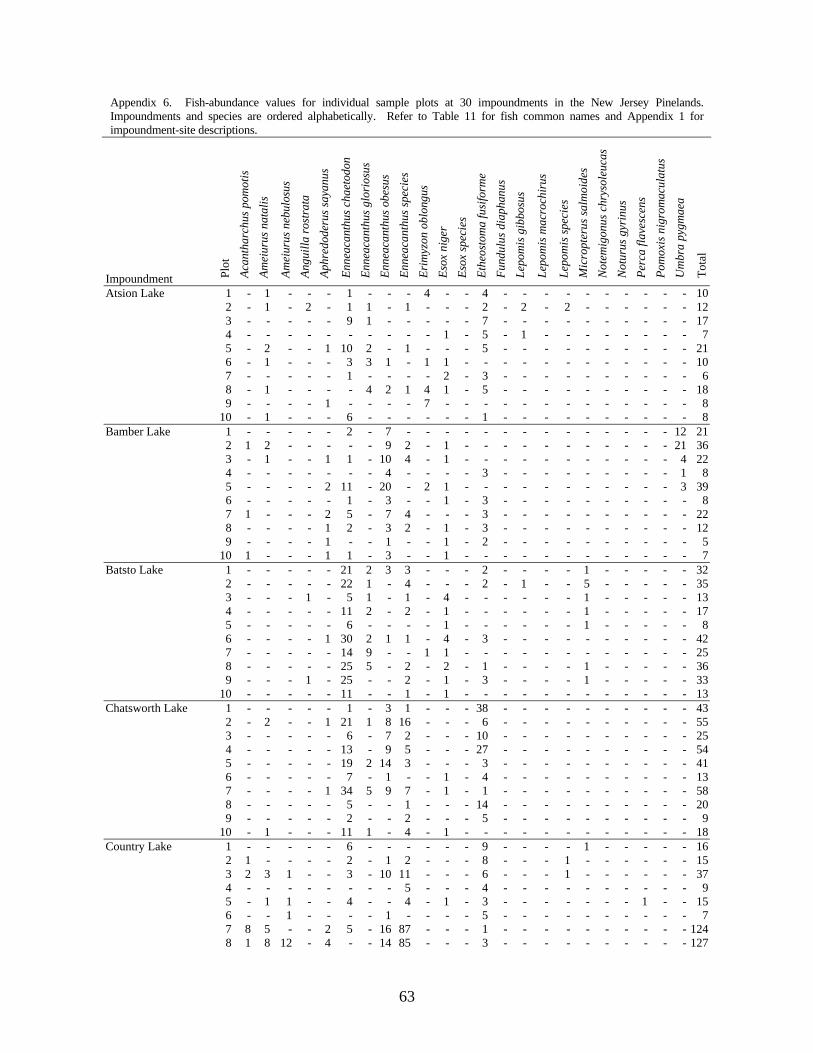
Appendix 6. Fish-abundance values for individual sample plots at 30 impoundments in the New Jersey Pinelands. Impoundments and species are ordered alphabetically. Refer to Table 11 for fish common names and Appendix 1 for impoundment-site descriptions.
Impoundment Plot
Ac
anth
arch
us p
omot
is
Amei
urus
nat
alis
Amei
urus
neb
ulos
us
Angu
illa
rost
rata
Ap
hred
oder
us sa
yanu
s
Enne
acan
thus
cha
etod
on
Enne
acan
thus
glo
rios
us
Enne
acan
thus
obe
sus
Enne
acan
thus
spec
ies
Erim
yzon
obl
ongu
s Es
ox n
iger
Es
ox sp
ecie
s Et
heos
tom
a fu
sifo
rme
Fund
ulus
dia
phan
us
Lepo
mis
gib
bosu
s
Lepo
mis
mac
roch
irus
Lepo
mis
spec
ies
Mic
ropt
erus
salm
oide
s N
otem
igon
us c
hrys
oleu
cas
Not
urus
gyr
inus
Pe
rca
flave
scen
s Po
mox
is n
igro
mac
ulat
us
Um
bra
pygm
aea
Tota
l
Atsion Lake 1 - 1 - - - 1 - - - 4 - - 4 - - - - - - - - - - 10 2 - 1 - 2 - 1 1 - 1 - - - 2 - 2 - 2 - - - - - - 12 3 - - - - - 9 1 - - - - - 7 - - - - - - - - - - 17 4 - - - - - - - - - - 1 - 5 - 1 - - - - - - - - 7 5 - 2 - - 1 10 2 - 1 - - - 5 - - - - - - - - - - 21 6 - 1 - - - 3 3 1 - 1 1 - - - - - - - - - - - - 10 7 - - - - - 1 - - - - 2 - 3 - - - - - - - - - - 6 8 - 1 - - - - 4 2 1 4 1 - 5 - - - - - - - - - - 18 9 - - - - 1 - - - - 7 - - - - - - - - - - - - - 8 10 - 1 - - - 6 - - - - - - 1 - - - - - - - - - - 8
Bamber Lake 1 - - - - - 2 - 7 - - - - - - - - - - - - - - 12 21 2 1 2 - - - - - 9 2 - 1 - - - - - - - - - - - 21 36 3 - 1 - - 1 1 - 10 4 - 1 - - - - - - - - - - - 4 22 4 - - - - - - - 4 - - - - 3 - - - - - - - - - 1 8 5 - - - - 2 11 - 20 - 2 1 - - - - - - - - - - - 3 39 6 - - - - - 1 - 3 - - 1 - 3 - - - - - - - - - - 8 7 1 - - - 2 5 - 7 4 - - - 3 - - - - - - - - - - 22 8 - - - - 1 2 - 3 2 - 1 - 3 - - - - - - - - - - 12 9 - - - - 1 - - 1 - - 1 - 2 - - - - - - - - - - 5 10 1 - - - 1 1 - 3 - - 1 - - - - - - - - - - - - 7
Batsto Lake 1 - - - - - 21 2 3 3 - - - 2 - - - - 1 - - - - - 32 2 - - - - - 22 1 - 4 - - - 2 - 1 - - 5 - - - - - 35 3 - - - 1 - 5 1 - 1 - 4 - - - - - - 1 - - - - - 13 4 - - - - - 11 2 - 2 - 1 - - - - - - 1 - - - - - 17 5 - - - - - 6 - - - - 1 - - - - - - 1 - - - - - 8 6 - - - - 1 30 2 1 1 - 4 - 3 - - - - - - - - - - 42 7 - - - - - 14 9 - - 1 1 - - - - - - - - - - - - 25 8 - - - - - 25 5 - 2 - 2 - 1 - - - - 1 - - - - - 36 9 - - - 1 - 25 - - 2 - 1 - 3 - - - - 1 - - - - - 33 10 - - - - - 11 - - 1 - 1 - - - - - - - - - - - - 13
Chatsworth Lake 1 - - - - - 1 - 3 1 - - - 38 - - - - - - - - - - 43 2 - 2 - - 1 21 1 8 16 - - - 6 - - - - - - - - - - 55 3 - - - - - 6 - 7 2 - - - 10 - - - - - - - - - - 25 4 - - - - - 13 - 9 5 - - - 27 - - - - - - - - - - 54 5 - - - - - 19 2 14 3 - - - 3 - - - - - - - - - - 41 6 - - - - - 7 - 1 - - 1 - 4 - - - - - - - - - - 13 7 - - - - 1 34 5 9 7 - 1 - 1 - - - - - - - - - - 58 8 - - - - - 5 - - 1 - - - 14 - - - - - - - - - - 20 9 - - - - - 2 - - 2 - - - 5 - - - - - - - - - - 9 10 - 1 - - - 11 1 - 4 - 1 - - - - - - - - - - - - 18
Country Lake 1 - - - - - 6 - - - - - - 9 - - - - 1 - - - - - 16 2 1 - - - - 2 - 1 2 - - - 8 - - - 1 - - - - - - 15 3 2 3 1 - - 3 - 10 11 - - - 6 - - - 1 - - - - - - 37 4 - - - - - - - - 5 - - - 4 - - - - - - - - - - 9 5 - 1 1 - - 4 - - 4 - 1 - 3 - - - - - - - 1 - - 15 6 - - 1 - - - - 1 - - - - 5 - - - - - - - - - - 7 7 8 5 - - 2 5 - 16 87 - - - 1 - - - - - - - - - - 124 8 1 8 12 - 4 - - 14 85 - - - 3 - - - - - - - - - - 127
63
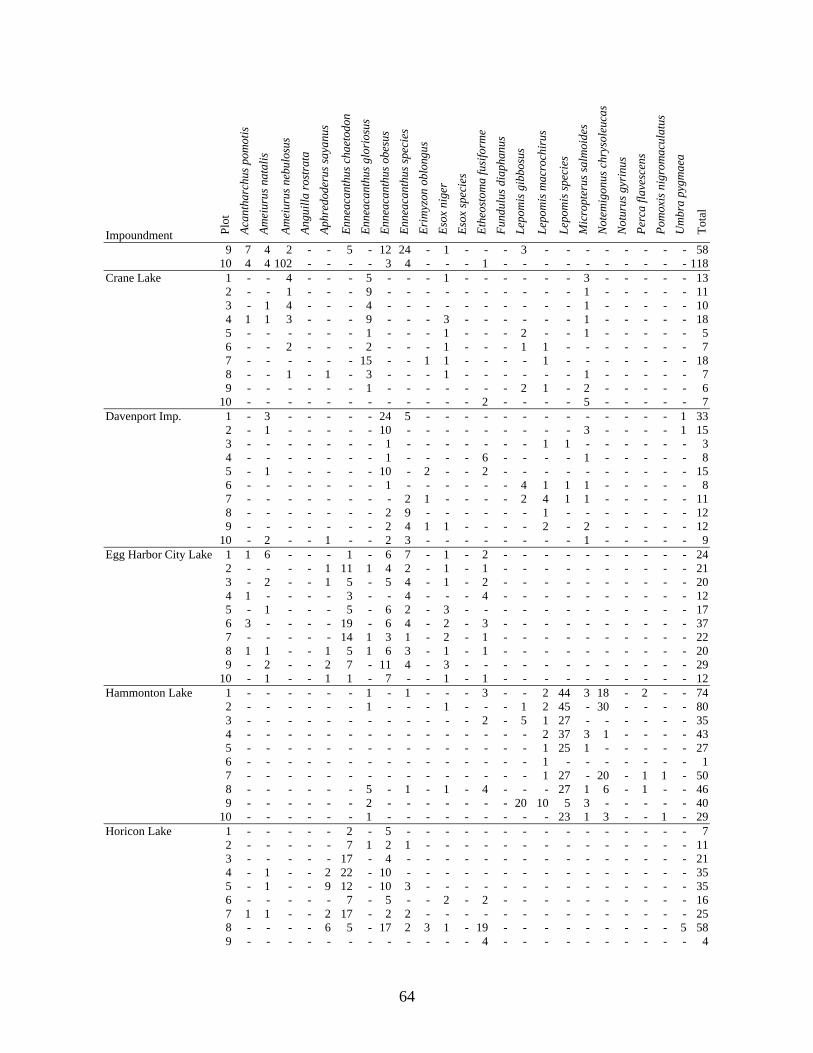
Impoundment Plot
Ac
anth
arch
us p
omot
is
Amei
urus
nat
alis
Amei
urus
neb
ulos
us
Angu
illa
rost
rata
Ap
hred
oder
us sa
yanu
s
Enne
acan
thus
cha
etod
on
Enne
acan
thus
glo
rios
us
Enne
acan
thus
obe
sus
Enne
acan
thus
spec
ies
Erim
yzon
obl
ongu
s Es
ox n
iger
Es
ox sp
ecie
s Et
heos
tom
a fu
sifo
rme
Fund
ulus
dia
phan
us
Lepo
mis
gib
bosu
s
Lepo
mis
mac
roch
irus
Lepo
mis
spec
ies
Mic
ropt
erus
salm
oide
s N
otem
igon
us c
hrys
oleu
cas
Not
urus
gyr
inus
Pe
rca
flave
scen
s Po
mox
is n
igro
mac
ulat
us
Um
bra
pygm
aea
Tota
l
9 7 4 2 - - 5 - 12 24 - 1 - - - 3 - - - - - - - - 58 10 4 4 102 - - - - 3 4 - - - 1 - - - - - - - - - - 118
Crane Lake 1 - - 4 - - - 5 - - - 1 - - - - - - 3 - - - - - 13 2 - - 1 - - - 9 - - - - - - - - - - 1 - - - - - 11 3 - 1 4 - - - 4 - - - - - - - - - - 1 - - - - - 10 4 1 1 3 - - - 9 - - - 3 - - - - - - 1 - - - - - 18 5 - - - - - - 1 - - - 1 - - - 2 - - 1 - - - - - 5 6 - - 2 - - - 2 - - - 1 - - - 1 1 - - - - - - - 7 7 - - - - - - 15 - - 1 1 - - - - 1 - - - - - - - 18 8 - - 1 - 1 - 3 - - - 1 - - - - - - 1 - - - - - 7 9 - - - - - - 1 - - - - - - - 2 1 - 2 - - - - - 6 10 - - - - - - - - - - - - 2 - - - - 5 - - - - - 7
Davenport Imp. 1 - 3 - - - - - 24 5 - - - - - - - - - - - - - 1 33 2 - 1 - - - - - 10 - - - - - - - - - 3 - - - - 1 15 3 - - - - - - - 1 - - - - - - - 1 1 - - - - - - 3 4 - - - - - - - 1 - - - - 6 - - - - 1 - - - - - 8 5 - 1 - - - - - 10 - 2 - - 2 - - - - - - - - - - 15 6 - - - - - - - 1 - - - - - - 4 1 1 1 - - - - - 8 7 - - - - - - - - 2 1 - - - - 2 4 1 1 - - - - - 11 8 - - - - - - - 2 9 - - - - - - 1 - - - - - - - 12 9 - - - - - - - 2 4 1 1 - - - - 2 - 2 - - - - - 12 10 - 2 - - 1 - - 2 3 - - - - - - - - 1 - - - - - 9
Egg Harbor City Lake 1 1 6 - - - 1 - 6 7 - 1 - 2 - - - - - - - - - - 24 2 - - - - 1 11 1 4 2 - 1 - 1 - - - - - - - - - - 21 3 - 2 - - 1 5 - 5 4 - 1 - 2 - - - - - - - - - - 20 4 1 - - - - 3 - - 4 - - - 4 - - - - - - - - - - 12 5 - 1 - - - 5 - 6 2 - 3 - - - - - - - - - - - - 17 6 3 - - - - 19 - 6 4 - 2 - 3 - - - - - - - - - - 37 7 - - - - - 14 1 3 1 - 2 - 1 - - - - - - - - - - 22 8 1 1 - - 1 5 1 6 3 - 1 - 1 - - - - - - - - - - 20 9 - 2 - - 2 7 - 11 4 - 3 - - - - - - - - - - - - 29 10 - 1 - - 1 1 - 7 - - 1 - 1 - - - - - - - - - - 12
Hammonton Lake 1 - - - - - - 1 - 1 - - - 3 - - 2 44 3 18 - 2 - - 74 2 - - - - - - 1 - - - 1 - - - 1 2 45 - 30 - - - - 80 3 - - - - - - - - - - - - 2 - 5 1 27 - - - - - - 35 4 - - - - - - - - - - - - - - - 2 37 3 1 - - - - 43 5 - - - - - - - - - - - - - - - 1 25 1 - - - - - 27 6 - - - - - - - - - - - - - - - 1 - - - - - - - 1 7 - - - - - - - - - - - - - - - 1 27 - 20 - 1 1 - 50 8 - - - - - - 5 - 1 - 1 - 4 - - - 27 1 6 - 1 - - 46 9 - - - - - - 2 - - - - - - - 20 10 5 3 - - - - - 40 10 - - - - - - 1 - - - - - - - - - 23 1 3 - - 1 - 29
Horicon Lake 1 - - - - - 2 - 5 - - - - - - - - - - - - - - - 7 2 - - - - - 7 1 2 1 - - - - - - - - - - - - - - 11 3 - - - - - 17 - 4 - - - - - - - - - - - - - - - 21 4 - 1 - - 2 22 - 10 - - - - - - - - - - - - - - - 35 5 - 1 - - 9 12 - 10 3 - - - - - - - - - - - - - - 35 6 - - - - - 7 - 5 - - 2 - 2 - - - - - - - - - - 16 7 1 1 - - 2 17 - 2 2 - - - - - - - - - - - - - - 25 8 - - - - 6 5 - 17 2 3 1 - 19 - - - - - - - - - 5 58 9 - - - - - - - - - - - - 4 - - - - - - - - - - 4
64

Impoundment Plot
Ac
anth
arch
us p
omot
is
Amei
urus
nat
alis
Amei
urus
neb
ulos
us
Angu
illa
rost
rata
Ap
hred
oder
us sa
yanu
s
Enne
acan
thus
cha
etod
on
Enne
acan
thus
glo
rios
us
Enne
acan
thus
obe
sus
Enne
acan
thus
spec
ies
Erim
yzon
obl
ongu
s Es
ox n
iger
Es
ox sp
ecie
s Et
heos
tom
a fu
sifo
rme
Fund
ulus
dia
phan
us
Lepo
mis
gib
bosu
s
Lepo
mis
mac
roch
irus
Lepo
mis
spec
ies
Mic
ropt
erus
salm
oide
s N
otem
igon
us c
hrys
oleu
cas
Not
urus
gyr
inus
Pe
rca
flave
scen
s Po
mox
is n
igro
mac
ulat
us
Um
bra
pygm
aea
Tota
l
10 - - - - 1 14 - 11 4 - 1 - 1 - - - - - - - - - - 32Howardsville Imp. 1 - - - - - - - 26 - - - - 41 - - - - - - - - - - 67
2 - - - - - 5 - 21 1 - - - 14 - - - - - - - - - 11 52 3 - - - - - 2 - 28 3 - 1 - 3 - - - - - - - - - 1 38 4 - - - - - - - 6 - - - - 3 - - - - - - - - - 2 11 5 - - - - - - - 14 - - - - 6 - - - - - - - - - 1 21 6 - - - - - - - 4 - - - - 1 - - - - - - - - - - 5 7 - - - - - 7 - 28 3 - - - 6 - - - - - - - - - 1 45 8 - - - - - 2 - 18 1 - 1 - 7 - - - - - - - - - 2 31 9 - - - - - 4 - 36 4 - - 1 1 - - - - - - - - - 1 47 10 - - - - - 1 - 21 - - - - 4 - - - - - - - - - 7 33
Indian Mills Lake 1 - - - - - - - - - 1 - - - - 1 2 6 - - - - - - 10 2 - - - 1 - - - - - 1 - - 3 - 2 1 12 - - - - - - 20 3 - - - - - - - - - - - - - - 7 10 58 - - - - - - 75 4 - - - - - - - - - - - - 2 - 2 2 13 - - - - - - 19 5 - - - - - - - - - - - - 6 - 3 2 1 - - - - - - 12 6 - - - - - - - - - - - - 1 - 9 5 26 - - - - - 1 42 7 - - - - 3 - - - - 1 - - 5 - 5 38 67 - - - - - 2 121 8 - - 1 - 3 - - - - - - - 10 - - 25 116 - - - - - - 155 9 - - - - 2 - - - - - - - 7 - 1 28 33 5 - - - - - 76 10 - - 1 - 1 - - - - - - - 16 - 1 9 65 1 - - - - - 94
Cushman Lake 1 - - - - - - 1 - - - - - - - 3 7 31 - - - - 1 - 43 2 - - - - - - - - - - - - - - - 13 8 - - - - - - 21 3 - - - - - - - - - - - - - - 6 24 41 - - 1 - - - 72 4 - - - - - - 2 - - - - - - - 9 63 24 1 - - 1 - - 100 5 - - - - - - - - - - - - - - 9 56 77 - - 1 - - - 143 6 - - - - - - - - - - - - - - 2 15 20 - - - - - - 37 7 - - - - - - 2 - - - - - - - 2 10 23 - - - - - - 37 8 - - - - - - 1 - - - - - 1 - - 8 25 2 2 - - - - 39 9 - - - - - - - - - - - - - 5 16 - - - - - - - - 21 10 - - - - - - - - - - - - - - 1 1 4 - - - - 1 - 7
Jennings Lake 1 - - - - - - 24 - - - - - - - - 2 - - - - - - 1 27 2 - - - - - - 19 - - - 3 - - - - - - 1 - - - - - 23 3 - - - - - - 6 - - - 2 - - - - - - - - - - - - 8 4 - - - - - - 4 - - - 1 - - - - 1 - - - - - - - 6 5 - - - - 1 - 7 - 2 - 2 1 - - - - - - - 1 - - 3 17 6 - - - - - - 24 - - 1 1 - - - - 3 - 3 - - - - - 32 7 - - 1 - - - 33 - - - 1 - - - - - - - - 2 - - 2 39 8 - - - - - - 4 - - - 1 - - - - - - - - - - - - 5 9 - - - - - - 11 - - - 3 - - - - - - - - - - - - 14 10 - - - - - - 3 - - - - - - - - - - - - 1 - - - 4
Kettle Run Imp. 1 - - - - - 6 - 6 - - - - 3 - - 5 - 1 - - - - 3 24 2 - - - - - 4 - - - - - - 1 - - - - - - - - - 1 6 3 - - - - - 2 - 3 - - - - 2 - - - - - - - - - 2 9 4 - - - - - 3 - 1 1 - - - 7 - 1 3 - - - - - - 1 17 5 1 - - - - 18 - - 3 - - - 2 - - 1 - - - - - - - 25 6 - - - - - 1 - - 3 - - - 3 - - 1 - 1 - - - 1 - 10 7 - 1 - - - - - 8 5 - - - 4 - - - - - - - - - 1 19 8 - - - - - 1 - - - - - - 4 - 2 - - - - - - - - 7 9 - - - - - 16 - 1 - - - - 2 - - - - - - - - - 1 20 10 - - - - - 17 - 3 - - - - 3 - - - - 1 - - - - - 24
65

Impoundment Plot
Ac
anth
arch
us p
omot
is
Amei
urus
nat
alis
Amei
urus
neb
ulos
us
Angu
illa
rost
rata
Ap
hred
oder
us sa
yanu
s
Enne
acan
thus
cha
etod
on
Enne
acan
thus
glo
rios
us
Enne
acan
thus
obe
sus
Enne
acan
thus
spec
ies
Erim
yzon
obl
ongu
s Es
ox n
iger
Es
ox sp
ecie
s Et
heos
tom
a fu
sifo
rme
Fund
ulus
dia
phan
us
Lepo
mis
gib
bosu
s
Lepo
mis
mac
roch
irus
Lepo
mis
spec
ies
Mic
ropt
erus
salm
oide
s N
otem
igon
us c
hrys
oleu
cas
Not
urus
gyr
inus
Pe
rca
flave
scen
s Po
mox
is n
igro
mac
ulat
us
Um
bra
pygm
aea
Tota
l
Lady’s Lake 1 - - - - - 22 - 4 4 - 1 - - - 1 - - 1 - - - - - 33 2 - 1 - - - 15 - 5 2 1 1 - - - - - - 5 4 - - - 1 35 3 - - - - - 16 - 5 1 - 1 - - - - - - 3 - - - - - 26 4 - - - - - 21 - 8 3 - 4 - 2 - - - - 1 - - - - - 39 5 - - - - - 5 - 1 2 - 3 - 2 - - 3 - - - - - - - 16 6 - - - - - - - - - - - - - - - 2 7 2 - - - - - 11 7 - - - - - 4 - - - - - - - - - 1 3 3 - - - - - 11 8 - - - - - 3 - 1 - - - - - - - 4 1 - - - - - - 9 9 - - - - - 23 - 5 1 1 1 - - - - 2 - - - - - - - 33 10 - - - - - 6 - 2 1 - 3 - - - - - - - - - - - - 12
Lake Absegami 1 - - - - - - - 10 6 - 3 - - - - - - - - - - - - 19 2 - - - - - - - 12 15 1 - - 7 - - - - - - - - - - 35 3 - - - - - - - 2 - - 1 - 3 - - - - - - - - - - 6 4 - - - - - - - 1 - - 1 - 15 - - - - - - - - - - 17 5 - - - - - - - - - - 1 - 14 - - - - - - - - - - 15 6 - - - - - - - 1 - - - - 4 - - - - - - - - - - 5 7 - - - - - - - 15 8 - - - 13 - - - - - - - - - - 36 8 - - - - - - - - - - - - - - - - - - - - - - - - 9 - - - - - - - - - - - - 20 - - - - - - - - - - 20 10 - - - - - - - 1 - - - - 26 - - - - - - - - - 1 28
Lake Albert 1 - - - - - 1 1 1 - - - - 17 - 14 3 40 - - - - - - 77 2 - - - - - 1 - - - - 1 - 7 - 2 3 11 - - - - - - 25 3 - - - - 1 1 2 - - - 3 - - - 1 23 26 - - - - - - 57 4 - - - - - - - - - - - - - - 1 2 3 - - - - - - 6 5 - - - - - 2 3 - - - - - 1 - 9 20 41 - - - - - - 76 6 - - - - - 1 - - - - - - 4 - 7 22 7 - - - - - - 41 7 - - - - - - - - - - - - 2 - - 6 135 1 - - - - - 144 8 - - - - - 1 - - - - - - 2 - 20 25 8 - - - - - - 56 9 - - - - - - - - - - - - 1 - - 24 289 - - - - - - 314 10 1 - - - - 13 1 - - - - - 8 - - - 25 - - - - - - 48
Lake Fred 1 - - 3 - - 1 - 38 1 - 1 - - - - - - 1 - - - - 4 49 2 - 1 - - - 29 - 11 4 - - - 1 - - - - 1 - - - - 3 50 3 - - 1 - - - - 8 7 - - - - - - - - 2 - - - - 6 24 4 - - - - - - - 5 9 - - - - - - - - - - - - - - 14 5 - - - - - 2 - 2 - - - - - - 1 - - 17 - - - - - 22 6 - - - - - 17 - 13 5 - - - 4 - - - - 4 - - - - - 43 7 - 6 2 - - 148 - 26 1 - 1 - 2 - 1 1 - - - - - - 9 197 8 - - - - - 1 - 5 - - 3 - 3 - 1 - - 2 - - - - - 15 9 - - - - - 14 - 14 10 - - - 1 - - - - 1 - - - - 3 43 10 - 1 - - - 32 - 12 2 - - - - - - - - - - - - - 1 48
Maple Lake 1 - - - - - - 7 - 2 - - - - - - 4 31 - - - - - 4 48 2 - - - - - - 1 - - - - - - - - 2 17 1 - - - - 3 24 3 - - - - - - 1 - - - - - - - - 4 18 - - - - - - 23 4 - - - - - - 1 - 1 - - - - - - 6 27 1 - - - - 2 38 5 - - - - - - 3 - - - - - - - - 102 33 2 - - - - 2 142 6 - - - - - - 1 - - - - - - - - 10 1 1 - - - - - 13 7 - - - - - - - - - - - - - - - 4 8 2 - - - - - 14 8 - - - - - - - - - - - - - - - 8 16 - - - - - - 24 9 - - - - - - - - - - - - - - - - 24 - - - - - - 24 10 - - - - - - - - - - - - - - - 3 9 - - - - - - 12
Mimosa Lake 1 - 1 - - - - - - - - - - 4 - - - - - - - - - - 5
66

Impoundment Plot
Ac
anth
arch
us p
omot
is
Amei
urus
nat
alis
Amei
urus
neb
ulos
us
Angu
illa
rost
rata
Ap
hred
oder
us sa
yanu
s
Enne
acan
thus
cha
etod
on
Enne
acan
thus
glo
rios
us
Enne
acan
thus
obe
sus
Enne
acan
thus
spec
ies
Erim
yzon
obl
ongu
s Es
ox n
iger
Es
ox sp
ecie
s Et
heos
tom
a fu
sifo
rme
Fund
ulus
dia
phan
us
Lepo
mis
gib
bosu
s
Lepo
mis
mac
roch
irus
Lepo
mis
spec
ies
Mic
ropt
erus
salm
oide
s N
otem
igon
us c
hrys
oleu
cas
Not
urus
gyr
inus
Pe
rca
flave
scen
s Po
mox
is n
igro
mac
ulat
us
Um
bra
pygm
aea
Tota
l
2 - 1 - - - - - - - - - - 1 - - - - 6 - - - - - 8 3 - 1 - - - - - - - - - - 1 - - - - 4 - - - - - 6 4 - - - - - 2 - - - - - - 1 - 1 2 - 3 - - - - - 9 5 - - - - - 4 - - - - - - 1 - - - - 2 - - - - - 7 6 - - - - - - - - - - - - 1 - 2 - - 7 - - - - - 10 7 - - - - - - - 2 - - - - 14 - - - - 2 - - - - - 18 8 - 2 - - - - - - - - - - 3 - - - - - - - - - - 5 9 - - - - - 2 - - - - - - 1 - - - - 2 - - - - - 5 10 - - - - - - - - - - - - - - - 3 - 5 - - - 1 - 9
Oswego Lake 1 - - - - - 3 - - 1 3 - - 7 - - - - - - - - - - 14 2 - 1 - - - 1 - 1 - 27 - - 3 - - - - - - - - - - 33 3 - 4 - - - - - 4 3 - - - - - - - - - - - - - - 11 4 - - - - - 2 - - - 1 - - 1 - - - - - - - - - - 4 5 - 1 - - - 2 - 2 2 17 1 - 4 - - - - - - - - - - 29 6 - - - - - 5 - 1 - - - - - - - - - - - - - - - 6 7 - - - - - 5 9 3 3 32 - - 17 - - - - - - - - - - 69 8 - - - - - 13 13 5 3 6 1 - 3 - - - - - - - - - - 44 9 - 1 - - - 10 4 5 2 4 - - 1 - - - - - - - - - 1 28 10 - - - - - 3 2 2 - - 1 - 2 - - - - - - - - - - 10
Pakim Pond 1 - - - - - - - 15 4 - 1 - - - - - - - - - - - - 20 2 - - - - - - - 7 15 - - - - - - - - - - - - - - 22 3 - - - - - - - 5 15 - - - - - - - - - - - - - - 20 4 - - - - - - - 13 5 - 1 - - - - - - - - - - - 2 21 5 - - - - - - - 6 6 - - - - - - - - - - - - - - 12 6 - - - - - - - 9 13 - 1 - - - - - - - - - - - - 23 7 - - - - - - - 7 5 - 1 - - - - - - - - - - - - 13 8 - - - - - - - 4 3 - - - - - - - - - - - - - - 7 9 - - - - - - - 4 3 - 1 - - - - - - - - - - - - 8 10 - - - - - - - 3 3 - - - - - - - - - - - - - - 6
Paradise Lake 1 - - - - - - - 1 - - 2 - - - - 1 - 1 - - - - - 5 2 - - - - - - - - - 16 3 - - - - - 1 - - - - - - 20 3 - - - - - 2 1 - 1 5 1 - - - - - 15 - 2 - - - - 27 4 - - - - - 6 3 1 - 5 1 - - - - - 7 - 1 - - - - 24 5 - - - - - 5 1 - - 9 3 - - - - 2 - - - - - - - 20 6 - - - - 1 7 - - - 2 5 - 3 - - 1 - - - - - - - 19 7 - - - - - 23 - 4 - 2 2 - - - - - - - - 1 - - 4 36 8 - - - - - 12 1 6 - 10 4 - - - - - - - - - - - - 33 9 - - - - - 2 - - - 1 3 - - - - - - - - - - - - 6 10 - - - - - - - - - - - - - - - - - - - - - - - -
Pilgrim Lake 1 - 1 - - - 7 3 7 - 16 - - 4 - - - - - - - - - 1 39 2 - - - - - 8 1 8 4 21 - - 1 - - - - - - - - - 2 45 3 - 1 - - - 11 1 10 5 2 1 - - - - - - - - - - - 4 35 4 - 2 - 1 - 11 - 6 7 2 - - - - - - - - - - - - 5 34 5 - 1 - - - 5 - 4 6 5 1 - 1 - - - - - - - - - 4 27 6 - 2 - - - 6 2 7 5 - 1 - - - - - - - - - - - - 23 7 - 1 - - - 12 1 3 3 - 1 - 1 - - - - - - - - - - 22 8 - 1 - - - 1 2 6 1 - 1 - - - - - - - - - - - 1 13 9 - 1 - 1 - 1 - 2 1 - 1 - - - - - - - - - - - - 7 10 - 2 - - - 2 3 3 9 - 1 - - - - - - - - - - - 1 21
Shadow Lake 1 1 2 - - 1 - - 3 3 1 - - 4 - 1 - - - - - - - - 16 2 - - - - - - - 17 3 3 - - 6 - - 1 - - - - - - 4 34
67
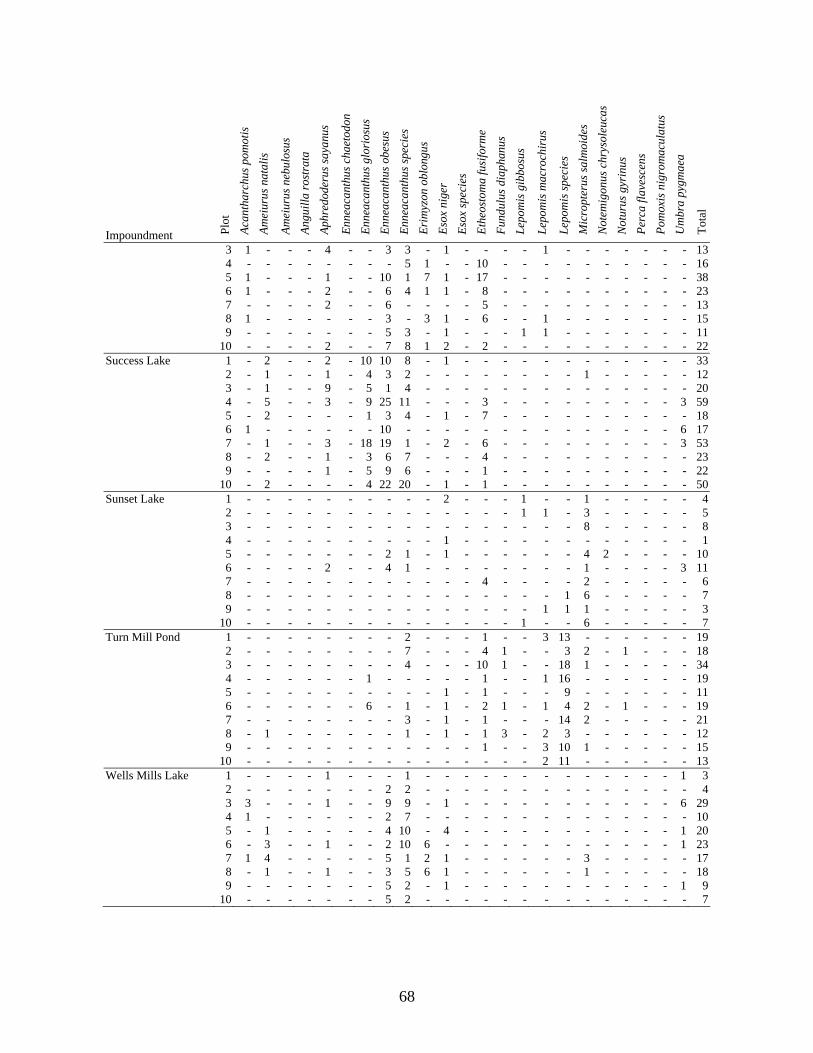
68
Impoundment Plot
Ac
anth
arch
us p
omot
is
Amei
urus
nat
alis
Amei
urus
neb
ulos
us
Angu
illa
rost
rata
Ap
hred
oder
us sa
yanu
s
Enne
acan
thus
cha
etod
on
Enne
acan
thus
glo
rios
us
Enne
acan
thus
obe
sus
Enne
acan
thus
spec
ies
Erim
yzon
obl
ongu
s Es
ox n
iger
Es
ox sp
ecie
s Et
heos
tom
a fu
sifo
rme
Fund
ulus
dia
phan
us
Lepo
mis
gib
bosu
s
Lepo
mis
mac
roch
irus
Lepo
mis
spec
ies
Mic
ropt
erus
salm
oide
s N
otem
igon
us c
hrys
oleu
cas
Not
urus
gyr
inus
Pe
rca
flave
scen
s Po
mox
is n
igro
mac
ulat
us
Um
bra
pygm
aea
Tota
l
3 1 - - - 4 - - 3 3 - 1 - - - - 1 - - - - - - - 13 4 - - - - - - - - 5 1 - - 10 - - - - - - - - - - 16 5 1 - - - 1 - - 10 1 7 1 - 17 - - - - - - - - - - 38 6 1 - - - 2 - - 6 4 1 1 - 8 - - - - - - - - - - 23 7 - - - - 2 - - 6 - - - - 5 - - - - - - - - - - 13 8 1 - - - - - - 3 - 3 1 - 6 - - 1 - - - - - - - 15 9 - - - - - - - 5 3 - 1 - - - 1 1 - - - - - - - 11 10 - - - - 2 - - 7 8 1 2 - 2 - - - - - - - - - - 22
Success Lake 1 - 2 - - 2 - 10 10 8 - 1 - - - - - - - - - - - - 33 2 - 1 - - 1 - 4 3 2 - - - - - - - - 1 - - - - - 12 3 - 1 - - 9 - 5 1 4 - - - - - - - - - - - - - - 20 4 - 5 - - 3 - 9 25 11 - - - 3 - - - - - - - - - 3 59 5 - 2 - - - - 1 3 4 - 1 - 7 - - - - - - - - - - 18 6 1 - - - - - - 10 - - - - - - - - - - - - - - 6 17 7 - 1 - - 3 - 18 19 1 - 2 - 6 - - - - - - - - - 3 53 8 - 2 - - 1 - 3 6 7 - - - 4 - - - - - - - - - - 23 9 - - - - 1 - 5 9 6 - - - 1 - - - - - - - - - - 22 10 - 2 - - - - 4 22 20 - 1 - 1 - - - - - - - - - - 50
Sunset Lake 1 - - - - - - - - - - 2 - - - 1 - - 1 - - - - - 4 2 - - - - - - - - - - - - - - 1 1 - 3 - - - - - 5 3 - - - - - - - - - - - - - - - - - 8 - - - - - 8 4 - - - - - - - - - - 1 - - - - - - - - - - - - 1 5 - - - - - - - 2 1 - 1 - - - - - - 4 2 - - - - 10 6 - - - - 2 - - 4 1 - - - - - - - - 1 - - - - 3 11 7 - - - - - - - - - - - - 4 - - - - 2 - - - - - 6 8 - - - - - - - - - - - - - - - - 1 6 - - - - - 7 9 - - - - - - - - - - - - - - - 1 1 1 - - - - - 3 10 - - - - - - - - - - - - - - 1 - - 6 - - - - - 7
Turn Mill Pond 1 - - - - - - - - 2 - - - 1 - - 3 13 - - - - - - 19 2 - - - - - - - - 7 - - - 4 1 - - 3 2 - 1 - - - 18 3 - - - - - - - - 4 - - - 10 1 - - 18 1 - - - - - 34 4 - - - - - - 1 - - - - - 1 - - 1 16 - - - - - - 19 5 - - - - - - - - - - 1 - 1 - - - 9 - - - - - - 11 6 - - - - - - 6 - 1 - 1 - 2 1 - 1 4 2 - 1 - - - 19 7 - - - - - - - - 3 - 1 - 1 - - - 14 2 - - - - - 21 8 - 1 - - - - - - 1 - 1 - 1 3 - 2 3 - - - - - - 12 9 - - - - - - - - - - - - 1 - - 3 10 1 - - - - - 15 10 - - - - - - - - - - - - - - - 2 11 - - - - - - 13
Wells Mills Lake 1 - - - - 1 - - - 1 - - - - - - - - - - - - - 1 3 2 - - - - - - - 2 2 - - - - - - - - - - - - - - 4 3 3 - - - 1 - - 9 9 - 1 - - - - - - - - - - - 6 29 4 1 - - - - - - 2 7 - - - - - - - - - - - - - - 10 5 - 1 - - - - - 4 10 - 4 - - - - - - - - - - - 1 20 6 - 3 - - 1 - - 2 10 6 - - - - - - - - - - - - 1 23 7 1 4 - - - - - 5 1 2 1 - - - - - - 3 - - - - - 17 8 - 1 - - 1 - - 3 5 6 1 - - - - - - 1 - - - - - 18 9 - - - - - - - 5 2 - 1 - - - - - - - - - - - 1 9 10 - - - - - - - 5 2 - - - - - - - - - - - - - - 7
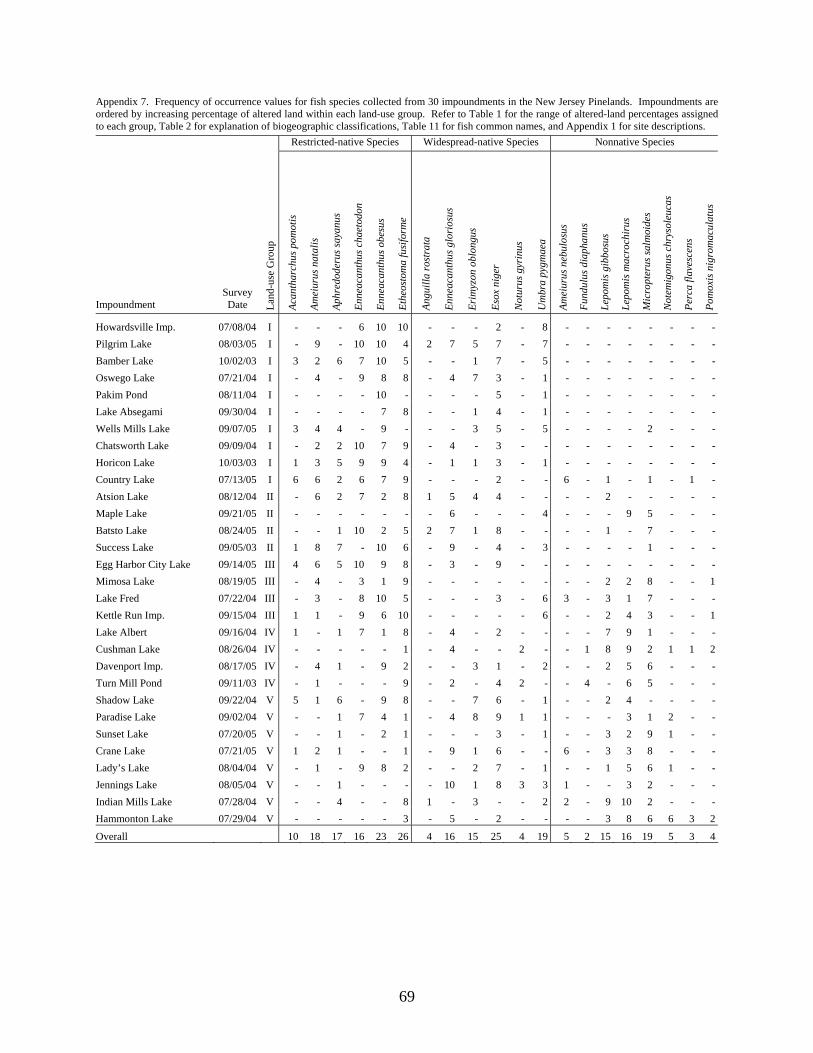
Appendix 7. Frequency of occurrence values for fish species collected from 30 impoundments in the New Jersey Pinelands. Impoundments are ordered by increasing percentage of altered land within each land-use group. Refer to Table 1 for the range of altered-land percentages assigned to each group, Table 2 for explanation of biogeographic classifications, Table 11 for fish common names, and Appendix 1 for site descriptions. Restricted-native Species Widespread-native Species Nonnative Species
Impoundment Survey Date La
nd-u
se G
roup
Acan
thar
chus
pom
otis
Amei
urus
nat
alis
Aphr
edod
erus
saya
nus
Enne
acan
thus
cha
etod
on
Enne
acan
thus
obe
sus
Ethe
osto
ma
fusi
form
e
Angu
illa
rost
rata
Enne
acan
thus
glo
rios
us
Erim
yzon
obl
ongu
s
Esox
nig
er
Not
urus
gyr
inus
Um
bra
pygm
aea
Amei
urus
neb
ulos
us
Fund
ulus
dia
phan
us
Lepo
mis
gib
bosu
s
Lepo
mis
mac
roch
irus
Mic
ropt
erus
salm
oide
s
Not
emig
onus
chr
ysol
euca
s
Perc
a fla
vesc
ens
Pom
oxis
nig
rom
acul
atus
Howardsville Imp. 07/08/04 I - - - 6 10 10 - - - 2 - 8 - - - - - - - -Pilgrim Lake 08/03/05 I - 9 - 10 10 4 2 7 5 7 - 7 - - - - - - - -Bamber Lake 10/02/03 I 3 2 6 7 10 5 - - 1 7 - 5 - - - - - - - -Oswego Lake 07/21/04 I - 4 - 9 8 8 - 4 7 3 - 1 - - - - - - - -Pakim Pond 08/11/04 I - - - - 10 - - - - 5 - 1 - - - - - - - -Lake Absegami 09/30/04 I - - - - 7 8 - - 1 4 - 1 - - - - - - - -Wells Mills Lake 09/07/05 I 3 4 4 - 9 - - - 3 5 - 5 - - - - 2 - - -Chatsworth Lake 09/09/04 I - 2 2 10 7 9 - 4 - 3 - - - - - - - - - -Horicon Lake 10/03/03 I 1 3 5 9 9 4 - 1 1 3 - 1 - - - - - - - -Country Lake 07/13/05 I 6 6 2 6 7 9 - - - 2 - - 6 - 1 - 1 - 1 -Atsion Lake 08/12/04 II - 6 2 7 2 8 1 5 4 4 - - - - 2 - - - - -Maple Lake 09/21/05 II - - - - - - - 6 - - - 4 - - - 9 5 - - -Batsto Lake 08/24/05 II - - 1 10 2 5 2 7 1 8 - - - - 1 - 7 - - -Success Lake 09/05/03 II 1 8 7 - 10 6 - 9 - 4 - 3 - - - - 1 - - -Egg Harbor City Lake 09/14/05 III 4 6 5 10 9 8 - 3 - 9 - - - - - - - - - -Mimosa Lake 08/19/05 III - 4 - 3 1 9 - - - - - - - - 2 2 8 - - 1Lake Fred 07/22/04 III - 3 - 8 10 5 - - - 3 - 6 3 - 3 1 7 - - -Kettle Run Imp. 09/15/04 III 1 1 - 9 6 10 - - - - - 6 - - 2 4 3 - - 1Lake Albert 09/16/04 IV 1 - 1 7 1 8 - 4 - 2 - - - - 7 9 1 - - -Cushman Lake 08/26/04 IV - - - - - 1 - 4 - - 2 - - 1 8 9 2 1 1 2Davenport Imp. 08/17/05 IV - 4 1 - 9 2 - - 3 1 - 2 - - 2 5 6 - - -Turn Mill Pond 09/11/03 IV - 1 - - - 9 - 2 - 4 2 - - 4 - 6 5 - - -Shadow Lake 09/22/04 V 5 1 6 - 9 8 - - 7 6 - 1 - - 2 4 - - - -Paradise Lake 09/02/04 V - - 1 7 4 1 - 4 8 9 1 1 - - - 3 1 2 - -Sunset Lake 07/20/05 V - - 1 - 2 1 - - - 3 - 1 - - 3 2 9 1 - -Crane Lake 07/21/05 V 1 2 1 - - 1 - 9 1 6 - - 6 - 3 3 8 - - -Lady’s Lake 08/04/04 V - 1 - 9 8 2 - - 2 7 - 1 - - 1 5 6 1 - -Jennings Lake 08/05/04 V - - 1 - - - - 10 1 8 3 3 1 - - 3 2 - - -Indian Mills Lake 07/28/04 V - - 4 - - 8 1 - 3 - - 2 2 - 9 10 2 - - -Hammonton Lake 07/29/04 V - - - - - 3 - 5 - 2 - - - - 3 8 6 6 3 2
Overall 10 18 17 16 23 26 4 16 15 25 4 19 5 2 15 16 19 5 3 4
69
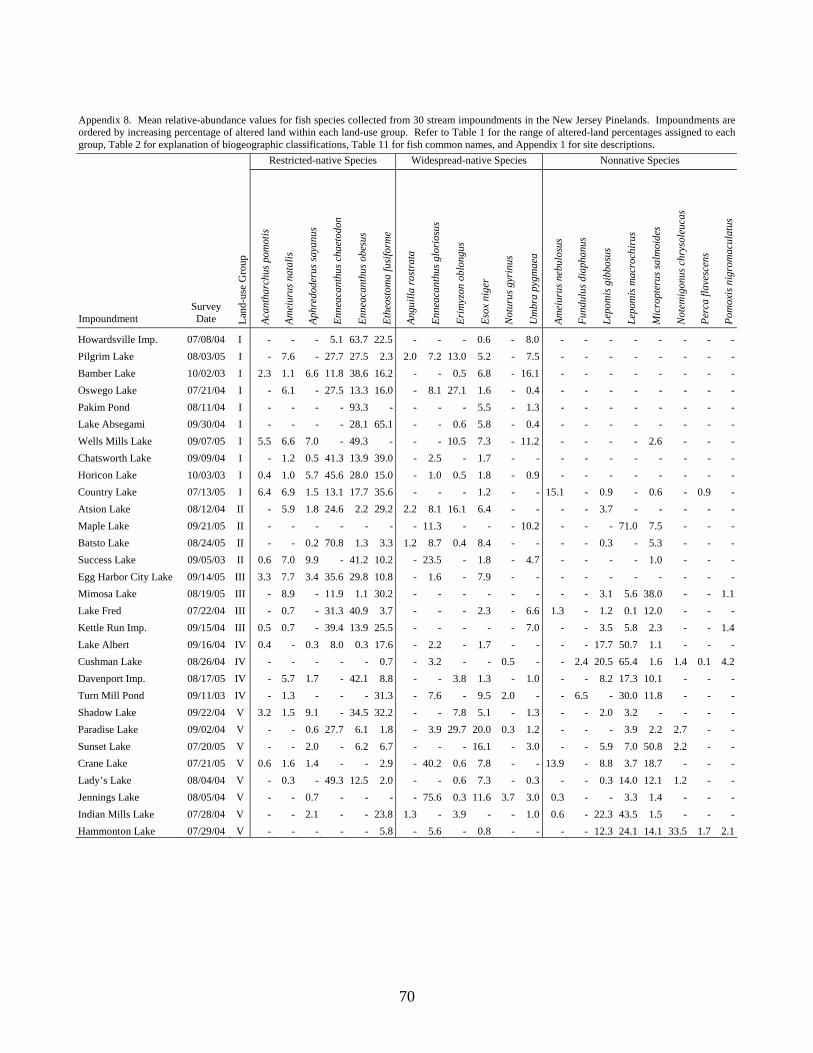
70
Appendix 8. Mean relative-abundance values for fish species collected from 30 stream impoundments in the New Jersey Pinelands. Impoundments are ordered by increasing percentage of altered land within each land-use group. Refer to Table 1 for the range of altered-land percentages assigned to each group, Table 2 for explanation of biogeographic classifications, Table 11 for fish common names, and Appendix 1 for site descriptions. Restricted-native Species Widespread-native Species Nonnative Species
Impoundment Survey Date La
nd-u
se G
roup
Acan
thar
chus
pom
otis
Amei
urus
nat
alis
Aphr
edod
erus
saya
nus
Enne
acan
thus
cha
etod
on
Enne
acan
thus
obe
sus
Ethe
osto
ma
fusi
form
e
Angu
illa
rost
rata
Enne
acan
thus
glo
rios
us
Erim
yzon
obl
ongu
s
Esox
nig
er
Not
urus
gyr
inus
Um
bra
pygm
aea
Amei
urus
neb
ulos
us
Fund
ulus
dia
phan
us
Lepo
mis
gib
bosu
s
Lepo
mis
mac
roch
irus
Mic
ropt
erus
salm
oide
s
Not
emig
onus
chr
ysol
euca
s
Perc
a fla
vesc
ens
Pom
oxis
nig
rom
acul
atus
Howardsville Imp. 07/08/04 I - - - 5.1 63.7 22.5 - - - 0.6 - 8.0 - - - - - - - -Pilgrim Lake 08/03/05 I - 7.6 - 27.7 27.5 2.3 2.0 7.2 13.0 5.2 - 7.5 - - - - - - - -Bamber Lake 10/02/03 I 2.3 1.1 6.6 11.8 38.6 16.2 - - 0.5 6.8 - 16.1 - - - - - - - -Oswego Lake 07/21/04 I - 6.1 - 27.5 13.3 16.0 - 8.1 27.1 1.6 - 0.4 - - - - - - - -Pakim Pond 08/11/04 I - - - - 93.3 - - - - 5.5 - 1.3 - - - - - - - -Lake Absegami 09/30/04 I - - - - 28.1 65.1 - - 0.6 5.8 - 0.4 - - - - - - - -Wells Mills Lake 09/07/05 I 5.5 6.6 7.0 - 49.3 - - - 10.5 7.3 - 11.2 - - - - 2.6 - - -Chatsworth Lake 09/09/04 I - 1.2 0.5 41.3 13.9 39.0 - 2.5 - 1.7 - - - - - - - - - -Horicon Lake 10/03/03 I 0.4 1.0 5.7 45.6 28.0 15.0 - 1.0 0.5 1.8 - 0.9 - - - - - - - -Country Lake 07/13/05 I 6.4 6.9 1.5 13.1 17.7 35.6 - - - 1.2 - - 15.1 - 0.9 - 0.6 - 0.9 -Atsion Lake 08/12/04 II - 5.9 1.8 24.6 2.2 29.2 2.2 8.1 16.1 6.4 - - - - 3.7 - - - - -Maple Lake 09/21/05 II - - - - - - - 11.3 - - - 10.2 - - - 71.0 7.5 - - -Batsto Lake 08/24/05 II - - 0.2 70.8 1.3 3.3 1.2 8.7 0.4 8.4 - - - - 0.3 - 5.3 - - -Success Lake 09/05/03 II 0.6 7.0 9.9 - 41.2 10.2 - 23.5 - 1.8 - 4.7 - - - - 1.0 - - -Egg Harbor City Lake 09/14/05 III 3.3 7.7 3.4 35.6 29.8 10.8 - 1.6 - 7.9 - - - - - - - - - -Mimosa Lake 08/19/05 III - 8.9 - 11.9 1.1 30.2 - - - - - - - - 3.1 5.6 38.0 - - 1.1Lake Fred 07/22/04 III - 0.7 - 31.3 40.9 3.7 - - - 2.3 - 6.6 1.3 - 1.2 0.1 12.0 - - -Kettle Run Imp. 09/15/04 III 0.5 0.7 - 39.4 13.9 25.5 - - - - - 7.0 - - 3.5 5.8 2.3 - - 1.4Lake Albert 09/16/04 IV 0.4 - 0.3 8.0 0.3 17.6 - 2.2 - 1.7 - - - - 17.7 50.7 1.1 - - -Cushman Lake 08/26/04 IV - - - - - 0.7 - 3.2 - - 0.5 - - 2.4 20.5 65.4 1.6 1.4 0.1 4.2Davenport Imp. 08/17/05 IV - 5.7 1.7 - 42.1 8.8 - - 3.8 1.3 - 1.0 - - 8.2 17.3 10.1 - - -Turn Mill Pond 09/11/03 IV - 1.3 - - - 31.3 - 7.6 - 9.5 2.0 - - 6.5 - 30.0 11.8 - - -Shadow Lake 09/22/04 V 3.2 1.5 9.1 - 34.5 32.2 - - 7.8 5.1 - 1.3 - - 2.0 3.2 - - - -Paradise Lake 09/02/04 V - - 0.6 27.7 6.1 1.8 - 3.9 29.7 20.0 0.3 1.2 - - - 3.9 2.2 2.7 - -Sunset Lake 07/20/05 V - - 2.0 - 6.2 6.7 - - - 16.1 - 3.0 - - 5.9 7.0 50.8 2.2 - -Crane Lake 07/21/05 V 0.6 1.6 1.4 - - 2.9 - 40.2 0.6 7.8 - - 13.9 - 8.8 3.7 18.7 - - -Lady’s Lake 08/04/04 V - 0.3 - 49.3 12.5 2.0 - - 0.6 7.3 - 0.3 - - 0.3 14.0 12.1 1.2 - -Jennings Lake 08/05/04 V - - 0.7 - - - - 75.6 0.3 11.6 3.7 3.0 0.3 - - 3.3 1.4 - - -Indian Mills Lake 07/28/04 V - - 2.1 - - 23.8 1.3 - 3.9 - - 1.0 0.6 - 22.3 43.5 1.5 - - -Hammonton Lake 07/29/04 V - - - - - 5.8 - 5.6 - 0.8 - - - - 12.3 24.1 14.1 33.5 1.7 2.1

Appendix 9. Anuran-abundance values for 30 impoundments in the New Jersey Pinelands. Abundance values represent the number of vocalizing adults up to a maximum of ten individuals. For carpenter frogs and bullfrogs, shaded values indicate that larvae were present. Weather codes are 0 = clear, 1 = cloudy, 2 = overcast, 3 = fog/haze, 4 = breezy, 5 = drizzle, 6 = constant rain, 7 = showers, 8 = thunder storm occurred within one hour, and 9 = thunderstorm. Impoundments are ordered by increasing percentage of altered land within each land-use group. Refer to Table 1 for the range of altered-land percentages assigned to each group, Table 2 for explanation of biogeographic classifications, and Appendix 1 for impoundment-site descriptions.
Restricted- native
Species
Widespread- native
Species Nonnative
Species
Impoundment Land
-use
Gro
up
Surv
ey D
ate
Tim
e
Wea
ther
Air
Tem
p. (d
eg. C
)
Rel
ativ
e H
umid
ity (%
)
Hyl
a an
ders
onii
(Pin
e B
arre
ns tr
eefr
og)
Rana
vir
gatip
es
(car
pent
er fr
og)
Bufo
woo
dhou
sii f
owle
ri
(Fow
ler’
s toa
d)
Rana
cla
mita
ns m
elan
ota
(gre
en fr
og)
Rana
utr
icul
aria
(s
outh
ern
leop
ard
frog
)
Acri
s c. c
repi
tans
(n
orth
ern
cric
ket f
rog)
Rana
cat
esbe
iana
(b
ullfr
og)
Howardsville Imp. I 06/14/05 11:10 PM 0 23.5 86.5 3 10 - 10 1 - 1 Pilgrim Lake I 06/05/05 11:23 PM 0 21.0 90.0 - 10 2 2 - - - Bamber Lake I 06/14/05 10:33 PM 0 26.0 76.5 3 10 5 3 - - 1 Oswego Lake I 06/05/05 9:32 PM 0 22.5 82.5 - 10 3 - - - - Pakim Pond I 06/05/05 9:30 PM 0 22.5 82.5 - 10 7 1 - - - Lake Absegami I 06/05/05 11:40 PM 0 20.5 90.0 4 6 4 1 3 - - Wells Mills Lake I 06/14/05 11:40 PM 0,4 27.0 78.0 - - 2 10 - - - Chatsworth Lake I 06/05/05 9:53 PM 0 22.0 82.5 - 6 3 2 - - - Horicon Lake I 06/14/05 9:55 PM 0 27.5 70.5 - 10 5 - - - 1 Country Lake I 06/05/05 8:43 PM 0 25.0 76.5 - - 2 - - - - Atsion Lake II 06/09/05 9:05 PM 1,4 24.5 84.0 - 3 4 3 - - - Maple Lake II 06/07/05 10:25 PM 0 22.0 90.5 - - 2 8 - - 8 Batsto Lake II 06/05/05 12:10 AM 0 20.5 90.0 - 10 2 1 - - 1 Success Lake II 06/14/05 9:25 PM 0 27.0 70.5 - 10 6 2 - - - Egg Harbor City Lake III 06/07/05 9:25 PM 0,4 25.5 74.0 - 10 2 4 2 - 1 Mimosa Lake III 06/28/05 9:07 PM 2,4 24.5 84.0 - - 1 5 - - 2 Lake Fred III 06/07/05 9:40 PM 0 25.5 76.5 - - 5 - 1 - 4 Kettle Run Imp. III 06/09/05 11:15 PM 0,4 24.0 84.0 - 8 - 10 1 - - Lake Albert IV 06/07/05 11:25 PM 0,4 24.0 80.0 - - - 3 - - 3 Cushman Lake IV 06/07/05 11:40 PM 0,4 24.5 76.5 - - 5 1 - - 2 Davenport Imp. IV 06/14/05 10:20 PM 0 28.0 71.0 - 10 - - - - 3 Turn Mill Pond IV 06/14/05 9:00 PM 0 27.0 70.5 - - 6 5 - - 3 Shadow Lake V 06/09/05 9:35 PM 1,4 24.0 84.0 - - - 6 - - 2 Paradise Lake V 06/05/05 12:50 AM 0 20.0 90.0 - 4 2 4 - - 7 Sunset Lake V 06/07/05 12:25 AM 0 23.0 86.5 - - 1 - - - 5 Crane Lake V 06/07/05 12:10 AM 0 23.0 86.5 - 4 2 4 - 10 6 Lady’s Lake V 06/09/05 10:10 PM 1 23.5 84.0 - - 3 4 - - 4 Jennings Lake V 06/09/05 11:40 PM 0,4 23.5 86.5 - - - 10 - - 9 Indian Mills Lake V 06/09/05 9:18 PM 1,4 24.5 80.0 - - - 3 - - 4 Hammonton Lake V 06/07/05 1:05 AM 0 23.0 88.0 - - - - - 2 4
71