
Variation in Soil Properties and Topographic Roughness of ...
110
Variation in Soil Properties and Topographic Roughness of Stabilized Sand Dunes in the Central Great Plains, USA: Implications for Susceptibility to Reactivation By KEVIN G. McKEEHAN A thesis submitted for the partial fulfillment of the requirements for the degree of MASTER OF SICENCE (GEOGRAPHY) At the UNIVERSITY OF WISCONSIN-MADISON 2018 Date of final thesis defense: December 6, 2018 The thesis is approved by the following members of the Final Thesis Committee: Joseph A. Mason, Professor, Geography Erika Marín-Spiotta, Associate Professor, Geography Ken Keefover-Ring, Assistant Professor, Botany and Geography
Transcript of Variation in Soil Properties and Topographic Roughness of ...

Variation in Soil Properties and Topographic Roughness of Stabilized Sand Dunes in the Central Great Plains, USA:
Implications for Susceptibility to Reactivation
By
KEVIN G. McKEEHAN
A thesis submitted for the partial fulfillment of the requirements for the degree of
MASTER OF SICENCE (GEOGRAPHY)
At the
UNIVERSITY OF WISCONSIN-MADISON
2018
Date of final thesis defense: December 6, 2018 The thesis is approved by the following members of the Final Thesis Committee:
Joseph A. Mason, Professor, Geography Erika Marín-Spiotta, Associate Professor, Geography Ken Keefover-Ring, Assistant Professor, Botany and Geography

ii | P a g e
TABLE of CONTENTS
TABLE of CONTENTS ..................................................................................................................................................... ii
LIST of FIGURES ......................................................................................................................................................... iii
LIST of TABLES ........................................................................................................................................................... v
ACKNOWLEDGEMENTS ................................................................................................................................................ vii
ABSTRACT .............................................................................................................................................................. viii
CHAPTER 1: Introduction and Literature Review .............................................................................................................. 1
CHAPTER 2: Study Areas and Methods ......................................................................................................................... 19
CHAPTER 3: Results .................................................................................................................................................. 39
CHAPTER 4: Discussion and Conclusions ....................................................................................................................... 87
REFERENCES ............................................................................................................................................................ 95

iii | P a g e
LIST of FIGURES 1. Research Study Areas ................................................................................................................. 29
2. Typical Climograph for Sand Hills Region............................................................................... 30
3. Research Study Areas: Nebraska Sand Hills Lord Ranch Site ............................................. 31
4. Research Study Areas: Nebraska Sand Hills Milepost 81 Site ........................................... 31
5. Research Study Areas: Imperial Dunefield Site...................................................................... 31
6. Research Study Areas: Lincoln Dunefield Site ......................................................................... 31
7. Research Study Areas: Sioux Dunefield Site ........................................................................... 31
8. Pedologic Color of Soil Profiles (Horizons A through Ab) for All Dunefield Sites ........... 46
9. Boxplot Profiles of Mean Particle Size Data by Horizon by Dunefield ............................ 55
10. Boxplot Profiles of Modal Particle Size Data by Horizon by Dunefield ........................... 56
11. Vertical Profiles of Particle Size Data by Horizon by Dunefield ....................................... 57
12. Vertical Profiles of Sand and Silt Data by Horizon by Dunefield...................................... 57
13. Loss-on-Ignition (LOI) Percentage by Horizon by Dunefield ................................................ 61
14. Ratio of LOI% A:C Horizon by Dunefield ................................................................................ 61
15. Loss-on-Ignition (LOI) Percentage by Horizon boxplots by Dunefield ............................... 61
16. Soil Organic Carbon% (SOC), Nitrogen%, and Carbon%-to-Nitrogen% Ratio by Horizon
by Dunefield ................................................................................................................................. 66
17. Regression Analysis of Soil Organic Carbon% (SOC) – Loss-on-Ignition% (LOI) Results .... ......................................................................................................................................................... 66
18. Boxplot Profiles of Soil Organic Carbon% Data by Horizon by Dunefield ..................... 67
19. Boxplot Profiles of Soil Nitrogen% Data by Horizon by Dunefield ................................... 68
20. Cation Exchange Capacity (CEC) by Horizon by Dunefield ................................................ 72
21. Boxplot Profiles of Cation Exchange Capacity (CEC) by Horizon by Dunefield ............. 72
22. Hillshade, Standard Deviation of Elevation, and Standard Deviation of Slope Maps for the Imperial Dunefield Sites .............................................................................................................. 79

iv | P a g e
23. Hillshade, Standard Deviation of Elevation, and Standard Deviation of Slope Maps for the
Lincoln Dunefield Sites ................................................................................................................. 79
24. Hillshade, Standard Deviation of Elevation, and Standard Deviation of Slope Maps for the Lord Ranch Sand Hills Sites ........................................................................................................ 80
25. Hillshade, Standard Deviation of Elevation, and Standard Deviation of Slope Maps for the Milepost 81 Sand Hills Sites ...................................................................................................... 80
26. Hillshade, Standard Deviation of Elevation, and Standard Deviation of Slope Maps for the Sioux Dunefield Sites ................................................................................................................... 81
27. Standard Deviation of Elevation and Standard Deviation of Slope Comparisons by Dunefields, Values for Individual Sites ..................................................................................... 81
28. Standard Deviation of the Three Curvature Metrics by Dunefields ................................... 82
29. Regression Analysis of Different Surface Roughness Metrics by Dunefields ..................... 82
30. Simple Linear Regression Analysis for Standard Deviation of Elevation and Soil Variables ......................................................................................................................................................... 85
31. Simple Linear Regression Analysis for Standard Deviation of Curvature and Soil Variables ......................................................................................................................................................... 86
32. Simple Linear Regression Analysis for Standard Deviation of Slope and Soil Variables .. ......................................................................................................................................................... 87

v | P a g e
LIST of TABLES 1. Climate Date for Research Study Areas .................................................................................. 29
2. Pedologic Description of Soil Profiles for Imperial Dunefield Sites .................................... 41
3. Pedologic Description of Soil Profiles for Lincoln Dunefield Sites ....................................... 42
4. Pedologic Description of Soil Profiles for Sand Hills Lord Ranch Sites .............................. 43
5. Pedologic Description of Soil Profiles for Sand Hills Milepost 81 Sites ............................ 44
6. Pedologic Description of Soil Profiles for Sioux Dunefield Sites ......................................... 45
7. Mean Soil Horizon Thickness (cm) by Dunefield Site ............................................................. 45
8. Particle Size Data for Soil Profiles in the Imperial Dunefield.............................................. 50
9. Particle Size Data for Soil Profiles in the Lincoln Dunefield ................................................. 51
10. Particle Size Data for Soil Profiles in the Sand Hills Lord Ranch Sites .............................. 52
11. Particle Size Data for Soil Profiles at the Sand Hills Milepost 81 Sites ............................ 53
12. Particle Size Data for Soil Profiles at the Sioux Dunefield .................................................. 54
13. Mean and Modal Soil Particle Size (µm) by Dunefield ........................................................ 54
14. Loss-on-Ignition (LOI) Values for Soil Profiles for the Imperial, Lincoln, and Lord Ranch Sites
......................................................................................................................................................... 59
15. Loss-on-Ignition (LOI) Values for Soil Profiles for the Milepost 81 and Sioux Sites ........ 60
16. Soil Organic Carbon (SOC) and Nitrogen Values for the Imperial, Lincoln, and Lord Ranch Sites ................................................................................................................................................ 64
17. Soil Organic Carbon (SOC) and Nitrogen Values for the Milepost 81 and Sioux Sites .... ......................................................................................................................................................... 65
18. Cation Exchange Capacity (CEC) Values for the Imperial, Lincoln, and Lord Ranch Sites .. ......................................................................................................................................................... 70
19. Cation Exchange Capacity (CEC) Values for the Milepost 81 and Sioux Sites ............... 71
20. Summary of One-Way ANOVA Results with Dunefield as the Factor .............................. 74
21. Summary of One-Way ANOVA Results with Horizon as the Factor .................................. 74

vi | P a g e
22. Summary of Two-Way ANOVA Results with Dunefield and Horizon as the Factors ...... 74
23. Results of Geomorphic Analyses for All Dunefield Sites from 10m DEMs ......................... 78
24. Results of Geomorphic Analyses for the Imperial Dunefield and Lord Ranch Sand Hills Sites from 2m LiDAR-based DSMs (where available) .................................................................... 78
25. Summary of Regression Analyses R2-Scores .......................................................................... 82

vii | P a g e
ACKNOWLEDGEMENTS This thesis would not be possible without the assistance of many people, in ways large and small.
Foremost, I’d like to thank my advisor, Joseph Mason, for his wise guidance, bottomless patience,
flexibility in matters academic and personal, and for answering hundreds of questions, always
promptly. He took two different chances on me and never made me feel as though I didn’t
belong in academia. I would also like to thank the other members of my thesis committee: Erika
Marín-Spiotta and Ken Keefover-Ring. Dr. Marín-Spiotta provided me with scientific guidance at
key moments, important suggestions, and the use of her laboratory. Dr. Keefover-Ring supplied
me with early encouragement during my time here at the University of Wisconsin-Madison.
Several others in the Department of Geography need to be recognized for their contributions to
this research and my advancement. I would like to thank the Trewartha Graduate Research
Award committee for providing me with the funds to conduct field research in Nebraska. Further,
I am gratefully indebted to the two graduate student coordinators during the last few years:
Sharon Kahn, who got me started, and Marguerite Roulet, with whom I finished. Ann Olsson
helped me with the carbon and nitrogen experiments and in learning laboratory protocols. Laura
Szymanski provided crucial advice along the way. In addition to those individuals, many people
at this fine university provided important assistance, including Lisa Naughton, Matthew Turner, A-
Xing Zhu, Jack Williams, Lucas Zoet, Shaun Marcott, Meghan Kelly, and Zhe Yu Lee, and many
others. The University of Wisconsin-Madison is a special place and I am eternally appreciative
for what I have learned here and to be forever connected to this institution.
Finally, but not in the least, I’d like to thank my parents, Gene and Vickie McKeehan, for their
unwavering support of this dream. Likewise, I’d like to thank my sons, Finley and Kellan, who
helped me in the field, and for Noah who very much wanted to go. I’d also like to offer my
deepest appreciation to Dr. Menglin Wang for support in ways that cannot be overestimated.

viii | P a g e
ABSTRACT With a warming global climate, regional climates will undergo changes to their temperature,
precipitation, and wind regimes. Consequently, the potential exists for these shifting
climatological conditions to affect dunefields across the globe. Sand dunes are found in two
states – active and stable, or unvegetated and vegetated, respectively – and the activation of
previously stable dunes could have serious ramifications for communities and ecosystems. Yet, the
mechanisms of dune reactivation and stabilization are not fully understood.
In research presented here, the links between dune and soil variables and dune status are
explored within four dunefields in the state of Nebraska on the central North American Great
Plains. Specifically, the links between soil particle size, loss-on-ignition (LOI), cation exchange
capacity (CEC), soil carbon and nitrogen, and dune surface roughness, which is interpreted as a
proxy for relatively recent dune activity, are examined from soil samples taken in the field and
GIS analyses. Results show that dunes suspected of a more recent activity because of their
rougher surface topography, contain fewer fine particles in surface soils and have low levels of
the other soil variables, indicating relatively weak pedogenesis. Likewise, dunes that are
surficially smoother and therefore assumed to have been more stable in recent times, have surface
soils containing more fine particles, more soil organic carbon, nitrogen, LOI, and a greater CEC.
These results suggest pedogenic-geomorphic feedbacks which may incline stable dunes toward
increased stabilization and recently active dunes toward future reactivation. For example,
frequently reactivated dunes create a choppy, rough landscape which may experience
particularly high shear stress during strong winds, making the dunes susceptible to reactivation
and less likely to undergo more significant pedogenesis including development of finer texture
and accumulation of more soil carbon. This tendency toward stabilization or reactivation has
resulted in dunefields with contrasting soil development and surface topography across the study
area, despite similar environmental settings.

1 | P a g e
Variation in Soil Properties and Topographic Roughness of Stabilized Sand Dunes in the Central Great Plains, USA:
Implications for Susceptibility to Reactivation A Research Thesis by Kevin McKeehan
December 19, 2018
CHAPTER 1: Introduction and Literature Review Introduction With a warming global climate, regional climates will undergo changes to their temperature,
precipitation, and wind intensity regimes. Consequently, the potential exists for these shifting
climatological conditions to affect dunefields across the globe. Sand dunes are found in two
states – active and stable, or unvegetated and vegetated, respectively – and the activation of
previously stable grassland dunes could have serious ramifications for communities and ecosystems
(Barchyn and Hugenholtz, 2013a; Schmeisser et al., 2009; Thomas et al., 2005). Yet, the
mechanisms of dune reactivation and stabilization in grasslands is not fully understood (Barchyn
and Hugenholtz, 2013b; Siegal et al., 2013). Research has shown dune status is dependent upon
wind strength, drought duration, and several other factors (Barchyn and Hugenholtz, 2013b;
Kocurek and Lancaster, 1999). Clearly, climate is a dominant factor (Hugenholtz and Wolfe,
2005; Mason et al., 2011, 2009; Miao et al., 2007; Xu et al., 2015) along with disturbance (Bo
et al., 2013; Meir and Tsoar, 1996) in controlling dune activity, but dune and soil geomorphology
are linked to dune status in important ways that are not fully comprehended.
In research detailed in this paper, the links between dune and soil variables and dune status are
explored. Previous studies have found that important soil and dune characteristics with regards to
dune status are soil moisture, soil texture, dune morphology, dune age, and type and composition
of vegetation cover (Barchyn and Hugenholtz, 2013b; Siegal et al., 2013; Werner et al., 2011).
This study focuses on some of these same variables with respect to the A, AC, and C horizons in

2 | P a g e
dune soils, including any paleosols – soil particle size, loss-on-ignition (LOI), cation exchange
capacity (CEC), soil carbon and nitrogen and dune surface roughness, which is interpreted as a
proxy for relatively recent dune activity, particularly in the form of blowout development.
In the dunefields of the Great Plains, some areas display a distinctly “choppy” surface
topography at spatial scales from 10s of m2 up to about 1 km2, while adjacent parts of the same
dunefield are characterized by smoother surfaces. Closer examination, especially with high-
resolution LiDAR-based elevation data, reveals that the “choppiness” is largely due to complexes
of blowouts and small parabolic dunes. Choppier, rougher surface features clearly suggest
recent local aeolian reworking of the dune surface. Where the surface is smoother, the
topography reflects either dune reactivation in the more distant past or the topography of larger
dune forms. Even smooth dune forms could contain localized roughness that could represent older
blowouts and small dunes that have been made less distinct by local redistribution of soil by
bioturbation, rainsplash, or slopewash.
The basic hypothesis underlying this study proposes that finer soil textures, significant organic
carbon and nitrogen accumulation, and greater CEC and LOI, together indicating modestly
advanced pedogenesis, would be observed on smoother dunes with less indication of recent
activity. Conversely, it was expected that areas exhibiting a rougher dune surface will display
minimal to very weak soil development, including a coarser texture, a lack of organic carbon and
nitrogen accumulation, and low CEC and LOI. This hypothesis is based on the assumption that
longer-term dune stability provides more time for soil and plant community development, which
would have fostered the conditions allowing soil organic carbon and nitrogen accumulation.
Moreover, once colonized by grasses, the vegetated dune surface would trap fine aeolian dust
dominated by silt and clay particles, which would contribute to higher CEC along with the
accumulation of more organic matter.

3 | P a g e
Importantly, this hypothesis implies that persistent dune stability should enhance productivity of the
grassland ecosystem and allow vegetation growth to more effectively compete with aeolian
erosion and deposition, by increasing availability of nutrients and water (plant water availability
was not measured in this study but is assumed to increase with silt and clay content). In other
words, dune stability should lead to conditions favoring persistence of stability in a positive
feedback. The opposite would be true of more active dunes, which due to their lack of stabilizing
soil features would have a persistently low threshold for reactivation. As a result of reactivation,
silt-sized dust particles would quickly be re-entrained by the wind, maintaining a coarse soil
particle size, lower CEC, and less moisture retention. Frequent reactivation would also limit
organic carbon and nitrogen accumulation and limit LOI.
In work conducted in dunefields in the central North American Great Plains and presented here,
the hypothesis of the study was largely supported, with exceptions. Areas of suspected relatively
recent dune activity exhibited significant differences in the targeted variables from those areas
where the most recent dune activity may have occurred earlier in the Holocene. Regional
dunefields may exhibit significant differences in sedimentary characteristics, echoing recent studies
examining the geochemical provenance of aeolian sand in dunefields and downwind loess in the
central Great Plains (Muhs, 2017; Yang et al., 2017). These differences may influence the rate
and magnitude of pedogenesis on the dunes, potentially complicating identification of
relationships between dune stability and pedogenesis. To encompass at least some of the
possible range of sedimentary variation, samples were extracted from sites in four distinct
dunefields in the US state of Nebraska – the Nebraska Sand Hills, the Imperial Dunefield, the
Lincoln Dunefield, and an area termed here as the Sioux Dunefield. These four dunefields, which
are largely inactive at present, but have been active several times since the late Pleistocene, are
spatially separate, spread over an area of nearly 65,000 km2, but they are often grouped
together in meta-analyses (Halfen and Johnson, 2013).

4 | P a g e
The results presented here reveal potential differences between these dunefields with regards to
variables representing soil development. Each of the four dunefields exhibited a distinct pattern
of variation by horizon for soil particle size, LOI, CEC, and organic carbon and nitrogen. This
suggests possible effects of different parent materials, related to different provenance, and/or
differing regional histories of dunefield activity and pedogenesis. These two findings – that 1)
soil and surface differences exist between more active and more stable dunes and that 2)
dunefields in relative regional proximity are potentially distinct – might enable a better
understanding of the mechanisms that control aeolian system and dunefield state, as proposed by
Kocurek and Lancaster (1999) and Barchyn and Hugenholtz (2013b). The results here possibly
detect patterns and variable relationships in these four grassland dunefields. As stabilized
grassland dunefields, such as those found on the Great Plains, are sensitive to drought and
reactivation, linking soil and dune characteristics to dunefield state and recent history of
reactivation could assist researchers to understand how these landscapes will respond to climate
change in the future and perhaps make sensitivity predictions.
Literature Review The reactivation of stabilized grassland sand dunes as the result of a warming global climate is a
significant concern. The active movement of massive amounts of sand is a destructive force to
communities and ecosystems (Barchyn and Hugenholtz, 2013a; Knight et al., 2004; Loope et al.,
1999; Schmeisser et al., 2009; Thomas et al., 2005; Wang et al., 2016), while a warming global
climate presents challenges for soil resources (Adewopo et al., 2014). The destructive forces of
aeolian sand in arid and semiarid lands have altered agricultural processes, displaced peoples,
destroyed infrastructure, and caused ecosystem migrations and adaptations. In some semiarid
regions, where stabilized sand dunes are found, global climate models show the potential for
warming this century, possibly driving dune reactivation in those landscapes (Feng and Fu, 2013).

5 | P a g e
These sensitive semiarid regions include grasslands of stabilized dunes which were once active
during drought conditions in the Holocene and/or Late Pleistocene and, consequently, could be
reactivated in response to increased warming and aridity in the future. The grasslands of
southern Africa’s Kalahari Desert, for example, could transition completely to active dunes by
2099, according to model simulations (Thomas et al., 2005), although the results of other models
show a low probability for mass reactivation in the region (Ashkenazy et al., 2012), and still other
analyses suggest a variety of responses in arid environments to climate change (Gremer et al.,
2015). Regardless of the scale of reactivation in the Kalahari Desert, currently stable grassland
dunes there will likely become active at an increasing rate in this century. The results of such a
transition would include the degradation of soil, the collapse of agricultural systems, and a decline
in air quality due to the effects of airborne dust and aeolian deposition (Thomas et al., 2005). A
recent study focusing on the mid-North American continent underscored these threats for the Great
Plains. Researchers reconstructed the historic regional megadroughts of the Holocene, which
coincided with active sand events in the Great Plains, and identified the extent of drought
conditions that led to the collapse of major prehistoric cultures (Cook et al., 2016).
One grassland region comprised mostly of stabilized dunes is the west central Great Plains of
North America, specifically the western two-thirds of the US state of Nebraska. This region
included the Nebraska Sand Hills and associated nearby dunefields. The Sand Hills, which are
the largest stabilized dunefield in North America, and the smaller dunefields nearby are sensitive
to changes in temperature, precipitation, and wind potential and, thus, provide geologic evidence
of environmental and climatic change during the late Quaternary period (Forman et al., 2001;
Mason et al., 2011). Researchers have studied this region closely to determine the nature of
Quaternary climates, grassland dune response, and aeolian processes. In times of sustained
drought or other conditions limiting growth of dune-stabilizing vegetation during the Pleistocene
and Holocene, studies have shown the Sand Hills mobilize into active dunes, while stabilizing in

6 | P a g e
response to more favorable conditions for plant growth (Ahlbrandt et al., 1983; Halfen and
Johnson, 2013; Mason et al., 2011, 2004, 2003).
Signals left in dune sand, paleosols, and associated downwind loess by these megadroughts and
wet periods are evidence for the grassland dune sensitivity in the Sand Hills and Great Plains
regions. Using optically stimulated luminescence (OSL) and radiocarbon (14C) methods, along with
geomorphological observations, evidence of significant droughts throughout and prior to the
Holocene can be found in stabilized grassland dune sands (Forman et al., 2008, 2005, Halfen et
al., 2016, 2012; Halfen and Johnson, 2013; Hanson et al., 2010, 2009; Mason et al., 2004;
Miao et al., 2007; Puta et al., 2013). Dating of eolian sand within stabilized dunes suggested
significant dune activation affected the region between 20-25ka (Mason et al., 2011), in the
early-mid Holocene, after 9-11 ka (Halfen and Johnson, 2013), and at several later times during
the Holocene. Significant drought events across the Great Plains occurred within the last 1,500
years, activating stabilized sand dunes that reflected a response to episodically drier conditions
(Forman et al., 2008, 2005; Halfen et al., 2012; Hanson et al., 2009; Mason et al., 2004, 2003).
Sand activation occurred during important climatic events such as the Medieval Climatic Anomaly
(MCA) (Forman et al., 2008, 2005; Halfen et al., 2012; Mason et al., 2004; Miao et al., 2007;
Schmeisser McKean et al., 2015; Schmeisser et al., 2010) and, more recently, the event in the
1930s known as the Dust Bowl (Forman et al., 2008, 2005), although the effects from this latter
event were far more pronounced in the southern Great Plains (Worster, 1982) and may not have
reactivated dunes in the state of Nebraska (Cronin and Beers, 1937). The arid event 800 to
1,000 years ago coinciding with the MCA was also accompanied by a shift in spring-summer
prevailing winds, from moisture-laden southern winds from the Gulf of Mexico to southwesterly
dry winds (Sridhar et al., 2006), underscoring the sensitivity these landscapes have to changes in
climate. The entire Great Plains region has this susceptibility to drought and climate change. For
example, dunefields to the east (Hanson et al., 2009), to the south (Arbogast, 1996; Hanson et

7 | P a g e
al., 2010; Werner et al., 2011), and farther west in Colorado have histories of Holocene and
Pleistocene dune activity as well (Clarke and Rendell, 2003; Muhs et al., 1996). One study from
Colorado suggested a geomorphic boundary defined by climate exists between more active
northeastern Colorado dunefields and the dunefields of Nebraska (Muhs and Maat, 1993), the
latter of which are the focus of this study.
Further evidence for many of these droughts can be found in loess deposits mantling landforms
downwind of the Sand Hills. Loess is a generally silt-sized material deposited via aeolian means
(Brady and Weil, 2010; Schaetzl and Anderson, 2005), although definitions for loess vary
(Follmer, 1996). Silt-sized grains are transported in suspension, potentially high above the
ground surface, in contrast to larger, coarser particles, such as sand, which saltates and creeps
across the surface (Bagnold, 1941). Initially proposed to be exclusively glacial in origin, loess
often is a product of fine material resulting from glacial abrasion and deposited by glacio-fluvial
processes (Chamberlin, 1897). Yet, some loess has been classified as “desert loess”, a fine
material with origins upwind in sand dunes and eroded bedrock (Smalley and Vita-Finzi, 1968).
Although the origin of loess downwind from the Sand Hills in central and eastern Nebraska has
been disputed in the past (Follmer, 1996; Lugn, 1968; Winspear and Pye, 1995), more recent
work demonstrates that most of it is of nonglacial origin, ultimately derived from rocks cropping
out in unglaciated areas of western Nebraska, South Dakota, and Wyoming (Aleinikoff et al.,
2008; Yang et al., 2017). Thickness and grain size trends demonstrate that much of the loess was
last entrained by the wind within the Sand Hills, however, where it was temporarily deposited on
its way from more distant sources (Mason, 2001; Mason et al., 2003). This observation implies
that the dunes and loess are geomorphically linked, with the loess only likely to have been re-
entrained from the dunes and deposited farther downwind if the dunes were active (Mason,
2001), and OSL dating of dunes and loess confirm that episodes of dune activity and rapid loess
accumulation were approximately synchronous (Mason et al., 2011; Miao et al., 2007).

8 | P a g e
Conversely, buried paleosols found between distinct loess and sand layers throughout the Great
Plains represent signals of warmer, wetter climatic periods in which grassland sand dunes and
loess deposition slowed or ceased. The Brady Soil, a paleosol found throughout much of the loess
region of the central Great Plains, represents a wetter interlude in the late Pleistocene to early
Holocene, during which the Sand Hills largely stabilized and loess deposition slowed to low rates
(Marin-Spiotta et al., 2014; Mason et al., 2011, 2008).
The tendency of stabilized sand dunes in the Great Plains in general, and the Sand Hills region in
particular, to respond to climatic warming and drought events by reactivation is important for this
study and in the context of predicted atmospheric conditions for the remainder of this century.
Some regional climate models focusing on the mid-North American continent predict a rise in mean
annual temperature (MAT) and aridity in the region (Feng and Fu, 2013; Galatowitsch et al.,
2009; King et al., 2015; Ray et al., 2008). Unfortunately, precise predictions for the Sand Hills
region of the Great Plains are difficult to ascertain, as the granularity of some models is
relatively coarse. Nevertheless, some generalized predictions are useful background this thesis.
One study compared the results from climate prediction models for the late 21st Century with the
megadrought conditions during the MCA and found the southern and central Great Plains would
likely enter a period of severe episodic drought surpassing the MCA conditions by the year 2050
(Cook et al., 2015). A study focusing on climate change to the northeast of the Sand Hills found a
likely rise in MAT of 3°C with a nominal increase in mean annual precipitation (MAP)
(Galatowitsch et al., 2009). The study found the most analogous present-day climate for the US
state of Minnesota in 2070 to be the current climate regime of northeastern Kansas and northern
Missouri. Research focusing on the far western edge of the thesis study area also found a rise in
average summer and winter temperatures for northeast Colorado by 2050 (Ray et al., 2008).

9 | P a g e
Other, more granular models supported a moderate rise in aridity for the Great Plains (Feng and
Fu, 2013; King et al., 2015).
If these studies were to come to fruition, climate trends might tend toward episodic drought or
could perpetuate a climatic bifurcation of Great Plains region. Currently, the state of Nebraska
sits astride a climate divide roughly along the 98th-100th meridians, with the eastern plains
located in the humid continental climate zone and the western extent in a semiarid climate zone
(Hanson et al., 2009; May, 2003). With climate models predicting a rise in MAT and MAP for
areas just east of the Sand Hills and a decrease in precipitation in the western extremities of the
study area, it would seem possible the temperature and precipitation gradient running
longitudinally through the state will deepen, with the Sand Hills and nearby dunefields potentially
straddling this gradient. Such changes also would herald a likely alteration of the current local
ecosystem of the Sand Hills and disturb agricultural yields, according to modeling (Ko et al.,
2012; Williams et al., 2007). Currently, the Sand Hills and dunefields of this study are astride
unique ecotones between the mixed and tallgrass prairies of eastern Nebraska’s loess plains and
the sandsage prairies of the state’s far western scrublands (Dunn et al., 2016). The primary plant
communities of the Sand Hills and the nearby dunefields have been designated as Sand Hills and
sandsage grasslands and include species uniquely adapted to high sand contents in soil and
dunefield morphology.
For these reasons, the Sand Hills and associated nearby dunefields of this study provide the
opportunity to research stable grassland dune systems. Yet, the causes of dune reactivation in
stabilized grassland dune systems are still not fully understood (Barchyn and Hugenholtz, 2013b;
Siegal et al., 2013), but several factors are linked and influence each other. Dune reactivation
has been postulated to be a function of climate, disturbance, and/or soil characteristics (Barchyn
and Hugenholtz, 2013b). Attempts to understand the importance and interaction of these factors

10 | P a g e
has led to the formulation of theoretical models that attempt to conceptualize dune formation,
movement, morphology, and status as a system (Bagnold, 1941; Barchyn and Hugenholtz, 2013b;
Kocurek and Lancaster, 1999). Bagnold (1941) studied the conversion of aeolian deposits into
dunes and proposed a series of sand dune types. Kocurek and Lancaster (1999) viewed the
dunefield system on both temporal and spatial scales, explaining the development of a dunefield
and its state at a given time as the result of complex interactions between the supply of sediment
(often originally from sources distant from the dunefield basin), the availability of the sediment for
wind transport (often controlled by vegetation), and the potential of the wind to transport sand.
They identified nine categories of dune state based on the local sediment supply, sediment
availability, and transport capacity, as well as time lags in sediment influx. Barchyn and
Hugenholtz (2013b) conceived of a state factor model focused on current dune state with a goal
of forecasting potential for reactivation. They classified four stages of dune state from stable to
active based on dune vegetation and a geomorphological examination of dunefield blowouts.
This approach has the benefit for this study to be temporally contemporary with an eye cast
toward reactivation potential.
Other pertinent research focused less on dunefield system dynamics and more on response to
climate. The reduction of vegetative cover on dunes, resulting in dune reactivation, has been
linked to prolonged drought or episodic aridity in several studies (Mason et al., 2004; Miao et
al., 2007; Muhs and Holliday, 2001; Siegal et al., 2013). The inverse effect was discovered in
dunes which had stabilized due to decreased wind potential, leading to the advance of
vegetation (Xu et al., 2015), further reinforcing the link between climate and dune activity.
Research involving grassland dune systems in Alberta and Saskatchewan found that dunes tended
toward a stabilized status within the last 200 years due primarily to rising MAT — possibly
through the effect of a longer growing season on the competition between vegetation growth and
sand movement — as well as less arid conditions (Wolfe and Hugenholtz, 2009).

11 | P a g e
Despite these studies linking dune activity to climatic factors including moisture availability, wind
strength, and temperature or growing season length, it does not appear likely that simple
thresholds defined by, e.g., available moisture or wind strength can fully explain the state of
dunefields. A widely-used model to predict dune activity based solely on such climatic thresholds
(Lancaster, 1988) sometimes fails to accurately predict the amount of activity on the ground
(Hugenholtz and Wolfe, 2005; Muhs et al., 2003; Werner et al., 2011). The persistence of bare
sand adjacent to stable grass-covered dunes under the same climatic conditions is difficult to
reconcile with the concept of simple climatic thresholds separating active and stable states (Yizhaq
et al., 2007). A study from the southwestern Great Plains in North America found that local
patches of dunes were active at times in the Late Holocene while adjacent aeolian sand sheets
were not, indicating the same kind of juxtaposition of stable and active patches in the past
(Werner et al., 2011). Research from dune fields in China suggested a lagged response between
dune activity and climatic variation (Lu et al., 2005). A study from the Negev Desert in southern
Israel found extended droughts to have more impact on arid dunes in the southern Negev than
semiarid dunes to the north that received more precipitation, suggesting a complex relationship
between climate, vegetation, and geomorphology (Siegal et al., 2013). Yizhaq et al. (2007,
2009) used relatively simple mathematical models of competition between sand transport and
vegetation to argue that bistability (coexistence of stable and active states) is a common feature
of dune systems.
Vegetation plays a key role in linking climate change to dune activity, in both simple and complex
models. Mechanically, vegetation anchors the stabilized surface crust (if present) and soil, while
also absorbing part of the wind stress and thereby reducing stress on the sand surface.
Observing a link between vegetation and dune activity, a range of studies have found that
vegetation variables were influenced by, but worked on a different temporal scale, from climate,
driving reactivation and stabilization processes. Sand flux on dunes was shown to decrease with

12 | P a g e
vegetative cover in an exponential relationship (Lancaster and Baas, 1998). A Nebraska Sand
Hills study found vegetation type was a more influential factor in controlling dune stability than
short-term fluctuations in precipitation, as the latter varied compared to the steady resilience of
prairie grasses (Sridhar and Wedin, 2009). Yet, a study from Australia found vegetation had the
capacity to respond rapidly to changes in precipitation and that sand movement and vegetative
cover were inversely related (Hesse and Simpson, 2006).
Vegetation diversity and type – primarily the colonization of C4 grasses, which are more efficient
with water usage in drier conditions and in this case also had relatively deep roots – proved key
in the stabilization of previously active dunes in a Canadian prairie (Shay et al., 2000). A
longer-stabilized site with finer-grained sand and somewhat more silt (5% vs. 0%) in the upper 5
cm was dominated by C3 grasses with shallower root systems, however. While Shay et al. (2000)
seem to have interpreted this observation as indicating eventual replacement of C4 by C3 grasses
as part of a general pattern of succession on these dunes, it can also be seen as evidence of the
influence of even small variations in soil texture on dune plant communities. Another study
observed that the ratio of live to dead vegetation on a dune is also important to dune stability, as
vegetative coverage alone was not a good indicator of whether a dune remained stabilized
during drought conditions (Siegal et al., 2013). Vegetative cover could remain extensive and
unchanged, the study found, but if the percentage of dead vegetation increased beyond a
certain threshold, the dune destabilized and reactivated despite the cover.
Additionally, vegetation was linked in some dune studies to soil characteristics, which have been
suggested as further controlling variables on dune activity. This is an area of research this thesis
aims to inform. Previous research is not in complete agreement on the effects of soil variables
such as moisture, nutrients, and particle size on dune activity, or how exactly these soil variables
are related to vegetation attributes. For example, a study of dune activity in the Great Plains

13 | P a g e
found older, stabilized dunes had undergone relatively thorough pedogenesis, specifically
through addition of finer-grained silt or clay particles that may have originated as aeolian dust
(Werner et al., 2011). Vegetation and soil mechanics moved the trapped fine-grained particles
into the soil, burying them, resulting in relatively higher soil moisture retention. This also enhanced
soil nutrients and the dunes stabilized over time. Conversely, the study concluded that dunes
lacking these finer-grained soil particles are more likely to become active during significant
drought events, even if the response is lagged (Werner et al., 2011).
Other studies support aspects of these findings from Werner et al (2011). A study reporting the
results of a controlled experiment from China found vegetated dunes could trap and accumulate
fine-grained dust (Yan et al., 2011). The amount and percentage of fine-grained silt and clay
trapped increased with the percentage of vegetative cover on the dune. Further, the trapped
fine-grained material also increased the concentrations of beneficial soil nutrients such as nitrogen
and phosphorus. Another study from China found more fine-grained particles in dunes stabilized
by shrubby vegetation and less in “mobile dunes” (Wang et al., 2005). The active dunes from this
study were nearly completely sand. At minimum, 99.6% of the active dunes were comprised of
particles >50 µm, while more stable dunes had between 0.26–36% particles <50 µm. Likewise,
a study from a sand prairie in Manitoba, Canada, found compatible results. Shay et al. (2000)
examined soil particle size in the A and C soil horizons on bare sand dunes, intermediate
landforms, and long-stabilized aeolian sands and found a modest increase in fine particle content
from bare sand through to the stable prairie sites in the top 5cm of soil. The bare sand dunes in
the study contained no measurable silt or clay particles, while the mixed intermediate sites
contained a tiny, barely measurable amount, and the sand prairie contained a modest 5%. None
of the sites sampled contained measurable silt or clay in the C horizon.

14 | P a g e
While this small but potentially significant accumulation of fines is consistent with the conclusions of
Werner et al. (2011), Shay et al. (2000) also found that observed soil moisture was greatest at
their bare dune site but decreased at recently stabilized sites. Observed soil moisture was least
at the long-stabilized site with greater silt and clay near the surface, likely due to the greater
total vegetation cover there as well greater dominance of shallow-rooted C3 grasses. Similarly, a
study in southwestern Saskatchewan found higher percentages of fine-grained material and lower
percentages of sand-sized particles in stabilized dunes versus active dunes (Hugenholtz and
Koenig, 2014). This study also noted depletion of soil moisture in stabilized grassland dunes
relative to those that were still active, attributed to greater uptake by vegetation.
The finding of lower moisture in stabilized dunes with greater silt and clay content than in bare,
active dunes may initially seem to conflict with the conclusions of Werner et al. (2011), however,
this observation largely reflects the difference in present vegetation density and degree of
depletion of soil water by plant use. If vegetation cover was established on the currently active
dunes with their minimal clay content, it is likely that plant moisture stress would be observed
earlier there than in the longer-stabilized dunes with some accumulation of fines and organic
matter. Shay et al. (2000) measured field capacity water content, the water content immediately
after free drainage of a saturated soil and before significant plant water use, at each site they
studied. Field capacity water content was significantly higher at their long-stabilized site with
higher silt and clay (30% by weight) than at active and more recently stabilized sites (18-19%).
Vegetation growing on the long-stabilized site would thus have a substantially greater reserve of
moisture during dry periods, consistent with the view of Werner et al. (2011).
Seasonal and local landscape-scale variation of soil moisture may also be important to the
persistence of dune-stabilizing vegetation. Forman et al. (2005) cited previous Great Plains
research suggesting that soil moisture reductions in winter and spring may be responsible for dune

15 | P a g e
activation. A study in the Sand Hills linked soil moisture in interdune lowlands to eventual dune
stabilization toward the end of the MCA (Schmeisser McKean et al., 2015). In some parts of the
Sand Hills, the water table was likely close to the surface even during droughts, because of
position within the regional groundwater system and distance from incised streams. As the MCA
megadrought relented, Schmeisser McKean et al. (2015) hypothesized that vegetation surviving in
those wetter interdunes allowed more rapid colonization and stabilization of nearby dunes than
occurred in other parts of the Sand Hills.
Shay et al. (2000) also found much greater contents of organic matter and nitrate, and somewhat
higher available K, in the soils at the long-stabilized site than in active dune sand, with
intermediate values at recently stabilized sites. CEC was not measured but was likely greater at
the long-stabilized site because of higher organic matter and clay content. Content of available
P did not show as much variation. These findings suggest that greater availability of some
nutrients could favor persistence of stabilizing vegetation on dunes that have been stable for
some time and have experienced some effects of pedogenesis and fine dust accumulation.
Another study sought to understand cation concentrations in dune systems with both bare sand and
vegetated dunes in coastal Brazil (Hay et al., 1981). In that study, no differences were observed
between active and stabilized dunes for the cations Na and K, but stable dunes were found to
have substantially greater concentrations of Ca and Mg, suggesting again a link between soil
development and dune state.
An additional dune variable thought to influence—or reflect—dune state is landform morphology.
The morphology of dunes is often clearly connected to vegetation cover and soil characteristics
(Barchyn and Hugenholtz, 2013b; Hack, 1941; Hesp, 2002; Hugenholtz et al., 2012; Hugenholtz
and Wolfe, 2005; Nield and Baas, 2008; Schmeisser McKean et al., 2015; Siegal et al., 2013;
Wolfe and Hugenholtz, 2009). The dunefields of the study areas – the Sand Hills plus the smaller

16 | P a g e
dunefields to the south and west – exhibit a variety of dune forms. The Sand Hills are comprised
of large transverse dunes (barchanoid ridges and megabarchans), with large linear dunes and
hummocky sand sheets in the eastern part of the dunefield and large compound parabolic dunes
at its western margin (Loope and Swinehart, 2000). Smaller linear or parabolic dunes are
superimposed on the larger forms. The Lincoln Dunefield immediate south of the Sand Hills is a
mixture of parabolic and linear dunes and hummocky sand sheets. The Imperial Dunefield, which
is to the southwest of the Sand Hills, is composed of large compound parabolic dunes (i.e. smaller
parabolic dunes superimposed on larger parabolic forms), as too is the Sioux Dunefield far west
of the Sand Hills. These dune forms reflect important controls on sand transport when the dunes
were active, and they also may have implications for stabilization and reactivation. For example,
the geomorphology of parabolic dunes – with their arms pointing upwind – is indicative of a
gradual stabilization process involving the anchoring of the parabola’s arms via the advent of
colonizing (Forman et al., 1992; Hack, 1941; Hanoch et al., 2018; Lancaster and Baas, 1998;
Reitz et al., 2010). While the genesis of large compound parabolic dunes is less well-understood,
it likely also involves a significant phase of partial vegetation. In contrast, the large transverse
dunes of the Sand Hills are typical of fully active, unvegetated desert dunes, suggesting that they
were quickly stabilized by vegetation and thus did not become transformed into parabolic forms
during the stabilization process. There is also some evidence that the geomorphology of
parabolic dunes is indicative of the ongoing presence of relatively higher soil moisture levels or a
shallow water table (Wolfe and David, 1997). Interpretation of the linear dunes common in the
Sand Hills as both superimposed and free-standing dunes is more complex, because both fully
active and partially vegetated linear dunes are observed in other settings (Pye and Tsoar, 2009).
Recent dune activity, especially patchy surficial activation in the form of blowouts, may also leave
geomorphic signals in form of choppy, rough landforms. A study of parabolic dunes in the Great
Sand Hills region of Canada found the activity of mostly stabilized dunes there left behind a

17 | P a g e
“varied and often complex terrain” (Wolfe and David, 1997). Conversely, a study from the
Negev Desert found the geomorphology of vegetated linear dunes smoothed over time, flattening
and elongating (Roskin et al., 2014). In testing the hypotheses of this thesis it is assumed that
surface roughness of dunefields is correlated to relatively recent, patchy surficial dune activation,
resulting in a choppy landscape. These choppy dunefields should also exhibit soil properties
which generally reflect a temporally shorter pedogenic period, because of more frequent
disturbance or loss of surface soils through reactivation. This surface roughness can be expressed
using different metrics of terrain, such as the standard deviation of elevation, standard deviation
of slope, and other topographic metrics (Grohmann et al., 2011).
Studies have explored related dune attributes such as dune type, aspect, and slope and how
these variables can influence the mobility and the development of geomorphic features such as
blowouts (Barchyn and Hugenholtz, 2013a; Hugenholtz and Wolfe, 2005). Blowouts are concave
depressions where bare sand is exposed by erosion on an otherwise stabilized dune surface, with
associated mounds of sand on one or two sides of the depression where the blown-out sand has
accumulated. These features are important in understanding dune stabilization and reactivation
(Barchyn and Hugenholtz, 2013a; Wolfe and David, 1997). Blowouts occur at the point of a
vegetation disturbance, where the wind burrows a depression into a stable dune, and, given wind
strength and the weakening of other controls, can override the stability of the local dune or
migrate downwind, disturbing other stable dunes. The process undoubtedly creates localized
surficial roughness and could be captured with a close investigation of dune topography.
Several studies have examined how dune geomorphology has affected other important
stabilization and reactivation variables, such as vegetation and soil properties. A study from the
Negev Desert found the reactivation and stabilization of dunes dependent on the intersection of
vegetation and geomorphic position, specifically the dune location of live grasses (Siegal et al.,

18 | P a g e
2013). Differences were found, the study noted, in vegetation coverage between dune crests,
stoss and lee slopes, and interdunes. The degree of pedogenesis on dunes in Kansas appeared to
be related partly to geomorphology, with well-developed Alfisols found on older sand sheets and
poorly-defined Entisols found on more active dunes (Werner et al., 2011).
All of these factors – climate, vegetation, soil characteristics, and geomorphology – play
interdependent roles in the state of grassland dunes in the central Great Plains, with climate the
independent variable often driving interactions among the other factors. A fifth variable
influencing grassland dune state is disturbance, either from anthropogenic alteration of the
environment, or in the form of fire or burrowing animals (Barchyn and Hugenholtz, 2013b; Bo et
al., 2013; Meir and Tsoar, 1996; Seifan, 2009). These are important forms of disturbance in
some dune fields, but they remain outside of the scope of this thesis research because of the
methods chosen. Instead, this thesis will focus on measuring soil properties and testing whether
they are related to surface roughness metrics indicative of recent surficial reactivation. If such
linkages can be found between surface roughness and soil properties, then conclusions perhaps
can be made regarding future potential for dune reactivation or continued stability.

19 | P a g e
CHAPTER 2: Study Areas and Methods Study Areas An ideal location to test the hypothesis of this thesis is in dunefields of central and western
Nebraska, United States. In this area west of the 98th meridian, where the climate transitions from
a Dfa (moist continental) to a BS (steppe) per Köppen’s classification system (May, 2003), there
are several mostly stable dunefields, including the largest stabilized grassland dunefield in North
America – the Nebraska Sand Hills (Mason et al., 2011). The Nebraska Sand Hills encompass an
area of 50,000km2 on the North American Great Plains, a sea of grass atop a vast deposit of
eolian sand. Surrounding the Sand Hills are several smaller dunefields with unique origins and
characteristics. Thus, collecting soil samples from the Sand Hills and an assortment of other
regional dunefields that share some similarities to, but are apart from, the Sand Hills should
provide a representative basis from which to test the hypothesis.
In addition to samples from the Sand Hills, samples from three other dunefields were collected
(Figure 1). Samples were drawn from sites in the Imperial and Lincoln dunefields, south of the
Sand Hills and the Platte River system, where some previous research was conducted examining
either the provenance of the parent material or dating dune activity via optically stimulated
luminescence (OSL) (Forman et al., 2005; Muhs, 2017; Muhs et al., 2000, 1996). A third
dunefield to the west of the Sand Hills was chosen, as little research had been done in the 300km
between the Sand Hills and the Casper and Ferris dunefields to the west. Within this region are
several small dunefields, such as Wyoming’s Lone Sand Hill (42.446408, -104.082583). Most of
these dunefields are unnamed, but a site was selected approximately 30km north of the
Nebraska town of Morrill, which is in the North Platte River Valley near the Wyoming border.
This site is within a dunefield located in central Sioux County, referred to in this thesis as the Sioux
Dunefield.

20 | P a g e
While the climate transitions from a Dfa (moist continental) to a BS (steppe) over western
Nebraska overall (May, 2003), the actual climate classification based on observed 1981-2010
data is more complex. None of the study sites are designated in the semiarid BS classification as
the mean annual precipitation (MAP) for all locations exceeds 10x each site’s P-threshold, a
precipitation coefficient based partly on the mean annual temperature (MAT), although the Sioux
site farthest west is nearly arid enough to qualify. Based on the recent interpretations of
Köppen’s climate classification formulae (Peel et al., 2007), all sites fall into the D climate class, a
midlatitude, continental climate featuring variability and lacking a temperate nature. In general,
MAP and MAT increase from northwest to southeast, with the driest and hottest climate belonging
to the Sioux study site. While the other sites received between 500-600mm yr-1 in precipitation
on average, precipitation near the Sioux site is roughly only two-thirds of that (Nebraska State
Climate Office, 2018). Likewise, the Sioux site’s MAT is nearly 1°C colder than the next coldest
study site (Milepost 81, taken at Cox Reservoir) and 2.5°C colder than the warmest site (Imperial).
Thus, in terms of climate, the Sioux Dunefield is somewhat an outlier from the other study sites in
this thesis, although all sites share a precipitation and temperature pattern similar to the
climograph in Figure 2 for Valentine, Nebraska – a cold, dry winter, with a warm and relatively
wet summer.
As climate transitions over the study areas, so too does vegetation. As a rule, as precipitation
decreases east to west across Nebraska, so to do the average height of the prairie grasses. The
tallgrass prairie in the wetter eastern third of Nebraska gives way to the mixed grass prairies of
central Nebraska’s loess lands, while the shortgrass steppe occurs on fine-grained soils farther to
the west. The sandy soils of dune fields in the central Great Plains are occupied by two
specialized prairie systems – the “Sandhills” and sandsage prairies (Dunn et al., 2016). The
Sandhills prairies inhabit the Sand Hills dunefield, while the sandsage prairies correspond to the

21 | P a g e
dunefields south and west of the Sand Hills, including the Imperial, Lincoln, and Sioux County
dunefields. As a result, two distinct grassland plant communities are present across the five study
areas.
Sand Hills Lord Ranch Site Owing to the size and importance of the Sand Hills, two sites were chosen in the Sand Hills for
investigation. The Lord Ranch site (Lat.: 42.61088, Lon.: -100.65524) was selected based on an
examination of aerial imagery, which suggested the ranch was home to choppy, semi-active, but
mostly stable, dunes. Its climate is classified as Dwa – humid continental with dry winters (Table
1). Meteorological data from Valentine’s Miller Field 28km north-northeast of the study site
shows the Lord Ranch site likely receives slightly more than 500mm of precipitation annually, has
hot summers and cold winters, with a MAT of 8.7.
Some studies have identified a unique plant community comprising of just the Sand Hills (Dunn et
al., 2016). This uniqueness is linked to the higher sand content of the soils and the geomorphically
high relief of Sand Hills dunes, which drives changes in vegetation. The region’s sands have high
hydraulic conductivity, which increases with depth (Wang et al., 2008) and, consequently, results
in relatively little precipitation running off the stabilized dunes (Dunn et al., 2016), except during
rare intense rainstorms or possibly where biocrusts occur (Sweeney and Loope, 2001). Thus, the
species often found in the Sand Hills have moderately deep roots (Johnsgard, 1995, p. 70).
Dunes here also have high upland relief, along with pronounced swales and blowouts. This
localized relief, often expressed as surface roughness, produces localized plant assemblages,
with Little bluestem (Schizachyrium scoparius) present throughout, sand bluestem (Andropogon
hallii) anchoring stable dune ridges, and blowout grass (Redfieldia Flexuosa) colonizing large
blowouts (Dunn et al., 2016; Johnsgard, 1995, pp. 68–76). Sand bluestem and prairie sandreed
(Calamovilfa longfolia), in particular, are often found on “choppy sand” in the Nebraska Sand

22 | P a g e
Hills (Dunn et al., 2016). Most of these grasses are amenable to grazing, especially the little
bluestem, and evidence at the Lord Ranch site suggests livestock were a recent presence as cow
tracks crisscrossed the landscape. Yet, as bison were once plentiful across the Great Plains, it is
not known how much cattle have impacted the Sand Hills (Dunn et al., 2016).
The central Sand Hills, including both the Lord Ranch and Milepost 81 sites, are dominated by
large transverse dunes with small dune forms superimposed on them (Loope and Swinehart, 2000;
Sridhar et al., 2006). The Sand Hills dune sand in general appears to have a complex origin in
an array of sources including bedrock formations to the northwest and Pliocene and modern
fluvial and aeolian sands (Muhs, 2017). Studies of regional prevailing winds show a bidirectional
aspect (Schmeisser et al., 2010; Sridhar et al., 2006). Seasonality explains this bidirectional
pattern as southerly to southeasterly winds prevail in summer while somewhat stronger northerly
to northwesterly winds are common in winter. The net sand transport direction (resultant drift
direction) is toward the south or southeast because of the greater strength of the winter winds
(Schmeisser et al., 2010; Sridhar et al., 2006), and the form of the large transverse dunes reflects
that transport direction. Smaller linear dunes, often superimposed on the large transverse forms,
commonly have a west-southwest to east-northeast orientation reflecting a stronger component of
wind from the southwest than is observed at present (Sridhar et al., 2006). That wind component
was apparently enhanced during Late Holocene dry periods when the linear dunes developed
(Schmeisser et al., 2010; Sridhar et al., 2006). Blowouts and small parabolic dunes that reflect
the most recent reactivation of the dune surfaces have orientations consistent with the modern wind
regime; that is, they provide evidence of greater transport toward the south or southeast, but with
some sand also carried out of blowouts toward the northwest or north. Samples were taken within
a large dune complex from three locations along three transects – transect CH-1A ran along a

23 | P a g e
small 10m dune, transect CH-1B was along the face of a blowout, and transect CH-1C was along
another 10m dune (Figure 3).
Sand Hills Milepost 81 Site The second of two Sand Hills sites in this study is a well-researched, large roadcut 51.5km
southwest of the Lord Ranch. The site, known as Milepost 81 (Lat.: 42.2405, Lon.: -101.032577),
is located along Nebraska Highway 97 at a 500m long perpendicular cut through one of
numerous closely spaced linear dunes superimposed on a larger transverse dune (Figure 4). The
roadcut itself is at least 12m high and provides an opportunity to examine thousands of years of
eolian deposition and activity (Mason et al., 2011; Miao et al., 2007). Dating of sand grains
using OSL techniques has shown the dune at Milepost 81 was active around ~920, ~2400, and
~13,500 years before present. The former date coincides with the Medieval Climatic Anomaly
(MCA), while the latter age, from below the base of the linear dune, is within the Pleistocene. The
linear dunes at this site have orientations consistent with the change in wind directionality during
Late Holocene dry periods such as the MCA that was inferred by Sridhar et al. (2006). The top
several meters of the roadcut is associated with linear dune formation and migration during the
MCA as well as more recent surficial reactivation, and samples were taken along three transects
(MP81-1A, MP81-1B, MP81-1C) approximately 6+ meters laterally from the dune crest.
The climate and vegetation of this site is similar to that of the Lord Ranch site, although
meteorological data from a weather station 26.5km to the west at Cox Reservoir recorded more
annual precipitation with almost 600mm on average (Table 1).
Imperial Dunefield Site Two study sites were located south of the massive Sand Hills region. The southernmost is a site in
the Imperial Dunefield (Lat.: 40.69003, Lon.: -101.68626), which is located in Chase and Perkins
counties between Frenchman and Stinking Water creeks. It is approximately 1,000km2 in size, or

24 | P a g e
2% the size of the Sand Hills. Like the Milepost 81 site, research has been conducted within and
near this dunefield. Some of this work concerned OSL dating of dune deposits to pinpoint the
dates of dune activity. Work conducted 8km northeast on the Cornelius Dune, part of the Imperial
Dunefield, found dune activity occurred at ~540, ~3000, and ~14,700 years before present
(Mason et al., 2011). The samples from that study yielding an OSL date of ~540 years before
present were taken at a soil profile depth of 1m; all samples for thesis at the Imperial site were
taken at a depth ≤1.1m, meaning that if the entire Imperial Dunefield was active at this time, then
the samples used for this thesis study would be partially from this late Holocene event.
Approximately 70km south of the Imperial study site, OSL dating from a different study on the
edge of the Imperial Dunefield returned similar Holocene dates. According to that study, dune
activity at the southern tip of the Imperial Dunefield near the Republican River occurred at ~70,
~80, ~420, and ~540 years before present (Forman et al., 2005). These dates suggest a
regional dune reactivation event across the Imperial Dunefield around 1460 AD in response to the
Little Ice Age. It further suggests some reactivation during the Dust Bowl event of the 1930s AD.
These Imperial dune reactivation dates are different than events dated at the two Sand Hills sites,
suggesting the Imperial Dunefield may have different drivers and sensitivities from the Sand Hills.
A series of studies examining the provenance of the dunefields in the region found that the Sand
Hills had a complex origin involving bedrock formations to northwest, along with sands from the
Pliocene Era and fluvial sources (Muhs, 2017; Muhs et al., 2000). That same study showed the
provenance of the Imperial Dunefield was no more straightforward, but different, with inputs from
South and North Platte River sands, bedrock formations to the west, and even the Sand Hills.
Climate and vegetation also differ slightly for the Imperial Dunefield study site as compared to
those sites in the Sand Hills. The Imperial site is the warmest in this thesis, with a MAT >10°C and
the highest minimum mean monthly temperature (-3.5°C for January). The climate is classified as

25 | P a g e
a Dfa, humid continental. The site is located in the sandsage plant community (Dunn et al., 2016;
Kaul and Rolfsmeier, 1994), named for the abundance of the shrub sandsage (Artemisia filifolia).
Several of the same species inhabit the Imperial Dunefield that inhabit the Sand Hills, including
grasses from the bluestem and grama families. And like the Sand Hills, species in the Imperial
Dunefield region have adapted to the “choppy” nature of periodically reactivated dunes,
particularly sand lovegrass (Eragrostis trichodes), prairie sandreed (Calamovilfa longfolia), and
windmillgrass (Choris verticillata) (Dunn et al., 2016), although little bluestem is found abundantly
throughout the area.
Previous studies have classified dunes in the Imperial Dunefield as compound parabolic dunes
(Loope and Swinehart, 2000). Aerial images from the study site selected for this thesis confirms
the parabolic nature of dunes in this area, especially northwest of the sites (Figure 5). Samples
representing the Imperial Dunefield were extracted from three sites each along three transects
(IMP-1A, IMP-1B, IMP-1C) which were sited along 330 Avenue in northern Chase County, where
several fresh roadcuts were located. To the east and south of the sites are cultivated areas. To
the northwest visible from 330 Avenue is a large dune complex with high relief. On some maps,
the Imperial Dunefield is identified as the Wray-Imperial-Lincoln (WIL) Dunefield, which lumps
three dunefields together stretching from central Colorado to central Nebraska.
Lincoln Dunefield Site Between the Sand Hills region and the Imperial Dunefield is the Lincoln Dunefield, which is perched
south of the Platte River system near the city of North Platte (Lat.: 41.0867, Lon.: -100.9257).
The dunefield is approximately 3,500km2 in size – larger than the Imperial Dunefield and 7% of
the size of the Sand Hills. Unlike the Sand Hills, however, a robust collect of OSL data does not
exist from the Lincoln Dunefield. The only OSL dataset from the area was collected from the
Wach site at the far southern end of the dunefield. Dune activity here dated to 7500, 10700,

26 | P a g e
and 13600 years before present (Mason et al., 2011). While few OSL dates have been
collected from this dunefield, there is research into its origin (Loope and Swinehart, 2000; Muhs,
2017; Muhs et al., 2000; Swinehart and Loope, 1992; Winspear and Pye, 1995). The Lincoln
Dunefield is sometimes referred to as part of the Wray-Imperial-Lincoln (WIL) Dunefield, but
studies have shown geochemical differences between these three geographic features. While
Winspear and Pye (1995) identified it as the “Dickens Dunefield” in their work, most workers
refer to the region as the Lincoln Dunefield or Lincoln County Dunefield.
Separated from the Sand Hills only by the Platte River Valley, researchers initially suggested the
Lincoln Dunefield had been an active aeolian arm of the Sand Hills that had dammed the North
and South Platte rivers during dry climatic periods (Muhs et al., 2000; Swinehart and Loope,
1992). Since then, grain size and provenance analyses have shown the Lincoln Dunefield’s origin
is unique from the Sand Hills (Muhs, 2017; Winspear and Pye, 1995). It seems likely now that
Lincoln Dunefield sands are derived from North Platte River sands, as the geochemical indicators
match almost exactly (Muhs, 2017). Thus, unlike the complex origins associated with the Sand Hills
and the Imperial Dunefield, the Lincoln Dunefield’s origin is straightforward seemingly; sand
entrained in the North Platte River from upstream in the basin was deposited on the river’s south
bank then transported southward across the Platte River Valley and over the South Platte River,
until being deposited on the south side of the valley. While geochemically clear, Muhs (2017)
suggests the actual geomorphic processes had to be more complex, despite the absence of inputs
from sands derived from the South Platte River system, which are geochemically different from
North Platte River sands, or the Sand Hills. Nevertheless, the data are clear and suggest that
sands originating from the North Platte River basin were instrumental in the formation of the
Lincoln Dunefield.

27 | P a g e
According to data from the nearby North Platte Experimental Farm, the climate for the Lincoln
Dunefield is Dwa, humid continental with a dry winter and a hot summer. The dunefield sits at a
juncture of the sandsage and mixed-grass prairie ecotones and features many of the same
species that are found in the Imperial Dunefield, including bluestems. In comparison to the other
study areas, however, the Lincoln Dunefield is less choppy, its surface smoother. Loope and
Swinehart (2000) found the Lincoln Dunefield to be a mixture of hummocky sand sheets and
complex transverse dunes, but linear dunes similar to those of the Sand Hills are clearly present in
parts of this dunefield. The location from which samples for this thesis were taken is clearly of low
relief (Figure 6) and is likely in the sector designated as a hummocky sand sheet. Samples were
extracted from three profiles each on three transects (LI-1A, LI-1B, and LI-1C) along Range Road
just north of the Outlet Canal.
Sioux Dunefield Site The last study site is the one on which the least amount of research has been conducted. Situated
in central Sioux County, this unnamed dunefield is 55km long and 15km wide stretching from
extreme eastern Wyoming’s Lone Sand Hill, with its 100m of vertical relief, into Nebraska. As this
dunefield is unnamed and located mostly in Sioux County, this study will refer to it as the Sioux
Dunefield. According to two meta-analyses of Great Plains dune research, no research has been
conducted on aeolian activity for any dunefield between the Sand Hills region and the Casper
Dunes in central Wyoming (Halfen et al., 2016; Halfen and Johnson, 2013). Loope and
Swinehart (2000) did classify the dunes in this region as compound parabolic with a northwest-to-
southeast orientation. That study also made note of a dune dam along Sheep Creek, as seen in
early 20th Century topographic maps, but no other known OSL or geomorphic research has been
done in this area.

28 | P a g e
The Sioux Dunefield site is the most remote of the study areas in this thesis (Lat.: 42.260681; Lon.:
-103.914394). It is at least 260km from all other study sites. It is also the highest in elevation
(~1,425m) and the coldest and driest in terms of climate, with a MAT of 7.6°C and a MAP of
365mm. It is also the only site classified as Dwc under the Köppen system, with a humid
continental climate, dry winters and equally hot summers and cold winters. The vegetation of the
Sioux Dunefield also differs slightly from the other sites. Part of northwestern Nebraska is
classified as the short-grass steppe ecotone, meaning that it is dominated by different species of
grass, chiefly buffalograss (Bouteloua dactyloides), blue grama (Bouteloua gracilis), and
threadleaf sedges (Carex filifolia) (Dunn et al., 2016), yet it is often mixed with sandsage plant
communities. The sites where samples were collected for this thesis were clearly sandsage
assemblages, with sandsage (Artemisia filifolia) and the introduced crested wheatgrass
(Agropyron cristata) and cheatgrass (Bromus tectorum) present in abundance, the latter two of
which are more common in northwestern Nebraska than in other areas of the state.
Samples for the Sioux Dunefield were taken from two nearby, but different geomorphic locations,
which may present issues with the data (Figure 7). Samples were taken from one transect (SI-1A)
that appears to be a sand sheet leeward of a large parabolic dune complex. The second site
(SI-1B) was near the intersection of Morrill Road and Murphys Road on the windward side of a
dune complex. Both sites are approximately 20km north of the North Platte River Valley.

29 | P a g e
Table 1: Climate Date for Research Study Areas Study Site Closet
Weather Station
MAP (mm) (Mean Annual
Precip.)
Summer P Wettest /
Driest
Winter P Wettest /
Driest
P- Threshold
MAT (°C) (Mean Annual
Temp.)
Monthly T Hottest / Coldest
Climate Class
Imperial Dunefield
Imperial 513.6 84.3 (June) 66.8 (Aug.)
13.2 (Feb.) 11.7 (Jan.)
34.6 10.3 23.6 (July) -3.5 (Jan.)
Dfa
Lincoln Dunefield
North Platte Experimental
Farm
528.32 93.7 (June) 60.7 (Aug.)
12.7 (Feb.) 8.4 (Jan.)
33.4 9.7 23.4 (July) -3.7 (Jan.)
Dwa
Sand Hills Lord Ranch
Site
Valentine Miller Field
513.1 90.4 (June) 55.3 (Aug.)
12.2 (Feb.) 6.6 (Jan.)
32.4 9.2 23.6 (July) -4.7 (Jan.)
Dwa
Sand Hills Milepost 81
Site
Cox Reservoir
(34km NW of Mullen on Calf
Creek)
591.3 100.8 (June) 58.7 (Aug.)
16.5 (Feb.) 11.9 (Jan.)
31.4 8.7 22.7 (July) -4.1 (Jan.)
Dfa
Sioux Dunefield
Agate Fossil Beds
National Monument
365 61.2 (June) 39.9 (Aug.)
7.6 (Feb.) 5.1 (Jan.)
29.6 7.8 21.4 (July) -4.7 (Dec.)
Dwc
Figure 1: Research Study Areas

30 | P a g e
Figure 2: Typical Climograph for Sand Hills Region (NOAA 2018) (https://w2.weather.gov/climate/xmacis.php?wfo=lbf)

31 | P a g e
Figure 3-7: Research Study Sites

32 | P a g e
Methods Variables that are important indicators of soil formation or recent dune activity were measured
using samples collected in the field or from elevation data using geographic information system
(GIS) procedures. Soil samples were taken from the five sites in the study area specified in
Chapter 3 and analyzed using a variety of methods in a laboratory. The results from laboratory
and GIS methods were then used in statistical analyses. This section details the methodology used
to collect and analyze these data.
Field Collection and Pedology Soil characteristics were obtained via field sampling, observation, and subsequent laboratory
analyses. Field observation and sampling was carried out using roadcuts or other vertical
exposures. After cleaning the exposures with a shovel and describing the soil profile, samples
were collected by pushing a hand soil probe into the exposure face to extract a 10-cm sample of
soil. Specific sampling sites were identified by exploring areas of interest within the study area,
which were first identified using aerial imagery in GIS. Grassland dune areas demonstrating a
mixture of choppy and smooth dunes – suggesting landscape and dune status variability – were
prioritized. Individual sites within these areas of interest were chosen for their accessibility and
include a mixture of fresh roadcuts and other exposures in dunefields with accommodating
landowners.
At each of the five study sites, a consistent methodology was established to collect samples. Three
transects were established at each site, with the exception of the Sioux Dunefield, where two
transects were employed due to severe weather conditions in the field. Along each transect, three
soil profiles were sampled; the distances between these profiles varied randomly along the
transect, with the exact distances determined using a random number function within a Microsoft
Excel spreadsheet. Thus, for Transect IMP-1A at the Imperial Dunefield, the three soil profiles
were spaced at distances of 2.3, 5.7, and 12.3 meters from the head of the transect, distances

33 | P a g e
which were calculated randomly. This process of sampling was utilized at each transect sample
site.
The soil profiles to be sampled along each transect were cleaned with a shovel or trowel to
create a freshly exposed face. The pedological elements of the soil profile were then recorded
along with attributes of the landscape in field notebooks and with cameras. Soil horizon colors
were recorded using the Munsell System (Anonymous, 1969). Selected soil horizons were also
evaluated for carbonate content in the Lincoln and Imperial dunefields using 10% HCl. For each
soil profile, samples were taken from the A, AC, and C horizons if present, plus from any
paleosols, discontinuities, dune banding, and lamellae observed in the top meter of the profile, if
it was deemed necessary. Finally, samples for lab analyses were collected from each horizon by
inserting a hand soil sampler probe 10 cm horizontally into the exposed face and placing the
collected soil in airtight bags. The samples were air-dried and crushed to pass a 2-mm sieve
before lab analyses.
Soil Particle Size One method was employed to measure soil particle size, which can be used to classify soil type,
identify soil series, infer soil moisture capacity and, potentially, recent dune activity. For this
research, soil particle size measurements were made via a Malvern Instruments Mastersizer
2000MU laser particle size analyzer. Although the laser diffraction method of measuring soil
particle sizes tends to underestimate the amount of the clay (<2µm) particle-size fraction (Mason
et al., 2003; Werner et al., 2011), the method was used here as the soils sampled were deemed
likely to be overwhelmingly sand-sized particles. Thus, the alternative pipette-sieve method,
which has traditionally been used to measure soil content, but takes longer, was not used in this
research.

34 | P a g e
Dry samples immersed in about 400 mL of DI water circulating through the particle size analyzer,
with sampled added until the light obscuration measured by the instrument was within the
acceptable range of 2-20%. To disperse clays and disaggregate the soil, 10 mL of 50 g L-1
sodium metaphosphate solution was added to the beaker. The samples were then sonicated (10
mm displacement, mid-range in sonicator power) for six minutes, followed by particle size
analysis. The Malvern Instruments software calculated the particle size distribution from the
distribution of scattered light using the Mie optical model, with a refractive index of 1.55 and
absorption coefficient of 0.1. While the software initially calculates a size distribution with 100
logarithmically spaced bins, for this study the following variables were calculated from those raw
data: % sand (2mm-63µm), % silt (63µm-2µm), % clay (<2µm), median diameter, and mean
diameter. Using the percentages of sand, silt, and clay, soil textural class was determined for
each sample by using a spreadsheet tool produced by the United States Department of
Agriculture, Natural Resources Conservation Service (USDA, 2018).
Loss-on-Ignition (LOI) This study evaluated soil organic matter (SOM) and soil organic carbon (SOC) using two different
approaches. The first used the loss-on-ignition (LOI) technique described by Konen et al. (2002).
LOI at 360°C largely represents loss of SOM, with only minor loss from other sources such as
dehydration of clay minerals; carbonates are not oxidized at this temperature. LOI at 360°C
does not oxidize all SOM; but regression models predicting SOC from LOI can be developed for
local regions or groups of soils, often with R2> 0.90 (Konen et al., 2002). Based on those
observations, it was assumed that LOI at 360°C should be a useful relative index of SOM
accumulation in the soils studied here.
As outlined by Konen et al. (2002), LOI soil samples were weighed, dried overnight at 105°C to
remove moisture, then weighed again. After this, the samples were combusted at 360°C for two

35 | P a g e
hours in a furnace, cooled at 105°C in an oven, then weighed again. LOI was then expressed as
a percentage:
𝐿𝐿𝐿𝐿𝐿𝐿% =𝑜𝑜𝑜𝑜𝑜𝑜𝑜𝑜 𝑑𝑑𝑑𝑑𝑑𝑑 𝑠𝑠𝑜𝑜𝑠𝑠𝑠𝑠 𝑤𝑤𝑜𝑜𝑠𝑠𝑤𝑤ℎ𝑡𝑡 − 𝑐𝑐𝑜𝑜𝑐𝑐𝑐𝑐𝑐𝑐𝑠𝑠𝑡𝑡𝑜𝑜𝑑𝑑 𝑠𝑠𝑜𝑜𝑠𝑠𝑠𝑠 𝑤𝑤𝑜𝑜𝑠𝑠𝑤𝑤ℎ𝑡𝑡
𝑜𝑜𝑜𝑜𝑜𝑜𝑜𝑜 𝑑𝑑𝑑𝑑𝑑𝑑 𝑠𝑠𝑜𝑜𝑠𝑠𝑠𝑠 𝑤𝑤𝑜𝑜𝑠𝑠𝑤𝑤ℎ𝑡𝑡 𝑋𝑋 100
Soil Carbon (C) and Nitrogen (N) SOC and total N were measured with an organic elemental analyzer (EA). Because of the close
relationship between SOC and SOM, the measured SOC provides a second indicator of SOM
accumulation in the dune field soils, while N is key plant nutrient, much of which is contained in
SOM. Samples were ground with a mortar and pestle and passed through a 2mm sieve, then
placed in tin capsules (or silver capsules if the sample needed to undergo acid fumigation to
remove carbonates). All samples from the southern dunefields – the Lincoln and Imperial
dunefields – underwent acid fumigation (Ramnarine et al., 2011) in silver capsules. Samples were
replicated and analyzed with a Thermo Scientific FlashSmart Elemental Analyzer.
Cation Exchange Capacity (CEC) The CEC of a soil horizon represents its ability to attract and adsorb positively charged ions,
including important nutrients for plants and is often tied to SOC content, texture, and clay
minerology (Schaetzl and Anderson, 2005). CEC was measured on samples from one profile out
of the three studied in each transect and processed in accordance with the procedure found in
Methods of Soil Analysis, 2nd Edition (Rhoades, 1982). Soil samples weighing ~10g were mixed
with ~50 mL of ammonium acetate (1N NH4OAc), shaken, and left to sit overnight in 100mL
plastic bottles. This process saturates the soil exchange complex with NH4+, displacing other
cations. The next day, the samples were placed in filter funnels, vacuum was applied, and excess
NH4+ was rinsed from the soil with DI water followed by 50 mL of ethanol. A final rinse with 120
mL of 10% NaCl solution displaced NH4+from the soil exchange complex into the filtrate. The

36 | P a g e
NH4+ was distilled from the filtrate as NH3 using a Kjeldahl distillation apparatus, and trapped in
boric acid solution, where it was quantified using titration with H2SO4. The moles of
NH4+displaced from the sample are assumed to equal total moles of negative charge on soil
particles and can then be used to calculate CEC of the sample in cmol+ kg-1.
GIS Analyses In addition to providing spatial data for the preliminary site analysis, GIS was used to provide
answers to key questions of geomorphology. Specifically, digital elevation models (DEMs)
constructed from light detection and ranging (LiDAR) files and were used in a number of analyses
to answer questions regarding dune geomorphology and surface roughness, both of which can
provide evidence on recent dune activation. LiDAR-based and coarser-resolution DEM data both
model the Earth’s surface and, thus, could be used to analyze the surface of dunefields. The
Nebraska Department of Natural Resources (DNR) has LiDAR-based DEMs available at a
resolution of 2m for a limited portion of the state. As of October 2018, LiDAR-based DEMs were
available from the Nebraska DNR only for the study sites in the Imperial Dunefield and at the
Lord Ranch in the Sand Hills. For the remaining three study areas, 10m DEMs were obtained from
the Nebraska DNR and used for analysis in those area. As a result, surface data across the study
area was available at different resolutions. Analyses involving metrics that did not require
statistical comparisons across dunefields were performed in the data available. For example, the
variable aspect – which is the directionality of the dune surface from where the soil sample was
drawn – was calculated with 2m LiDAR-based DEMs for the Imperial Dunefield and Lord Ranch
sites, but with 10m DEMs for all other sites. On the other hand, the analysis of surface roughness,
which needed to be compared across dunefields in a statistically consistent manner, could not be
performed just with the original data. For these types of analyses, the higher-resolution LiDAR-
based data were converted to lower 10m-resolution raster data for comparison purposes. Thus,

37 | P a g e
for surface roughness or any other variable involving a statistical comparison, the terrain data
used was at a resolution of 10m.
Dune Geomorphology The most straightforward manner of GIS analyses for this study involved measurements of dune
geomorphology. These measurements include elevation, aspect, surface slope, and all three
curvature metrics. Elevation is embedded in the pixel values of the DEM raster files for each
study site. It was recorded for each soil sample profile location in meters. Elevation also formed
the foundation of all other GIS analyses, as it is the input value for aspect, surface slope,
curvature, and the surface roughness variable.
Aspect is the directionality of the dune surface. An ESRI ArcGIS software tool called ‘Aspect’ was
used to calculate this metric (ESRI, 2018). It does so by determining the orientation of a surface
at each pixel from the elevation of all pixels within a planar 3-cell-by-3-cell moving window. The
tool returned an azimuth for each study site location, which was then converted into cardinal and
intercardinal directions. Aspect is an important metric in dune geomorphology as the orientations
of dunes or blowouts are often tied closely with wind direction. One issue with the not only the
aspect tool, but many of the GIS analyses is the potential of the process to return anomalous
results due to the influence of roads and roadcuts in the LiDAR data. A review of the results
showed that this phenomenon did not unduly alter the outcomes of the processes as more-granular
10m DEMs were used for geostatistical analyses.
Surface slope, likewise, was calculated with an ArcGIS tool. The ‘Slope’ tool evaluates the
steepness of surface terrain in degrees by considering the elevation of pixels within a planar 3-
cell-by-3-cell moving window. Slope is an important geomorphic variable as steeper slopes
oriented in the direction of the prevailing winds tend to expose more of the dune surface to the
potential of aeolian erosion or blowouts. Further, steep surfaces may be indicative of surface

38 | P a g e
roughness and, therefore, potentially key in understanding dune status. As with many calculations,
slight variations in surface slope are more likely to be detected with the higher-resolution LiDAR
data than with the 10m DEMs, which tend to smooth out a landscape. For this reason, 2m-
resolution LiDAR was used to calculate surface slope where available.
Curvature is a surface geomorphology variable which has three related metrics (ESRI, 2018). The
‘Curvature’ tool in ArcGIS attempts calculate and visualize the slope shape in three dimensions by
evaluating the second derivative – or trend of surficial change – within an envelope of pixels.
The three metrics returned from the ‘Curvature’ tool are profile, planform, and total curvature.
Profile curvature measures the convex or concave nature of a surface, while planform measures if
a surface is converging or diverging. Profile and planform curvatures are rolled into the overall
standard curvature metric.
Surface Roughness While the metrics of dune geomorphology could be important indicators of dune status and
relative activity, it is hypothesized that calculating surface roughness is critical to identifying areas
of recent dune reactivation. Unfortunately, the calculation method of surface roughness is
contested and often scale- and terrain-dependent (Brown and Hugenholtz, 2012; Grohmann et
al., 2011). In accordance with the findings of Grohmann et al. (2011), this study focuses on the
standard deviation of elevation, slope, and profile curvature. Each of these were calculated by
using the neighborhood statistical tool in ArcGIS called ‘Focal Statistics’. The ‘Focal Statistics’ tool
can calculate standard deviation of raster pixels within a neighborhood of pixels as defined by
the analyst. As these roughness statistics needed to be compared across dunefields, all data
employed in these analyses were 10m-resolution raster files, whether originally from a DEM or
2m-resolution LiDAR dataset, the latter of which was degraded to 10m resolution for the purposes
of comparison. As a result, the focal statistical neighborhood defined for all of these analyses
was 3-cells-by-3-cells, or 90x90 meters.
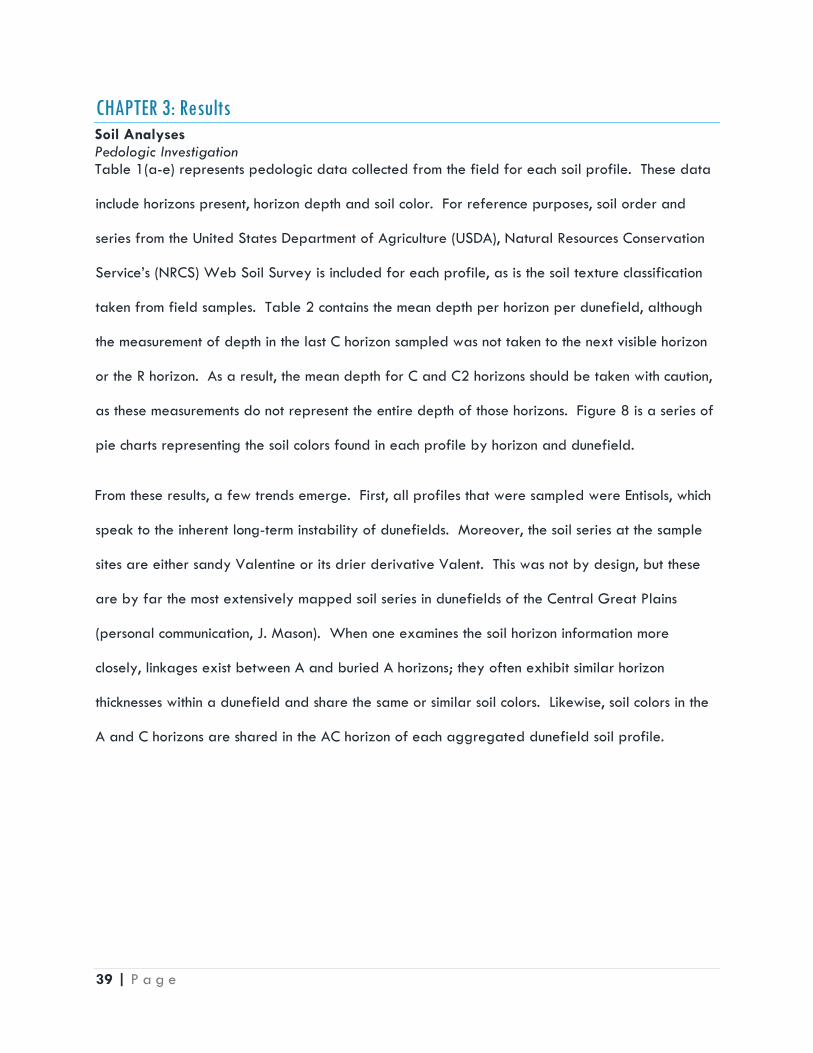
39 | P a g e
CHAPTER 3: Results Soil Analyses Pedologic Investigation Table 1(a-e) represents pedologic data collected from the field for each soil profile. These data
include horizons present, horizon depth and soil color. For reference purposes, soil order and
series from the United States Department of Agriculture (USDA), Natural Resources Conservation
Service’s (NRCS) Web Soil Survey is included for each profile, as is the soil texture classification
taken from field samples. Table 2 contains the mean depth per horizon per dunefield, although
the measurement of depth in the last C horizon sampled was not taken to the next visible horizon
or the R horizon. As a result, the mean depth for C and C2 horizons should be taken with caution,
as these measurements do not represent the entire depth of those horizons. Figure 8 is a series of
pie charts representing the soil colors found in each profile by horizon and dunefield.
From these results, a few trends emerge. First, all profiles that were sampled were Entisols, which
speak to the inherent long-term instability of dunefields. Moreover, the soil series at the sample
sites are either sandy Valentine or its drier derivative Valent. This was not by design, but these
are by far the most extensively mapped soil series in dunefields of the Central Great Plains
(personal communication, J. Mason). When one examines the soil horizon information more
closely, linkages exist between A and buried A horizons; they often exhibit similar horizon
thicknesses within a dunefield and share the same or similar soil colors. Likewise, soil colors in the
A and C horizons are shared in the AC horizon of each aggregated dunefield soil profile.

40 | P a g e
Table 2: Pedologic Description of Soil Profiles for Imperial Dunefield Sites
Profile Horizon Depth (cm)
Sample Depth
Color Moist
Color Desc.
Texture Soil Order
Soil Series
Notes
IMP-1A-1 A 0-50 10 30
10YR 4/2 Dark Grayish Brown
Loamy Sand
Entisol Valent Roots
C 50-122 60 10YR 5/4 Yellowish Brown
Loamy Sand
IMP-1A-2 A 0-37 10 30
10YR 4/3 Brown Loamy Sand
Entisol Valent Roots
C 37-80 60 10YR 5/4 Yellowish Brown
Loamy Sand
IMP-1A-3 A 0-44 10 30
10YR 4/3 Brown Loamy Sand
Entisol Valent Roots
C 44-83 60 10YR 5/4 Yellowish Brown
Loamy Sand
IMP-1B-1 A 0-13 5 10YR 5/4 Yellowish Brown
Loamy Sand
Entisol Valent Roots
C 13-87 50 10YR 4/6 Dark Yellowish
Brown
Sand Dune bedding @61cm
Ab 87-113 110 10YR 3/4 Dark Yellowish
Brown
Sand
IMP-1B-2 A 0-18 5 10YR 4/3 Brown Sand Entisol Valent C 18-90 50 10YR 4/6 Dark
Yellowish Brown
Sand Dune bedding @88cm
Ab 90-119 110 10YR 3/4 Dark Yellowish
Brown
Sand
IMP-1B-3 A 0-21 5 10YR 4/3 Brown Sand Entisol Valent Sand Sage Vegetation
C 21-42 25 10YR 4/4 Brown Loamy Sand
Ab 42-62 50 10YR 4/6 Dark Yellowish
Brown
Sand
IMP-1C-1 A 0-21 5 10YR 3/2 Brown Loamy Sand
Entisol Valent
AC1 21-35 - 10YR 4/4 Brown - C1 35-77 50 10YR 4/3 Brown Sand C2 77-120 110 10YR 5/4 Yellowish
Brown Sand Coarse
grains, pebbles, laminated
IMP-1C-2 A 0-15 5 10YR 3/3 Dark Brown
Loamy Sand
Entisol Valent
AC1 15-25 - 10YR 4/3 Brown - C1 25-90 50 10YR 4/4 Brown Sand Roots
@62cm C2 90-120 110 10YR 6/4 Light
Yellowish Brown
Sand
IMP-1C-3 A 0-21 5 10YR 3/3 Dark Brown
Sandy Loam
Entisol Valent
AC1 21-34 - 10YR 4/4 Brown - C1 34-87 50 10YR 4/4 Brown Sand C2 87-120 110 10YR 6/4 Light
Yellowish Brown
Sand Some dune bedding

41 | P a g e
Table 3: Pedologic Description of Soil Profiles for Lincoln Dunefield Sites Profile Horizon Depth
(cm) Sample Depth
Color Moist
Color Desc.
Texture Soil Order
Soil Series
Notes
LI-1A-1 A 0-6 5 10YR 4/2 Dark Grayish Brown
Loamy Sand
Entisol Valent
AC 6-32 20 10YR 4/3 Brown Loamy Sand
Upper and lower
boundaries distinctive
C 32-98 50 10YR 4/6 Dark Yellowish
Brown
Sand
LI-1A-2 A 0-6 5 10YR 4/2 Dark Grayish Brown
Loamy Sand
Entisol Valent
AC 6-47 20 10YR 4/3 Brown Loamy Sand
Lower boundary distinctive
C 47-87 60 10YR 4/4 Brown Sand LI-1A-3 A 0-8 5 10YR 4/2 Dark
Grayish Brown
Loamy Sand
Entisol Valent
AC 8-49 20 10YR 3/3 Dark Brown
Loamy Sand
C 49-75 60 10YR 4/3 Brown Loamy Sand
LI-1B-1 A 0-5 3 10YR 3/3 Dark Brown
Sandy Loam
Entisol Valent
AC 5-21 10 10YR 4/3 Brown Loamy Sand
Lower boundary distinctive
C 21-75 40 10YR 4/4 Brown Sand LI-1B-2 A 0-4 3 10YR 4/2 Dark
Grayish Brown
Loamy Sand
Entisol Valent
AC 4-22 10 10YR 4/3 Brown Loamy Sand
Lower boundary distinctive
C 22-65 40 10YR 4/4 Brown Sand LI-1B-3 A 0-6 5 10YR 4/2 Dark
Grayish Brown
Loamy Sand
Entisol Valent
AC 6-26 10 10YR 4/3 Brown Loamy Sand
C 26-50 40 10YR 4/4 Brown Sand LI-1C-1 A 0-8 5 10YR 4/2 Dark
Grayish Brown
Sandy Loam
Entisol Valent
AC 8-21 10 10YR 4/3 Brown Loamy Sand
C 21-97 40 10YR 4/6 Dark Yellowish
Brown
Loamy Sand
Eff. w/HCl
LI-1C-2 A 0-9 5 10YR 4/2 Dark Grayish Brown
Sandy Loam
Entisol Valent
AC 9-39 20 10YR 3/2 Brown Loamy Sand
C 39-68 60 10YR 3/3 Dark Brown
Loamy Sand
LI-1C-3 A 0-11 5 10YR 4/2 Dark Grayish Brown
Sandy Loam
Entisol Valent
AC 11-40 20 10YR 3/3 Dark Brown
Loamy Sand
C1 40-44 42 10YR 3/6 Dark Yellowish
Brown
Loamy Sand
Ab 44-51 50 10YR 4/2 Dark Grayish Brown
Sandy Loam
Ab horizon has mod.
slope C2 51-83 - - - -

42 | P a g e
Table 4: Pedologic Description of Soil Profiles for Sand Hills Lord Ranch Sites Profile Horizon Depth
(cm) Sample Depth
Color Moist
Color Desc.
Texture Soil Order
Soil Series
Notes
CH-1A-1 A 0-9 5 10YR 5/4 Yellowish Brown
Sand Entisol Valentine Dune with some bare
sand AC 9-20 10 10YR 4/6 Dark
Yellowish Brown
Sand
C 20-100 50 10YR 4/6 Dark Yellowish
Brown
Sand Roots
CH-1A-2 A 0-8 5 10YR 4/4 Brown Sand Entisol Valentine Dune with some bare
sand AC 8-22 10 10YR 3/4 Dark
Yellowish Brown
Sand
C 22-100 50 10YR 3/6 Dark Yellowish
Brown
Sand
CH-1A-3 A 0-9 5 10YR 4/3 Brown Sand Entisol Valentine Dune with some bare
sand AC 9-21 10 10YR 3/4 Dark
Yellowish Brown
Sand
C 21-100 50 10YR 3/6 Dark Yellowish
Brown
Sand
CH-1B-1 AC 0-10 5 10YR 5/4 Yellowish Brown
Sand Entisol Valentine Blowout
C1 10-86 50 10YR 6/4 Light Yellowish
Brown
Sand
Ab 86-105 100 10YR 5/3 Brown Sand C2 >120 - - - -
CH-1B-2 AC 0-17 5 10YR 5/4 Yellowish Brown
Sand Entisol Valentine Blowout
C1 17-120 50 10YR 6/3 Pale Brown Sand Ab 120-150 135 10YR 4/3 Brown Sand C2 >150 - - - -
CH-1B-3 AC 0-10 5 10YR 5/4 Yellowish Brown
Sand Entisol Valentine Blowout
C1 10-150 50 10YR 6/3 Pale Brown Sand Ab 150-165 160 10YR 4/3 Brown Sand C2 >165 - - - -
CH-1C-1 A 0-9 5 10YR 4/3 Brown Sand Entisol Valentine Dune with some bare
sand C 9-53 10
50 10YR 5/4 Yellowish
Brown Sand
CH-1C-2 A 0-7 5 10YR 4/2 Dark Grayish Brown
Sand Entisol Valentine Dune with some bare
sand C 7-55 10
50 10YR 3/4 Dark
Yellowish Brown
Sand
CH-1C-3 A 0-7 5 10YR 4/2 Dark Grayish Brown
Sand Entisol Valentine Dune with some bare
sand C 7-83 10
60 10YR 3/4 Dark
Yellowish Brown
Sand

43 | P a g e
Table 5: Pedologic Description of Soil Profiles for Sand Hills Milepost 81 Sites Profile Horizon Depth
(cm) Sample Depth
Color Moist
Color Desc.
Texture Soil Order
Soil Series
Notes
MP81-1A-1 A 0-4 3 10YR 4/2 Dark Grayish Brown
Sand Entisol Valentine Dune with some bare
sand C 4-85 10
50 10YR 4/3 Brown Sand Some
banding MP81-1A-2 A 0-12 2 10YR 4/2 Dark
Grayish Brown
Sand Entisol Valentine Dune with some bare
sand C 12-92 20
70 10YR 4/3 Brown Sand Light-dark
bands @39cm &,
51cm -
Lighter band @62 cm, 10YR 5/4
- Lamellae @83cm
MP81-1A-3 A 0-8 5 10YR 4/2 Dark Grayish Brown
Sand Entisol Valentine Dune with some bare
sand -
Profile at 30° angle
C1 8-69 20 50
10YR 4/3 Brown Sand Banding throughout
Ab 69-75 70 10YR 2/1 Black Sand C2 75-90 - - - -
MP81-1B-1 A 0-9 5 10YR 4/3 Brown Sand Entisol Valentine C1 9-20 15 10YR 3/3 Dark
Brown Sand
Ab 20-40 40 10YR 3/1 Very Dark Gray
Sand
C2 40-51 - - - - MP81-1B-2 A 0-8 5 10YR 4/3 Brown Sand Entisol Valentine
C 8-110 20 50
10YR 3/3 Dark Brown
Sand
MP81-1B-3 A 0-7 5 10YR 4/2 Dark Grayish Brown
Sand Entisol Valentine
C1 7-52 20 50
10YR 4/3 Brown Sand
Ab 52-53 52 10YR 3/1 Very Dark Gray
Sand Possibly lamellae
C2 53-75 - - - - MP81-1C-1 A 0-9 5 10YR 4/2 Dark
Grayish Brown
Sand Entisol Valentine
C 9-82 20 62
10YR 4/3 Brown Sand Banding 62-82cm
MP81-1C-2 A 0-10 5 10YR 4/2 Dark Grayish Brown
Sand Entisol Valentine Very weak, possibly AC.
Some banding.
C 10-70 20 50
10YR 4/3 Brown Sand Banding @ 20cm, no banding below.
MP81-1C-3 A 0-13 5 10YR 4/2 Dark Grayish Brown
Sand Entisol Valentine Profile at 30° angle.
C 13-110 20 60
10YR 4/3 Brown Sand Banding throughout

44 | P a g e
Table 6: Pedologic Description of Soil Profiles for Sioux Dunefield Sites Profile Horizon Depth
(cm) Sample Depth
Color Moist
Color Desc.
Texture Soil Order
Soil Series
Notes
SI-1A-1 A 0-4 3 10YR 4/4 Brown Loamy Sand
Entisol Valent Possibly sand sheet
AC 4-8 8 10YR 5/6 Yellowish Brown
Loamy Sand
C 8-30 25 10YR 3/6 Dark Yellowish
Brown
Sand
SI-1A-2 A 0-12 5 10YR 3/4 Dark Yellowish
Brown
Loamy Sand
Entisol Valent Possibly sand sheet
AC 12-18 15 10YR 5/6 Yellowish Brown
Loamy Sand
C 18-40 30 10YR 3/4 Dark Yellowish
Brown
Sand
SI-1A-3 A 0-10 5 10YR 3/3 Dark Brown
Loamy Sand
Entisol Valent Possibly sand sheet
C 10-40 15 30
10YR 4/6 Dark Yellowish
Brown
Sand
SI-1B-1 A 0-8 5 10YR 3/3 Dark Brown
Loamy Sand
Entisol Valent
C 8-80 20 60
10YR 3/4 Dark Yellowish
Brown
Loamy Sand
SI-1B-2 A 0-13 5 10YR 3/2 Brown Sandy Loam
Entisol Valent Deep roots
AC 13-39 20 10YR 4/3 Brown Loamy Sand
C 39-72 60 10YR 3/4 Dark Yellowish
Brown
Sandy Loam
SI-1B-3 A 0-10 5 10YR 4/3 Brown Loamy Sand
Entisol Valent
C 10-45 20 40
10YR 4/4 Brown Loamy Sand
Table 7: Mean Soil Horizon Thickness (cm) by Dunefield Site Horizon Imperial Lincoln Lord Ranch Milepost 81 Sand Hills
(tot.) Sioux
A 26.7 7 8.2 8.9 8.6 9.5 AC 12.3 26 12.3 - 12.3 12 C* 53.4 44.8 67.5 82.3 74.9 35.7 C1 - 4 106.3 39 72.7 - Ab 25 7 21.3 9 15.2 - C2* - 32 - 12.7 12.7 -
(* - complete depth to R horizon or next horizon beyond last C horizon sampled was not recorded)

45 | P a g e
Figure 8: Pedologic Color of Soil Profiles (Horizons A through Ab) for All Dunefield Sites

46 | P a g e
Soil Particle Size Analysis Results from the soil particle size analyses show some consistency across horizons and dunefields,
but also many differences. Overall mean, mode, and median grain sizes demonstrate a
coarseness of soil across all dunefields and horizons. All three descriptive metrics for all
dunefields were firmly in the sand fraction, with values greater than 63 µm. Likewise, the profiles
at each site exhibited similar vertical trends, with grain sizes becoming coarser downward from
the A horizon, then trending back toward a finer sand at some depth (Figure 12a-c). Given these
trends, it is not surprising that the mean percentage of sand-sized particles increases in all
dunefields from the A horizon to the C horizon (Figure 13a-c) and that this comes at the expense
of material in the silt-sized fraction. These findings are unsurprising given the nature of
dunefields, even stabilized dunefields. Generally, the parent material of dunefield soils found in
the C Horizon is sandy, while the presence of vegetation and the process of pedogenesis in the A
horizon traps finer soil particles and incorporates them into the soil.
Yet, while these general trends and patterns show the dunefields of the study areas share
similarities, there are important differences in the particle size data which have implications for
this thesis. While the overall soil particle size across all the dunefields is coarse, the degree of
coarseness differs. The Sand Hills study sites exhibited the coarsest particle sizes of all with an
overall mean of 214µm (±30) (Table 13). The dunefield’s modal particle size slightly exceeds its
mean, suggesting its overall particle size distribution is skewed in that direction. But beyond the
pronounced coarseness of the Sand Hills sites, other data suggest important dunefield differences.
For example, the mean and modal particle sizes by horizon show a relatively wide variance
(Table 13, last column), as expressed by the standard deviation values. This feature can also be
seen in the range of modal values in the A horizon, with the Sand Hills sites representing a
maximum of Mo=207µm (±26) and the Lincoln Dunefield representing the minimum Mo=111µm
(±5).

47 | P a g e
A further illustration of dunefield soil differences can be found in a comparison of the data for the
Sand Hills and Imperial Dunefield sites. The Sand Hills site exhibits the coarsest particle size data,
but the grain sizes at depth in the Imperial Dunefield approach those of the Sand Hills sites. In the
parent material of the C horizon, the mean particle size for the Sand Hills is x̅ = 214µm (±33),
while the mean particle size for the Imperial Dunefield actually is higher at x̅ = 217µm (±15).
Yet, in the A horizon, the mean particle sizes for the two sites diverge. For the Sand Hills, the
mean particle size for the A horizon was x̅ = 202µm (±23), while it was x̅ = 168µm (±19) for
the Imperial Dunefield. This divergence for the two locations between the A and C horizons might
suggest that soil development is more robust in the Imperial Dunefield than it is in the Sand Hills.
Additionally, dunes in the Sand Hills might have experienced more frequent recent activity,
leading to loss of finer-grained material – and this possibility has implications for this study.
Other interesting findings with regards to soil grain size involve the overall percentage of silt
present in the soil (Figure 12b) and the composition of the silt fraction (Figure 12c). On average,
fine silt (2-16µm) comprises approximately 50% or more of material in the silt particle size
category (2-63µm) at all horizons. Additionally, the average percentage of silt in the soil profiles
decreases from the A horizons down to the C horizon, then increases in buried Ab horizons.
Depending upon the horizon, these results have different implications. In the A and Ab horizons,
the pronounced presence of fine silt and of silt overall suggests a stable vegetated state to the
dunes. In this scenario, grasses could be trapping dust particles, with bioturbation such as insect or
rodent burrowing working the silt-sized material down into the soil profile, especially in the A
horizon, as was discovered in other studies (Werner et al., 2011; Yan et al., 2011). The relative
lack of silt in the C horizons suggests the parent material of the dunefields is somewhat “clean”
sand and not silty-sandy dunes.

48 | P a g e
With regards to clay-sized soil particles (<2µm), very little exists in any of these sites. It is
possible that the Malvern Instruments Mastersizer 2000MU® laser particle size analyzer, which
was used to measure soil grain size, underestimated clay content relative to other methods such as
pipette analysis, as was discovered in other studies (Mason et al., 2003). However, the clay
percentages range from 2.5% in the C horizon at site SI-1B-2 in the Sioux Dunefield to 0.4% in
two C horizons at the Lord Ranch site. Even with a potential underestimation of clay in the results,
there is very little clay in these dunefield soils. Samples from the Sand Hills sites have the least
clay, followed by the Imperial Dunefield sites. The profiles with the highest clay content are in the
Lincoln and Sioux dunefields.

49 | P a g e
Table 8: Particle Size Data for Soil Profiles in the Imperial Dunefield Profile Horizon Sample
Depth Mean (µm)
Median (µm)
Mode (µm)
Sand% Silt% Total
Silt% Fine
2-16(µm)
Silt Fine-Total
Ratio
Clay% Texture General
Texture Mean
IMP-1A-1 A 10 177.3 144.8 157.1 79.1 19.4 10.8 0.56 1.4 Loamy Sand Fine Sand A 30 181.4 150.6 155.2 83.3 15.4 9.1 0.59 1.4 Loamy Sand Fine Sand C 60 189.8 150.8 148.8 82.2 16.4 9.8 0.6 1.4 Loamy Sand Fine Sand
IMP-1A-2 A 10 175.4 148.2 163.1 79.9 18.7 10.5 0.56 1.4 Loamy Sand Fine Sand A 30 194.5 166.6 179.4 85.3 13.5 8.3 0.61 1.3 Loamy Sand Fine Sand C 60 200.8 157.1 151.7 83.1 15.4 9.8 0.63 1.5 Loamy Sand Fine Sand
IMP-1A-3 A 10 150.2 123.1 143.6 73.1 25.5 12.8 0.5 1.5 Loamy Sand Fine Sand A 30 171.2 145.6 153.8 82.6 16.1 9.5 0.59 1.4 Loamy Sand Fine Sand C 60 205.8 167.7 169.9 84.8 13.8 8.9 0.65 1.4 Loamy Sand Fine Sand
IMP-1B-1 A 5 164.1 146.6 167.3 80.3 18.3 10.1 0.55 1.4 Loamy Sand Fine Sand C 50 209 193.4 206 94.2 4.9 3.4 0.7 1 Sand Fine Sand Ab 110 222.7 178.6 180.7 86.1 12.7 7.4 0.59 1.2 Sand Fine Sand
IMP-1B-2 A 5 159.2 145.7 154.4 86.6 12.2 7.7 0.63 1.3 Sand Fine Sand C 50 220.9 199 213.9 93.4 5.7 4 0.7 1 Sand Fine Sand Ab 110 215.6 171.2 168 87.4 11.5 6.9 0.59 1.1 Sand Fine Sand
IMP-1B-3 A 5 155.8 145.4 155.8 87.3 11.4 7.3 0.63 1.3 Sand Fine Sand C 25 218.7 178.5 180.1 87.6 11.3 6.8 0.6 1.1 Sand Fine Sand Ab 50 188.1 159.6 166.1 85 13.8 8.6 0.62 1.2 Loamy Sand Fine Sand
IMP-1C-1 A 5 194.4 161.5 180.4 82.2 16.5 9.3 0.56 1.3 Loamy Sand Fine Sand AC1 - - - - - - - - - - - C1 50 208.6 176.2 176.2 92.1 6.9 4.1 0.59 1.1 Sand Fine Sand C2 110 241.7 209.5 244.8 90.6 8.3 6.1 0.74 1.1 Sand Fine Sand
IMP-1C-2 A 5 157.6 129.8 150 75.8 23.1 9.8 0.42 1.1 Loamy Sand Fine Sand AC1 - - - - - - - - - - - C1 50 225.9 199.1 229.2 90.3 8.6 5.4 0.63 1.1 Sand Fine Sand C2 110 238.3 204.6 223.2 91.4 7.5 5.2 0.7 1.1 Sand Fine Sand
IMP-1C-3 A 5 130.8 110.6 132 71.2 27.1 12.6 0.47 1.7 Sandy Loam Fine Sand AC1 - - - - - - - - - - - C1 50 221.9 200.7 223.8 92.5 6.5 4 0.61 0.9 Sand Fine Sand C2 110 216.1 188.0 198.5 92.6 6.4 4.1 0.65 1.1 Sand Fine Sand

50 | P a g e
Table 9: Particle Size Data for Soil Profiles in the Lincoln Dunefield Profile Horizon Sample
Depth Mean (µm)
Median (µm)
Mode (µm)
Sand% Silt% Total
Silt% Fine
2-16(µm)
Silt Fine-Total
Ratio
Clay% Texture General
Texture Mean
LI-1A-1 A 5 108.3 101.1 111.8 75.3 22.9 11.2 0.49 1.8 Loamy Sand Very Fine Sand
AC 20 138.4 119.4 129.3 77.7 20.5 11.1 0.54 1.8 Loamy Sand Fine Sand C 50 149.8 136.4 136.9 91.6 7 4.1 0.59 1.5 Sand Fine Sand
LI-1A-2 A 5 117 106.5 115.2 78.4 19.9 11 0.55 1.7 Loamy Sand Very Fine Sand
AC 20 136.6 115.4 125 76.5 21.8 11.9 0.54 1.6 Loamy Sand Fine Sand C 60 157 131.7 128.9 88.5 9.9 5.6 0.57 1.5 Loamy Sand Fine Sand
LI-1A-3 A 5 111 105 117.2 76.2 21.9 12.9 0.59 1.9 Loamy Sand Very Fine Sand
AC 20 119.8 104.1 115.7 73.7 24.6 12 0.49 1.7 Loamy Sand Very Fine Sand
C 60 151.6 129.9 130.6 84.4 14.3 8.2 0.57 1.4 Loamy Sand Fine Sand LI-1B-1 A 3 106.3 94.7 106.1 71.8 26.4 11.8 0.45 1.8 Sandy Loam Very Fine
Sand AC 10 109.9 99.9 108.5 75.8 22.7 10.3 0.46 1.6 Loamy Sand Very Fine
Sand C 40 155.9 128.1 121.5 88.2 10.1 4.5 0.45 1.7 Sand Fine Sand
LI-1B-2 A 3 119.5 104 110.8 77.9 20.3 9.9 0.49 1.8 Loamy Sand Very Fine Sand
AC 10 164.3 110.3 114 81.7 16.7 8.9 0.53 1.6 Loamy Sand Fine Sand C 40 166 122.3 121.6 89.3 9.1 4.8 0.53 1.6 Sand Fine Sand
LI-1B-3 A 5 182.4 108.6 113.2 78.4 20 10 0.5 1.6 Loamy Sand Fine Sand AC 10 128.9 110.6 116.1 79 19.4 9.7 0.5 1.6 Loamy Sand Fine Sand C 40 142.9 126.7 124.7 90.1 8.4 4.3 0.51 1.5 Sand Fine Sand
LI-1C-1 A 5 112.8 93.8 107.5 69 28.9 13.6 0.47 2.1 Sandy Loam Very Fine Sand
AC 10 160 105.3 113.8 74.7 23.5 11.4 0.49 1.8 Loamy Sand Fine Sand C 40 128.7 108 117.1 75.1 23 11.7 0.51 1.9 Loamy Sand Fine Sand
LI-1C-2 A 5 102.9 96.5 112.7 70.9 27.2 12.9 0.47 1.9 Sandy Loam Very Fine Sand
AC 20 116.3 106.3 116 76.9 21 11.2 0.53 2 Loamy Sand Very Fine Sand
C 60 140.7 118.1 124.5 77.8 20.4 11.5 0.57 1.9 Loamy Sand Fine Sand LI-1C-3 A 5 97.3 86.5 101.4 66.2 31.5 13.9 0.44 2.3 Sandy Loam Very Fine
Sand AC 20 111.2 101.3 112.4 74.2 23.6 11.5 0.49 2.1 Loamy Sand Very Fine
Sand C1 42 154.8 129.8 132.5 81.4 16.8 9.6 0.57 1.8 Loamy Sand Fine Sand Ab 50 113.5 98.3 111 71.3 26.7 13.7 0.51 2.1 Sandy Loam Very Fine
Sand C2 - - - - - - - - - - -

51 | P a g e
Table 10: Particle Size Data for Soil Profiles at the Sand Hills Lord Ranch Sites Profile Horizon Sample
Depth Mean (µm)
Median (µm)
Mode (µm)
Sand% Silt% Total
Silt% Fine
2-16(µm)
Silt Fine-Total
Ratio
Clay% Texture General
Texture Mean
CH-1A-1 A 5 220.1 218.7 232 90.3 8.9 5.2 0.58 0.8 Sand Fine Sand AC 10 210.2 211.3 227.7 86.8 12.5 7.1 0.57 0.7 Sand Fine Sand C 50 230.3 228.5 237.2 92.2 7.3 4.9 0.67 0.6 Sand Fine Sand
CH-1A-2 A 5 211.1 210.9 224.6 88.6 10.7 6.6 0.62 0.7 Sand Fine Sand AC 10 219 217.8 230.7 89.3 10 6 0.6 0.6 Sand Fine Sand C 50 256.4 251.3 258.7 94.6 5 3.4 0.69 0.4 Sand Median to
Course Sand
CH-1A-3 A 5 213 211.4 223.3 89.8 9.6 6 0.62 0.5 Sand Fine Sand AC 10 225.4 226.6 238.1 89.8 9.5 6.2 0.65 0.6 Sand Fine Sand C 50 225.7 221.8 227.5 93.9 5.6 3.9 0.71 0.5 Sand Fine Sand
CH-1B-1 AC 5 229.7 228.5 238.1 92 7.5 5.1 0.69 0.6 Sand Fine Sand C1 50 256 253.9 263.7 93.1 6.4 4.2 0.66 0.5 Sand Median to
Course Sand
Ab 100 274 272.7 288.8 89.9 9.5 5.8 0.62 0.6 Sand Median to Course Sand
C2 - - - - - - - - - - - CH-1B-2 AC 5 233.2 230.6 238.6 92.6 6.8 4.8 0.7 0.6 Sand Fine Sand
C1 50 259.3 254.6 261 94.7 4.8 3.2 0.66 0.5 Sand Median to Course Sand
Ab 135 238.7 239.8 253 89.6 9.7 6.3 0.64 0.7 Sand Fine Sand C2 - - - - - - - - - - -
CH-1B-3 AC 5 247.6 243.5 252.7 93.9 5.6 4.1 0.73 0.6 Sand Fine Sand C1 50 265.3 259.9 267.2 95.3 4.3 3 0.7 0.4 Sand Median to
Course Sand
Ab 160 251 248.1 256.8 93.4 6.1 4.1 0.66 0.5 Sand Median to Course Sand
C2 - - - - - - - - - - - CH-1C-1 A 5 239.5 239.4 251.3 91.7 7.7 5.1 0.66 0.6 Sand Fine Sand
C 10 240.4 238.8 247.6 92.7 6.8 4.3 0.64 0.5 Sand Fine Sand C 50 258.9 258.6 266.4 93.1 6.3 4.5 0.72 0.6 Sand Median to
Course Sand
CH-1C-2 A 5 220.2 220.9 231.1 90.8 8.6 5.7 0.67 0.6 Sand Fine Sand C 10 235.3 235.7 243.1 92.8 6.6 4.4 0.67 0.6 Sand Fine Sand C 50 248.4 247.6 258 92 7.2 4.9 0.67 0.8 Sand Fine Sand
CH-1C-3 A 5 238.7 238.8 246.2 93 6.5 4.3 0.66 0.5 Sand Fine Sand C 10 245.3 243 250.8 92.9 6.5 4.3 0.67 0.6 Sand Fine Sand C 60 248.1 251 260.6 90.8 8.6 5.7 0.67 0.6 Sand Fine Sand

52 | P a g e
Table 11: Particle Size Data for Soil Profiles at the Sand Hills Milepost 81 Sites
Profile Horizon Sample Depth
Mean (µm)
Median (µm)
Mode (µm)
Sand% Silt% Total
Silt% Fine
2-16(µm)
Silt Fine-Total
Ratio
Clay% Texture General
Texture Mean
MP81-1A-1 A 3 181.9 177.6 185.3 92.8 6.3 5 0.79 0.9 Sand Fine Sand C 10 204.2 197 203.3 95.4 3.9 2.9 0.74 0.7 Sand Fine Sand C 50 168.9 165.6 170.4 94.5 4.7 3.6 0.76 0.8 Sand Fine Sand
MP81-1A-2 A 2 188.8 183.4 191.4 93 6.2 4.7 0.76 0.7 Sand Fine Sand C 20 180.3 174.1 179.8 94.2 5 3.7 0.75 0.9 Sand Fine Sand C 70 168.1 161.6 171.6 91.1 7.6 5.2 0.68 1.3 Sand Fine Sand
MP81-1A-3 A 5 187 182 189.3 93.3 5.9 4.5 0.75 0.7 Sand Fine Sand C1 20 198.8 193.4 198.4 95.7 3.8 2.6 0.7 0.5 Sand Fine Sand C1 50 207.8 199 204 95.6 3.9 2.8 0.71 0.5 Sand Fine Sand Ab 70 233.7 220 229.4 96.4 3.1 2.2 0.7 0.5 Sand Fine Sand C2 - - - - - - - - - - -
MP81-1B-1 A 5 160.2 156.9 163.8 91.8 7.3 5.8 0.8 0.9 Sand Fine Sand C1 15 178.5 173.6 177.8 95 4.3 3.1 0.73 0.7 Sand Fine Sand Ab 40 187.4 181.5 187.9 94.1 5.1 3.7 0.73 0.8 Sand Fine Sand C2 - - - - - - - - - - -
MP81-1B-2 A 5 179 172 181.6 91.7 7.3 5.8 0.79 0.9 Sand Fine Sand C 20 179.3 172.8 177.8 94.7 4.5 3.4 0.75 0.8 Sand Fine Sand C 50 182.8 177.1 180.6 95.8 3.5 2.5 0.72 0.7 Sand Fine Sand
MP81-1B-3 A 5 213.6 202.1 211.3 94.3 4.9 3.9 0.78 0.8 Sand Fine Sand C1 20 221.4 209 216.4 96.3 3.1 2.2 0.73 0.6 Sand Fine Sand C1 50 182.5 175.2 180.5 95.1 4.1 3.1 0.76 0.9 Sand Fine Sand Ab 52 185.3 178.2 183.3 95.1 4.1 3.1 0.76 0.8 Sand Fine Sand C2 - - - - - - - - - - -
MP81-1C-1 A 5 189.9 183.7 189.7 94.5 4.7 3.5 0.74 0.7 Sand Fine Sand C 20 196.5 185.8 194.2 94 5.2 3.8 0.74 0.8 Sand Fine Sand C 62 157.8 153.8 158.7 94.7 4.4 3.4 0.77 0.9 Sand Fine Sand
MP81-1C-2 A 5 184.2 180 189.6 91.5 7.5 5.9 0.79 1 Sand Fine Sand C 20 214.8 206.6 212.7 95.9 3.5 2.4 0.7 0.7 Sand Fine Sand C 50 190.2 183 188.6 95.4 3.9 2.9 0.74 0.7 Sand Fine Sand
MP81-1C-3 A 5 198.9 190.8 197 94.7 4.6 3.5 0.76 0.8 Sand Fine Sand C 20 207.1 198.7 204.7 95.1 4.3 3.2 0.74 0.6 Sand Fine Sand C 60 186.2 180.5 185.4 95.7 3.6 2.5 0.69 0.7 Sand Fine Sand
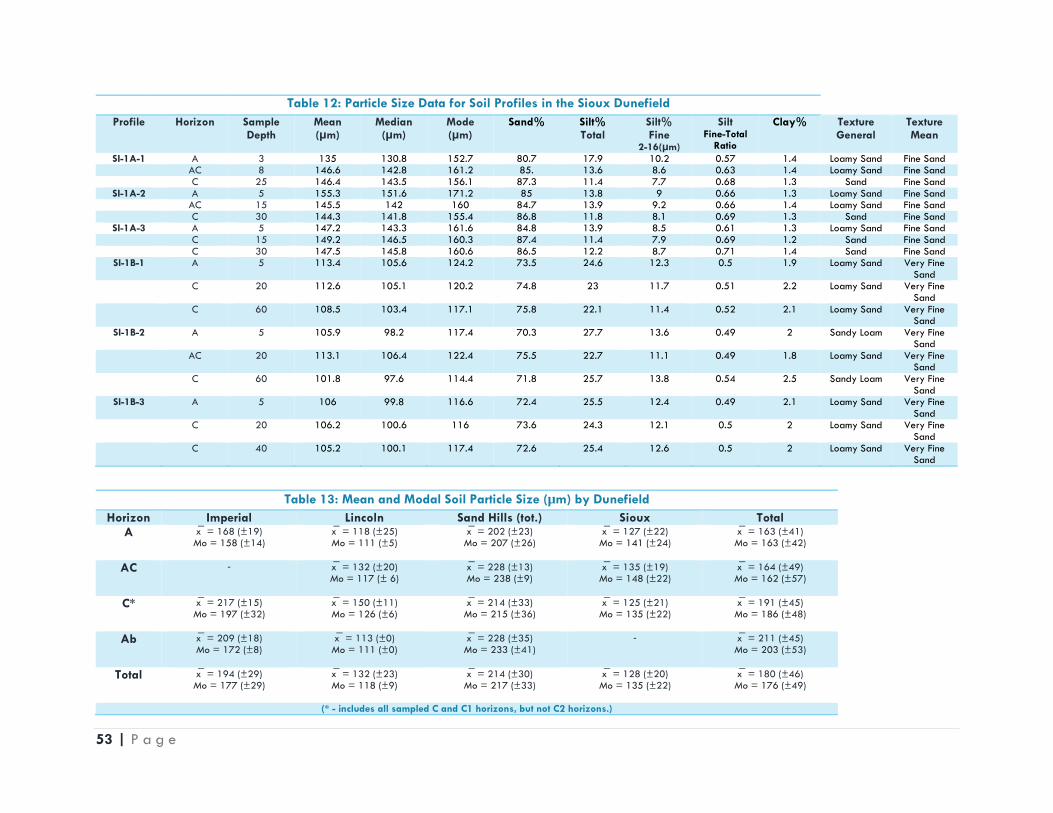
53 | P a g e
Table 12: Particle Size Data for Soil Profiles in the Sioux Dunefield Profile Horizon Sample
Depth Mean (µm)
Median (µm)
Mode (µm)
Sand% Silt% Total
Silt% Fine
2-16(µm)
Silt Fine-Total
Ratio
Clay% Texture General
Texture Mean
SI-1A-1 A 3 135 130.8 152.7 80.7 17.9 10.2 0.57 1.4 Loamy Sand Fine Sand AC 8 146.6 142.8 161.2 85. 13.6 8.6 0.63 1.4 Loamy Sand Fine Sand C 25 146.4 143.5 156.1 87.3 11.4 7.7 0.68 1.3 Sand Fine Sand
SI-1A-2 A 5 155.3 151.6 171.2 85 13.8 9 0.66 1.3 Loamy Sand Fine Sand AC 15 145.5 142 160 84.7 13.9 9.2 0.66 1.4 Loamy Sand Fine Sand C 30 144.3 141.8 155.4 86.8 11.8 8.1 0.69 1.3 Sand Fine Sand
SI-1A-3 A 5 147.2 143.3 161.6 84.8 13.9 8.5 0.61 1.3 Loamy Sand Fine Sand C 15 149.2 146.5 160.3 87.4 11.4 7.9 0.69 1.2 Sand Fine Sand C 30 147.5 145.8 160.6 86.5 12.2 8.7 0.71 1.4 Sand Fine Sand
SI-1B-1 A 5 113.4 105.6 124.2 73.5 24.6 12.3 0.5 1.9 Loamy Sand Very Fine Sand
C 20 112.6 105.1 120.2 74.8 23 11.7 0.51 2.2 Loamy Sand Very Fine Sand
C 60 108.5 103.4 117.1 75.8 22.1 11.4 0.52 2.1 Loamy Sand Very Fine Sand
SI-1B-2 A 5 105.9 98.2 117.4 70.3 27.7 13.6 0.49 2 Sandy Loam Very Fine Sand
AC 20 113.1 106.4 122.4 75.5 22.7 11.1 0.49 1.8 Loamy Sand Very Fine Sand
C 60 101.8 97.6 114.4 71.8 25.7 13.8 0.54 2.5 Sandy Loam Very Fine Sand
SI-1B-3 A 5 106 99.8 116.6 72.4 25.5 12.4 0.49 2.1 Loamy Sand Very Fine Sand
C 20 106.2 100.6 116 73.6 24.3 12.1 0.5 2 Loamy Sand Very Fine Sand
C 40 105.2 100.1 117.4 72.6 25.4 12.6 0.5 2 Loamy Sand Very Fine Sand
Table 13: Mean and Modal Soil Particle Size (µm) by Dunefield Horizon Imperial Lincoln Sand Hills (tot.) Sioux Total
A x̅ = 168 (±19) Mo = 158 (±14)
x̅ = 118 (±25) Mo = 111 (±5)
x̅ = 202 (±23) Mo = 207 (±26)
x̅ = 127 (±22) Mo = 141 (±24)
x̅ = 163 (±41) Mo = 163 (±42)
AC - x̅ = 132 (±20)
Mo = 117 (± 6)
x̅ = 228 (±13) Mo = 238 (±9)
x̅ = 135 (±19) Mo = 148 (±22)
x̅ = 164 (±49) Mo = 162 (±57)
C* x̅ = 217 (±15)
Mo = 197 (±32)
x̅ = 150 (±11) Mo = 126 (±6)
x̅ = 214 (±33) Mo = 215 (±36)
x̅ = 125 (±21) Mo = 135 (±22)
x̅ = 191 (±45) Mo = 186 (±48)
Ab x̅ = 209 (±18)
Mo = 172 (±8)
x̅ = 113 (±0) Mo = 111 (±0)
x̅ = 228 (±35) Mo = 233 (±41)
- x̅ = 211 (±45) Mo = 203 (±53)
Total x̅ = 194 (±29)
Mo = 177 (±29)
x̅ = 132 (±23) Mo = 118 (±9)
x̅ = 214 (±30) Mo = 217 (±33)
x̅ = 128 (±20) Mo = 135 (±22)
x̅ = 180 (±46) Mo = 176 (±49)
(* - includes all sampled C and C1 horizons, but not C2 horizons.)

54 | P a g e
Figure 9a-d: Boxplot Profiles of Mean Particle Size Data by Horizon by Dunefield

55 | P a g e
Figure 10a-d: Boxplot Profiles of Modal Particle Size Data by Horizon by Dunefield
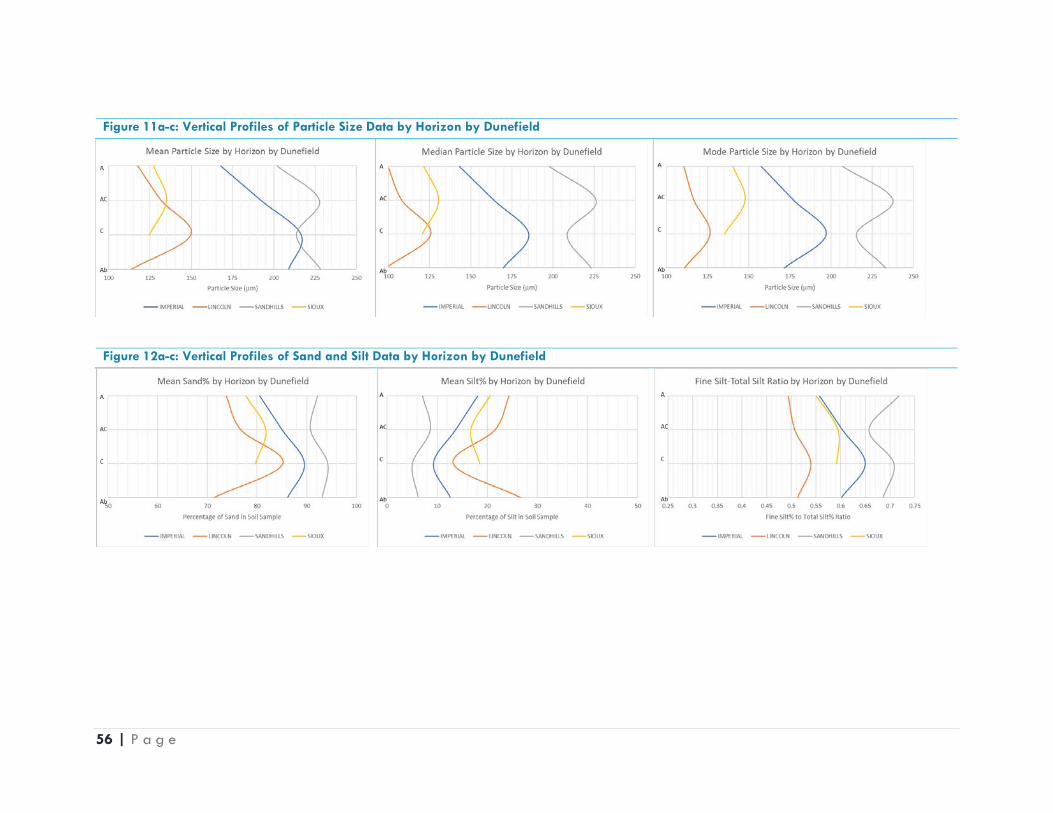
56 | P a g e
Figure 11a-c: Vertical Profiles of Particle Size Data by Horizon by Dunefield
Figure 12a-c: Vertical Profiles of Sand and Silt Data by Horizon by Dunefield

57 | P a g e
Loss-on-Ignition (LOI) The results of the loss-on-ignition (LOI) analysis produced an overall pattern to LOI values across
all dunefields that was related to pedology, but also illustrated differences between dunefields.
Across all dunefields, the loss of soil organic matter (SOM) on ignition decreased overall from the
A horizon to the C horizon (Figure 13a), then increased slightly for any buried A horizons present.
This general pattern is a trend seen in many of the analyses in this study, including the particle
size analysis, where the results have been aggregated by horizon and dunefield. This pattern
clearly is tied to pedologic horizon.
Yet, differences exist in the maximum value of LOI% in A horizons, its decrease with depth, and
the variance of the results. LOI% values for the Sand Hills sites were relatively low in the A and C
horizons when compared with results from the other three dunefields and exhibited very little
variance around the low mean LOI (Figure 15a & c). The mean LOI% for A horizons in the Sand
Hills was 0.32% (±0.08), while the next lowest mean A horizon LOI% values were 0.77% (±0.35)
for the Imperial Dunefield. The Lincoln and Sioux dunefields A horizon LOI% values were both
>1%. The three other dunefields exhibited roughly the same mean LOI% values for both A and C
horizons, which was higher than in the Sand Hills. The dunefields also differed in the ratio of A
horizon LOI% to C horizon LOI%. The metric could be interpreted as a measure of grassland
vegetation and pedogenesis, since presumably the parent material of a dunefield soil would be
sand and, thus, lacking SOM. For this metric, the results are bifurcated. The ratio of LOI% in the
A-to-C horizons is high – greater than 1.75 – for the Imperial and Lincoln dunefields and low –
less than 1.5 – for the Sand Hills and Sioux dunefields. This distribution clusters the two southern-
most dunefields together (Imperial and Lincoln) and the two northern-most dunefields together
(Sand Hills and Sioux).

58 | P a g e
Table 14a-c: Loss-on-Ignition (LOI) Values for Soil Profiles for the Imperial, Lincoln, and Lord Ranch Sites Profile Horizon Sample
Depth LOI% Profile Horizon Sample
Depth LOI% Profile Horizon Sample
Depth LOI%
IMP-1A-1 A 10 0.72 LI-1A-1 A 5 0.99 CH-1A-1 A 5 0.52 A 30 0.26 AC 20 0.83 AC 10 0.40 C 60 0.59 C 50 0.39 C 50 0.19
IMP-1A-2 A 10 0.73 LI-1A-2 A 5 0.76 CH-1A-2 A 5 0.37 A 30 0.46 AC 20 0.85 AC 10 0.48 C 60 0.55 C 60 0.37 C 50 0.10
IMP-1A-3 A 10 1.19 LI-1A-3 A 5 0.69 CH-1A-3 A 5 0.31 A 30 0.65 AC 20 0.90 AC 10 0.57 C 60 0.50 C 60 0.44 C 50 0.18
IMP-1B-1 A 5 0.79 LI-1B-1 A 3 1.45 CH-1B-1 AC 5 0.25 C 50 0.28 AC 10 0.98 C1 50 0.21 Ab 110 0.45 C 40 0.46 Ab 100 0.23
IMP-1B-2 A 5 0.53 LI-1B-2 A 3 0.92 C2 - - C 50 0.25 AC 10 0.72 CH-1B-2 AC 5 0.63 Ab 110 0.38 C 40 0.46 C1 50 0.83
IMP-1B-3 A 5 0.55 LI-1B-3 A 5 0.93 Ab 135 0.31 C 25 0.38 AC 10 0.72 C2 - - Ab 50 0.49 C 40 0.30 CH-1B-3 AC 5 0.13
IMP-1C-1 A 5 0.65 LI-1C-1 A 5 1.57 C1 50 0.10 AC1 - - AC 10 0.90 Ab 160 0.26 C1 50 0.28 C 40 0.80 C2 - - C2 110 0.22 LI-1C-2 A 5 1.12 CH-1C-1 A 5 0.29
IMP-1C-2 A 5 1.28 AC 20 0.67 C 10 0.27 AC1 - - C 60 0.71 C 50 0.19 C1 50 0.65 LI-1C-3 A 5 1.36 CH-1C-2 A 5 0.35 C2 110 0.32 AC 20 1.00 C 10 0.24
IMP-1C-3 A 5 1.39 C1 42 0.61 C 50 0.24 AC1 - - Ab 50 0.87 CH-1C-3 A 5 0.30 C1 50 0.35 C2 - C 10 0.22 C2 110 0.42 C 60 0.23
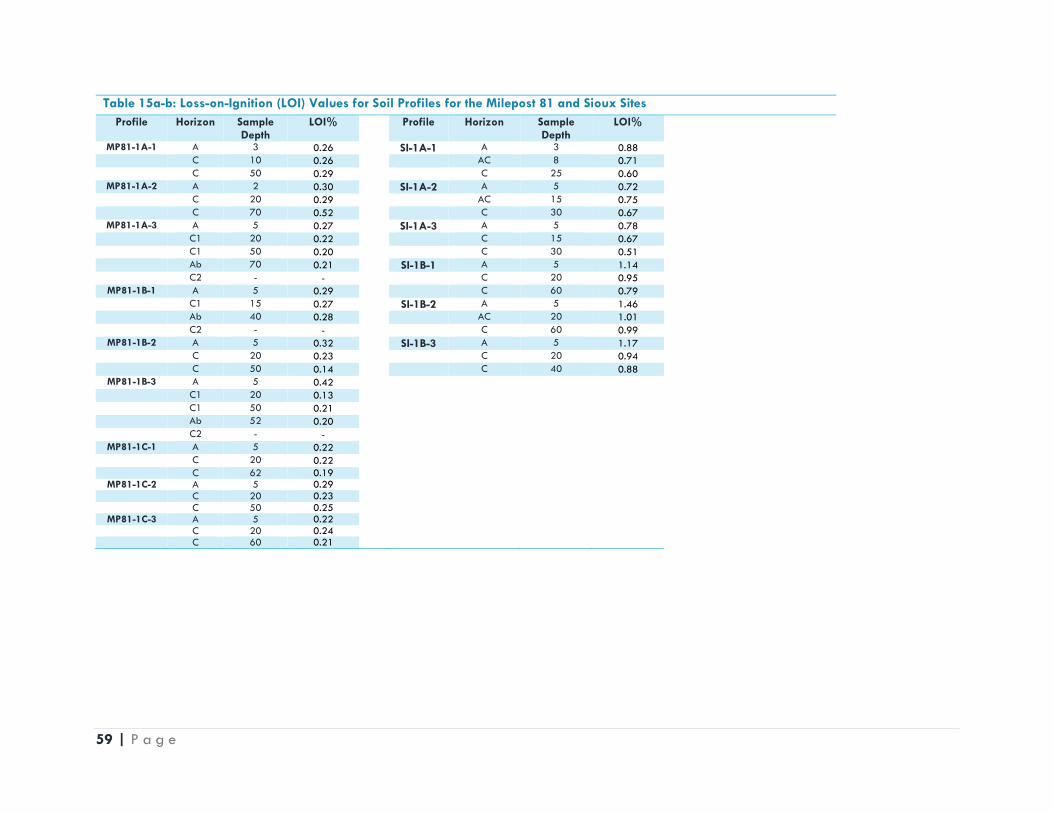
59 | P a g e
Table 15a-b: Loss-on-Ignition (LOI) Values for Soil Profiles for the Milepost 81 and Sioux Sites Profile Horizon Sample
Depth LOI% Profile Horizon Sample
Depth LOI%
MP81-1A-1 A 3 0.26 SI-1A-1 A 3 0.88 C 10 0.26 AC 8 0.71 C 50 0.29 C 25 0.60
MP81-1A-2 A 2 0.30 SI-1A-2 A 5 0.72 C 20 0.29 AC 15 0.75 C 70 0.52 C 30 0.67
MP81-1A-3 A 5 0.27 SI-1A-3 A 5 0.78 C1 20 0.22 C 15 0.67 C1 50 0.20 C 30 0.51 Ab 70 0.21 SI-1B-1 A 5 1.14 C2 - - C 20 0.95
MP81-1B-1 A 5 0.29 C 60 0.79 C1 15 0.27 SI-1B-2 A 5 1.46 Ab 40 0.28 AC 20 1.01 C2 - - C 60 0.99
MP81-1B-2 A 5 0.32 SI-1B-3 A 5 1.17 C 20 0.23 C 20 0.94 C 50 0.14 C 40 0.88
MP81-1B-3 A 5 0.42 C1 20 0.13 C1 50 0.21 Ab 52 0.20 C2 - -
MP81-1C-1 A 5 0.22 C 20 0.22 C 62 0.19
MP81-1C-2 A 5 0.29 C 20 0.23 C 50 0.25
MP81-1C-3 A 5 0.22 C 20 0.24 C 60 0.21

60 | P a g e
Figure 13: Loss-on-Ignition (LOI) Percentage by Horizon by Dunefield Figure 14: Ratio of LOI% A:C Horizon by Dunefield
Figure 15a-d: Loss-on-Ignition (LOI) Percentage by Horizon boxplots by Dunefield

61 | P a g e
Soil Organic Carbon (SOC) and Nitrogen (N) Similar to the other soil variable investigations in this thesis, the results of the soil organic carbon
(SOC) and nitrogen (N) analyses showed a strong pattern across all dunefields based on soil
horizon. On average, SOC and N decreased from the A to C horizons, then increased in any Ab
horizons present (Figure 16a-b). Other similarities across all dunefields with regards to SOC and
soil N include the C:N ratio (mass ratio, not molar), which was roughly 10:1 in all samples. Yet,
this ratio varied slightly by horizon. On average, the ratio decreased from the A to C horizon,
then rose in the Ab horizons (Figure 16c), even though the ratio did not deviate greatly from 10:1.
SOC and N usually are found in higher abundance at depths where organic matter is added to
the soil or was added in the past, in the upper horizons or in paleosols (Jobbagy and Jackson,
2000), although this pattern is not universal and can be controlled by vegetative and
anthropogenic influences (Omonode and Vyn, 2006). Thus, this pattern of decreasing amounts of
SOC and N from the A to the C horizons – where few roots are present or where soil
development has occurred the least – is unsurprising. The rise in SOC and N from the C horizons
to any lower Ab horizons also confirms the accuracy of field observations of pedologic profiles,
as buried A horizons are likely to have retained some SOC and N prior to the deposition of
eolian sand which would have lacked these elements. The somewhat higher content of SOC in
buried A horizons than in C horizons above and below them also supports previous findings of the
widespread sequestration of carbon in paleosols across the Great Plains (Marin-Spiotta et al.,
2014), although the total quantity sequestered is low in these sandy soils.
Despite the presence of these pronounced patterns across all dunefields in the study area, other
aspects of the SOC and N analyses demonstrate important differences between dunefields. The
Sand Hills sites registered the least amount of SOC and N in every horizon when compared to the
three other dunefields (Figure 16a-b). This feature was most distinct in the A horizon, where Sand

62 | P a g e
Hills sites on average recorded approximately 0.3% less SOC and 0.03% less N than the other
dunefields. The SOC and N values for all dunefield C horizons are more analogous, suggesting
that sandy parent material carries and developed little organic material and that the differences
in the A horizon between the Sand Hills and other dunefields may be attributable to soil
development and more stable vegetation. The Sand Hills sites also demonstrated the least
amount of variance in its SOC and N values (Figures 18a-d and Figure 19a-d), with a coefficient
of variance (CV) of 0.48, also signifying a greater confidence surrounding these values and, thus,
the lack of SOC and N in the A horizons of those Sand Hills sites.
As mentioned in the Study Area and Methods Section (Chapter 2), the SOC and N analyses
involved the use of a method which employed an organic elemental analyzer (EA). The use of an
EA to extract SOC values differs from the LOI method, which can be considered a measure of
SOM. Nevertheless, these two methods are presumed to be related. To test this idea and the
validity of the SOC and LOI results, a regression analysis was conducted of SOC% and LOI%
values for each soil sample site (Figure 17). The results of the regression analysis showed a strong
correlation between SOC% and LOI% with an R2-score of 0.86 . The results demonstrated the
applicability of both methods and the relationship between SOC and SOM.

63 | P a g e
Table 16a-c: Soil Organic Carbon (SOC) and Nitrogen Values for the Imperial, Lincoln, and Lord Ranch Sites Profile Horizon Sample
Depth C% N% Profile Horizon Sample
Depth C% N% Profile Horizon Sample
Depth C% N%
IMP-1A-1 A 10 0.35 0.04 LI-1A-1 A 5 0.42 0.04 CH-1A-1 A 5 0.25 0.02 A 30 0.26 0.03 AC 20 0.33 0.03 AC 10 0.23 0.02 C 60 0.20 0.02 C 50 0.08 0.01 C 50 0.11 0.01
IMP-1A-2 A 10 0.38 0.04 LI-1A-2 A 5 0.29 0.03 CH-1A-2 A 5 0.30 0.02 A 30 0.20 0.02 AC 20 0.36 0.04 AC 10 0.20 0.02 C 60 0.20 0.02 C 60 0.11 0.01 C 50 0.06 0.01
IMP-1A-3 A 10 0.66 0.07 LI-1A-3 A 5 0.31 0.03 CH-1A-3 A 5 0.18 0.02 A 30 0.27 0.03 AC 20 0.39 0.04 AC 10 0.16 0.02 C 60 0.16 0.02 C 60 0.19 0.02 C 50 0.08 0.01
IMP-1B-1 A 5 0.44 0.04 LI-1B-1 A 3 0.63 0.06 CH-1B-1 AC 5 0.17 0.02 C 50 0.07 0.01 AC 10 0.41 0.04 C1 50 0.09 0.01 Ab 110 0.16 0.02 C 40 0.07 0.01 Ab 100 0.14 0.01
IMP-1B-2 A 5 0.28 0.03 LI-1B-2 A 3 0.34 0.03 C2 - - - C 50 0.11 0.01 AC 10 0.29 0.03 CH-1B-2 AC 5 0.12 0.01 Ab 110 0.15 0.02 C 40 0.07 0.01 C1 50 0.08 0.01
IMP-1B-3 A 5 0.31 0.03 LI-1B-3 A 5 0.42 0.04 Ab 135 0.13 0.02 C 25 0.16 0.02 AC 10 0.31 0.03 C2 - - - Ab 50 0.20 0.02 C 40 0.05 0.01 CH-1B-3 AC 5 0.05 0.01
IMP-1C-1 A 5 0.33 0.03 LI-1C-1 A 5 0.87 0.08 C1 50 0.04 0.005 AC1 - - - AC 10 0.51 0.05 Ab 160 0.10 0.01 C1 50 0.10 0.01 C 40 0.40 0.04 C2 - - - C2 110 0.07 0.01 LI-1C-2 A 5 0.51 0.05 CH-1C-1 A 5 0.14 0.01
IMP-1C-2 A 5 0.72 0.07 AC 20 0.30 0.03 C 10 0.14 0.01 AC1 - - - C 60 0.27 0.03 C 50 0.08 0.01 C1 50 0.11 0.01 LI-1C-3 A 5 0.71 0.07 CH-1C-2 A 5 0.14 0.01 C2 110 0.09 0.01 AC 20 0.37 0.04 C 10 0.11 0.01
IMP-1C-3 A 5 0.87 0.08 C1 42 0.22 0.02 C 50 0.12 0.01 AC1 - - - Ab 50 0.33 0.03 CH-1C-3 A 5 0.11 0.01 C1 50 0.10 0.01 C2 - - - C 10 0.10 0.01 C2 110 0.06 0.01 C 60 0.11 0.01
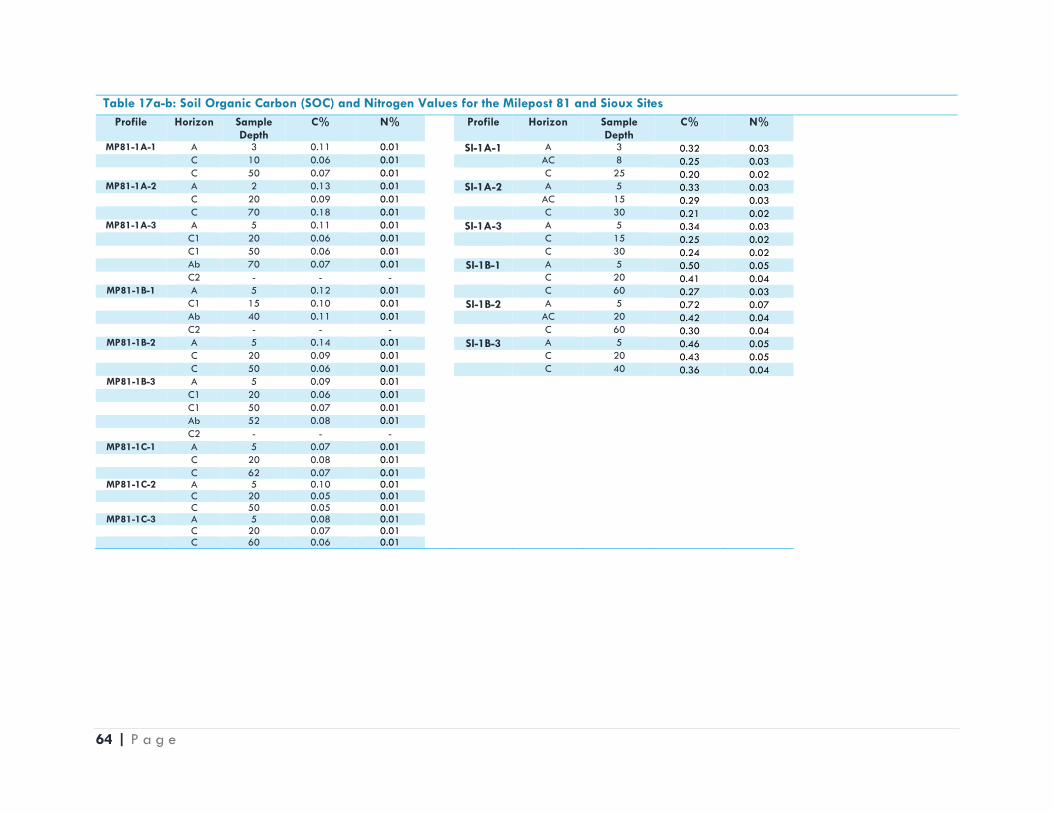
64 | P a g e
Table 17a-b: Soil Organic Carbon (SOC) and Nitrogen Values for the Milepost 81 and Sioux Sites Profile Horizon Sample
Depth C% N% Profile Horizon Sample
Depth C% N%
MP81-1A-1 A 3 0.11 0.01 SI-1A-1 A 3 0.32 0.03 C 10 0.06 0.01 AC 8 0.25 0.03 C 50 0.07 0.01 C 25 0.20 0.02
MP81-1A-2 A 2 0.13 0.01 SI-1A-2 A 5 0.33 0.03 C 20 0.09 0.01 AC 15 0.29 0.03 C 70 0.18 0.01 C 30 0.21 0.02
MP81-1A-3 A 5 0.11 0.01 SI-1A-3 A 5 0.34 0.03 C1 20 0.06 0.01 C 15 0.25 0.02 C1 50 0.06 0.01 C 30 0.24 0.02 Ab 70 0.07 0.01 SI-1B-1 A 5 0.50 0.05 C2 - - - C 20 0.41 0.04
MP81-1B-1 A 5 0.12 0.01 C 60 0.27 0.03 C1 15 0.10 0.01 SI-1B-2 A 5 0.72 0.07 Ab 40 0.11 0.01 AC 20 0.42 0.04 C2 - - - C 60 0.30 0.04
MP81-1B-2 A 5 0.14 0.01 SI-1B-3 A 5 0.46 0.05 C 20 0.09 0.01 C 20 0.43 0.05 C 50 0.06 0.01 C 40 0.36 0.04
MP81-1B-3 A 5 0.09 0.01 C1 20 0.06 0.01 C1 50 0.07 0.01 Ab 52 0.08 0.01 C2 - - -
MP81-1C-1 A 5 0.07 0.01 C 20 0.08 0.01 C 62 0.07 0.01
MP81-1C-2 A 5 0.10 0.01 C 20 0.05 0.01 C 50 0.05 0.01
MP81-1C-3 A 5 0.08 0.01 C 20 0.07 0.01 C 60 0.06 0.01

65 | P a g e
Figure 16a-c: Soil Organic Carbon% (SOC), Nitrogen%, and Carbon%-to-Nitrogen% Ratio by Horizon by Dunefield
Figure 17: Regression Analysis of Soil Organic Carbon% (SOC) – Loss-on-Ignition% (LOI) Results

66 | P a g e
Figure 18a-d: Boxplot Profiles of Soil Organic Carbon% Data by Horizon by Dunefield

67 | P a g e
Figure 19a-d: Boxplot Profiles of Soil Nitrogen% Data by Horizon by Dunefield

68 | P a g e
Cation Exchange Capacity (CEC) Results for soil cation exchange capacity (CEC) did not follow the pedological patterns exhibited
in the investigations of particle size, soil organic matter, soil organic carbon, or soil nitrogen.
Instead, the average CEC decreased from A through AC to C, and did not increase again in Ab
horizons (Figure 20). Results for the Imperial Dunefield were typical, with an average CEC of
6.24 (±0.98) cmol+ kg-1 in the A horizon, a CEC value of 4.9 (±0.84) cmol+ kg-1 in the C horizon,
and a CEC from one data point of 4.04 cmol+ kg-1 in the Ab horizon. The analysis may be
hindered by a limited sample size, but, with the exception of the Sioux Dunefield, the results for
CEC did not generate much variance. The standard deviation of CEC values by horizon in each
dunefield other than the Sioux Dunefield was less than 1. The variance of CEC values in the Sioux
Dunefield likely can be explained by the low CEC values from one site – SI-A1-3. This site’s
geomorphology – on a sand sheet downwind from a larger dune – is different from the two other
Sioux Dunefield sites.
Despite this, some differences with regards to CEC emerge between the dunefields. The four
dunefields can be arrayed in a sequence from least to greatest CEC across all horizons. The
Sand Hills exhibited the lowest CEC, followed by the Imperial, Lincoln, and lastly Sioux dunefields.
As CEC may be largely due to negative charges on SOM in these clay-poor soils, it is not
surprising to see some similarities between CEC values and the A horizon SOC content found in
carbon and nitrogen analysis (Figures 16a-b, 20). Unfortunately, these results for the analysis of
CEC make it difficult to draw firmer conclusions.

69 | P a g e

70 | P a g e
Table 19a-b: Cation Exchange Capacity (CEC) Values for the Milepost 81 and Sioux Sites Profile Horizon Sample
Depth CEC
(cmol+ kg-1) Profile Horizon Sample
Depth CEC
(cmol+ kg-1) MP81-1A-1 A 3 4.31 SI-1A-1 A 3 -
C 10 3.17 AC 8 - C 50 3.75 C 25 -
MP81-1A-2 A 2 - SI-1A-2 A 5 - C 20 - AC 15 - C 70 - C 30 -
MP81-1A-3 A 5 - SI-1A-3 A 5 7.30 C1 20 - C 15 8.26 C1 50 - C 30 5.84 Ab 70 - SI-1B-1 A 5 11.28 C2 - - C 20 9.07
MP81-1B-1 A 5 - C 60 11.77 C1 15 - SI-1B-2 A 5 10.92 Ab 40 - AC 20 9.73 C2 - - C 60 10.87
MP81-1B-2 A 5 - SI-1B-3 A 5 - C 20 - C 20 - C 50 - C 40 -
MP81-1B-3 A 5 4.85 C1 20 3.12 C1 50 6.03 Ab 52 - C2 - -
MP81-1C-1 A 5 3.83 C 20 3.67 C 62 2.59
MP81-1C-2 A 5 - C 20 - C 50 -
MP81-1C-3 A 5 - C 20 - C 60 -

71 | P a g e
Figure 20: Cation Exchange Capacity (CEC) by Horizon by Dunefield
Figure 21a-b: Boxplot Profiles of Cation Exchange Capacity (CEC) by Horizon by Dunefield

72 | P a g e
Analysis of Variation of Soil Properties Among Horizons and Dunefields A recurring trend in the results of soil variable analyses were differences between dunefields and
horizons. For example, the mean soil particle size for the Sand Hills sites were coarsest, followed
by the Imperial Dunefield (Table 13, Figure 9). Results for mean soil particle size for the Lincoln
and Sioux Dunefields were more clustered together and relatively finer – although still sandy and
above 100µm in general overall. Furthermore, the values for soil metrics varied with soil horizon
down through the profile. To understand whether these differences among dunefields and among
horizons within dunefields are statistically significant, a series of analyses of variance (ANOVAs)
were performed. Two sets of one-way ANOVAs tested horizon and dunefield separately as
factors in the differences in soil variables. A set of two-way ANOVAs tested horizon and
dunefields together as factors to ascertain if one factor was more significant in determining
differences in soil variable results.
Results from the one-way ANOVAs where dunefield is the factor show that soil properties differ
significantly by dunefield, as P-values are very low (Table 20). Dunefield influence was also
strong in the two-way ANOVAs (Table 22). This strong geographic influence on soil properties
could be explained by differences in frequency of recent reactivation or by variation of the
composition of the aeolian sand parent material across the various dunefields. The soil properties
in dunefields with choppy, rough surfaces and frequently active dunes may diverge from soil
properties in more stable, smoother dunefields. Likewise, provenance studies show that the C
horizon parent material in these different regional dunefields have somewhat different
sedimentary origins (Muhs, 2017).
Unlike the dunefield ANOVA results, the results for horizon factors were mixed (Table 21-22).
The influence of soil profile development, as expressed by pedogenic horizons, appears
relatively strong for three metrics regardless of dunefield – LOI%, SOC%, and soil N%. For the

73 | P a g e
Lincoln Dunefield, horizon is a strong influence on all soil properties tested, with the exception of
CEC. This suggests that pedogenesis in the Lincoln Dunefield is more advanced, possibly because
of the lack of recent dune activity or because this dunefield contains finer sand that is more
conducive to pedogenesis, as indicated by the dunefield’s lower modal grain size. Soil profile
horizon seems to have a mixed influence of soil properties, varying by dunefield and metric.
Again, this mixed result may be indicative of the differential nature of pedogenesis and parent
material.
Table 20: Summary of One-Way ANOVA Results with Dunefield as the Factor Horizon
Particle Size Median
Particle Size Mode
LOI% (SOM)
SOC% N% CEC
Dunefield is factor
F-Test P-Value F-Test P-Value F-Test P-Value F-Test P-Value F-Test P-Value F-Test P-Value
A 55.5 <0.001 49.4 <0.001 20.8 <0.001 12.6 <0.001 14.1 <0.001 16.3 0.002 AC 690.1 <0.001 965.6 <0.001 29.9 <0.001 33.6 <0.001 38 <0.001 35.2 0.01 C 39.7 <0.001 31.8 <0.001 39.4 <0.001 34 <0.001 36.6 <0.001 23.8 <0.001
Ab 7.7 0.017 6.8 0.023 78.3 <0.001 26 <0.001 15 0.003 N/A N/A
Table 21: Summary of One-Way ANOVA Results with Horizon as the Factor Dunefield
Particle Size Median
Particle Size Mode
LOI% (SOM)
SOC% N% CEC
Horizon is factor
F-Test P-Value F-Test P-Value F-Test P-Value F-Test P-Value F-Test P-Value F-Test P-Value
Imperial 18.7 <0.001 8.7 0.001 3.2 0.032 6.4 0.001 6.3 0.002 2.4 0.207 Lincoln 20.1 <0.001 11.5 <0.001 11.2 <0.001 8.8 <0.001 9.2 <0.001 0.3 0.764
Sand Hills 1.7 0.175 1.8 0.157 3.5 0.021 7.8 <0.001 7.1 <0.001 1 0.413 Sioux <0.1 0.899 <0.1 0.848 5.1 0.038 6.6 0.021 4.6 0.047 0.1 0.713
Table 22: Summary of Two-Way ANOVA Results with Dunefield and Horizon as the Factors Factor
Particle Size
Median Particle Size
Mode LOI% (SOM)
SOC% N% CEC
Two-Way ANOVA
F-Test P-Value F-Test P-Value F-Test P-Value F-Test P-Value F-Test P-Value F-Test P-Value
Dunefield 123.1 <0.001 103.1 <0.001 61.9 <0.001 35.6 <0.001 39.1 <0.001 58.2 <0.001 Horizon 5.7 0.001 3.4 0.019 9.2 <0.001 20.8 <0.001 19.1 <0.001 1.6 0.193

74 | P a g e
GIS Analyses Dune Geomorphology The geomorphic analysis of terrain data utilized GIS tools. Hillshade profiles of each sample site
were generated from either 2m LiDAR-based digital elevation models (DEMs) or 10m DEMs, if the
former were not available (Figures 22a-26a). The hillshade profiles show that the five study sites
chosen for this thesis can be categorized into three different dune morphologies. First, the
Imperial and Sioux dunefield sites can be classified as compound parabolic dunes with a clear
northwest-to-southeast orientation. Sioux site 1A may be located on a sand sheet downwind of a
large parabolic dune complex, while site 1B sits at the foredune of such a complex. Nevertheless,
the two Sioux sites and the study locations for the Imperial Dunefield demonstrate the typical
hairpin, hemicyclid, and nested morphologies typical of parabolic dunes (Pye and Tsoar, 2009).
The second dune classification present in the study area as evidenced by the hillshade analysis is
the hummocky sand sheet of the Lincoln Dunefield. Here, the relief is minimal compared with the
other sites and the morphology lack a discernable pattern. Finally, the last dune classification
present is the complex tranverse dune systems of the two sites in the Sand Hills. These sites are
located within a linear train of large-relief dune systems in which blowouts and other dune types
can be found, often overlapping each other. This geographic categorization of dune types – with
complex transverse dunes comprising the central Sand Hills, parabolic dunes comprising satellite
dunefields to the west and south, and hummocky sand sheets peppered throughout – fits the
general distribution pattern described in some other studies, including Loope and Swinehart
(2000).
In further keeping with these dune classifications, most dune surfaces sampled for this thesis have
westward aspects, with an azimuth heading between 200-360° (Table 23). The only two sites
with contrary aspects were two sites likely located within sand sheets – Sioux site 1A and Lincoln
site 1B. This is logical as a larger proportion of dune surfaces would be oriented windward, as

75 | P a g e
opposed to the more compact slip faces on the leeward side. Other geomorphic characteristics
proved to be less uniform. GIS curvature values show a mixture of concave and convex, and
divergent and convergent landforms. Thus, no pattern to the curvature results is evident, but this
could be indicative of surficial variability and roughness. However, the curvature analyses often
resulted in different outcomes depending upon the dataset used. Where available, analyses
using the 2m DEM data were performed (Table 24). These higher-resolution analyses were not
used in any advanced comparisons as the 2m DEM data exists only for two locations – the
Imperial Dunefield and the Lord Ranch Sand Hills site – but they often resulted in outcomes
different from the analyses conducted with the 10m DEM data, even though the DEMs used for
these two sites were degraded 2m DEMs. For example, the differences between the standard
deviations for both elevation and slope at each transect were almost always greater with the 2m
DEM data (Table 24). Likewise, the two analyses produced difference curvature results for sites
such as IMP-1A, from flat-convergent with 10m data, to convex-divergent with 2m data (Tables
23-24). At site CH-1B, which was a large blowout ~5m deep, the 2m DEM data perhaps
captured the geomorphology better by finding the sample site to be convex and linear, with a
flat plan curvature, which seems logical for the face of a blowout. The analysis with the 10m
data, on the other hand, pronounced the CH-1B site to be convex-divergent, which seems less
reasonable.
Surface Roughness As discussed in the Study Area and Methods section, different metrics were tested with the aim of
understanding surface roughness – a potential indicator of dune status and activity. The standard
deviations of elevation, slope, and curvature all could provide valuable insight with regards to
surface roughness. These metrics were calculated from 10m DEM data for each of the standard
deviations (Table 23), while maps were produced to visualize the standard deviations for
elevation and slope (Figures 22b-c—26b-c). These values and maps suggest that the two Sand

76 | P a g e
Hills sites are surficially the roughest, followed by the Imperial Dunefield sites. The Sioux
Dunefield exhibits pronounced roughness near the large parabolic dune complexes, while the
Lincoln Dunefield is the least variable in terms of surface roughness. This hierarchy of roughness
was also demonstrated with some variation in boxplots visualizing the standard deviations of
elevation, slope, overall curvature, and profile and plan curvature (Figures 27-28).
These geomorphic results were subjected along with the findings from other analyses to more
advanced statistical investigations, as described in the next subsection. Yet, questions exist
regarding the use of these metrics based on local variance of terrain attributes to describe
surface roughness. Arguments can be made for any of the metrics, but a regression analysis was
used to identify any relationships between the standard deviations of elevation, slope, and
curvature (Figures 30-32). While all three metrics appeared to be related – an unsurprising
finding based upon the interrelated nature of landforms – the relationship between the standard
deviation of elevation and the standard deviation of curvature was the strongest, with an R2-score
of 0.75. This suggests that any statistical analysis testing both the standard deviations of
elevation and curvature should be similar, with the possibility that one metric is a slightly better
indicator or predictor of surface roughness than the other. Thus, in addition to the standard
deviation of slope, both the standard deviations of elevation and curvature were tested in a
series of simple linear regression analyses which sought to determine the relationships between
surface roughness and soil variables, the results of which are presented in the next subsection.

77 | P a g e
Table 23: Results of Geomorphic Analyses for All Dunefield Sites from 10m DEMs Transect Dunefield Elevation
(m) Elevation St. Dev.
3x3
Aspect Slope (degrees)
Slope St. Dev.
Curvature Curvature St. Dev.
Profile Profile Description
Plan Plan Description
IMP-1A Imperial 1017.9 0.162 Southwest 0.62 0.36 -0.58 0.44 0.08 Flat -0.51 Convergent IMP-1B Imperial 1026.2 0.598 North 2.91 1.15 0.59 1.87 0.14 Concave 0.73 Divergent IMP-1C Imperial 1023 1.024 Northwest 5.86 3.54 2.61 1.27 -2.28 Convex 0.33 Divergent
LI-1A Lincoln 920.8 0.940 West 5.38 1.89 -2.13 1.96 1.89 Concave -0.24 Convergent LI-1B Lincoln 913.8 0.287 Northeast 1.57 1.06 -0.61 0.68 0.15 Concave -0.46 Convergent LI-1C Lincoln 909.5 0.365 West 2.35 0.45 1.22 0.66 -0.46 Convex 0.76 Divergent
CH-1A Sand Hills 883.7 0.647 West 4.65 2.07 -2.86 1.53 1.61 Concave -1.25 Convergent CH-1B Sand Hills 899.1 1.795 Southwest 12.41 3.24 2.34 4.45 -0.83 Convex 1.51 Divergent CH-1C Sand Hills 886.9 1.322 West 8.85 2.72 2.11 3.63 -0.70 Convex 1.41 Divergent
MP81-1A Sand Hills 1016.8 0.863 West 5.23 2.55 -1.22 2.80 -0.41 Convex -1.63 Convergent MP81-1B Sand Hills 1012.9 0.806 West 4.41 1.75 -1.83 1.86 0.71 Concave -1.12 Convergent MP81-1C Sand Hills 1014.7 1.183 West 8.03 1.04 1.22 1.34 -0.36 Convex 0.86 Divergent
SI-1A Sioux 1432.3 0.434 East 2.84 0.93 -0.30 0.45 0.30 Concave 0.00 Linear SI-1B Sioux 1422.5 0.392 Northwest 2.49 0.85 0.00 0.86 0.23 Concave 0.23 Divergent
Table 24: Results of Geomorphic Analyses for the Imperial Dunefield and Lord Ranch Sand Hills Sites from 2m LiDAR-based DSMs (where available) Transect Dunefield Elevation
(m) Elevation St. Dev. 15x15
Diff. Btw. Elv. S.D. 2m-10m
Slope (degrees)
Slope St. Dev.
Diff. Btw. Slope S.D. 2m-10m
Curvature Profile Profile Description
Plan Plan Description
IMP-1A Imperial 1018.0 0.240 +0.078 1.02 1.83 +1.47 2.34 -1.31 Convex 1.03 Divergent IMP-1B Imperial 1025.6 0.592 -0.006 2.44 5.85 +4.70 -3.81 1.43 Concave -2.39 Convergent IMP-1C Imperial 1023.3 0.946 -0.078 1.95 8.35 +4.81 1.72 0.25 Concave 1.97 Divergent
CH-1A Sand Hills 884.1 0.771 +0.124 16.37 4.64 +2.57 -9.23 5.86 Concave -3.36 Convergent CH-1B Sand Hills 899.1 1.915 +0.120 26.47 7.70 +4.46 3.94 -3.92 Convex 0.03 Linear CH-1C Sand Hills 887.7 1.354 +0.031 22.02 5.03 +2.31 -0.88 -0.42 Convex -1.31 Convergent

78 | P a g e
Figures 22a-c: Hillshade, Standard Deviation of Elevation, and Standard Deviation of Slope Maps for the Imperial Dunefield Sites
Figures 23a-c: Hillshade, Standard Deviation of Elevation, and Standard Deviation of Slope Maps for the Lincoln Dunefield Sites

79 | P a g e
Figures 24a-c: Hillshade, Standard Deviation of Elevation, and Standard Deviation of Slope Maps for the Lord Ranch Sand Hills Sites
Figures 25a-c: Hillshade, Standard Deviation of Elevation, and Standard Deviation of Slope Maps for the Milepost 81 Sand Hills Sites

80 | P a g e
Figures 26a-c: Hillshade, Standard Deviation of Elevation, and Standard Deviation of Slope Maps for the Sioux Dunefield Sites
Figures 27a-b: Standard Deviation of Elevation and Standard Deviation of Slope Comparisons by Dunefields, Values for Individual Sites

81 | P a g e
Figures 28a-c: Standard Deviation of the Three Curvature Metrics by Dunefields
Figures 29a-c: Regression Analysis of Different Surface Roughness Metrics by Dunefields
Table 25: Summary of Regression Analyses R2-Scores Standard Deviation
Metric
Particle Size
Mode
Particle Size
Mean
Fine Silt% Sand% LOI% (SOM)
SOC% N% CEC
Elevation 0.474 0.432 0.412 0.371 0.334 0.318 0.327 0.314 Curvature 0.52 0.484 0.431 0.406 0.395 0.392 0.398 0.365
Slope 0.33 0.327 0.221 0.182 0.137 0.088 0.102 0.177

82 | P a g e
Statistical Analyses of Relationships Between Soil and Topographic Variables Simple Linear Regression Analyses of Surface Roughness The hypothesis of this thesis is that dunes with a relative recent history of activity as indicated by
surface morphology should have less developed soils, which have properties less conducive to
plant growth. If a dune’s surface roughness, indicated by standard deviations of elevation, slope,
or curvature is indicative of frequent reactivation in the recent past, as this study assumes, then
there should be a relationship between surface roughness and soil variables. For example, dunes
with a large standard deviation of elevation should also have a coarse mean soil particle size in
the A horizon, as dune activity would result in the entrainment and removal of silt-sized particles.
To determine if a relationship between surface roughness and soil variables exists, a series of
simple linear regression analyses were conducted. For these regression analyses, the indicators of
surface roughness at each sample site were set as independent variables. Dependent variables
were the results of each soil analysis from the A horizon – soil particle size, soil organic matter as
expressed as loss-on-ignition percentage, soil organic carbon, soil nitrogen, and cation exchange
capacity.
The results of these simple linear regression analyses show that dunes with a higher standard
deviation of curvature have A horizon properties reflecting greater accumulation of SOM and silt
in general and fine silt in particular, as well as higher CEC (Table 25). For every soil variable
tested, the standard deviation of curvature had a stronger relationship than did the standard
deviation of elevation. Likewise, the standard deviation of elevation had higher R2-scores for
every soil measure than recorded for the standard deviation of slope, which had several weak
relationships with soil variables, particularly the percentage of A horizon sand, LOI%, SOC%,
N%, and CEC. The strongest relationship seen in the data is between standard deviation of
curvature and modal particle size. These results suggest coarser modal and mean soil particle
size are strongly associated with highly variable, choppy landscapes, which have likely

83 | P a g e
experienced relatively recent dune activation, while a finer particle size mode and mean are
related to smoother surfaces.

84 | P a g e
Figures 30a-h: Simple Linear Regression Analysis for Standard Deviation of Elevation and Soil Variables

85 | P a g e
Figures 31a-h: Simple Linear Regression Analysis for Standard Deviation of Curvature and Soil Variables

86 | P a g e
Figures 32a-h: Simple Linear Regression Analysis for Standard Deviation of Slope and Soil Variables
87 | P a g e
CHAPTER 4: Discussion and Conclusions Discussion The results of the soil and geomorphic analyses largely support the hypothesis of this thesis.
Greater accumulations of silt-sized particles, SOC, soil nitrogen, SOM, and CEC were found in the
A horizons of dunes with topography indicative of longer periods of stability, and thus,
pedogenesis. The opposite was true as well; dunes with topography assumed to represent more
frequent recent reactivation were found to have minimal accumulation of silt and clay and lower
SOC, soil nitrogen, SOM, and CEC in the A horizon. This pattern is evident when the results for
sites in the Sand Hills are compared to those obtained in other dunefields. At both the Lord Ranch
and Milepost 81 sites bare sand patches and blowouts were observed while in the field, more so
than at any other site. Unsurprisingly, the geomorphic analyses of the terrain found the Sand Hills
sites to be rougher, as measured by the standard deviations of elevation and curvature, when
compared to the other study areas. This indicates that the Sand Hills had been reactivated more
recently and likely more frequently, causing a complex and choppy landscape to emerge.
Consequently, the Sand Hills sites had lower CEC and less silt and clay, SOC, soil nitrogen, and
SOM in the A horizon when compared to sites sampled elsewhere, suggesting a stunted
pedogenic period interrupted by sand reactivation and blowouts.
If the Sand Hills sites’ topography indicated more frequent recent reactivation, then the Sioux and
Lincoln dunefield sites have been the most stable in recent times of those studied here. Both of the
latter dunefields were the smoothest in terms of the roughness metrics and had relatively high
concentrations of fine particles in A horizons. Both sites had greater accumulations of organic
carbon, nitrogen, SOM, and CEC in the A horizon than the Sand Hills sites, with the Sioux
Dunefield sites recording over twice the mean CEC in the A horizon as the mean of the Sand Hills
sites. The Imperial Dunefield sites were rougher than the Lincoln and Sioux sites, but smoother
than the Sand Hills sites. The results for the Imperial Dunefield soil and roughness analyses were

88 | P a g e
often between those for the Sand Hills and Lincoln/Sioux results, suggesting more recent
reactivation than the Sioux and Lincoln dunefields, but less than the dunes in Sand Hills.
The trends in soil properties from the Sand Hills sites through the Imperial dunefield sites to those
in the Lincoln and Sioux dunefields clearly resemble trends observed in studies of the changes
following dune stabilization. As reviewed earlier in Section 1, stabilized dunes often accumulate
fine particles in near-surface layers, probably through dust trapping by vegetation (Hugenholtz
and Koenig, 2014; Shay et al., 2000; Wang et al., 2005; Yan et al., 2011). Shay et al. (2000)
also found progressive increases in SOM and some nutrients in surface horizons, from active
through recently stabilized to long-stabilized dunes. These parallel trends support the inference
that the contrasts in particle size and A horizon properties between sites sampled in this study
reflect differences in recent history of dune activity, as reflected by dune surface topography.
Taken together, the results of this study suggest a varied and regionalized response to the factors
driving dune reactivation and/or stabilization on the west central Great Plains. Based on the
progress of pedogenesis and the roughness at each site, it is clear some dunefields—or at least
parts of some dunefields—have experienced surficial reactivation more frequently than others,
despite being geographically in the same Great Plains region. While there is a danger of
extrapolating results from individual sites to make conclusions about entire dunefields, the rough
topography of the sampled dunes in the Sand Hills appears to be characteristic of a large
fraction of that dunefield, while smoother topography characterizes large areas of the smaller
regional dunefields. The sampled site in the Imperial Dunefield suggests more frequent
reactivation than those sampled in the Lincoln and Sioux dunefields, but additional work would be
needed to test whether the Imperial Dunefield as a whole has characteristics intermediate
between the Sand Hills and the other two smaller dunefields. The climate for the four dunefields
is largely the same, yet their late Holocene history of reactivation may differ, as the results of the

89 | P a g e
soil and roughness analyses demonstrate. In fact, the dunefield in the driest climate, where
reactivation might be expected to be most frequent – the Sioux Dunefield of far western
Nebraska – has the smoothest topography, and the most mature soil development, even more so
than the sites in the Lincoln Dunefield. Thus, it appears as though climate cannot explain the
apparent variation in frequency of reactivation among these dunefield sites. If that is true, then
other factors must account for these differences.
In the dune reactivation model proposed by Barchyn and Hugenholtz (2013b), some type of
disturbance is required to initiate the reactivation process. The disturbance can range from long-
term changes in climate to short-term storminess, from fire to anthropogenic effects such as locally
heavy livestock grazing. It is often difficult to observe the disturbance which sparks the
reactivation process, and this study provides little evidence on types of disturbance that could
have led to more frequent reactivation in the Sand Hills. However, it is possible to rule out some
types of disturbance as likely causes of the increased reactivation in the Sand Hills and, to a
lesser extent, the Imperial Dunefield. While rare extreme windstorms or large wildfires might
lead to local short-term reactivation, it is unlikely that individual events can explain the observed
contrast between dunefields, especially given the extensive areas of rough topography in the
Sand Hills as compared to the other dunefields. Moreover, while it is true that evidence of
anthropogenic disturbance was observed at the two Sand Hills dunefield sites, there was evidence
of human influence on the landscape at all five sites. Cow paths were evident in the dunes at the
Lord Ranch along with a windmill and water tank. Mesh netting had been installed in some dunes
in the Milepost 81 roadcut in an attempt at stabilization and the entire site was surrounded by
ranching operations. Samples from the SI-1B transect in the Sioux Dunefield were taken within
sight of an abandoned ranch-style home and corral. Ranches and homes surrounded the Imperial
and Lincoln locations. Human impacts are a fact of this landscape in a manner similar to the semi-
arid nature of the region’s climate. Yet, again, instead of responding evenly to anthropogenic

90 | P a g e
disturbance, the evidence for recent reactivation varies widely across the five study areas. In
addition, livestock ranching in these dunefields only began in the late nineteenth century. While it
is difficult to estimate the timescale over which the contrasts between study sites were established,
the degree of soil development at the Lincoln and Sioux County dunefields suggests that greater
stability there may predate the time of livestock ranching. On the other hand, the grassland
dunefields of the Great Plains have been home to bison for more than 100,000 years, which
could have had an effect similar to domestic cattle. Clearly more research is needed to
understand dunefield response to different types of anthropogenic and nonanthropogenic
disturbance, but at this point it is difficult to identify a type of disturbance that would consistent
occur more frequently or have greater effects in the Sand Hills than in the other study areas.
There is another intriguing possibility, however, which is that pedogenic-geomorphic feedbacks
could maintain more frequent stability or activity in a given area after a short-term but large-
magnitude disturbance (a locally severe drought, possibly combined with large fires or
overgrazing, for example). Reactivation of a stable dune surface leads to erosion or burial of
pre-existing A horizons and loss of any fine particles, SOM, and nutrients that have accumulated
there. Even if the surface of the dune is restabilized by vegetation, the surface soil will initially
have lower water retention capacity and nutrient availability than the surfaces of dunes that have
been stable for some time and have developed A horizons impacts the pedogenic process. Lower
available water and nutrients could then limit the resilience of vegetation when exposed to
drought or disturbance, making the dune more prone to frequent reactivation and thus limiting
long-term development of soils that can sustain more resilient ecosystems. The frequency of
reactivation results in blowouts and small parabolic dunes that ultimate create a choppy, rough
landscape across much of the entire dunes. Sharp-edge ridge crests characteristic of this choppy
landscape may experience particularly high shear stress during strong winds, also favoring
recurrent activity. In contrast, a dune that has remained stable for some time, whether by chance

91 | P a g e
or because of local environmental factors, will develop soils that reduce the susceptibility of the
dune-stabilizing vegetation to drought or disturbance (Werner et al., 2011).
If these hypothesized pedogenic-geomorphic feedbacks are effective under a wide range of
environmental conditions, they would have important implications for predicting the impacts of
future climate change across the region. Rather than a uniform response of dunefields to more
severe or sustained droughts, for example, there may be more pronounced response through
reactivation in rough dune landscapes with more limited soil development. Conversely, greater
precipitation in future decades, as predicted for regions north and east of the study areas and
possibly extending into the Sand Hills, may not be sufficient to fully stabilize Sand Hills dunes
marked today by rough topography, abundant blowouts, and minimal soil development.
While pedogenic-geomorphic feedback loops offer a compelling explanation for corresponding
contrasts in soil properties and dune topography in this study, one complicating issue must be
addressed – the impact of parent material on all of the metrics used in this thesis. As explained
by Muhs (2017), the Sand Hills, the Imperial Dunefield, and the Lincoln Dunefield all have unique
provenances. Unfortunately, no published provenance data exists for the Sioux Dunefield, but it
could follow the regional pattern of provenance and have its origins in the surficial bedrock
formations to the northwest plus a mixture of other fluvial and aeolian origins. The known unique
origins for three of the four dunefields in this study, which are evident in their distinguishing
geochemical signatures, offer one viable explanation for the distinct C horizon parent material at
each study site. Coarser sand grains are more abundant in the parent material of the soils
studied in the Sand Hills, and to some extent in the Imperial Dunefield, as compared to the other
two dunefields. A somewhat coarser sand size distribution at the time of deposition could have
hampered some processes of pedogenesis in the Sand Hills, and to a lesser extent in the Imperial
Dunefield. Importantly, coarser initial sand size would probably not affect the process of silt and

92 | P a g e
clay accumulation in surface horizons through dust trapping, so not all of the observed variation in
soil properties between dunefields can be attributed to different provenance. It should also be
noted that in addition to the effects of provenance, sand size may vary significantly within a
dunefield because of geomorphic effects; for example, grain size may be finer higher on large
dunes. While there is no obvious geomorphic explanation for the coarser sand at the Sand Hills
sites, sampling a larger network of sites might reveal one.
Other results uncovered in this thesis work include a better understanding of surface roughness
metrics. Several indices of surface roughness were calculated as part of this thesis. Ultimately,
the standard deviations of elevation and curvature proved likely to be the most useful in
capturing surface variability. Standard deviation of slope, mentioned as a good index of surface
roughness in one study in Scotland (Grohmann et al., 2011), did not seen to capture the choppy
nature of the landscape. Although not necessarily pertinent for questions of dune status, another
important finding of this thesis was the discovery of horizon-specific patterns to the soil analyses
results. Results across dunefields showed a horizon-specific pattern that was unmistakable. For
example, the percentage of soil organic carbon and nitrogen decreased in each dunefield from
the A horizon to the C horizon, before increasing in an buried A horizon, if present. Variations on
this pattern repeated across metrics. The pattern was strong enough to be statistically significant
in the ANOVAs for which dunefield was a factor. While dunefield was a more of an influence
with regard to differences in soil characteristics according to the ANOVA results, horizon was a
powerful influence on the differences uncovered as well.
The results of this thesis allow for the possibility of future research in a number of subjects. First,
more samples can be taken across a wider portion of each dunefield to confirm the patterns seen
here. For example, samples can be taken from smoother areas of the Sand Hills or in other
geographic corners of the vast dunefield, while samples could be taken from overtly choppier

93 | P a g e
landscapes in the other three dunefields. By obtaining more samples and from a variety of
dunefield landforms, it could determined if the patterns seen here extend to the entire dunefield
or are more localized. Additionally, this same research could be conducted in other parts of the
Great Plains, on different coastal dunefields, or any place where dunes exist to determine if the
patterns here are applicable to a wider aeolian environment. Any further extensions of this study
also might want to better incorporate the analysis of vegetation, specifically the type, coverage
percentage and percentage of live and dead vegetation. A different aspect of this study which
might require further exploration is the measurement of surface roughness. The literature is
inconclusive on which methods provide the best results when evaluating roughness and no research
has been conducted on capturing the degree of roughness in aeolian environments. Perhaps
instead of relying on existing, and imperfect, metrics to capture surface roughness at the dune-
scale, a new quantitative method tested in dunefields could be developed. Once a new method
emerges, it could be applied to these study areas and compared side-by-side to the two methods
used here – the standard deviations of elevation and curvature.
Conclusions Dunefields with a recent history of reactivation inferred from rougher topography, such as the
Sand Hills and to some extents the Imperial Dunefield, display soil properties which indicate a
shorter period of pedogenesis – low silt and clay content, soil organic carbon (SOC), soil nitrogen,
loss-on-ignition (SOM), and cation exchange capacity (CEC) in surface horizons The Lincoln and
Sioux dunefields, demonstrated the opposite attributes – smoother terrain and relatively high silt
and clay content, SOC, soil nitrogen, SOM, and CEC. These findings suggest the possibility of
pedogenic-geomorphic feedbacks, where the soil and geomorphic properties of the dunes may
drive the landscapes toward frequent reactivation or persistent stability based whether or not
they have developed soil properties favoring growth of dune-stabilizing vegetation. For instance,
a significant period of stability could allow the accumulation of fine material through dust

94 | P a g e
deposition, enhancing the soil’s ability to retain moisture, as well as buildup of SOM and nutrients
that would foster vegetative growth, two processes that could limit reactivation of dunes during
dry periods or after disturbance. Conversely, the lack of finer-grained soil material, SOM, and
nutrients in recently actively dunes would make reactivation more likely, perpetuating conditions
that limit vegetation growth. One caveat to this interpretation is that the degree of soil
development and thus susceptibility to reactivation or stability could be somewhat influenced by
the provenance of the parent sand material or geomorphic setting within a dunefield. The
findings of this study could have important implications for the potential response of dunefields in
the Central Great Plains to current and future climate change: Dunes with weak to minimal soil
development may be particularly susceptible to persistent reactivation in a climate where severe
drought is more common, creating a patchwork of response across the region. Further study is
needed to test whether the findings reported here are applicable across other dunefields of the
Great Plains and similar regions.

95 | P a g e
REFERENCES Adewopo, J.B., VanZomeren, C., Bhomia, R.K., Almaraz, M., Bacon, A.R., Eggleston, E., Judy, J.D.,
Lewis, R.W., Lusk, M., Miller, B., Moorberg, C., Snyder, E.H., Tiedeman, M., 2014. Top-Ranked Priority Research Questions for Soil Science in the 21 Century. Soil Sci. Soc. Am. J. 78, 337. https://doi.org/10.2136/sssaj2013.07.0291
Ahlbrandt, T.S., Swinehart, J.B., Maroney, D.G., 1983. The dynamic holocene dune fields of the great plains and rocky mountain basins, U.S.A, in: Developments in Sedimentology. pp. 379–406. https://doi.org/10.1016/S0070-4571(08)70806-9
Aleinikoff, J.N., Muhs, D.R., Bettis, E.A., Johnson, W.C., Fanning, C.M., Benton, R., 2008. Isotopic evidence for the diversity of late quaternary loess in Nebraska: Glaciogenic and nonglaciogenic sources. Bull. Geol. Soc. Am. 120, 1362–1377. https://doi.org/10.1130/b26222.1
Anonymous, 1969. Munsell Soil Color Charts: With Genuine Munsell Color Chips. Munsell Color, Grand Rapids, Mich.
Arbogast, A.F., 1996. Stratigraphic evidence for late-holocene aeolian sand mobilization and soil formation in south-central Kansas, U.S.A. J. Arid Environ. 34, 403–414. https://doi.org/10.1006/jare.1996.0120
Ashkenazy, Y., Yizhaq, H., Tsoar, H., 2012. Sand dune mobility under climate change in the Kalahari and Australian deserts. Clim. Change 112, 901–923. https://doi.org/10.1007/s10584-011-0264-9
Bagnold, R.A., 1941. The Physics of Blown Sand and Desert Dunes. Methuen, London.
Barchyn, T.E., Hugenholtz, C.H., 2013a. Dune field reactivation from blowouts: Sevier Desert, UT, USA” (Aeolian Research (2013) 11 (75–84) (S1875963713000700) (10.1016/j.aeolia.2013.08.003)). Aeolian Res. 21, 163–164. https://doi.org/10.1016/j.aeolia.2015.10.003
Barchyn, T.E., Hugenholtz, C.H., 2013b. Reactivation of supply-limited dune fields from blowouts: A conceptual framework for state characterization. Geomorphology 201, 172–182. https://doi.org/10.1016/j.geomorph.2013.06.019
Bo, T.L., Fu, L.T., Zheng, X.J., 2013. Modeling the impact of overgrazing on evolution process of grassland desertification. Aeolian Res. 9, 183–189. https://doi.org/10.1016/j.aeolia.2013.01.001
Brady, N.C., Weil, R.R., 2010. Elements of the Nature and Properties of Soils, 3rd ed, Animal Genetics. Prentice Hall, Upper Saddle River, New Jersey.
Brown, O.W., Hugenholtz, C.H., 2012. Estimating aerodynamic roughness (zo) in mixed grassland prairie with airborne LiDAR. Can. J. Remote Sens. 37, 422–428. https://doi.org/10.5589/m11-051
Chamberlin, T.C., 1897. Supplementary hypothesis respecting the origin of the loess of the

96 | P a g e
Mississippi Valley. J. Geol. 5, 795–802. https://doi.org/10.1086/607964
Clarke, M.L., Rendell, H.M., 2003. Late Holocene dune accretion and episodes of persistent drought in the Great Plains of Northeastern Colorado. Quat. Sci. Rev. 22, 1051–1058. https://doi.org/10.1016/S0277-3791(03)00024-6
Cook, B.I., Ault, T.R., Smerdon, J.E., 2015. Unprecedented 21st century drought risk in the American Southwest and Central Plains. Sci. Adv. 1, 1–8. https://doi.org/10.1126/sciadv.1400082
Cook, B.I., Cook, E.R., Smerdon, J.E., Seager, R., Williams, A.P., Coats, S., Stahle, D.W., Díaz, J.V., 2016. North American megadroughts in the Common Era: Reconstructions and simulations. Wiley Interdiscip. Rev. Clim. Chang. https://doi.org/10.1002/wcc.394
Cronin, F.D., Beers, H.W., 1937. Areas of intense drought distress, 1930-1936.
Dunn, C.D., Stephenson, M.B., Stubbendieck, J., 2016. Common Grasses of Nebraska 1–178.
Feng, S., Fu, Q., 2013. Expansion of global drylands under a warming climate. Atmos. Chem. Phys. 13, 10081–10094. https://doi.org/10.5194/acp-13-10081-2013
Follmer, L.R., 1996. Loess studies in central United States: Evolution of concepts. Eng. Geol. 45, 287–304. https://doi.org/doi: DOI: 10.1016/S0013-7952(96)00018-X
Forman, S.L., Goetz, A.F.H., Yuhas, R.H., 1992. Large-scale stabilized dunes on the High Plains of Colorado: understanding the landscape response to Holocene climates with the aid of images from space. Geology 20, 145–148. https://doi.org/10.1130/0091-7613(1992)020<0145:LSSDOT>2.3.CO;2
Forman, S.L., Marín, L., Gomez, J., Pierson, J., 2008. Late Quaternary eolian sand depositional record for southwestern Kansas: Landscape sensitivity to droughts. Palaeogeogr. Palaeoclimatol. Palaeoecol. 265, 107–120. https://doi.org/10.1016/j.palaeo.2008.04.028
Forman, S.L., Marín, L., Pierson, J., Gómez, J., Miller, G.H., Webb, R.S., 2005. Aeolian sand depositional records from Western Nebraska: Landscape response to droughts in the past 1500 years. Holocene 15, 973–981. https://doi.org/10.1191/0959683605hl871ra
Forman, S.L., Oglesby, R., Webb, R.S., 2001. Temporal and spatial patterns of Holocene dune activity on the Great Plains of North America: Megadroughts and climate links. Glob. Planet. Change 29, 1–29. https://doi.org/10.1016/S0921-8181(00)00092-8
Galatowitsch, S., Frelich, L., Phillips-Mao, L., 2009. Regional climate change adaptation strategies for biodiversity conservation in a midcontinental region of North America. Biol. Conserv. 142, 2012–2022. https://doi.org/10.1016/j.biocon.2009.03.030
Gremer, J.R., Bradford, J.B., Munson, S.M., Duniway, M.C., 2015. Desert grassland responses to climate and soil moisture suggest divergent vulnerabilities across the southwestern United States. Glob. Chang. Biol. 21, 4049–4062. https://doi.org/10.1111/gcb.13043

97 | P a g e
Grohmann, C.H., Smith, M.J., Riccomini, C., 2011. Multiscale analysis of topographic surface roughness in the Midland Valley, Scotland. IEEE Trans. Geosci. Remote Sens. 49, 1200–1213. https://doi.org/10.1109/TGRS.2010.2053546
Hack, J.T., 1941. Dunes of the Western Navajo Country. Geogr. Rev. 31, 240. https://doi.org/10.2307/210206
Halfen, A.F., Johnson, W.C., 2013. A review of Great Plains dune field chronologies. Aeolian Res. https://doi.org/10.1016/j.aeolia.2013.03.001
Halfen, A.F., Johnson, W.C., Hanson, P.R., Woodburn, T.L., Young, A.R., Ludvigson, G.A., 2012. Activation history of the Hutchinson dunes in east-central Kansas, USA during the past 2200years. Aeolian Res. 5, 9–20. https://doi.org/10.1016/j.aeolia.2012.02.001
Halfen, A.F., Lancaster, N., Wolfe, S., 2016. Interpretations and common challenges of aeolian records from North American dune fields. Quat. Int. 410, 75–95. https://doi.org/10.1016/j.quaint.2015.03.003
Hanoch, G., Yizhaq, H., Ashkenazy, Y., 2018. Modeling the bistability of barchan and parabolic dunes. Aeolian Res. 35, 9–18. https://doi.org/10.1016/j.aeolia.2018.07.003
Hanson, P.R., Arbogast, A.F., Johnson, W.C., Joeckel, R.M., Young, A.R., 2010. Megadroughts and late Holocene dune activation at the eastern margin of the Great Plains, north-central Kansas, USA. Aeolian Res. 1, 101–110. https://doi.org/10.1016/j.aeolia.2009.10.002
Hanson, P.R., Joeckel, R.M., Young, A.R., Horn, J., 2009. Late Holocene dune activity in the Eastern Platte River Valley, Nebraska. Geomorphology 103, 555–561. https://doi.org/10.1016/j.geomorph.2008.07.018
Hay, J.D., de Lacerda, L.D., Tan, A.., 1981. Soil cation increase in a tropical sand dune ecosystem due to a terrestrial bromeliad. Ecology 62, 1392–1395.
Hesp, P., 2002. Foredunes and blowouts: initiation, geomorphology and dynamics. Geomorphology 48, 245–268. https://doi.org/10.1016/S0169-555X(02)00184-8
Hesse, P.P., Simpson, R.L., 2006. Variable vegetation cover and episodic sand movement on longitudinal desert sand dunes. Geomorphology 81, 276–291. https://doi.org/10.1016/j.geomorph.2006.04.012
Hugenholtz, C.H., Koenig, D.K., 2014. Sand dune stabilization reduces infiltration and soil moisture: A case study from the northern Great Plains. Ecohydrology 7, 1135–1146. https://doi.org/10.1002/eco.1445
Hugenholtz, C.H., Levin, N., Barchyn, T.E., Baddock, M.C., 2012. Remote sensing and spatial analysis of aeolian sand dunes: A review and outlook. Earth-Science Rev. 111, 319–334. https://doi.org/10.1016/j.earscirev.2011.11.006
Hugenholtz, C.H., Wolfe, S.A., 2005. Recent stabilization of active sand dunes on the Canadian prairies and relation to recent climate variations. Geomorphology 68, 131–147. https://doi.org/10.1016/j.geomorph.2004.04.009

98 | P a g e
Jobbagy, E.G., Jackson, R.B., 2000. The vertical distribution of soil organic carbon and its relation to climate and vegetation. Ecol. Appl. 10, 423–436.
Johnsgard, P.A., 1995. This Fragile Land: A Natural History of the Nebraska Sandhills. University of Nebraska Press, Lincoln, Neb.
Kaul, R.B., Rolfsmeier, S.B., 1994. Diversity of vascular plants and intensity of plant collecting in Nebraska. Trans. Nebraska Acad. Sci. 21, 13–20.
King, D.A., Bachelet, D.M., Symstad, A.J., Ferschweiler, K., Hobbins, M., 2015. Estimation of potential evapotranspiration from extraterrestrial radiation, air temperature and humidity to assess future climate change effects on the vegetation of the Northern Great Plains, USA. Ecol. Modell. 297, 86–97. https://doi.org/10.1016/j.ecolmodel.2014.10.037
Knight, M., Thomas, D.S.G., Wiggs, G.F.S., 2004. Challenges of calculating dunefield mobility over the 21st century. Geomorphology 59, 197–213. https://doi.org/10.1016/j.geomorph.2003.07.017
Ko, J., Ahuja, L.R., Saseendran, S.A., Green, T.R., Ma, L., Nielsen, D.C., Walthall, C.L., 2012. Climate change impacts on dryland cropping systems in the Central Great Plains, USA. Clim. Change 111, 445–472. https://doi.org/10.1007/s10584-011-0175-9
Kocurek, G., Lancaster, N., 1999. Aeolian system sediment state: Theory and Mojave Desert Kelso dune field example. Sedimentology 46, 505–515. https://doi.org/10.1046/j.1365-3091.1999.00227.x
Konen, M.E., Jacobs, P.M., Burras, C.L., Talaga, B.J., Mason, J.A., 2002. Equations for Predicting Soil Organic Carbon Using Loss-on-Ignition for North Central U.S. Soils. Soil Sci. Soc. Am. J. 66, 1878. https://doi.org/10.2136/sssaj2002.1878
Lancaster, N., 1988. Development of linear dunes in the southwestern Kalahari, Southern Africa. J. Arid Environ. 14, 233–244.
Lancaster, N., Baas, A., 1998. Influence of vegetation cover on sand transport by wind: Field studies at Owens Lake, California. Earth Surf. Process. Landforms 23, 69–82. https://doi.org/10.1002/(SICI)1096-9837(199801)23:1<69::AID-ESP823>3.0.CO;2-G
Loope, D.B., Mason, J.A., Dingus, L., 1999. Lethal sandslides from eolian dunes. J. Geol. 107, 707–713.
Loope, D.B., Swinehart, J.B., 2000. Thinking like a dune field: Geologic history in the Nebraska Sand Hills. Gt. Plains Res. 10, 5–35.
Lu, H., Miao, X., Zhou, Y., Mason, J., Swinheart, J., Zhang, J., Zhou, L., Yi, S., 2005. Late Quaternary aeolian activity in the Mu Us and Otindag dune fields (north China) and lagged response to insolation forcing. Geophys. Res. Lett. 32, 1–4. https://doi.org/10.1029/2005GL024560
Lugn, A.L., 1968. The origin of loesses and their relation to the Great Plains in North America, in: Schultz, C., Frye, J.C. (Eds.), Loess and Related Eolian Deposits of the World. pp. 139–182.

99 | P a g e
Marin-Spiotta, E., Chaopricha, N.T., Plante, A.F., Diefendorf, A.F., Mueller, C.W., Grandy, A.S., Mason, J.A., 2014. Long-term stabilization of deep soil carbon by fire and burial during early Holocene climate change. Nat. Geosci. 7, 428–432. https://doi.org/10.1038/ngeo2169
Mason, J.A., 2001. Transport direction of Peoria Loess in Nebraska and implications for Loess sources on the central Great Plains. Quat. Res. 56, 79–86. https://doi.org/10.1006/qres.2001.2250
Mason, J.A., Jacobs, P.M., Hanson, P.R., Miao, X., Goble, R.J., 2003. Sources and paleoclimatic significance of Holocene Bignell Loess, central Great Plains, USA. Quat. Res. 60, 330–339. https://doi.org/10.1016/j.yqres.2003.07.005
Mason, J.A., Lu, H., Zhou, Y., Miao, X., Swinehart, J.B., Liu, Z., Goble, R.J., Yi, S., 2009. Dune mobility and aridity at the desert margin of northern China at a time of peak monsoon strength. Geology 37, 947–950. https://doi.org/10.1130/G30240A.1
Mason, J.A., Miao, X., Hanson, P.R., Johnson, W.C., Jacobs, P.M., Goble, R.J., 2008. Loess record of the Pleistocene-Holocene transition on the northern and central Great Plains, USA. Quat. Sci. Rev. 27, 1772–1783. https://doi.org/10.1016/j.quascirev.2008.07.004
Mason, J.A., Swinehart, J.B., Goble, R.J., Loope, D.B., 2004. Late-Holocene dune activity linked to hydrological drought, Nebraska Sand Hills, USA. Holocene 14, 209–217. https://doi.org/10.1191/0959683604hl677rp
Mason, J.A., Swinehart, J.B., Hanson, P.R., Loope, D.B., Goble, R.J., Miao, X., Schmeisser, R.L., 2011. Late Pleistocene dune activity in the central Great Plains, USA. Quat. Sci. Rev. 30, 3858–3870. https://doi.org/10.1016/j.quascirev.2011.10.005
May, D.W., 2003. Properties of a 5500-year-old flood-plain in the Loup River Basin, Nebraska. Geomorphology 56, 243–254. https://doi.org/10.1016/S0169-555X(03)00154-5
Meir, A., Tsoar, H., 1996. International borders and range ecology: The case of Bedouin transborder grazing. Hum. Ecol. 24, 39–64.
Miao, X., Mason, J.A., Swinehart, J.B., Loope, D.B., Hanson, P.R., Goble, R.J., Liu, X., 2007. A 10,000 year record of dune activity, dust storms, and severe drought in the central Great Plains. Geology 35, 119–122. https://doi.org/10.1130/G23133A.1
Muhs, D.R., 2017. Evaluation of simple geochemical indicators of aeolian sand provenance: Late Quaternary dune fields of North America revisited. Quat. Sci. Rev. 171, 260–296. https://doi.org/10.1016/j.quascirev.2017.07.007
Muhs, D.R., Holliday, V.T., 2001. Origin of late Quaternary dune fields on the Southern High Plains of Texas and New Mexico. Bull. Geol. Soc. Am. 113, 75–87. https://doi.org/10.1130/0016-7606(2001)113<0075:OOLQDF>2.0.CO;2
Muhs, D.R., Maat, P.B., 1993. The potential response of eolian sands to greenhouse warming and precipitation reduction on the Great Plains of the U.S.A. J. Arid Environ. 25, 351–361.

100 | P a g e
Muhs, D.R., Reynolds, R.L., Been, J., Skipp, G., 2003. Eolian sand transport pathways in the southwestern United States: Importance of the Colorado River and local sources. Quat. Int. 104, 3–18. https://doi.org/10.1016/S1040-6182(02)00131-3
Muhs, D.R., Stafford, T.W., Cowherd, S.D., Mahan, S. a., Kihl, R., Maat, P.B., Bush, C. a., Nehring, J., 1996. Origin of the late Quaternary dune fields of northeastern Colorado. Geomorphology 17, 129–149. https://doi.org/10.1016/0169-555X(95)00100-J
Muhs, D.R., Swinehart, J.B., Loope, D.B., Been, J., Mahan, S.A., Bush, C.A., 2000. Geochemical evidence for an Eolian sand dam across the North and South Platte rivers in Nebraska. Quat. Res. 53, 214–222. https://doi.org/10.1006/qres.1999.2104
Nield, J.M., Baas, A.C.W., 2008. The influence of different environmental and climatic conditions on vegetated aeolian dune landscape development and response. Glob. Planet. Change 64, 76–92. https://doi.org/10.1016/j.gloplacha.2008.10.002
Omonode, R.A., Vyn, T.J., 2006. Vertical distribution of soil organic carbon and nitrogen under warm-season native grasses relative to croplands in west-central Indiana, USA. Agric. Ecosyst. Environ. 117, 159–170. https://doi.org/10.1016/j.agee.2006.03.031
Peel, M.C., Finlayson, B.., McMahon, T.A., 2007. Updated world map of the K¨oppen-Geiger climate classification. Hydrol. Earth Syst. Sci.
Puta, R.A., Hanson, P.R., Young, A.R., 2013. Late Holocene activation history of the Stanton Dunes, northeastern Nebraska. Gt. Plains Res. 23, 11–23.
Pye, K., Tsoar, H., 2009. Aeolian Sand and Sand Dunes. Springer-Verlag, Berlin.
Ramnarine, R., Voroney, R.P., Wagner-Riddle, C., Dunfield, K.E., 2011. Carbonate removal by acid fumigation for measuring the δ 13 C of soil organic carbon. Can. J. Soil Sci. 91, 247–250. https://doi.org/10.4141/cjss10066
Ray, A., Barsugli, J., Averyt, K., 2008. Climate change in Colorado: a synthesis to support water resources management and adaptation, Intermountain West Climate Summary. https://doi.org/10.1007/s12010-007-8035-9
Reitz, M.D., Jerolmack, D.J., Ewing, R.C., Martin, R.L., 2010. Barchan-parabolic dune pattern transition from vegetation stability threshold. Geophys. Res. Lett. 37, 1–5. https://doi.org/10.1029/2010GL044957
Rhoades, J.D., 1982. Cation exchange capacity, in: Page, A.L., Miller, R.H., Keeney, D.R. (Eds.), Methods of Soil Analysis, Part 2: Chemical and Microbiological Properties. American Society of Agronomy, Inc.; Soil Science Society of America. Inc., Madison, Wisc., pp. 149–157.
Roskin, J., Blumberg, D.G., Katra, I., 2014. Last millennium development and dynamics of vegetated linear dunes inferred from ground-penetrating radar and optically stimulated luminescence ages. Sedimentology 61, 1240–1260. https://doi.org/10.1111/sed.12099
Schaetzl, R., Anderson, S., 2005. Soils: Genesis and Geomorphology. Cambridge University Press, New York.

101 | P a g e
Schmeisser McKean, R.L., Goble, R.J., Mason, J.B., Swinehart, J.B., Loope, D.B., 2015. Temporal and spatial variability in dune reactivation across the Nebraska Sand Hills, USA. Holocene 25, 523–535. https://doi.org/10.1177/0959683614561889
Schmeisser, R.L., Loope, D.B., Mason, J.A., 2010. Modern and late Holocene wind regimes over the Great Plains (central U.S.A.). Quat. Sci. Rev. 29, 554–566. https://doi.org/10.1016/j.quascirev.2009.11.003
Schmeisser, R.L., Loope, D.B., Wedin, D.A., 2009. Clues to the Medieval destabilization of the Nebraska Sand Hills, USA, from ancient pocket gopher burrows. Palaios 24, 809–817.
Seifan, M., 2009. Long-term effects of anthropogenic activities on semi-arid sand dunes. J. Arid Environ. 73, 332–337. https://doi.org/10.1016/j.jaridenv.2008.10.009
Shay, J.M., Herring, M., Dyck, B.S., 2000. Dune colonization in the Bald Head Hills, southwestern Manitoba. Can. Field-Naturalist 114, 612–627.
Siegal, Z., Tsoar, H., Karnieli, A., 2013. Effects of prolonged drought on the vegetation cover of sand dunes in the nw negev desert: Field survey, remote sensing and conceptual modeling. Aeolian Res. 9, 161–173. https://doi.org/10.1016/j.aeolia.2013.02.002
Smalley, I.J., Vita-Finzi, C., 1968. The formation of fine particles in sandy deserts and the nature Of “desert” loess. SEPM J. Sediment. Res. Vol. 38, 766–774. https://doi.org/10.1306/74D71A69-2B21-11D7-8648000102C1865D
Sridhar, V., Loope, D.B., Swinehart, J.B., Mason, J.A., Oglesby, R.J., Rowe, C., 2006. Large wind shift on the Great Plains during the Medieval Warm Period. Science (80-. ). 313, 345–347.
Sridhar, V., Wedin, D.A., 2009. Hydrological behaviour of grasslands of the Sandhills of Nebraska: water and energy-balance assessment from measurements, treatments, and modelling. Ecohydrology 2, 195–212. https://doi.org/10.1002/eco.61
Sweeney, M.R., Loope, D.B., 2001. Holocene dune-sourced alluvial fans in the Nebraska Sand Hills. Geomorphology 38, 31–46. https://doi.org/10.1016/S0169-555X(00)00067-2
Swinehart, J.B., Loope, D.B., 1992. A giant dune-dammed lake on the North Platte River, Nebraska. Geol. Soc. Am. Abstr. with Programs 24, A51.
Thomas, D.S.G., Knight, M., Wiggs, G.F.S., 2005. Remobilization of southern African desert dune systems by twenty-first century global warming. Nature 435, 1218–1221. https://doi.org/10.1038/nature03717
Wang, T., Zlotnik, V.A., Wedin, D., Wally, K.D., 2008. Spatial trends in saturated hydraulic conductivity of vegetated dunes in the Nebraska Sand Hills: Effects of depth and topography. J. Hydrol. 349, 88–97. https://doi.org/10.1016/j.jhydrol.2007.10.027
Wang, X., Dong, Z., Yan, P., Yang, Z., Hu, Z., 2005. Surface sample collection and dust source analysis in northwestern China. Catena 59, 35–53. https://doi.org/10.1016/j.catena.2004.05.009

102 | P a g e
Wang, Y., Yan, X., Wang, Z., 2016. A preliminary study to investigate the biogeophysical impact of desertification on climate based on different latitudinal bands. Int. J. Climatol. 36, 945–955. https://doi.org/10.1002/joc.4396
Werner, C.M., Mason, J.A., Hanson, P.R., 2011. Non-linear connections between dune activity and climate in the High Plains, Kansas and Oklahoma, USA. Quat. Res. 75, 267–277. https://doi.org/10.1016/j.yqres.2010.08.001
Williams, J.W., Jackson, S.T., Kutzbach, J.E., 2007. Projected distributions of novel and disappearing climates by 2100 AD. Proc. Natl. Acad. Sci. 104, 5738–5742. https://doi.org/10.1073/pnas.0606292104
Winspear, N.R., Pye, K., 1995. Textural, geochemical and mineralogical evidence for the origin of peoria loess in Central and Southern Nebraska, USA. Earth Surf. Process. Landforms 20, 735–745. https://doi.org/10.1002/esp.3290200805
Wolfe, S.A., David, P.P., 1997. Parabolic dunes: Examples from the Great Sand Hills, southwestern Saskatchewan. Can. Geogr. 41, 207–13.
Wolfe, S.A., Hugenholtz, C.H., 2009. Barchan dunes stabilized under recent climate warming on the northern Great Plains. Geology 37, 1039–1042. https://doi.org/10.1130/G30334A.1
Worster, D., 1982. Dust Bowl: The Southern Plains in the 1930s. Oxford University Press, New York.
Xu, Z., Mason, J.A., Lu, H., 2015. Vegetated dune morphodynamics during recent stabilization of the Mu Us dune field, north-central China. Geomorphology 228, 486–503. https://doi.org/10.1016/j.geomorph.2014.10.001
Yan, Y., Xu, X., Xin, X., Yang, G., Wang, X., Yan, R., Chen, B., 2011. Effect of vegetation coverage on aeolian dust accumulation in a semiarid steppe of northern China. Catena 87, 351–356. https://doi.org/10.1016/j.catena.2011.07.002
Yang, Y., Mason, J.A., Zhang, H., Lu, H., Ji, J., Chen, J., Liu, L., 2017. Provenance of loess in the central Great Plains, U.S.A. based on Nd-Sr isotopic composition, and paleoenvironmental implications. Quat. Sci. Rev. 173, 114–123. https://doi.org/10.1016/j.quascirev.2017.08.009
Yizhaq, H., Ashkenazy, Y., Tsoar, H., 2007. Why do active and stabilized dunes coexist under the same climatic conditions? Phys. Rev. Lett. 98, 98–101. https://doi.org/10.1103/PhysRevLett.98.188001