VARIABLITY OF STREAMFLOW AND SEDIMENT YIELDS...
15
Sixteenth International Water Technology Conference, IWTC 16 2012, Istanbul, Turkey 1 VARIABLITY OF STREAMFLOW AND SEDIMENT YIELDS IN WADI TARIA (NORTHWEST ALGERIA) H. MADANI CHERIF 1 , A. TERFOUS 2 , A. BOUANANI 3 and A. GHENAIM 4 1 Laboratory of Hydrology and management of the water resources, Department of Hydraulics, Faculty of Architecture and Civil engineering, University of Sciences and the Technology of Oran, Laboratory (LGECO), INSA Strasbourg, France. E-mail: [email protected] 2 Laboratory (LGECO), INSA Strasbourg, France. E-mail : [email protected] , [email protected] 3 University Aboubakr Belkaid Tlemcen, Algeria; E-mail: [email protected] 4 Laboratory (LGECO), INSA Strasbourg, France. E-mail: abdellah.ghenaim@insa- strasbourg.fr ABSTRACT In this paper we are interesting to study the variability of stream flow and sediment yield in wadi Taria, a river of semi arid regions of Algeria. To do this, we adopt a methodology which consists to find a regressive model capable of explaining the sediment load as a function of the discharge measured at wadi Taria station, by studying this relation at various scales e.g., annual, seasonal etc. The results show that the power model explains the greatest part of the variance (80%). The analysis of the monthly sediment yields shows that the autumn season contributes in a large proportion of the annual sediment yield (60%). Keywords: Erosion, Sediment, Water discharge, Modelling. 1. INTRODUCTION Hydric erosion is a very widespread complex phenomenon in Mediterranean zone, concerning particularly the Maghreb countries from which it’s seriously threatens the potentialities out of water and soil (Achite. [1]). A large number of data on suspended sediment transport of the Algerian rivers were accumulated during the various decades (60, 70, 80, 90, 2000 and 2010) and made it possible to undertake a general study on erosion, sediment discharge and silting in dams. Many studies on erosion and its consequences were undertaken in different countries, but the complexity of the phenomenon, its irregular and random character did not make it possible to lead quickly to satisfactory results. Slopes of the West Algerian catchment areas make the principal subject of the erosion study. They aroused the interest of a great number of researchers who tried to explain the complex mechanisms of sediment transport and to quantify volumes of the transported sediments. One will note old work of: MEDINGER (1960): who
Transcript of VARIABLITY OF STREAMFLOW AND SEDIMENT YIELDS...
Sixteenth International Water Technology Conference, IWTC 16 2012, Istanbul, Turkey 1
VARIABLITY OF STREAMFLOW AND SEDIMENT YIELDS IN WADI
TARIA (NORTHWEST ALGERIA)
H. MADANI CHERIF
1, A. TERFOUS
2, A. BOUANANI
3 and A. GHENAIM
4
1
Laboratory of Hydrology and management of the water resources, Department of
Hydraulics, Faculty of Architecture and Civil engineering, University of Sciences and the
Technology of Oran, Laboratory (LGECO), INSA Strasbourg, France.
E-mail: [email protected] 2
Laboratory (LGECO), INSA Strasbourg, France. E-mail : [email protected] ,
University Aboubakr Belkaid Tlemcen, Algeria; E-mail: [email protected] 4
Laboratory (LGECO), INSA Strasbourg, France. E-mail: abdellah.ghenaim@insa-
strasbourg.fr
ABSTRACT
In this paper we are interesting to study the variability of stream flow and sediment
yield in wadi Taria, a river of semi arid regions of Algeria. To do this, we adopt a
methodology which consists to find a regressive model capable of explaining the
sediment load as a function of the discharge measured at wadi Taria station, by
studying this relation at various scales e.g., annual, seasonal etc. The results show that
the power model explains the greatest part of the variance (80%). The analysis of the
monthly sediment yields shows that the autumn season contributes in a large
proportion of the annual sediment yield (60%).
Keywords: Erosion, Sediment, Water discharge, Modelling.
1. INTRODUCTION
Hydric erosion is a very widespread complex phenomenon in Mediterranean zone,
concerning particularly the Maghreb countries from which it’s seriously threatens the
potentialities out of water and soil (Achite. [1]). A large number of data on suspended
sediment transport of the Algerian rivers were accumulated during the various decades
(60, 70, 80, 90, 2000 and 2010) and made it possible to undertake a general study on
erosion, sediment discharge and silting in dams. Many studies on erosion and its
consequences were undertaken in different countries, but the complexity of the
phenomenon, its irregular and random character did not make it possible to lead
quickly to satisfactory results.
Slopes of the West Algerian catchment areas make the principal subject of the erosion
study. They aroused the interest of a great number of researchers who tried to explain
the complex mechanisms of sediment transport and to quantify volumes of the
transported sediments. One will note old work of: MEDINGER (1960): who
Sixteenth International Water Technology Conference, IWTC 16 2012, Istanbul, Turkey 2
proceeded to the treatment of the first series of measures collected in Algeria on about
thirty basins during the period 1946 - 1957; TIXERONT (1960): who based its work
on the data of 32 basins of Algeria and 9 basins of Tunisia. CAPOLINI (1965 - 1969):
undertook a regional geomorphologic study on the principal affluent of the Chelif
(area physiographic, hypsometry, slope, geology formations, and vegetable cover).
SOGREAH (1969) s: Studied the surfaces of irrigation basing on the data of
observation collected at 9 dams and 18 hydrometric stations adding up 282 years. One
will also note recent works of DEMMAK (1982), GACHI (1982), BOUROUBA
(2003), MEDDI (1999-2004), TERFOUS (2001-2003), GHENIM (2001),
BENKHALED and REMINI (2003), BOUANANI (2004), KHANCHOUL (2006) and
ACHITE (2005, 2006), who have tried to quantify sediment transport and to explain
hydric erosion in the basins of the Tafna, Seybouse and Chelif.
In consequence of the space-time discontinuity of the process erosion-transport-
sedimentation, there exists only one remote relation and variable between the quantity
of material torn off with the interfluves and that which is transported by the river. The
irregularity of the phenomenon makes difficult the settling of a precise, reliable and
operational measurement technique. The methods of direct and continuous recording
are proved to be inapplicable on the rivers strongly charged. The sporadic taking away
of samples carried out by an observer is insufficient and seldom correspond to the
suitable periods. The high concentrations which constitute the major part of the annual
solid contributions arrive during some brutal storms and are measured only on rare
occasions (Khanchoul [2]).
This contribution focuses on a quantitative study of erosion, suspended sediment and
siltation of dams and whose objective is to offer solutions to fight against this
phenomenon. In this context, we attempt to show, by means of in situ measurement,
the relationship between water discharge and sediment discharge in order to quantify
the sediment transport and the ratio of silting, and the statistical models found, will be
used also to fill the gaps due to lacking measurement data and extend the existing
series.
2. STUDY AREA
The basin of the wadi Taria belongs to the catchment of Macta (figure 01), located
at the North-West of Algeria. The two principal rivers, the Mekerra wadi in the west
and the wadi El Hammam in the East, meet not far from the Mediterranean dimension
to form Macta. The basin of the wadi el Hammam occupies a surface of 7862 km2, is
divided into 11 under basins (figure 02) (wadi louza, wadi melrhir, wadi mezoua,
wadi Sefioun, wadi Berbour, wadi Hounet, wadi Saida, wadi Sahouat, wadi Ghriss,
wadi El hammam, and wadi Taria which is the subject of our study).

Sixteenth International Water Technology Conference, IWTC 16 2012, Istanbul, Turkey 3
Fig. 1 Situation of Macta basin, Algeria
The catchment area of wadi Taria extends between longitudes 0°25' W - 0°50' E,
and the latitudes 34°75' N - 35° 25 ' N, it is limited to north by the basin of the plain of
Ghriss, in the south by the basin of Chott Chergui, in the east by the catchment area of
Chellif Zehrez, and in the west by the basin of wadi Saida (figure 02). It is
characterized by a semiarid climate with an interannual average pluviometry of 450
mm/an, with irregularities of rains and an annual average temperature of 17°C. The
principal affluent of the studied area is wadi Taria with a 32 km length and an altitude
of 600 m at the upstream and 450 m at the downstream. The station of study of wadi
Taria is at the coordinates Lambert (X = 262.35, Y = 204.85), and controls a surface of
1365 km2. It was brought into service in 1972, and has a battery of limnimetric scale,
and a bridge where the gauging are done.
Fig. 2 basins of Macta catchment area
Ouizert dam, with a capacity of 100 million cubic meters and 58 meters height, was
brought into service in 1985, for civil, industrial and agricultural uses. The prediction
of sediment load will give information on the basin erosion that will serve to protect
the reservoir from deposit of suspended sediment flux. The basin is principally formed
by Oligocene sandstone and clay. The rest of the lithologic formations are Mio-
Pliocene conglomerate and clay, marl and cretaceous limestone, and some Jurassic
dolomitic limestone’s outcrop Composed of. The presence of friable rocks in the study
area associated with a semi-arid climate where rainfall is irregular and stormy
promotes erosion and suspended sediment supply (ABH. [3]).

Sixteenth International Water Technology Conference, IWTC 16 2012, Istanbul, Turkey 4
3. DATA AND METHODOLOGIES
The study used instantaneous water discharge values (m
3/s) measured at the
hydrometric station of wadi Taria from february 1987 to may 2007 (7657
observations), results obtained and furnished by the “Algerian National Agency of
Hydric Resources” (ANRH). For measured values, sediment concentrations (g/l) were
evaluated using samples taken from the river. The suspended sediment discharges
were calculated by multiplying these concentrations the water discharges. The number
of samples was adapted to the hydrological regime. They were taken every other day
or during flood periods, as frequently as quarter-hourly. Thirty eight floods were
selected and are illustrated on the (table 01) and (figure 03). The principle of the
selection is based on the following criteria (Benkhaled et al. [4]):
a. Has a realization of a complete and noncomplex hydrogramme;
b. A noncomplex rainstorm ;
c. A sampling rate sufficient in the event (well turbidigramme monitoring).
Table 1 Chronology of the important rainstorm selected
N° Date Number of
observations N° Date
Number of
observations
1 24-25/11/87 24 20 20-21/04/97 14
2 20-21/03/89 23 21 24/08/97 14
3 17- 21/07/90 81 22 25-26/08/97 40
4 11-13/11/90 48 23 15-16/09/97 51
5 14/03/91 19 24 22-24/10/97 37
6 14-16/03/91 51 25 22-25/11/97 53
7 08-10/04/92 39 26 23-24/04/98 29
8 31/08- 01/09/93 50 27 15-19/03/99 78
9 19-20/10/93 34 28 27-28/09/99 43
10 22-23/09/94 22 29 08-09/10/99 28
11 27-28/09/94 57 30 17/10/99 15
12 28-29/09/94 44 31 18-20/12/99 44
13 29-30/09/94 40 32 23-24/10/00 31
14 17-18/10/94 68 33 16-17/11/00 30
15 02-04/03/95 76 34 25-26/11/00 24
16 09-11/10/95 43 35 29-31/01/01 36
17 12-14/10/95 39 36 28/02- 02/03/01 53
18 05-07/12/95 73 37 07/05/02 24
19 03-06/02/96 71 38 25-26/11/02 43
The systematic sampling procedure of the suspended sediments in Algerian wadis
is simple and punctual. The sampling of the charged water is done using bottles from
0.5 to 1 liter capacity, and which either are launched in the current after being
ballasted, or hung to a pole or a salmon, according to the conditions of current and of
the variations of dimension of the wadi's bed. The samples collected are initially
filtered on a millipore filter and the sediment load is measured by weighing the filters,
then the filtered sediment are dried during 30 mn at a temperature of 110°C. Brought
back to the unit of volume (1 liter), this load is allotted to the concentration in
Sixteenth International Water Technology Conference, IWTC 16 2012, Istanbul, Turkey 5
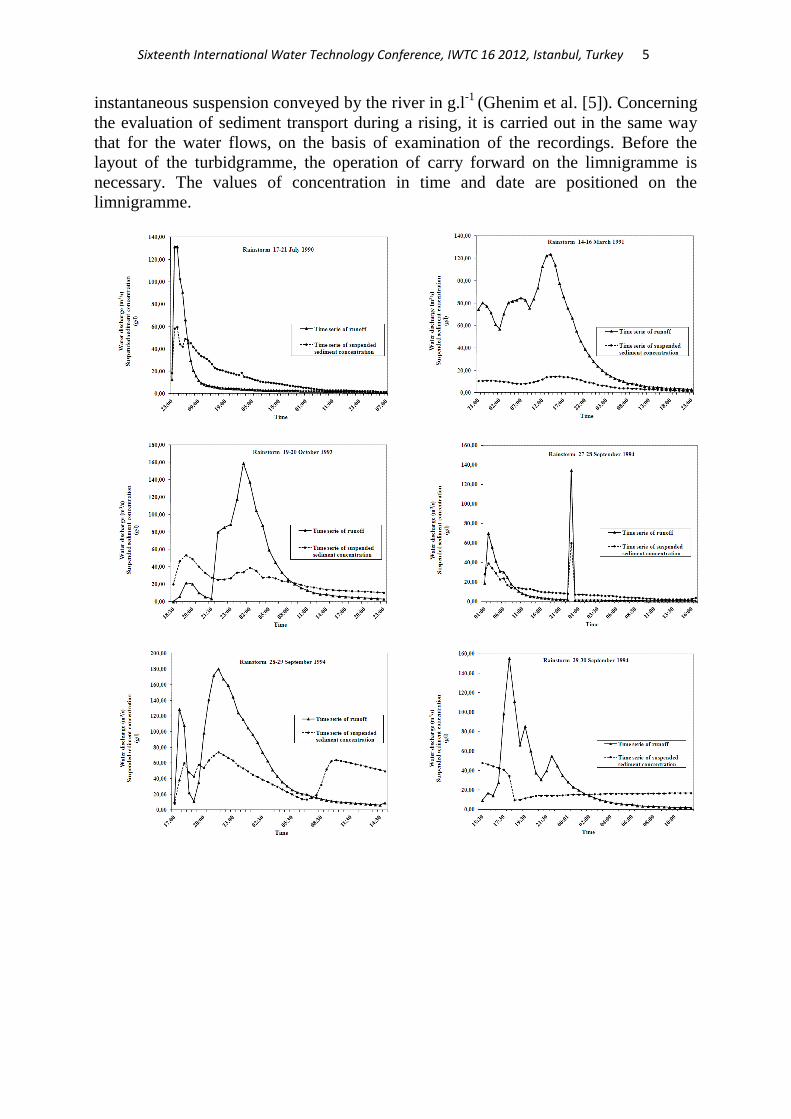
instantaneous suspension conveyed by the river in g.l-1
(Ghenim et al. [5]). Concerning
the evaluation of sediment transport during a rising, it is carried out in the same way
that for the water flows, on the basis of examination of the recordings. Before the
layout of the turbidgramme, the operation of carry forward on the limnigramme is
necessary. The values of concentration in time and date are positioned on the
limnigramme.

Sixteenth International Water Technology Conference, IWTC 16 2012, Istanbul, Turkey 6

Sixteenth International Water Technology Conference, IWTC 16 2012, Istanbul, Turkey 7
Fig. 3 Time series of water discharges and suspended sediment concentrations for the most important
rainstorms selected.
3.1 Statistical parameters of rainstorms selected
The statistical parameters of the events (Table 2), confirms the irregularity of the
hydrological mode of wadi Taria.
Table 2 Statistical parameters of the selected rainstorms
Rainstor
m
Variable
s
values
maximu
m
Standar
d
deviatio
n
Averag
e
Mod
e
Media
n Cv
Coefficient
of
asymmetry
1 C 18,70 5,15 7,73 4,00 6,10 0,67 0,66
QL 39,20 9,71 12,68 6,86 7,64 0,77 1,77
2 C 12,70 3,81 5,73 0,68 6,80 0,66 -0,15
QL 31,40 9,05 10,96 0,59 8,94 0,83 0,83
3 C 59,62 14,62 14,45 3,20 8,80 1,01 1,43
QL 131,25 25,75 10,88 1,66 2,80 2,37 3,73
4 C 21,20 7,11 10,96 21,2 10,30 0,65 0,11
QL 44,58 15,83 14,06 4,74 5,03 1,13 0,86
5 C 17,60 4,90 11,39 4,40 12,80 0,43 -0,42
QL 128,00 44,53 62,53 13,56 72,50 0,71 0,11
6 C 14,50 4,20 7,57 10,4 8,10 0,55 0,05
QL 123,80 39,08 46,06 82,7 38,90 0,85 0,35
7 C 12,35 3,60 5,17 1,00 4,00 0,70 0,73
QL 33,84 9,58 6,56 0,74 2,33 1,46 1,90
8 C 48,50 13,82 18,02 7,50 12,60 0,77 0,92
QL 52,00 15,01 8,14 50,5 1,80 1,84 2,21
9 C 53,50 11,80 24,47 28,00 23,55 0,48 0,78
QL 159,00 44,28 35,67 20,25 11,70 1,24 1,42
10 C 50,40 20,86 20,22 12,00 11,80 1,03 0,49
QL 123,00 39,39 48,76 98,5 47,65 0,81 0,24
11 C 60,00 10,63 10,09 2,40 6,70 1,05 2,68
QL 134,52 21,77 9,44 1,00 1,55 2,31 4,15

Sixteenth International Water Technology Conference, IWTC 16 2012, Istanbul, Turkey 8
Rainstor
m
Variable
s
values
maximu
m
Standar
d
deviatio
n
Averag
e
Mod
e
Media
n Cv
Coefficient
of
asymmetry
12 C 74,00 18,01 45,93 60,00 51,60 0,39 -0,58
QL 180,12 56,13 55,81 10,75 24,20 1,01 0,92
13 C 48,00 10,28 19,27 14,2 16,00 0,53 2,02
QL 155,40 34,61 26,93 14,3 13,05 1,29 2,07
14 C 68,00 20,89 30,30 17,00 20,75 0,69 0,64
QL 191,00 62,92 88,68 127,3 97,00 0,71 -0,13
15 C 36,80 10,37 12,47 0,30 11,10 0,83 0,63
QL 98,25 23,35 11,77 0,75 2,02 1,98 2,59
16 C 53,00 18,92 26,35 53,00 22,50 0,72 0,26
QL 165,00 50,33 28,40 3,47 3,47 1,77 1,87
17 C 47,00 13,68 29,96 46,00 29,00 0,46 -0,29
QL 78,38 15,68 23,47 13,32 19,54 0,67 1,86
18 C 52,50 15,99 16,32 2,00 10,50 0,98 1,08
QL 165,00 60,11 47,05 1,26 8,70 1,28 0,97
19 C 25,80 8,22 13,79 3,10 15,00 0,60 -0,10
QL 103,60 29,22 27,63 56,0 15,37 1,06 1,01
20 C 33,00 6,32 24,46 22,0 24,50 0,26 -0,53
QL 163,43 63,32 73,42 - 48,13 0,86 0,52
21 C 54,00 20,29 26,50 0,48 32,30 0,77 -0,18
QL 126,60 48,45 48,58 0,34 33,70 1,00 0,47
22 C 52,40 14,83 16,45 - 9,60 0,90 1,16
QL 90,66 23,35 16,79 1,13 4,02 1,39 1,66
23 C 66,00 13,24 40,36 32,0 36,00 0,33 0,40
QL 90,92 27,60 19,80 3,77 5,66 1,39 1,63
24 C 55,00 19,79 32,53 55,0 32,40 0,61 -0,16
QL 94,93 26,87 17,69 0,68 5,39 1,52 1,79
25 C 51,00 17,29 18,64 0,40 11,60 0,93 0,60
QL 116,58 32,57 25,22 0,42 4,58 1,29 1,20
26 C 38,00 10,63 16,07 32,0 14,50 0,66 0,57
QL 41,88 10,41 6,77 0,62 1,58 1,54 2,10
27 C 90,50 20,34 26,90 22,0 22,45 0,76 0,86
QL 121,40 15,88 7,70 3,26 3,26 2,06 5,59
28 C 46,00 12,52 13,52 2,00 9,00 0,93 1,05
QL 197,00 60,69 37,10 2,36 6,86 1,64 1,78
29 C 128,00 39,36 20,28 3,00 2,50 1,94 2,02
QL 164,12 49,52 26,64 9,00 6,88 1,86 2,23
30 C 52,00 17,67 20,41 - 16,50 0,87 0,60
QL 53,26 16,80 19,09 - 13,26 0,88 1,13

Sixteenth International Water Technology Conference, IWTC 16 2012, Istanbul, Turkey 9
Rainstor
m
Variable
s
values
maximu
m
Standar
d
deviatio
n
Averag
e Mode
Media
n Cv
Coefficient
of
asymmetry
31
C 25,00 7,58 10,03 6,00 6,50 0,76 0,75
QL 78,82 22,77 16,83 3,10 5,47 1,35 1,75
32 C 68,90 20,16 27,01 38,00 28,00 0,75 0,15
QL 203,00 74,89 81,70 - 65,00 0,92 0,52
33 C 15,60 4,35 9,70 15,60 10,25 0,45 -0,39
QL 67,51 16,77 15,20 9,29 9,29 1,10 2,18
34 C 31,50 9,40 14,29 5,00 13,90 0,66 0,42
QL 62,00 15,25 13,08 2,10 8,77 1,17 2,1
35 C 30,20 7,83 15,67 15,00 15,00 0,50 0,34
QL 55,00 14,01 17,9 21,60 18,03 0,78 1,25
36 C 32,70 8,61 9,38 5,80 5,80 0,92 1,17
QL 126,50 33,28 22,94 1,19 6,27 1,45 1,86
37
C 58,00 14,27 36,01 29,00 29,00 0,40 0,39
QL 196,40 72,90 118,4 155,4
0 152,88 0,62 -0,79
38 C 31,00 9,11 16,51 10,00 12,00 0,55 0,34
QL 58,61 16,93 11,65 1,10 2,56 1,45 1,73
C: suspended sediment concentration g l-1
; QL: water discharge m3 s
-1; Cv: coefficient of variation.
4. RESULTS AND DISCUSSION:
4.1 Using of the sediment rating curve:
Once sufficient data have been collected, attention must be given to deriving the
rating relationship. In the absence of actual suspended sediment concentration
measurements, hydrologists have used sediment rating curves to predict suspended
sediment concentrations for subsequent flux calculations, determining long-term
suspended sediment loads (Khanchoul et al. [6]).
A regression analysis is made between the instantaneous sediment discharges (QS) and
the instantaneous water discharges (QL). The most commonly used sediment rating
curve is a power function as in (1).
b
LS QaQ . (1)
Where a and b are regression coefficients. Equation (1) covers both the effect of
increased stream power at higher discharge and the extent to which sediment becomes
available in weather conditions that cause high discharge. Water discharge and
sediment discharge have been plotted on logarithmic co-ordinates. The data used to
develop the sediment rating curves of the wadi Taria consists of 7657 values of

Sixteenth International Water Technology Conference, IWTC 16 2012, Istanbul, Turkey 10
suspended sediment concentrations and their discharges. High, medium and low flows
were studied. The data set was also represented and gathered according to four
seasons: Autumn, winter, spring and summer (figure 04).
Fig. 4 Sediment rating curves developed on instantaneous water discharges and instantaneous sediment
discharges according to seasonal scale.
After several tests with various types of adjustment, the model power seems to
offer the best adjustment within sight of the value of the coefficient of determination
R2. The correlation coefficients, ranging between 0.84 and 0.86, are good, which
makes it possible to conclude that these regressions give acceptable results.
Analysis of the seasonal regression parameters has shown that the constant ‘a’ is
highly variable and differs significantly from season to season (figure 04). The winter
season value of ‘a’ is lower than the corresponding dry and spring season value. The
exponent ‘b’ is higher in the spring season than in autumn, winter and in the dry
season. Since ‘b’ is a measure of the rate at which a change in the runoff is converted
to geomorphic work and shows the sensivity of the system to carry out such work.
4.2 The seasonal and annual variations of the suspended sediment loads:
In this section, attempts will be made to explain the variations of the suspended
sediment loads in the wadi Taria. The annual and seasonal budget of the suspended
sediment load exported by wadi Taria is calculated as in (2)
N
j
jj
jLjjjL
S ttCQCQ
A1
1
)1()1(
2
)()( (2)

Sixteenth International Water Technology Conference, IWTC 16 2012, Istanbul, Turkey 11
Where: AS: seasonal or annual sediment suspended load (Tonne/year); Cj: suspended
sediment concentration measured (Kg/m3); QLj: water discharge (m
3/s); N: is the
number of taking away carried out over the year and the season considered; and (tj+1 –
tj) is the step of time separating two consecutive taking away (s). (Ghenim et al. [7]).
In the same way, the annual and seasonal water contribution AL, corresponding to AS
is calculated as in (3)
N
j
jj
LjjL
L ttQQ
A1
1
)1(
2 (3)
In addition, the sediment yield ASS (tonnes/km2/year) is calculated as in (4)
S
AA S
SS (4)
S: area of the basin (km2).
Fig. 5 (A). Seasonal sediment yield during 21 years (tonnes/km2/year).
(B) Seasonal water contribution during 21 years (106 m
3/year)
Fig. 6 Interannual variability of sediment yield (1986-2007) in wadi Taria gauging station
The study of seasonal distribution of sediment load indicates that 3 345000 tonnes
were transported during the autumn. This quantity represent 60% of the total sediment
yield (figure 5A) with a volume of water about 108 million m3 (figure 5B). The second
Sixteenth International Water Technology Conference, IWTC 16 2012, Istanbul, Turkey 12
highest sediment load occurred during the winter with a load reaching 949000 tonnes
which represent 17% of the total load and 69 million m3 of water contribution. This
variability is explained by the variation of vegetation cover throughout the year and
the nature of the rains in autumn (aggressiveness of the rains). These two factors allow
the first rains of autumn to transport considerable quantities of sediments after a long
dry season characterized by high temperatures and the destruction of the aggregates of
the ground from these factors and energy developed by the first rains, also contributing
is the weak vegetation cover rate in this season. The weak rate of erosion in winter is
explained by the fact that most of the solid particles were transported by the first
floods of autumn (Khanchoul and Jansson. [8]).
The annual suspended sediment yield varies significantly from one year to another
(figure 06). For example, during the hydrologic year 1994-1995, stream flow,
sediment concentration and sediment load were much higher than other hydrologic
years due to exceptional rainstorms recorded in october 93, september 94 and march
95 (figure 03) and as a result, 30 million m3 of water contribution was recorded, during
which 1 048 535 tonnes of suspended sediment load what gives a suspended sediment
yield of 768 tonnes/km2/year, and hydrologic year 1988-1989 was the driest year with
only 8744 tonnes observed corresponding to a suspended sediment yield equal to 6,4
tonnes km-2
year-1
.
5. CONCLUSION
The hydric erosion constitutes a major aspect of the degradation of the landscapes
in the semiarid Mediterranean environments. So sediment yield from semiarid areas is
very highly variable because precipitation and runoff are highly variable.
In this study we have estimate suspended sediment load in wadi Taria basin, using the
sediment rating curve method. This gave a good correlation coefficients ranging
between 0.84 and 0.86. A great number of data on the sediment transport in the wadi
Taria basin have been explored in order to get a good estimation of the seasonal and
annual suspended sediment yield. The results obtained indicate that the mean sediment
yield for the catchment area is about 236 tonnes/km2/year. Compared to the excessive
erosion in other wadis of Algeria such as Sebdou wadi with 937 tonnes Km-2
year-1
(Bouanani 2004), Ebda wadi with 1875 tonnes Km-2
year-1
, (Meddi 1999), Haddad
wadi with 2.87 tonnes Km-2
year-1
, Abd wadi with 3.47 tonnes Km-2
year-1
(Achit 2004,
2006), Mouilah wadi 165 tonnes Km-2
year-1
(Ghenim 2008), Mellah wadi with 373
tonnes Km-2
year-1
(Khanchoul 2008), the suspended sediment yield of the Taria wadi
is considered moderate.
REFERENCES
[1] Achite, M., Methodology for computation of normal annual yield of suspended
sediments from rivers: Case of the wadi Abd basin of northern Algeria / 2006 (Ed
by Singh, V.P. and Xu, Y.J) pp. 175-182, Proceedings of the AIH 25th

Sixteenth International Water Technology Conference, IWTC 16 2012, Istanbul, Turkey 13
Anniversary Meeting & International Conference « Challenges in Coastal
Hydrology and Water Quality ».
[2] Khanchoul, K., Quantification de l’érosion et des transports solides dans certains
bassins versants de l’extrême Nord-est algérien, Thèse de Doctorat d’état en
Géologie, 2006.
[3] Ministère des Ressources en Eau (Algérie), Agence de Bassin Hydrographique
Oranie-Chott Chergui (ABH), Cadastre hydraulique bassin Macta, Mission VI,
Document de synthèse, Janvier 2007.
[4] Benkhaled, A., Remini, B., Variabilité temporelle de la concentration en
sediments et phenomena d’hystérésis dans le basin de l’Oued Wahrane (Algérie),
Hydrological Sciences Journal, Vol. 48, part 2, pp. 243-255, 2003.
[5] Ghenim, A., Seddini, A., Terfous, A., Variation temporelle de la dégradation
spécifique du basin versant de l’Oued Mouilah (nord-ouest Algérien),
Hydrological Sciences Journal, Vol. 53, part 2, pp. 448-456, 2008.
[6] Khanchoul, K., Boukhrissa, Z.E.A., Acidi, A., Altschul, R., Estimation of
suspended sediment transport in the Kebir drainage basin, Algeria, Elsevier,
Quaternary International, The Journal of the International Union for Quaternary,
pp. 1-7, 2010.
[7] Ghenim, A., Terfous, A., Seddini, A., Etude du transport solide en suspension
dans les régions semi-arides méditerranéennes: cas du basin-versant de l’oued
Sebdou (Nord-Ouest algérien), Sécheresse, Vol. 18, part 1, pp. 39-44, 2007.
[8] Khanchoul, K., Jansson, M.B., Sediment rating curves developed on stage and
seasonal means in discharge classes for the Mellah wadi, Algeria, Journal
compilation© 2008 Swedish Society for Anthropology and Geography, pp. 227-
236.
[9] Achite, M., Meddi, M., Estimation du transport solide dans le basin-versant de
l’oued Haddad (Nord-Ouset algérien), Sécheresse, Vol. 15, part 4, pp. 367-373,
2004.
[10] Asselman, N.E.M., Fitting and interpretation of sediment rating curves, Journal
of Hydrology, Vol. 234, pp. 228-248, 2000.
[11] Mimiko, M., An investigation of suspended sediment rating curves in western
and northern Greece, Hydrological Sciences Journal, Vol. 27, pp. 368-383, 1982.
[12] Terfous, A., Ghenim, A., Bouanani, A., Megnounif, A., Baba hamed, K., Rôle
des crues dans la genèse des sédiments transportés en suspension par trois cours
d’eau des zones semi-arides méditerranéennes, Watmed 2002, Proceeding of

Sixteenth International Water Technology Conference, IWTC 16 2012, Istanbul, Turkey 14
International Workshop on Water in the Mediterraneen Basin : Resources and
Sustainable Development, pp. 888-893, 2002.
[13] Terfous, A., Megnounif, A., Bouanani, A., Détermination des dégradations
spécifiques dans trois basins versants des régions méditerranéennes algériennes
IAHS Publication n° 278, pp. 366-372, 2003.
[14] Terfous, A., Megnounif, A., Bouanani, A., Etude du transport solide en
suspension dans l’oued Mouilah (Nord Ouest Algérien), Revue des sciences de
l’eau, Vol. 14, part 2, pp. 173-185, 2001.
[15] Batalla, R.J., Sala, M., Temporal variability of suspended sediment transport in a
Mediterranean sandy gravel-bed river, IAHS Publication n° 224, pp. 299-305,
1994.
[16] Cherif, E., Errih, M. and Madani cherif, H., Modélisation statistique du transport
solide du basin versant de l’Oued Mekerra (Algérie) en zone semi-aride,
Hydrological Sciences Journal, Vol. 54, part 2, pp. 338-348, 2009.
[17] Rius, J., Battala, R., Poch, R.M., Monitoring Water and Sediment Yield in
Mediterranean Mountainous Watersheds: Preliminary Results / 2001 (Ed by
Stott, D.E., Mohtar, R.H. and Steinhardt, G.C) pp. 223-228, Sustaining the
Global Farm. Selected papers from the 10th International Soil Conservation
Organization Meeting held, May 24-29, 1999 at Purdue University and the
USDA-ARS National Soil Erosion Research Laboratory.
[18] Bencherif, K., Inventaire satellitaire des ressources forestières en région Sud-
méditerranéenne. Etude de trois exemples de forêts algériennes, (Coordination
Ragot, J., Batton-Hubert., M., Breuil, F., pp. 235-261, Colloque sciences de
l’information et de la communication pour l’environnement 2011 (Les STIC pour
l’environnement 2011), Ecole Nationale Supérieure des Mines Saint-Etienne.
[19] Walling, D.E., The sediment yields of African rivers, IAHS Publication n° 144,
1984, pp. 265-283.
[20] Marsaides, G.L., José, C.D.C., Roberto, M.M.S., Méthodologie pour l’étude de
l’érosion interne sur les sols tropicaux, pp. 1-8, AUGC. 2006.
[21] Touaibia, B., Problématique de l’érosion et du transport solide en Algérie
septentrionale, Séchresse, Vol. 21, part 1e, pp. 1-6, 2010.
[22] Touaibia, B., Achite, M., Contribution à la cartographie de l’érosion spécifique
du bassin versant de l’Oued Mina en zone semi-aride de l’ septentrionale,
Hydrological Sciences Journal, Vol. 48, part 2, pp. 234-242, 2003.

Sixteenth International Water Technology Conference, IWTC 16 2012, Istanbul, Turkey 15
[23] Gareth, H.O., Graham, J.L.L., John.C.P., Barnaby.P.J.S., Scott, L., Edward, J.H.,
Matthew, H., Andy, Y., The impact of a convectional summer rainfall event on
river flow and fine sediment transport in a highly urbanized catchment :
Bradford, West Yorkshire, Elsevier, The Science of the Total Environment, Vol.
314-316, pp. 495-512, 2003.
[24] Chen, B., Wang, K., Suspended sediment transport in the offshore near Yangtze
Estuary, Elsevier, Journal of Hydrodynamics, Vol. 20, part. 3, pp. 373-381, 2008.
[25] Naishuang, B., Zuosheng, Y., Houjie, W., Dejiang, F., Xiaoxia, S., Kun, L.,
Seasonal variation of suspended-sediment transport through the southern Bohai
Strait, Elsevier, Estuarine, Coastal and Shelf Science, Vol 93, part 3, pp. 239-247,
2011.
[26] Damià, V., Ramon.j, B., Sediment transport from continuous monitoring in a
perennial Mediterranean stream, Catena, Vol. 82, pp. 77-86, 2010.
[27] Toby, D., Carol M, W., Sediment entrainment and transport in fluviokarst
systems, Journal of Hydrology, Vol. 295, pp.163-172, 2004.
[28] Peter D, D., Shiu-hung, L., Gully erosion and sediment transport in a small
subtopical catchment, South China, Catena, Vol. 29, pp. 161-176, 1997.
[29] Megnounif, A., Terfous, A., Ghenaim, A., Poulet, J.B., Key processes influencing
erosion and sediment transport in a semi-arid Mediterranean area: the Upper
Tafna catchment, Algeria, Hydrological Sciences Journal, Vol. 52, part 6, pp.
1270-1284, 2007.
[30] Josef, K., Tomas, D., Anton Van, R., Jiri, V., Karel, V., Reservoirs’ siltation
measurements and sediment transport assessment in the Czech Republic, the
Vrchlice catchment study, Catena, Vol. 64, pp. 348-362, 2005.
[31] Peng, G., Gregory B, P., Khaled M, B., Wesley W, W., Suspended- sediment
transport in an intensively cultivated watershed in southeastern California,
Catena, Vol. 69, pp. 239-252, 2007.
[32] Achite, M., Meddi, M., Variabilité spatio-temporelle des apports liquides et
solide en zone semi-aride. Cas du bassin versant de l’oued Mina (nord-ouest
algérien), Revue des sciences de l’eau, 18/ spécial (2005), Vol 18 (Hors-série),
pp. 37-56.