Variability in the bio-optical properties of Mayagüez...
70
Variability in the bio-optical properties of Mayagüez Bay by Marcos A. Rosado Torres A thesis submitted in partial fulfillment of the requirements for the degree of MASTER OF MARINE SCIENCE in Biological Oceanography UNIVERSITY OF PUERTO RICO MAYAGUEZ CAMPUS 2000 Approved by: ______________________________ ______________ Fernando Gilbes, Ph. D. Date Member, Graduate Committee ______________________________ ______________ Jorge R. García-Sais, Ph. D. Date Member, Graduate Committee ______________________________ ______________ Roy A. Armstrong, Ph. D. Date President, Graduate Committee ______________________________ ______________ Alexander Leyderman, Ph. D. Date Representative of Graduate Studies ______________________________ ______________ Dallas Alston, Ph. D. Date Chairperson, Department of Marine Sciences ______________________________ ______________ Jaime Seguel, Ph. D. Date Director of Graduate Studies
Transcript of Variability in the bio-optical properties of Mayagüez...

Variability in the bio-optical properties of Mayagüez Bay
by
Marcos A. Rosado Torres
A thesis submitted in partial fulfillment of the requirements for the degree of
MASTER OF MARINE SCIENCE
in
Biological Oceanography
UNIVERSITY OF PUERTO RICO MAYAGUEZ CAMPUS
2000
Approved by: ______________________________ ______________ Fernando Gilbes, Ph. D. Date Member, Graduate Committee ______________________________ ______________ Jorge R. García-Sais, Ph. D. Date Member, Graduate Committee ______________________________ ______________ Roy A. Armstrong, Ph. D. Date President, Graduate Committee ______________________________ ______________ Alexander Leyderman, Ph. D. Date Representative of Graduate Studies ______________________________ ______________ Dallas Alston, Ph. D. Date Chairperson, Department of Marine Sciences ______________________________ ______________ Jaime Seguel, Ph. D. Date Director of Graduate Studies
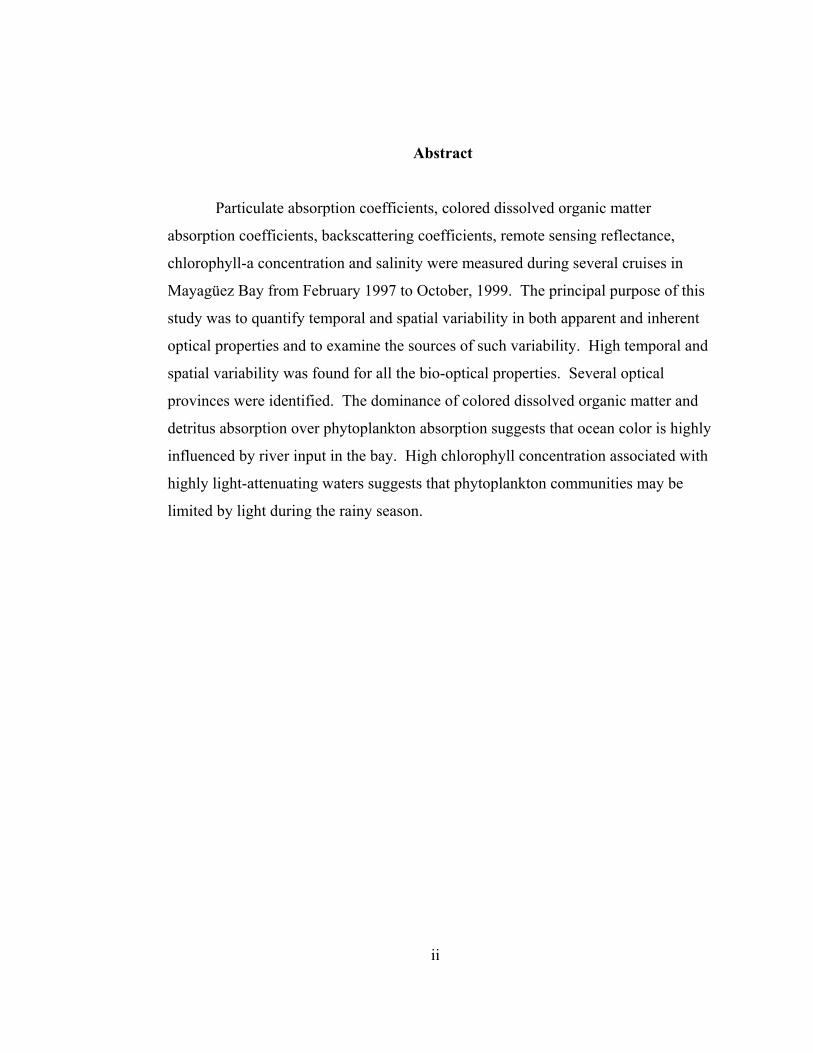
Abstract
Particulate absorption coefficients, colored dissolved organic matter
absorption coefficients, backscattering coefficients, remote sensing reflectance,
chlorophyll-a concentration and salinity were measured during several cruises in
Mayagüez Bay from February 1997 to October, 1999. The principal purpose of this
study was to quantify temporal and spatial variability in both apparent and inherent
optical properties and to examine the sources of such variability. High temporal and
spatial variability was found for all the bio-optical properties. Several optical
provinces were identified. The dominance of colored dissolved organic matter and
detritus absorption over phytoplankton absorption suggests that ocean color is highly
influenced by river input in the bay. High chlorophyll concentration associated with
highly light-attenuating waters suggests that phytoplankton communities may be
limited by light during the rainy season.
ii
Resumen
Los coeficientes de absorción de partículas, coeficientes de absorción de
materia orgánica disuelta coloreada, coeficientes de retro-dispersión, reflectancia tele-
detectada, concentración de clorofila-a y salinidad fueron medidos durante varios
cruceros a la Bahía de Mayagüez desde febrero 1997 hasta octubre 1999. El
propósito principal de este estudio fue cuantificar la variabilidad temporal y espacial
en las propiedades ópticas tanto aparentes como inherentes y examinar las fuentes de
esta variabilidad. Una alta variabilidad temporal y espacial fue encontrada en todas
las propiedades bio-ópticas. Varias provincias ópticas fueron identificadas. La
dominación de la absorción de materia orgánica disuelta coloreada y la absorción de
detrito sobre la absorción de fitoplancton sugiere que el color del océano es altamente
influenciado por el insumo ribereño en la bahía. Altas concentraciones de clorofila
asociadas a aguas con alta atenuación de luz sugieren que las comunidades de
fitoplancton en la bahía podrían estar limitadas por la luz.
iii

Acknowledgements
I would like to thank my parents, Rafael and Gloria and my brother Robert, I
simply adore you. I would like to acknowledge my friends, Fernando, Jesús, Ramón
and Patrick who guided me through this process and were always there. I would also
like to thank my graduate committee, Dr. Roy Armstrong, Dr. Fernando Gilbes and
Dr. Jorge R. García-Sais, for their support and guidance. Capt. Dennis Corales
assistance in the field operations is genuinely appreciated. Last but not least, I
would like to thank all those who provided support, knowledge and hope through this
journey. This research was supported by NASA grants NAG13-99029 and
NAG13-54.
iv

TABLE OF CONTENTS
LIST OF TABLES …………………………………………………………..……...…vi
LIST OF FIGURES.……………………………………………….………….….……vii
BACKGROUND ..............................................................................................................1
INTRODUCTION ............................................................................................................6
OBJECTIVES...................................................................................................................9
METHODS .....................................................................................................................10
FIELD WORK............................................................................................................... 10
LABORATORY WORK................................................................................................... 12
DATA ANALYSIS.......................................................................................................... 14
RESULTS .......................................................................................................................16
INHERENT OPTICAL PROPERTIES................................................................................. 16
APPARENT OPTICAL PROPERTIES................................................................................ 34
ANCILLARY DATA ...................................................................................................... 44
DISCUSSION.................................................................................................................51
CONCLUSION...............................................................................................................57
REFERENCES ...............................................................................................................58
v
LIST OF TABLES
Table 1. Analysis of Variance (two-way, without replicates) between stations
and months for the absorption coefficients (S. = Significant,
N.S = Non significant). P equals probability of no statistically
significant differences……………………...…………………………… 21
Table 2. Absorption coefficients of CDOM (ag) at 412 and 443 nm and
spectral slopes during July 98 and October 99. ……………………....... 24
Table 3. Analysis of Variance (two-way, without replicates) between
stations and months for the backscattering coefficient (S. = Significant,
N.S = Non significant). P equals probability of no statistically
significant differences…………………...………………………………32
Table 4. Correlation between backscattering coefficient and selected
parameters……………………………………………………...….…….32
Table 5. Vertical attenuation coefficient and estimated euphotic zone in
Mayagüez Bay during July 1998…………………………………….…. 43
Table 6. Vertical attenuation coefficients at 490 nm calculated for the Yagüez
River transect during October 1999……………………….……….……45
vi
LIST OF FIGURES
Figure 1. Stations sampled during 1997 and 1998 cruises in Mayagüez Bay.…..9
Figure 2. Stations sampled on October, 1998. Stations 1 to 6 were sampled on
October 19 and Stations 7 to 11 on October 24……………………….13
Figure 3. Absorption coefficients at surface for Atuneras station from February
1997 to January 1998……………………………………………...…..17
Figure 4. Particulate absorption coefficient (ap) at surface in Añasco station
from February 1997 to January 1998……………………………….…18
Figure 5. Detritus absorption coefficient (ad) at surface in Añasco station (a)
and Oceánica station (b) from February 97 to January 98………...…..19
Figure 6. Spectra of ap, ad, aph and aph* in Mayagüez Bay during July 98. The
legend at the top right corner applies to all graphs………………...….22
Figure 7. Spectra of ag in Mayagüez Bay during July 1998……………………...23
Figure 8. Spectra of ap, ad, aph and aph* for stations 1 to 6 during October 1999.
The legend at the top right corner applies to all graphs…………….…25
Figure 9. Spectra of ap, ad, aph and aph* for stations 8 to 11 during October 1999.
The legend at the top right corner applies to all graphs…………….....27
Figure 10. Spectra of ag in Mayagüez Bay during October 99……………...……28
vii
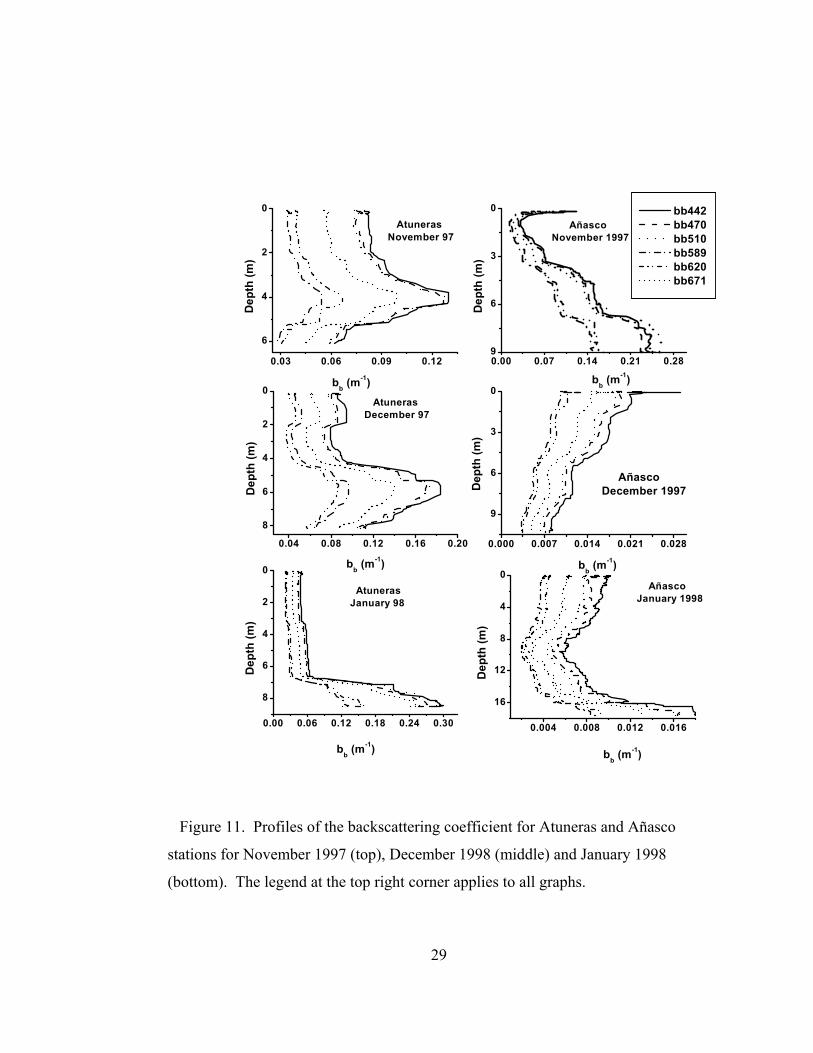
Figure 11. Profiles of the backscattering coefficient for Atuneras and Añasco
stations for November 1997 (top), December 1998 (middle) and
January 1998(bottom). The legend at the top right corner applies to
all graphs……...………………………………………………….……29
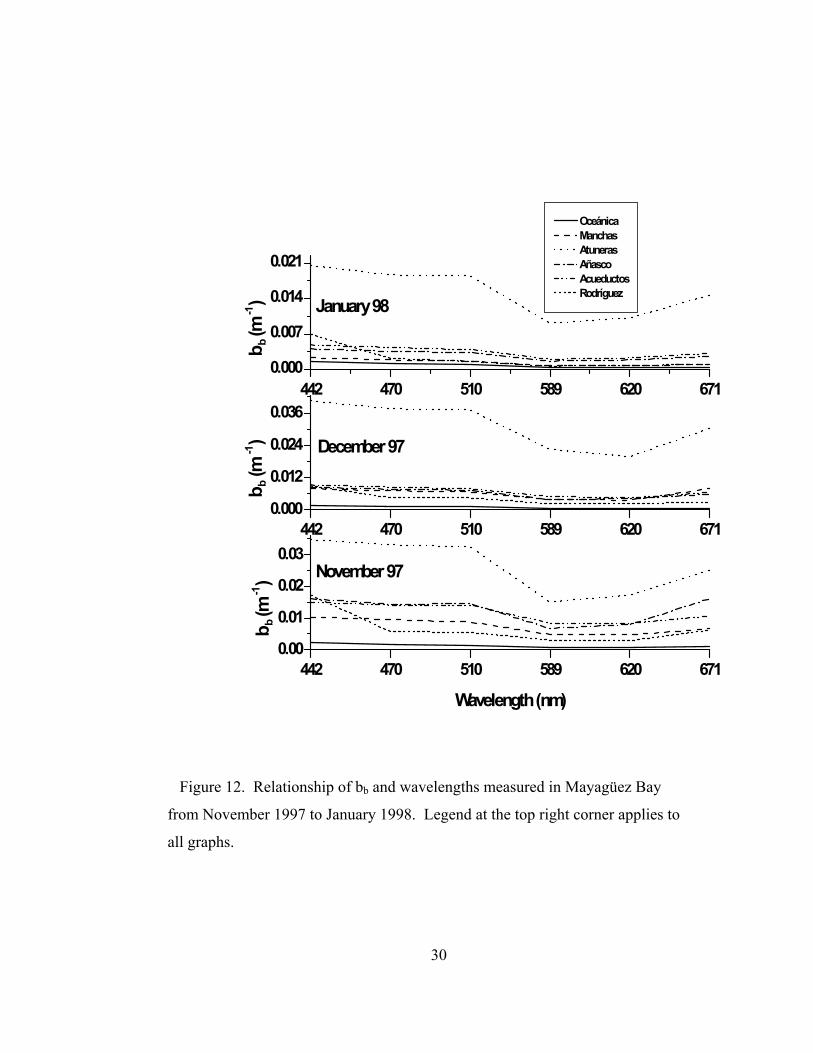
Figure 12. Relationship of bb and wavelengths measured in Mayagüez Bay from
November 1997 to January 1998. Legend at the top right corner applies
to all graphs……………………………………………………………30
Figure 13. Linear fits and correlation coefficients of bb vs. ap at the selected
wavelengths……………………………………………………………31
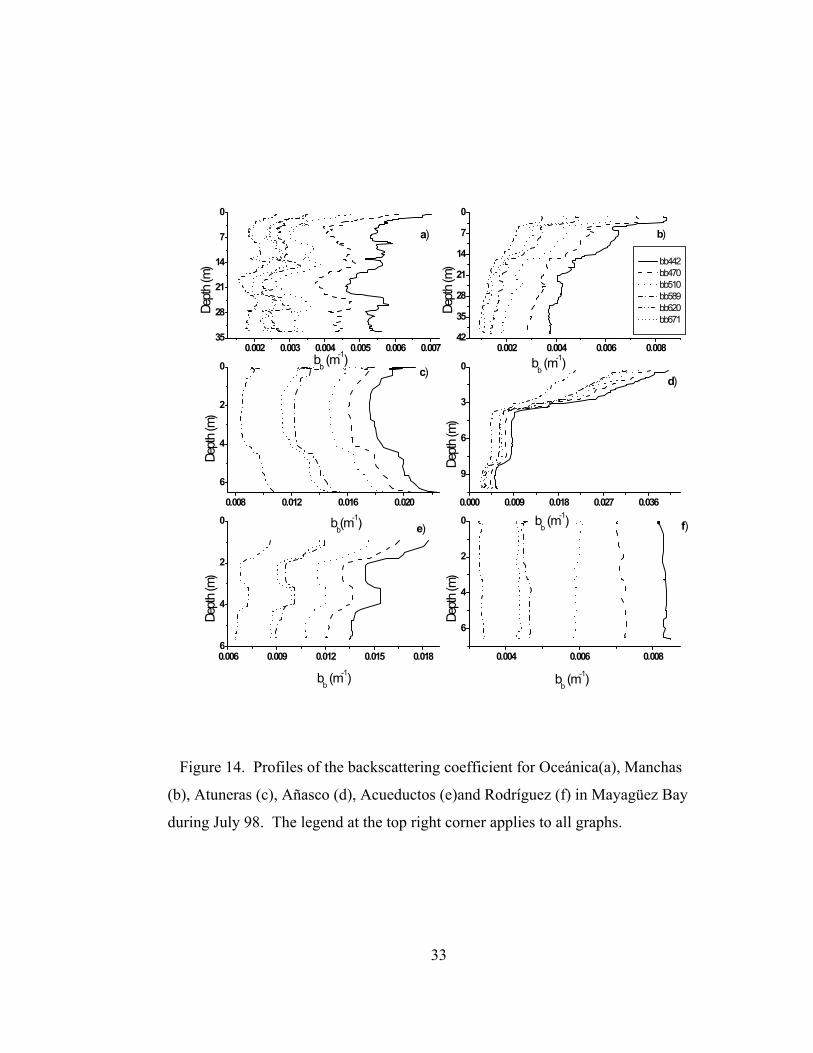
Figure 14. Profiles of the backscattering coefficient for Oceánica(a), Manchas
(b), Atuneras (c), Añasco (d), Acueductos (e) and Rodríguez (f) in
Mayagüez Bay during July 98. The legend at the top right corner
applies to all graphs…………………………………………………....33
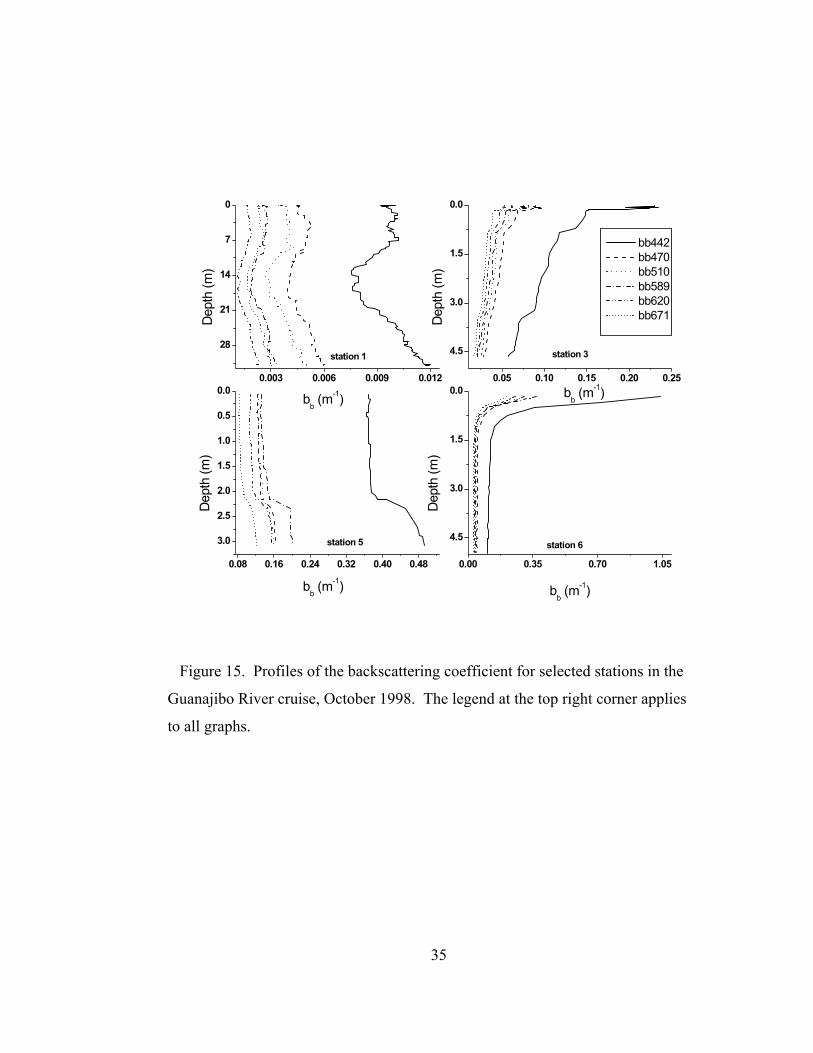
Figure 15. Profiles of the backscattering coefficient for selected stations in the
Guanajibo River cruise, October 1998. The legend at the top right
corner applies to all graphs……………………………..………….…..35
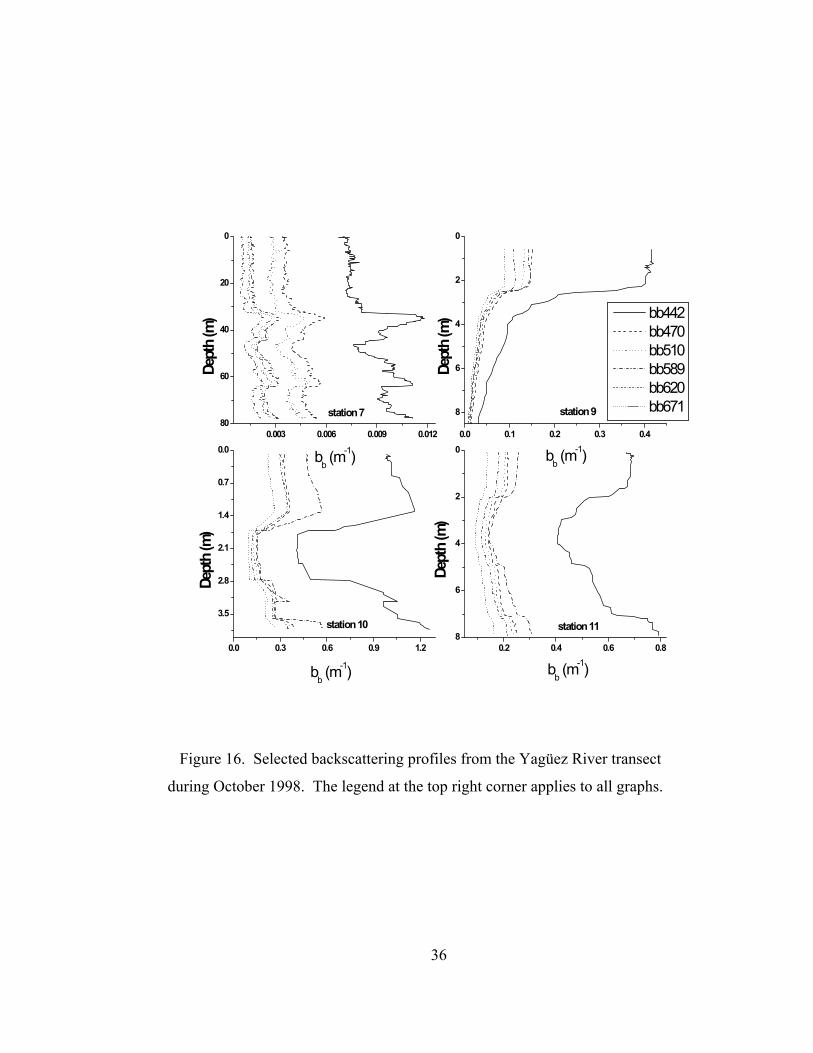
Figure 16. Selected backscattering profiles from the Yagüez River transect
during October 1998. The legend at the top right corner applies to
all graphs…………..………………………………….……….….…….36
Figure 17. First meter average of total absorption coefficient (m-1) and beam
attenuation coefficient (m-1) in Yagüez River stations, October 1999 …37
viii
Figure 18. Remote sensing reflectance curves from June 1997 to January
1998…………………………………………..………………………....38
Figure 19. The three typical spectral shapes of remote sensing reflectance
(Rrs) curves obtained in Mayagüez Bay. These examples are
from November 1997. Notice the difference in magnitudes of
the y axis.…………………………………………………………...…..40
Figure 20. Remote sensing reflectance curves in Mayagüez Bay during July
1998………………………………………………………………….....41
Figure 21. Remote sensing reflectance curves for the Guanajibo River stations
(stations 1-6), and the Yagüez River stations (stations 7-11) during
October 1999………...………………………………………………….42
Figure 22. Chl-a concentrations and salinities at surface in Mayagüez Bay during the
October 1999 cruise….………………….....…………….….……….….46
Figure 23. River discharge, salinity and Chl-a measured in Mayagüez Bay from
February 1997 to January 1998 ..…………………..…...…………..…..48
Figure 24. Suspended particulate matter (SPM) at surface in Mayagüez Bay during
October 1999.……………………………………………………..….....49
Figure 25. Comparison of particulate absorption coefficient, detritus absorption
coefficient and phytoplankton absorption coefficient at 443 nm. Note
the proportion of particulate absorption due to detritus…….……....…..52
ix
BACKGROUND
Absorption and scattering are collectively known as inherent optical
properties because they are defined for collimated light and thus independent of
radiance distribution (Kirk, 1994). Values of absorption and scattering vary
greatly among natural waters due to the differences in kinds and concentrations of
dissolved and particulate substances. These differences underlie the wide
variations in apparent properties of natural waters. These properties, namely the
vertical attenuation coefficient (K), radiance (L), irradiance (E) and reflectance
(R) are functions of the radiance distribution as well of the inherent properties
(Weidemann and Bannister, 1986). To better understand these properties, the
dissolved and particulate components of the ecosystem must be identified and
their contributions to absorption and scattering evaluated.
Absorption occurs when a photon passes in the vicinity of a molecule and
is captured, increasing its energy by an amount corresponding to the energy of the
photon (Kirk, 1994). Most of the light energy absorbed in the aquatic medium
ends up as heat or as chemical energy in the form of photosynthetically produced
biomass. Only a tiny part is turned back into light again by fluorescence and even
this is for the most part re-absorbed before it can escape from the system (Kirk,
1994). Absorption in the aquatic ecosystem can be attributed to four components:
water, colored dissolved organic matter, phytoplankton and inanimate particulate
matter (tripton). Water absorbs very weakly in the blue and green regions of the
spectrum but its absorption begins to rise above 550 nm and is very high in the
red region (Pope and Fry, 1997). The contribution of water itself to the
attenuation of PAR by absorption of quanta is of importance only above 500 nm.
Salts present in sea water have no significant effect on absorption in the
visible/photosynthetic range. The result of microbial decomposition of plant
1
tissue is a complex group of compounds, collectively named humic substances
(Kirk, 1994). Sometimes they are called Gelbstoff, meaning “yellow substance”
in German, a more acceptable term being colored dissolved organic matter
(CDOM). These substances enter the marine environment as the result of river
input and coastal runoff, although a fraction of the total marine Gelbstoff is
produced in situ. These compounds are yellow to brown in color and absorb light
in the blue end of the spectrum, absorbing strongly ultraviolet wavelengths
(Carder et. al, 1989). If present in large concentrations, they can reduce the
photosynthetically active radiation available to phytoplankton, reducing primary
production (D’sa et. al, 1999). Detritus or inanimate particulate matter absorbs
low in the red region of the spectrum and increases exponentially into the blue
region. The spectral shape is very similar to that of CDOM and in some waters it
is theorized that detritus is composed of the insoluble fractions of humic
materials, although it also arise from the decomposition of the phytoplankton
(Kirk, 1994). The photosynthetic pigments of phytoplankton are the fourth
component responsible for absorption of light in aquatic ecosystems. Absorption
of light by phytoplankton cells is the major factor determining the reflectance
signal from seawater, whose spectral variations are used in remote sensing to
estimate their biomass in the oceans (García et al., 1998). Phytoplankton has
absorption peaks in the blue and red portions of the spectrum, due to the presence
of their principal pigment, Chlorophyll-a (Chl-a). Smaller peaks in absorption at
other wavelengths occur, depending on the natural phytoplankton assemblages
(and the specific pigment composition in their cells). In general, oceanic waters
should exhibit absorption curves dominated by phytoplankton while coastal
waters have a large contribution of CDOM and detritus absorption, specially in
waters with high river influence.
2
Scattering occurs when a photon interacts with some component of the
medium in such a way that it is caused to diverge from its original path (Kirk,
1994). Scattering itself does not remove light from the system, a scattered photon
still being available for photosynthesis. The effect of scattering is to impede the
vertical penetration of light. As a photon is scattered, the probability that it is
captured by one of the absorbing components of the medium increases. Some
photons are actually scattered back in an upward direction, this property is known
as backscattering. The ratio between backscattering and absorption yields the
remote sensing reflectance, an important measurement for estimating Chl-a values
from space. Scattering is caused in natural waters by molecular scattering of
water itself and particles, including phytoplankton. Water scatters light inversely
with the fourth power of the wavelength (Kirk, 1994). The angular distribution of
light scattered by water is the same in the forward and backward directions (Kirk,
1994). The lowest value for scattering in natural waters is 10 times as high as the
value for pure water at that wavelength. Total light scattering in natural waters is
dominated by the particle contribution and increases broadly in proportion of the
concentration of suspended particulate matter. In coastal waters, scattering is
much higher due to the presence of resuspended particles, river-borne terrigenous
particulate material and phytoplankton. Resuspension of particles is caused by
wave action, tidal currents and storms (Kirk, 1994). Phytoplankton can also make
a significant contribution to the scattering of light, but their scattering properties
vary widely from one species to another (Kirk, 1994). Due to their low refractive
index relative to water, phytoplankton cells are weak backward scatterers
compared to inorganic particles (Kirk, 1994).
The bio-optical properties can give us information about ecological
processes. Given the growing concern of anthropogenic modification of coastal
waters and related global changes affecting phytoplankton growth in such waters,
3
the long term variability and trends of Chl-a have become of major interest.
Optical monitoring of coastal waters may be a cost effective and efficient tool for
assessing seasonal and regional variations in phytoplankton abundance and bloom
dynamics (Li and Smayda, 1998). A better understanding of how light interacts
with coastal waters can also help us to explain how phytoplankton populations
adapt to seasonal variations in available radiation.
Of all the factors which limit primary production, light is the one that
shows the more extreme variation (Kirk, 1994). Spectral quality of light in the
sea is susceptible to changes with depth, water transparency, and the nature of the
incident solar radiation (Figueiras and Arbones, 1999). In response to the
variability in intensity and spectral distribution of available light for
photosynthesis in the aquatic ecosystem, phytoplankton has developed
physiological adaptations to ensure their survival. The light harvesting capacity
of a phytoplankton cell depends in part on the particular combination of
photosynthetic pigments present in their thylakoids (Platt, 1981). There are three
chemically distinct families of pigments; the chlorophylls, the carotenoids and the
biliproteins. Pigments within these families, have different absorption peaks.
Chl-a is the most abundant and important of these pigments. Energy is captured
by accessory pigments and passed to Chl-a to be used for photosynthesis.
Although a given phytoplankton group has a fixed number of pigments specific to
that species, it can change the ratio in which these pigments are concentrated in
the cell, thus effectively changing the absorption spectrum of that cell (Platt,
1981). It is generally found that as light intensity during growth decrease, the
concentration of photosynthetic pigments in the cells increases. Increases in
pigment concentration of up to five- fold are commonly observed (Kirk, 1994).
These increases are not only in Chl-a, but also in accessory pigments, which can
be greater. The increase of photosynthetic pigments that occur as the light
4
intensity diminishes can be due to an increase in the number of photosynthetic
units, or in the average size of the photosynthetic unit, or both.
Other factor that affects the absorption spectrum of a phytoplankton cell is
the “package effect”. It occurs because pigment molecules are contained in
discrete packages; within chloroplasts, and cells. This diminishes the efficiency
at which they collect light from the prevailing field, lowering their specific
absorption (Kirk, 1994). Package effect is proportionately greatest when
absorption is strongest, flattening the absorption peaks. This effect is regulated by
the size and shape of phytoplankton cells. As a general rule, the larger the cells,
the less efficient is the light capture process. Elongated cell shapes, in the other
hand, tend to absorb more light than spherical shapes.
5
INTRODUCTION
Coastal waters are known for their large variability in optical properties
(Kirk, 1994). This is the result of a complex and dynamic array of processes that
operates in these systems. The interaction of these processes, both in a temporal
and spatial scale, causes variation in the abiotic and biotic components of the
water column, which affect its optical characteristics. Assessing the range and
sources of this variability is important for the development of remote sensing
algorithms capable of accurately measuring Chl-a. Establishing regional
algorithms for calculating Chl-a concentration from satellite data is required to
obtain proper estimates of phytoplankton biomass and primary production (García
et. al., 1998).
In most marine areas, absorption and backscattering coefficients of
phytoplankton are fundamental variables controlling optical properties (Morel,
1987). Absorption of light by phytoplankton cells is the major factor determining
the reflectance signal from seawater (Gordon and Morel, 1983). These bio-
optical properties, when combined with ancillary data, can be used to study
phytoplankton ecology.
Historically, it has been difficult to obtain a full data set of optical
parameters in a short time span (i.e. a day), due to lack of technology to perform
these measurements in the field (e.g. backscattering), and the geographical
extension needed to navigate in order to locate contrasting optical provinces.
Modern instrumentation has made possible the collection of in situ data sets of
optical parameters such as particulate absorption (ap), CDOM (ag), backscattering
coefficient (bb), remote sensing reflectance (Rrs), and Chl-a concentration on
space and time scales previously impossible to sample. This information can be
used to asses the relative importance of specific optical constituents in a particular
system.
6

Puerto Rico offers a good opportunity to study optical properties in
tropical coastal waters. In the tropics, the seasonal rainfall patterns produce clear
changes in river discharge. Changes in both the amount and the biogeochemical
nature of river discharge occur through the year due to large variations in climatic
and topographic conditions combined with anthropogenic factors (Gilbes et al.,
1996). These sources of variation, affect important oceanic parameters such as
salinity, nutrient concentration, light attenuation, and suspended sediments, thus
affecting bio-optical properties.
Mayagüez Bay is an excellent natural laboratory to study optical
properties. Located in the west coast of Puerto Rico, it is subjected to the
influence of three major rivers. The Añasco, Yagüez and Guanajibo rivers supply
a considerable load of terrigenous sediments, especially during the rainy season,
extending from September through November. According to Morelock et al.
(1983), the Añasco- Mayagüez basin receives an average precipitation range of
200 - 250 cm per year. The mean discharge of these rivers during 1997-1998
varied from 2.21 m3s-1 to 13.55 m3s-1 for Añasco River and 0.71 m3s-1 to 13.85
m3s-1 for the Guanajibo River (US Geological Survey, 1998). The Añasco River
is the largest river of the west coast, and although its basin was used for
agriculture in the past, nowadays is much more developed. The Yagüez basin is
highly developed and highly influenced by anthropogenic activities. The
Guanajibo basin was traditionally dedicated to agriculture, especially to the sugar
cane industry, but it is not being cultivated actively in the present. Beside these
rivers, a number of smaller streams discharge to the bay.
The location of tuna processing facilities close to the Yagüez River mouth
is another source of nutrients and particulate matter to the bay. These industries
dump waste waters into the bay on a regular basis. Mayagüez Bay is also
subjected to sewage waters input. The Puerto Rico Waters Authority discharges
7
primary treated water from the city sewer systems through a diffuser tube located
between the Añasco River mouth and the tuna factories. Both the riverine and the
anthropogenic inputs to the bay supply nutrients and suspended particles to the
system. All these interactions may suggest the existence of several bio-optical
provinces in a relatively small area.
8

OBJECTIVES
The main objective of this work is to characterize the spatial and temporal
variability of inherent and apparent optical properties in Mayagüez Bay. A
secondary objective is to study how this variability is regulated by the abiotic and
biotic factors in the system. The analysis of how these variables are related may
provide a better understanding of the behavior of phytoplankton assemblages in
Mayagüez Bay. The hypotheses considered in this work are:
1. Bio-optical properties in Mayagüez Bay are highly variable and influenced
mostly by rainy and dry seasonal patterns.
2. Correlation exist between river discharge and absorption, backscattering
and reflectance measurements in the bay.
3. Light is the limiting factor for phytoplankton populations during the rainy
season.
9
METHODS
Field Work
Six stations were routinely sampled at Mayagüez Bay (Figure 1) to
evaluate the influence of the seasonal river discharge and industrial effluents on
the bio-optical properties. Monthly samples were collected from February 1997
to January 1998. At each station, water samples were taken from the surface for
Chl-a concentration, absorption measurements and nutrient analysis. Temperature
and salinity profiles were obtained at each station using a SBE-19 CTD from Sea-
Bird Electronics. Profiles of the backscattering coefficient (bb) at six wavelengths
were obtained using the Hydroscat-6 (from Hobi Labs). Water radiance, L0(λ),
sky radiance, Ls(λ), and the above surface downwelling irradiance, Ed(0+, λ) were
measured using a GER 1500 portable spectroradiometer. L0(λ) was measured
aiming the GER 45o to the vertical into the water surface, maintaining an azimuth
of 90o from the solar plane to minimize sun glint. Ls(λ), was measured pointing
the GER 45o to the vertical to the sky, maintaining an azimuth of 90o from the
solar plane. Ed(0+, λ) was measured pointing directly upward using a cosine
collector attached to the GER. The remote sensing reflectance, Rrs(λ), was
calculated using the following equation:
Rrs(λ) = L0(λ)-f (Ls(λ)) Ed(0+, λ)
Where f is the Fresnel’s number, the percent of sky radiance reflected back to the
atmosphere. Fresnel’s number has a value of 0.28 at a 45o angle.
An additional cruise took place in July 1998. All of the above
measurements were taken. In addition, samples for measuring the absorption of
CDOM were collected. Two more cruises were carried out in October 1999.
During the October 19 cruise, six stations were sampled at different distances
10
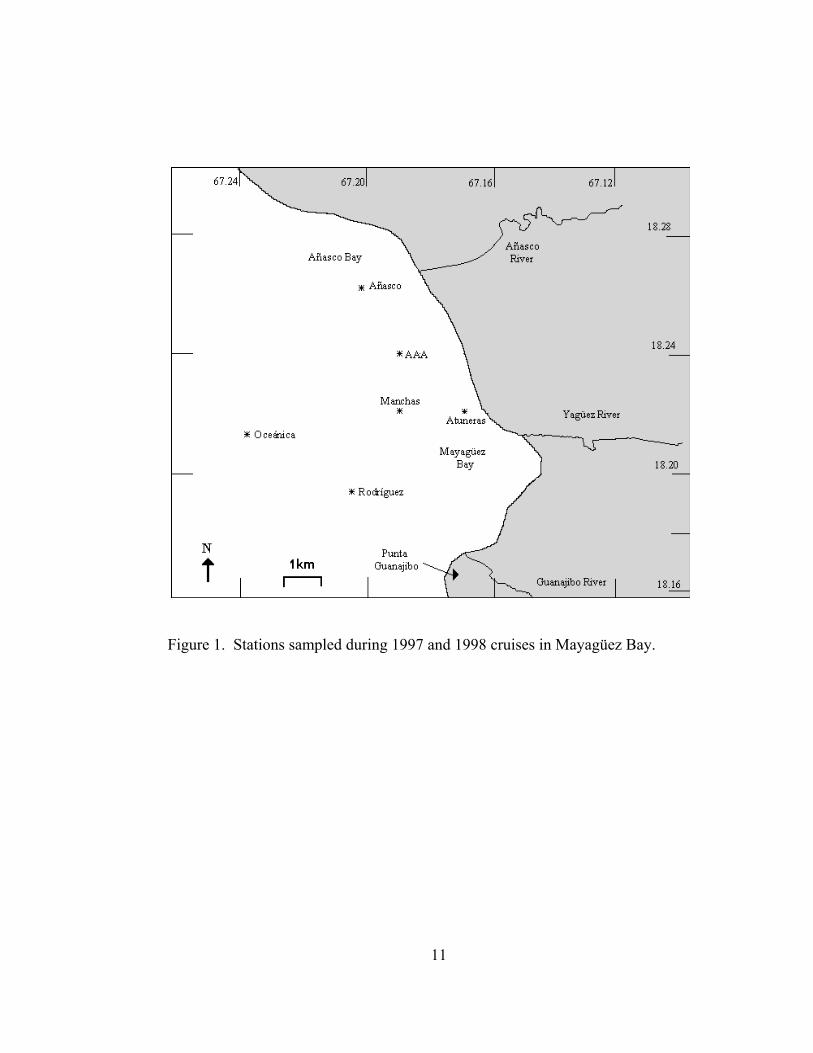
Figure 1. Stations sampled during 1997 and 1998 cruises in Mayagüez Bay.
11
from the Guanajibo River mouth. Samples were also taken for determination of
total suspended particulate matter concentrations. On October 24, five stations
were sampled approaching the Yagüez River mouth (Figure 2). In this cruise an
optical package containing an AC-9 (Wet Labs),a SBE-19 CTD, a WetStar
fluorometer (Wet Labs), and a OCR- 200 Profiling radiometer (Satlantic) was
deployed.
Laboratory work
Water samples were filtered in situ using the filter pad technique proposed
by Mitchell and Kieffer (1984). The samples were collected on 25 mm Whatman
GF/F filters. These filters were kept at 0°C until absorption measurements were
done. The absorption spectra between 375 and 800 nm was measured using a
GER 1500 portable spectroradiometer attached to a Licor integrating sphere
through a fiber optic cable. A blank filter was made passing a volume of 200
milliliters of distilled water. The absorption of the blank was also measured and
the difference between the sample and the blank spectra was taken as the
particulate absorption spectrum (ap). Following this measure, hot methanol was
passed through the filter (Kishino et al., 1985), and the measurement procedure
repeated. These spectra were taken as absorption by non-methanol extractable
detrital material (ad). The difference between ap and ad represents the
phytoplankton absorption (aph). This value, divided by the Chl-a concentration
correspond to the Chlorophyll-a specific absorption coefficient (aph*). All spectra
were shifted to zero absorbance at 750 nm and corrected for pathlength
amplification using the β factor from Bricaud and Stramsky (1990). Chl-a
concentration extracted in methanol was measured with a Turner Designs Model
10-AU fluorometer using the method developed by Welschmeyer (1994). This
12

Figure 2. Stations sampled on October, 1998. Stations 1 to 6 were sampled on
October 19 and Stations 7 to 11 on October 24.
13
set-up provides the capacity of measuring the Chl-a concentration directly,
without acidification of the sample. The fluorometer was calibrated using Chl-a
from the alga Anacystis nidulans.
CDOM samples were obtained using only materials made of crystal and
Teflon. All materials were thoroughly cleaned with 1M HCl and1M NaOH
solutions, and rinsed with distilled water. Crystalware and filters were combusted
for at least 6 hours at 300°C to remove any trace of organic matter. Absorption
spectra of CDOM (ag) were obtained filtering seawater through a pre-combusted
GF/F filter and collecting the filtrate in amber glass bottles. The absorbances of
the samples were measured from 250 to 750 nm in a Pelkin Elmer Lambda 18
dual beam spectrophotometer following the suggestions of Bricaud et al. (1981).
The concentration of total suspended particulate matter (SPM) was
measured using Millipore HA 0.45 µm cellulose acetate filters. The filters were
desiccated in an oven for 24 hours at 70-80°C . The weight of each filter was
recorded to five significant figures using a Mettler analytical balance. Filters
were stored in a glass dessicator with silica gel until use. A known volume of
seawater was filtered and the filters were desiccated in the oven again to remove
the water before weighing for second time. The difference between the filter
weight before and after filtration was taken as the SPM (mg l-1).
Data analysis
Two-way analyses of variance (ANOVA) were used to evaluate the
temporal and spatial variability of ap, ad, aph and aph*. The analyzed wavelengths
correspond to those found in the Sea-viewing Wide Field-of-view Sensor
(SeaWiFS), namely 412, 443, 490, 510, 555 and 670 nm. The data were analyzed
using the log10 transformation to normalize it. Similar calculations were done
with bb, ag, and Rrs, trying to establish the sources of variation from both the
14
ANOVA results and graphic examination of the data. Correlation analysis were
performed between several optical variables, Chl-a and river discharge. The
CDOM spectral slopes were calculated from linear-least-square regressions of the
plot of ln ag(λ) vs. wavelength for the interval between 412 and 443 nm. This
interval was chosen because CDOM absorption is greater there and those
wavelengths have been suggested to discriminate between Chl-a and CDOM in
future bio-optical algorithms.
15
RESULTS
Inherent Optical Properties
Figure 3 illustrates some examples of the absorption curves obtained at
Mayagüez Bay from February 1997 to January 1998. The spatial variability of
total particulate absorption, ap, was highly significant (p<0.001) at the six
analyzed wavelengths. The ap also showed significant temporal differences at
those wavelengths, except for 555 nm. The highest particulate absorption values
were found during October 1997 in Añasco station, and the lowest values were
found during March 1997 in Manchas station. This pattern is shown in the six
analyzed wavelengths. The Añasco station also showed the greatest range in ap
values during this study (Figure 4). Correlations made between ap at 443, 555 ,
670 nm and Chl-a did not reveal any strong relationship. In general, ap was
highest in Añasco station and lowest in Oceánica station through time. April,
August, and October were the months with the highest ap values.
Detritus absorption (ad) followed a similar trend to particulate absorption.
It was highly significant in space (p< 0.001) but it did not show temporal
differences except for 412 and 443 nm ( P< 0.01 and P< 0.05, respectively). The
highest ad value was found at Añasco station during October 1997 and the lowest
ad value was found in Oceánica station during June 1997 (Figure 5).
Phytoplankton absorption, aph, was also highly variable in space, showing
significant differences at all the examined wavelengths ( P<0.001). At the
temporal level aph showed significant differences in all analyzed wavelengths
except at 443 nm. The maximum aph value was at Añasco station during
November 1997 and the minimum value was at Manchas during September 1997.
16

Figure 3. Absorption coefficients at surface for Atuneras station from February
1997 to January 1998.
17

Figure 4. Particulate absorption coefficient (ap) at surface in Añasco station
from February 1997 to January 1998.
18

Figure 5. Detritus absorption coefficient (ad) at surface in Añasco station (a)
and Oceánica station (b) from February 97 to January 98.
19
Note that although the highest aph value was recorded in Añasco station, the three
values following the lowest value were recorded in that station as well.
The specific absorption coefficient of phytoplankton (aph*) was
significantly different in space only at 412 and 443 nm (P< 0.05), but it was
significantly different in time at all wavelengths except for 670 nm. The
maximum value was at Añasco station during February 1997 and the minimum
value was at Añasco station during April 1997. A summary of the results for all
the absorption analyses is presented in Table 1.
In July 1998, the highest ap were detected in Añasco station (0.73 m-1 at
412 nm). The lowest were in Oceánica and Rodríguez stations (0.061 m-1 at 412
nm). Añasco station also showed the highest ad (0.68 m-1 at 412 nm) and
Oceánica and Rodríguez stations showed the lowest ( 0.030 m-1 at 412 nm). The
aph were the highest in Atuneras and Acueductos stations (0.20 m-1 and 0.16 m-1 at
443 nm, respectively) and the lowest in Oceánica and Rodríguez stations (0.036
m-1 and 0.040 m-1 at 443 nm, respectively). The aph* were the highest in Manchas
station (0.06 at 443nm) and Oceánica station (0.059 m-1 at 443 nm). The lowest
values were recorded in Atuneras station (0.034 m-1 at 443 nm). These results are
presented in Figure 6. The highest ag was found in Añasco station with 0.43 m-1
at 412 nm. Other stations had values ranging from 0.17 to 0.10 m-1 at 412 nm.
These data are shown in Figure 7. The spectral slopes of ag curves are shown in
Table 2.
In October 1999, stations 1 to 6 (Figure 2) showed an increase in ap as the
station approached to the Guanajibo River mouth. As ap increases ad increases
accordingly. There is also an increase in aph , although it is a much smaller
fraction of ap in the stations close to the mouth. Figure 8 demonstrates these
trends. The aph* shows large variability at 443 nm and lower variability at 670
nm. Stations 8 to 11 (Figure 2) show a similar pattern to the Guanajibo stations.
20

Table 1. Analysis of Variance (two-way, without replicates) between stations
and months for the absorption coefficients (S. = Significant,
N.S = Non significant). P equals probability of no statistically
significant differences.
Parameter Significance in Space P Significance in Time P
ap 412 S. <0.001 S. <0.01
ap 443 S. <0.001 S. <0.05
ap 490 S. <0.001 S. <0.05
ap 510 S. <0.001 S. <0.05
ap 555 S. <0.001 N.S. N.S.
ap 670 S. <0.001 S. <0.01
ad 412 S. <0.001 S. <0.01
ad 443 S. <0.001 S. <0.05
ad 490 S. <0.001 N.S. N.S.
ad 510 S. <0.001 N.S. N.S.
ad 555 S. <0.001 N.S. N.S.
ad 670 S. <0.001 N.S. N.S.
aph 412 S. <0.001 S. <0.01
aph 443 S. <0.001 N.S. N.S.
aph 490 S. <0.001 S. <0.001
aph 510 S. <0.001 S. <0.01
aph 555 S. <0.001 S. <0.001 aph 670 S. <0.001 S. <0.001
aph * 412 S. <0.05 S. <0.001 aph * 443 S. <0.05 S. <0.001 aph * 490 N.S. N.S. S. <0.05
aph * 510 N.S. N.S. S. <0.01
aph * 555 N.S. N.S. S. <0.001
aph * 670 N.S. N.S. N.S. N.S.
21
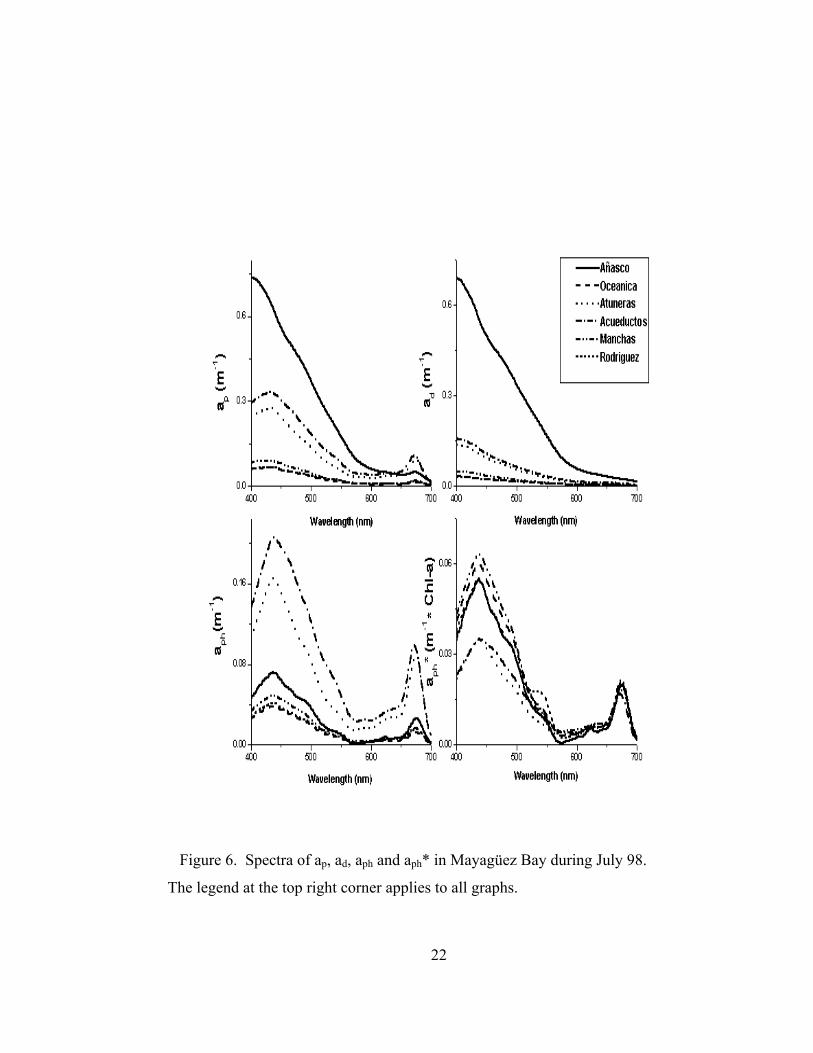
Figure 6. Spectra of ap, ad, aph and aph* in Mayagüez Bay during July 98.
The legend at the top right corner applies to all graphs.
22
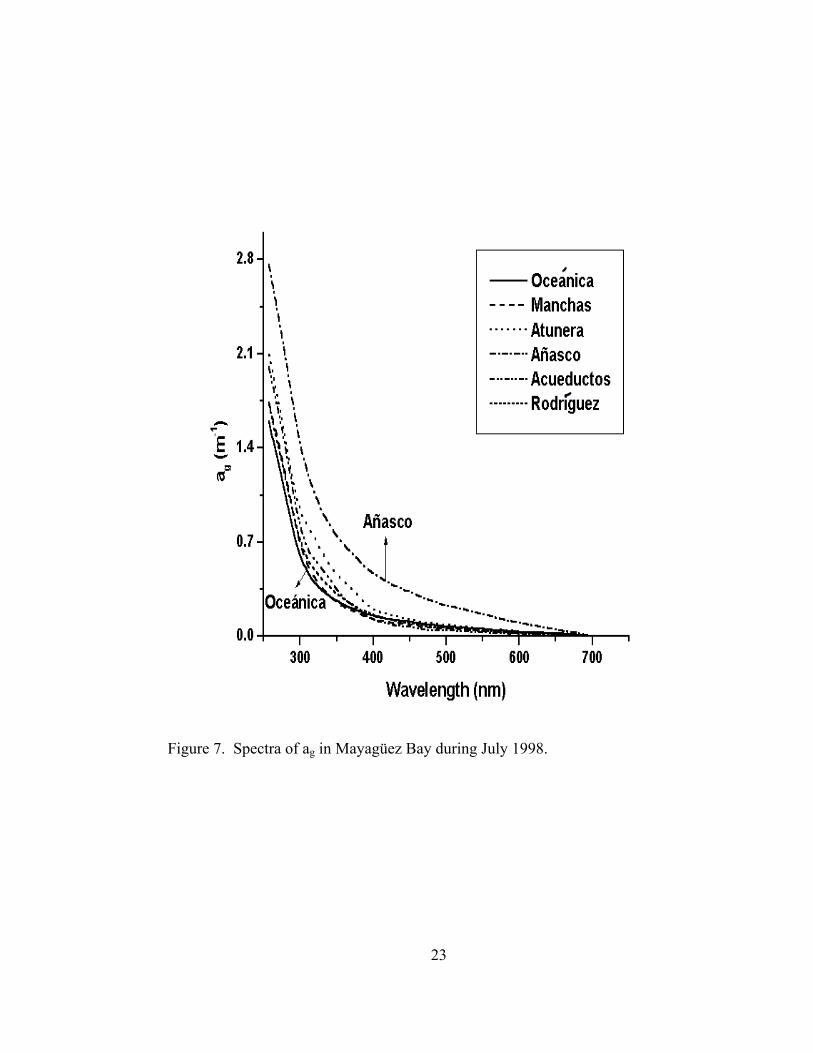
Figure 7. Spectra of ag in Mayagüez Bay during July 1998.
23

Table 2. Absorption coefficients of CDOM (ag) at 412 and 443 nm and spectral
slopes during July 98 and October 99.
Sample Date ag 412 nm ag 443 nm Spectral Slopes
Oceánica July 98 0.2308 0.1823 0.00732
Manchas July 98 0.1159 0.0900 0.00781
Atuneras July 98 0.1772 0.1338 0.00915
Añasco July 98 0.4286 0.3445 0.00695
Acueductos July 98 0.1910 0.1397 0.00989
Rodríguez July 98 0.1416 0.1031 0.00958
station 1 October 99 0.1249 0.0908 0.0103
station 2 October 99 0.1727 0.1160 0.0129
station 3 October 99 0.4498 0.3083 0.0122
station 4 October 99 2.3819 1.4989 0.0149
station 5 October 99 0.3281 0.2229 0.0124
station 6 October 99 0.5656 0.3746 0.0132
station 7 October 99 0.1209 0.0880 0.0103
station 8 October 99 0.1810 0.1330 0.0099
station 9 October 99 0.6277 0.4632 0.0098
station 10 October 99 1.0550 0.6471 0.0158
station 11 October 99 0.8853 0.5774 0.0138
Mean 0.4811 0.3243 0.0110
Std. Dev. 0.5641 0.3505 0.0026
Min. 0.1159 0.0880 0.0070
Max. 2.3819 1.4989 0.0158
24

Figure 8. Spectra of ap, ad, aph and aph* for stations 1 to 6 during October 1999.
The legend at the top right corner applies to all graphs.
25

An increase in ap, ad and aph was found as the station gets closer to the Yagüez
River mouth (Figure 9). The aph* shows a great range of variability at the 443 nm
peak but lower variability at the 670 nm peak (Figure 9). The ag showed the
highest values in stations closer to the river mouth, namely station 4 and Station
10 (Figure 10). In station 4, the maximum value was 2.38 m-1 at 412 nm. A
maximum value of 1.06 m-1 at 412 nm was observed at station 10.
Backscattering coefficients from November 1997 to January 1998 for
Atuneras and Añasco stations are shown in Figure 11. These data showed
significant spatial differences (P< 0.001 to P<0.01) in the six channels of the
Hydroscat-6, (442, 470, 510, 589, 620 and 671 nm). Significant temporal
differences (P< 0.01 to P<0.05) were also found at most wavelengths except at
589 nm. Maximum values were found in December 1997 at the Atuneras station,
and minimum values were found at the Oceánica station in January 1998.
Atuneras station had the highest bb values through the year, followed by Añasco
and Acueductos, the smallest values were recorded at the Oceánica station. The
profiles showed a tendency of decreasing bb with increasing wavelength. This
pattern is not observed in the red wavelengths (620 and 671 nm) as shown in
Figure 12. The bb and ap revealed a strong positive correlation at the three pairs
of analyzed wavelengths (442 x 443, 589 x 555 and 671 x 670 nm ) (Figure 13).
The correlation between bb (671) and ap (670) was specially strong with a
correlation coefficient of 0.93, n=17. A linear regression curve fitted to the data
yielded a regression coefficient of 0.86. The backscattering coefficient and Secchi
depth revealed moderately strong negative correlations. The data were fitted with
a power regression equation which resulted in high regression coefficients. These
results are summarized in Table 3 and Table 4. Backscattering values for July
1998 are shown in Figure 14. The data shows the highest backscattering values
26
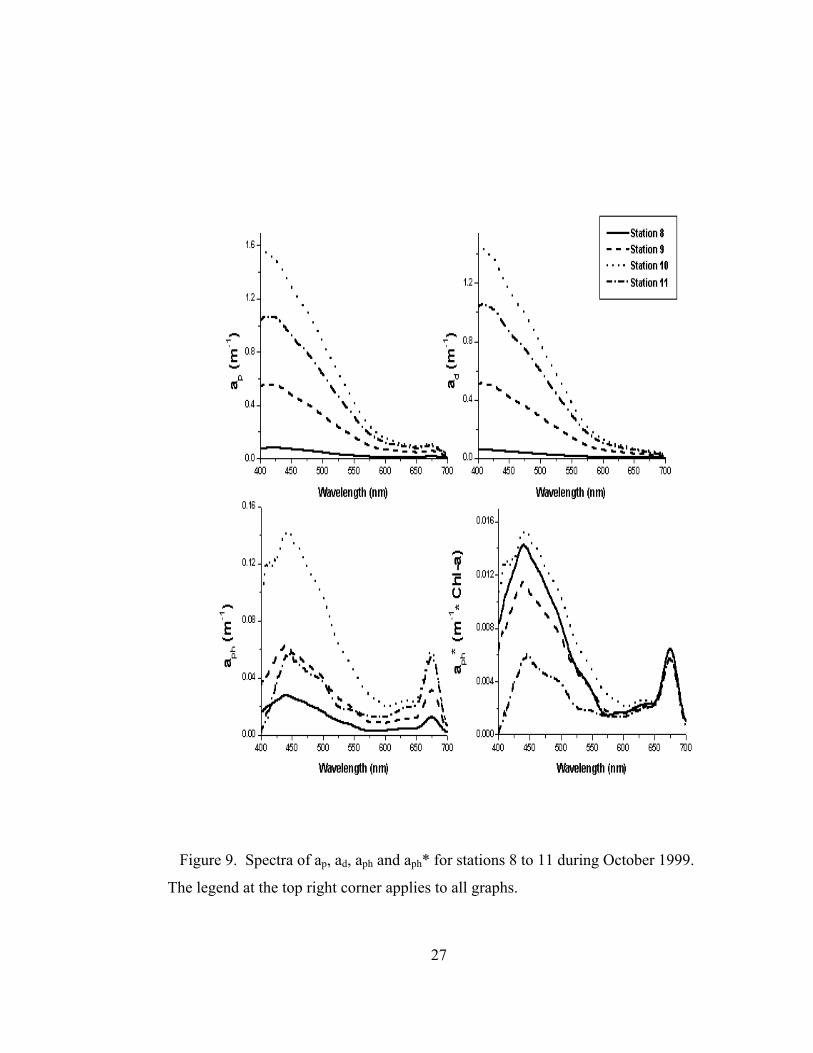
Figure 9. Spectra of ap, ad, aph and aph* for stations 8 to 11 during October 1999.
The legend at the top right corner applies to all graphs.
27

Figure 10. Spectra of ag in Mayagüez Bay during October 99.
28
6
4
2
0
0.03 0.06 0.09 0.12
8
6
4
2
0
0.04 0.08 0.12 0.16 0.20
8
6
4
2
0
0.00 0.06 0.12 0.18 0.24 0.30
9
6
3
0
0.00 0.07 0.14 0.21 0.28
9
6
3
0
0.000 0.007 0.014 0.021 0.028
16
12
8
4
0
0.004 0.008 0.012 0.016
AtunerasNovember 97
bb (m-1)
Dep
th (m
)
AtunerasDecember 97
bb (m-1)
Dep
th (m
)
AtunerasJanuary 98
bb (m-1)
Dep
th (m
)
AñascoNovember 1997
bb (m-1)
Dep
th (m
) AñascoDecember 1997
bb (m-1)
Dep
th (m
)
bb442 bb470 bb510 bb589 bb620 bb671
AñascoJanuary 1998
bb (m-1)
Dep
th (m
)
Figure 11. Profiles of the backscattering coefficient for Atuneras and Añasco
stations for November 1997 (top), December 1998 (middle) and January 1998
(bottom). The legend at the top right corner applies to all graphs.
29
442 470 510 589 620 6710.00
0.01
0.02
0.03
442 470 510 589 620 6710.000
0.012
0.024
0.036
442 470 510 589 620 6710.000
0.007
0.014
0.021
November 97
b b (m
-1)
Wavelength (nm)
December 97
b b (m
-1)
January 98
b b (m
-1)
Oceánica Manchas Atuneras Añasco Acueductos Rodríguez
Figure 12. Relationship of bb and wavelengths measured in Mayagüez Bay
from November 1997 to January 1998. Legend at the top right corner applies to
all graphs.
30
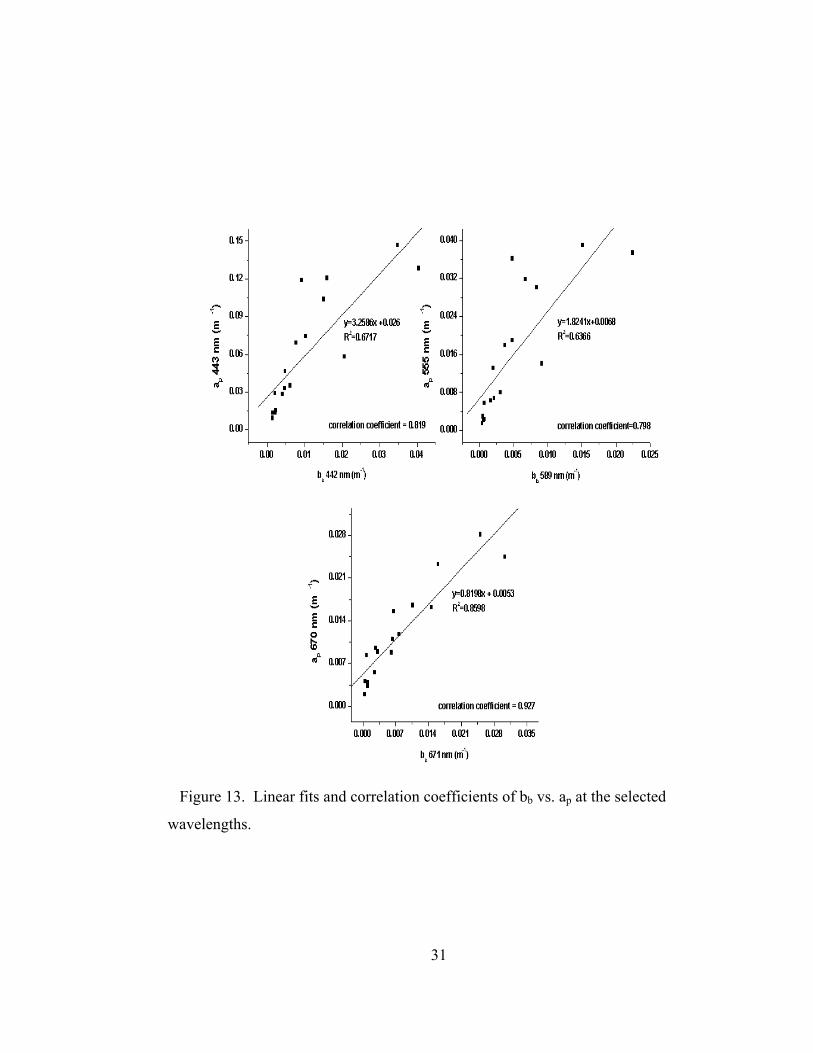
Figure 13. Linear fits and correlation coefficients of bb vs. ap at the selected
wavelengths.
31
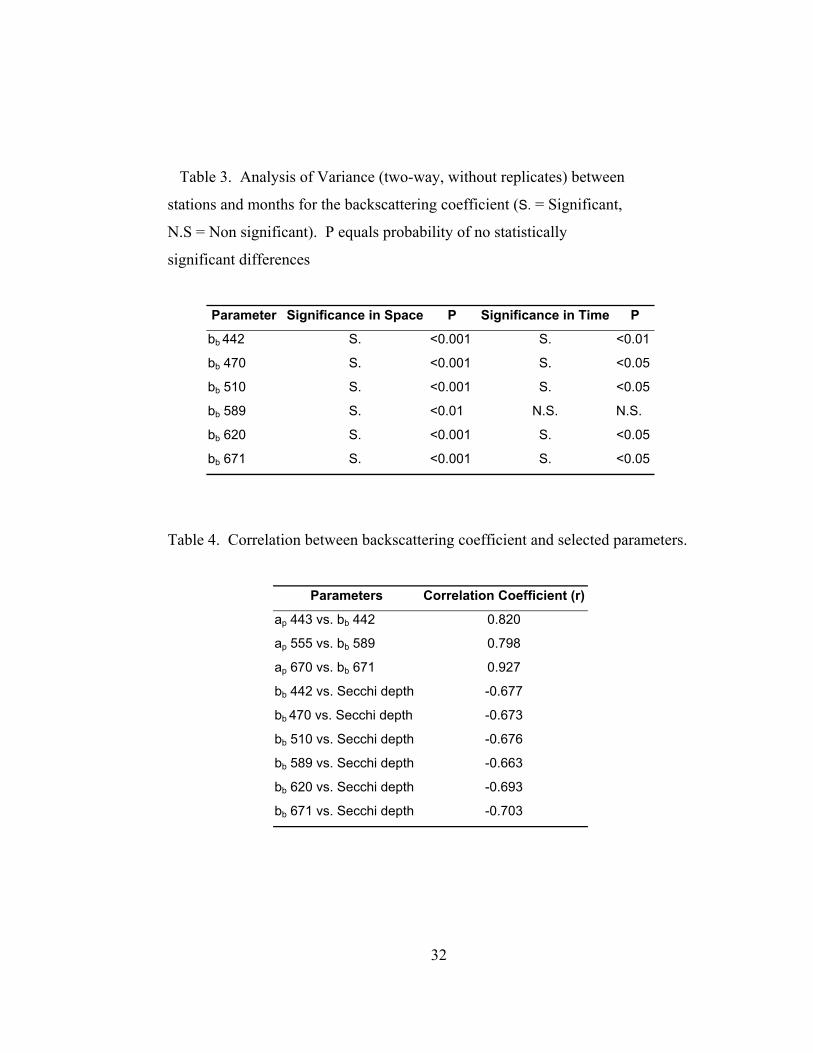
Table 3. Analysis of Variance (two-way, without replicates) between
stations and months for the backscattering coefficient (S. = Significant,
N.S = Non significant). P equals probability of no statistically
significant differences
Parameter Significance in Space P Significance in Time P
bb 442 S. <0.001 S. <0.01
bb 470 S. <0.001 S. <0.05
bb 510 S. <0.001 S. <0.05
bb 589 S. <0.01 N.S. N.S.
bb 620 S. <0.001 S. <0.05
bb 671 S. <0.001 S. <0.05
Table 4. Correlation between backscattering coefficient and selected parameters.
Parameters Correlation Coefficient (r)
ap 443 vs. bb 442 0.820
ap 555 vs. bb 589 0.798
ap 670 vs. bb 671 0.927
bb 442 vs. Secchi depth -0.677
bb 470 vs. Secchi depth -0.673
bb 510 vs. Secchi depth -0.676
bb 589 vs. Secchi depth -0.663
bb 620 vs. Secchi depth -0.693
bb 671 vs. Secchi depth -0.703
32
35
28
21
14
7
0
0.002 0.003 0.004 0.005 0.006 0.007
42
35
28
21
14
7
0
0.002 0.004 0.006 0.008
6
4
2
0
0.008 0.012 0.016 0.020
9
6
3
0
0.000 0.009 0.018 0.027 0.036
6
4
2
0
0.006 0.009 0.012 0.015 0.018
6
4
2
0
0.004 0.006 0.008
a)
bb (m-1)
Depth
(m)
b)
bb (m-1)
Depth
(m) bb442
bb470 bb510 bb589 bb620 bb671
c)
bb(m-1)
Depth
(m)
d)
bb (m-1)
Depth
(m)
e)
bb (m-1)
Depth
(m)
f)
bb (m-1)
Depth
(m)
Figure 14. Profiles of the backscattering coefficient for Oceánica(a), Manchas
(b), Atuneras (c), Añasco (d), Acueductos (e)and Rodríguez (f) in Mayagüez Bay
during July 98. The legend at the top right corner applies to all graphs.
33
for Añasco station, followed by Atuneras and Acueductos stations, and the lowest
values for Oceánica, Manchas and Rodriguez stations.
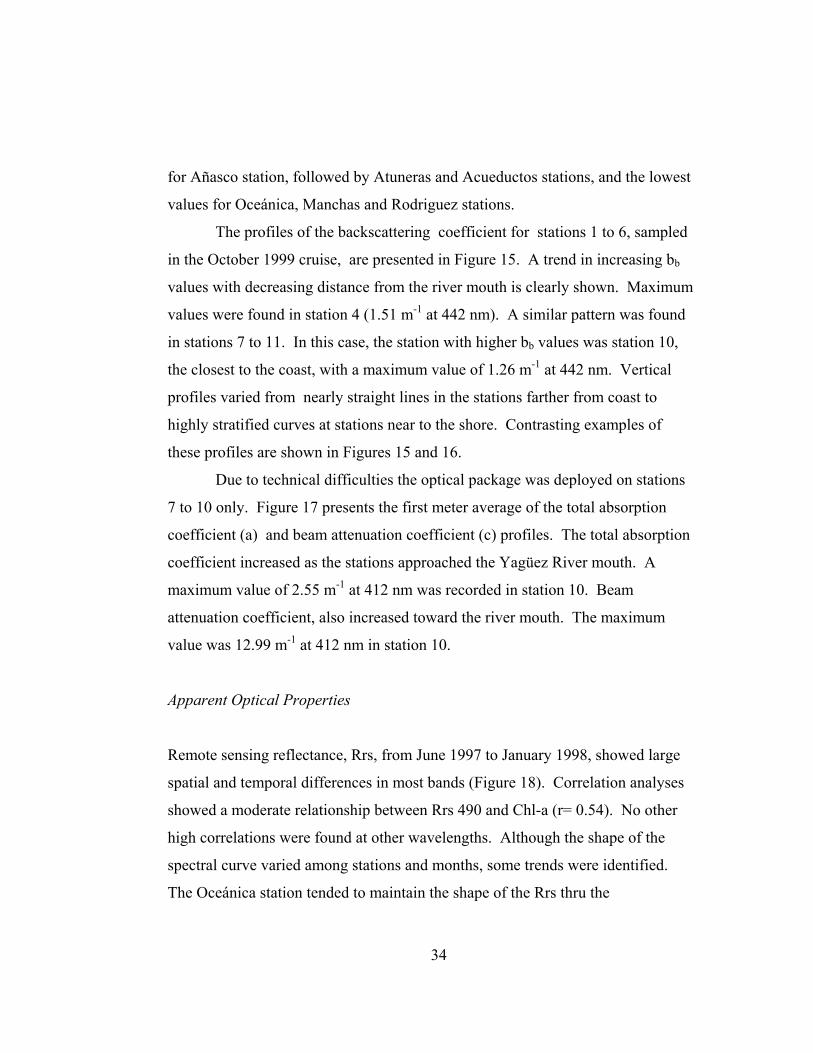
The profiles of the backscattering coefficient for stations 1 to 6, sampled
in the October 1999 cruise, are presented in Figure 15. A trend in increasing bb
values with decreasing distance from the river mouth is clearly shown. Maximum
values were found in station 4 (1.51 m-1 at 442 nm). A similar pattern was found
in stations 7 to 11. In this case, the station with higher bb values was station 10,
the closest to the coast, with a maximum value of 1.26 m-1 at 442 nm. Vertical
profiles varied from nearly straight lines in the stations farther from coast to
highly stratified curves at stations near to the shore. Contrasting examples of
these profiles are shown in Figures 15 and 16.
Due to technical difficulties the optical package was deployed on stations
7 to 10 only. Figure 17 presents the first meter average of the total absorption
coefficient (a) and beam attenuation coefficient (c) profiles. The total absorption
coefficient increased as the stations approached the Yagüez River mouth. A
maximum value of 2.55 m-1 at 412 nm was recorded in station 10. Beam
attenuation coefficient, also increased toward the river mouth. The maximum
value was 12.99 m-1 at 412 nm in station 10.
Apparent Optical Properties
Remote sensing reflectance, Rrs, from June 1997 to January 1998, showed large
spatial and temporal differences in most bands (Figure 18). Correlation analyses
showed a moderate relationship between Rrs 490 and Chl-a (r= 0.54). No other
high correlations were found at other wavelengths. Although the shape of the
spectral curve varied among stations and months, some trends were identified.
The Oceánica station tended to maintain the shape of the Rrs thru the
34
28
21
14
7
0
0.003 0.006 0.009 0.012
4.5
3.0
1.5
0.0
0.05 0.10 0.15 0.20 0.25
3.0
2.5
2.0
1.5
1.0
0.5
0.0
0.08 0.16 0.24 0.32 0.40 0.48
4.5
3.0
1.5
0.0
0.00 0.35 0.70 1.05
station 1
bb (m-1)
Dept
h (m
)
station 3
bb (m-1)
Dept
h (m
)
bb442 bb470 bb510 bb589 bb620 bb671
station 5
bb (m-1)
Dept
h (m
)
station 6
bb (m-1)
Dept
h (m
)
Figure 15. Profiles of the backscattering coefficient for selected stations in the
Guanajibo River cruise, October 1998. The legend at the top right corner applies
to all graphs.
35
80
60
40
20
0
0.003 0.006 0.009 0.012
8
6
4
2
0
0.0 0.1 0.2 0.3 0.4
3.5
2.8
2.1
1.4
0.7
0.0
0.0 0.3 0.6 0.9 1.2
8
6
4
2
0
0.2 0.4 0.6 0.8
station 7
bb (m-1)
Dept
h (m)
station 9
bb (m-1)
Dept
h (m)
bb442 bb470 bb510 bb589 bb620 bb671
station 10
bb (m-1)
Dept
h (m)
station 11
bb (m-1)
Dept
h (m)
Figure 16. Selected backscattering profiles from the Yagüez River transect
during October 1998. The legend at the top right corner applies to all graphs.
36
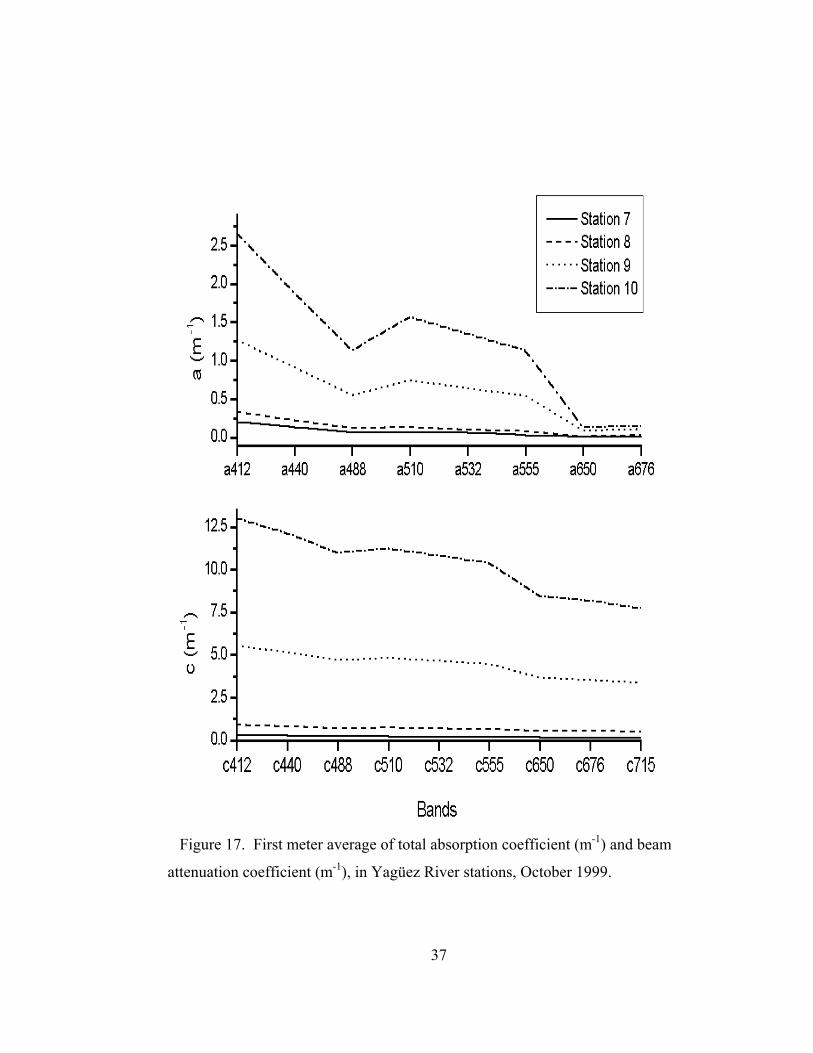
Figure 17. First meter average of total absorption coefficient (m-1) and beam
attenuation coefficient (m-1), in Yagüez River stations, October 1999.
37
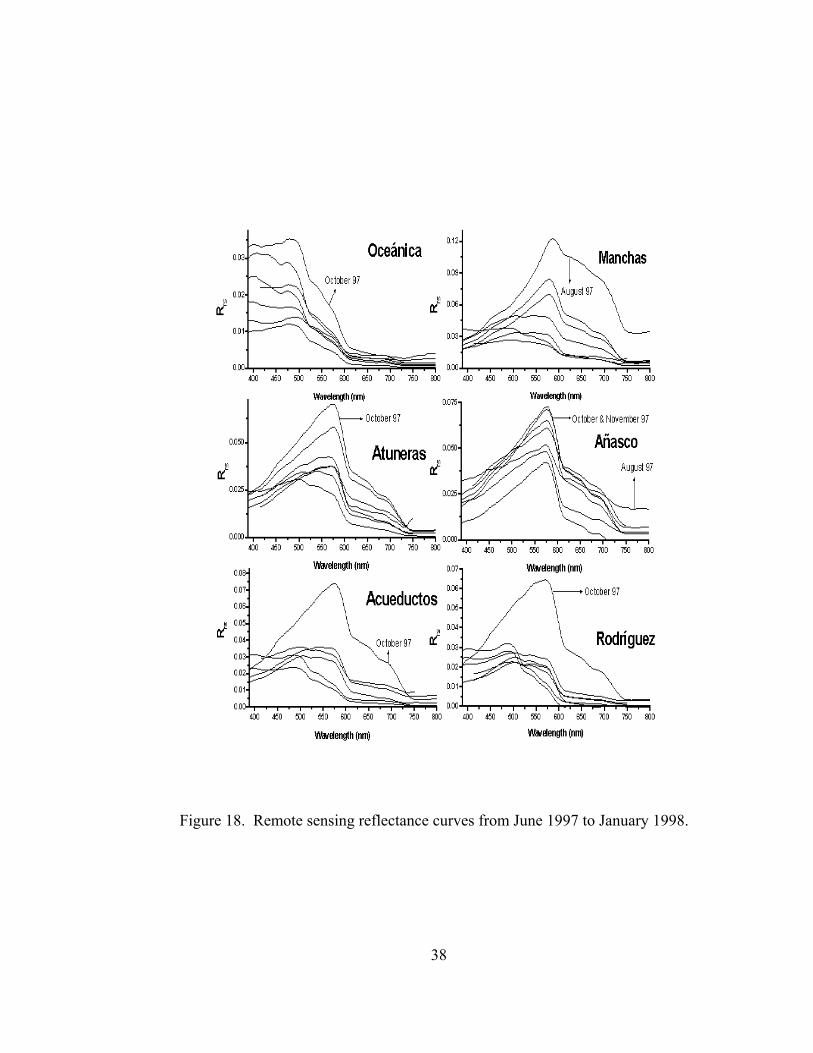
Figure 18. Remote sensing reflectance curves from June 1997 to January 1998.
38
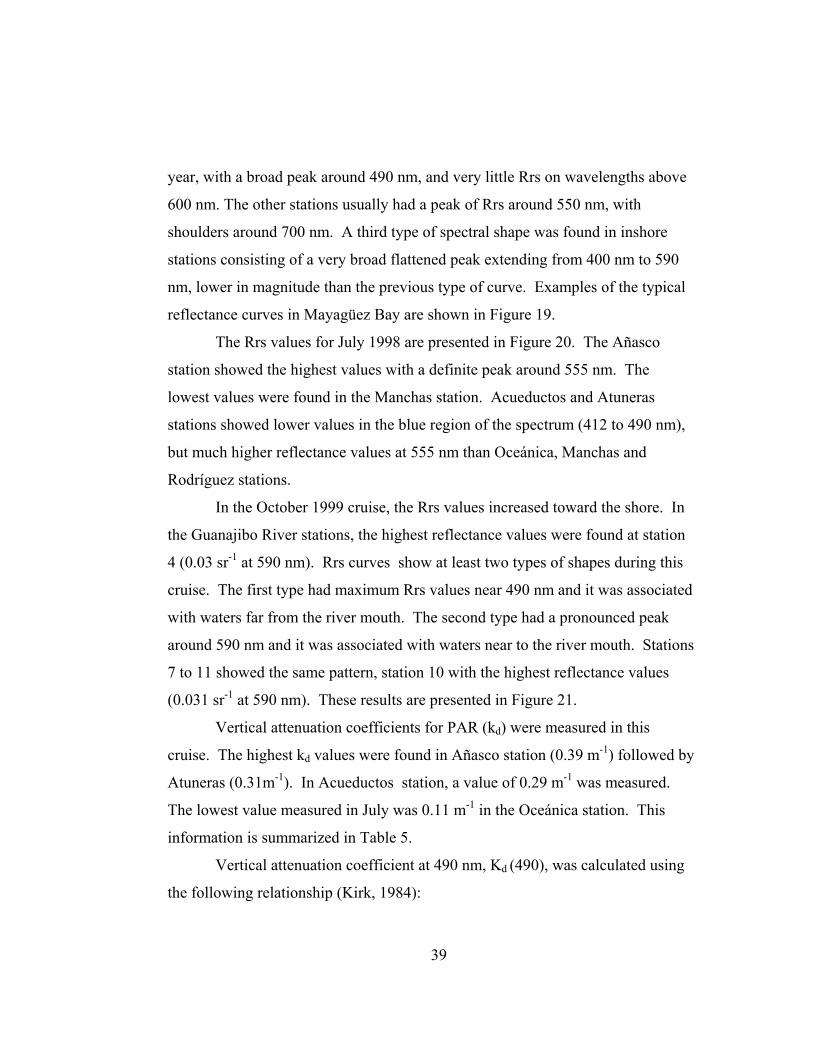
year, with a broad peak around 490 nm, and very little Rrs on wavelengths above
600 nm. The other stations usually had a peak of Rrs around 550 nm, with
shoulders around 700 nm. A third type of spectral shape was found in inshore
stations consisting of a very broad flattened peak extending from 400 nm to 590
nm, lower in magnitude than the previous type of curve. Examples of the typical
reflectance curves in Mayagüez Bay are shown in Figure 19.
The Rrs values for July 1998 are presented in Figure 20. The Añasco
station showed the highest values with a definite peak around 555 nm. The
lowest values were found in the Manchas station. Acueductos and Atuneras
stations showed lower values in the blue region of the spectrum (412 to 490 nm),
but much higher reflectance values at 555 nm than Oceánica, Manchas and
Rodríguez stations.
In the October 1999 cruise, the Rrs values increased toward the shore. In
the Guanajibo River stations, the highest reflectance values were found at station
4 (0.03 sr-1 at 590 nm). Rrs curves show at least two types of shapes during this
cruise. The first type had maximum Rrs values near 490 nm and it was associated
with waters far from the river mouth. The second type had a pronounced peak
around 590 nm and it was associated with waters near to the river mouth. Stations
7 to 11 showed the same pattern, station 10 with the highest reflectance values
(0.031 sr-1 at 590 nm). These results are presented in Figure 21.
Vertical attenuation coefficients for PAR (kd) were measured in this
cruise. The highest kd values were found in Añasco station (0.39 m-1) followed by
Atuneras (0.31m-1). In Acueductos station, a value of 0.29 m-1 was measured.
The lowest value measured in July was 0.11 m-1 in the Oceánica station. This
information is summarized in Table 5.
Vertical attenuation coefficient at 490 nm, Kd (490), was calculated using
the following relationship (Kirk, 1984):
39
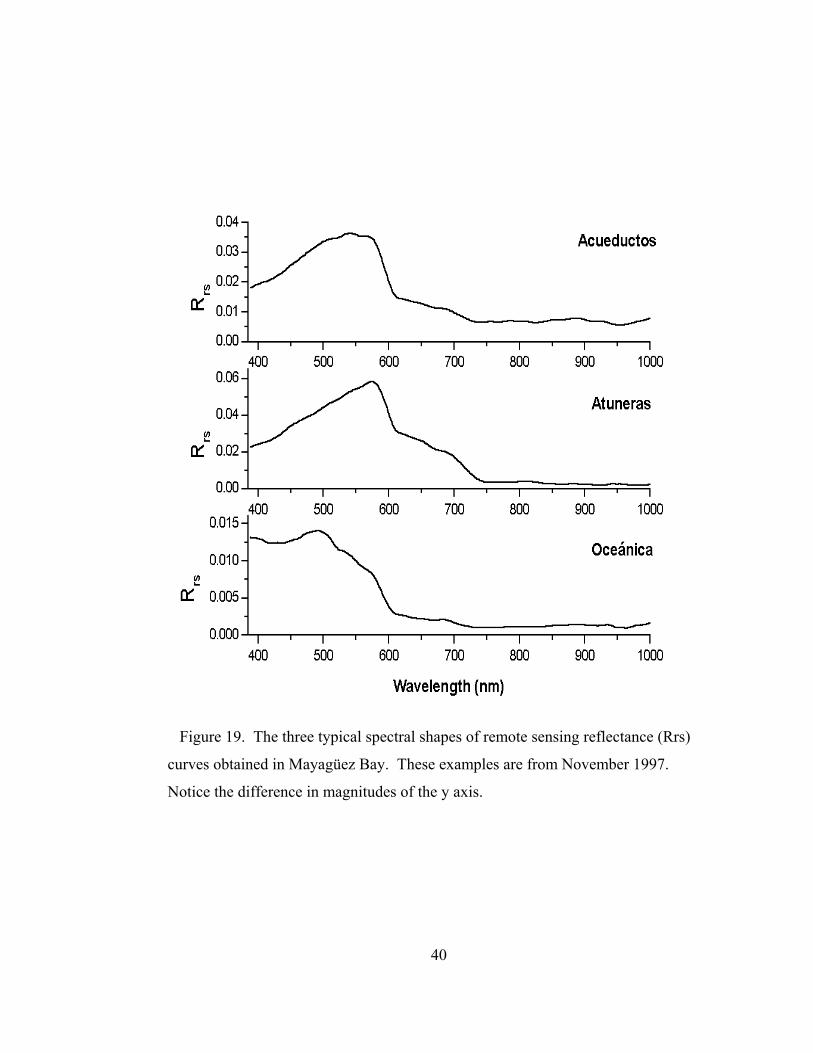
Figure 19. The three typical spectral shapes of remote sensing reflectance (Rrs)
curves obtained in Mayagüez Bay. These examples are from November 1997.
Notice the difference in magnitudes of the y axis.
40
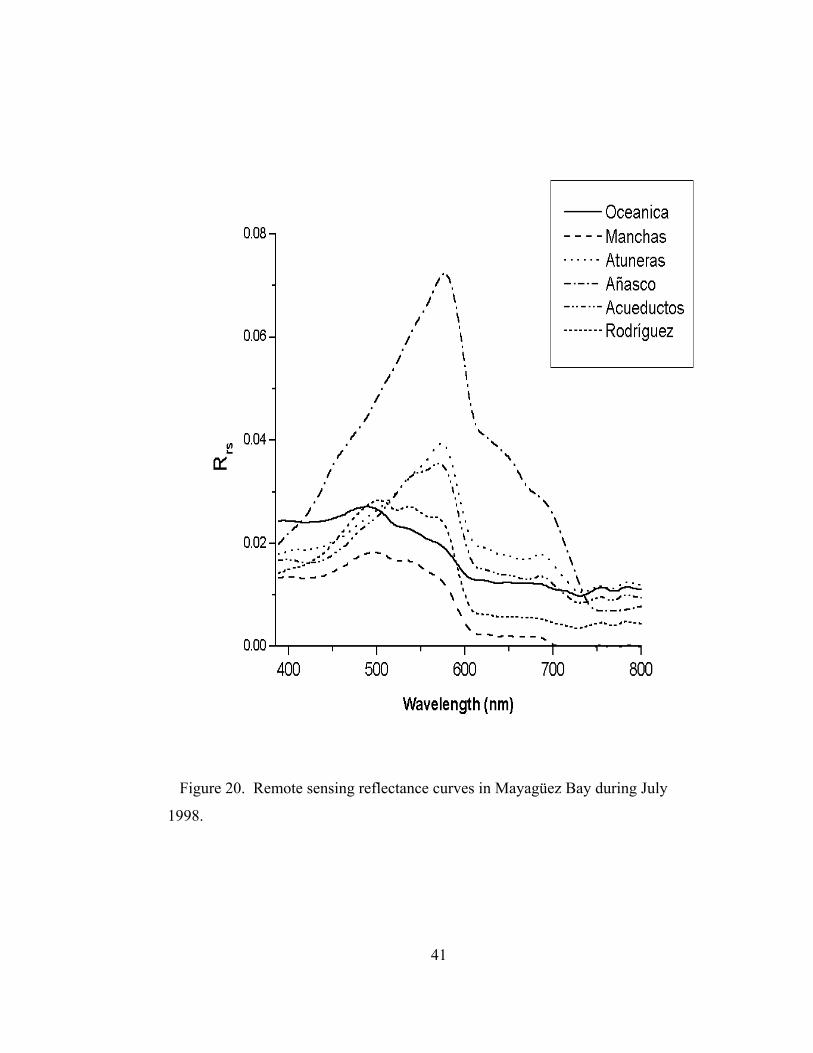
Figure 20. Remote sensing reflectance curves in Mayagüez Bay during July
1998.
41
Figure 21. Remote sensing reflectance curves for the Guanajibo River stations
(stations 1-6), and the Yagüez River stations (stations 7-11) during October 1999.
42
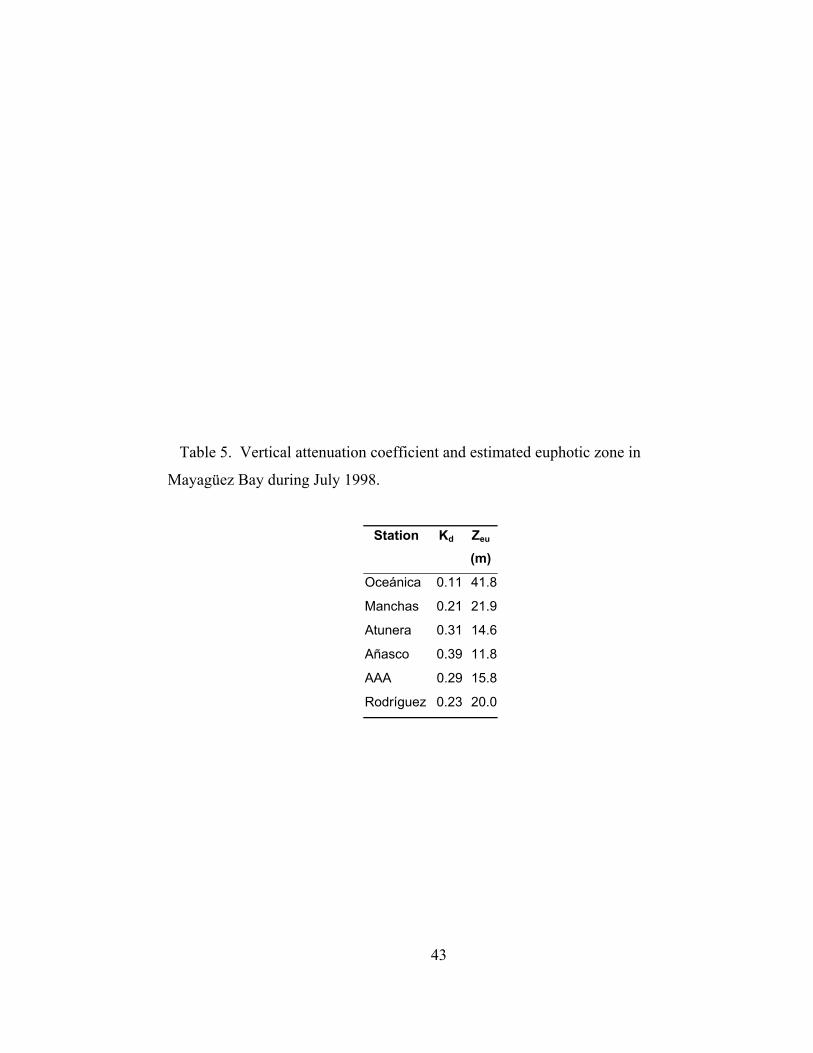
Table 5. Vertical attenuation coefficient and estimated euphotic zone in
Mayagüez Bay during July 1998.
Station
Kd
Zeu (m)
Oceánica 0.11 41.8
Manchas 0.21 21.9
Atunera 0.31 14.6
Añasco 0.39 11.8
AAA 0.29 15.8
Rodríguez 0.23 20.0
43
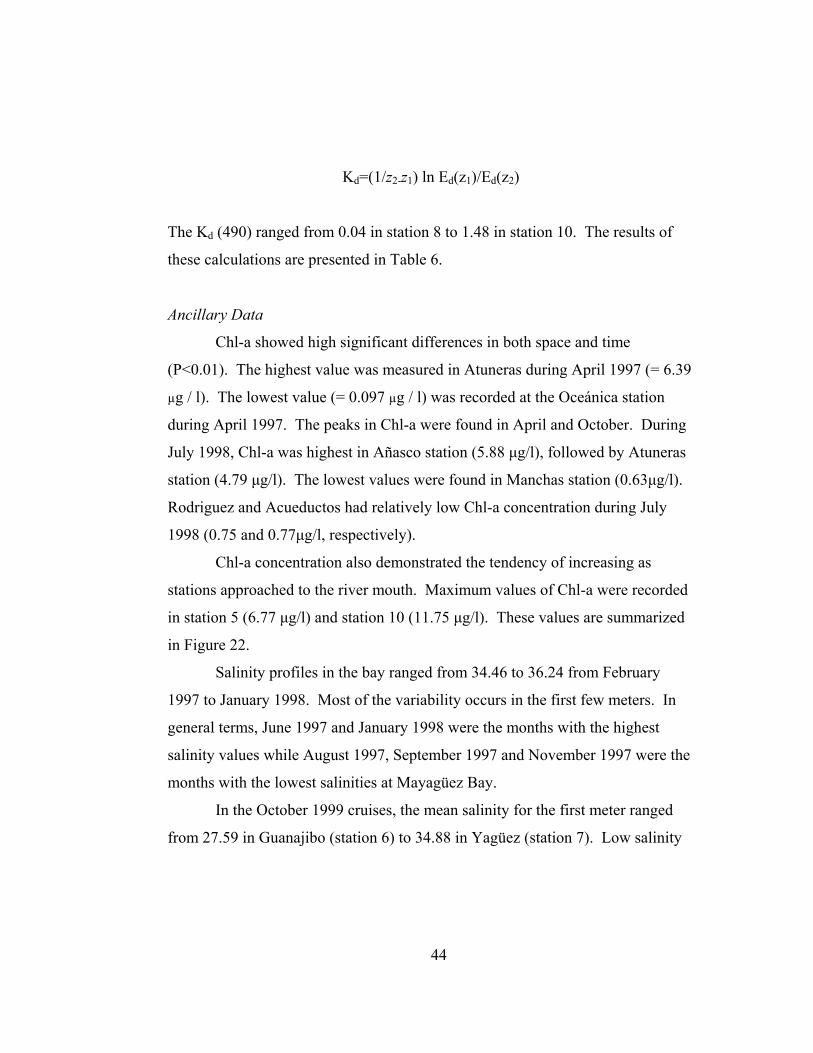
Kd=(1/z2-z1) ln Ed(z1)/Ed(z2)
The Kd (490) ranged from 0.04 in station 8 to 1.48 in station 10. The results of
these calculations are presented in Table 6.
Ancillary Data
Chl-a showed high significant differences in both space and time
(P<0.01). The highest value was measured in Atuneras during April 1997 (= 6.39
µg / l). The lowest value (= 0.097 µg / l) was recorded at the Oceánica station
during April 1997. The peaks in Chl-a were found in April and October. During
July 1998, Chl-a was highest in Añasco station (5.88 µg/l), followed by Atuneras
station (4.79 µg/l). The lowest values were found in Manchas station (0.63µg/l).
Rodriguez and Acueductos had relatively low Chl-a concentration during July
1998 (0.75 and 0.77µg/l, respectively).
Chl-a concentration also demonstrated the tendency of increasing as
stations approached to the river mouth. Maximum values of Chl-a were recorded
in station 5 (6.77 µg/l) and station 10 (11.75 µg/l). These values are summarized
in Figure 22.
Salinity profiles in the bay ranged from 34.46 to 36.24 from February
1997 to January 1998. Most of the variability occurs in the first few meters. In
general terms, June 1997 and January 1998 were the months with the highest
salinity values while August 1997, September 1997 and November 1997 were the
months with the lowest salinities at Mayagüez Bay.
In the October 1999 cruises, the mean salinity for the first meter ranged
from 27.59 in Guanajibo (station 6) to 34.88 in Yagüez (station 7). Low salinity
44
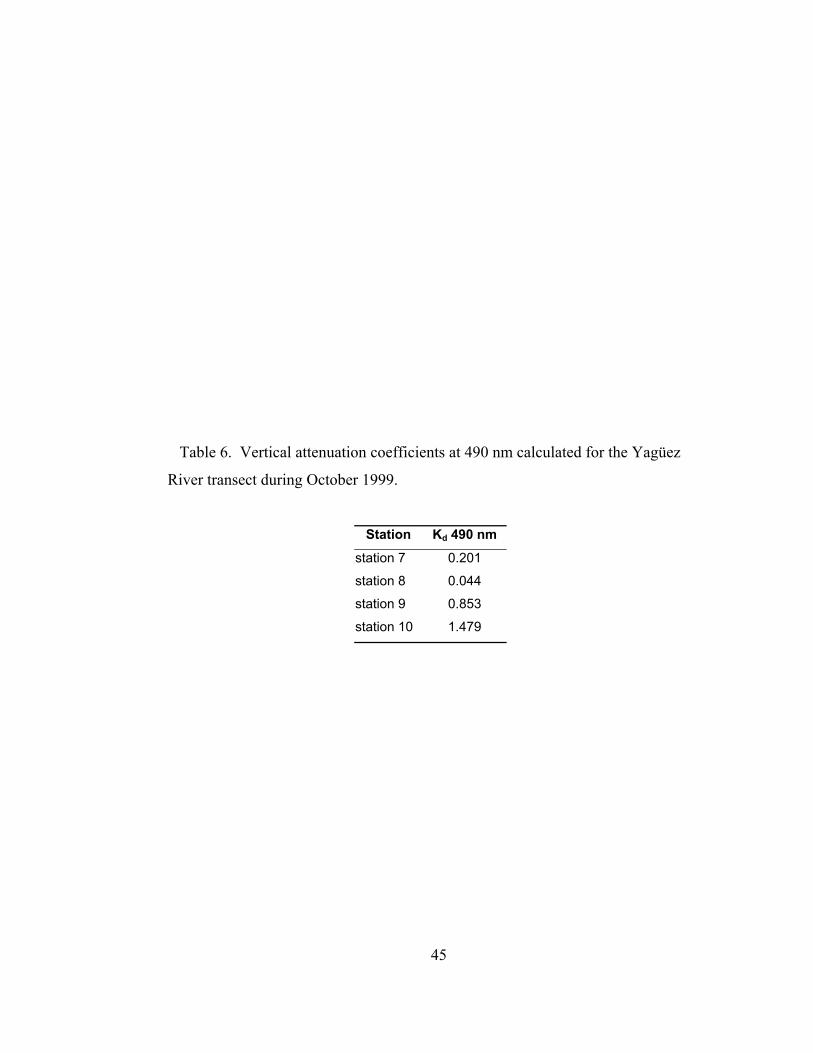
Table 6. Vertical attenuation coefficients at 490 nm calculated for the Yagüez
River transect during October 1999.
Station Kd 490 nm station 7 0.201
station 8 0.044
station 9 0.853
station 10 1.479
45
Figure 22. Chl-a concentrations and salinities at surface in Mayagüez Bay during
the October 1999 cruise.
46

values were found in the stations closer to the Yagüez River but only at station 6
in the Guanajibo River. These results are presented in Figure 22.
From February 1997 to January 1998, Añasco River had a major discharge
peak in October 1997 (13.55 m3/s) and a smaller peak in August 1997 (9.85 m3/s).
The smallest discharge at Añasco River was measured in April (2.21 m3/s).
During that same period, Guanajibo River had its greater discharge in October
1997 (13.85 m3/s), with a second peak occurring in August 1997 (3.90 m3/s). The
lowest discharge recorded in Guanajibo River during this study was 0.71 m3/s in
May 1997. In July 1998, Añasco River had a mean discharge of 3.07 m3/s and
Guanajibo River had a mean discharge of 1.36 m3/s. These river discharge values
are the average of the daily discharge for three days before the sampling. Figure
23 compares river discharge with salinity and Chl-a concentration in all stations
from February 1997 to January 1998.
Suspended particulate matter (SPM) also increased as the sampling
stations came closer to the river mouths. Maximum values were recorded in
station 4 (27.6mg/l) and station 10 (18.5 mg/l). These results are presented in
Figure 24.
Añasco River discharge and Chl-a presented a positive correlation for
Manchas station (r = 0.69, n = 11) and Rodríguez station (r = 0.74, n = 11). The
other stations showed very low correlation between Chl-a and Añasco River
discharge (r < 0.10). Correlations between Añasco River discharge and Secchi
disk measurements were also low (r < -0.50).
The correlation coefficients between Guanajibo River discharge and Chl-a
were high for Manchas station (r = 0.76, n = 11) and Rodríguez station (r = 0.75,
n = 12). The other stations showed low correlations (r < 0.41). Correlations
between Guanajibo River discharge and Secchi depth showed a negative
47

Figure 23. River discharge, salinity and Chl-a measured in Mayagüez Bay
from February 1997 to January 1998.
48

Figure 24. Suspended particulate matter (SPM) at surface in Mayagüez Bay
during October 1999.
49

relationship with the largest coefficients in the Oceánica station (r = -0.60, n = 12)
and Rodríguez station (r = -0.60, n= 12).
50

DISCUSSION
Mayagüez Bay is a complex bio-optical system. The synergistic effect of
rivers, industrial effluents, and coastal geomorphology creates a variety of optical
provinces in a relatively small geographical area.
Absorption in the inner part of the bay is dominated by two components;
detritus and CDOM. Detritus is responsible for about half of the particulate
absorption in the samples from Añasco, Atuneras and Acueductos stations (Figure
25). This suggests that these three stations receive high freshwater inputs
throughout the year. In Rodríguez and Oceánica stations, absorption is
dominated by phytoplankton in the dry season and by detritus in the rainy season.
These findings suggest that during the rainy season freshwater mixes throughout
Mayagüez Bay, affecting the optical properties even in the stations farthest from
the coast. Unfortunately, no CDOM measurements were taken from February 97
to January 98. In July 98, CDOM dominated absorption, being higher than
particulate absorption in all stations. July 98 was an average month in terms of
river discharge, with the Añasco River discharging 3.07 m3 s-1 and the Guanajibo
River discharging 1.36 m3 s-1, respectively. Since this was a dry month with
average discharge, it is expected that CDOM values are considerably higher
during the rainy season. These high absorptions of CDOM and detritus suggest
that light is been absorbed very effectively in the blue end of the spectrum. As
consequence, this filtering of blue wavelengths may stimulate phytoplankton to
alter their pigment compositions in order to capture light at other wavelengths and
possibly increase their Chl-a content (Kirk, 1994). This can be observed in the aph
peaks around 550 and 650 nm (Figure 6). Another possible effect is the
occurrence of seasonal successions of phytoplankton species in response to the
varying light quality. In the October 99 cruise, it was evident that absorption
51

Figure 25. Comparison of particulate absorption coefficient, detritus absorption
coefficient and phytoplankton absorption coefficient at 443 nm. Note the
proportion of particulate absorption due to detritus.
52
increased toward the river mouth. This absorption was also dominated by
CDOM, and detritus. October is the peak of river discharge in Mayagüez Bay.
Therefore, in these highly light attenuating conditions, phytoplankton may be
limited by light instead of nutrients. Notice that absorption by phytoplankton is
about one order of magnitude less than particulate absorption and two orders
magnitude less than CDOM absorption.
Backscattering profiles show a highly stratified distribution of particles
(Figure 14). These features may be associated to sediment resuspension caused
by wind or by internal waves reflected into Mayagüez Bay. This is specially
feasible during the dry season, when there is not a significant input of river
transported sediment into the bay, but still the particulate absorption and
backscattering coefficients are high. Backscattering was very high in Atuneras,
Añasco and Acueductos stations. These stations also showed the highest
particulate absorption values during the course of this study. The fact that ap and
bb are well correlated in Mayagüez Bay, suggests that a common factor regulates
these parameters in the bay. Inanimate particle concentration could be this factor.
This is supported if we consider the nature of the optical components in the bay.
Particulate absorption in the bay is composed mostly by inanimate matter (as we
discussed earlier) and phytoplankton absorption is usually low. Inanimate matter
at typical concentrations does not absorb light strongly but scatters quite intensely
(Kirk, 1994). At the high concentrations encountered in Mayagüez Bay,
inanimate particulate matter may be very important in the absorption and
scattering processes.
The remote sensing reflectance signal throws in additional evidence on the optical
properties of Mayagüez Bay. Water absorbs light strongly at 750 nm, yet
reflectance was far from zero at this wavelength in all stations except Oceánica
(Figure 18). This was more pronounced during rainy months such as August,
53
November and October. This high reflectance in the red (λ>670 nm) is consistent
with the red clay minerals washed down by local rivers. From the reflectance
data we can also infer that the two stations with the higher concentration of blue
absorbing components (CDOM and detritus) are Atuneras and Añasco (Figure
18). The rest of the stations only showed low reflectance in the blue during the
peak of the rainy season, except Oceánica that was offshore and received the
lowest impact from river run-off. It is also evident in some stations the Rrs peaks
at 550 nm. These peaks are associated with high concentrations of Chl-a and are
characteristic of Atuneras and Añasco stations, although in the peak of the rainy
season all inshore stations showed a similar low blue, high green reflectance
curve. Although these stations had higher values of absorption and
backscattering (hence attenuation), they also had the highest values of Chl-a
(Figure 23). In the October 1999 cruise, it was clearly shown that the magnitude
of Rrs curve increased and the spectral shape transformed from a featureless curve
from 350 to 600 nm to a low reflectance in the blue and a very high peak in 550
nm as the salinity (distance to the river mouth) decreased (Figure 21). This may
be explained by an increase in CDOM and detritus, increasing absorption in the
blue region, and an increase in nutrients, fertilizing the phytoplankton. These
results are in agreement with the findings of Gilbes et al. (1996).
Chl-a concentrations measured at Mayagüez Bay are within those
measured in other bays. Webb and Gómez (1998) reported Chl-a concentrations
averaging 2 µg/L) in San Juan Bay. Gilbes et al. (1996) measured Chl-a
concentrations up to 2.4 µg/L in the Añasco River mouth. Chl-a peaks in October
can be explained as the result of a peak in the river discharge during the rainy
season (Figure 23). This explanation is supported by the findings of Gilbes et al.
(1996). The Chl-a peak of April is more difficult to justify. The weak correlation
between Chl-a and river discharge suggest that other factors besides river
54

discharge may play a role in the phytoplankton dynamics of Mayagüez Bay.
These factors may include anthropogenic activities, wind driven sediment
resuspension and internal waves.
In Mayagüez Bay, seasonal river discharge appears to be the principal factor
regulating the bio-optical properties and hence the phytoplankton populations.
Anthropogenic activities in the river basins alters the composition of the rivers
input in the bay and therefore the characteristics of the water masses entering the
bay (Kirk, 1994). The western basin of Puerto Rico is highly developed and
deforested, which favors erosion and transference of soil particles into the river
waters. These suspended particles increase scattering and absorption, effectively
attenuating light, but also increase nutrient concentrations (Gilbes et al. 1996).
Resuspension of sediments by wind and waves seems to be specially important in
the dry season, from February to April (Alfonso, 1995, Gilbes et al., 1996).
Another possibility is the intrusion of internal waves into Mayagüez Bay,
suspending sediments deposited earlier within the coastal zone (Edwin Alfonso,
personal communication, Bogucki and Redekopp, 1999). At smaller spatial
scales, the anthropogenic effects of the tuna industry and sewage processing
plants may be important. Nutrients in the vicinity of the Atuneras and
Acueductos station were high, specially organic nitrogen (Mónica Alfaro,
unpublished data). Phytoplankton populations may be responding to increased
nutrient supply at these stations. Increased predation of zooplankton by
gelatinous plankton (medusae and ctenophores) may be another mechanism
accounting for larger phytoplankton biomass in these stations. Large populations
of these organisms has been reported in Acueductos and Atuneras station (Mónica
Alfaro, unpublished data). This predation regulate abundance of zooplankton
populations, resulting in lower grazing pressure over phytoplankton.
55

The high range of variability found in bio-optical properties in Mayagüez
Bay point out the necessity of developing algorithms capable of discerning Chl-a
signature from other components of the coastal aquatic environment. The
complex processes occurring in the bay need to be studied in more detail in order
to formulate functional relationships between Rrs and Chl-a.
56

CONCLUSION
Mayagüez Bay is a highly dynamic environment from a bio-optical
perspective. Spatial and temporal variability is very high in the bay. Bio-optics
appear to be largely determined by river input, but anthropogenic factors may
play a role at a smaller spatial scale. There is probably a synergistic effect in those
stations closer to the anthropogenic influence. Other oceanographic processes
may be important defining the bio-optical characteristics of the bay but river input
is probably the single most important factor. Specific conclusions drawn from this
work are:
1. Bio-optical properties are highly variable in Mayagüez Bay and are related
to river discharge.
2. There are high correlations between absorption and backscattering in the
bay, but no clear pattern of correlations were found. This is probably the
result of the bio-optical complexity of the bay.
3. Although some data may suggest the possibility of light limitation of
phytoplankton communities in the bay, there is no clear evidence in this
study. This subject needs more research.
Future studies should take into account vertical variability in optical properties
and what effects, if any, it has on the values observed at surface. It is also
recommended to study taxonomical composition of phytoplankton assemblages in
the bay and perform photosynthetic efficiency and primary production studies.
Other studies that may provide essential data and should be considered in the
future are photosynthetic pigment analysis using the HPLC method and nutrients
analysis.
57
REFERENCES
Ackleson S. G., 1998. Variability in the inherent optical properties of ocean waters around Lee Stocking Island, Bahamas. Ocean Optics XIV, Kailua-Kona, Hawaii. Alfonso E., 1995. The coastal current regime in Añasco Bay during a one year period. Master of Science Thesis. UPRM. Department of Marine Sciences. Banse, K., and English D. C. 1994. Seasonality of coastal zone color scanner phytoplankton pigment in the offshore oceans. J. of Geophysical Research, 99(C4): 7323-7345. Bogucki, D. J., and. Redekopp L. A 1999. A mechanism for sediment resuspension by internal solitary waves. Geophysical Research Letters 26(9): 1317-1320. Bricaud, A., Morel A. and Prieur L. 1981. Absorption by dissolved organic matter of the sea (yellow substance) in UV and visible domains. Limnol. Oceanogr. 26: 43-53. Bricaud, A. and Stramski, D. 1990. Spectral absorption coefficients of living phytoplankton and nonalgal biogenous matter: A comparison between the Peru upwelling and the Sargasso Sea. Limnol. Oceanogr., 35(3): 562-582.
Carder, K. L., Steward, R. G., Harvey, G. R., & Ortner, P. B. (1989). Marine humic and fulvic acids: Their effects on remote sensing of ocean chlorophyll. Limnol. Oceanogr., 34: 68-81.
Del Castillo C. E., Coble P. G., Morell J. M., López J. M. and J. E. Corredor. 1999. Análisis of the optical properties of the Orinoco River Plume by absorption and fluorescence spectroscopy. Marine Chemistry, 66: 35-51. Denny M. W. 1993. Air and Water, The biology and physic's of life's media, Princeton University Press, Princeton, New Jersey 341 pp. D’Sa E. J., Steward R. G., Vodacek A., Blough, N. V. and Phiney D. 1999. Determining optical absorption of colored dissolved organic matter in seawater with a liquid capillary waveguide. Limnol. Oceanogr., 44(4): 1142-1148.
58
Eppley, R. W. 1977. The growth and culture of diatoms, in the biology of diatoms, Werner, D., Ed., Blackwell Scientific, Oxford. Figueiras, F. G., and Arbones B. 1999. Implications of bio-optical modeling of phytoplankton photosynthesis in Antarctic waters: Further evidence of no light limitation in the Bransfield Strait. Limnol. Oceanogr., 44(7): 1599-1608. García, C. A., V. M. García, A. S. González and Omachi C. Y. 1998. Bio-optical characteristics of southern Brazilian waters. Ocean Optics XIV, Kailua-Kona, Hawaii. Garrison, D. L. 1984. Planktonic Diatoms, in Marine Plankton Life Cycle Strategies, Steidinger, K. A. and Walker L. M., Eds., CRC Press, Boca Raton, Florida. Gilbes, F., López, J. M. and Yoshioka P. 1996. Spatial and temporal variations of phytoplankton chlorophyll a and suspended particulate matter in Mayagüez Bay, Puerto Rico. J. of Plankton Res. 18: 29-43. Gordon, H. R., Clark D. K., Brown J. W., Brown O. B., Evans R. H., and Broenkow W. W. 1983. Phytoplankton pigment concentrations in the Middle Atlantic Bight: comparisons of ship determinations and CZCS estimates. Applied Optics, 22(1): 20-36. Gordon, H. R. and Morel, A. Y. 1983. Remote assessment of ocean colour for interpretation of satellite imagery. A review. Springer, New York. Grove, K., 1977. Sedimentation in Añasco Bay and river estuary: Western Puerto Rico. Master of Science Thesis. UPRM. Department of Marine Sciences. Kirk, J. T. O. 1994. Light and Photosynthesis in Aquatic Ecosystems. Cambridge University Press, Cambridge. Levinton, J. S. 1982. Marine Ecology. Prentice-Hall, New York. Li, Y. and T. J. Smayda. 1998. Temporal variability of chlorophyll in Narrangansett Bay, 1973-1990. ICES Journal of Marine Science, 55: 562-573
59

Longhurst, A.R., and Pauly D. 1987. Ecology of the tropical oceans. Academic Press Inc. San Diego. 407 pp. Kishino, M., Okami N. and Ichimura S. 1985 Estimation of the spectral absorption coefficients of phytoplankton in the sea. Bull. Mar Sci. 37: 634-642. Mitchell, B. G. and Kiefer, D. A. 1984. Determination of absorption and fluorescence excitation spectra of phytoplankton. In: Marine phytoplankton and productivity. Holm-Halsen, O., Bolis L., Giles R. (Ed.) Springer-Verlag, Berlin. 157-169 pp. Morel, A. 1987. Chorophyll-specific scattering coefficient of phytoplankton. A simplified theoretical approach. Deep-Sea Res. 34: 1093-1105. Morelock, J., Grove, K., and Hernández, M. L. 1983. Oceanography and patterns of shelf sediments in Mayagüez, Puerto Rico. J. Sed. Petrol. 53: 371-381 Nybakken, J. W. 1993. Marine Biology An ecological approach. Harper Collins, New York. 462 pp. Platt, T. [ED.] 1981. Physiological bases of phytoplankton ecology. Can. Bull. Aquat. Sci. 210: 346p.
R. M. Pope and Fry, E. S.. 1997. Absorption spectrum (380-700 nm) of pure water. II. Integrating cavity measurements. Appl. Opt.,36: 8710-8723
Raymont, J. E. G. 1980. Plankton and productivity in the oceans, 2ed. Vol. 1 Pergamon Press, Oxford. Smayda, T.J. 1970. The suspension and sinking of phytoplankton in the sea, Oceanogr. Mar. Biol. Ann. Rev., 8(853). Steidinger , K.A. and Walker, L.M. 1984. Introduction, in Marine plankton life cycle strategies, Steidinger , K.A. and Walker, L.M., Eds., CRC Press, Boca Raton, Florida Sumich, J.L. 1984. Biology of Marine Life Wm. C. Brown Publishers, Dubuque, Iowa 386 PP.
60
Thurman, H.V. and Webber, H.H. 1984. Marine Biology, Charles E. Merill, Columbus, Ohio Walker, L. M. 1984. Life histories, dispersal and survival in marine, planktonic dinoflagellates, in Marine plankton life cycle strategies, Steidinger , K.A. and Walker, L.M., Eds., CRC Press, Boca Raton, Florida Webb, R. M. T. and Gómez F. 1998. Synoptic survey of water quality and bottom sediments, San Juan Bay Estuary System, Puerto Rico, December 1994-July 1995. U.S. Geological Survey, Water-Resources Investigations Report 97-4144 Weidemann, A. D. and Bannister, T. T. 1986. Absorption and scattering coefficients in Irondequoit Bay. Limnol. Oceanogr., 31(3): 567-583.
Welschmeyer, N. A. 1994. Fluorometric analysis of chlorophyll a in the presence of chlorophyll b and pheopigments. Limnol. Oceanogr. 39(8): 1985-1992.
61