
Bio-optical properties in waters influenced by the...
12
Bio-optical properties in waters influenced by the Mississippi River during low flow conditions Eurico J. D’Sa a, * , Richard L. Miller b a GB Tech, NASA Earth Science Applications Directorate, Stennis Space Center, MS 39529, USA b NASA Earth Science Applications Directorate, Stennis Space Center, MS 39529, USA Received 15 July 2002; received in revised form 26 September 2002; accepted 26 September 2002 Abstract Spatial and temporal patterns of bio-optical properties were studied in the Northern Gulf of Mexico during cruises in April and October of 2000, a year during which the discharge volume from the Mississippi River was unusually low. Highly variable surface Chl a concentrations (0.1 to 17 mg m 3 ) and colored dissolved organic matter (CDOM) absorption (0.07 to 1.1 m 1 at 412 nm) were observed in the study region that generally decreased with increasing salinity waters, being highest nearshore and decreasing at offshore stations. The optical properties of absorption, scattering, and diffuse attenuation coefficients reflected these distributions with phytoplankton particles and CDOM contributing to most of the spatial, vertical, and seasonal variability. The diffuse attenuation coefficient K d (k) and spectral remote sensing reflectance R rs (k) were linear functions of absorption and backscattering coefficients a(k) and b b (k) through the downward average cosine l d and the ratio of variables f/Q at the SeaWiFS wavebands for waters with widely varying bio-optical conditions. Although various R rs (k) ratio combinations showed high correlation with surface Chl a concentrations and CDOM absorption at 412 nm, power law equations derived using the R rs (490)/R rs (555) and R rs (510)/R rs (555) ratios provided the best retrievals of Chl a concentrations and CDOM absorption from SeaWiFS reflectance data. D 2002 Elsevier Science Inc. All rights reserved. Keywords: Bio-optical properties; Mississippi River; SeaWiFS; Chlorophyll; CDOM 1. Introduction The Mississippi River system ranks among the top 10 rivers in length, freshwater discharge, and sediment delivery (Milliman & Meade, 1983) and thus exerts a strong influ- ence on the biological, chemical, and physical properties of the Northern Gulf of Mexico (Del Castillo et al., 2001; Muller-Karger, Walsh, Evans, & Meyers, 1991). A season- ally varying discharge of fresh water and nutrients from the Mississippi River influences the spatial and temporal dis- tribution of carbon fluxes and primary productivity in the Northern Gulf of Mexico (Dinnel & Wiseman, 1986; Lohrenz et al., 1999; Rabalais et al., 1996; Redalje, Loh- renz, & Fahnenstiel, 1994). Recent outbreaks of hypoxia over large areas of Louisiana and Texas coastal waters have been attributed to high levels of primary productivity in surface plume waters that are sustained by nutrients from the Mississippi River (Rabalais & Turner, 2001). While satellite remote sensing provides the potential to describe and monitor the variability of bio-optical properties (e.g., phy- toplankton biomass) and the oceanic carbon fluxes, there is still a need to evaluate currently used or to develop regional ocean color algorithms for coastal regions as those influ- enced by the Mississippi River. Ocean color algorithms developed to estimate biological variables such as Chl a have been used in both case I and case II waters (O’Reilly et al., 1998) and are based on the premise that other in-water constituents such as colored dissolved organic matter (CDOM) and detrital material co- vary with Chl a, the primary pigment used to represent phytoplankton concentrations. However, the ability of these algorithms to accurately estimate bio-optical variables in coastal waters is not very clear as in-water constituents such as CDOM and suspended sediments may not co-vary with Chl a (Carder et al., 1991; Tassan, 1994), although still 0034-4257/02/$ - see front matter D 2002 Elsevier Science Inc. All rights reserved. PII:S0034-4257(02)00163-3 * Corresponding author. Tel.: +1-228-688-1724; fax: +1-228-688- 1774. E-mail address: [email protected] (E.J. D’Sa). www.elsevier.com/locate/rse Remote Sensing of Environment 84 (2003) 538 – 549
Transcript of Bio-optical properties in waters influenced by the...

Bio-optical properties in waters influenced by the Mississippi River
during low flow conditions
Eurico J. D’Saa,*, Richard L. Millerb
aGB Tech, NASA Earth Science Applications Directorate, Stennis Space Center, MS 39529, USAbNASA Earth Science Applications Directorate, Stennis Space Center, MS 39529, USA
Received 15 July 2002; received in revised form 26 September 2002; accepted 26 September 2002
Abstract
Spatial and temporal patterns of bio-optical properties were studied in the Northern Gulf of Mexico during cruises in April and October of
2000, a year during which the discharge volume from the Mississippi River was unusually low. Highly variable surface Chl a concentrations
(0.1 to 17 mg m� 3) and colored dissolved organic matter (CDOM) absorption (0.07 to 1.1 m� 1 at 412 nm) were observed in the study region
that generally decreased with increasing salinity waters, being highest nearshore and decreasing at offshore stations. The optical properties of
absorption, scattering, and diffuse attenuation coefficients reflected these distributions with phytoplankton particles and CDOM contributing
to most of the spatial, vertical, and seasonal variability. The diffuse attenuation coefficient Kd(k) and spectral remote sensing reflectance
Rrs(k) were linear functions of absorption and backscattering coefficients a(k) and bb(k) through the downward average cosine ld and the
ratio of variables f/Q at the SeaWiFS wavebands for waters with widely varying bio-optical conditions. Although various Rrs(k) ratio
combinations showed high correlation with surface Chl a concentrations and CDOM absorption at 412 nm, power law equations derived
using the Rrs(490)/Rrs(555) and Rrs(510)/Rrs(555) ratios provided the best retrievals of Chl a concentrations and CDOM absorption from
SeaWiFS reflectance data.
D 2002 Elsevier Science Inc. All rights reserved.
Keywords: Bio-optical properties; Mississippi River; SeaWiFS; Chlorophyll; CDOM
1. Introduction
The Mississippi River system ranks among the top 10
rivers in length, freshwater discharge, and sediment delivery
(Milliman & Meade, 1983) and thus exerts a strong influ-
ence on the biological, chemical, and physical properties of
the Northern Gulf of Mexico (Del Castillo et al., 2001;
Muller-Karger, Walsh, Evans, & Meyers, 1991). A season-
ally varying discharge of fresh water and nutrients from the
Mississippi River influences the spatial and temporal dis-
tribution of carbon fluxes and primary productivity in the
Northern Gulf of Mexico (Dinnel & Wiseman, 1986;
Lohrenz et al., 1999; Rabalais et al., 1996; Redalje, Loh-
renz, & Fahnenstiel, 1994). Recent outbreaks of hypoxia
over large areas of Louisiana and Texas coastal waters have
been attributed to high levels of primary productivity in
surface plume waters that are sustained by nutrients from the
Mississippi River (Rabalais & Turner, 2001). While satellite
remote sensing provides the potential to describe and
monitor the variability of bio-optical properties (e.g., phy-
toplankton biomass) and the oceanic carbon fluxes, there is
still a need to evaluate currently used or to develop regional
ocean color algorithms for coastal regions as those influ-
enced by the Mississippi River.
Ocean color algorithms developed to estimate biological
variables such as Chl a have been used in both case I and
case II waters (O’Reilly et al., 1998) and are based on the
premise that other in-water constituents such as colored
dissolved organic matter (CDOM) and detrital material co-
vary with Chl a, the primary pigment used to represent
phytoplankton concentrations. However, the ability of these
algorithms to accurately estimate bio-optical variables in
coastal waters is not very clear as in-water constituents such
as CDOM and suspended sediments may not co-vary with
Chl a (Carder et al., 1991; Tassan, 1994), although still
0034-4257/02/$ - see front matter D 2002 Elsevier Science Inc. All rights reserved.
PII: S0034 -4257 (02 )00163 -3
* Corresponding author. Tel.: +1-228-688-1724; fax: +1-228-688-
1774.
E-mail address: [email protected] (E.J. D’Sa).
www.elsevier.com/locate/rse
Remote Sensing of Environment 84 (2003) 538–549

influencing the water leaving radiance. The contribution of
particulate and dissolved constituents to the variability of
optical properties and ocean color in coastal waters requires
a better understanding of the linkages between the concen-
tration of these constituents, the inherent optical properties
(IOPs) of absorption and scattering coefficients, and the
apparent optical properties (AOPs) such as the spectral
attenuation for downward irradiance Kd(k) and remote
sensing reflectance Rrs(k). Knowledge of these relationshipsis important for characterizing the marine optical environ-
ment and developing remote sensing ocean color algorithms
for coastal waters.
In this study, we present results of bio-optical measure-
ments obtained during two research cruises conducted in the
coastal margin influenced by the Mississippi River in April
and October of 2000. While river discharge in spring and
fall generally corresponds to high/low flow periods, the
discharge for the study year was unusually low compared to
previous years. We evaluate the spatial and temporal vari-
ability of the bio-optical properties and the relationships
between the IOPs (absorption, scattering and backscattering
coefficients) and the AOPs (Kd(k) and Rrs(k)) within the
context of low discharge. This data may provide an under-
standing of the baseline effect of the Mississippi River on
the regional coastal waters. The properties of the two main
AOPs of importance to remote sensing, Kd(k) and Rrs(k), arediscussed and analyzed in relation to absorption and scatter-
ing in an attempt to examine closure between the AOPs and
IOPs based on field data. We also derive empirical relation-
ships between the ratios of Rrs(k) and in-water constituents
such as Chl a concentrations and CDOM absorption and
compare estimates obtained using these local algorithms
with the standard ocean chlorophyll OC4v4 algorithm
(O’Reilly et al., 1998) on a SeaWiFS image of the region.
2. Methods and data
2.1. Study site
The study site is located in the Northern Gulf of Mexico
(Fig. 1) in waters largely influenced by the Mississippi
River. Most of the River discharge flows westward onto
the Louisiana–Texas shelf (Dinnel & Wiseman, 1986). Two
research cruises using the RV Pelican were undertaken in
spring (5–13 April) and fall (24 October–1 November) of
2000. Stations were occupied in the plume waters of the
main flow of the Mississippi River (Southwest Pass) to the
outer shelf, the inner shelf, as well as some open ocean
locations in the Gulf of Mexico (station locations shown in
Fig. 1. Study site showing location of bio-optical stations occupied in the Northern Gulf of Mexico during research cruises in April and October of 2000. Bio-
optical properties of four representative stations (squares) during the April cruise and two stations (circles) in October are noted for further discussion in the text.
E.J. D’Sa, R.L. Miller / Remote Sensing of Environment 84 (2003) 538–549 539

Fig. 1). While a full suite of bio-optical measurements was
made during the April cruise, in-water bio-optical data were
obtained at only four stations during the October cruise.
However, remote sensing reflectance Rrs(k) measurements
using an above-water radiometer were made at all the
stations (Fig. 1) during both cruises. Although river flow
is generally high during spring, the average discharge
volume for the 2 months prior to the spring 2000 cruise
was about 45% lower than the previous years (discharge
data are from the U.S. Army Corps of Engineers monitoring
station at Tarbert Landing, Mississippi). The fall cruise was
conducted during a period usually considered as a low-flow
period of river discharge. Overall, river discharge was much
lower for the year, and therefore, the results presented here
may be considered as prevailing under such conditions.
Ocean color SeaWiFS satellite imagery was obtained for
one clear day in spring (e.g., April 8), while three images of
the region were obtained for the fall experiment. The
satellite data were obtained from the Goddard Distributed
Active Archive Center and processed using NASA’s Sea-
DAS (version 4.1) software.
2.2. Bio-optical measurements
Bio-optical measurements were obtained using an optical
profiling package that integrated a number of optical instru-
ments within a metal cage. Discrete water samples were
obtained immediately after the optical cast with a rosette
sampler equipped with 10-l Niskin bottles. The bio-optical
package contained sensors for measurements of conductivity
and temperature (SBE-19, Seabird), stimulated chlorophyll
fluorescence (Wetstar, WetLabs), absorption/attenuation at
nine wavebands (ac-9, WetLabs), downwelling spectral
irradiance and upwelling spectral radiance at seven channels
(OCI and OCR-200, Satlantic), and backscattering at two
spectral bands (Hydroscat-2, HOBILabs). A data acquisition
and power unit (Mpak3, WetLabs) was used to integrate and
archive the data collected from the different instruments in
the bio-optical package. Subsequently, upon transfer of the
data to a desktop computer, a separate software program was
used to unpack into separate files the data corresponding to
individual instruments. A program was then used to depth-
align the data based on time stamps referenced to the CTD
depth. The data were then separated into downcast and
upcast segments and averaged into 0.5- or 1-m bins for
further processing and analysis.
The ac-9 consists of dual, 25-cm pathlength flow tubes
for measurement of in-water absorption and attenuation at
nine 10-nm wide spectral wavebands (412, 440, 488, 510,
532, 555, 650, 676, and 715 nm). Optically clean water
from a Nanopure system (Infinity UV/UF, Barnstead) was
used to calibrate the ac-9 during the cruise (Twardowski,
Sullivan, Donaghay, & Zaneveld, 1999). Software was
written to implement three additional corrections (temper-
ature, salinity, and scattering) to the ac-9 data (Pegau, Gray,
& Zaneveld, 1997; Zaneveld, Kitchen, & Moore, 1994).
Particulate scattering coefficient bp(k) was calculated as the
difference between the corrected attenuation and absorp-
tion. The ac-9 data were generally binned at 1-m depth
intervals, but at stations with shallow depths ( < 20 m),
binning was set to 0.5 m. The deployment of the bio-
optical package at each station was repeated for dissolved
or CDOM absorption measurements using a 0.2-Am Supor-
Cap cartridge filter (Gelman Sciences) that was attached to
the intake tubes of the ac-9 meter. The difference between
unfiltered (particulate plus dissolved absorption or
[ap(k) + acdom(k)]) and filtered (dissolved absorption or
acdom(k)) profiles can be attributed to particulate absorp-
tion, ap(k). Scattering data from the Hydroscat-2 sensor
were obtained during the October cruise only and were
processed using software (Hydrolab, HOBILabs) that gen-
erated the uncorrected backscattering coefficients at two
wavelengths of 442 and 589 nm. The ac-9 derived absorp-
tion and scattering values were then used to correct the
backscattering data bb(k) (here, bb is the sum of back-
scattering due to particulates bbp and pure water bbw) to
account for losses due to attenuation of some backscattered
light in the water between the instrument and the detection
volume. The 440- and 442-nm central wavebands for the
ac-9 and the Hydroscat measurements were interpolated to
the 443-nm waveband to match the SeaWiFS waveband
(band 2). The change in values due to this shift was
insignificant for the absorption and scattering data.
Vertical profiles of spectral downwelling irradiance Ed(k)and upwelling radiance Lu(k) at seven 10-nm wavebands
(412, 443, 490, 510, 555, 665, and 683 nm) were processed
to calculate the diffuse attenuation coefficients for down-
welling irradiance Kd(k) and upwelling radiance Ku(k).These coefficients were determined as the slope of ln Ed(k)or Lu(k) versus depth. An 11-point moving linear regression
of ln Ed(k) versus depth was used to obtain vertical profiles
of Kd(k) and Ku(k). Values of Kd(k) and Ku(k) at the
shallowest depth were then used to estimate Ed(k,0�) and
Lu(k,0�) just beneath the sea surface. Based on known values
of Fresnel reflectance at the water–air interface for upwell-
ing radiance and downwelling irradiance, the subsurface
values Ed(k,0�) and Lu(k,0
�) were extrapolated to values
just above the sea surface (Mueller & Austin, 1995). Remote
sensing reflectance Rrs(k,0+) or Rrs(k) was then calculated as
RrsðkÞ ¼ Luðk; 0þÞ=Edðk; 0þÞ; ð1Þ
where Lu(k,0+) is the water-leaving radiance measured in the
nadir direction just above the sea surface and Ed(k,0+) is the
downwelling irradiance incident on the sea surface.
In addition to the in-water derived values of Rrs(k), wealso derived Rrs(k) from above-water measurements of
signals proportional to surface and sky radiance, and radi-
ance reflected from a horizontal plaque with known bi-
directional reflectance (Mobley, 1999). Above-water remote
sensing reflectance measurements of Rrs(k) from 400 to 825
nm at 1-nm spectral resolution were obtained using a GER
E.J. D’Sa, R.L. Miller / Remote Sensing of Environment 84 (2003) 538–549540

1500 (Geophysical and Environmental Research) 512-chan-
nel, fiber optic system adapted for field operations. Follow-
ing SeaWiFS protocols (Mueller & Austin, 1995), replicate
radiance spectra of the sea surface were measured with the
fiber-optic radiometer at 30j, followed by the sky radiance
and the radiance reflected from a 10% reference Spectralon
plaque (Labsphere), and the data processed for determina-
tion of above-water Rrs(k).
2.3. Discrete water sample analysis
Water samples at discrete depths were collected using a
CTD rosette multi-bottle array system (General Oceanics
Model 1015-12). Water samples collected from CTD casts
immediately following optical profiles were used for corre-
lation with optical measurements. Discrete water samples
were analyzed for: (1) Chl a and selected pigments using
high performance liquid chromatography or HPLC, (2)
particulate ap(k) and detrital ad(k) absorption coefficients
using the quantitative filter pad technique (Kishino, Taka-
hasi, Okami, & Ichimura, 1985; Mitchell & Kiefer, 1988),
and (3) CDOM absorption acdom(k) using a multiple path-
length capillary waveguide (Miller, Belz, Del Castillo, &
Trzaska, 2002). Water samples collected from Niskin bottles
were filtered through GF/F glass fiber filters and frozen/
stored in liquid nitrogen for laboratory analysis of pigments
and particle absorption. Chlorophyll a used in this study and
determined from HPLC represents chlorophyll a and deriv-
atives (chlorophyllide a, chlorophyll a, allomers and epi-
mers). Measurements of CDOM absorption were carried out
with a waveguide using pre-rinsed 0.2-Am Nuclepore nylon
filters and verified with spectrophotometric measurements
using a Perkin-Elmer ultraviolet/visible (UV/VIS) Lambda-
18 dual beam spectrophotometer.
3. Results and discussion
3.1. Spatial and seasonal variability in the bio-optical
properties
One of the consequences of the Mississippi River flow
into the Northern Gulf of Mexico is the density stratifica-
tion, with lower salinity waters overlying a more saline
oceanic water body. At most stations sampled during the
April cruise (Fig. 1), the overlying surface plume waters had
salinity values that varied spatially from lows in the 20 to 33
psu, while in the underlying oceanic waters, salinities varied
from 33 to 36.4 psu. Example stations close to the Mis-
sissippi River outflow into the Gulf of Mexico (st. 192, near
SW Pass), a mid-shelf station (st. 46) and an off-shore
station (st. 24), are shown as representing the range of bio-
optical properties at the study site during the spring cruise.
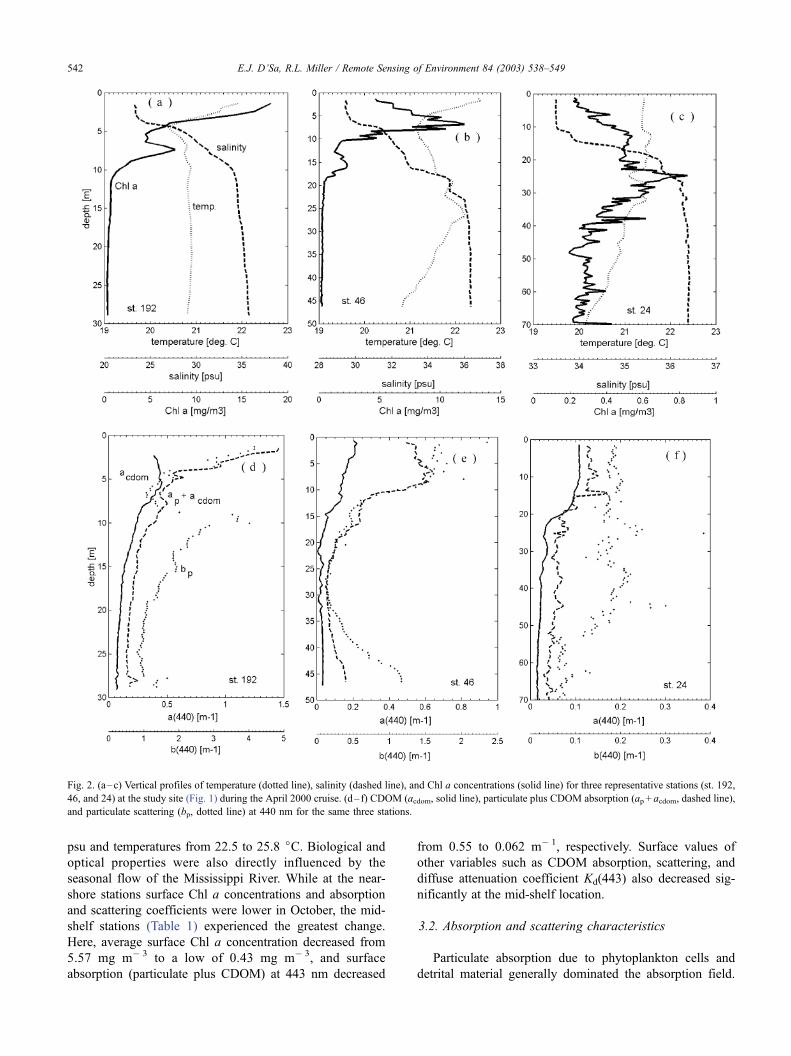
High Chl a concentrations were associated with lower
salinity surface plume waters with concentrations varying
from highs of about 17 mg m� 3 at station 192 (Fig. 2(a)) to
lows of < 0.2 mg m� 3 at the weakly stratified offshore
stations (st. 24 and 122). High surface Chl a concentrations
and CDOM absorption at stations with lower salinities (e.g.,
Fig. 2(a) and (b)) strongly attenuated the light field thus
potentially restricting primary production to near surface
waters. In comparison, a weakly stratified surface layer
(e.g., station 24, Fig. 2(c)) was associated with low surface
Chl a concentrations of about 0.2 mg m� 3, which increased
with depth to about 0.7 mg m� 3 at up to 25 m and then
again decreases. An examination of inorganic nutrient con-
centrations (Powell, LUMCON, personal communication)
indicated elevated levels of nutrient concentrations (>3 AMNO3) at most stations with high Chl a concentrations in the
river plume, while at the two offshore stations (st. 24 and
122), nitrate concentrations in surface waters were relatively
low (0.14 and 0.19 AM NO3, respectively).
Vertical profiles of particulate plus CDOM and CDOM
absorption and scattering coefficients (determined from ac-9
measurements) at the 440 nm waveband (Fig. 2(d)–(f)) at the
same three representative stations show a strong resemblance
to Chl a profiles, higher values in surface waters that decrease
with depth. These high values of absorption were all asso-
ciated with lower salinity waters and high surface Chl a
concentrations. At the nearshore station (st. 192), a near-
surface [ap(440) + acdom(440)] maximum of 1.5 m� 1
decreased rapidly to about 0.3 m� 1 at a depth of 10 m.
Spatially, surface values of [ap(440) + acdom(440)] further
decreased to 0.5 m� 1 at the mid-shelf station (Fig. 2(e))
and to about 0.13 m� 1 at the offshore station 24. Surface
acdom(440) varied from a high of about 0.4 m� 1 (nearshore
station 192) to about 0.01 m� 1 at station 24. Particulate
scattering bp(440) at stations 192 and 46 also showed surface
highs (4 and 1.6 m� 1), reflecting higher phytoplankton
concentrations at these two stations. In contrast, surface
scattering was relatively low (f 0.2 m� 1) at station 24
(surface Chl a concentration < 0.2 mg m� 3). Subsurface
and near-bottom highs in scattering unrelated to phytoplank-
ton concentrations were observed at all three stations. Spec-
trally, both the absorption and scattering typically decreased
with increasing wavelengths. In the case of CDOM, the
spectra showed an exponential decrease in absorption with
increasing wavelength, an expected trend (Miller et al., 2002)
with slopes of the log-linearized absorption spectra, S, in the
range 0.014 to 0.017.
Seasonality of the Mississippi River discharge is observed
to strongly influence the hydrographic and bio-optical prop-
erties of waters in the Northern Gulf of Mexico. This is
illustrated by the variability in bio-optical properties at
closely located stations (st. 192 and 34 near SW Pass) and
mid-shelf stations (st. 46 and 70) sampled in April and
October of 2000, respectively (Table 1). A higher volume
of river discharge in spring results in lower salinity and
temperature values observed at both the nearshore and mid-
shelf stations. Seasonal changes (April to October 2000) in
hydrographic conditions were greatest at the mid-shelf
location where surface salinity changed from 29.48 to 36.0
E.J. D’Sa, R.L. Miller / Remote Sensing of Environment 84 (2003) 538–549 541
psu and temperatures from 22.5 to 25.8 jC. Biological andoptical properties were also directly influenced by the
seasonal flow of the Mississippi River. While at the near-
shore stations surface Chl a concentrations and absorption
and scattering coefficients were lower in October, the mid-
shelf stations (Table 1) experienced the greatest change.
Here, average surface Chl a concentration decreased from
5.57 mg m� 3 to a low of 0.43 mg m� 3, and surface
absorption (particulate plus CDOM) at 443 nm decreased
from 0.55 to 0.062 m� 1, respectively. Surface values of
other variables such as CDOM absorption, scattering, and
diffuse attenuation coefficient Kd(443) also decreased sig-
nificantly at the mid-shelf location.
3.2. Absorption and scattering characteristics
Particulate absorption due to phytoplankton cells and
detrital material generally dominated the absorption field.
Fig. 2. (a–c) Vertical profiles of temperature (dotted line), salinity (dashed line), and Chl a concentrations (solid line) for three representative stations (st. 192,
46, and 24) at the study site (Fig. 1) during the April 2000 cruise. (d– f) CDOM (acdom, solid line), particulate plus CDOM absorption (ap + acdom, dashed line),
and particulate scattering (bp, dotted line) at 440 nm for the same three stations.
E.J. D’Sa, R.L. Miller / Remote Sensing of Environment 84 (2003) 538–549542

However, CDOM absorption also formed an important
though variable component of the total absorption, varying
from less than 25% of the absorption field at the nearshore
stations to greater than 50% at the offshore stations. Also, at
the turbid nearshore stations, detrital material contributed a
large fraction (about 40%) to the particulate absorption
while being negligible at the offshore stations. The partic-
ulate scattering coefficient bp (where appropriate, we drop
the k argument for brevity), as derived from field measure-
ments with the ac-9, varied over a large range (e.g., bp(443)
varied from 3.55 m� 1 near SW Pass to about 0.2 m� 1 at the
offshore station 24). Spectrally, scattering decreased in a
similar fashion (Gould, Arnone, & Martinolich, 1999), with
increasing wavelength from 412 to 715 nm (not shown).
However, the backscattering coefficient bb(k) is the variablethat directly influences ocean color variability and is most
often used in inversion models. From simultaneous meas-
urements of bb(443) and bp(443) at various stations during
the October cruise, we obtained a relationship (Fig. 3(a))
between bb(443) and bp(443) given by
bbð443Þ ¼ 0:00069 þ 0:01799bpð443Þ ðr2 ¼ 0:98Þ: ð2Þ
A similar value for the slope (0.01829) was obtained by
Gould et al. (1999) using Petzold’s values of b and bb that
were applicable over a wide wavelength range (400 to 600
nm) and samples that were obtained from different oceanic
regions. Similarity in the relationship between scattering and
backscattering obtained by these two studies are interesting
in that these parameters are also dependent on particle size,
shape, and composition (i.e., index of refraction). However,
an examination of Fig. 3(a) suggests that a nonlinear fit may
also be applicable, especially for the mid-range data. A
general cubic-polynomial equation (bb = a0 + a1bp + a2bp2 +
a3bp3) showed a strong fit to the data (coefficient of de-
termination of 0.98) with values of coefficients being a0 =
0.00248, a1 = 0.01, a2 =� 0.0036, and a3 =� 0.00041. The
intercept, a0 = 0.00248, which represents the backscattering
by pure water bbw(443) is about the same value (0.002406
m� 1) as that obtained by Smith and Baker (1981). Based on
the assumption that the relationship between bb and bpwould also be valid temporally for the same waters, we
Table 1
Hydrographic and bio-optical properties of two closely located stations near Southwest Pass (st. 192 and 34) and two mid-shelf stations (st. 46 and 70) in April
and October of 2000, respectively
Surface properties (0–3 m) Spring 2000 (April 5–13) Fall 2000 (October 24–31)
SW Pass (st. 192) Mid-shelf (st. 46) SW Pass (st. 34) Mid-shelf (st. 70)
Salinity (psu) 23.35 29.48 25.66 36.0
Temperature (jC) 21.76 22.50 23.80 25.88
Chl a (mg m� 3) 17.34 5.57 8.4 0.43
TSM (mg/l) 7.0 13.5 3.12 0.34
CDOM abs. acdom(443) (m� 1) 0.45 0.26 0.33 0.031
[ap(443) + acdom(443)] (m� 1) 1.3 0.55 0.69 0.062
Scattering, bp(443) (m� 1) 3.55 1.63 1.81 0.18
Scattering albedo x0(443) 0.73 0.74 0.72 0.74
Backscattering bb(443) (m� 1) 0.065 0.031 0.028 0.004
Attenuation coeff. Kd(443) (m� 1) 1.18 0.89 0.14 0.08
Nitrate +Nitrite (AM) 11.52 4.29 15.27 1.25
Fig. 3. (a) Backscattering (bb) at 443 nm (m� 1) plotted as a function of
particulate scattering bp at the same waveband measured for three stations
during the October 2000 cruise. The solid line represents the least-squares
regression fit to the data; (b) particulate backscattering bbp (m� 1) as a
function of wavelength at four stations (Fig. 1) derived from scattering
measurements.
E.J. D’Sa, R.L. Miller / Remote Sensing of Environment 84 (2003) 538–549 543

use the linear relationship of Eq. (2) to derive bbp(k) frombp(k) for the April cruise. Typical surface spectral bbp(k)values (Fig. 3(b)) for four stations (st. 192, 46, 24, and
207) varied by an order of magnitude from about 0.003
m� 1 at the offshore station (st. 24) to >0.06 m� 1 at the
two nearshore stations (st. 192 and 207). Under the low
flow regime of the Mississippi River, both suspended
sediments and phaeopigments were relatively low suggest-
ing phytoplankton biomass to be the dominant factor
determining backscattering. HPLC pigment analysis
showed higher levels of the carotenoid fucoxanthin, indi-
cative of diatoms at these stations.
Observed spatial and vertical changes in the magnitude
of the water column attenuation coefficient for downward
irradiance Kd(k) were primarily influenced by particulate
and CDOM absorption (D’Sa, Miller, McKee, & Trzaska,
2002). Estimated at the 10% light level, Kd(443) was
linearly related to total absorption (a= aw + ap + acdom) at
443 nm (Fig. 4) determined at the same optical depth. Here,
absorption due to pure water aw was obtained from Pope
and Fry (1997). The diffuse attenuation coefficient Kd has
been expressed as a function of absorption and backscatter-
ing coefficients a and bb using the two-stream irradiance
model (Aas, 1987) through the approximation
Kdcðaþ bbÞ=ld; ð3Þ
where ld is the cosine of the mean downwelling light field
and the absorption a and backscattering bb coefficients are
the sum of components representing the contribution of
various in-water constituents. The various components of
absorption are due to pure water, particulates, and dissolved
materials, while backscattering comprised of pure water
backscatter and particulate backscatter. From field determi-
nations of a, b, and Kd at the 10% light level, we also
observe that (a + bb) and Kd are linearly related (Fig. 4) for
stations comprising a variety of optical conditions. From Eq.
(3), the slope (0.65) in Fig. 4 represents the mean cosine ld,which on neglecting the effects of bb reduces ld to a value
of 0.61. As observed in Fig. 4, while the bb contribution to
this formulation appears to be negligible at the offshore
stations with low absorption values, it is quite significant at
the nearshore stations with higher absorption. The mean
cosine ld has been modeled for a variety of solar zenith
angles (0–90j), scattering to absorption ratios (1–20) and
water depths (Bannister, 1992). Modeled values of ld havebeen shown to vary from 0.8 at surface to an asymptotic
value of 0.65 at the 0.1% light level for a sun zenith angle of
30j and a b/a value of 4 (Bannister, 1992). For stations at
our study site, the b/a ratio at the 10% light level varied
from a high of about 9.7 at coastal stations (st. 157 and 91)
to a low of about 1.23 at the offshore station 24. A
comprehensive examination of ld as a function of depth
and the IOPs (Berwald, Stramski, Mobley, & Kiefer, 1995;
McCormick, 1995) and the relationship between Kd and Chl
a concentrations (Morel & Maritorena, 2001) will be useful
in further characterizing the bio-optical properties of these
waters.
3.3. Remote sensing reflectance relationship to absorption
and backscattering
Spectral remote sensing reflectances Rrs(k) determined
from measurements with an in-water radiometer were var-
iable in shape and magnitude (Fig. 5). Reflectance spectra of
the nearshore and the mid-shelf stations (st. 192, 207, and
46) show well-pronounced maxima in the green spectral
band, while the offshore station 24 shows maximal reflec-
tance at 490 nm. The relative role of absorption and
scattering appear to control the reflectance spectra at these
stations. While absorption due to phytoplankton and CDOM
is strong at the nearshore and mid-shelf stations, enhanced
Fig. 4. Absorption a(443) and absorption plus backscattering a(443) +
bb(443) as a function of Kd at 443 nm determined from field measurements
at the 10% light level. The lines are least-squares fit to the data (r2 = 0.91,
n= 9 in both cases).
Fig. 5. Typical remote sensing reflectance spectra Rrs(k) determined from
measurements using an in-water radiometer at four stations at the study site
in April of 2000.
E.J. D’Sa, R.L. Miller / Remote Sensing of Environment 84 (2003) 538–549544

backscattering (Fig. 3(b)) due to suspended particles (phy-
toplankton, detrital, and suspended sediments) contributed
to the large Rrs(k) values (>0.005) at the green wavebands.
We also observe the signature associated with solar-stimu-
lated Chl a at 683 nm at these stations. At the offshore
station 24, backscattering contribution by particulate mate-
rial is minimal (Chl a < 0.2 mg m� 3), while the relatively
higher CDOM levels (0.1 m� 1 at 443 nm) at this station
results in lower Rrs(k) values in the blue spectral region.
Ocean color is usually understood in terms of remote
sensing reflectance Rrs(k), which is defined as the ratio of
the upwelling radiance and downwelling irradiance (Eq.
(1)). Rrs(k) has been related to the irradiance reflectance just
beneath the surface R(0�) through the approximation given
by (Mobley, 1994),
RrsðkÞc0:54 Rð0�Þ=Q; ð4Þ
where Q is the ratio of upwelling irradiance to upwelling
radiance (Morel & Gentili, 1996). The subsurface irradiance
reflectance R(0�) defined as the ratio of upwelling irradi-
ance to downwelling irradiance has been related through
modeling studies to the absorption a(k) and backscattering
bb(k) coefficients of seawater through the approximation
(Gordon, et al., 1988; Morel & Gentili, 1996)
Rð0�Þcfbb=ðaþ bbÞ; ð5Þ
where f is a variable that depends upon the solar zenith
angle, the optical properties of seawater, and light wave-
length (Morel & Gentili, 1991). From Eqs. (4) and (5),
Rrs(k) relates to the IOPs of absorption and backscattering
through the approximation given by
RrsðkÞc0:54½ f =Q�½bb=ðaþ bbÞ� ð6Þ
The f/Q ratio above, although being dependent on the
geometric conditions (solar-zenith angle and the viewing
angle), wavelength, and the bio-optical state (Morel &
Gentili, 1996), varies to a lesser degree than f and Q
individually.
Using Eq. (6), we examine the spectral relationship
between Rrs(k) and concurrent surface (0–3 m average)
estimates of backscattering and absorption coefficients at the
SeaWiFS wavebands (Fig. 6). The criteria for choosing the
0–3 m surface average for the IOPs and Chl a were based
on the observation that the lower salinity surface mixed
layer in the study region, while variable, was generally
greater than 3 m. We observe that Rrs and bb/(a + bb) are
linearly related (r2>0.8) at the 490 and 555 nm wavebands
(Fig. 6) as well as at the 412, 510, and 683 nm wavebands.
From Eq. (6), the slope divided by 0.54 gives the ratio f/Q
and lies between 0.09 and 0.12 (Fig. 7) over the spectral
range of 412 to 683 nm. These f/Q values derived from our
field studies fall well within the range modeled for various
solar-zenith angles, the viewing angle, wavelength, and the
bio-optical state (Morel & Gentili, 1996). While the solar-
zenith angle has been shown to strongly affect value of f/Q,
this was not observed in our data since most of our field
measurements were done within 2 h of midday. Although
surface values of Chl a concentrations varied widely (0.2 to
>17 mg m� 3) at the study site, it did not contribute greatly
to the f/Q variability. A similar range in the field determi-
nations of f/Q ratio (Reynolds, Stramski, & Mitchell, 2001)
in the Southern Ocean suggests a narrow range in its
variability. High correlations between the independently
measured reflectances and the IOPs (backscattering and
absorption) and the low f/Q variability suggest a measure
of closure in our field determinations of AOPs and IOPs for
waters with considerable range in absorption and scattering
properties.
3.4. Remote sensing reflectance algorithms
Remote sensing reflectance Rrs(k) were determined
using both in-water and above-water radiometers during
the April 2000 cruise. A comparison of the ratios of
Fig. 6. Comparison of remote sensing reflectance Rrs with bb/(a+ bb) at
various stations during the April cruise corresponding to two SeaWiFS
wavebands at 490 and 555 nm. From Eq. (6) in text, we interpret the slope
divided by 0.54 as representing the average value of the ratio f/Q at each of
the wavebands.
E.J. D’Sa, R.L. Miller / Remote Sensing of Environment 84 (2003) 538–549 545

Rrs(k) determined using the two techniques, indicate the
ratios to be highly correlated (Fig. 8) for the various
combinations of wavebands generally used in ocean color
algorithms. These results suggest that ratios of Rrs(k)determinations using the above-water radiometer also
closely relate to the ratios of IOPs (backscattering and
absorption) for any of the relevant combination wave-
bands. We use an extended set of these Rrs(k) and surface
measurements of Chl a and CDOM absorption to
evaluate appropriate empirical relationships between the
variables.
The application of color ratios of water-leaving radiances
or remote sensing reflectances to estimate Chl a concen-
trations is based on the absorption characteristics of Chl a
which absorbs more blue light than green. The operational
SeaWiFS ocean chlorophyll algorithm (OC4), for example,
uses a four-band (443, 490, 510, and 555 nm) maximum
band ratio formulation (O’Reilly et al., 1998). Regression
analysis of the log-transformed reflectance ratios and Chl a
for the four bands used in the OC4 algorithm indicates
high correlations between the Rrs(k) ratios and Chl a
(r2>0.8) for all the bands (Fig. 9). For the same range in
Chl a concentrations, however, the range in Rrs(k) ratio
values decreases with increasing wavebands (i.e., Rrs(443)/
Rrs(555)>Rrs(490)/Rrs(555) and >Rrs(510)/Rrs(555)). The
Rrs(443)/Rrs(555) ratio is expected to give the most precise
estimates at lower Chl a concentrations, the Rrs(510)/
Rrs(555) ratio at higher Chl a concentrations while the
Rrs(490)/Rrs(555) ratio in the Chl a range between the other
two ratios (O’Reilly et al., 1998). However, in the presence
of variable and relatively high CDOM absorption in the
region, the effect of shifts in the ratio selection is not clear,
although for our data set, it was observed that the OC4
algorithm would predominantly select the Rrs(510)/Rrs(555)
band ratio. With Rrs(490)/Rrs(555) ratio providing a higher
dynamic range for the same range in Chl a concentrations,
we propose the use of this single band ratio for estimating
Fig. 8. Comparison between the ratios of remote sensing reflectance Rrs(k) determined from measurements with above-water and in-water radiometers at same
locations (April 2000).
Fig. 7. Spectral variations of the ratio f/Q computed from regression
analysis (Fig. 6) and Eq. (6) in text for the SeaWiFS wavebands.
E.J. D’Sa, R.L. Miller / Remote Sensing of Environment 84 (2003) 538–549546
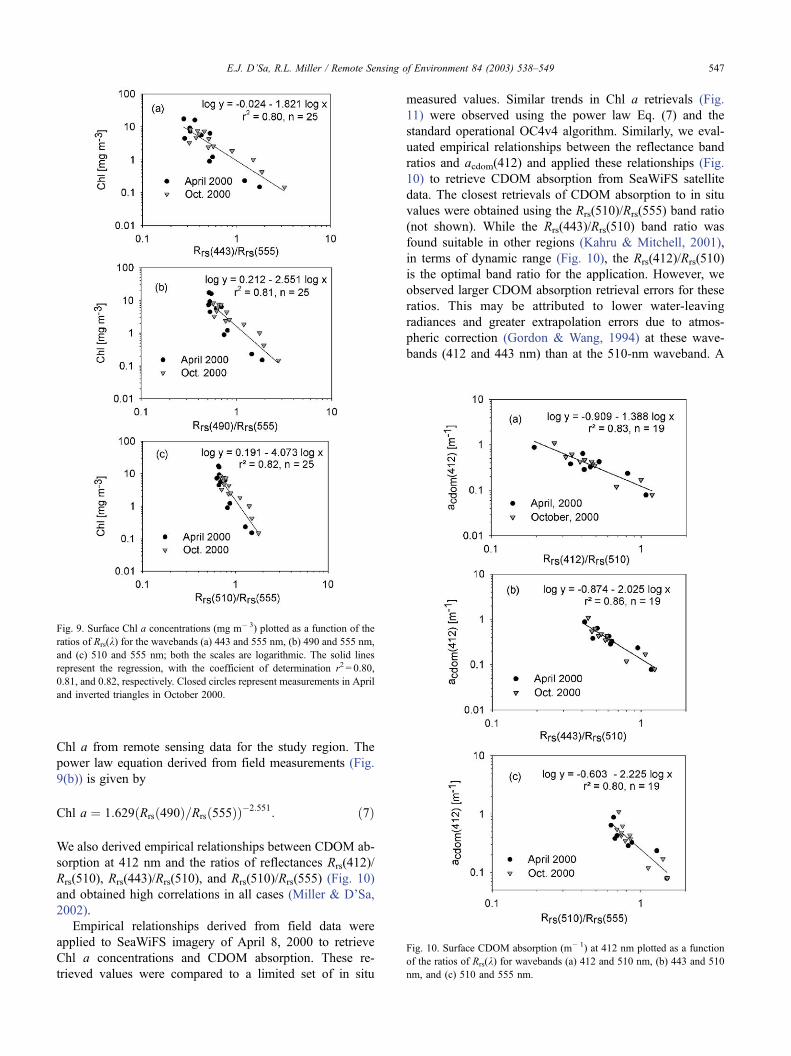
Chl a from remote sensing data for the study region. The
power law equation derived from field measurements (Fig.
9(b)) is given by
Chl a ¼ 1:629ðRrsð490Þ=Rrsð555ÞÞ�2:551: ð7Þ
We also derived empirical relationships between CDOM ab-
sorption at 412 nm and the ratios of reflectances Rrs(412)/
Rrs(510), Rrs(443)/Rrs(510), and Rrs(510)/Rrs(555) (Fig. 10)
and obtained high correlations in all cases (Miller & D’Sa,
2002).
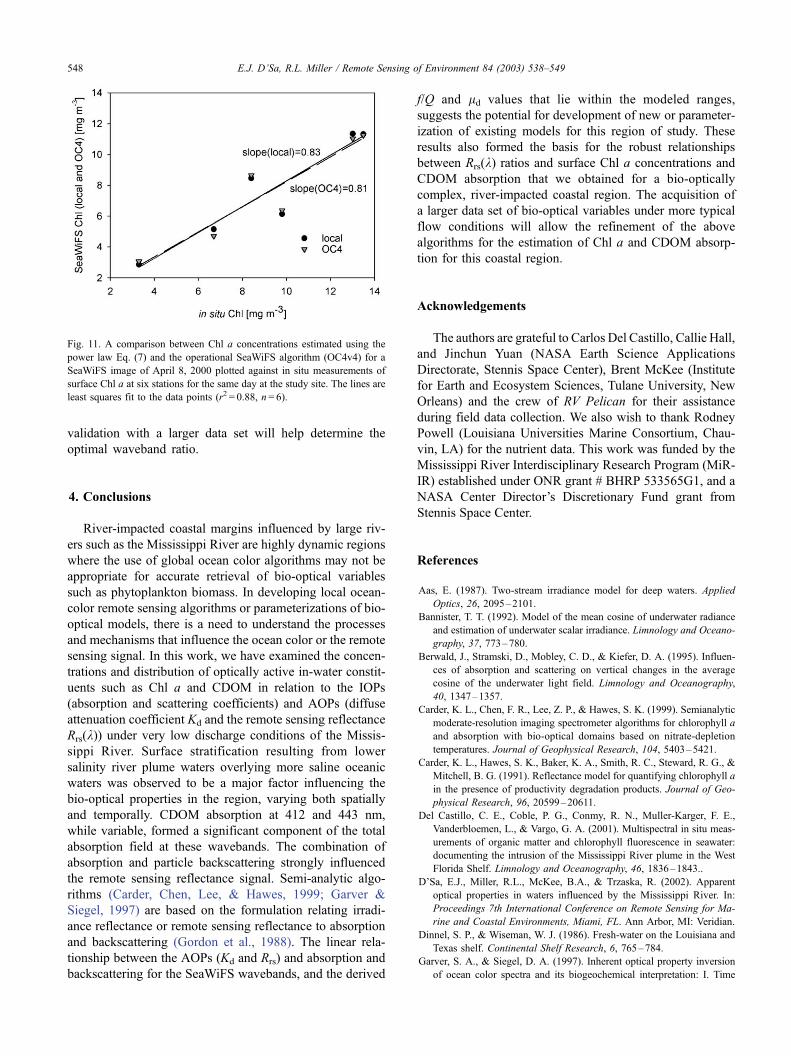
Empirical relationships derived from field data were
applied to SeaWiFS imagery of April 8, 2000 to retrieve
Chl a concentrations and CDOM absorption. These re-
trieved values were compared to a limited set of in situ
measured values. Similar trends in Chl a retrievals (Fig.
11) were observed using the power law Eq. (7) and the
standard operational OC4v4 algorithm. Similarly, we eval-
uated empirical relationships between the reflectance band
ratios and acdom(412) and applied these relationships (Fig.
10) to retrieve CDOM absorption from SeaWiFS satellite
data. The closest retrievals of CDOM absorption to in situ
values were obtained using the Rrs(510)/Rrs(555) band ratio
(not shown). While the Rrs(443)/Rrs(510) band ratio was
found suitable in other regions (Kahru & Mitchell, 2001),
in terms of dynamic range (Fig. 10), the Rrs(412)/Rrs(510)
is the optimal band ratio for the application. However, we
observed larger CDOM absorption retrieval errors for these
ratios. This may be attributed to lower water-leaving
radiances and greater extrapolation errors due to atmos-
pheric correction (Gordon & Wang, 1994) at these wave-
bands (412 and 443 nm) than at the 510-nm waveband. A
Fig. 9. Surface Chl a concentrations (mg m� 3) plotted as a function of the
ratios of Rrs(k) for the wavebands (a) 443 and 555 nm, (b) 490 and 555 nm,
and (c) 510 and 555 nm; both the scales are logarithmic. The solid lines
represent the regression, with the coefficient of determination r2 = 0.80,
0.81, and 0.82, respectively. Closed circles represent measurements in April
and inverted triangles in October 2000.
Fig. 10. Surface CDOM absorption (m� 1) at 412 nm plotted as a function
of the ratios of Rrs(k) for wavebands (a) 412 and 510 nm, (b) 443 and 510
nm, and (c) 510 and 555 nm.
E.J. D’Sa, R.L. Miller / Remote Sensing of Environment 84 (2003) 538–549 547
validation with a larger data set will help determine the
optimal waveband ratio.
4. Conclusions
River-impacted coastal margins influenced by large riv-
ers such as the Mississippi River are highly dynamic regions
where the use of global ocean color algorithms may not be
appropriate for accurate retrieval of bio-optical variables
such as phytoplankton biomass. In developing local ocean-
color remote sensing algorithms or parameterizations of bio-
optical models, there is a need to understand the processes
and mechanisms that influence the ocean color or the remote
sensing signal. In this work, we have examined the concen-
trations and distribution of optically active in-water constit-
uents such as Chl a and CDOM in relation to the IOPs
(absorption and scattering coefficients) and AOPs (diffuse
attenuation coefficient Kd and the remote sensing reflectance
Rrs(k)) under very low discharge conditions of the Missis-
sippi River. Surface stratification resulting from lower
salinity river plume waters overlying more saline oceanic
waters was observed to be a major factor influencing the
bio-optical properties in the region, varying both spatially
and temporally. CDOM absorption at 412 and 443 nm,
while variable, formed a significant component of the total
absorption field at these wavebands. The combination of
absorption and particle backscattering strongly influenced
the remote sensing reflectance signal. Semi-analytic algo-
rithms (Carder, Chen, Lee, & Hawes, 1999; Garver &
Siegel, 1997) are based on the formulation relating irradi-
ance reflectance or remote sensing reflectance to absorption
and backscattering (Gordon et al., 1988). The linear rela-
tionship between the AOPs (Kd and Rrs) and absorption and
backscattering for the SeaWiFS wavebands, and the derived
f/Q and ld values that lie within the modeled ranges,
suggests the potential for development of new or parameter-
ization of existing models for this region of study. These
results also formed the basis for the robust relationships
between Rrs(k) ratios and surface Chl a concentrations and
CDOM absorption that we obtained for a bio-optically
complex, river-impacted coastal region. The acquisition of
a larger data set of bio-optical variables under more typical
flow conditions will allow the refinement of the above
algorithms for the estimation of Chl a and CDOM absorp-
tion for this coastal region.
Acknowledgements
The authors are grateful to Carlos Del Castillo, Callie Hall,
and Jinchun Yuan (NASA Earth Science Applications
Directorate, Stennis Space Center), Brent McKee (Institute
for Earth and Ecosystem Sciences, Tulane University, New
Orleans) and the crew of RV Pelican for their assistance
during field data collection. We also wish to thank Rodney
Powell (Louisiana Universities Marine Consortium, Chau-
vin, LA) for the nutrient data. This work was funded by the
Mississippi River Interdisciplinary Research Program (MiR-
IR) established under ONR grant # BHRP 533565G1, and a
NASA Center Director’s Discretionary Fund grant from
Stennis Space Center.
References
Aas, E. (1987). Two-stream irradiance model for deep waters. Applied
Optics, 26, 2095–2101.
Bannister, T. T. (1992). Model of the mean cosine of underwater radiance
and estimation of underwater scalar irradiance. Limnology and Oceano-
graphy, 37, 773–780.
Berwald, J., Stramski, D., Mobley, C. D., & Kiefer, D. A. (1995). Influen-
ces of absorption and scattering on vertical changes in the average
cosine of the underwater light field. Limnology and Oceanography,
40, 1347–1357.
Carder, K. L., Chen, F. R., Lee, Z. P., & Hawes, S. K. (1999). Semianalytic
moderate-resolution imaging spectrometer algorithms for chlorophyll a
and absorption with bio-optical domains based on nitrate-depletion
temperatures. Journal of Geophysical Research, 104, 5403–5421.
Carder, K. L., Hawes, S. K., Baker, K. A., Smith, R. C., Steward, R. G., &
Mitchell, B. G. (1991). Reflectance model for quantifying chlorophyll a
in the presence of productivity degradation products. Journal of Geo-
physical Research, 96, 20599–20611.
Del Castillo, C. E., Coble, P. G., Conmy, R. N., Muller-Karger, F. E.,
Vanderbloemen, L., & Vargo, G. A. (2001). Multispectral in situ meas-
urements of organic matter and chlorophyll fluorescence in seawater:
documenting the intrusion of the Mississippi River plume in the West
Florida Shelf. Limnology and Oceanography, 46, 1836–1843..
D’Sa, E.J., Miller, R.L., McKee, B.A., & Trzaska, R. (2002). Apparent
optical properties in waters influenced by the Mississippi River. In:
Proceedings 7th International Conference on Remote Sensing for Ma-
rine and Coastal Environments, Miami, FL. Ann Arbor, MI: Veridian.
Dinnel, S. P., & Wiseman, W. J. (1986). Fresh-water on the Louisiana and
Texas shelf. Continental Shelf Research, 6, 765–784.
Garver, S. A., & Siegel, D. A. (1997). Inherent optical property inversion
of ocean color spectra and its biogeochemical interpretation: I. Time
Fig. 11. A comparison between Chl a concentrations estimated using the
power law Eq. (7) and the operational SeaWiFS algorithm (OC4v4) for a
SeaWiFS image of April 8, 2000 plotted against in situ measurements of
surface Chl a at six stations for the same day at the study site. The lines are
least squares fit to the data points (r2 = 0.88, n= 6).
E.J. D’Sa, R.L. Miller / Remote Sensing of Environment 84 (2003) 538–549548

series from the Sargasso Sea. Journal of Geophysical Research, 102,
18607–18625.
Gordon, H. R., Brown, O. B., Evans, R. H., Brown, J. W., Smith, R. C.,
Baker, K. S., & Clark, D. K. (1988). A semianalytic radiance model of
ocean color. Journal of Geophysical Research, 93, 10909–10924.
Gordon, H. R., & Wang, M. (1994). Retrieval of water-leaving radiance
and aerosol optical thickness over the oceans with SeaWiFS: a prelimi-
nary algorithm. Applied Optics, 33, 443–452.
Gould, R. W., Arnone, R. A., & Martinolich, P. M. (1999). Spectral de-
pendence of the scattering coefficient in case 1 and case 2 waters.
Applied Optics, 38, 2377–2383.
Kahru, M., & Mitchell, B. G. (2001). Seasonal and nonseasonal variability
of satellite-derived chlorophyll and colored dissolved organic matter
concentration in the California Current. Journal of Geophysical Re-
search, 106, 2517–2529.
Kishino, M., Takahasi, M., Okami, N., & Ichimura, S. (1985). Estimation
of the spectral absorption coefficients of phytoplankton in the sea.
Bulletin of Marine Science, 37, 634–642.
Lohrenz, S. E., Fahnenstiel, G. L., Redalje, D. G., Lang, G. A., Chen, X., &
Dagg, M. J. (1999). Variations in primary production of Northern Gulf
of Mexico continental shelf waters linked to nutrient inputs from the
Mississippi River. Marine Ecology Progress Series, 155, 435–454.
McCormick, N. J. (1995). Mathematical models for the mean cosine of irra-
diance and the diffuse attenuation coefficient. Limnology and Oceano-
graphy, 40, 1013–1018.
Miller, R. L., Belz, M., Del Castillo, C. E., & Trzaska, R. (2002). De-
termining CDOM absorption spectra in diverse aquatic environments
using a multiple pathlength, liquid core waveguide system. Continental
Shelf Research, 22, 1301–1310.
Miller, R. L., & D’Sa, E. J. (2002). Evaluating the influence of CDOM on
the remote sensing signal in the Mississippi River Bight. EOS Tran-
sactions AGU, Honolulu, HI (p. 171). AGU, Washington, DC.
Milliman, J. D., & Meade, R. H. (1983). World-wide delivery of river
sediment to the ocean. Journal of Geology, 91, 1–21.
Mitchell, B. G., & Kiefer, D. A. (1988). Variability in the pigment specific
fluorescence and absorption spectra in the northeastern Pacific Ocean.
Deep Sea Research, Part A, 35, 665–689.
Mobley, C. D. (1994). Light and water: radiative transfer in natural
waters. San Diego: Academic Press.
Mobley, C. D. (1999). Estimation of the remote-sensing reflectance from
above-surface measurements. Applied Optics, 38, 7442–7455.
Morel, A., & Gentili, B. (1991). Diffuse reflectance of oceanic waters: its
dependence on sun angle as influenced by the molecular scattering
contribution. Applied Optics, 30, 4427–4438.
Morel, A., & Gentili, B. (1996). Diffuse reflectance of oceanic waters: III.
Implication of bidirectionality for the remote-sensing problem. Applied
Optics, 35, 4850–4862.
Morel, A., &Maritorena, S. (2001). Bio-optical properties of oceanic waters:
a reappraisal. Journal of Geophysical Research, 106, 7163–7180.
Mueller, J. L., & Austin, R. W. (1995). Ocean optics protocols for SeaWiFS
validation, revision 1. In S. B. Hooker, & E. R. Firestone (Eds.), NASA
Tech. Memo. 104566, vol. 25 (pp. 1–67). Greenbelt, MD: NASA God-
dard Space Flight Center.
Muller-Karger, F. E., Walsh, J., Evans, R. H., & Meyers, M. B. (1991). On
the seasonal phytoplankton concentration and sea surface temperature
cycles of the Gulf of Mexico as determined by satellites. Journal of
Geophysical Research, 96, 12645–12665.
O’Reilly, J. E., Maritorena, S., Mitchell, G. G., Siegel, D. A., Carder,
K. L., Garver, S. A., Kahru, M., & McClain, C. (1998). Ocean color
algorithms for SeaWiFS. Journal of Geophysical Research, 103,
24937–24953.
Pegau, W. S., Gray, D., & Zaneveld, J. R. V. (1997). Absorption and
attenuation of visible and near-infrared light in water: dependence on
temperature and salinity. Applied Optics, 36, 6035–6046.
Pope, R. M., & Fry, E. S. (1997). Absorption spectrum (380–700 nm) of
pure water: II. Integrating cavity measurements. Applied Optics, 36,
8710–8723.
Rabalais, N. N., & Turner, R. E. (2001). Hypoxia in the Northern Gulf of
Mexico: description, causes and change. In N. N. Rabalais, & R. E.
Turner (Eds.), Coastal hypoxia: consequences for living resources and
ecosystems (pp. 1–36). Washington, DC: AGU.
Rabalais, N. N., Turner, R. E., Justic, D., Dortch, Q., Wiseman Jr., W. J.,
& Sen Gupta, B. K. (1996). Nutrient changes in the Mississippi River
and system responses on the adjacent continental shelf. Estuaries, 19,
386–407.
Redalje, D. G., Lohrenz, S. E., & Fahnenstiel, G. L. (1994). The relation-
ship between primary production and the vertical export of particulate
organic matter in a river-impacted coastal ecosystem. Estuaries, 17,
829–838.
Reynolds, R. A., Stramski, D., & Mitchell, B. G. (2001). A chlorophyll-
dependent semianalytical reflectance model derived from field measure-
ments of absorption and backscattering coefficients within the Southern
Ocean. Journal of Geophysical Research, 106, 7125–7138.
Smith, R. C., & Baker, K. S. (1981). Optical properties of the clearest
natural waters (200–800 nm). Applied Optics, 20, 177–184.
Tassan, S. (1994). Local algorithms using SeaWiFS data for the retrieval of
phytoplankton, pigments, suspended sediment, and yellow substance in
coastal waters. Applied Optics, 33, 2369–2377.
Twardowski, M. S., Sullivan, J. M., Donaghay, P. L., & Zaneveld, J. R. V.
(1999). Microscale quantification of the absorption by dissolved and
particulate material in coastal waters with an ac-9. Journal of Atmos-
pheric and Oceanic Technology, 16, 691–707.
Zaneveld, J.R.V., Kitchen, J.C., & Moore, C. (1994). The scattering error
correction of reflecting-tube absorption meters. In: J.S. Jaffe (Ed.), Pro-
ceedings of Ocean Optics XII ( pp. 44–55). SPIE.
E.J. D’Sa, R.L. Miller / Remote Sensing of Environment 84 (2003) 538–549 549