Vapor-phase synthesis of metallic and intermetallic ... synthesis of metallic and intermetallic...
23
1667 Pure Appl. Chem., Vol. 78, No. 9, pp. 1667–1689, 2006. doi:10.1351/pac200678091667 © 2006 IUPAC Vapor-phase synthesis of metallic and intermetallic nanoparticles and nanowires: Magnetic and catalytic properties* Garry Glaspell, Victor Abdelsayed, Khaled M. Saoud, and M. Samy El-Shall ‡ Department of Chemistry, Virginia Commonwealth University, Richmond, VA 23284-2006, USA Abstract: In this paper, we present several examples of the vapor-phase synthesis of inter- metallic and alloy nanoparticles and nanowires, and investigate their magnetic and catalytic properties. In the first example, we report the vapor-phase synthesis of intermetallic alu- minide nanoparticles. Specifically, FeAl and NiAl nanoparticles were synthesized via laser vaporization controlled condensation (LVCC) from their bulk powders. The NiAl nanoparti- cles were found to be paramagnetic at room temperature, with a blocking temperature of ap- proximately 15 K. The FeAl nanoparticles displayed room-temperature ferromagnetism. In the second example, we report the vapor-phase synthesis of cobalt oxide nanoparticle cata- lysts for low-temperature CO oxidation. The incorporation of Au and Pd nanoparticles into the cobalt oxide support leads to significantly improved catalytic activity and stability of the binary catalyst systems. Finally, we report the synthesis of nanowires of Ge, Mg, Pd, and Pt using the vapor–liquid–solid (VLS) method where the vapor-phase growth of the wire is cat- alyzed using a proper metal catalyst present in the liquid phase. Keywords: nanoparticles; alloys; intermetallic; magnetism; LVCC; catalysis; CO oxidation; vapor–liquid–solid growth; nanowires. INTRODUCTION It is now well established that nanoparticles (1–100 nm) exhibit unique chemical and physical proper- ties that differ from those of the corresponding bulk materials [1–4]. Due to their finite small size and the high surface-to-volume ratio, nanoparticles often exhibit novel, and sometimes unique properties. The characterization of these properties can ultimately lead to identifying many potential uses and ap- plications, ranging from catalysis, ceramics, microelectronics, sensors, pigments, and magnetic storage to drug delivery and biomedical applications. The applications of nanoparticles are thus expected to en- hance many fields of advanced technology particularly in the areas of catalysis, chemical and biologi- cal sensors, optoelectronics, drug delivery, and media storage. Recently, bimetallic alloy nanoparticles have gained significant interest due to new properties that arise from the combination of different com- positions of metals on the nanoscale. Their unique properties have been utilized in electronic, optical, and catalysis applications [1–4]. *Paper based on a presentation at the 3 rd IUPAC Workshop on Advanced Materials (WAM III), Stellenbosch, South Africa, 5–9 September 2005. Other presentations are published in this issue, pp. 1619–1801. ‡ Corresponding author: Tel.: (804) 828-3518; Fax: (804) 828-1280; E-mail: [email protected]
Transcript of Vapor-phase synthesis of metallic and intermetallic ... synthesis of metallic and intermetallic...

1667
Pure Appl. Chem., Vol. 78, No. 9, pp. 1667–1689, 2006.doi:10.1351/pac200678091667© 2006 IUPAC
Vapor-phase synthesis of metallic andintermetallic nanoparticles and nanowires:Magnetic and catalytic properties*
Garry Glaspell, Victor Abdelsayed, Khaled M. Saoud, andM. Samy El-Shall‡
Department of Chemistry, Virginia Commonwealth University, Richmond,VA 23284-2006, USA
Abstract: In this paper, we present several examples of the vapor-phase synthesis of inter-metallic and alloy nanoparticles and nanowires, and investigate their magnetic and catalyticproperties. In the first example, we report the vapor-phase synthesis of intermetallic alu-minide nanoparticles. Specifically, FeAl and NiAl nanoparticles were synthesized via laservaporization controlled condensation (LVCC) from their bulk powders. The NiAl nanoparti-cles were found to be paramagnetic at room temperature, with a blocking temperature of ap-proximately 15 K. The FeAl nanoparticles displayed room-temperature ferromagnetism. Inthe second example, we report the vapor-phase synthesis of cobalt oxide nanoparticle cata-lysts for low-temperature CO oxidation. The incorporation of Au and Pd nanoparticles intothe cobalt oxide support leads to significantly improved catalytic activity and stability of thebinary catalyst systems. Finally, we report the synthesis of nanowires of Ge, Mg, Pd, and Ptusing the vapor–liquid–solid (VLS) method where the vapor-phase growth of the wire is cat-alyzed using a proper metal catalyst present in the liquid phase.
Keywords: nanoparticles; alloys; intermetallic; magnetism; LVCC; catalysis; CO oxidation;vapor–liquid–solid growth; nanowires.
INTRODUCTION
It is now well established that nanoparticles (1–100 nm) exhibit unique chemical and physical proper-ties that differ from those of the corresponding bulk materials [1–4]. Due to their finite small size andthe high surface-to-volume ratio, nanoparticles often exhibit novel, and sometimes unique properties.The characterization of these properties can ultimately lead to identifying many potential uses and ap-plications, ranging from catalysis, ceramics, microelectronics, sensors, pigments, and magnetic storageto drug delivery and biomedical applications. The applications of nanoparticles are thus expected to en-hance many fields of advanced technology particularly in the areas of catalysis, chemical and biologi-cal sensors, optoelectronics, drug delivery, and media storage. Recently, bimetallic alloy nanoparticleshave gained significant interest due to new properties that arise from the combination of different com-positions of metals on the nanoscale. Their unique properties have been utilized in electronic, optical,and catalysis applications [1–4].
*Paper based on a presentation at the 3rd IUPAC Workshop on Advanced Materials (WAM III), Stellenbosch, South Africa,5–9 September 2005. Other presentations are published in this issue, pp. 1619–1801.‡Corresponding author: Tel.: (804) 828-3518; Fax: (804) 828-1280; E-mail: [email protected]

The work presented in this paper deals with the vapor-phase synthesis of different classes ofnanostructured materials. The vapor-phase synthesis of nanoparticles involves the generation of thevapor of the material of interest, followed by the condensation of clusters and nanoparticles from thevapor phase [5]. The vapor may be generated by thermal, laser, electron beam, etc. evaporation.Different sources of energy can be used to decompose the precursor such as microwave plasma, laserpyrolysis, laser photolysis, combustion flame, etc. The size of the nanoparticle is determined by the par-ticle residence time, temperature of the vapor, precursor composition, and pressure. Low-temperatureflames can also be used to supply the energy to decompose the precursors. Flame synthesis is most com-mon for the production of oxides [1–4]. For the synthesis of metal nanoparticles, inert gas condensa-tion has been typically used [3,4]. In spite of the success of this method, there are, however, some prob-lems and limitations, such as: possible reactions between metal vapors and oven materials,inhomogeneous heating which can limit the control of particle size distribution, limited success with re-fractory metals due to low vapor pressures, and difficulties in controlling the composition of the mixedmetal particles due to the difference in composition between the alloys and the mixed vapors.
Laser vaporization provides several advantages over other heating methods such as the produc-tion of a high-density vapor of any metal, the generation of a directional high-speed metal vapor fromthe solid target which can be useful for directional deposition of the particles, the control of the evapo-ration from specific spots on the target as well as the simultaneous or sequential evaporation of severaldifferent targets [4]. Recently, we described a novel technique to synthesize nanoparticles of controlledsize and composition [5–12]. Our technique combines the advantages of pulsed laser vaporization withcontrolled condensation (LVCC) in a diffusion cloud chamber under well-defined conditions of temp-erature and pressure. It allows the synthesis of a wide variety of nanoparticles of metal oxides, carbides,and nitrides.
In this paper, we present three examples of the synthesis of nanoparticles and assemblies ofnanoparticles and discuss their selected properties. In the first example, we focus on the synthesis ofintermetallic NiAl and FeAl nanoparticles and the characterization of their magnetic properties.Intermetallic aluminides of nickel and iron alloys have many important applications, especially forhigh-temperature structural applications due to their high melting points and thermal conductivity.These materials are further characterized by a low density, a high strength-to-weight ratio, and corro-sion and oxidation resistance especially at high temperatures [13–16]. However, their poor room-tem-perature ductility and low high-temperature strength limit their usage [17,18]. Interestingly, nano-particles prepared from these materials were proposed to overcome the bulk materials limitations. Forexample, iron aluminide and nickel aluminide nanoparticles exhibit room-temperature ductility andsuperplasticity [19–21]. Consolidated nanoparticles may show enhanced plasticity, i.e., they may ex-hibit exceptionally large tensile elongation during stretching compared with conventional materials[19–22]. With smaller grain sizes, it is expected that superior mechanical properties can be achievedwhich would enhance the room-temperature ductility and the high-temperature strength of the iron andnickel aluminides. Recently, we reported the vapor-phase synthesis of iron aluminide nanocrystals frombulk iron aluminide alloy targets using the LVCC method [10,23,24]. In the present work, we describea different approach for the synthesis of FeAl and NiAl intermetallic nanoparticles through laser va-porization of targets made from mixtures of the elemental metallic powders with controlled composi-tions.
In the second example, we report the vapor-phase synthesis of Co oxide nanoparticles and the in-corporation of Au and Pd nanoparticles within the Co oxide support as efficient catalysts for low-tem-perature oxidation of carbon monoxide. The monitoring and detection of environmental pollution andcontamination by various harmful gases is one of the most important applications of nanoparticles[25–27]. Nanophase metal and metal oxide catalysts, with controlled particle size, high surface area,and more densely populated unsaturated surface coordination sites could potentially provide signifi-cantly improved catalytic performance over conventional catalysts [25–27]. The large number of sur-face and edge atoms provides active sites for catalyzing surface reactions. Research in this area is mo-
G. GLASPELL et al.
© 2006 IUPAC, Pure and Applied Chemistry 78, 1667–1689
1668

tivated by the possibility of designing nanostructured catalysts that possess novel catalytic propertiessuch as low-temperature activity, selectivity, stability, and resistance to poisoning and degradation ef-fects [27–34]. Such catalysts are essential for technological advances in environmental protection, im-proving indoor air quality, and in chemical synthesis and processing. For example, the low-temperatureoxidation of carbon monoxide is one of the current important environmental issues since small expo-sure (ppm) to this odorless invisible gas can be lethal [35].
Although Au is a noble metal and is known to be a chemically inert, it has been shown that it canbe used as an active catalyst for a variety of reactions, including CO oxidation, selective hydrogenationof unsaturated hydrocarbons, and selective reduction of NO by hydrocarbons in the presence of a highconcentration of oxygen [36–40]. Haruta et al. have shown that supported Au nanoparticle catalystswith a particle size between 2 and 5 nm, are exceptionally active for low-temperature CO oxidation[37,38,41]. When compared to highly dispersed Pt, the Au-based catalysts are an order of magnitudemore active [38]. The catalytic activity of the Au-based catalysts for low-temperature CO oxidation de-pends on various factors such as the type of the support, the Au precursor, the preparation conditions,the pretreatment conditions and the catalytic reaction conditions [42–45]. For example, it has beenshown that the activity of an Au/TiO2 catalyst is very sensitive to water vapor pressure [42]. In othercatalyst systems such as Au/Al2O3, water is needed to obtain good catalytic activity and the presenceof hydrogen prevents the catalyst deactivation [45]. It is, therefore, interesting to investigate the cat-alytic activity of nanoparticle catalysts prepared by the LVCC method in the absence of any chemicalprecursors or solvents [12]. We also present results for the catalytic activity of unsupported bimetallicalloy nanoparticles prepared by the LVCC method. Our goal here is to demonstrate that the LVCCmethod can provide a simple and yet effective synthetic route for supported and unsupported contami-nation-free, crystalline nanoparticle catalysts.
Finally, in the third example we present the synthesis of Mg, Pd, and Pt nanowires using thevapor–liquid–solid (VLS) method [46–50]. In this approach, a liquid binary metal cluster acts as a cat-alyst for the absorption of gas-phase species of the desired wire material. The equilibrium phase dia-gram is used to rationally choose the catalyst material and the growth conditions so that there is a co-existence of liquid alloy (catalyst) and solid nanowire material. Wire formation is possible when theclusters become saturated with the building material (the metal selected to form wires) from the vaporphase, resulting in precipitation of the wire. Ultimately, the growth terminates when the nanowires aretransferred out of the high-temperature region where the metal catalyst can exist in the liquid state.
In the present work, we report on the synthesis of Ge, Mg, Pd, and Pt nanowires and investigatethe factors that determine the dimensions of the resulting wires. Magnesium nanowires may find im-portant applications for hydrogen storage due to the high storage capacity of 7.6 wt % hydrogen in thelight-weight magnesium metal [51]. Nanowires, in general, represent ideal systems for dimension-de-pendent optical, electrical, and mechanical properties, and are expected to play an important role asbuilding blocks in devices and processes such as light-emitting diodes, solar cells, single electron tran-sistors, lasers, and biological labels [46–50,52–54].
EXPERIMENTAL METHODS
The intermetallic and alloy nanoparticles and the supported nanoparticle catalysts were prepared usingthe LVCC method as described previously in several references [5–12]. Here, we only provide the nec-essary information relevant to the preparation of the alloy nanoparticles and supported nanoparticle cat-alysts. A sketch of the chamber with the relevant components for the production of nanoparticles isshown in Fig. 1A. The chamber consists of two horizontal, circular stainless steel plates, separated bya glass ring. A metal target of interest is set on the lower plate, and the chamber is filled with a purecarrier gas such as Ar (99.99 % pure). The metal target and the lower plate are maintained at a temper-ature higher than that of the upper one. The top plate can be cooled to less than 150 K by circulatingliquid nitrogen. The large temperature gradient between the bottom and top plates results in a steady
© 2006 IUPAC, Pure and Applied Chemistry 78, 1667–1689
Vapor-phase synthesis of nanomaterials 1669
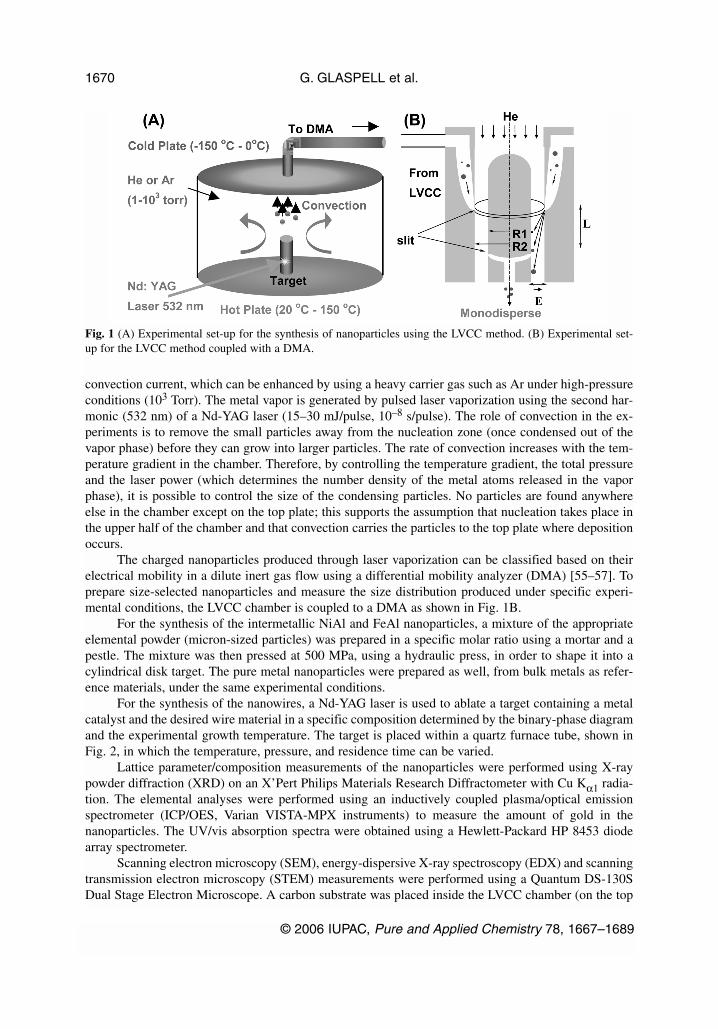
convection current, which can be enhanced by using a heavy carrier gas such as Ar under high-pressureconditions (103 Torr). The metal vapor is generated by pulsed laser vaporization using the second har-monic (532 nm) of a Nd-YAG laser (15–30 mJ/pulse, 10–8 s/pulse). The role of convection in the ex-periments is to remove the small particles away from the nucleation zone (once condensed out of thevapor phase) before they can grow into larger particles. The rate of convection increases with the tem-perature gradient in the chamber. Therefore, by controlling the temperature gradient, the total pressureand the laser power (which determines the number density of the metal atoms released in the vaporphase), it is possible to control the size of the condensing particles. No particles are found anywhereelse in the chamber except on the top plate; this supports the assumption that nucleation takes place inthe upper half of the chamber and that convection carries the particles to the top plate where depositionoccurs.
The charged nanoparticles produced through laser vaporization can be classified based on theirelectrical mobility in a dilute inert gas flow using a differential mobility analyzer (DMA) [55–57]. Toprepare size-selected nanoparticles and measure the size distribution produced under specific experi-mental conditions, the LVCC chamber is coupled to a DMA as shown in Fig. 1B.
For the synthesis of the intermetallic NiAl and FeAl nanoparticles, a mixture of the appropriateelemental powder (micron-sized particles) was prepared in a specific molar ratio using a mortar and apestle. The mixture was then pressed at 500 MPa, using a hydraulic press, in order to shape it into acylindrical disk target. The pure metal nanoparticles were prepared as well, from bulk metals as refer-ence materials, under the same experimental conditions.
For the synthesis of the nanowires, a Nd-YAG laser is used to ablate a target containing a metalcatalyst and the desired wire material in a specific composition determined by the binary-phase diagramand the experimental growth temperature. The target is placed within a quartz furnace tube, shown inFig. 2, in which the temperature, pressure, and residence time can be varied.
Lattice parameter/composition measurements of the nanoparticles were performed using X-raypowder diffraction (XRD) on an X’Pert Philips Materials Research Diffractometer with Cu Kα1 radia-tion. The elemental analyses were performed using an inductively coupled plasma/optical emissionspectrometer (ICP/OES, Varian VISTA-MPX instruments) to measure the amount of gold in thenanoparticles. The UV/vis absorption spectra were obtained using a Hewlett-Packard HP 8453 diodearray spectrometer.
Scanning electron microscopy (SEM), energy-dispersive X-ray spectroscopy (EDX) and scanningtransmission electron microscopy (STEM) measurements were performed using a Quantum DS-130SDual Stage Electron Microscope. A carbon substrate was placed inside the LVCC chamber (on the top
G. GLASPELL et al.
© 2006 IUPAC, Pure and Applied Chemistry 78, 1667–1689
1670
Fig. 1 (A) Experimental set-up for the synthesis of nanoparticles using the LVCC method. (B) Experimental set-up for the LVCC method coupled with a DMA.
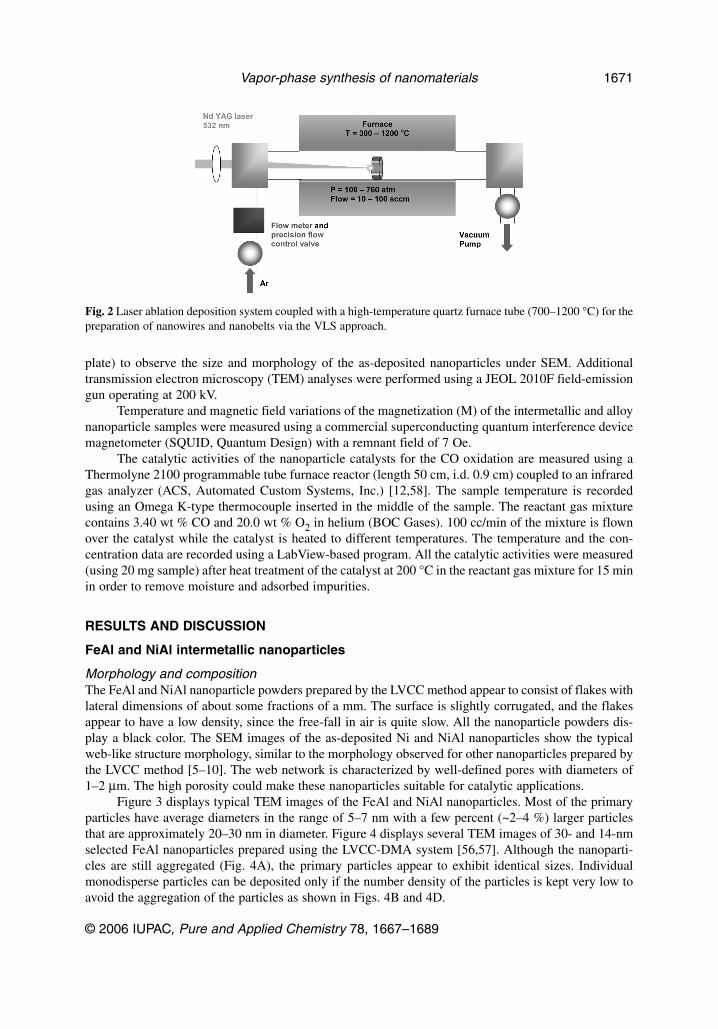
plate) to observe the size and morphology of the as-deposited nanoparticles under SEM. Additionaltransmission electron microscopy (TEM) analyses were performed using a JEOL 2010F field-emissiongun operating at 200 kV.
Temperature and magnetic field variations of the magnetization (M) of the intermetallic and alloynanoparticle samples were measured using a commercial superconducting quantum interference devicemagnetometer (SQUID, Quantum Design) with a remnant field of 7 Oe.
The catalytic activities of the nanoparticle catalysts for the CO oxidation are measured using aThermolyne 2100 programmable tube furnace reactor (length 50 cm, i.d. 0.9 cm) coupled to an infraredgas analyzer (ACS, Automated Custom Systems, Inc.) [12,58]. The sample temperature is recordedusing an Omega K-type thermocouple inserted in the middle of the sample. The reactant gas mixturecontains 3.40 wt % CO and 20.0 wt % O2 in helium (BOC Gases). 100 cc/min of the mixture is flownover the catalyst while the catalyst is heated to different temperatures. The temperature and the con-centration data are recorded using a LabView-based program. All the catalytic activities were measured(using 20 mg sample) after heat treatment of the catalyst at 200 °C in the reactant gas mixture for 15 minin order to remove moisture and adsorbed impurities.
RESULTS AND DISCUSSION
FeAl and NiAl intermetallic nanoparticles
Morphology and compositionThe FeAl and NiAl nanoparticle powders prepared by the LVCC method appear to consist of flakes withlateral dimensions of about some fractions of a mm. The surface is slightly corrugated, and the flakesappear to have a low density, since the free-fall in air is quite slow. All the nanoparticle powders dis-play a black color. The SEM images of the as-deposited Ni and NiAl nanoparticles show the typicalweb-like structure morphology, similar to the morphology observed for other nanoparticles prepared bythe LVCC method [5–10]. The web network is characterized by well-defined pores with diameters of1–2 µm. The high porosity could make these nanoparticles suitable for catalytic applications.
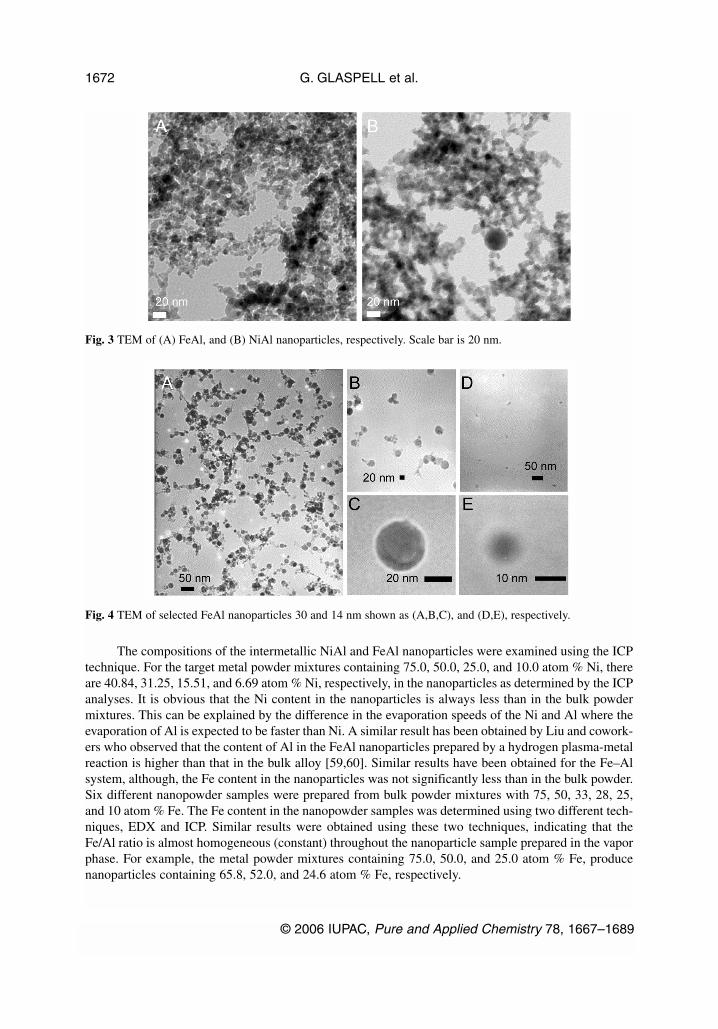
Figure 3 displays typical TEM images of the FeAl and NiAl nanoparticles. Most of the primaryparticles have average diameters in the range of 5–7 nm with a few percent (~2–4 %) larger particlesthat are approximately 20–30 nm in diameter. Figure 4 displays several TEM images of 30- and 14-nmselected FeAl nanoparticles prepared using the LVCC-DMA system [56,57]. Although the nanoparti-cles are still aggregated (Fig. 4A), the primary particles appear to exhibit identical sizes. Individualmonodisperse particles can be deposited only if the number density of the particles is kept very low toavoid the aggregation of the particles as shown in Figs. 4B and 4D.
© 2006 IUPAC, Pure and Applied Chemistry 78, 1667–1689
Vapor-phase synthesis of nanomaterials 1671
Fig. 2 Laser ablation deposition system coupled with a high-temperature quartz furnace tube (700–1200 °C) for thepreparation of nanowires and nanobelts via the VLS approach.
The compositions of the intermetallic NiAl and FeAl nanoparticles were examined using the ICPtechnique. For the target metal powder mixtures containing 75.0, 50.0, 25.0, and 10.0 atom % Ni, thereare 40.84, 31.25, 15.51, and 6.69 atom % Ni, respectively, in the nanoparticles as determined by the ICPanalyses. It is obvious that the Ni content in the nanoparticles is always less than in the bulk powdermixtures. This can be explained by the difference in the evaporation speeds of the Ni and Al where theevaporation of Al is expected to be faster than Ni. A similar result has been obtained by Liu and cowork-ers who observed that the content of Al in the FeAl nanoparticles prepared by a hydrogen plasma-metalreaction is higher than that in the bulk alloy [59,60]. Similar results have been obtained for the Fe–Alsystem, although, the Fe content in the nanoparticles was not significantly less than in the bulk powder.Six different nanopowder samples were prepared from bulk powder mixtures with 75, 50, 33, 28, 25,and 10 atom % Fe. The Fe content in the nanopowder samples was determined using two different tech-niques, EDX and ICP. Similar results were obtained using these two techniques, indicating that theFe/Al ratio is almost homogeneous (constant) throughout the nanoparticle sample prepared in the vaporphase. For example, the metal powder mixtures containing 75.0, 50.0, and 25.0 atom % Fe, producenanoparticles containing 65.8, 52.0, and 24.6 atom % Fe, respectively.
G. GLASPELL et al.
© 2006 IUPAC, Pure and Applied Chemistry 78, 1667–1689
1672
Fig. 3 TEM of (A) FeAl, and (B) NiAl nanoparticles, respectively. Scale bar is 20 nm.
Fig. 4 TEM of selected FeAl nanoparticles 30 and 14 nm shown as (A,B,C), and (D,E), respectively.

The XRD patterns for Ni and Al nanoparticles have four strong lines assigned to reflections fromthe 111, 200, 220, and 311 planes at scattering angles (2θ) of 44.49, 51.81, 76.41, and 92.89, respec-tively, for Ni and 38.47, 44.71, 65.09, and 78.21, respectively, for Al. The lattice constants, assuming acubic unit cell, for Ni and Al nanoparticles were calculated to be 3.5242 and 4.0495, compared to 3.523and 4.0494 for the bulk materials, respectively [61]. The XRD pattern for nanoparticles’ sample ob-tained following the ablation of the Ni–Al powder mixture (51.8 atom % Ni) is shown in Fig. 5 alongwith the XRD patterns for pure Ni and Al nanoparticles. It is clear that the XRD pattern of the NiAlsample does not match any of the XRD peaks of pure Ni or Al nanoparticles. However, it matches thediffraction pattern of bulk Ni0.58Al0.42 alloy [61], which means that NiAl intermetallic nanoparticleswere formed in the vapor phase using the LVCC method. The strong diffraction lines at the scatteringangles (2θ) of 31.11, 44.63, 64.97, and 82.27 were assigned to the diffraction from 100, 110, 200, and211 planes, respectively, of the B2 crystal structure of NiAl. The calculated lattice parameter for NiAlnanoparticles (2.868) is in good agreement with bulk lattice parameter (2.871) [61].
A mixture of Ni and Al nanoparticles, as the major product, was produced from the vaporizationof a powder mixture with (75 atom % Ni), as identified from the XRD data. When the molar percent-age of Ni was decreased to 50 atom % in the target, alloy nanoparticles NiAl were obtained, and the ab-sence of pure Ni and/or Al nanoparticles was evident. The alloy nanoparticles were assigned toNi0.9Al1.1 as identified from the XRD pattern which matched the pattern of the Ni0.9Al1.1 bulk alloy[61]. A mixture of pure Al and intermetallic Ni0.9Al1.1 nanoparticles was obtained when a target with25.0 and 10 atom % Ni was vaporized in the LVCC chamber. A mixture with more Al nanoparticleswas obtained from 10.0 atom % Ni target as compared to that prepared from the 25.0 atom % Ni tar-get. It is evident that only one intermetallic phase (NiAl) is obtained in the preparation of Ni/Alnanoparticles using targets consisting of mixtures of Ni and Al bulk powders. However, by increasingthe molar ratio of Al or Ni content, alloy nanoparticles, in addition to the pure components (dependingon which metal is in excess) are obtained. This result can be explained by the greater stability of theNiAl phase compared to other nickel aluminide phases such as NiAl3, Ni2Al3, and Ni3Al, since theNiAl phase has the highest heat of formation [62,63].
© 2006 IUPAC, Pure and Applied Chemistry 78, 1667–1689
Vapor-phase synthesis of nanomaterials 1673
Fig. 5 XRD of (a) NiAl, (b) Ni, and (c) Al nanoparticles prepared by the LVCC method.

The XRD pattern for the nanocrystalline sample prepared from (50:50 atom %) of Fe and Almetallic powder mixture is shown in Fig. 6, along with the diffraction patterns of pure Fe and Alnanoparticles. Neither the Fe nor Al diffraction pattern matched the nanopowder sample patterns pre-pared from the Fe–Al (50:50) powder mixture. By comparing the XRD data to the database, goodagreement was found between the XRD patterns of prepared nanopowder and bulk Fe0.5Al0.5 inter-metallic alloy [61]. The observed prominent peaks at scattering angles (2θ) of 30.91, 44.15, 64.23, and81.27 are assigned to scattering from the 100, 110, 200, and 211 planes, respectively, of the FeAl crys-tal lattice [61].
Effects of electric and magnetic fieldsApplication of an electric field between the bottom and top plates of the LVCC chamber during thepreparation of the metallic and intermetallic nanoparticles results in the formation of filaments andfibers [11]. The nanoparticles aggregate as little chains and stack end to end. Generally, the chains growperpendicular on the top and bottom plates of the LVCC chamber. Eventually, the chains bridge the topand bottom metal plates (electrodes), indicating that both negatively and positively charged particles areinvolved. The XRD of the nanoparticles of the chain aggregates are similar to those obtained from thenanoparticles prepared in the absence of the field, thus indicating that the field has no effect on the com-position of the nanoparticles.
Figures 7a and 7b display SEM images of the as-deposited Fe and Ni filaments on glass slidesplaced on the top plate of the LVCC chamber. It is clear that the filament and fiber morphology is quitedifferent from the web-like morphology observed with no electric field applied during the experiment.
The electrostatic aggregation is attributed to dipole forces between nanoparticles to form chainaggregates, and between the chain aggregates to form tree-like filaments. The filament- and tree-likeaggregates may have some special applications as fillers (additives) to increase the elastic modulus andtensile strength of polymers such as low-strength rubbers. This may allow for stronger interactions be-tween the polymer chains and the nanoparticle chain aggregates [11].
G. GLASPELL et al.
© 2006 IUPAC, Pure and Applied Chemistry 78, 1667–1689
1674
Fig. 6 XRD of (a) Fe0.5Al0.5, (b) Fe, and (c) Al nanoparticles prepared by the LVCC method.

We have also observed a strong orientation effect resulting from the application of a magneticfield during the preparation of Fe nanoparticles. Figure 8 displays SEM images of as deposited Fenanoparticles in the presence of a weak magnetic field (0.4 Tesla). It is clear that the nano-particles as-semble in the form of long chains under the influence of the magnetic field. The combination of elec-tric and magnetic fields can lead to the formation of assembled arrays of nanoparticles which may pro-vide a simple means of constructing three-dimensional structures for device applications.
© 2006 IUPAC, Pure and Applied Chemistry 78, 1667–1689
Vapor-phase synthesis of nanomaterials 1675
Fig. 7a SEM micrographs of Fe nanoparticles deposited in the absence (left image) and presence of electric field(200 V/cm) (right image).
Fig. 7b SEM micrographs of Ni filament nanoparticles prepared under the influence of an electric field (60 V/cm).

Magnetic propertiesWe have previously reported that nanoparticles generated from a paramagnetic FeAl target display fer-romagnetism [10]. Thus, we have extended this study to investigate the magnetic properties of FeAlnanoparticles generated in the vapor phase by vaporization of a target consisting of the Fe and Al bulkpowders as decribed above. SQUID measurements of the temperature variation of the moment χ for theFeAl nanoparticles display ferromagnetism similar to nanoparticles generated from the alloyed targetas shown in Fig. 9A. Hysteresis loops, shown in Fig. 9B, were measured for temperatures ranging from5 to 300 K. The coercivity at 300 and 5 K were found to be 50 and 650 Oe, respectively similar to thevalues previously reported [10].
SQUID measurements reveal that the NiAl nanoparticles are predominately superparamagnetic.Zero-field-cooled (ZFC) measurements reveal a blocking temperature TB of approximately 15 K, belowwhich hysteresis is observed with a coercivity of approximately 325 Oe, as shown in Fig. 10. The slopeof the temperature variation of χ below the blocking temperature for the field-cooled (FC) data is rep-resentative of noninteracting particles, and the convergence of the FC spectra at the blocking tempera-ture is suggestive that the nanoparticles are of uniform size. The average magnetic size domain can bedetermined from the slope of the magnetization near zero field with the major contributions arising fromthe largest particles. Using eq. 1 below, where k = Boltzmnn constant, T = temperature, dM/dH = the
G. GLASPELL et al.
© 2006 IUPAC, Pure and Applied Chemistry 78, 1667–1689
1676
Fig. 8 TEM image of Fe nanoparticles produced by the LVCC method in the presence of a 0.4 Tesla magnetic field.
Fig. 9 Temperature dependence of the magnetic susceptibility (χ) for FeAl under FC and ZFC conditions (A) andM vs H variation measured at 5 K (B).

slope near zero field, Ms is the saturation magnetization (assumed here to be bulk Ni with the acceptedvalue of 253 emu/g) and ρ = bulk density, an upper bound for the magnetic domain size was determinedto be approximately 3 Å [64,65]. From the Curie-constant C = 1.4 × 10⁻² (emu-K/gOe) (C = Nµ2/3kBwith N being the number of magnetic ions/g, kB = Boltzmann constant and µ = magnetic moment),µ(Ni) = 3.0 µB is obtained. This magnitude of µ is slightly lower than the accepted value of 3.2 for thespin state of Ni2+.
(1)
In conclusion, the results reported here clearly indicate that nanoparticles of FeAl and NiAl canbe synthesized in the vapor phase via the LVCC method from their bulk counterparts. SEM data indi-cates that the as-prepared samples exhibit a web-like morphology which may be suitable for catalyticapplications. XRD analysis reveals that by carefully controlling the stoichiometry of the starting mate-rials, single-phase alloys can be produced without any indication of the presence of the starting materi-als. EDX and ICP were also employed to confirm the composition of the alloyed products. Finally,SQUID measurements revealed that the FeAl nanoparticles prepared in the vapor phase from the ele-mental Fe and Al powder mixture displayed similar characteristics to nanoparticles formed from abla-tion of an intermetallic bulk target [10].
Nanoparticle catalysts for CO oxidation
As mentioned in the introduction, the recent advances in the synthesis and characterization of nanoscalematerials have promoted an extensive search for methods to prepare highly efficient nanostructured cat-alysts for the removal of chemical contaminants and harmful gases such as sulfur dioxide and carbonmonoxide [26–31]. In this section, we present the vapor-phase synthesis and characterization of Au- andPd-doped cobalt oxide and bimetallic alloy nanoparticle catalysts for CO oxidation. Using the LVCCmethod, the nanoparticle catalysts are prepared from micron-sized commercial metal powders. Thismethod allows us to explore the effect of pre-oxidation on the catalytic activity simply by varying theamount of oxygen present during the preparation of the catalyst. Furthermore, the method does not in-volve the use of any chemical precursors or solvents, and, therefore, it provides a simple and yet effec-
© 2006 IUPAC, Pure and Applied Chemistry 78, 1667–1689
Vapor-phase synthesis of nanomaterials 1677
Fig. 10 Temperature dependence of the magnetic susceptibility (χ) for NiAl under FC and ZFC conditions (A) andM vs. H variation measured at 5 K (B).
dk T
dM
dH
Mmax =
182
� ��
�π ρ s
1
3

tive synthetic route for supported and unsupported contamination-free, crystalline nanoparticle catalysts[12,57].
Cobalt oxide, Au- and Pd-doped cobalt oxide catalystsFigure 11 displays TEM images of (A) Co nanoparticles prepared in an Ar atmosphere in the absenceof O2 and (B) Co oxide nanoparticles prepared in 50 % O2 in Ar using the LVCC method. The averageparticle size for pure Co was ~19 and ~32 nm for Co ablated in oxygen.
The XRD patterns of the nanoparticles prepared in the absence and presence of O2, shown inFigs. 12A and 12B, match well the patterns of Co (ICCD 01-089-7093) and CoO (ICCD 01-075-0533),respectively [61]. It is significant to note that when Co is ablated in the presence of O2, only CoO isformed with no evidence of the presence of other cobalt oxide phases such as Co3O4. However, afterthe heat treatment in the reactant gas mixture (4 wt % CO and 20.0 wt % O2 in helium), the Co nanopar-ticles are converted into the Co3O4 phase as shown from the XRD data in Fig. 12A, while the CoOnanoparticles result in a mixture of Co3O4 and CoO.
Interestingly, the activity of the Co nanoparticles prepared in the presence of oxygen increaseswith increasing the % of oxygen used during the LVCC synthesis. As shown in Fig. 13, the as-preparedCo nanoparticles (using Ar as a carrier gas with no O2 present) exhibit 50 and 97 % conversions of COto CO2 at temperatures of 125 and 145 °C, respectively. However, the Co nanoparticles prepared using5 % O2 in Ar show 50 and 97 % conversions of CO to CO2 at temperatures of 110 and 120 °C, re-spectively. For the samples prepared in 50 and 100 % O2 (CoO as shown from the XRD data), 84 and100 % conversions, respectively, are observed at room temperature (25 °C). The XRD data shown in
G. GLASPELL et al.
© 2006 IUPAC, Pure and Applied Chemistry 78, 1667–1689
1678
Fig. 11 TEM micrographs of as-prepared Co (A) and CoO (B). The scale bars are 100 and 50 nm, respectively.
Fig. 12 XRD patterns for (A) the as-prepared Co and (B) Co generated in 50 % O2 before and after catalysis.
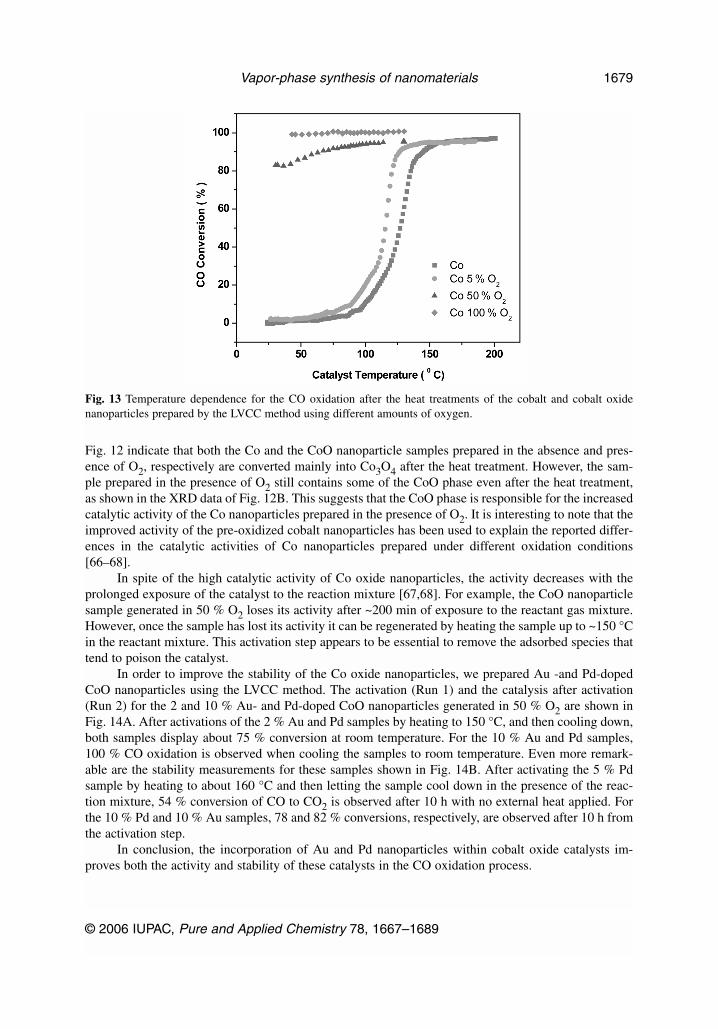
Fig. 12 indicate that both the Co and the CoO nanoparticle samples prepared in the absence and pres-ence of O2, respectively are converted mainly into Co3O4 after the heat treatment. However, the sam-ple prepared in the presence of O2 still contains some of the CoO phase even after the heat treatment,as shown in the XRD data of Fig. 12B. This suggests that the CoO phase is responsible for the increasedcatalytic activity of the Co nanoparticles prepared in the presence of O2. It is interesting to note that theimproved activity of the pre-oxidized cobalt nanoparticles has been used to explain the reported differ-ences in the catalytic activities of Co nanoparticles prepared under different oxidation conditions[66–68].
In spite of the high catalytic activity of Co oxide nanoparticles, the activity decreases with theprolonged exposure of the catalyst to the reaction mixture [67,68]. For example, the CoO nanoparticlesample generated in 50 % O2 loses its activity after ~200 min of exposure to the reactant gas mixture.However, once the sample has lost its activity it can be regenerated by heating the sample up to ~150 °Cin the reactant mixture. This activation step appears to be essential to remove the adsorbed species thattend to poison the catalyst.
In order to improve the stability of the Co oxide nanoparticles, we prepared Au -and Pd-dopedCoO nanoparticles using the LVCC method. The activation (Run 1) and the catalysis after activation(Run 2) for the 2 and 10 % Au- and Pd-doped CoO nanoparticles generated in 50 % O2 are shown inFig. 14A. After activations of the 2 % Au and Pd samples by heating to 150 °C, and then cooling down,both samples display about 75 % conversion at room temperature. For the 10 % Au and Pd samples,100 % CO oxidation is observed when cooling the samples to room temperature. Even more remark-able are the stability measurements for these samples shown in Fig. 14B. After activating the 5 % Pdsample by heating to about 160 °C and then letting the sample cool down in the presence of the reac-tion mixture, 54 % conversion of CO to CO2 is observed after 10 h with no external heat applied. Forthe 10 % Pd and 10 % Au samples, 78 and 82 % conversions, respectively, are observed after 10 h fromthe activation step.
In conclusion, the incorporation of Au and Pd nanoparticles within cobalt oxide catalysts im-proves both the activity and stability of these catalysts in the CO oxidation process.
© 2006 IUPAC, Pure and Applied Chemistry 78, 1667–1689
Vapor-phase synthesis of nanomaterials 1679
Fig. 13 Temperature dependence for the CO oxidation after the heat treatments of the cobalt and cobalt oxidenanoparticles prepared by the LVCC method using different amounts of oxygen.

Bimetallic nanoparticle catalystsSeveral unsupported bimetallic nanoparticles such as PdxAu1–x, PdxCu1–x, AuxCu1–x and AuxAg1–xwith controlled compositions have been prepared by the LVCC method from mixed metal targets andthe elemental compositions of the resulting alloy nanoparticles have been determined using the ICPtechnique. Figure 15 displays typical examples of the TEM images of the AuPd and AuCu alloynanoparticles.
The XRD data provides direct evidence for the preparation of bimetallic alloy nanoparticles andnot simply a mixture of the two metal nanoparticles. For example, the XRD diffraction pattern of thebimetallic Pd0.6Au0.4, nanoparticles, shown in Fig. 16A, confirms the formation of an alloy in the vaporphase without any indication of the presence of pure Pd or pure Au nanoparticles. The XRD pattern ofthe Pd0.6Au0.4 alloy is quite different from the pattern obtained for a physical mixture of Pd and Aunanoparticles shown in Fig. 16B. Furthermore, the XRD obtained following the catalysis test on thePd + Au nanoparticle mixture shows the formation of PdO, as shown in Fig. 16C, thus indicating thata significant amount of the free Pd nanoparticles in the mixture are oxidized to PdO by the reaction withO2 present in the CO reactant mixture. Interestingly, the XRD of the PdxAu1–x alloy nanoparticles isidentical before and after the catalysis test with no new peaks observed, thus confirming that the sam-ple does not contain free Pd nanoparticles. Figure 17A displays a comparison between the XRD data of
G. GLASPELL et al.
© 2006 IUPAC, Pure and Applied Chemistry 78, 1667–1689
1680
Fig. 14 (A) Temperature dependence for the CO oxidation on Au- and Pd-doped CoO nanoparticles. (B) Stabilitymeasurements for the Au- and Pd-doped CoO nanoparticle samples.
Fig. 15 TEM micrographs of as-prepared AuPd (A) and AuCu (B) alloy nanoparticles.

the Pd0.12 Au0.88 and Pd0.35Au0.65 alloy nanoparticles and the XRD patterns of pure Au and Pdnanoparticles. It is clear that all the diffraction peaks in the alloy nanoparticles are observed at 2θ val-ues that lie between the corresponding values of the pure components and gradually shift between thesevalues depending on the composition of the alloy. These results demonstrate that alloy nanoparticleswith well-defined compositions can be prepared by the LVCC method.
The CO oxidations over several bimetallic nanoparticles, shown in Fig. 17B, reveal some inter-esting observations. First, the activity of the unsupported bimetallic nanoparticles can be tuned to thedesired performance depending on the composition of the catalyst. For example, the 3, 50, and 100 %CO conversions occur at the temperatures of 38, 119, and 145 °C for the bimetallic Cu0.90Au0.10,
© 2006 IUPAC, Pure and Applied Chemistry 78, 1667–1689
Vapor-phase synthesis of nanomaterials 1681
Fig. 16 XRD of (a) Pd0.6Au0.4 nanoparticles, (b) a physical mixture of Pd + Au nanoparticles, and (c) Pd + Aunanoparticle mixture after the reaction of CO + O2.
Fig. 17 (A) XRD patterns of Au and Pd nanoparticles, and Au88Pd12 and Au65Pd35 bimetallic nanoparticlesprepared by the LVCC method. (B) CO oxidation as a function of temperature for the unsupported bimetallicnanoparticle catalysts.

Cu0.50Pd0.50 and Cu0.12Pd0.88 nanoparticle catalysts (as-prepared target compositions), respectively.These are significantly lower temperatures as compared to the bimetallic PdAu nanoparticles supportedon TiO2 where the 1 and 100 % CO conversions occur at 150 and 250 °C, respectively [69].
Another important finding is obtained from the XRD data taken after the catalysis reaction overthe CuPd alloy nanoparticles (shown in Fig. 18A), which indicate the formation of CuO from the reac-tion of O2 with the bimetallic CuPd nanoparticles. Therefore, CuPd alloy nanoparticles, unlike theAuPd alloy nanoparticles, are converted into a mixture of CuO and Au nanoparticles following the re-action with O2. Interestingly, a significant increase in the catalytic activity is observed following the for-mation of CuO as shown in Fig. 18B. Therefore, the improved conversion efficiency of the oxidizedCuPd alloy nanoparticles after the catalysis test is attributed to the formation of CuO, which is knownto have a higher catalytic activity than Cu for CO oxidation [70,71].
Finally, the high activity and stability of the nanoparticle catalysts prepared using the LVCCmethod are remarkable and imply that a variety of efficient catalysts can be designed and tested usingthis approach. Figure 19 summarizes the catalysis results for the CO oxidation on different Au-Xbimetallic nanoparticles prepared by the LVCC method. It is clear that both the Co- and Cu-containingcatalysts show excellent catalytic activities due to the formation of CoO and CuO during the activationstep.
G. GLASPELL et al.
© 2006 IUPAC, Pure and Applied Chemistry 78, 1667–1689
1682
Fig. 18 (A) XRD patterns of Au10Cu90 bimetallic nanoparticles before and after the CO catalysis test. (B)Temperature dependence for the CO oxidation on Au10Cu90 for the first and second catalysis tests.

The use of the unsupported bimetallic nanoparticles as catalysts provides an opportunity of tun-ing the catalytic activity to the desired performance depending on the specific application. The signifi-cance of the current method lies mainly in its simplicity, flexibility, and the control of the different fac-tors that determine the activity of the nanoparticle catalysts. For example, control of the composition ofthe active metal (Pd, Au, Cu) and the oxide support (CeO2, ZrO2, TiO2, Al2O3, and SiO2) can beachieved by controlling the compositions of the initial targets. Nonstoichiometric oxide supports can beprepared by using metal powders such as Ce, Zr, Ti, Al, and Si in the selected targets and carrying outthe LVCC process in the presence of varying concentrations of oxygen/helium carrier gas mixtures.Control of the size distribution of the nanoparticle catalysts is accomplished by controlling the pressureof the carrier gas and the temperature gradients during the LVCC synthesis. Size selection is possiblethrough the coupling of the LVCC method with a DMA. The method allows the incorporation of oneor more type of active metals such as Pd, Pt, Au, and Cu, or bimetallic alloys such CuAu, PdAu, andCuPd as well as one or more type of oxide supports.
Synthesis of metal and metal oxide nanowires
Nanowires and nanobelts of controlled dimensions, morphology, and compositions can be synthesizedusing the VLS approach developed by Lieber [46–48], Zhang [49,50], and Yang [72,73]. In the VLSgrowth process, a liquid binary metal cluster acts as a catalyst for the absorption of gas-phase speciesof the desired wire material. The requirement of a liquid cluster provides a preferential site for absorp-tion since the sticking probability is much higher on liquid than on solid surfaces. The equilibriumphase diagram is used to rationally choose the catalyst material and the growth conditions so that thereis a coexistence of liquid alloy (catalyst) and solid nanowire material. Preferential wire growth in 1Doccurs as long as the catalyst remains liquid.
For the synthesis of a variety of metal and semiconductor nanowires, Au has typically been thecatalyst of choice [46–48,72]. However, for the synthesis of Ge nanowires, we used Fe rather than Ausince Fe would be economically preferable in a scaled-up process. The binary Ge–Fe phase diagram in-dicates that there is an area above 820 °C and below 940 °C with Fe less than 20 wt %, where the cat-alyst is in the liquid phase while Ge remains a solid [74]. To optimize the wire growth conditions, weprepared three binary targets containing 20, 15, and 10 % (wt) Fe. Laser ablation of the Fe–Ge target
© 2006 IUPAC, Pure and Applied Chemistry 78, 1667–1689
Vapor-phase synthesis of nanomaterials 1683
Fig. 19 CO oxidation as a function of temperature for the unsupported Au-X bimetallic nanoparticle catalystswhere X = Co, Cu, Pd, Ni, Ag, and Fe.
creates a supersaturated binary vapor which, under the current experimental conditions, immediatelyundergoes nucleation to form small binary Fe–Ge clusters. These clusters remain in the liquid phasewhile in the hot zone of the furnace and as the clusters become saturated with Ge, precipitation of theGe wire occurs. The wire growth is terminated when the gas flow carries the clusters out of the hot zoneof the furnace. Three factors that effect the growth of the wires are temperature, flow rate, and pressure.The temperature of the furnace needs to be high enough to ensure that the cluster remains in a liquidstate, which again is determined from the equilibrium-phase diagram. The flow rate directly affects theresidence time of catalyst cluster in the hot zone, longer times result in the formation of longer wires.The pressure within the quartz tube affects the size of the initial catalyst cluster formed, which ulti-mately determines the diameter of the growing wire.
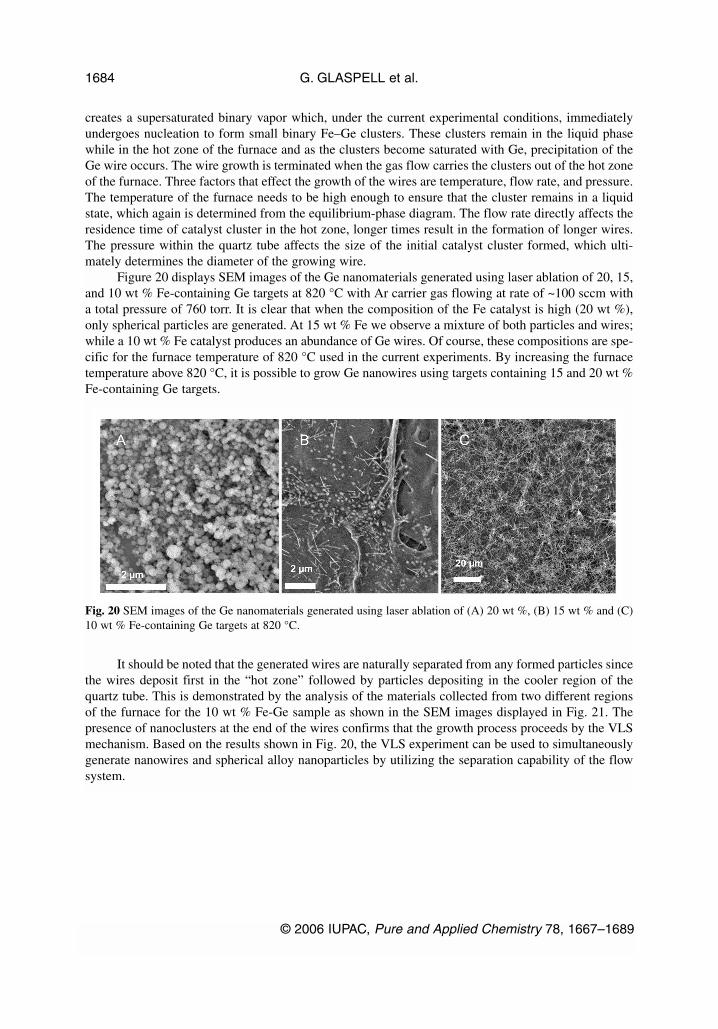
Figure 20 displays SEM images of the Ge nanomaterials generated using laser ablation of 20, 15,and 10 wt % Fe-containing Ge targets at 820 °C with Ar carrier gas flowing at rate of ~100 sccm witha total pressure of 760 torr. It is clear that when the composition of the Fe catalyst is high (20 wt %),only spherical particles are generated. At 15 wt % Fe we observe a mixture of both particles and wires;while a 10 wt % Fe catalyst produces an abundance of Ge wires. Of course, these compositions are spe-cific for the furnace temperature of 820 °C used in the current experiments. By increasing the furnacetemperature above 820 °C, it is possible to grow Ge nanowires using targets containing 15 and 20 wt %Fe-containing Ge targets.
It should be noted that the generated wires are naturally separated from any formed particles sincethe wires deposit first in the “hot zone” followed by particles depositing in the cooler region of thequartz tube. This is demonstrated by the analysis of the materials collected from two different regionsof the furnace for the 10 wt % Fe-Ge sample as shown in the SEM images displayed in Fig. 21. Thepresence of nanoclusters at the end of the wires confirms that the growth process proceeds by the VLSmechanism. Based on the results shown in Fig. 20, the VLS experiment can be used to simultaneouslygenerate nanowires and spherical alloy nanoparticles by utilizing the separation capability of the flowsystem.
G. GLASPELL et al.
© 2006 IUPAC, Pure and Applied Chemistry 78, 1667–1689
1684
Fig. 20 SEM images of the Ge nanomaterials generated using laser ablation of (A) 20 wt %, (B) 15 wt % and (C)10 wt % Fe-containing Ge targets at 820 °C.

Recent studies have indicated that during the growth process of nanowires and nanobelts, the pre-ferred crystallographic orientation can change with variations in temperature and pressure resulting inthe formation of nanorings or nanobows at the end of the wires and belts [75,76]. Thus, it is perceiv-able that introducing a barrier that is significantly cooler than its surroundings located immediately afterthe “hot zone” in the quartz tube would induce bends and kinks in the growing Ge wires. Figure 22demonstrates these features in the SEM images of the as-deposited Ge wires on the surface of the bar-rier. It is plausible that when the wire comes into contact with the cooler surface the sudden change intemperature alters the preferred crystallographic orientation inducing a kink in the wire. The presenceof spherical particles is also evident in the background due to the location of the barrier, which did notallow for the natural separation of the nucleated particles.
© 2006 IUPAC, Pure and Applied Chemistry 78, 1667–1689
Vapor-phase synthesis of nanomaterials 1685
Fig. 21 SEM images of the Ge nanomaterials generated using laser ablation of a 10 wt % Fe-containing Ge targetat 820 °C. (A) nanowires and (B) spherical nanoparticles deposited on the high- and low-temperature zones,respectively.
Fig. 22 SEM images demonstrating the non-uniform wire growth of the Ge nanowires resulting from the presenceof a cold surface immediately after the hot zone of the furnace. Note the formation of kinks, extensive bending, andrings.

We have extended this study to generate Mg wires of various diameters. The synthesis of Mgwires was accomplished using Al as a catalyst. The phase diagram for Mg–Al indicates that wire for-mation is possible above 437 °C between 70 and 90 wt % Al (74). This region ensures that the Al clus-ter is in the liquid phase, which again is vital for wire formation. Thus, Mg wires were synthesized byablating a target consisting of Mg85Al15 wt % at 550 °C. Figure 23 shows the SEM and TEM micro-graphs of the Mg wires synthesized at three different pressures, 760 torr (A), 200 torr (B), and 100 torr(C).
It is significant to note that the diameter of the resulting wire diminishes as the pressure decreases.Specifically, the Mg wires produced at 760 torr resulted in a diameter of ~4.8 µm, while the wires pro-duced at 200 and 100 torr had diameters of ~190 and 16 nm, respectively. One possible explanation isthat at higher pressures larger catalyst clusters are formed following the laser ablation process. This isconsistent with the VLS mechanism, which assumes that the diameter of the resulting wire is deter-mined by the diameter of the initial catalyst cluster. The XRD diffraction pattern for the Mg nanowiresexhibits asymmetrical-shaped peaks occurring at 2θ values of 43.1 and 62.5 indicating that multiplephases are present. Further analysis confirms that the phases are Mg (ICSD 03-065-7219) and MgO(ICSD 03-065-0476) [61]. The formation of MgO is most likely a result of the surface oxidation of theMg wires upon exposure to air.
We have also generated Pd and Pt wires using Ge as a catalyst by utilizing Pd90Ge10 and Pt90Ge10targets ablated at 1000 °C. The SEM micrographs of the synthesized wires are shown in Fig. 24. Theaverage diameters of the Pd and Pt wires are ~280 and ~830 nm, respectively.
G. GLASPELL et al.
© 2006 IUPAC, Pure and Applied Chemistry 78, 1667–1689
1686
Fig. 23 SEM (A and B) and TEM (C) images of Mg wires synthesized using an Al catalyst at 550 °C with the Arpressure (torr): (A) 760, (B) 200, and (C) 100.
Fig. 24 SEM of Pd (A) and Pt (B and C) wires synthesized using a Ge catalyst at 1000 °C.

In conclusion, we have synthesized Ge, Mg, Pd, and Pt nanowires of varying diameters andlengths by controlling the experimental parameters of the VLS process. Full characterizations of thesematerials including their hydrogen storage capacities are currently in progress.
CONCLUSIONS
Based on the work presented in this paper, we conclude the following: (1) intermetallic FeAl and NiAlcan be synthesized in the vapor phase via the LVCC method from their bulk powder counterparts, (2)the intermetallic nanoparticles prepared in the vapor phase from the elemental powder mixtures displaysimilar characteristics to nanoparticles formed from ablation of intermetallic bulk targets, (3) the in-corporation of Au and Pd nanoparticles within cobalt oxide catalysts improves both the activity and sta-bility of these catalysts in the CO oxidation process, (4) the activity of the unsupported bimetallicnanoparticles can be tuned to the desired performance depending on the composition of the catalyst pre-pared by the LVCC method, (5) the improved catalytic activity of the oxidized AuCo and AuCunanoparticles is due to the formation of CoO and CuO, respectively, during the activation step, and (6)the properties of the Ge, Mg, Pd, and Pt nanowires can be controlled by adjusting the experimental para-meters of the VLS process. Full characterizations of the nanowires including their hydrogen storage ca-pacities are currently in progress.
ACKNOWLEDGMENTS
The authors acknowledge support from NASA (NNG04GH45G). Acknowledgement is also made to thedonors of the Petroleum Research Fund, administered by the American Chemical Society for the par-tial support of this research (PRF # 37582-AC6 and PRF# 41602-AEF).
REFERENCES
1. G. A. Ozin, A. C. Arsenault. Nanochemistry, A Chemical Approach to Nanomaterials, RoyalSociety of Chemistry, Cambridge (2005).
2. L. M. Liz-Marzan, P. V. Kamat. Nanoscale Materials, Kluwer Academic, Dordrecht (2003).3. A. S. Edelstein, R. C. Cammarata. Nanomaterials: Synthesis, Properties and Applications,
Institute of Physics, Philadelphia (1996).4. G. C. Hadijipanyis, R. W. Siegel. Nanophase Materials: Synthesis, Properties, Applications,
Kluwer Academic, London (1994).5. M. S. El-Shall, A. S. Edelstein. Nanomaterials: Synthesis, Properties and Applications, Institute
of Physics, Philadelphia (1996).6. M. S. El-Shall, W. Slack, W. Vann, D. Kane, D. Hanley. J. Phys. Chem. 52, 3067 (1994). 7. M. S. El-Shall, S. Li, D. Graiver, U. C. Pernisz. Nanotechnology: Molecularly Designed
Nanostructural Materials, G. Chow, K. E. Gonsalves (Eds.), ACS Symposium Series No. 622,p. 79, American Chemical Society, Washington, DC (1996).
8. S. Li, S. Silvers, M. S. El-Shall. J. Phys. Chem. 101, 1794 (1997).9. M. S. El-Shall, S. Li. In Advances in Metal and Semiconductor Clusters, M. A. Duncan (Ed.),
p. 115, JAI Press, London (1998).10. Y. B. Pithawalla, M. S. El-Shall, S. C. Deevi, V. Stroem, K. V. Rao. J. Phys. Chem. B 105, 2085
(2001).11. M. S. El-Shall, V. Abdelsayed, Y. B. Pithawalla, E. Alsharach, S. C. Deevi. J. Phys. Chem. B 107,
2882 (2003).12. Y. Yang, K. M. Saoud, V. Abdelsayed, G. Glaspell, S. Deevi, M. S. El-Shall. Catal. Commun. 7,
281 (2006).
© 2006 IUPAC, Pure and Applied Chemistry 78, 1667–1689
Vapor-phase synthesis of nanomaterials 1687
13. N. S. Stoloff, V. K. Sikka. Physical Metallurgy and Processing of Intermetallic Compounds,p. 217, Chapman & Hall, London (1996).
14. K. Morsi. Mater. Sci. Eng. A 299, 1 (2001).15. V. K. Sikka, S. C. Deevi, S. Viswanathan, R. W. Swindeman, M. L. Santella. Intermetallics 8,
1329 (2000).16. S. C. Deevi, V. K. Sikka. Intermetallics 4, 357 (1996).17. A. Bose, B. Moore, R. M. German, N. S. Stoloff. J. Met. 40, 14 (1988).18. C. T. Liu. Scr. Metall. Mater. 27, 25 (1992).19. P. J. Maziasz, G. M. Goodwin, D. J. Alexander, S. Viswanathan. International Symposium on
Nickel and Iron Aluminides: Processing, Properties, and Applications, Proceedings fromMaterials Week ‘96, Cincinnati, 7–9 Oct. 1996, 157 (1997).
20. S. X. Mcfadden, R. S. Mishra, R. Z. Valiev, A. P. Zhilyaev, A. K. Mukherjee. Nature 398, 684(1999).
21. S. X. McFadden, R. Z. Valiev, A. K. Mukherjee. Mater. Sci. Eng., A 319–321, 849 (2001).22. M. Nastashi, H. Gleiter. Mechanical Properties and Deformation Behavior of Materials Having
Ultra-fine Microstructures, p. 624, Kluwer, Dordrecht (1993).23. Y. B. Pithawalla, M. S. El Shall, S. C. Deevi. Intermetallics 8, 1225 (2000).24. Y. B. Pithawalla, S. C. Deevi, M. S. El-Shall. Mater. Sci. Eng., A 329–A331, 92 (2002).25. H. Haruta, H. Sano. Preparation of Catalysts III, p. 225, Elsevier, Amsterdam (1983).26. W. R. Moser. Advanced Catalysts and Nanostructured Materials, Academic Press, New York
(1996).27. M. Valden, X. Lai, D. W. Goodman. Science 281, 1647 (1998).28. A. Tschope, W. Liu, M. Flytzani-Stephanopoulos, J. Y. Ying. J. Catal. 157, 42 (1995).29. Y. Yamada, A. Ueda, Z. Zhao, T. Maekawa, K. Suzki, T. Takada, T. Kobayashi. Catal. Today 67,
379 (2001).30. M. Ferrandon, B. Ferrand, E. Bjormbom, F. Klingstedt, A. K. Nayestanaki, H. Karhu, I. J.
Vayrynen. J. Catal. 202, 354 (2001).31. K. R. McCrea, J. S. Parker, G. A. Somorjai. J. Phys. Chem. B 106, 10854 (2002).32. I. S. Ahmadi, Z. L. Wang, T. C. Green, A. Henglein, M. A. El-Sayed. Science 272, 1924 (1996).33. R. M. Rioux, H. Song, J. D. Hoefelmeyer, P. Yang, G. A. Somorjai. J. Phys. Chem. B 109, 2192
(2005).34. R. Narayanan, M. A. El-Sayed. J. Phys. Chem. B 109, 12663 (2005).35. World Health Organization, Carbon Monoxide. Environmental Health Criteria 213, World Health
Organization, Geneva (1999).36. H. Huber, D. McIntosh, G. A. Ozin. Inorg Chem. 16, 975 (1977). 37. M. Haruta, N. Yamada, T. Kobayashi, S. Iijima. J. Catal. 115, 301 (1989).38. R. M. T. Sanchez, A. Ueda, K. Tanaka, M. Haruta. J. Catal. 168, 125 (1997).39. C. Mohr, M. Hofmeister, M. Lucas, P. Clause. Chem. Eng. Technol. 23, 4 (2000).40. G. C. Bond. Gold Bull. 34, 117 (2001).41. M. Haruta, H. Sano, T. Kobayasi. U.S. Patent 4698324, Method for Manufacture of Catalyst
Composite Having Gold with Catalytic Metal Oxide Deposited on Carrier (1987).42. M. Date, M. Haruta. J. Catal. 201, 221 (2001).43. M. Haruta, M. Date. Appl. Catal. A 222, 427 (2001).44. A. Wolf, F. Schűth. Appl. Catal. A 226, 1 (2002).45. C. K. Costello, J. H. Yang, H. Y. Law, Y. Wang, J. N. Lin, L. D. Marks, M. C. Kung, H. H. Kung.
Appl. Catal. A 243, 15 (2003).46. A. M. Morales, C. M. Lieber. Science 279, 208 (1998).47. J. Hu, T. W. Odom, C. M. Lieber. Acc. Chem. Res. 32, 435 (1999).48. M. S. Gudiksen, C. M. Lieber. J. Am. Chem. Soc. 122, 8801 (2000).
G. GLASPELL et al.
© 2006 IUPAC, Pure and Applied Chemistry 78, 1667–1689
1688

49. Z. L. Wang. Nanowires and Nanobelts – Materials, Properties and Devices; Vol. I: Metal andSemiconductor Nanowires, Vol. II: Nanowires and Nanobelts of Functional Materials, KluwerAcademic, Dordrecht (2003).
50. M. Zhao, Z. L. Wang, S. X. Mao. Nano Lett. 4, 587 (2004).51. R. Vijay, R. Sundaresan, M. P. Maiya, S. Srinivasa Murthy, Y. Fu, H.-P. Klein, M. Groll. J. Alloys
Compd. 384, 283 (2004).52. X. Y. Kong, Y. Ding, R. S. Yang, Z. L. Wang. Science 303, 1348 (2004).53. W. U. Huynh, J. J. Dittmer, A. P. Alivisatos. Science 295, 2425 (2002). 54. Z. Tang, N. A. Kotov, M. Giersig. Science 297, 237 (2002).55. V. Abdelsayed. Experimental Studies on Nucleation, Nanoparticles’ Formation and
Polymerization from the Vapor Phase, Ph.D. dissertation, Virginia Commonwealth University,Richmond, VA (2004).
56. V. Abdelsayed, M. S. El-Shall, T. Seto. J. Nanoparticle Res. (2006). In press.57. V. Abdelsayed, K. M. Saoud, M. S. El-Shall. J. Nanoparticle Res. (2006). In press.58. G. Glaspell, L. Fuoco, M. S. El-Shall. J. Phys. Chem. B 109, 17350 (2005).59. T. Liu, H. Shao, X. Li. J. Phys.: Condens. Matter 15, 2507 (2003).60. T. Liu, Y. Leng, X. Li. Solid State Commun. 125, 391 (2003).61. Inorganic Crystal Structure Database (ICSD) 2004. 62. S. Dong, P. Hou, H. Yang, G. Zou. Intermetallics 10, 217 (2002).63. F. Z. Chrifi-Alaoui, M. Nassik, K. Mahdouk, J. C. Gachon. J. Alloys Compd. 364, 121 (2004).64. J. Crangle. The Magnetic Properties of Solids, Arnold, London (1977).65. I. I. Yaacob, A. C. Nunes, A. Bose, D. O. Shah. J. Colloid Interface Sci. 168, 289 (1994). 66. M. Haruta, S. Tsubota, T. Kobayashi, H. Kageyama, M. J. Genet, B. J. Delmon. J. Catal. 144, 175
(1993).67. D. A. Cunningham, T. Kobayashi, N. Kamijo, M. Haruta. Catal. Lett. 25, 257 (1994).68. P. Thormählen, M. Skoglundh, E. Fridel, B. J. Andersson. J. Catal. 188, 300 (1999).69. R. W. J. Scott, C. Sivadinarayana, O. M. Wilson, Z. Yan, D. W. Goodman, R. M. Crooks. J. Am.
Chem. Soc. 127, 1380 (2005).70. J. Wang, D.-H. Tsai, T.-J. Huang. J. Catal. 208, 370 (2002).71. B. Skarman, D. Grandjean, R. E. Benfield, A. Hinz, A. Andersson, L. R. Wallenberg. J. Catal.
211, 119 (2002).72. Y. Wu, P. Yang. J. Am. Chem. Soc. 123, 3165 (2001).73. Y. Wu, R. Fan. P. Yang. Nano Lett. 2, 84 (2002).74. M. Hansen. Constitution of Binary Alloys, Genium, Schenectady, NY (1985).75. W. L. Hughes, Z. L. Wang. Appl. Phys. Lett. 86, 043106 (2005).76. J. Zhang, F. Jiang, Y. Yang, J. Li. J. Phys. Chem. B 109, 13143 (2005).
© 2006 IUPAC, Pure and Applied Chemistry 78, 1667–1689
Vapor-phase synthesis of nanomaterials 1689