Valuentum Exclusive Volume 5 Edition 5 FINAL
38
THE VALUENTUM TEAM * Redistribution strictly prohibited. May 2020 THE EXCLUSIVE Confidential*
Transcript of Valuentum Exclusive Volume 5 Edition 5 FINAL

THE VALUENTUM TEAM
* Redistribution strictly prohibited.
May 2020
THE EXCLUSIVE
Confidential*

2 | P a g e
Table of Contents
Never Been More Bullish on Stocks Even as Buffett Dumps Airlines................3 Jernigan Capital Fundamentally Transforms Its Business Model…….………..7 Tracking Exclusive Idea Simulated Performance ….………………...........16-21
Income…………………………………………………………………………….........16 Capital Appreciation……………………………………………………………….........18 Short Idea Considerations……………………………………………………………....20
Income Generation: United Microelectronics (UMC)…………………..........22 Capital Appreciation: Sprouts Farmers Market (SFM)…………………..........26 Short Idea Consideration: U.S. Global Jets ETF (JETS)......................................33 Inaugural Letter to Members, July 2016……………………….…………….36

3 | P a g e
Never Been More Bullish on Stocks Even as Buffett Dumps Airlines
Image Source: IATA. Data Source: McKinsey & Company (IATA). Airlines haven’t been able to earn their estimated cost of capital for as long as we can remember. There have been hundreds of airline bankruptcies since deregulation in 1978.
By Callum Turcan and Brian Nelson, CFA Dear Exclusive members,
On Saturday, May 2, Berkshire Hathaway (BRK.A, BRK.B) reported expectedly weak first-quarter results. We won’t be ditching Berkshire Hathaway’s stock in the Best Ideas Newsletter portfolio so long as Uncle Warren is at the helm, but there were a couple takeaways from the report that we want you to be aware of. The first big piece of news, something that should not be surprising to any reader of our work, is that Buffett sold his stakes in the airlines. We’ve already talked extensively about how the Oracle made a mistake in owning the airlines in the first place in Value Trap and in the following article, “Buffett Makes Another ‘Unforced Error’ in Airlines,” and we’re not reading anything at all (not on the economy, not on the equity markets) into his decision to unload shares.
Please note that a version of this article was emailed out to members on May 5.

4 | P a g e
Despite their oligopolistic structure, airlines do not have “moats” and arguably have decrepit economic castles. A company is generally considered a “moaty” enterprise if its ROIC, or return on invested capital, consistently exceeds its WACC (ROIC-WACC = economic profit) and is expected to continue to do so, as a result of a benign industry structure and impenetrable competitive advantages. Consistent economic profits have never happened for airlines. Airlines have always been terrible long-term investments. According to the IATA, for example, industry-wide ROIC averaged a mere 6.7% during the 5-year period 2014-2018, well below the group’s estimated cost of capital (see image at top of Page 3), a period that coincides with one of the most prosperous economic environments ever witnessed across the globe. There have been hundreds of airline bankruptcies since deregulation in 1978, too, and there hasn’t been one instance where the airline industry’s ROIC has exceeded its WAAC in more than 20 years (even when oil prices collapsed in 2015/2016, ROIC still came up short).
Image Source: American Airlines’ 10-K, released February 2019. A flu pandemic is a documented risk factor in airline regulatory filings.
Though COVID-19 was an unexpected catalyst, so was SARS, 9/11, oil price shocks and the Iraq war. While COVID-19 may look like it came out of left field, when it comes to the airline business, these types of shocks are part of their operations (a flu pandemic is even a documented risk factor in their regulatory filings, see image above, as illustrative), and therefore not extraordinary or even anywhere close to being considered a black swan. Massive buybacks by airlines in recent years are simply unforgiveable, as many executives even used the bankruptcy process to optimize their operations during the past few decades. They knew they were rolling the dice in a bad business. “Let them fail,” we said more recently, and here’s what we said about what to expect from airlines in Value Trap, released December 2018:
Buffett said once that he had an 800 number that he would call anytime that he wanted to buy an airline stock again. Maybe that number has been disconnected after all these years, as Berkshire Hathaway is once again an owner of airline equities. Though the structural characteristics of an industry can and do change over time, I’m very skeptical the airline business has changed permanently for the better. Today’s airline business may be more oligopolistic in nature and much more profitable thanks to consolidation and the right-sizing of capacity, but it retains a notoriously cyclical passenger-demand profile, ties to the level and volatility of energy resource prices, considerable operating leverage, all the while barriers to entry remain low, exit barriers remain high, and fare pressure endures. The next downturn may not see as many bankruptcies as prior economic cycles due to lower unit-cost profiles, but it may turn out to only be modestly “less bad” for equity holders.
Warren Buffett ditched airlines because he knows they are terrible investments and just made a mistake, while prudently reducing exposure to the aerospace/airline industry because Berkshire also owns metal-bender Precision Castparts, one of our favorite companies that makes metal castings for jet engines. Boeing’s (BA) massive debt raise has been a material positive for the aerospace supply chain, including Precision Castparts, but the ill-health of Boeing’s airline customer base will mean commercial aerospace demand will also remain subdued for some time. We told you to stay away from Boeing a long time ago, “Boeing’s Fall from Grace.”

5 | P a g e
Image (March 21, 2020): Boeing was added to the Dividend Growth Newsletter portfolio January 27, 2017, and removed March 16, 2018, prior to the unfortunate accidents that have claimed the lives of hundreds of people. We warned readers to stay far away of Boeing's stock days before its huge collapse.
Today, we remain unequivocally bullish on equities for the long run. This is somewhat of a change during the past week or so. As with Professor Jeremy Siegel of Wharton, we do not expect markets to come anywhere close to retesting the March 23 lows. While it is now much more difficult to call near-term direction than at the top in February and in dollar-cost averaging near the bottom on March 23, we’ve never been more bullish on the long term, “Staying Focused on the Long Term,” as we fully expect moral hazard advice (indexing) to not only continue to be supported via bailouts and stimulus, but actually be rewarded, a key lesson following any financial crisis.
Image Source: The final lesson to learn from financial crises. Value Trap: Theory of Universal Valuation.

6 | P a g e
The Treasury is expected to borrow ~$3 trillion during the current quarter, a tally that is nearly 6 times as much as the nearest record quarter of July-September 2008 during the depths of the Great Financial Crisis. The Fed plans to start buying ETFs this month, and Apple (AAPL) is borrowing 10-year debt at incredibly low rates of just 1.65%. Enter 1.65% as the discount rate in a DCF model. The bias is to the upside! The world also now has several ‘shots on goal’ for a new coronavirus vaccine with drug companies scaling up production even as any possible vaccine remains in early trials. Warren Buffett wrote his now-famous op-ed to the New York Times on October 16, 2008, and this is what you need to know:
Over the long term, the stock market news will be good. In the 20th century, the United States endured two world wars and other traumatic and expensive military conflicts; the Depression; a dozen or so recessions and financial panics; oil shocks; a flu epidemic; and the resignation of a disgraced president. Yet the Dow rose from 66 to 11,497.
The news may be scary in coming months, and market volatility may elevate again, but we’ve never been more bullish on the longer run. The biggest advantage of an individual investor is something called time horizon arbitrage. As many professionals continue to fear a break below the March 23 lows in the near term, we’re focused on how this market absorbs the tremendous and unprecedented stimulus in the coming months and what that means for nominal equity prices in the longer run. It may not happen this month or this year, but we expect lift off as investors race to preserve purchasing power! Facebook (FB), PayPal (PYPL), Visa (V), and Alphabet (GOOG) remain among our favorites, in particular. As it relates to the Exclusive publication, we closed out our April 2020 long idea consideration Royal Gold (RGLD) and our April 2020 short idea consideration LendingClub (LC) on April 27, both for nice theoretical gains (with RGLD up 30+%), which was announced via this email here: http://campaign.r20.constantcontact.com/render?m=1110817109903&ca=7463e91f-d9c5-4aa3-a9d9-5a48a742c8e3 Shares of Royal Gold were the beneficiary of strong gold prices of late (a product of unprecedented fiscal and monetary stimulus measures seen around the world, including in the US) and positive operational updates as it relates to the mining operations Royal Gold has an economic stake in through royalties and streaming agreements. Shares of LendingClub came under pressure after announcing it was cutting ~30% of its headcount in April 2020, indicating the firm was coming under immense financial stress. After closing our LendingClub for a nice “gain” we are proud to announce that 25 out of our past 25 short idea considerations have been locked in as winners and we continue to sift through the vast world of equities to find mispriced opportunities for our Exclusive members. We hope everyone, their families, and their loved ones stay safe out there during the harrowing times. Disclosure: Callum Turcan and Brian Nelson do not own shares in any of the securities mentioned above. * Success rate: The percentage of ideas highlighted in the Exclusive that have moved in the direction of our thesis (i.e. up for capital appreciation ideas and down for short idea considerations) through the current price or closed price, with consideration of cash and stock dividends. Success rates do not consider trading costs or tax implications. Trading is simulated. Past results are not a guarantee of future performance.
7 | P a g e
Jernigan Capital Fundamentally Transforms Its Business Model
Image Source: Jernigan Capital Inc – March 2020 IR Presentation
By Callum Turcan Jernigan Capital Inc (JCAP) is now an internally managed real estate investment trust (‘REIT’) that invests in self-storage properties, either directly or by providing funding for developers that build such properties. Shares of JCAP currently yield ~7.1% (as of this writing) in the wake of Jernigan Capital’s stock price selling off aggressively this year, as investor concerns mounted due to the ongoing coronavirus (‘COVID-19’) pandemic. Jernigan Capital is in the midst of a major shift in its business model and overall corporate strategy, and we like the changes management is in the process of making. While these are still early days, plenty is already known about this seismic shift and more information will become available in the coming weeks. Recently, Jernigan Capital has pivoted from focusing primarily on providing financing to self-storage property developers to a business model built around seeking to fully own these properties outright (with those self-storage properties getting managed by an external self-storage operator, which we’ll cover later on), as described in this excerpt from Jernigan Capital’s 2019 Annual Report:
Our primary strategy moving forward is to continue to acquire 100% ownership of a majority of the self-storage facilities that we have financed either through the exercise of ROFRs [right of first refusals] or through privately negotiated transactions with our investment counterparties, subject to acquisition prices being consistent with our investment objective to create long-term value for our stockholders. As of December 31, 2019, we owned 100% of the membership interests in the LLCs that own fifteen facilities and fully consolidate these facilities in the accompanying consolidated financial statements. Subsequent to December 31, 2019, we acquired 100% of the membership interests in the LLCs that own nine additional self-storage facilities.
8 | P a g e
Additionally, please note Jernigan Capital’s previous business strategy, which is summed up in the excerpt down below, also from its 2019 Annual Report:
“Our principal business objective is to deliver attractive risk-adjusted returns by investing in new Generation V self-storage facilities primarily in urban submarkets. A majority of our investments to date have been first mortgage loans to finance ground-up construction of and conversion of existing buildings into new Generation V self-storage facilities. These investments, which we refer to as “development property investments,” are typically structured as loans equal to between 90% and 97% of facility costs (including land, pre-development and other “soft” costs, hard construction costs, fees and interest and operating reserves). We receive a fixed rate of interest on loaned amounts and up to a 49.9% interest in the positive cash flows from operations, sales and/or refinancings of self-storage facilities, which we refer to as “Profits Interest”. We also typically receive a right of first refusal (“ROFR”) to acquire the self-storage facility upon sale.”
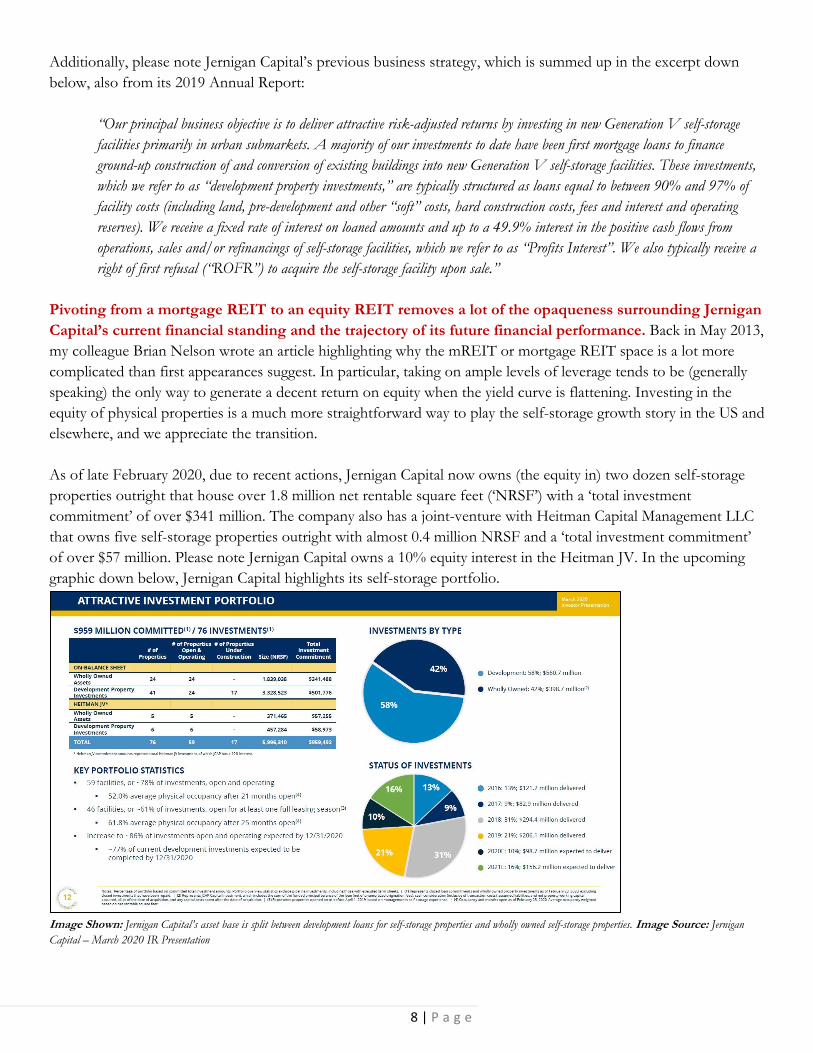
Pivoting from a mortgage REIT to an equity REIT removes a lot of the opaqueness surrounding Jernigan Capital’s current financial standing and the trajectory of its future financial performance. Back in May 2013, my colleague Brian Nelson wrote an article highlighting why the mREIT or mortgage REIT space is a lot more complicated than first appearances suggest. In particular, taking on ample levels of leverage tends to be (generally speaking) the only way to generate a decent return on equity when the yield curve is flattening. Investing in the equity of physical properties is a much more straightforward way to play the self-storage growth story in the US and elsewhere, and we appreciate the transition. As of late February 2020, due to recent actions, Jernigan Capital now owns (the equity in) two dozen self-storage properties outright that house over 1.8 million net rentable square feet (‘NRSF’) with a ‘total investment commitment’ of over $341 million. The company also has a joint-venture with Heitman Capital Management LLC that owns five self-storage properties outright with almost 0.4 million NRSF and a ‘total investment commitment’ of over $57 million. Please note Jernigan Capital owns a 10% equity interest in the Heitman JV. In the upcoming graphic down below, Jernigan Capital highlights its self-storage portfolio.
Image Shown: Jernigan Capital’s asset base is split between development loans for self-storage properties and wholly owned self-storage properties. Image Source: Jernigan Capital – March 2020 IR Presentation

9 | P a g e
In the upcoming graphic down below, Jernigan Capital highlights its wholly owned self-storage property asset base, which the REIT aims to grow over time.
Image Shown: Jernigan Capital seeks to grow its wholly owned self-storage property asset base going forward. Image Source: Jernigan Capital – March 2020 IR Presentation
Assets that are wholly owned by Jernigan Capital are managed by well-known self-storage companies, namely CubeSmart (CUBE) [CubeSmart managed over 90% of Jernigan Capital’s self-storage properties, both those owned by the firm and ones that the firm has an economic stake in via development project investments and other considerations, at the end of 2019], with a small amount of properties managed by Extra Space Storage Inc (EXR), Life Storage Inc (LSI), and Public Storage (PSA) as of the end of 2019. Considering CubeSmart manages the vast majority of the self-storage properties Jernigan Capital is invested in, as mentioned previously, the operational execution of CubeSmart has an outsize effect on Jernigan Capital’s ability to succeed (or not). We like CubeSmart as a holding in our High Yield Dividend Newsletter portfolio, and we view the firm as a top quality self-storage REIT with a solid understanding of the business. Additionally, we like Public Storage as a holding in our High Yield Dividend Newsletter portfolio, meaning that in our view, Jernigan Capital has teamed up with high quality self-storage operators which we appreciate. As noted previously in this research piece, very recently, Jernigan Capital transitioned to an internally managed REIT, summed up succinctly here (from its 2019 Annual Report):
Prior to February 20, 2020, we were externally managed and advised by JCAP Advisors, LLC (the “Manager”). The Manager was led by our founder and former Executive Chairman, Dean Jernigan, our Chief Executive Officer (“CEO”), John A. Good, and our President and Chief Investment Officer (“CIO”), Jonathan Perry. On February 20, 2020, our common stockholders voted to approve the internalization of management pursuant to an Asset Purchase Agreement (the “Purchase Agreement”) dated as of December 16, 2019. Later on February 20, 2020, we closed the internalization described in the Purchase Agreement, resulting, among other things, in the Operating Company acquiring substantially all of the operating assets and liabilities of the Manager and each of the employees of the Manager became an employee of the Company. As of February 20, 2020, we are an internally advised REIT.

10 | P a g e
Becoming an internally managed REIT should better allow for Jernigan Capital to align its interests with shareholders, which we are supportive of. The REIT notes that ~6% of the company is owned by senior executives and the board of directors, which is another way Jernigan Capital is communicating to shareholders that their interests are aligned.
Image Shown: Senior executives and the board of directors own a meaningful amount of Jernigan Capital’s equity. Image Source: Jernigan Capital – March 2020 IR Presentation
As an aside, Jernigan Capital was added to the MSCI US REIT Index in November 2019. When a firm, especially a relatively smaller and lesser known firm like Jernigan Capital, is added to a major index that usually leads to meaningful fund flows into the entity. Please note that doesn’t mean the intrinsic value or fair value of the entity in question changes, but that simply general market awareness of the firm grows (which, potentially, could see shares converge towards their fair value over time at a quicker rate). That being said, the emergence of a unexpected event like COVID-19 can fundamentally alter the market’s outlook towards a company in an instant. While the self-storage industry (particularly in the US) is supported by very strong secular growth tailwinds over the long term, aggressive capacity expansions (again, particularly in the US) in recent years have put downward pressure on the same-store net operating income (‘NOI’) of self-storage properties (stemming from a combination of occupancy rate pressures and the inability to push through price increases in many areas, while property taxes and other operating costs are going up). That made 2019 a rough year for the self-storage space and would likely have made 2020 a rough year for the industry as well before taking the COVID-19 pandemic into account. The pandemic will pose short-term headwinds for Jernigan Capital; however, given its debt-to-capital ratio is relatively low and the firm recently upsized its secured revolving credit facility (two things we’ll cover later on), Jernigan Capital appears to be in a position to ride out the storm.
11 | P a g e
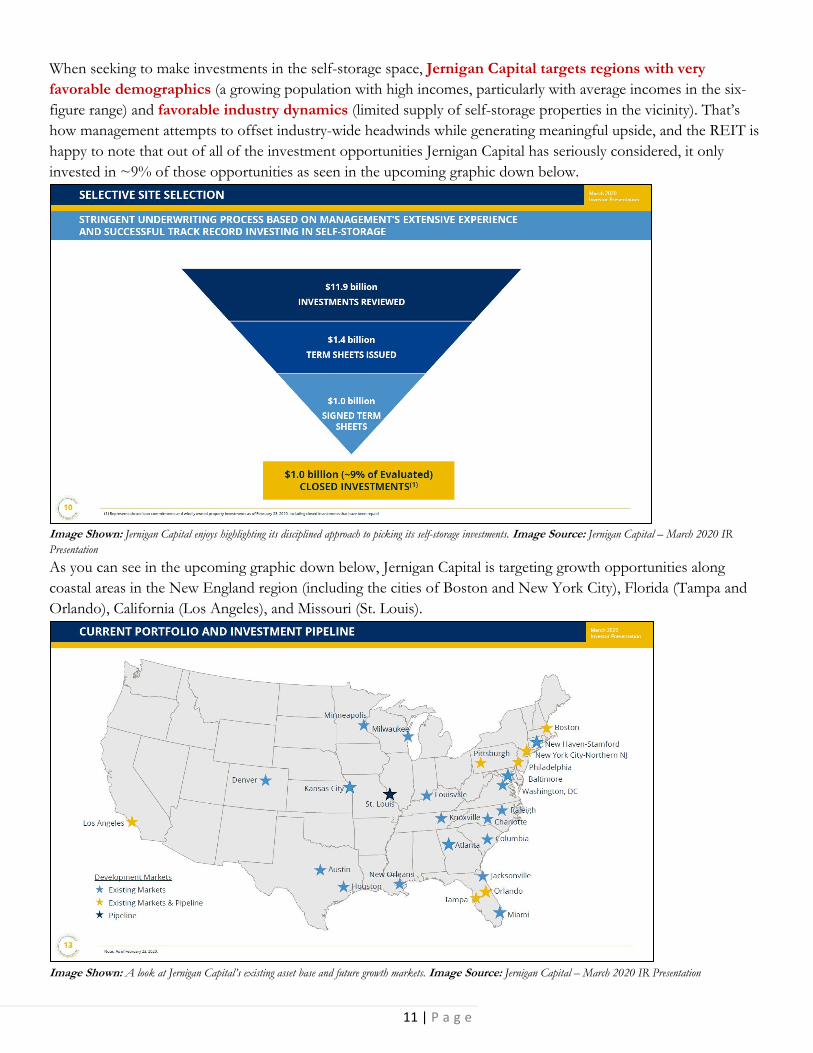
When seeking to make investments in the self-storage space, Jernigan Capital targets regions with very favorable demographics (a growing population with high incomes, particularly with average incomes in the six-figure range) and favorable industry dynamics (limited supply of self-storage properties in the vicinity). That’s how management attempts to offset industry-wide headwinds while generating meaningful upside, and the REIT is happy to note that out of all of the investment opportunities Jernigan Capital has seriously considered, it only invested in ~9% of those opportunities as seen in the upcoming graphic down below.
Image Shown: Jernigan Capital enjoys highlighting its disciplined approach to picking its self-storage investments. Image Source: Jernigan Capital – March 2020 IR Presentation
As you can see in the upcoming graphic down below, Jernigan Capital is targeting growth opportunities along coastal areas in the New England region (including the cities of Boston and New York City), Florida (Tampa and Orlando), California (Los Angeles), and Missouri (St. Louis).
Image Shown: A look at Jernigan Capital’s existing asset base and future growth markets. Image Source: Jernigan Capital – March 2020 IR Presentation
12 | P a g e
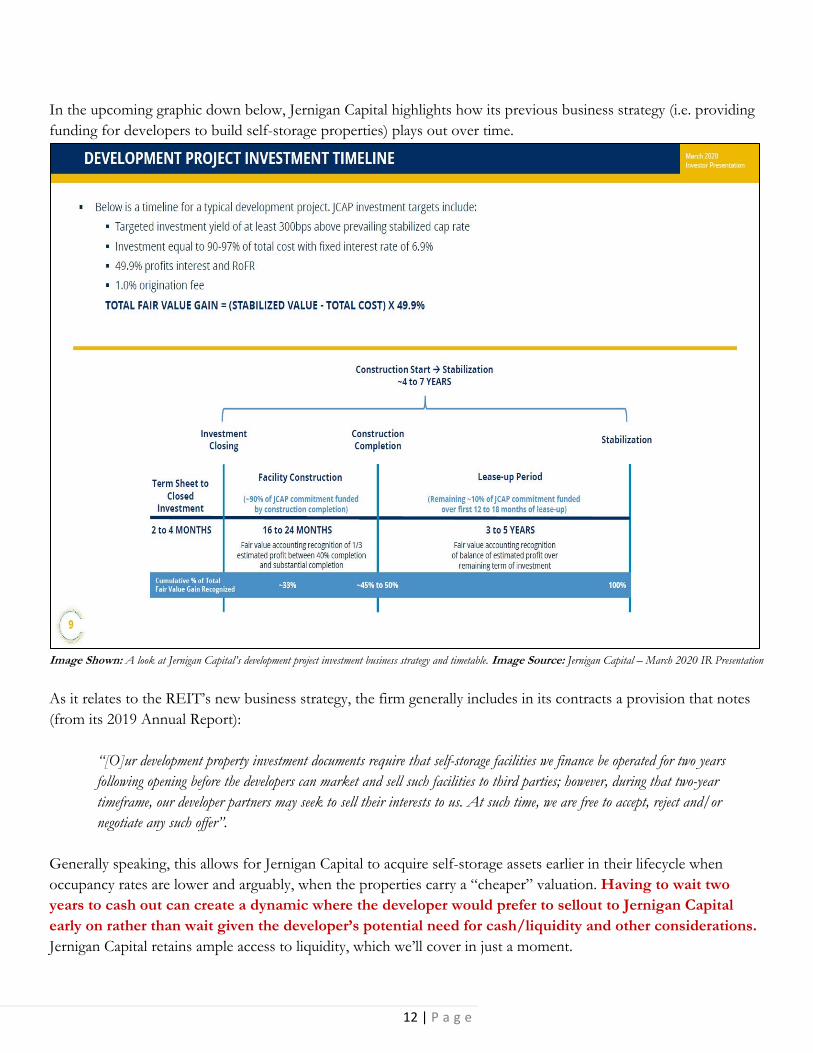
In the upcoming graphic down below, Jernigan Capital highlights how its previous business strategy (i.e. providing funding for developers to build self-storage properties) plays out over time.
Image Shown: A look at Jernigan Capital’s development project investment business strategy and timetable. Image Source: Jernigan Capital – March 2020 IR Presentation
As it relates to the REIT’s new business strategy, the firm generally includes in its contracts a provision that notes (from its 2019 Annual Report):
“[O]ur development property investment documents require that self-storage facilities we finance be operated for two years following opening before the developers can market and sell such facilities to third parties; however, during that two-year timeframe, our developer partners may seek to sell their interests to us. At such time, we are free to accept, reject and/or negotiate any such offer”.
Generally speaking, this allows for Jernigan Capital to acquire self-storage assets earlier in their lifecycle when occupancy rates are lower and arguably, when the properties carry a “cheaper” valuation. Having to wait two years to cash out can create a dynamic where the developer would prefer to sellout to Jernigan Capital early on rather than wait given the developer’s potential need for cash/liquidity and other considerations. Jernigan Capital retains ample access to liquidity, which we’ll cover in just a moment.

13 | P a g e
Looking at Jernigan Capital’s financials now, while the REIT has historically used equity issuances (both common and preferred securities) to fund its growth ambitions, the REIT turned more so towards credit markets in 2019 as seen by the REIT drawing down a meaningful portion of its secured revolving credit line. In the upcoming graphic down below, please note the relatively large increase in Jernigan Capital’s total liabilities from the end of 2018 to the end of 2019, almost entirely due to the firm drawing down its secured revolving credit line (the remainder came from growth in its outstanding term loans balance).
Image Shown: Jernigan Capital has historically leaned more so on equity issuances than debt to fund its growth ambitions, but that changed in 2019 when it drew down its secured revolving credit facility. Image Source: Jernigan Capital – 2019 Annual Report
On March 26, 2020, Jernigan Capital put out a press release noting that its credit facility was upsized to $375 million in borrowing capacity and the credit spread over LIBOR was reduced by 15-25 basis points (meaning the firm now has greater access to liquidity at a cheaper cost of debt). The revolving credit facility matures in March 2023 with two one-year extension options, with room to potentially expand the borrowing capacity of the credit line up to $750 million. It appears Jernigan Capital’s liquidity buffer remains sizable, which we appreciate, particularly when factoring in potential equity issuances this year.

14 | P a g e
Like most REITs, Jernigan Capital hasn’t historically been free cash flow positive as you can see in the upcoming graphic down below. As a capital market dependent entity, Jernigan Capital must retain constant access to capital markets to refinance maturing debt and to issue equity to cover its growth ambitions, along with meeting its dividend obligations. Given that its secured revolving credit line was recently upsized, it appears that continues to be the case. Please note that this business model does come with significant risks, especially during times of great market turbulence. The REIT has often used equity issuances to raise funds as mentioned previously but given the decline in the share price of JCAP over the past few months, that may be a less appealing option going forward until things improve. That being said, Jernigan Capital’s management team in the recent past has stated the remains part of the REIT’s strategy.
Image Shown: Jernigan Capital has not historically been free cash flow positive, and instead generated negative free cash flows from 2017 to 2019. That’s common in the REIT space, keeping in mind that the firm must retain constant access to capital markets at attractive rates to maintain such a business model which does pose serious risks during times of market turbulence. Image Source: Jernigan Capital – 2019 Annual Report

15 | P a g e
In 2019, Jernigan Capital reported adjusted (non-GAAP) diluted EPS of $2.00 per share for the full-year, which was down from 2018 levels of $2.92. Please note that a large part of this decline, aside from its growing outstanding diluted share count (which has been a material factor over the past couple of years and is expected to remain so going forward) and rising operating expenses (though the REIT’s GAAP revenues did grow nicely year-over-year in 2019), was due to fluctuations in ‘net unrealized gain on investments’ and it’s possible EPS and adjusted EPS figures may not be reflective of Jernigan Capital’s financial performance on a forward-looking basis for that and other reasons. For 2020, the company was guiding for adjusted (non-GAAP) EPS of $0.52-$0.87, which is largely due to the changes in Jernigan Capital’s business model. Acquiring self-storage properties will be dilutive to the REIT’s near-term performance, but will enhance its long-term net asset value (‘NAV’) according to management during Jernigan Capital’s fourth quarter and full-year of 2019 conference call:
“…[W]e expect strong external growth in 2020, but that growth will look slightly different than it has in years past, with it being weighted more towards acquisitions to new development. Specifically, we are expecting one to two new development commitments this year, as we have become quite selective about development opportunities we are willing to pursue this late in the cycle and in the current environment of fundamentals. Additionally, we are expecting to acquire between 15 to 20 developer interest, inclusive of the nine we acquired year-to-date. From a value creation standpoint, these acquisitions are very accretive to longer-term NAV and shareholder value and they will meaningfully add to NOI and AFFO growth during their lease-up. However, as we discussed publicly for several quarters, our development -- our developer acquisitions are near-term dilutive to earnings per share because we, one, discontinue recording fair value; and two, assume the operating burden of lease-up assets as they move towards stabilization.
On that note, we expect that the properties we consolidate in 2020 will be less mature than those consolidated in 2018 and 2019 with less in-place NOI at the time of acquisition and a longer period of stabilization. For frame of reference, the '19 operating assets that we consolidated prior to 2020 were approximately 21 months into lease-up and were on average 63% occupied when acquired. By comparison, the average physical occupancy of the nine assets acquired thus far in 2020 was about 39% and they were only 14 months into lease-up. Overall the large quantity timing and relatively younger ages of these acquisitions are expected to have a greater near-term dilutive effect on adjusted EPS and in years past. Specifically, adjusted EPS is expected to be $0.35 to $0.42 per share lower than our targeted level of acquisitions than if our capital had remained in loans with profits interest that accretive fair value on a quarterly basis.” --- Kelly Luttrell, Senior Vice President, Chief Financial Officer, and Treasurer of Jernigan Capital
Management plans to “opportunistically” issue shares under Jernigan Capital’s at-the-market (‘ATM’) equity issue program to fund some of these acquisitions, including the acquisitions the firm has already pursued this year. 2020 will be a transformative year for the REIT, and we caution that its historical performance or guidance on an EPS basis (whether adjusted or not) likely won’t properly reflect its potential future performance. The ongoing pandemic will further obfuscate things, but in general, we like the material changes in Jernigan Capital’s business strategy. A bet on Jernigan Capital is a bet on the REIT’s new strategy playing out favorably and that the REIT, through a combination of equity issuances (such as through its ATM program) and by tapping its credit facility, will retain access to capital markets at attractive rates. While COVID-19 may make that a harder task, we do appreciate management’s pivot and the internalization of Jernigan Capital’s management structure. Disclosure: Callum Turcan does not own shares in any of the securities mentioned above.
16 | P a g e
Tracking Exclusive Idea Simulated Performance
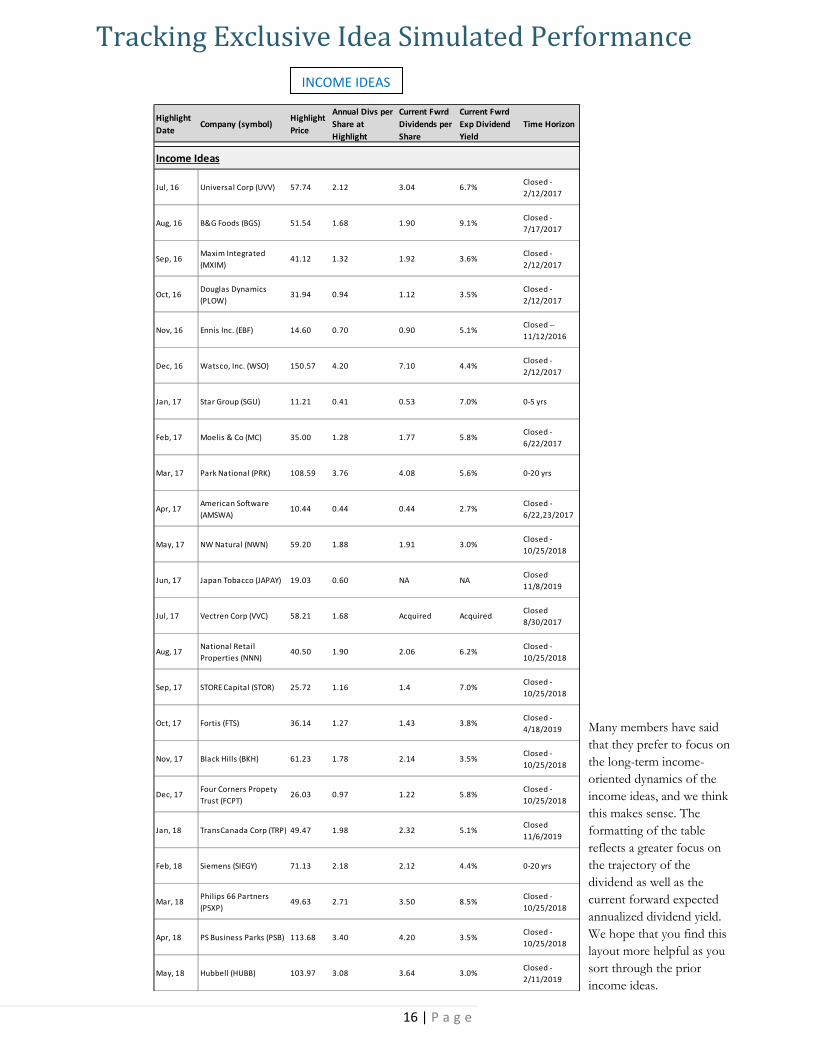
Many members have said that they prefer to focus on the long-term income-oriented dynamics of the income ideas, and we think this makes sense. The formatting of the table reflects a greater focus on the trajectory of the dividend as well as the current forward expected annualized dividend yield. We hope that you find this layout more helpful as you sort through the prior income ideas.
INCOME IDEAS
Highlight
DateCompany (symbol)
Highlight
Price
Annual Divs per
Share at
Highlight
Current Fwrd
Dividends per
Share
Current Fwrd
Exp Dividend
Yield
Time Horizon
Income Ideas
Jul, 16 Universal Corp (UVV) 57.74 2.12 3.04 6.7%Closed ‐
2/12/2017
Aug, 16 B&G Foods (BGS) 51.54 1.68 1.90 9.1%Closed ‐
7/17/2017
Sep, 16Maxim Integrated
(MXIM)41.12 1.32 1.92 3.6%
Closed ‐
2/12/2017
Oct, 16Douglas Dynamics
(PLOW)31.94 0.94 1.12 3.5%
Closed ‐
2/12/2017
Nov, 16 Ennis Inc. (EBF) 14.60 0.70 0.90 5.1%Closed ‐‐
11/12/2016
Dec, 16 Watsco, Inc. (WSO) 150.57 4.20 7.10 4.4%Closed ‐
2/12/2017
Jan, 17 Star Group (SGU) 11.21 0.41 0.53 7.0% 0‐5 yrs
Feb, 17 Moelis & Co (MC) 35.00 1.28 1.77 5.8%Closed ‐
6/22/2017
Mar, 17 Park National (PRK) 108.59 3.76 4.08 5.6% 0‐20 yrs
Apr, 17American Software
(AMSWA)10.44 0.44 0.44 2.7%
Closed ‐
6/22,23/2017
May, 17 NW Natural (NWN) 59.20 1.88 1.91 3.0%Closed ‐
10/25/2018
Jun, 17 Japan Tobacco (JAPAY) 19.03 0.60 NA NAClosed
11/8/2019
Jul, 17 Vectren Corp (VVC) 58.21 1.68 Acquired AcquiredClosed
8/30/2017
Aug, 17National Retail
Properties (NNN)40.50 1.90 2.06 6.2%
Closed ‐
10/25/2018
Sep, 17 STORE Capital (STOR) 25.72 1.16 1.4 7.0%Closed ‐
10/25/2018
Oct, 17 Fortis (FTS) 36.14 1.27 1.43 3.8%Closed ‐
4/18/2019
Nov, 17 Black Hills (BKH) 61.23 1.78 2.14 3.5%Closed ‐
10/25/2018
Dec, 17Four Corners Propety
Trust (FCPT)26.03 0.97 1.22 5.8%
Closed ‐
10/25/2018
Jan, 18 TransCanada Corp (TRP) 49.47 1.98 2.32 5.1%Closed
11/6/2019
Feb, 18 Siemens (SIEGY) 71.13 2.18 2.12 4.4% 0‐20 yrs
Mar, 18Philips 66 Partners
(PSXP)49.63 2.71 3.50 8.5%
Closed ‐
10/25/2018
Apr, 18 PS Business Parks (PSB) 113.68 3.40 4.20 3.5%Closed ‐
10/25/2018
May, 18 Hubbell (HUBB) 103.97 3.08 3.64 3.0%Closed ‐
2/11/2019

17 | P a g e
INCOME IDEAS
Highlight
DateCompany (symbol)
Highlight
Price
Annual Divs per
Share at
Highlight
Current Fwrd
Dividends per
Share
Current Fwrd
Exp Dividend
Yield
Time Horizon
Income Ideas
Jun, 18Park Hotels & Resorts
(PK)32.43 1.72 1.80 NMF
Closed ‐
5/3/2019
Jul, 18Healthcare Trust of
America (HTA)27.36 1.22 1.26 5.0%
Closed ‐
2/11/2019
Aug, 18 QTS Realty Trust (QTS) 44.01 1.64 1.88 2.9%Closed ‐
4/18/2019
Sep, 18 Atmos Energy (ATO) 93.62 1.94 2.30 2.4%Closed ‐
10/25/2018
Oct, 18Veolia Environment
(VEOEY)19.70 0.99 0.54 2.6%
Closed
4/18/2019
Nov, 18 Roche Holding (RHHBY) 29.82 1.08 1.14 2.6%Closed ‐
2/11/2019
Dec, 18 OGE Energy (OGE) 40.46 1.46 1.55 5.3%Closed ‐
2/11/2019
Jan, 19 BAE Systems (BAESY) 24.32 0.92 ‐ ‐Closed ‐
2/11/2019
Feb, 19EastGroup Properties
(EGP)107.58 2.88 3.00 2.7%
Closed
11/6/2019
Mar, 19Canadian Natural
Resources (CNQ)26.76 1.01 1.21 7.4%
Closed ‐
9/24/2019
Apr, 19 Evergy (EVRG) 57.32 1.90 2.02 3.5%Closed
11/6/2019
May, 19 National Health (NHI) 76.43 4.20 4.41 9.0%Closed
11/6/2019
Jun‐19Corporate Office
Properties Trust (OFC)28.94 1.10 1.10 4.4% 0‐20 yrs
Jul‐19Nuveen Real Estate
Income Fund (JRS)10.63 0.76 0.76 10.5% 0‐20 yrs
Aug‐19South32 Limited
(SOUHY)10.01 0.28 0.11 1.8% 0‐20 yrs
Sep‐19
Bank of America
Preferred Stock (ISIN:
US0605052291)
26.87 1.50 1.50 5.6% 0‐20 yrs
Oct‐19 Life Storage (LSI) 105.41 4.00 4.28 4.6%Closed
2/24/2020
Nov‐19 VICI Properties (VICI) 24.28 1.19 1.19 7.0%Closed
2/24/2020
Dec‐19 Comerica (CMA) 71.37 2.68 2.72 8.0% 0‐20 yrs
Jan‐20
Vanguard International
High Dividend Yield ETF
(VYMI)
63.78 2.68 2.68 5.2% 0‐20 yrs
Feb‐20 Omnicom Group (OMC) 75.74 2.60 2.60 4.7% 0‐20 yrs
Mar‐20JPM‐PRC, Preferred
Shares Series EE27.50 1.52 1.52 5.6% 0‐20 yrs
Apr‐20
iShares Investment
Grade Corporate Bond
ETF (LQD)
121.10 3.72 3.84 3.2% 0‐20 yrs
The information provided in the tables is offered for the convenience of the reader, for illustrative purposes only, and no actual trading is taking place. Actual results may differ from the simulated information being presented. Valuentum is a publisher of financial information, not a money manager, broker, or financial advisor.

18 | P a g e
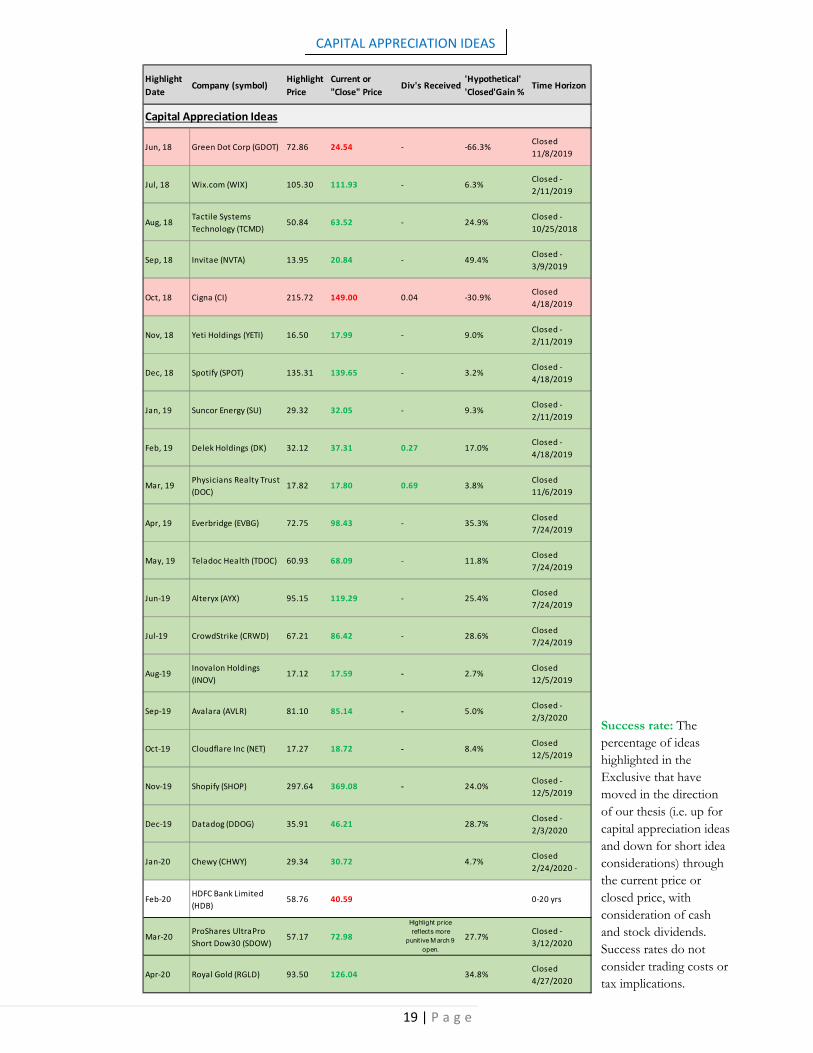
CAPITAL APPRECIATION IDEAS
Many capital appreciation ideas are based on a long-term thesis. However, rapid price-to-fair value convergence may mean we close the ideas relatively quickly, or sooner than expected. Our decision to close an idea may or may not be relevant to you given varying goals and risk tolerances.
Highlight
DateCompany (symbol)
Highlight
Price
Current or
"Close" PriceDiv's Received
'Hypothetical'
'Closed'Gain %Time Horizon
Capital Appreciation Ideas
Jul, 16 Bloomin Brands (BLMN) 17.87 19.28 0.07 8.3%Closed ‐‐
11/12/2016
Aug, 16Healthcare Srvs Group
(HCSG)38.91 41.02 0.369 6.4%
Closed ‐
2/12/2017
Sep, 16Grupo Aeroportuario
(ASR)157.87 181.61 ‐ 15.0%
Closed ‐
4/5/2017
Oct, 16Swedish Match
(SWMA.ST)314.80SEK 417.40SEK 17.7 38.2%
Closed ‐
6/1/2018
Nov, 16 Symrise AG (SYIEY) 16.25 16.34 ‐ 0.6%Closed ‐
4/5/2017
Dec, 16 Tootsie Roll (TR) 37.80 38.96 0.90 5.4%Closed
4/18/2019
Jan, 17Texas Capital
Bancshares (TCBI)78.05 85.10 ‐ 9.0%
Closed ‐
2/12/2017
Feb, 17 Arconic (ARNC) 25.90 29.62 ‐ 14.4%Closed ‐
2/12/2017
Mar, 17 Tesaro (TSRO) 180.84 122.62 ‐ ‐32.2%Closed ‐
7/17/2017
Apr, 17 Yum China (YUMC) 31.15 37.67 ‐ 20.9%Closed ‐
5/23/2017
May, 17 Galapagos (GLPG) 87.67 76.13 ‐ ‐13.2%Closed ‐
7/17/2017
Jun, 17 Huntington Ingalls (HII) 193.79 206.39 ‐ 6.5%Closed
8/18/2017
Jul, 17 Orbital ATK (OA) 102.33 104.65 ‐ 2.3%Closed
8/18/2017
Aug, 17 Wingstop (WING) 32.28 66.17 3.61 116.2%Closed ‐
10/25/2018
Sep, 17 Qualys (QLYS) 51.10 75.44 ‐ 47.6%Closed ‐
10/25/2018
Oct, 17Guidewire Software
(GWRE)78.24 87.50 ‐ 11.8%
Closed ‐
10/25/2018
Nov, 17 Ferrari N.V. (RACE) 117.43 123.26 0.71 5.6%Closed ‐
2/11/2019
Dec, 17 Square (SQ) 38.22 72.61 ‐ 90.0%Closed ‐
10/25/2018
Jan, 18 Planet Fitness (PLNT) 33.70 46.41 ‐ 37.7%Closed ‐
10/25/2018
Feb, 18 Insulet Corp (PODD) 75.84 82.69 ‐ 9.0%Closed ‐
10/25/2018
Mar, 18 Preferred Bank (PFBC) 64.01 36.35 2.52 ‐ 0‐20 yrs
Apr, 18Esperion Therapeutics
(ESPR)66.43 40.94 ‐ ‐38.4%
Closed ‐
4/18/2019
May, 18Heidrick & Struggles
(HSII)37.65 40.77 0.41 9.4%
Closed ‐
3/9/2019
19 | P a g e
CAPITAL APPRECIATION IDEAS
Success rate: The percentage of ideas highlighted in the Exclusive that have moved in the direction of our thesis (i.e. up for capital appreciation ideas and down for short idea considerations) through the current price or closed price, with consideration of cash and stock dividends. Success rates do not consider trading costs or tax implications.
Highlight
DateCompany (symbol)
Highlight
Price
Current or
"Close" PriceDiv's Received
'Hypothetical'
'Closed'Gain %Time Horizon
Capital Appreciation Ideas
Jun, 18 Green Dot Corp (GDOT) 72.86 24.54 ‐ ‐66.3%Closed
11/8/2019
Jul, 18 Wix.com (WIX) 105.30 111.93 ‐ 6.3%Closed ‐
2/11/2019
Aug, 18Tactile Systems
Technology (TCMD)50.84 63.52 ‐ 24.9%
Closed ‐
10/25/2018
Sep, 18 Invitae (NVTA) 13.95 20.84 ‐ 49.4%Closed ‐
3/9/2019
Oct, 18 Cigna (CI) 215.72 149.00 0.04 ‐30.9%Closed
4/18/2019
Nov, 18 Yeti Holdings (YETI) 16.50 17.99 ‐ 9.0%Closed ‐
2/11/2019
Dec, 18 Spotify (SPOT) 135.31 139.65 ‐ 3.2%Closed ‐
4/18/2019
Jan, 19 Suncor Energy (SU) 29.32 32.05 ‐ 9.3%Closed ‐
2/11/2019
Feb, 19 Delek Holdings (DK) 32.12 37.31 0.27 17.0%Closed ‐
4/18/2019
Mar, 19Physicians Realty Trust
(DOC)17.82 17.80 0.69 3.8%
Closed
11/6/2019
Apr, 19 Everbridge (EVBG) 72.75 98.43 ‐ 35.3%Closed
7/24/2019
May, 19 Teladoc Health (TDOC) 60.93 68.09 ‐ 11.8%Closed
7/24/2019
Jun‐19 Alteryx (AYX) 95.15 119.29 ‐ 25.4%Closed
7/24/2019
Jul‐19 CrowdStrike (CRWD) 67.21 86.42 ‐ 28.6%Closed
7/24/2019
Aug‐19Inovalon Holdings
(INOV)17.12 17.59 ‐ 2.7%
Closed
12/5/2019
Sep‐19 Avalara (AVLR) 81.10 85.14 ‐ 5.0%Closed ‐
2/3/2020
Oct‐19 Cloudflare Inc (NET) 17.27 18.72 ‐ 8.4%Closed
12/5/2019
Nov‐19 Shopify (SHOP) 297.64 369.08 ‐ 24.0%Closed ‐
12/5/2019
Dec‐19 Datadog (DDOG) 35.91 46.21 28.7%Closed ‐
2/3/2020
Jan‐20 Chewy (CHWY) 29.34 30.72 4.7%Closed
2/24/2020 ‐
Feb‐20HDFC Bank Limited
(HDB)58.76 40.59 0‐20 yrs
Mar‐20ProShares UltraPro
Short Dow30 (SDOW)57.17 72.98
Highlight price ref lects more
punit ive M arch 9 open.
27.7%Closed ‐
3/12/2020
Apr‐20 Royal Gold (RGLD) 93.50 126.04 34.8%Closed
4/27/2020

20 | P a g e
SHORT IDEA CONSIDERATIONS
Highlight
DateCompany (symbol)
Highlight
Price
Current or
"Close" PriceDiv's Received
'Hypothetical'
'Closed'Gain %Time Horizon
Short Idea Considerations
Jul, 16 Lands' End (LE) 16.76 16.10 ‐ 3.9%Closed ‐‐
12/2/2016
Aug, 16 Vivint Solar (VSLR) 2.94 2.85 ‐ 3.1%Closed ‐‐
12/2/2016
Sep, 16 Lloyds Banking (LYG) 3.31 2.78 ‐ 16.0%Closed ‐‐
11/4/2016
Oct, 16 GoPro (GPRO) 16.68 11.16 ‐ 33.1%Closed ‐‐
11/4/2016
Nov, 16Seritage Growth
Properties (SRG)44.31 42.13 0.25 4.4%
Closed ‐‐
1/6/2017
Dec, 16Royal Bank of Scotland
(RBS)4.91 4.19 0.68 0.8%
Closed
3/5/2020
Jan, 17Sequential Brands
Group (SQBG)4.62 4.18 ‐ 9.5%
Closed ‐
2/12/2017
Feb, 17Sportman's Warehouse
(SPWH)6.85 6.11 ‐ 10.8%
Closed ‐
2/12/2017
Mar, 17 Fitbit (FIT) 6.07 5.71 ‐ 5.9%Closed ‐
4/5/2017
Apr, 17Santander Consumer
(SC)12.51 11.65 ‐ 6.9%
Closed ‐
5/23/2017
May, 17 Snap, Inc (SNAP) 23.19 17.19 ‐ 25.9%Closed ‐
5/10/2017
Jun, 17 Mallinckrodt (MNK) 42.65 36.41 ‐ 14.6%Closed ‐
8/18/2017
Jul, 17Deutsche Lufthansa AG
(DLAKY)23.38 21.42 0.94 4.4%
Closed ‐
10/25/2018
Aug, 17 Del Frisco's (DFRG) 14.35 11.93 ‐ 16.9%Closed ‐
10/16/17
Sep, 17Fiesta Restaurant
Group (FRGI)15.90 14.36 ‐ 9.7%
Closed ‐
2/11/2019
Oct, 17 Ingles Markets (IMKTA) 26.50 24.20 ‐ 8.7%Closed ‐
10/16/17
Nov, 17 Fogo de Chao (FOGO) 10.85 15.62 ‐ ‐44.0%Closed ‐
3/3/2018
Dec, 17 TrueCar (TRUE) 12.07 10.97 ‐ 9.1%Closed ‐
12/28/17
Jan, 18 Shake Shack (SHAK) 44.17 43.54 ‐ 1.4%Closed
3/11/2020
Feb, 18
iShares Core US
Aggregate Bond ETF
(AGG)
107.20 104.63 1.93 0.6%Closed ‐
10/25/2018
Mar, 18
iShares iBoxx $ High
Yield Corporate Bond
ETF (HYG)
85.75 86.68 4.936 ‐6.8%Closed ‐
4/18/2019
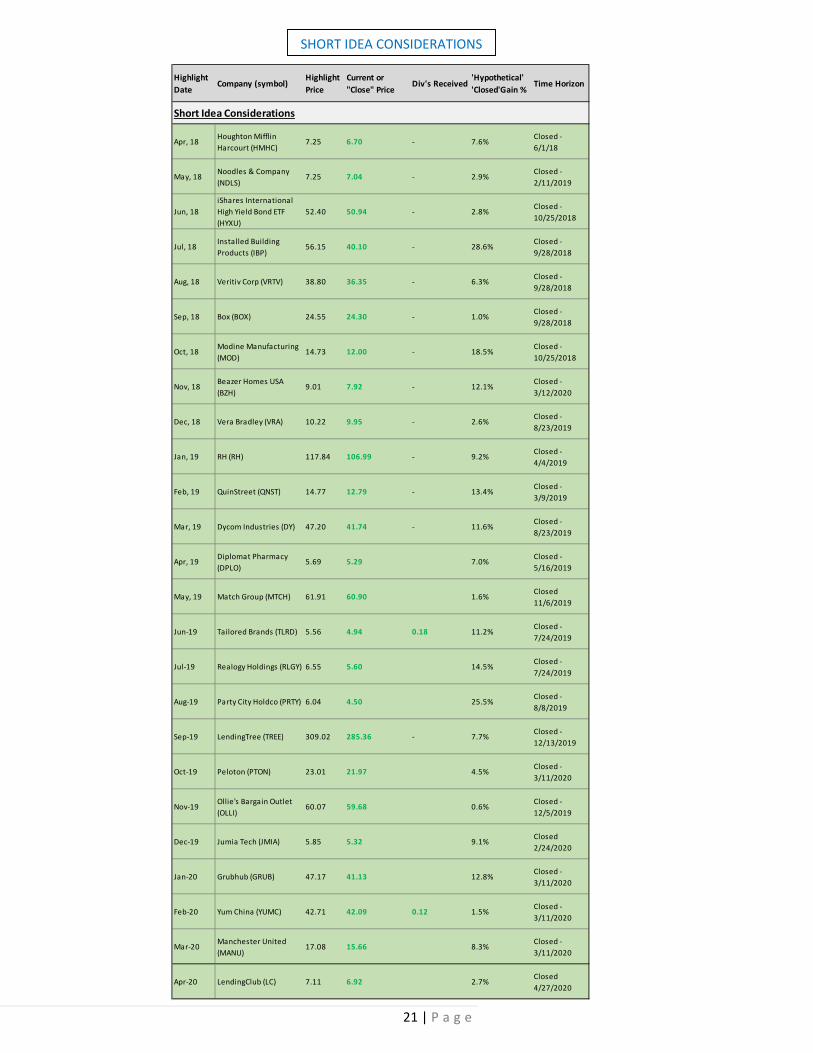
The tables above are provided for the sole purpose of transparency, to allow readers to measure Exclusive ideas in a way they feel is most appropriate. Ideas within the Exclusive are not constructed as a
portfolio, nor should they be viewed as a portfolio, and performance information is hypothetical and "trading" is simulated. "Hypothetical annualized returns," now labeled "Capital Efficiency," cannot be
achieved and are provided for the sole purpose of rightsizing each idea to a common measurement period (one year), to compare ideas 'closed' within one year to ones 'open' longer than one year, taking
into account capital efficiency. A reader, for example, may view a 20% hypothetical return over a period of five weeks as much better than a 20% hypothetical return over a period of five years. Whereas
both represent 20% hypothetical returns, hypothetical annualized performance is much different under each case. Readers may have different views and time horizons. To retain independence, neither
Valuentum nor Brian Nelson own any shares, nor do they plan to own any shares, of any companies highlighted in the Exclusive. Importantly, shorting stocks involves a number of abnormal risks,
including theoretically the infinite loss of capital, and is not for everyone. Valuentum is a financial publisher not a financial advisor. Please contact your personal financial advisor to determine if any
idea in the Exclusive may be appropriate for you.
21 | P a g e
SHORT IDEA CONSIDERATIONS
Highlight
DateCompany (symbol)
Highlight
Price
Current or
"Close" PriceDiv's Received
'Hypothetical'
'Closed'Gain %Time Horizon
Short Idea Considerations
Apr, 18Houghton Mifflin
Harcourt (HMHC)7.25 6.70 ‐ 7.6%
Closed ‐
6/1/18
May, 18Noodles & Company
(NDLS)7.25 7.04 ‐ 2.9%
Closed ‐
2/11/2019
Jun, 18
iShares International
High Yield Bond ETF
(HYXU)
52.40 50.94 ‐ 2.8%Closed ‐
10/25/2018
Jul, 18Installed Building
Products (IBP)56.15 40.10 ‐ 28.6%
Closed ‐
9/28/2018
Aug, 18 Veritiv Corp (VRTV) 38.80 36.35 ‐ 6.3%Closed ‐
9/28/2018
Sep, 18 Box (BOX) 24.55 24.30 ‐ 1.0%Closed ‐
9/28/2018
Oct, 18Modine Manufacturing
(MOD)14.73 12.00 ‐ 18.5%
Closed ‐
10/25/2018
Nov, 18Beazer Homes USA
(BZH)9.01 7.92 ‐ 12.1%
Closed ‐
3/12/2020
Dec, 18 Vera Bradley (VRA) 10.22 9.95 ‐ 2.6%Closed ‐
8/23/2019
Jan, 19 RH (RH) 117.84 106.99 ‐ 9.2%Closed ‐
4/4/2019
Feb, 19 QuinStreet (QNST) 14.77 12.79 ‐ 13.4%Closed ‐
3/9/2019
Mar, 19 Dycom Industries (DY) 47.20 41.74 ‐ 11.6%Closed ‐
8/23/2019
Apr, 19Diplomat Pharmacy
(DPLO)5.69 5.29 7.0%
Closed ‐
5/16/2019
May, 19 Match Group (MTCH) 61.91 60.90 1.6%Closed
11/6/2019
Jun‐19 Tailored Brands (TLRD) 5.56 4.94 0.18 11.2%Closed ‐
7/24/2019
Jul‐19 Realogy Holdings (RLGY) 6.55 5.60 14.5%Closed ‐
7/24/2019
Aug‐19 Party City Holdco (PRTY) 6.04 4.50 25.5%Closed ‐
8/8/2019
Sep‐19 LendingTree (TREE) 309.02 285.36 ‐ 7.7%Closed ‐
12/13/2019
Oct‐19 Peloton (PTON) 23.01 21.97 4.5%Closed ‐
3/11/2020
Nov‐19Ollie's Bargain Outlet
(OLLI)60.07 59.68 0.6%
Closed ‐
12/5/2019
Dec‐19 Jumia Tech (JMIA) 5.85 5.32 9.1%Closed
2/24/2020
Jan‐20 Grubhub (GRUB) 47.17 41.13 12.8%Closed ‐
3/11/2020
Feb‐20 Yum China (YUMC) 42.71 42.09 0.12 1.5%Closed ‐
3/11/2020
Mar‐20Manchester United
(MANU)17.08 15.66 8.3%
Closed ‐
3/11/2020
Apr‐20 LendingClub (LC) 7.11 6.92 2.7%Closed
4/27/2020
22 | P a g e
Income Generation
Time Horizon: Long‐term
“Looking into the second quarter of 2020, despite significantly highly levels of uncertainty caused by the
COVID‐19 pandemic, [our] current outlook indicates slightly higher wafer demand, mainly supported by
inventory replacement across computer peripheral and the consumer electronics end markets. We will
continue to monitor market dynamics. Meanwhile we anticipate a surge in the number of customers 28
nanometer tape outs in the first half of 2020. While we strive to maintain the business momentum
attained in the first quarter UMC's corporate strategy of delivering high dividend payout ratio remains
intact. In Q1 our Board of Directors proposed to distribute cash dividend of approximately NT$0.75 per
share subject to shareholder approval at the annual shareholder meeting. We will also continue to
strengthen our financial structure while gaining additional market share by excluding our technology
development and the corporate strategy.” ‐‐‐ SC Chien, President of United Microelectronics Corporation,
during the firm’s first quarter of 2020 conference call
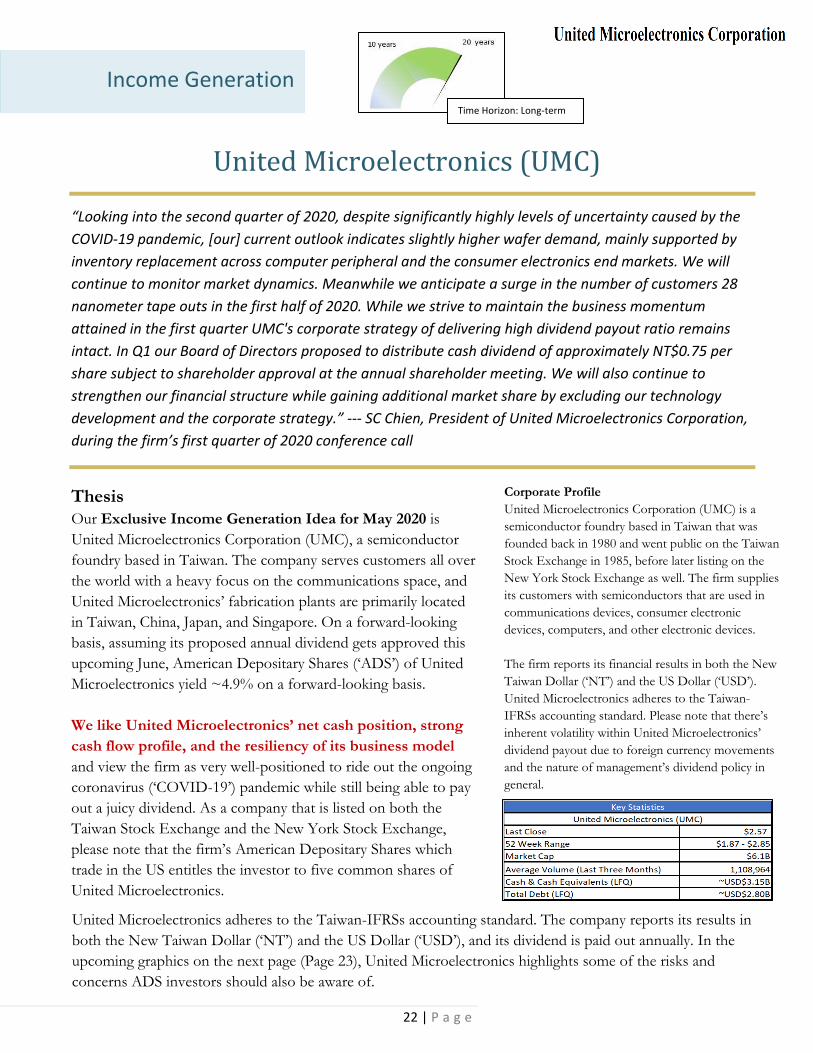
United Microelectronics (UMC)
Thesis Our Exclusive Income Generation Idea for May 2020 is United Microelectronics Corporation (UMC), a semiconductor foundry based in Taiwan. The company serves customers all over the world with a heavy focus on the communications space, and United Microelectronics’ fabrication plants are primarily located in Taiwan, China, Japan, and Singapore. On a forward-looking basis, assuming its proposed annual dividend gets approved this upcoming June, American Depositary Shares (‘ADS’) of United Microelectronics yield ~4.9% on a forward-looking basis. We like United Microelectronics’ net cash position, strong cash flow profile, and the resiliency of its business model and view the firm as very well-positioned to ride out the ongoing coronavirus (‘COVID-19’) pandemic while still being able to pay out a juicy dividend. As a company that is listed on both the Taiwan Stock Exchange and the New York Stock Exchange, please note that the firm’s American Depositary Shares which trade in the US entitles the investor to five common shares of United Microelectronics.
Corporate Profile United Microelectronics Corporation (UMC) is a semiconductor foundry based in Taiwan that was founded back in 1980 and went public on the Taiwan Stock Exchange in 1985, before later listing on the New York Stock Exchange as well. The firm supplies its customers with semiconductors that are used in communications devices, consumer electronic devices, computers, and other electronic devices. The firm reports its financial results in both the New Taiwan Dollar (‘NT’) and the US Dollar (‘USD’). United Microelectronics adheres to the Taiwan-IFRSs accounting standard. Please note that there’s inherent volatility within United Microelectronics’ dividend payout due to foreign currency movements and the nature of management’s dividend policy in general.
United Microelectronics adheres to the Taiwan-IFRSs accounting standard. The company reports its results in both the New Taiwan Dollar (‘NT’) and the US Dollar (‘USD’), and its dividend is paid out annually. In the upcoming graphics on the next page (Page 23), United Microelectronics highlights some of the risks and concerns ADS investors should also be aware of.
23 | P a g e
Image Source: United Microelectronics – 2019 Annual Report (20‐F Filing)
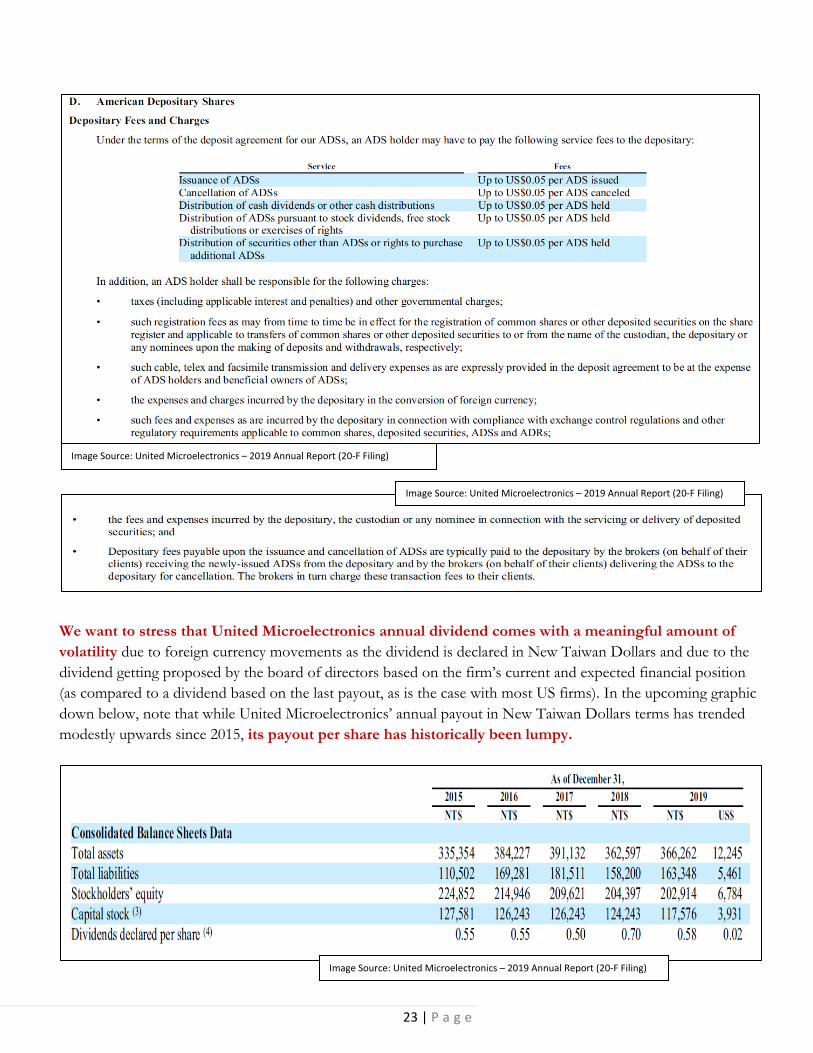
We want to stress that United Microelectronics annual dividend comes with a meaningful amount of volatility due to foreign currency movements as the dividend is declared in New Taiwan Dollars and due to the dividend getting proposed by the board of directors based on the firm’s current and expected financial position (as compared to a dividend based on the last payout, as is the case with most US firms). In the upcoming graphic down below, note that while United Microelectronics’ annual payout in New Taiwan Dollars terms has trended modestly upwards since 2015, its payout per share has historically been lumpy.
Image Source: United Microelectronics – 2019 Annual Report (20‐F Filing)
Image Source: United Microelectronics – 2019 Annual Report (20‐F Filing)
24 | P a g e
According to United Microelectronics’ 2019 Annual Report, the firm’s board of directions has proposed a NT$0.75 per share annual dividend for 2020 that’s expected to get approved in June 2020 during the annual general meeting as you can see in the excerpt below:
On February 26, 2020, our board of directors proposed dividends of NT$9,765,154,720 (approximately NT$0.75 per common share) which are expected to be approved at our annual general meeting on June 10, 2020.
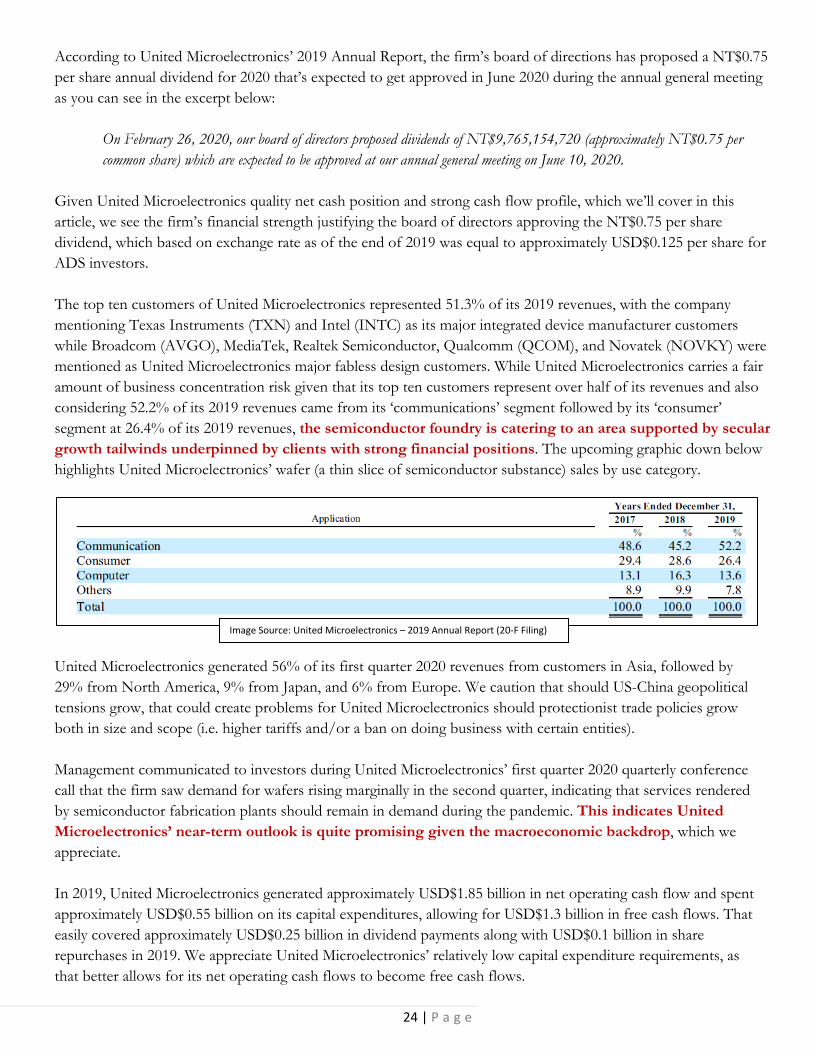
Given United Microelectronics quality net cash position and strong cash flow profile, which we’ll cover in this article, we see the firm’s financial strength justifying the board of directors approving the NT$0.75 per share dividend, which based on exchange rate as of the end of 2019 was equal to approximately USD$0.125 per share for ADS investors. The top ten customers of United Microelectronics represented 51.3% of its 2019 revenues, with the company mentioning Texas Instruments (TXN) and Intel (INTC) as its major integrated device manufacturer customers while Broadcom (AVGO), MediaTek, Realtek Semiconductor, Qualcomm (QCOM), and Novatek (NOVKY) were mentioned as United Microelectronics major fabless design customers. While United Microelectronics carries a fair amount of business concentration risk given that its top ten customers represent over half of its revenues and also considering 52.2% of its 2019 revenues came from its ‘communications’ segment followed by its ‘consumer’ segment at 26.4% of its 2019 revenues, the semiconductor foundry is catering to an area supported by secular growth tailwinds underpinned by clients with strong financial positions. The upcoming graphic down below highlights United Microelectronics’ wafer (a thin slice of semiconductor substance) sales by use category.
Image Source: United Microelectronics – 2019 Annual Report (20‐F Filing)
United Microelectronics generated 56% of its first quarter 2020 revenues from customers in Asia, followed by 29% from North America, 9% from Japan, and 6% from Europe. We caution that should US-China geopolitical tensions grow, that could create problems for United Microelectronics should protectionist trade policies grow both in size and scope (i.e. higher tariffs and/or a ban on doing business with certain entities). Management communicated to investors during United Microelectronics’ first quarter 2020 quarterly conference call that the firm saw demand for wafers rising marginally in the second quarter, indicating that services rendered by semiconductor fabrication plants should remain in demand during the pandemic. This indicates United Microelectronics’ near-term outlook is quite promising given the macroeconomic backdrop, which we appreciate. In 2019, United Microelectronics generated approximately USD$1.85 billion in net operating cash flow and spent approximately USD$0.55 billion on its capital expenditures, allowing for USD$1.3 billion in free cash flows. That easily covered approximately USD$0.25 billion in dividend payments along with USD$0.1 billion in share repurchases in 2019. We appreciate United Microelectronics’ relatively low capital expenditure requirements, as that better allows for its net operating cash flows to become free cash flows.

25 | P a g e
At the end of March 2020, United Microelectronics was carrying approximately USD$3.15 billion in cash and cash equivalents and USD$1.2 billion in long-term ‘funds and investments’ (at least some of which are strategic assets for the company) versus approximately USD$0.85 billion in short-term debt (‘short-term loans’ plus ‘current portions of long-term liabilities’) and USD$1.6 billion in long-term debt, giving the firm a pristine balance sheet which we really appreciate during harrowing times such as these. United Microelectronics’ strong financials lends support to the board of director’s plan to boost the firm’s per share dividend payout this year in New Taiwan Dollar terms, as does its relatively strong near-term outlook. Here’s some management commentary from United Microelectronics’ first quarter 2020 quarterly conference call:
“Let's move on to second quarter 2020 guidance. Our wafer shipments… increased by 1% to 2%. ASP [average selling price] in U.S. dollar is expected to increase by 1% to 2%. The gross profit margin will be approximately 20%. The capacity utilization rate will be in the mid 90% range.” --- SC Chien, President of United Microelectronics Corporation
Additionally, management expects United Microelectronics will allocate USD$1.0 billion towards capital expenditures this year, primarily to build out the firm’s capacity to produce 12-inch wafers (roughly 85% of that budget is expected to be deployed for that purpose). The remaining 15% of its expected capital investment is being allocated towards its 8-inch wafer production capabilities. In the upcoming graphic down below, United Microelectronics highlights its production capabilities at the end of 2019.
Higher utilization rates in the second quarter of 2020 are expected to positively benefit United Microelectronics’ gross margins, which came in at 19.2% on a Taiwan-IFRS basis in the first quarter. We appreciate this relatively optimistic outlook, but caution that management noted during the firm’s last quarterly conference call that predicting United Microelectronics’ financial results past the next quarter is a very tricky task given the ongoing COVID-19 pandemic, which could reduce demand from various sectors as the global economy slows down and consumer habits change. We view United Microelectronics as well-positioned to ride out the storm while its strong cash flow profile combined with its pristine balance sheet should enable the firm to continue paying out a juicy dividend, keeping in mind those annual payouts will be lumpy for the aforementioned reasons. Disclosure: Callum Turcan does not own shares in any of the securities mentioned above.
Image Source: United Microelectronics – 2019 Annual Report (20‐F Filing)

26 | P a g e
Capital Appreciation
Corporate Profile Sprouts Farmers Market Inc (SFM) defines itself as “one of the fastest-growing retailers in the country” and one that “has made healthy living accessible to shoppers for nearly two decades by offering affordable, fresh, natural and organic products” according to its first quarter of 2020 earnings press release. Furthermore, Sprouts notes that the firm “is known for pioneering its unique grocery model by offering a welcoming store layout featuring fresh produce at the center of the store, an expansive bulk foods section, and a vitamin department focused on overall wellness. Sprouts also offers a unique assortment of healthier products with special attributes, such as plant-based, gluten-free, keto-friendly, and grass-fed, to meet the growing and diverse needs of today’s consumer. Headquartered in Phoenix, Ariz., Sprouts employs more than 32,000 team members and operates over 340 stores in 23 states from coast to coast” according to its first quarter of 2020 earnings press release.
Thesis Our May 2020 capital appreciation idea is Sprouts Farmers Market Inc (SFM). For those that are not familiar, the below graphic shows several pictures of what the in-store experience and unique product set looks like. Sprouts is basically targeting a similar target market to Amazon’s (AMZN) Whole Foods, but at a lower price point. The Sprouts customer is looking for wholesome and organic options and is also looking for unique packaged products with a healthier bent as compared to what can be found with the mass brands in the aisles of Kroger (KR), for example.
Sprouts Farmers Market (SFM)
“In the first quarter, net sales grew 16% to $1.6 billion and comparable store sales were up 10.6%
compared to the same period last year. We estimate that COVID‐19 positively impacted sales by $146
million and comps by 9.6%. For the first quarter, gross profit increased 23% to $594 million and our gross
margin was 36.1%, an increase of 180 basis points compared to the same period last year. SG&A increased
16% to $436 million or 26.5% of sales, flat compared to the same period last year.” ‐‐‐ Denise Paulonis, CFO
of Sprouts Farmers Market, during the firm’s first quarter of 2020 conference call
Image Source: Sprouts Farmers Market ‐ Investor Presentation
Time Horizon: Long‐term

27 | P a g e
So, while a Kroger customer might buy a “Tombstone” frozen pizza, a Sprouts customer might buy an “Urban Pie” frozen pizza instead. Instead of “Doritos”, they might buy niche-branded paleo chips. And, instead of “Coke” (KO) or “Pepsi” (PEP), they might be a buyer of “Hansen” Natural Soda which is made by Coca-Cola. In fact, Sprouts does not generally stock a lot of the mass market consumer packaged brands, but rather much more niche and innovative healthier alternatives. As one can tell by the name, there is a farmers’ market type display of both traditional and organic produce, which is at the center of the offering. Sprouts is a small cap stock with small regional share of a quite large target market, as one can see in the upcoming graphic down below. The company is currently benefitting from two tailwinds. First, the firm is rapidly growing its store base with their own funds and doing so quite profitably on a four year out cash on cash basis. Secondly, with the recent massive shift from dining out to dining at home due the COVID-19 virus, grocers are benefitting from a huge boon of unknown duration and magnitude. What is known based on the just announced quarterly results is that Sprouts had a huge jump in same-store sales on the back of this activity, so not only were existing customers stocking up their cabinets (a temporary phenomenon), but also former and new adopting customers have been walking in the door, which we think sets up this grocer very well for the future. While it is clearly just an anecdote, channel checks in Southern California indicate stores did a much better job of staying stocked up than many of its grocer peers, preparing them quite nicely for those wanting to do a full shop in one stop. Locations were better able to stay stocked up because they are dealing with niche brands that are not sold in the mainstream grocery stores to the same extent. We think this bodes well for Sprouts’ inventory management system going forward.
Image Source: Sprouts Farmers Market ‐ Investor Presentation

28 | P a g e
Another consideration that we would point out as a near-term catalyst is that Sprouts has turned over part of its management team and is improving its strategic and tactical decision making. New stores are a bit smaller going forward, which reduces the upfront capital outlay and speeds the time to a higher return on invested capital. New distribution centers are being added in Colorado and Florida to better serve existing stores. This will help with freshness and the economics involved. Sprouts had also been overly promotional, hyping low price points on specific items, without stimulating demand as much as hoped. Instead, the firm now intends to focus more so on preserving its margins and instead plow those marketing dollars into digital brand advertising to shore up the image of the store in consumers’ minds and get more people in the door. All in all, the firm has laid out a strategy to drive low double-digit earnings growth with flat to expanding margins and expanding Return on Invested Capital (‘ROIC’) for the foreseeable future. In our view, we think the runway for profitable store expansion is quite long, as the target market is huge, and we think Whole Foods leaves room for a lower price point wholesome operator to play in their shade with a similar (if scaled down) playbook. Please see the below graphic for all the strategic elements listed in one place.
Image Source: Sprouts Farmers Market ‐ Investor Presentation
29 | P a g e
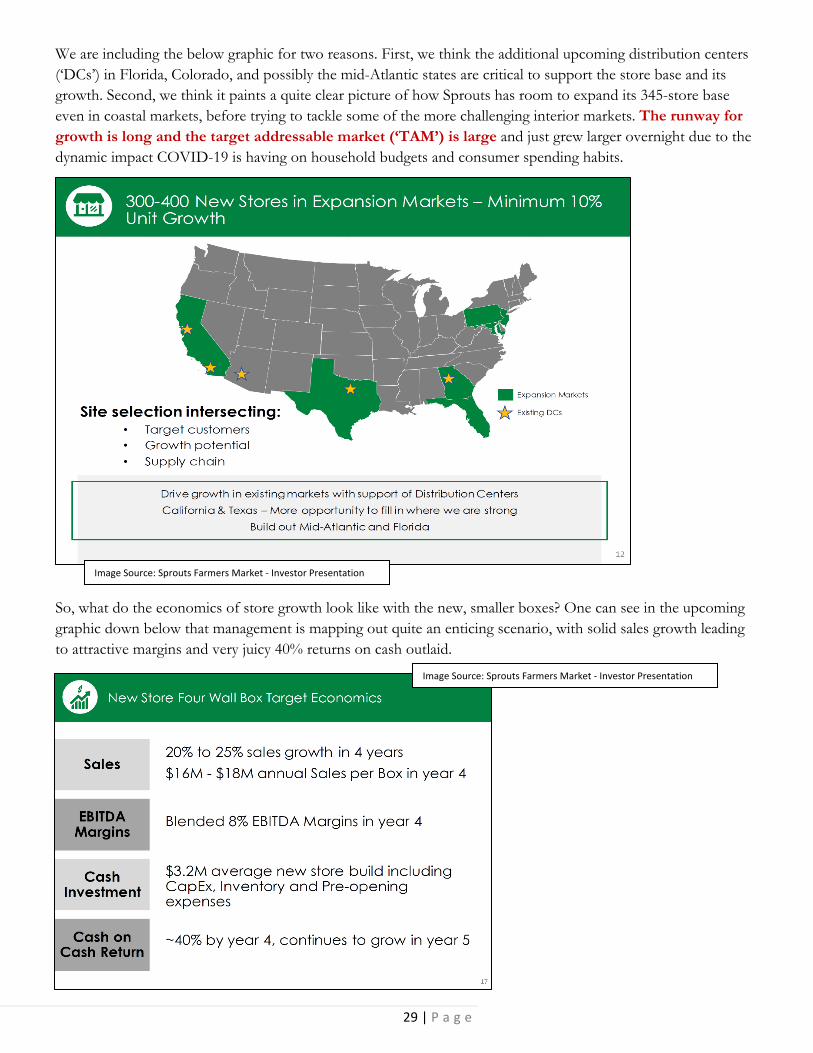
We are including the below graphic for two reasons. First, we think the additional upcoming distribution centers (‘DCs’) in Florida, Colorado, and possibly the mid-Atlantic states are critical to support the store base and its growth. Second, we think it paints a quite clear picture of how Sprouts has room to expand its 345-store base even in coastal markets, before trying to tackle some of the more challenging interior markets. The runway for growth is long and the target addressable market (‘TAM’) is large and just grew larger overnight due to the dynamic impact COVID-19 is having on household budgets and consumer spending habits.
Image Source: Sprouts Farmers Market ‐ Investor Presentation
So, what do the economics of store growth look like with the new, smaller boxes? One can see in the upcoming graphic down below that management is mapping out quite an enticing scenario, with solid sales growth leading to attractive margins and very juicy 40% returns on cash outlaid.
Image Source: Sprouts Farmers Market ‐ Investor Presentation
30 | P a g e
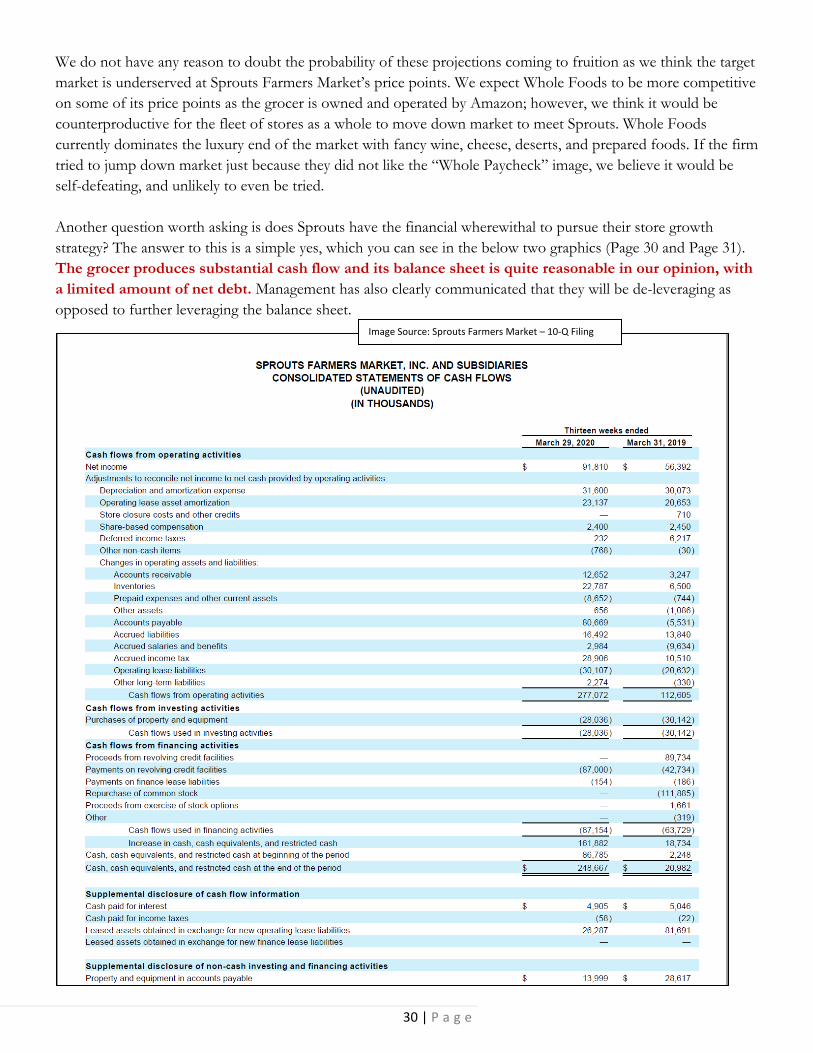
We do not have any reason to doubt the probability of these projections coming to fruition as we think the target market is underserved at Sprouts Farmers Market’s price points. We expect Whole Foods to be more competitive on some of its price points as the grocer is owned and operated by Amazon; however, we think it would be counterproductive for the fleet of stores as a whole to move down market to meet Sprouts. Whole Foods currently dominates the luxury end of the market with fancy wine, cheese, deserts, and prepared foods. If the firm tried to jump down market just because they did not like the “Whole Paycheck” image, we believe it would be self-defeating, and unlikely to even be tried. Another question worth asking is does Sprouts have the financial wherewithal to pursue their store growth strategy? The answer to this is a simple yes, which you can see in the below two graphics (Page 30 and Page 31). The grocer produces substantial cash flow and its balance sheet is quite reasonable in our opinion, with a limited amount of net debt. Management has also clearly communicated that they will be de-leveraging as opposed to further leveraging the balance sheet.
Image Source: Sprouts Farmers Market – 10‐Q Filing

31 | P a g e
From here, let us zero in on management’s stated financial targets, which you can see in the below graphic.
Image Source: Sprouts Farmers Market – 10‐Q Filing
Image Source: Sprouts Farmers Market ‐ Investor Presentation
32 | P a g e
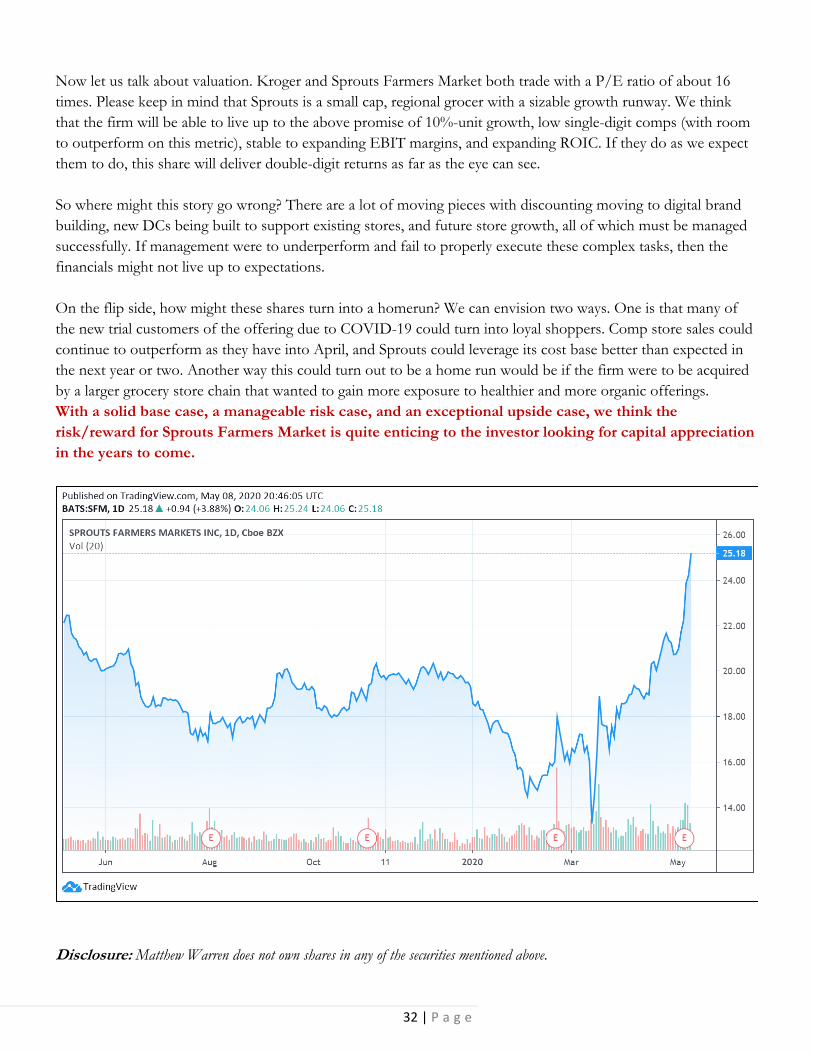
Now let us talk about valuation. Kroger and Sprouts Farmers Market both trade with a P/E ratio of about 16 times. Please keep in mind that Sprouts is a small cap, regional grocer with a sizable growth runway. We think that the firm will be able to live up to the above promise of 10%-unit growth, low single-digit comps (with room to outperform on this metric), stable to expanding EBIT margins, and expanding ROIC. If they do as we expect them to do, this share will deliver double-digit returns as far as the eye can see. So where might this story go wrong? There are a lot of moving pieces with discounting moving to digital brand building, new DCs being built to support existing stores, and future store growth, all of which must be managed successfully. If management were to underperform and fail to properly execute these complex tasks, then the financials might not live up to expectations. On the flip side, how might these shares turn into a homerun? We can envision two ways. One is that many of the new trial customers of the offering due to COVID-19 could turn into loyal shoppers. Comp store sales could continue to outperform as they have into April, and Sprouts could leverage its cost base better than expected in the next year or two. Another way this could turn out to be a home run would be if the firm were to be acquired by a larger grocery store chain that wanted to gain more exposure to healthier and more organic offerings. With a solid base case, a manageable risk case, and an exceptional upside case, we think the risk/reward for Sprouts Farmers Market is quite enticing to the investor looking for capital appreciation in the years to come.
Disclosure: Matthew Warren does not own shares in any of the securities mentioned above.
33 | P a g e
U.S. Global Jets ETF (JETS)
Short Consideration
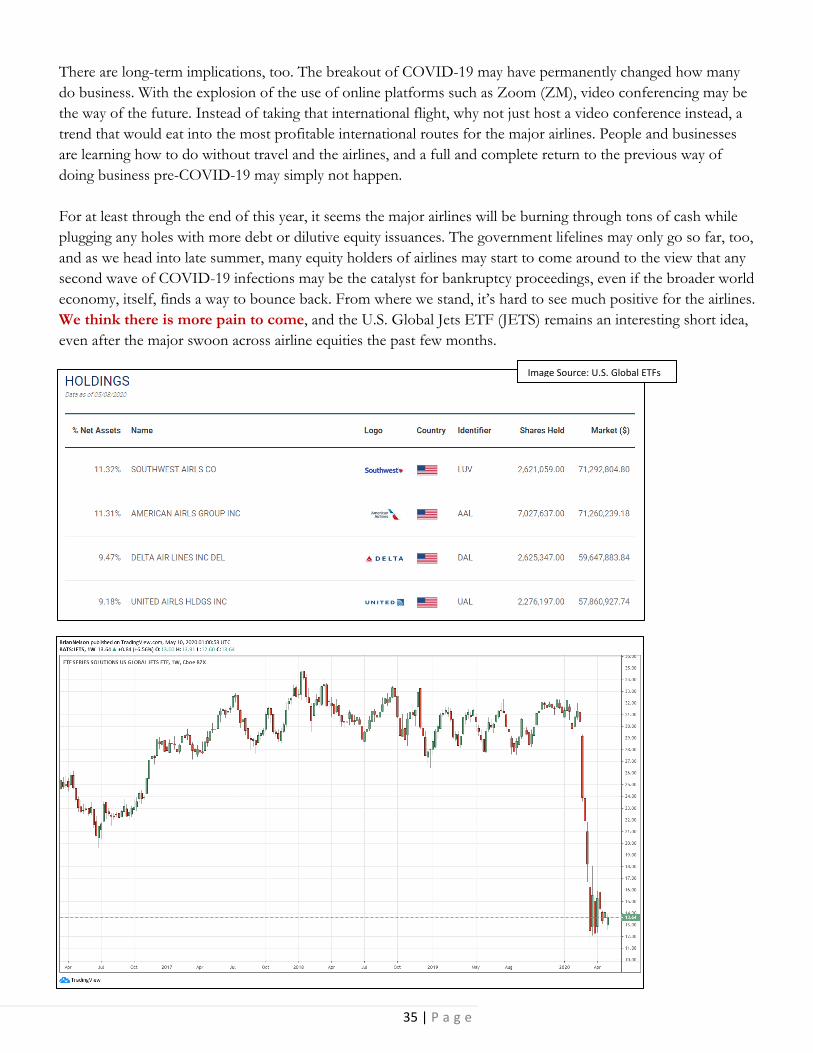
ETF Profile “The U.S. Global Jets ETF (JETS) provides investors access to the global airline industry, including airline operators and manufacturers from all over the world (source: U.S. Global ETFs).” Top holdings for the ETF include Southwest, American, Delta and United, and the ETF comes with a rather hefty expense ratio of 0.6%. Its inception date was April 28, 2015.
Thesis
Perhaps to no surprise to followers of our research, during the past few weeks or so, Warren Buffett sold his stakes in the four major US airlines--American (AAL), Delta Air Lines (DAL), Southwest Airlines (LUV), and United Airlines (UAL)--making the big announcement during the Berkshire Hathaway 2020 Annual Shareholders Meeting earlier this month.
To us, however, not much has changed. As we wrote in the book Value Trap, the airline business has always been a terrible one, and we think Warren Buffett just got swept up in the optimism surrounding the companies when he purchased them years ago. We dedicated part of the intro to this edition of the Exclusive (page 3-4) as to why we never really believed the airline business improved, and we maintain that view today.
Time Horizon: Short term
“The airline business…changed in a very major way, and it has obviously changed in the fact that there are
four (major airlines) that are each going to borrow perhaps an average of at least $10‐$12 billion
each…well you have to pay that back out of earnings over some period of time…you’re $10‐$12 billion
worse off if that happens…in some cases they’re having to sell stock…at these prices, and that takes away
from the upside. I don’t know whether two or three years from now that as many people will fly as many
passenger miles as they did last year (2019); they may, or they may not. The future is much less clear to me
how the business will turn out...If the (airline) business comes back 70%‐80%, the aircraft don’t disappear;
you’ve got too many planes; it didn’t look that way when the orders were placed a few months ago. But
the world changed for airlines. I wish them well.” – Warren Buffett, Berkshire Hathaway 2020 Annual
Shareholders Meeting, May 2, 2020
However, it may be fair to say that things have only gotten worse for airlines. Not only will the major airlines have to take on more leverage (debt), but as Warren Buffett put it in his quote above, the airline business now has too many planes, and this will crush pricing (fares) across the competitive landscape. While many point to a vaccine for COVID-19 as a catalyst for economic improvement, the “new” airline business, however, when it bounces back, may at best be just like the “old,” and that’s not saying much.
What we’re trying to say is that, even when the economy improves, we think there may be more pain to come for the airlines, and that’s why the U.S. Global Jets ETF (JETS) makes it as the May Exclusive short-idea consideration. Overcapacity (too many planes), pricing pressure (perishable inventory—when a plane takes off, the empty seats cannot be filled), too much leverage (requiring new debt to survive), and the list of troubles is only growing. Warren Buffett made a mistake in buying airlines in the first place, but he may be right in ditching them before things get any worse.

34 | P a g e
For starters, the airline business has considerable operating leverage. It may only take one more passenger per flight or one dollar more per ticket across all flights/tickets to make the difference between profit and loss. But what will happen if airlines are forced to do away with the middle seat in a post-COVID-19 social-distancing world? In the case where airlines may require more space between passengers, such a change may make the existing airline business as we know it simply uneconomical. Even with passengers crammed together pre-COVID-19, for example, airlines still weren’t able to consistently earn their cost of capital (see intro, page 3-4). What are they going to do? The reality is that the airline business may be required to undergo some serious costly changes. For one, some planes may need to be retrofitted to reduce the number of seats in them, and this, itself, may mean their business models suffer further. Airlines count on filling planes with as many seats as possible, and even at high loads, some flights barely breakeven. Not only may the number of passengers per plane structurally change in a post-COVID-19 world, but crude oil prices are bouncing back as the world re-opens for business. That means that there may be no relief from the energy costs it still takes to fly planes with reduced revenue (passengers). Part of the reason why we didn’t like the airline business in the first place is that flying from point to point is a commodity, and consumers flock to the lower ticket price. Passengers aren’t going to pay up to offset an airlines’ lower revenue caused by a reduced number of flyers on each plane. But let’s say that social distancing measures (and the empty middle seat) go away by the end of this year, the industry will have taken on a burden of too much debt just to make it that far, and recent indications are that it’s not easy for many of them right now to float new issues without it being too cost prohibitive (United recently pulled a bond offering). What about later this year when borrowing capacity is even more depleted? Even Warren Buffett backed down from supporting his equity positions by stopping short of issuing the airlines preferred stock; if that’s any indication, it seems like many of the airlines are more likely to head for Chapter 11 in the coming months than to bounce back with any material equity residual remaining.
Image Source: U.S. Global ETFs
35 | P a g e
There are long-term implications, too. The breakout of COVID-19 may have permanently changed how many do business. With the explosion of the use of online platforms such as Zoom (ZM), video conferencing may be the way of the future. Instead of taking that international flight, why not just host a video conference instead, a trend that would eat into the most profitable international routes for the major airlines. People and businesses are learning how to do without travel and the airlines, and a full and complete return to the previous way of doing business pre-COVID-19 may simply not happen. For at least through the end of this year, it seems the major airlines will be burning through tons of cash while plugging any holes with more debt or dilutive equity issuances. The government lifelines may only go so far, too, and as we head into late summer, many equity holders of airlines may start to come around to the view that any second wave of COVID-19 infections may be the catalyst for bankruptcy proceedings, even if the broader world economy, itself, finds a way to bounce back. From where we stand, it’s hard to see much positive for the airlines. We think there is more pain to come, and the U.S. Global Jets ETF (JETS) remains an interesting short idea, even after the major swoon across airline equities the past few months.
Image Source: U.S. Global ETFs

36 | P a g e
Inaugural Letter to Members
Dear Valued Member, Welcome! You are one of a very limited number of members that will ever bear witness to the pages that follow. The launch week of the Nelson Exclusive coincided with news that Britain has voted to leave the European Union. The decision, while sending the European banks tumbling violently, does little to muddy the context setting the background of the inaugural edition of this publication. Broader stock market valuations are at frothy levels, and interest rates continue to hover near all-time lows. The investment-decision landscape is more complicated today than ever before for all types of investors, from those seeking long-term capital appreciation to those that are targeting certain income goals. Cyclicals today are trading at peak multiples on peak earnings, and even consumer staples equities have reached valuation levels that may be more appropriate for aggressive growth equities, not mature operators. Said differently, the market has laid down the gauntlet. The next few years in the markets may be among the most difficult witnessed since the Great Recession. Even a broader market pullback 20% from current all-time highs wouldn’t be abnormal given that the collective market valuation of S&P 500 companies has effectively tripled from the March 2009 panic bottom. The launch of the Nelson Exclusive in such conditions can be considered perilous as broader market performance inevitably will act as ballast to the returns of ideas surfaced. In this spirit, I want to remind you that not all ideas in this publication will be successful, and some that are eventually may encounter tough sledding over extended periods of time. As a swimmer cannot achieve his best time swimming against the current, a stock selector cannot achieve his best performance in a down market. Regardless, the value placed on a steady hand during challenging times is priceless. Let’s first cover what the Exclusive is and then we’ll talk about what it is not. As you know, the Valuentum investment coverage universe is vast, and what we’re seeking to deliver in this publication is ideas that fall outside its reach. We’re breaking down the traditional barriers of equity coverage to identify underfollowed gems across the investing spectrum, delivering in each monthly edition one idea for income investors, one idea for readers seeking long-term capital appreciation, and a bonus idea for those looking for a “short” consideration (1). Underfollowed doesn’t mean obscure, however, and the ideas that we’re targeting will be investable ones, avoiding thinly-traded instruments and penny stock “traps.” We’ll clearly define our expected time horizon for each consideration, and where applicable, we’ll update our theses in subsequent editions. We’ll keep score, tracking performance over time. Let’s talk about what the Exclusive isn’t. The Exclusive does not constitute individual investment advice, and the ideas within it are not personal recommendations. Each of you reading should always work with your
July 1, 2016
37 | P a g e
personal financial advisor who knows your individual goals and risk tolerances. I do not. Only you and your personal financial advisor know what’s best for your life circumstances. The personal financial advising markets and what we do at Valuentum via financial publishing are two different verticals in the same industry, but they are different nonetheless. I just want to be very clear about this because I can never tell you to buy or sell anything at any time, even if this may be what you want. It’s not that I don’t have conviction in my work – it’s the rules of the business. Within the twelve editions of the Nelson Exclusive each year, we’ll be highlighting in total 36 ideas for consideration with varying investment parameters. That’s a lot. Depending on the time horizon set forth with each idea, fantastic performance might mean a success rate of 60%, great performance might be 55%, average performance might be 50%, while anything below that mark may constituent a poor showing. Obviously, I’m aiming for a 100% success rate, but I also have to be realistic. The great Joe DiMaggio may have hit safely for 56 consecutive games in the last baseball season before the United States was thrust into World War II, but he “only” hit .357 that year. That season of ‘41, the great Ted Williams would be the last player to hit .400, meaning that one of the best hitters in baseball…ever…was still called out ~60% of the time. The greatest investors face a similar paradigm. Stock selection is a process where there will be homeruns and strikeouts. You know me. The Exclusive is not a “get-rich-quick” product, and you should keep a close eye on your wallet if you encounter anyone promising anything of the sort. In the inaugural edition of the Nelson Exclusive, I’m going to take 36 swings – they are going to be hard and through the zone, and I’m not going to pull my shoulder out or take my eye off the ball. Market conditions are expected to be stormy in coming years as “reversion-to-the-mean” dynamics rain down, and a crafty lefthander with great “stuff” may be on the mound, but we’re stepping up to the plate and digging in. Batter up! Sincerely, Brian Nelson, CFA President, Investment Research & Analysis Valuentum Securities, Inc. [email protected] P.S. On a very personal note, I wanted to thank you for your continued support. Without you, neither the Nelson Exclusive publication nor Valuentum would exist. This fact is not lost on me. I thank you deeply.

38 | P a g e
(1) From the SEC’s website: A short sale is the sale of a stock that an investor does not own or a sale
which is consummated by the delivery of a stock borrowed by, or for the account of, the investor. Short
sales are normally settled by the delivery of a security borrowed by or on behalf of the investor. The
investor later closes out the position by returning the borrowed security to the stock lender, typically by
purchasing securities on the open market.
Investors who sell stock short typically believe the price of the stock will fall and hope to buy the stock
at the lower price and make a profit. Short selling is also used by market makers and others to provide
liquidity in response to unanticipated demand, or to hedge the risk of an economic long position in the
same security or in a related security. If the price of the stock rises, short sellers who buy it at the
higher price will incur a loss.
Brokerage firms typically lend stock to customers who engage in short sales, using the firm’s own
inventory, the margin account of another of the firm’s customers, or another lender. As with buying
stock on margin, short sellers are subject to the margin rules and other fees and charges may apply
(including interest on the stock loan). If the borrowed stock pays a dividend, the short seller is
responsible for paying the dividend to the person or firm making the loan (Source: SEC
https://www.sec.gov/answers/shortsale.htm)
Short selling is not for all types of investors, and readers should consult their personal financial advisor
that understands their individual goals and risk tolerances before considering any investment or any
strategy. Potential losses for an investor engaging in a short selling strategy are theoretically infinite.
Copyright @2020 by Valuentum, Inc. All rights reserved.
No part of this publication may be reproduced in any form or by any means.
The information contained in this report is not represented or warranted to be accurate, correct,
complete, or timely. This report is for informational purposes only and should not be considered a
solicitation to buy or sell any security. No warranty or guarantee may be created or extended by sales or
promotional materials, whether by email or in any other format. The securities or strategies mentioned
herein may not be suitable for all types of investors. The information contained in this report does not
constitute any advice, especially on the tax consequences of making any particular investment decision.
This material is not intended for any specific type of investor and does not take into account an
investor's particular investment objectives, financial situation or needs. This report is not intended as a
recommendation of the security highlighted or any particular investment strategy. Before acting on any
information found in this report, readers should consider whether such an investment is suitable for their
particular circumstances, perform their own due diligence, and if necessary, seek professional advice.
The sources of the data used in this report are believed by Valuentum to be reliable, but the data’s
accuracy, completeness or interpretation cannot be guaranteed. Assumptions, opinions, and estimates
are based on our judgment as of the date of the report and are subject to change without notice.
Valuentum is not responsible for any errors or omissions or for results obtained from the use of this
report and accepts no liability for how readers may choose to utilize the content. In no event shall
Valuentum be liable to any party for any direct, indirect, incidental, exemplary, compensatory, punitive,
special or consequential damages, costs, expenses, legal fees, or losses (including, without limitation,
lost income or lost profits and opportunity costs) in connection with any use of the information
contained in this document. Investors should consider this report as only a single factor in making their
investment decision.
Valuentum is not a money manager, is not a registered investment advisor, and does not offer brokerage
or investment banking services. Valuentum has not received any compensation from the company or
companies highlighted in this report. Valuentum, its employees, independent contractors and affiliates
may have long, short or derivative positions in the securities mentioned herein. Information and data in
Valuentum’s valuation models and analysis may not capture all subjective, qualitative influences such
as changes in management, business and political trends, or legal and regulatory developments.
Redistribution is prohibited without written permission. Readers should be aware that information in
this work may have changed between when this work was written or created and when it is read. There
is risk of substantial loss associated with investing in financial instruments.
Valuentum's company-specific forecasts used in its discounted cash flow model are rules-based. These
rules reflect the experience and opinions of Valuentum's analyst team. Historical data used in our
valuation model is provided by Xignite and from other publicly available sources including annual and
quarterly regulatory filings. Stock price and volume data is provided by Xignite. No warranty is made
regarding the accuracy of any data or any opinions. Valuentum's valuation model is based on sound
academic principles, and other forecasts in the model such as inflation and the equity risk premium are
based on long-term averages. The Valuentum proprietary automated text-generation system creates text
that will vary by company and may often change for the same company upon subsequent updates.
Valuentum uses its own proprietary stock investment style and industry classification systems. Peer
companies are selected based on the opinions of the Valuentum analyst team. Research reports and data
are updated periodically, though Valuentum assumes no obligation to update its reports, opinions, or
data following publication in any form or format. Performance assessment of Valuentum metrics,
including the Valuentum Buying Index, is ongoing, and we intend to update investors periodically,
though Valuentum assumes no obligation to do so. Not all information is available on all companies.
There may be a lag before reports and data are updated for stock splits and stock dividends.
The information provided regarding the measurement of Nelson Exclusive ideas is hypothetical, and
trading is simulated. Past simulated performance, whether backtested or walk-forward or other, is not a
guarantee of future results. Actual results of ideas may differ from the performance information being
presented in the Nelson Exclusive publication. No assurances can be made regarding the calculations.
For general information about Valuentum's products and services, please contact us at
[email protected] or visit our website at www.valuentum.com.
The Nelson Exclusive: Volume 5, Issue 5
The Nelson Exclusive is published monthly. Contact us at
[email protected] for more information.
Link to data source for the picture on Page 3:
https://www.iata.org/en/iata-
repository/publications/economic-reports/new-study-on-
airline-investor-returns/