Value of Solar in Utah
19
Value of Solar in Utah Prepared for Utah Clean Energy January 7, 2014
Transcript of Value of Solar in Utah

Value of Solar in Utah
Prepared for
Utah Clean Energy
January 7, 2014
Brandy
Typewritten Text
UCE Exhibit 2.1 (DT) [COS+RD] Docket No. 13-035-184
Brandy
Typewritten Text
Brandy
Typewritten Text
Brandy
Typewritten Text

Value of Solar in Utah | Utah Clean Energy
Clean Power Research i
Principal Investigators
Clean Power Research
Benjamin L. Norris
Legal Notice
This report was prepared for Utah Clean Energy by Clean Power Research. This report should not be
construed as an invitation or inducement to any party to engage or otherwise participate in any
transaction, to provide any financing, or to make any investment.
Any information shared with Utah Clean Energy prior to the release of the report is superseded by the
Report. Clean Power Research owes no duty of care to any third party and none is created by this
report. Use of this report, or any information contained therein, by a third party shall be at the risk of
such party and constitutes a waiver and release of Clean Power Research, its directors, officers,
partners, employees and agents by such third party from and against all claims and liability, including,
but not limited to, claims for breach of contract, breach of warranty, strict liability, negligence, negligent
misrepresentation, and/or otherwise, and liability for special, incidental, indirect, or consequential
damages, in connection with such use.
Value of Solar in Utah | Utah Clean Energy
Clean Power Research ii
Executive Summary
Introduction
Utah Clean Energy contracted with Clean Power Research (CPR) in 2013 to estimate the Value of Solar™
(“VOS”) in Utah for the territory served by Rocky Mountain Power (RMP).
The VOS result represents value of gross energy produced by PV (before loads) and includes delivery,
generation capacity, transmission capacity, transmission and distribution line losses, and environmental
value. The VOS is the sum of several value components, each of which is calculated separately using
established methodologies. Economic and technical assumptions were provided by Utah Clean Energy
who coordinated data requests to Rocky Mountain Power (UT Docket No. 11-035-104).
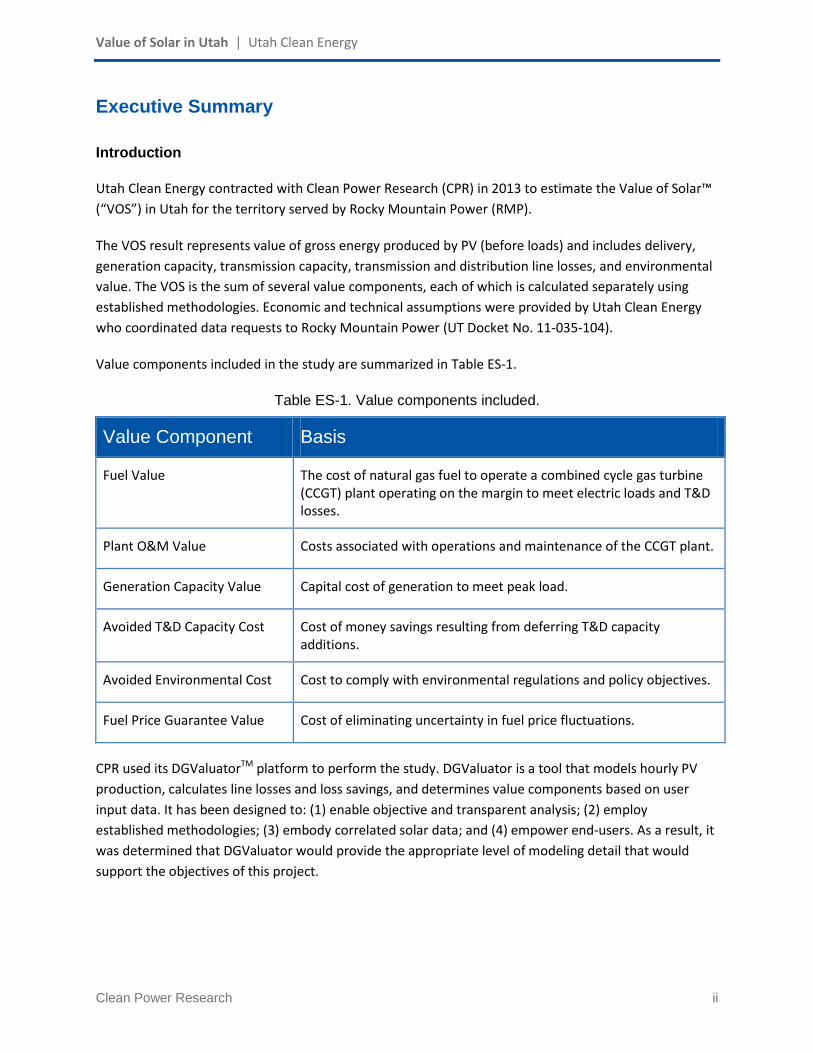
Value components included in the study are summarized in Table ES-1.
Table ES-1. Value components included.
Value Component Basis
Fuel Value The cost of natural gas fuel to operate a combined cycle gas turbine (CCGT) plant operating on the margin to meet electric loads and T&D losses.
Plant O&M Value Costs associated with operations and maintenance of the CCGT plant.
Generation Capacity Value Capital cost of generation to meet peak load.
Avoided T&D Capacity Cost Cost of money savings resulting from deferring T&D capacity additions.
Avoided Environmental Cost Cost to comply with environmental regulations and policy objectives.
Fuel Price Guarantee Value Cost of eliminating uncertainty in fuel price fluctuations.
CPR used its DGValuatorTM platform to perform the study. DGValuator is a tool that models hourly PV
production, calculates line losses and loss savings, and determines value components based on user
input data. It has been designed to: (1) enable objective and transparent analysis; (2) employ
established methodologies; (3) embody correlated solar data; and (4) empower end-users. As a result, it
was determined that DGValuator would provide the appropriate level of modeling detail that would
support the objectives of this project.

Value of Solar in Utah | Utah Clean Energy
Clean Power Research iii
PV Production Data
A sample PV system definition was selected as a 1 kW-AC south-facing system with a 40° tilt located in
Salt Lake City, Utah. Hourly production for 2012 was obtained by modeling this system using
SolarAnywhere® satellite-based meteorological data. The calculated VOS corresponds to the energy and
effective capacity of this selected system.
Results
The VOS analysis was performed by separating the analysis into economic and technical components.
The economic value is calculated based on perfect load match and no losses. The result is then modified
as required using “Load Match” factors to reflect the match between PV production profiles and utility
loads. Finally a “Loss Savings” factor is applied to reflect the distributed nature of the resource. Results
are presented in Table ES-2 and Figure ES-1.
For example, the Generation Capacity value is first calculated as $0.021 per kWh for a perfect centrally
located (non-distributed) resource. The ELCC of the PV resource is determined to be 53% of the perfect
resource, so this factor is included. Finally, an ELCC-specific loss factor1 is determined to be 25% to take
into account marginal hourly loss savings provided by PV. When these factors are considered, the
Generation Capacity value is re-calculated as $0.011 per kWh.
The total VOS with all components included is calculated as $0.116 per kWh. This value is a levelized
value representing all avoided costs over a 25-year assumed PV life.
Table ES-2. Levelized value of ideal resource and distributed PV ($ per kWh)
1 The loss factor is calculated by calculating the ELCC both with (65.8%) and without (52.7%) T&D losses. When
including loss savings, the losses are calculated hourly based on the PV output for that hour, and determining the marginal losses. The loss model is a quadratic form with coefficients determined such that the annual average losses and peak hour losses are in agreement with the input data.
Economic
Value
Load Match
(No Losses)
Distributed
Loss Savings
Distributed
PV Value
($/kWh) (%) (%) ($/kWh)
Fuel Value $0.037 16% $0.043
Plant O&M Value $0.011 16% $0.013
Gen. Capacity Value $0.021 53% 25% $0.014
Avoided T&D Capacity Cost $0.017 53% 25% $0.011
Avoided Environmental Cost $0.009 0% $0.009
Fuel Price Guarantee Value $0.022 16% $0.026
$0.118 $0.116

Value of Solar in Utah | Utah Clean Energy
Clean Power Research iv
Figure ES-1. Levelized value of solar at ($ per kWh)

Value of Solar in Utah | Utah Clean Energy
Clean Power Research v
Contents
Executive Summary ....................................................................................................................................... ii
Introduction .............................................................................................................................................. ii
PV Production Data .................................................................................................................................. iii
Results ...................................................................................................................................................... iii
Introduction to VOS ...................................................................................................................................... 1
Value Components Included ..................................................................................................................... 1
Fuel Value .............................................................................................................................................. 2
Plant O&M Value .................................................................................................................................. 2
Generation Capacity Value ................................................................................................................... 2
Avoided T&D Capacity Cost .................................................................................................................. 2
Avoided Environmental Cost ................................................................................................................ 2
Fuel Price Guarantee Value ................................................................................................................... 3
Calculation tool ......................................................................................................................................... 3
Economic Assessment ................................................................................................................................... 4
Technical Assessment ................................................................................................................................... 7
Overview ................................................................................................................................................... 7
Step 1: Obtain Historical Load Data ...................................................................................................... 7
Step 2: Obtain PV Production Data ....................................................................................................... 7
Step 3: Quantify Load Match ................................................................................................................ 7
ELCC Method ......................................................................................................................................... 7
Peak Load Reduction Method ............................................................................................................... 7
Step 4: Quantify Loss Savings ................................................................................................................ 8
Loss Savings Analysis ................................................................................................................................. 8
Technical Results ....................................................................................................................................... 9
Summary Results......................................................................................................................................... 10
Conclusions ................................................................................................................................................. 12
Appendix ..................................................................................................................................................... 13

Value of Solar in Utah | Utah Clean Energy
Clean Power Research 1
Introduction to VOS
This report quantifies the value of distributed solar power production by behind-the-meter PV systems
in the Utah service territory of Rocky Mountain Power (RMP). The Value of Solar (VOS) is the value of PV
production, before serving load, from the utility perspective. It uses methodologies and analytical tools
that have been developed by Clean Power Research over several years.
The framework supposes that PV is located in the distribution system. PV that is located close to the
loads provides the highest value per unit of energy to the utility because line losses are avoided, thereby
increasing the value of solar relative to centrally-located resources.
Framing a VOS analysis requires answers to two fundamental questions. First, what benefits should be
included? This requires defining the benefits, identifying the recipients, and making a selection as to
what should be included. Second, how should the benefits calculated? This includes defining
methodology and selecting input assumptions.
Value Components Included
The first question is, “What benefits should be included?” The two broad categories of benefit recipients
are the utility and ratepayers/taxpayers. This study only examines the utility’s perspective. The value
components included in the study are summarized in Table 1. Thus, the VOS from RMP’s perspective
may be considered to be the sum of the value components presented in Table 1.
Table 1. Value components included.
Value Component Basis
Fuel Value The cost of natural gas fuel to operate a gas turbine (CCGT) plant operating on the margin to meet electric loads and T&D losses.
Plant O&M Value Costs associated with operations and maintenance of the CCGT plant.
Generation Capacity Value Capital cost of generation to meet peak load.
Avoided T&D Capacity Cost Cost of money savings resulting from deferring T&D capacity additions.
Avoided Environmental Cost Cost to comply with environmental regulations and policy objectives.
Fuel Price Guarantee Value Cost of eliminating uncertainty in fuel price fluctuations.

Value of Solar in Utah | Utah Clean Energy
Clean Power Research 2
The following sections provide brief descriptions of these components.
Fuel Value
Distributed PV generation offsets the cost of power generation. Each kWh generated by PV results in
one less unit of energy that the utility needs to purchase or generate. In addition, distributed PV reduces
losses in the transmission and distribution systems so that the cost of the wholesale generation that
would have been lost is also a contributor to value.
Under this study, the value is defined as the cost of natural gas fuel that would otherwise have to be
purchased to operate a gas turbine (CCGT) plant and meet electric loads and overcome T&D losses. The
study presumes that the energy delivered by PV displaces energy at this plant for each hour of the study
period with loss calculations being based on each hour.
Whether the utility receives the fuel savings directly by avoiding fuel purchases, or indirectly by reducing
wholesale power purchases, the method of calculating the value is the same.
Plant O&M Value
For the same reasons described for Fuel Value, the utility realizes a savings in O&M costs due to
decreased use of the CCGT plant. The cost savings are assumed to be proportional to the avoided
energy, including loss savings.
Generation Capacity Value
In addition to the fuel and O&M savings, the total cost of power includes the capital cost of the
generation plant. To the extent that PV displaces the need for generation capacity, it would be valued as
the capital cost of displaced generation. The key to valuing this component is to determine the effective
load carrying capability (ELCC) of the PV resource. This is accomplished through an analysis of hourly PV
production relative to utility generation.
Avoided T&D Capacity Cost
PV has the potential to provide savings on T&D infrastructure investments. As in the case of generation
capacity, the timing PV production is important relative to the loading on the line, and the ELCC is used
here as well as a measure of effective line capacity relief.
Avoided Environmental Cost
PV has the potential to reduce costs that the utility incurs in satisfying environmental compliance goals
or state laws. Environmental value calculated here assumes no benefit on line loss savings, similar to
REC definitions.
Value of Solar in Utah | Utah Clean Energy
Clean Power Research 3
Fuel Price Guarantee Value
PV displaces energy generated from a marginal unit, so it avoids the cost of fuel associated with this
generation. Furthermore, the PV system is assumed to have a service life of 25 years, so the uncertainty
in fuel price fluctuations is also eliminated over this period. This component indicates the value of the
elimination of uncertainty in fuel price fluctuations.
Calculation tool
CPR used its DGValuatorTM V2 platform to perform the study. DGValuator is a tool that models hourly PV
production, calculates line losses and loss savings, and determines value components based on user
input data. It has been designed to: (1) enable objective and transparent analysis; (2) employ
established methodologies; (3) embody correlated solar data; and (4) empower end-users. As a result, it
was determined that DGValuator would provide the appropriate level of modeling detail that would
support the objectives of this project.

Value of Solar in Utah | Utah Clean Energy
Clean Power Research 4
Economic Assessment
The VOS analysis includes both economic and technical analyses. The overall approach is to calculate the
economic value for an “Ideal Resource” and then to modify this result as necessary based on the “Load
Match” for capacity-based benefits to reflect the match between PV and utility loads and “Loss Savings”
to reflect the distributed nature of the resource.
Table 2 summarizes key assumptions for the economic assessment. The study period was assumed to be
25 years. The assumed life of PV systems is 25 years with output degrading at 0.5 percent per year. The
discount rate used is 6.882 percent.
PV is assumed to displace power generated from a combined cycle combustion turbine (CCCT)2. In the
data request, RMP provided data for a simple cycle combustion turbine (SCCT); however this was not
used as the baseline VOS case. The SCCT has a lower capital cost (resulting in a lower generation
capacity cost) but a significantly higher heat rate (resulting in a significantly higher fuel value. The heat
rate was the dominant factor, and CPR believes that the CCCT would be more representative of the
resource displaced by solar over its operating hours. Therefore, the CCCT was used as the baseline, but a
separate case is included in the Appendix using the SCCT for completeness.
Capital cost, installation year, O&M, heat rate, and escalation values are all presented in the table. In
addition, a reserve planning margin is included because solar is located in the distribution system,
reducing the overall loads that would be used for determining reserve requirements.
Utah Clean Energy provided the avoided environmental cost.
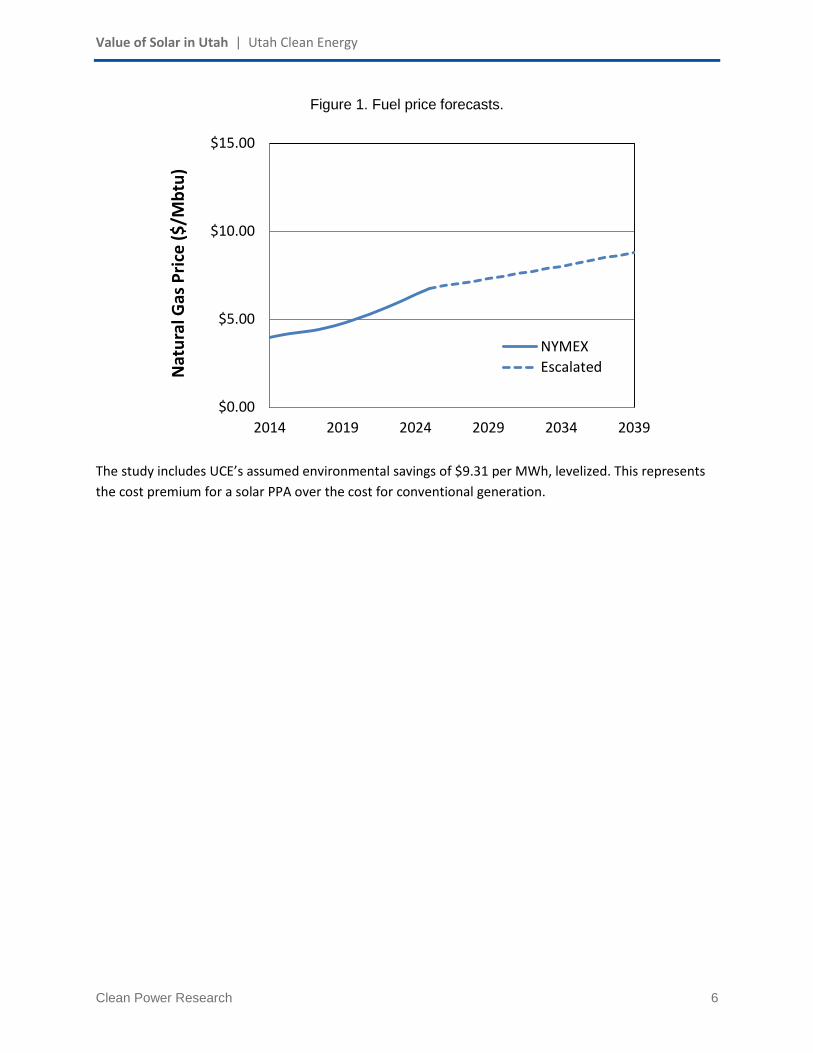
Natural gas prices are the NYMEX futures prices as of August 27, 2013, with a 1.9% escalation assumed
for years beyond the 12-year NYMEX product availability. These are shown in Figure 1.
2 Integrated Resource Plan, 423 MW CCCT “J” Adv 1x1 (1,500 AFSL).

Value of Solar in Utah | Utah Clean Energy
Clean Power Research 5
Table 2. Input data provided by RMP and UCE.
Economic Factors
Start Year 2014
Discount Rate 6.882% per year
General Escalation Rate 1.90% per year
PV Assumptions
PV Degradation 0.50% per year
PV Life 25 years
Utility-Owned Generation
Capacity
Generation Overnight Capacity Cost $962 per kW
Years Until New Gen Capacity Is Needed 11 years
Capacity Cost Escalation Rate 1.90% per year
Generation Life 30 years
Reserve Planning Margin 13%
Energy
Heat Rate 6495 BTU per kWh
Heat Rate Degradation 0.000% per year
O&M cost (first Year) - Fixed $31.29 per kW-yr
O&M cost (first Year) - Variable $0.0024 $ per kWh
O&M cost escalation rate 1.90% per year
Environmental
Avoided Environmental Cost $0.00931 per kWh
Transmission & Distribution
Capacity-related transmission capital cost $34.8 per kW-yr
Years until new transmission capacity is needed 1 years
Transmission lifetime 58 years
Transmission capital cost escalation 1.90% per year
Value of Solar in Utah | Utah Clean Energy
Clean Power Research 6
Figure 1. Fuel price forecasts.
The study includes UCE’s assumed environmental savings of $9.31 per MWh, levelized. This represents
the cost premium for a solar PPA over the cost for conventional generation.
$0.00
$5.00
$10.00
$15.00
2014 2019 2024 2029 2034 2039
Nat
ura
l Gas
Pri
ce (
$/M
btu
)
NYMEX
Escalated
Value of Solar in Utah | Utah Clean Energy
Clean Power Research 7
Technical Assessment
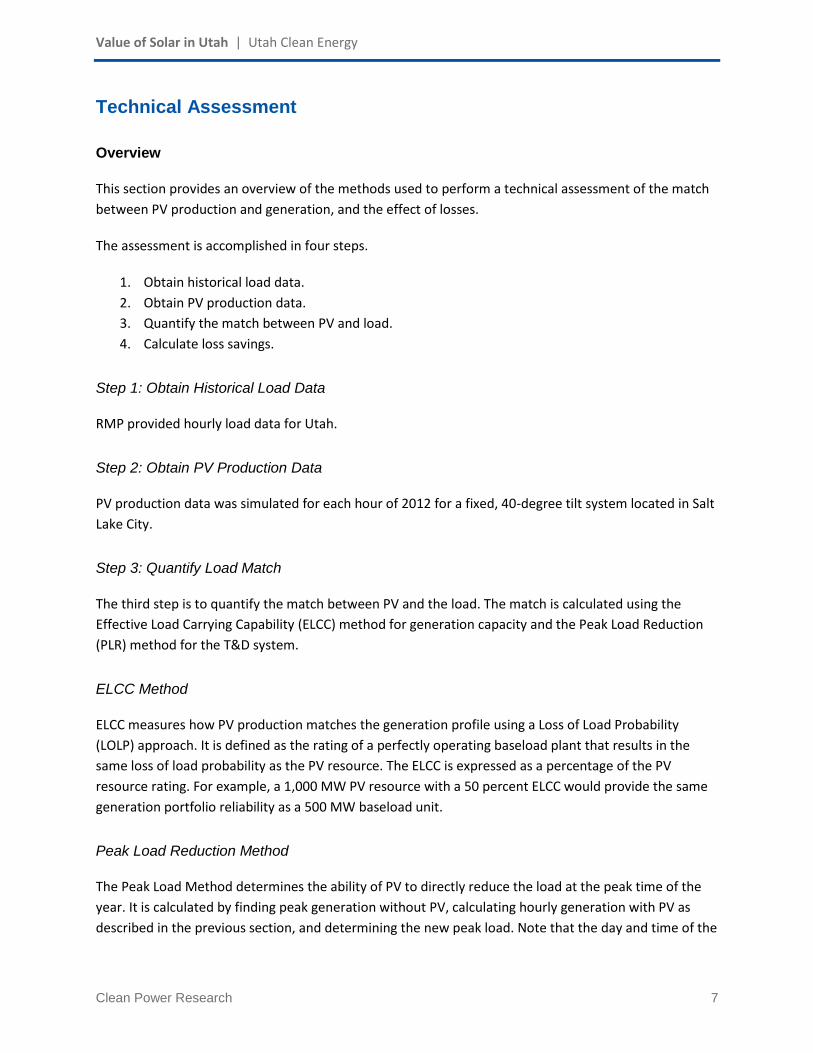
Overview
This section provides an overview of the methods used to perform a technical assessment of the match
between PV production and generation, and the effect of losses.
The assessment is accomplished in four steps.
1. Obtain historical load data.
2. Obtain PV production data.
3. Quantify the match between PV and load.
4. Calculate loss savings.
Step 1: Obtain Historical Load Data
RMP provided hourly load data for Utah.
Step 2: Obtain PV Production Data
PV production data was simulated for each hour of 2012 for a fixed, 40-degree tilt system located in Salt
Lake City.
Step 3: Quantify Load Match
The third step is to quantify the match between PV and the load. The match is calculated using the
Effective Load Carrying Capability (ELCC) method for generation capacity and the Peak Load Reduction
(PLR) method for the T&D system.
ELCC Method
ELCC measures how PV production matches the generation profile using a Loss of Load Probability
(LOLP) approach. It is defined as the rating of a perfectly operating baseload plant that results in the
same loss of load probability as the PV resource. The ELCC is expressed as a percentage of the PV
resource rating. For example, a 1,000 MW PV resource with a 50 percent ELCC would provide the same
generation portfolio reliability as a 500 MW baseload unit.
Peak Load Reduction Method
The Peak Load Method determines the ability of PV to directly reduce the load at the peak time of the
year. It is calculated by finding peak generation without PV, calculating hourly generation with PV as
described in the previous section, and determining the new peak load. Note that the day and time of the

Value of Solar in Utah | Utah Clean Energy
Clean Power Research 8
new (reduced) peak may be different than the original peak. The difference between these two numbers
is the peak load reduction. It is a very stringent test in that it is a “worst case” analysis.
For example, suppose the utility’s annual peak was 10,000 MW at 6 pm on August 15 and that the
addition of 1,000 MW of distributed PV reduces the peak to 9,500 MW at 7 pm on July 14, then the
resource would have an effective reduction of 500 MW, or 50 percent of rated capacity.
Step 4: Quantify Loss Savings
The final step is to quantify loss savings. Loss savings are calculated by comparing the difference
between the results for the distributed and central PV from the previous step. For example, if
distributed PV has a 60 percent ELCC and central PV has a 50 percent ELCC for central PV, loss savings
equal 20 percent (60%/50% - 100% = 20%).
Loss Savings Analysis
Hourly losses (combined transmission and distribution losses) were calculated using a model in the form
A + B*Load2. Model coefficients were determined using data from the Pacificorp Utah “2009 Analysis of
System Losses”3 and hourly load data provided by RMP. Annual average losses were calculated to be
8.53%4 and be losses were calculated to be 11.4%.5
Figure 2 shows load-related losses used in the loss-savings analysis. No-load losses cancel out of the
analysis because they are incurred whether PV is present or not.
3 Prepared by Management Applications Consulting, Inc., Nov. 2011.
4 Appendix B, Exhibit 1, “Summary of Loss Factors” gives the secondary loss factor of 1.09322. From this, the
average losses are calculated as (1.09322-1)/1.09322 = 8.53%. PV is assumed to be located on secondary voltages.
5 Estimated as follows: Hourly loads were summed for 2012, and annual losses were calculated using the 8.53%
figure above. Of these total losses, 25% were assumed to be no-load losses, and 75% are assumed to be load-related losses. Losses were assumed to be of the form A+B*Load^2, so A is calculated as the annual no-load losses divided by 8784 hours in 2012. B is then determined such that the model results sum to the total annual losses. With A and B known, on-peak losses are calculated by applying the model on the peak hour. The on-peak losses divided by the on-peak load gives 11.4%.

Value of Solar in Utah | Utah Clean Energy
Clean Power Research 9
Figure 2. Load-related losses as a function of load used in loss-savings calculations.
Technical Results
The resulting DGValuator technical results are shown in Table 3.
Table 3. Loss savings
Incl. Losses No Losses
ELCC (%) 65.8% 52.7%
PLR (%) 87.4% 69.8%
Loss Savings (Percent of PV Production)
ELCC 24.9%
PLR 25.3%
Energy 15.8%
Value of Solar in Utah | Utah Clean Energy
Clean Power Research 10
Summary Results
This section summarizes the results of the analysis. Table 4 presents the results in terms of the levelized
value of solar, broken down by component. The total levelized value is $0.116 per kWh. These results
are presented graphically in Figure 2.
The table presents the economic value of the “ideal resource,” the load match and loss savings factors,
and the final distributed PV value.
For example, the Generation Capacity value is first calculated as $0.021 per kWh for a perfect centrally
located (non-distributed) resource. The ELCC of the PV resource is determined to be 53% of the perfect
resource, so this factor is included. Finally, an ELCC-specific loss factor is determined to be 25% to take
into account marginal hourly loss savings provided by PV. When these factors are considered, the
Generation Capacity value is re-calculated as $0.011 per kWh.
Loss savings (not to be confused with average loss percentages) account for the cost of energy that
would have otherwise been lost. Note that there are four separate loss savings percentages used,
depending on category: energy, ELCC, PRL, and environmental (i.e., “none”).

Value of Solar in Utah | Utah Clean Energy
Clean Power Research 11
Table 4. Levelized value of solar ($ per kWh).
Figure 2. Levelized value of solar ($ per kWh).
Economic
Value
Load Match
(No Losses)
Distributed
Loss Savings
Distributed
PV Value
($/kWh) (%) (%) ($/kWh)
Fuel Value $0.037 16% $0.043
Plant O&M Value $0.011 16% $0.013
Gen. Capacity Value $0.021 53% 25% $0.014
Avoided T&D Capacity Cost $0.017 53% 25% $0.011
Avoided Environmental Cost $0.009 0% $0.009
Fuel Price Guarantee Value $0.022 16% $0.026
$0.118 $0.116

Value of Solar in Utah | Utah Clean Energy
Clean Power Research 12
Conclusions
Using assumptions and data provided by Rocky Mountain Power and Utah Clean Energy, the value of
solar in RMP’s service territory in Utah is calculated to be a levelized $0.116 per kWh over 25 years.
Several observations and conclusions may be made:
The value is based on avoided utility costs based on the electricity produced by distributed PV. It is
irrespective of ownership (commercial or residential). It presumes that all PV production is metered
separately from customer usage.
The value does not include societal benefits that may provide additional value, such as economic
development, greenhouse gas reduction or disaster recovery benefits. These benefits were not
included because they do not represent savings to the utility.
The levelized value represents the long term contract rate at which a utility would be economically
indifferent, based on the assumptions of this study. In other words, if a utility were to credit
customers with a fixed amount of $0.116 per kWh produced by distributed PV production over 25
years, the amount paid would offset the savings to the utility in generating and delivering the energy
to the customer.
The value corresponds to a fixed, south-facing PV system with a 40-degree tilt. In reality, distributed
PV systems are oriented in multiple ways (e.g., east- and west-facing), so the profile of the aggregate
“fleet shape” would differ from the assumed shape. Fleet modeling was not conducted for this
study.
Another variant on value would be to consider the value of export energy only. While the methods
for valuing export-only energy would be similar, the results would be different because the timing of
the export energy would not be the same as that of gross production. The value of export energy
was not addressed in this study.
The value represents today’s costs based on existing loads. In the future, loads will grow, and PV
capacity will grow. This has the potential to change the utility load shape, and affect future year
value.

Value of Solar in Utah | Utah Clean Energy
Clean Power Research 13
Appendix
The body of the report covers the baseline VOS calculation. It is based on the costs associated with a
CCCT. However, RMP provided data for an SCCT, and the associated input assumptions and results are
shown here. The SCCT has a lower capital cost (resulting in lower generation capacity value) but also a
higher heat rate (resulting in a higher fuel value). The heat rate is the dominant effect.
Table 4. Input assumptions.
Table 5. Levelized value of solar (SCCT case).
SCCT Case CCCT Case
(Baseline)
Capacity
Generation Overnight Capacity Cost $762 $962 per kW
Years Until New Gen Capacity Is Needed 11 11 years
Capacity Cost Escalation Rate 1.90% 1.90% per year
Generation Life 30 30 years
Reserve Planning Margin 13% 13%
Energy
Heat Rate 9950 6495 BTU per kWh
Heat Rate Degradation 0% 0% per year
O&M cost (first Year) - Fixed $34.66 $31.29 per kW-yr
O&M cost (first Year) - Variable $0.0102 $0.0024 $ per kWh
Economic
Value
Load Match
(No Losses)
Distributed
Loss Savings
Distributed
PV Value
($/kWh) (%) (%) ($/kWh)
Fuel Value $0.057 16% $0.066
Plant O&M Value $0.021 16% $0.024
Gen. Capacity Value $0.017 53% 25% $0.011
Avoided T&D Capacity Cost $0.017 53% 25% $0.011
Avoided Environmental Cost $0.009 0% $0.009
Fuel Price Guarantee Value $0.034 16% $0.039
$0.155 $0.161