Value chain cover finale 4seps front · CDF Constituency Development Fund DDP District Development...
68
2011 / 2012
Transcript of Value chain cover finale 4seps front · CDF Constituency Development Fund DDP District Development...

2011 / 2012

Priority Value Chain Analysis
Study in Selected Districts
Kenya
Republic of Kenya
Youth Employment Regional Programme
2011 / 2012


Priority Value Chain Analysis Study in Selected Districts Kenya
i
Table of Content
Abbreviations and Acronyms iiForeword ivAcknowledgements vExecutive Summary vi
Chapter 1: Introduction 1 1.1 Background Information 1 1.1.1 Situational Analysis 1 1.1.2 Situation of Youth at National Level 2 1.1.3 District/ Constituency Level Statistics and Current Engagements 4
Chapter 2: Problems Confronting the Youth and Proposed Resolution Efforts 9 2.1ProblemandJustification 9 2.2 Study Objectives 10 2.3 Resolution Mechanisms 11
Chapter 3: Methodological Approach 14 3.1 The Evaluation Framework 14 3.2InterrogationoftheValueChains 19
Chapter 4: The Value Chain Analyses Results and Discussions 26 4.1 Formation of the Value Chain Clusters: 26 4.2 The Generic Value Chain Mapping Outcomes 35 4.3 Engagement Options or Business Cases 36
Chapter 5: Articulation of The Youth Engagement Options 38 5.1Detailedpresentationoftheyouthengagementoptions 39 5.2 Skills Gap in the 24 Selected Constituencies 41
Chapter 6: Conclusions And Recommendations 44 6.1 Conclusions 44 6.2 Recommendations 45
References 47
Annex 48 QuantificationandCostingofaModel 48

Priority Value Chain Analysis Study in Selected Districts Kenya
ii
Abbreviations and Acronyms
AGRA Alliance for a Green Revolution in AfricaAIDS Acquired Immune Deficiency SyndromeASAL Arid and Semi Arid LandBAACH Business Alliance Against Chronic HungerBDS Business Development ServicesCDA Constituency Development AssociationCDF Constituency Development FundDDP District Development PlanDVO District Veterinary OfficerDYO District Youth OfficerEPZ Export Processing ZoneESP Economic Stimulus ProgrammeFAO Food And Agricultural Organization of the United Nations FGD Focus Group DiscussionFTC Farmers Training CentreGDP Gross Domestic ProductGOK Government of Kenya
GTZDeutsche Gesellschaft für Technische Zusammenarbeit GmbH (German Agency for Technical Cooperation)
HCDA Horticultural Crops Development AuthorityHIV Human Immunodeficiency VirusICT Information Communication TechnologyIFAP International Federation of Agricultural ProducersILO International Labour OrganizationIMF International Monetary FundJK Jua KaliKARI Kenya Agricultural Research InstituteKCPE Kenya Certificate of Primary EducationKCSE Kenya Certificate of Secondary EducationKEBS Kenya Bureau of StandardsKENFAP Kenya National Federation of Agricultural producers KEPHIS Kenya Plant Health Inspectorate ServicesKEPSA Kenya Private Sector AllianceKIE Kenya Institute of Education KIPI Kenya Industrial Property InstituteKIRDI Kenya Industrial Research InstituteKNBS Kenya National Bureau of StatisticsKNEC Kenya National Examination CouncilKSL KENFAP Services Limited LRA Long Rains AssessmentMDG’s Millennium Development Goals

Priority Value Chain Analysis Study in Selected Districts Kenya
iii
MIG Metal Active Gas WeldingMoA Ministry of AgricultureMoE Ministry of EducationMoEST Ministry of Higher Education, Science & TechnologyMoL Ministry of LabourMoL&F Ministry of Livestock and FisheriesMoTR Ministry of TradeMoW Ministry of WaterMoYAS Ministry of Youth Affairs and SportsMP Member of ParliamentNEMA National Environment Management AuthorityNEP North Eastern ProvinceNGO Non-Governmental OrganizationNYS National Youth ServicePDYA Provincial Director of Youth AffairsPHO Public health OfficerSMEs Small and Medium Enterprises
SNVStichting Nederlandse Vrijwilligers (Netherlands Development Organization)
SWOT Strength Weaknesses Opportunities and ThreatsUN United NationsUNDP United Nations Development ProgrammeUNEP United Nations Environment ProgrammeUNESCO United Nations Educational, Scientific and Cultural OrganizationUNICEF United Nations Children’s FundUNV United Nations VolunteersUSAID United States of America for International DevelopmentVC Value ChainVSO Volunteer Service Organization (United Kingdom)VTC Vocational Training CenterWEDF Women Enterprise Development FundYEC Youth Empowerment CentreYEDF Youth Enterprise Development FundYEF Youth Enterprise FacilityYERP Youth Employment Regional Programme

Priority Value Chain Analysis Study in Selected Districts Kenya
iv
Foreword
Kenya’seconomycangaingreat benefits from the “youthbulge”.This canbeachieved by investing in the right sectors with high potential for job creation. The countrycurrentlyhasahighproportionof15-to-29yearoldsrelativetotheadult
population. According to recent studies, a large youth bulge can both have a positive impact on a country’s economy, being a vital resource which can be tapped to promote its development, and a negative impact due to its associated problems such as high unemployment rates, idleness and likelihood of misuse.
Although effort by Governments and other stakeholders in addressing these issues have been put in place, more still needs to be done towards poverty alleviation and the youth unemployment situation. In view of this realization, the UNDP/Regional Programme for Social Cohesion and Youth Employment (YERP) funded by the Spanish cooperation commissioned this study to investigate the existing value chains and to identify those with the highest potential to maximize economic growth and youth absorption.
In order to obtain this result, a value chain analysis was conducted in 24 economic constituencies in Kenya with the objective of identifying the two lead sectors in each constituency. The applied criteria to select the lead sectors were the following: quick return on investment, market availability, growth potential, availability of skills required and supportive services locally, business and employment opportunities for the youth.
The report selected eleven lead categories of value chains. Along the various stages oftheselectedvaluechains,twentyoneentrepreneurialpossibilitieswereidentifiedin the form of constraints, resolution mechanisms or uptake of opportunities. The majorityoftheidentifiedpriorityvaluechainsareagriculturalbased.Atthesametimethe entrepreneurial possibilities are mainly focused on transformation of the goods, a largely missing aspect of African agricultural sector. The report furthermore indicates that pre-inception physical investments requirements, supportive services and infrastructurearekeyfactorstofasttrackrealizationoftheidentifiedentrepreneurialoptions.
The report concludes that clear possibilities for absorption of youth exist in the rural setup of Kenya, but lots of efforts and resources are required to release those potentialities for up take. Although grants will be necessary to initiate the adoption of engagementpossibilities,thereport’sfindingscastlightontheexistenceofdevolvedfundsandcompetingfinancialproductsasaclearpossibilityforinvestmentsandasan alternative to grants.
Aeneas C. ChumaResident representativeUnited Nations Development Programme, Kenya

Priority Value Chain Analysis Study in Selected Districts Kenya
v
Acknowledgements
This report was prepared with the support and generous contribution of the youth and rural communities, Government departments and the private sector amongst other organizations. My sincere appreciation goes to the Resident
Representative, Mr. Aeneas C. Chuma for his leadership and to other UNDP staff who supportedthestudy.Specifically,IwishtoregistermysincereappreciationBonifaceM. Kitili (UNDP-Programme Analyst) for coordinating the study and providing the much needed guidance and technical inputs to the draft reports. I also wish to thank Ms. Couty Fall, the Coordinator for the Regional Programme for Social Cohesion and Youth Employment (YERP) and her team for providing the back-stopping support services while in Dakar-Senegal.
Special recognition goes to Dr. Dinah C. Mwinzi (Director-Youth Training) for co-coordinatingthestudywithUNDPandtoIsaacOdek(PrincipalYouthTrainingOfficer)and Provincial Directors of Youth Affairs and Sports for linking the consultants with key respondents.ThefieldcoordinationandotherlogisticswereprovidedbyDistrictYouthTrainingOfficersintherespectivedistricts.Ithereforetakethisopportunitytothankthem and the youth leaders for guiding the process at the at the grassroots level. The financial support by the United Nations Development Programme (UNDP)/Regional Programme for Social Cohesion and Youth Employment (YERP) funded by the Spanish Cooperation demonstrates the importance UNDP and the Spanish Cooperation has placed on developing viable options with a special focus on the youth and women in this country. I therefore wish to commend UNDP and the Spanish Cooperation for supporting this study which will inform the design and implementation of viable economic options in this country.
Finally to the Kenya Agricultural Federation of Agricultural Producers (KENFAP) for undertaking this study
Thank you all.
Mr. James M. Waweru, CBSPermanent Secretary Ministry of Youth Affairs and Sports

Priority Value Chain Analysis Study in Selected Districts Kenya
vi
Executive Summary
The priority value chain analysis study aimed at accomplishing several objectives in line with youth engagement. Such engagement may fall into employment, business and entrepreneurial opportunity creation or actual participation in some chain based
activity. The study was conducted in 24 selected political constituencies in Kenya as guided by several objectives including: reviewing existing reports, selecting a lead sub-sector for each constituency and identifying the lead sub-sectors with potential to contribute to sustainable economic growth in Kenya. The value chain approach is an essential model in assessing the competitiveness of enterprises, enabling all the relevant actors to anticipate and meet their specific roles within and along the chain, identifying and taking advantage of opportunities in the value chain and responding to changes in their chain specific functions.
The study captured the global, regional and national youth situation, focusing largely on the youth bulge and its associated problems such as; high unemployment rates, idleness and likelihood of misuse and also the possible opportunities that could be tapped from the same. This study adopted the United Nation Development Program’s definition of a youth as a person aged between 15-35 years. The study articulated efforts that have been made to address and resolve the problems affecting the youth. Through value chain mapping and analysis, the study has identified possibilities within the value chain where the youth can be gainfully employed.
Data collection tools utilized in the study included: literature review, focus group discussions observations and key informant interviews. For effectiveness and ease of undertaking the assignment, the 24 constituencies were divided into 7 different clusters which included: Eastern, Central, Coast, Rift Valley, North Eastern Turkana and Cross Country – with the latter having a variation of agro ecological zones to form a representation sample for the team leader.
Global, national, district and constituency statistics and information captured in the study have been used to formulate entrepreneurial options from the priority value chains selected by each constituency. The value chains themselves have been clustered into 11 categories namely: Rabbit production, processing and marketing; Talent Academy / creative arts; Poultry production, processing and marketing; Camel milk production, processing and marketing; Dairy cattle and goat production, processing and marketing; Beef, Chevon and Mutton production, processing and marketing; Fruit production, processing and marketing; Ceramic materials extraction, production of ceramics and marketing; Fish farming and fishing, product processing and marketing; Honey production, processing and marketing; and Fresh vegetable and tubers production, processing and marketing. The study was keen to include the dynamics of youth socio-economic issues and possible redress mechanisms, while taking great recognition of the rural and urban youth situation. Youth comparative data captured at the district level aided in bringing out the socio-economic engagements and the main livelihood support systems at the constituency level.
Twenty one (21) entrepreneurial possibilities were identified from the value chain analyses from the various stages in the form of constraints, resolution mechanisms or uptake of

Priority Value Chain Analysis Study in Selected Districts Kenya
vii
opportunities. Those were clustered into four broad enterprise based categories to include horticulture, livestock, ceramics and talent and creative arts academy. Each possibility was unique in its own fashion and specifically targeted a certain value chain stage or a multiplicity of stages. The majority of the identified priority value chains and options are agricultural based with pre inception physical investments requirements, supportive services and infrastructure being key factors to fast track the realization of the identified entrepreneurial options or business ideas. The study has articulated the initiation/ entry, growth, sustainability and exit strategies for the business cases. However, the peculiar Arid and Semi Arid Land (ASAL) area environments need specific and appropriate resolution mechanisms designed, to befit their uniqueness.
Key unique problems that were clearly identified and require specific interventions include: illiteracy and ignorance; the presence of highly qualified youth and few engagement opportunities, and cultural inclinations and the associated effects.
The study concludes that clear possibilities for absorption of youth exist in the rural setup of Kenya, but lots of efforts and resources are required to release those potentialities for up take. It further identifies devolved funds and existence of competing financial products as a clear possibility for investments, other than continuous reliance on grants. Grants will however be necessary to enable the articulation of engagement options and possibly initiate adoption of seemingly complex options through some form of incubation. The study further quantifies the cost of each of the identified entrepreneurial possibility and levels of investments needed, as annexes to each constituency based report.

Priority Value Chain Analysis Study in Selected Districts Kenya
viii

Priority Value Chain Analysis Study in Selected Districts Kenya
1
Chapter 1
Introduction
1.1 Background Information
The need to accord specific attention to the youth is informed by the global, regional, and national situational analyses, focusing on the youth bulge and its possible associated problems such as; high unemployment rates, idleness and likelihood of misuse among
others. Although efforts by Governments and other stakeholders in addressing these issues have been put in place, much more still needs to be done. In light of this background, the United Nations Development Program (UNDP) has developed various programs focused on youth empowerment to address some youth related problems. This study adopts the United Nation Development Program’s definition of youth as persons aged between 15-35 years and explores possibilities within priority value chains towards poverty alleviation and the youth unemployment situation.
1.1.1 Situational analysis
Today’s global youth population is estimated at more than 1.5 billion. About 89% of these young people live in developing countries, with many of them unable to secure decent livelihoods. In these countries, the youth constitute about 29% of the total population and though declining as proportions of total population they are still growing in absolute numbers. On the other hand, a large majority of the people living below the poverty line are also in their youth. The same principle applies in view of unemployment statistics where many studies have placed greater proportions of youth as job seeking (www.unfpa.org).
The youth bulge is defined as a high proportion of 15-to-29 year olds relative to the adult population. Recent studies have shown that a large youth bulge can be associated with both positive and negative impacts such as vital resources that can be tapped to promote a given country’s development and a high risk of outbreak of civil conflict respectively. This youthful demographic is found principally in countries in the Middle East and Sub-Saharan Africa, but also in parts of the South American Andes, Central Asia, and the Pacific Islands. Sixty-two (62) countries located in sub-Saharan Africa, Southern Asia, the Middle East, and the Pacific Islands are considered “very young;” which indicates that two-thirds of their populations are under the age of thirty while less than 6% are above the age of sixty years.
The world is experiencing a youth unemployment crisis. Indeed the youth are on average three times as likely to be unemployed as adults. Statistics indicate that in the last ten years, the world’s youth population grew by 10.5 percent while youth employment only grew by 0.2 percent. The International Labour Organization (ILO) is also estimating that another 1 billion young people will enter the world’s labor market within the next ten years. However, it is highly unlikely that enough jobs will be created to employ the number of young jobseekers entering the labor market this decade. (http://makeadiff.in/blog/2010/02/25/the-mad-

Priority Value Chain Analysis Study in Selected Districts Kenya
2
national-conference-2010/ )According to the 2007 World Development Report, “youth make up 25% of the working population worldwide and 47% of the unemployed.” While the global youth population continues to grow rapidly, economic opportunities in the form of access to education, employment, or entrepreneurship are not growing proportionately. Unemployment rates are much higher for youth than for adults, in some countries up to 7 times high. Demographic shifts caused by the rural exodus to urban areas, stagnant literacy rates, and static numbers of higher education opportunities all contribute to the need for greater attention to youth and their economic prospects. In many countries, unemployment, underemployment, and dubious informal sector employment contribute to the progressively growing insecurity.
1.1.2 Situation of Youth at National level
The 2009 Kenya’s population and housing census, estimated the total population to be 38,610,097 million people comprising of 19,192,458 males and 19,417,639 females. The population density was estimated to be 66 persons per square kilometer while the area covered was 581,313.2 square kilometer. The 2007 spatial population distribution in Kenya indicates that 41% live in urban areas and 59% in rural reflecting the African scenario of the population living predominantly in rural settlements. Although the world is rapidly urbanizing, the number of rural dwellers is still high.
Kenya’s economy is suffering from a “youth bulge”. There is high unemployment rates, especially among the young population who are the majority. A population that is greatly skewed towards the young can be a challenge for any country. A large population indicates that the economy will be strained to support large and growing numbers of youths which causes a reduction in the per capita incomes.
The 2009 population and housing census for Kenya estimates that the economically active Kenyan population commonly referred to as the labour force and aged between 15 and 64 years comprises of 10,505,000 males and 10,180,000 females. Earlier statistics (2006) estimated extreme poverty in Kenya to be at 19% of the population. Almost one in every three of Kenya’s poor population was between 15-29 years of age. Half of these were youth between 15-19 years and who had a poverty rate of 51%; which was much higher than the national average.
The Labour Force Analytical report 2008 states that; labor force constitutes 12.7 million employed and 1.9 million unemployed persons. Youth represent 30 percent of Kenya’s population and their unemployment is twice the country’s average. Almost one third of Kenyans are between 15 and 29 years, and the total reached almost 11 million people in 2006 (compared to 8.5 million in 1999). Youth in Kenya face serious challenges, including high rates of unemployment and underemployment. The overall unemployment rate for youth is double the adult average, at about 21%. Statistics on joblessness suggest that the magnitude of the unemployment problem is larger for youth with 38% of them neither in school nor at work (aggregating the rates of reported unemployment and inactivity) (GoK, 2007).
Poverty remains a major challenge in the country. The youthful population is affected by high levels of unemployment, lack of proper housing especially in the urban areas and health

Priority Value Chain Analysis Study in Selected Districts Kenya
3
related challenges. This has contributed to high crime rate and extreme violence with more than 50% of convicted prisoners aged between 16-25 years, (GoK, 2007). A third of all HIV/AIDS patients are between 15-35 years and over 75% of all new infections occur among the youth (UNDP, 2010). Statistics indicate that youth living in poverty are most likely to suffer from psychological problems. Other problems affecting the youth include marginalization (lack of voice in the family, the community and the national arena); poor representation in decision making and limited recreational facilities.
An impressive number of Kenyan youth have been involved in many activities that have raised the country’s profile. Some of these include athletics and sports where the country is unrivaled in the long distance track events. They have also excelled in areas such as entertainment and ICT. Indeed the youth form the majority in ICT related engagements with prospects for higher growth being seen as the technology advances. Currently the youth account for about 60% of the active labor force but with the majority estimated at 75% or three million being unemployed. About 800,000 youth enter the job market every year (UNDP, 2010). Increased emphasis needs to be placed on coordination of efforts; improvement of services and facilities in rural areas; vocational training and training for self employment among others, if the situation is to be addressed.
The current strategic orientation of the Kenyan Ministry of Youth Affairs (MOYA) describes the unemployed youth as facing growing poverty levels, changing family patterns and deteriorating health and environmental conditions. Though considerably multi-skilled, the majority of youth remain unemployed mainly due to the low levels of translation of potentialities into tangible engagement options. While the number of youth leaving secondary and tertiary institutions has increased, the labour market in Kenya is not able to accommodate this large group of skilled young graduates a factor attributed to the minimal link between the education system and the labour market development. Too many youth grow into adulthood unprepared to contribute productively either as employees or productive citizens, yet they are the most heavily affected by the absence of sustainable employment.
High unemployment rates and limited alternative engagements have led to heightened concerns about the potential for dissatisfied youth and the likelihood of some of them participating in potentially destabilizing or destructive activities. Many young people are at risk, leading to rising levels of youth delinquency. According to the MOYA’s strategic plan (2007-2010), absence of opportunities has made young people turn to self-employment in the informal sector, often working in hazardous conditions for low payment with few prospects for the future. Generations of youth on the move, attempting to generate income for their families or themselves, have become a familiar sight in rural and urban areas. According to the Ministry of Trade’s Strategic Plan (2008-2018), high unemployment, particularly in the informal sector is attributed to low labour force productivity, low level of education and skills, declining private sector investment, and labour market rigidities. The contribution of the youth towards economic growth and development is yet to be felt. Clear opportunities for requisite contribution are largely lacking in view of the narrow focus with respect to exploration of value chain related opportunities. These could exist either as constraints in optimization of benefits from a given value chain, or opportunities that could be taken advantage of.
The higher unemployment rates of youth as compared to adults are also cited with factors

Priority Value Chain Analysis Study in Selected Districts Kenya
4
such as lack of work experience, lack of information on job search and inadequate skills profile demanded in the labor market. Low levels of employment could also be associated with the background orientation of the youth, availability of opportunities in the immediate vicinity and a general low supply of possibilities in the job market. There is increased rural-urban migration leading to illegal settlements that lack basic amenities. Risk factors such as high levels of idleness, highly concentrated urban populations, economic decline, and increased perceptions and realities of social & economic exclusion as well as gender inequalities have led to the youth and especially young men being susceptible to mobilization for political violence and engagement in acts of crime.
Micro and small enterprises play a pivotal role in employment creation and improvement of livelihoods for the youth. This can be realized through analyzing and identifying priority value chains from which possibilities could be deductively inferred. Value chain analyses is critical for the design of competitive strategies to enable actors anticipate and meet buyers’ demands, identify and take advantage of end-market opportunities, resolve structural and operational constraints and respond to changes in market demands. The multiplicity of stages that produce could pass through along a value chain to the final finished form dictates the availability of options for youth engagement in the ensuing input-output systems.
1.1.3 District/constituency level statistics and current engagements
The matrix below captures the situation of the youth at the district level using population, poverty dependency ratio, literacy level and current engagements/enterprises by the youth, as the main indicators captured from the survey on the ground. The youth population across all constituencies was above 25% of the total population, in some constituencies such as Yatta, the youth population was way above 50% of the total population. The poverty indices of the constituencies were informed by the district development plans (DDP’s) and E-libraries. It is cognizant that in some constituencies, poverty index is as high as 96% whereas in others as low as 27%. This disparity in poverty greatly informs the opportunities and challenges to be expected in enhancing value chain based entrepreneurial opportunities in the specific constituencies. This information also brings to the fore the great need to improve livelihoods and especially of the youth who form a majority of the studied constituencies’ population. Literacy levels of the constituencies are relatively high ranging from 5-93% with a majority of the constituencies falling in the above 50% bracket; which is an indication of ease of adoption of the enterprises by the majority population that is literate. The various ongoing activities/business ventures in the constituencies have also been captured. All of the listed value chain based business cases have the potential of being amplified, contributing to the creation of more job opportunities in the identified constituencies.
The matrix below gives a glance the of situation in the constituencies/ districts that have

Priority Value Chain Analysis Study in Selected Districts Kenya
5
informed the development of the business cases in a manner that considers all challenges and opportunities to ensure effective entry, growth, sustainability and exit strategy of the proposed priority value chain based entrepreneurial options.
Table 1: District/ constituency level statistics and current engagements
Region/ province
Constituency Population Poverty dependency ratio (Poverty index)
Literacy(%) as per province
No education (%) - as per province
Current engagements/ enterprises of choice.
Total Y o u t h (32%)
Female Male Female Male
Central
Mukurweini 83,932 26,858 34% 91.8 94.2 5.6 4.9
Traditional museums, tourism, dairy cattle production, banana production, avocado production, coffee farming, fish farming, rabbit keeping, macadamia production, mango production, ceramics, ICT, talent academy, arboretum, tree nurseries library services, working in ceramic areas, coffee and dairy farming and creative arts.
Kandara 156,663 50,132 33.3 %
Boda boda, jua kali, poultry, catering, pig farming, tree nursery, Horticulture (tomato)/ green houses, dairy cattle production, SACCO, avocado production, passion fruits production and banana production.
Yatta 147,597 87526 66.2%
Boda boda, horticulture, fruits and juice extraction, nurseries, saloons, carving, sand trading-construction, kazi kwa vijana, tailoring, barber shops, fish farming, fruits farming, poultry farming, dairy goat farming, Bee keeping, Sports, market cleaning and hair dressing

Priority Value Chain Analysis Study in Selected Districts Kenya
6
Gatanga 113,094 36,190 48.4%
Boda boda, barber shops, saloons, m-pesa, hotels, hawking, fish farming, nurseries, bee keeping, rabbit keeping, pig rearing, energy solutions, fish farming and kazi kwa vijana among others.
Gichugu 124,672 39,895 35.6%
Teachers, m-pesa, accountant, secretaries, boda boda, saloon and barber shops, mini shops, kazi kwa vijana, buying and selling of french beans and milk
Tetu 78,320 25,062 34%
Horticulture- tomatoes, dairy goats, information Communication technology (ICT), coffee farming, fish farming, rabbit keeping, bee keeping, indigenous chicken, sericulture-silk worm farming and avocado production
Mathira 148,847 47,631 27%
Cabbage production, tree tomatoes, dairy goats , dairy cattle, rabbit keeping, bananas, fish farming and green house enterprises- fresh leafy vegetables
Kieni 165,81253,062
32%
Horticulture, ICT, indigenous poultry (chicken), fish farming, beef cattle production, dairy cattle production, bee keeping, rabbit keeping and dairy goat production
Laikipia East 142,034 45,450 38%
Dairy goat production, rabbit keeping, poultry (chicken), fish farming, bee keeping, creative arts, camel milk, aloe vera, orch plant, eco-tourism services, sheep and goats (Shoats)

Priority Value Chain Analysis Study in Selected Districts Kenya
7
Rift valley
Kapenguria 181,063 57940 44%
73.2 83.9 17.4 10.2
Bee keeping, jua kali (carpentry), greenhouse (tomato and onion farming), sand harvesting, tree nursery, beef cattle (trading), dairy cattle production, poultry production (indigenous and exotic), arts theatre and sports, maize (posho mill), goat production (local/ indigenous variety), hotel and food kiosks, charcoal burning, herbalists (medicinal plants), motorcycle (boda boda), ICT and computer services, car wash, sports, uniform/clothes making, mangoes, avocadoes, onions and brick making
Sigor 175,616 56197 53%
Gold mining, beekeeping, buying and selling goats, fish farming, beef cattle, jua kali (washing vehicles), fruit farming (mangoes, oranges, lemon, paw paws), maize, baking, metal works, poultry keeping ( indigenous) and boda boda
B a r i n g o East
133,189 42,620 35%
Beef production, improved animal production, sheep and goats production, beekeeping and honey processing, maize farming, sorghum production, acca production ( Gum Arabica) and eco- tourism
Saboti 387,366 123,957 54.83%
Horticulture, brick making, beekeeping, dairy cattle production, ICT, poultry keeping, Irish potatoes production, Passion fruit production, boda boda, matatu, flower farming and sweet potato production
Bungoma 408,598 130,751 52%
Poultry keeping, sugarcane production, horticulture (onions, tomatoes, kales), tourism, dairy cattle production, tree nursery, brick making, fish farming and dressmaking
Mt. Elgon 172,377 55,160 56%
Beekeeping, horticulture, dairy farming, selling of timber, tree nursery, fish farming, tree planting, poultry keeping, irish potatoes farming, boda boda, tourism and beans production.

Priority Value Chain Analysis Study in Selected Districts Kenya
8
Nyanza Siaya 493,326 100,668 58%
79.8 89.4 7.1 1.8
Indigenous poultry, ICT, boda boda, brick making, cassava, fresh vegetables (leafy), fish farming, performing arts, and community based tourism, executive transport, and mango production.
S o u t h Mugirango
159,049 50,895 66%
Fresh vegetables production, banana production, pineapples production, indigenous poultry production, stone carving, tree nursery and tree planting (afforestation)
N o r t h Eastern
Wajir South 130,070 41622 70%
6.4 29.5 93.4 71.1
Milk production, beef trade, skin/leather trade , cloths trade, vegetable production/trade, beekeeping and honey production
M a n d e r a East
*288,687 92380 86.3%
Simsim production and sale, milk production, hides/skin trade, livestock trade, mango production and sale, beef trade, fodder production and sale
T u r k a n a Central
*254,606 81,473 96.94%
Livestock (goat) production, processing and marketing, horticulture (fresh vegetable) production and marketing, boda boda services, M-pesa Services, hotel/conference facilities and tree planting
T u r k a n a South
*226,37972,441
96.14%
Livestock (goat) production, processing and marketing, fish production, processing and marketing, irrigation along river banks, building and construction, weaving and basketry, Jua kali workshops and burial services
Coast
G a r s e n (Tana Delta)
96,664 30932 41%
65.6 88.2 29.6 10.0
Dairy cattle production, livestock (beef, skin and hooves) production, mango production, khat (Miraa) production, shops, boda boda, tailoring, matatu, M-Pesa, Café, entertainment-discos, videos, bars and water vendors
Bura(Tana River)
143,411 45892 84%
Dairy cattle production, camel production, boat production, chicken rearing, selling of cold drinks and barber shops
Eastern I g e m b e South
152,87848,920
58% 81.6 91.7 8.4 3.5
Bee keeping, dairy cattle production, indigenous chicken production, tomatoes production in green house, fish farming, sports, carpentry, tailoring, driving, salon, bakery and potatoes production
Source: Statistics adapted from District Development plan (DDP), 2003 Kenya demographic and health survey and the priority value chain study

Priority Value Chain Analysis Study in Selected Districts Kenya
9
Chapter 2
Problems Confronting the Youth andProposed Resolution Efforts
According to studies, it is estimated that on average the youth experience higher unemployment rates than adults. The recently released 2009 population and housing census report for Kenya indicates that out of about 14 million youth (15 – 35 years who
comprise about 36% of the population) only 35% are absorbed in the job market leaving about 65% jobless. Factors such as lack of work experience, information on job search and inadequate skills profile demanded in the labour market contribute to the high unemployment levels. Low levels of employment could also be associated with the lifestyle background of the youth, availability of opportunities in the immediate vicinity and a general supply of possibilities in the job market. Additionally every year, approximately 800,000 youth are released from educational institutions to the job market, while employment opportunities are very limited or not available (only 25% are employed), thereby compounding the problem (UNDP, 2009).
There is increased rural urban migration leading to illegal settlements (slums) that lack basic amenities. Settlement in slums is a risk factor even as it is further compounded by high levels of idleness, highly concentrated urban populations, economic decline, and increased perceptions of social and economic exclusion as well as gender inequalities leading to the youth and especially young men being susceptible to mobilization for political violence and engagements in acts of crime and violence.
The entire situation emanates from low and increasing un-availability of engagement opportunities as a derivative of a slowly opening economy. The Kenyan economy has largely not been effectively challenged to innovatively target progressive absorption of the population joining the job market on a regular basis, or grow to enhance such synchrony over time. In other words opportunities are not systematically derived and expunged to delimit growth of the multi-skilled though possibly inexperienced jobseekers.
2.1 Problem and justification
Youth unemployment resulting to idleness and subsequent deviant behavior leading to engagement in crime, violence, drug and substance abuse is a big challenge to Kenya thus calling for innovative strategies to address the vice. Opportunities for employment creation in Small and Medium Enterprises (SME’s) can be identified through value chain analyses. A value chain encompasses value transformation where inputs are ordered to generate preferred outputs in an organized manner.
Although primary products may be consumed in a raw state; transformation to secondary and even tertiary forms is feasible which can be widely explored as an effort to creating employment opportunities thus addressing youth unemployment. Many value addition options exist in the different value chains thus the need for identification of the most competitive chain. Exploration of the multiplicity and requirement of the value chain exposes engagement opportunities for the youth, hence the sole purpose of this study.

Priority Value Chain Analysis Study in Selected Districts Kenya
10
Micro and small enterprises will play a pivotal role in employment creation and improving livelihoods for the youth. This can be realized through identifying, analyzing, prioritizing and supporting key value chains from which opportunities could be deductively inferred. Value chain analyses is critical for the design of competitive strategies to enable all actors to anticipate and meet their specific roles in the chain, identify and take advantage of these opportunities, resolve structural and operational constraints and respond to changes in their functions. The multiplicity of stages a product could pass through along a value chain to the final finished form dictates the availability of options for youth engagements in the ensuing input-output systems.
2.2 Study objectives
The main objective of this study is to review existing reports, select a lead sub-sector for each constituency and identify the lead sub-sectors with potential to contribute to sustainable economic growth in Kenyan political constituencies through the value chain approach. The value chain analysis was critical for the design of the competitiveness strategy to enable actors to:
a) Anticipate and meet specific roles within and along the chainb) Identify and take advantage of opportunities in the value chain c) Respond to changes in their chain specific functions
The specific objectives include: a) To review existing works and familiarize self with the industry, its market and business
environment in which it operates as well as identifying sources for additional information (statistics on exports,/imports, local, regional and global trade figures etc);
b) To lead a process of and identify the lead sub-sector in each of the focus regions by establishing a value based ranking of economic activities in each of the focus regions in order of contribution/engagement to the majority of households (rank by economic value);
c) To establish a market share based comparative analysis for the key product sources and key market destinations (Localized, National, Regional and International Markets).
d) To identify the value chain players and influencers (actors) including those who increase costs but not the value of the product and explain their roles and a SWOT Analysis Strength/ Weaknesses/ Opportunities/Threats) of the commodity market regime in Kenya, taking into consideration each section and player of the chain (i.e. physical infrastructure, logistics (such as customs procedures and facilities), technical barriers to trade (such as standards for product quality and testing, certification processes, etc), other supporting services, business/investment climate
e) To carry out a value chain mapping and identify constraints and opportunities along selected sub-sector value chain;
f) To design a plan to make the chain more competitive for both short and long-term intervention by:
• Identifying appropriate BDS interventions (Services and Providers) required along the value chain and highlight BDS provision gaps (BDS Mapping) that require to be addressed to make each sub-sector vibrant;
• Identifying and planning for strategies to overcome the constraints• Developing an action plan for implementation

Priority Value Chain Analysis Study in Selected Districts Kenya
11
It was critical to carry out a comprehensive study of the viable value chains to have a clear understanding of opportunities and constraints and develop appropriate upgrading strategies leading towards employment creation. Value chain analyses assisted in the identification of technological and skills gaps and recommended ways for the development of programs that promote youth engagement and subsequent improvement of their livelihoods. Value chain analyses enabled the identification of sources of raw materials, quantities and quality requirements, quality standards, consumer demands and preferences, markets and competition for the various commodities, products and services within and outside the constituency. This information was imperative for business development as the youth can identify the avenues they will engage in along the value chain.
Through value chain analyses, legal and regulatory framework for small and medium enterprises development were analyzed. This gave the opportunity to explore any legal constraints and subsequent policy recommendations to foster an enabling environment for business development while focusing on the youth. By mapping out the opportunities and constraints along the value chain and providing relevant information for taking advantages of the possibilities, the study confirmed that the youth enterprises can be initiated and profitably run in a sustainable manner.
The value chain analysis was critical for the design of a competitive strategy as the information produced enables actors including the youth to: anticipate and meet buyers’ demands, identify and take advantage of end-market opportunities, and respond to changes in market demand. For the identified and selected value chain, the study provides a better understanding of the actors involved, their characteristics, strengths, competitive and comparative advantages (where they exist) and the inefficiencies within the production and marketing systems (locally, regionally and globally) which could be amplified for youth employment. Upon successful implementation of the intervention strategies it is hoped that this program will be up-scaled and replicated in other constituencies.
2.3 Resolution mechanisms
The youth are known to be creative in the face of problems and have demonstrated an ability to contribute to the development processes and economic growth. Promoting their roles in leadership and channeling their energy, initiatives and resolve towards dealing with development challenge is key for progress. Engaging the youth positively can increase the general social well being and benefit to a given country’s economy, through stimulation and direction of entropy towards faster and better returns/ outputs.
Youth related problems are phenomenal the world over; with varied efforts being put in place to address them. Four Millennium Development Goals (MDGs) directly relate to the youth development index; a tool for measuring youth development, including goal 2 on universal primary education; goal 3 on gender equality, and women empowerment (ratio of girls to boys in secondary and tertiary education and ratio of literate females to males); goal 6 on combating HIV/AIDS, malaria, and other diseases and goal 7 on environmental sustainability. Achievement of the MDGs will critically depend on the extent and nature of involvement of the youth.

Priority Value Chain Analysis Study in Selected Districts Kenya
12
The international community has initiated many programmes to increase youth employment. Organizations such as USAID, UNDP, UNESCO, SNV, UNV, IFAP, AGRA and VSO among others are keen towards development of gainful employment for the youth. UNDP is currently implementing a Sub-Saharan Africa regional program for social cohesion and youth employment whose main focus is employment generation particularly for the youth, improved livelihood and social cohesion in line with priorities of the UNDP’s strategic plan 2008-2011. The International Federation of Agricultural Producers (IFAP) has organized youth into young farmers globally. The global IFAP young farmers committee initiated in the year 2000 articulates young farmers’ issues and organizes world congress for young farmers every three years. UNESCO strives to help empower young people, reaching out to them, responding to their expectations and views, and fostering useful and long lasting skills. They encourage young women and men to participate in UNESCO and its various networks and partner organizations so as to open up opportunities for dialogue. They foster partnerships between UNESCO and young people’s networks and organizations aimed at causing integration of youth concerns and issues into policy agendas of member states. The United Nations in collaboration with the International Labor Organization (ILO) has developed the Youth Employment Network which has come up with recommendations advising governments to incorporate broad based policies that enhance the capabilities of young people. Recommended areas for national action include employability, creating equal opportunities for men and women, entrepreneurship and employment creation.
There are many initiatives by the government and other actors geared towards alleviation of suffering among the Kenyan youth. Under the economic pillar of Kenya’s blue print Vision 2030, the value of agriculture, livestock and fisheries is projected to increase through an innovative, commercially oriented and modern sector which will contribute towards increased competitiveness and incomes for the producers (GoK, 2007). It also recognizes that young people today and in the future will be the principle stakeholders and beneficiaries of opportunities. Therefore issues affecting the youthful community should be fully integrated and harmonized into every aspect of public policy and across all ministries and government agencies. Under the vision, specific policies and interventions are factored for implementation to fully develop their potential as well as prepare and engage them in socio economic development of the country. Interventions for youth cover the following fundamental areas; building capacity and empowerment to equip youth and engage in productive activities, creating employment opportunities, providing the youth with necessary support such as; financial and market linkages, support initiatives that mould character, strengthening programmes to advance youth health and well being and giving the youth a voice to articulate their issues as well as participate in decision making.
Kenya established the Ministry of Youth Affairs in 2005 to address youth concerns in the country. The Ministry has four technical departments; National Youth Service, Youth Training, Youth Sports and one support department with two parastatals namely; Youth Enterprise Fund (YEF) and Youth Stadia. Under the youth training, the Ministry is establishing Youth Polytechnics to develop vocational training skills among the youth and envisages establishing at least one youth polytechnic at constituency level. The Kenya government through the Ministry of Youth Affairs has developed a national youth policy and established a national youth council. The policy addresses numerous challenges that the youth face and how to overcome them. The national youth policy also provides the framework for the integration of

Priority Value Chain Analysis Study in Selected Districts Kenya
13
the youth in national development. It is being operationalized through the creation of the Youth Enterprise Fund administered by the Youth Enterprise Development Fund Board. YERP focuses on enterprise development to increase economic opportunities for and participation of youth in nation building. According to the Youth Enterprise Development Fund status report (2009), the fund aims at increasing access to capital by young entrepreneurs, providing business development services, facilitating linkages in supply chains, creating market opportunities locally and abroad for products and services for youth enterprises and facilitating creation of commercial infrastructure to support growth of youth businesses. Other ministries that have a mandate related to the youth include: The Ministry of Education with a responsibility towards education and vocational training; the Ministry of Health on youth health and HIV/AIDS issues; Ministry of Information and Technology on ICT; Ministry of Labor on employment and the Ministry of State for Planning and Vision 2030 with a responsibility for population, sexual and reproductive health education and adolescent reproductive health. Others include nongovernmental organizations, faith based organizations and producer organizations like KENFAP and the private sector that also have youth related programs in relation to health, agriculture and education. Agenda 4 of Kenya’s National Accord and Reconciliation Act (2008) clearly articulates the provision of innovative recommendations for the creation of a conducive environment for progression in youth and human development and in economic prosperity.
To support development of the private sector, generate wealth and alleviate poverty in Kenya, the Ministry of industrialization with the assistance of the World Bank is implementing the Micro, Small and Medium Enterprises (MSME) competitiveness project through Public and Private sector partnerships (PPP). The main objective of the five year programme which started in 2005 was to increase growth and competitiveness of MSME’s. This is achieved by providing access to finance: strengthening enterprise skills and market linkages and improving the business environment. The youth will benefit from the culture of innovation, training, and opportunities for MSME’s (Jitihada, 2010). Ministry of Higher Education Science and Technology progressively has increased universities enrolment from 1% to 8.5% through initiating programmes and strategies including parallel degree programmes, E-learning, upgrading middle level institutions which enhance the education level of the youth and their business acumen.
Inspite of all the interventions, there still remains prospects for optimizing opportunities for youth employment. The youth are interested in tangible solutions, quick money and savvy technology which necessitates top- of-the -range solutions and innovations. One best intervention lies in the exploration of value chain based opportunities. UNDP therefore, sought consultancy services to identify, select and analyze value chains with the greatest potential to contribute to sustainable economic growth.
At the constituency levels, a good percentage of women and youth have been sensitized on the youth, women enterprise and other devolved funds and the process of accessing them. Programmes have been put in place to ensure that they are trained on the management of these funds for maximum benefits that will be sustainable. Active civil society movements are apparently operating in the constituencies though mostly relying on funding from donors.

Priority Value Chain Analysis Study in Selected Districts Kenya
14
Chapter 3
Methodological Approach
3.1 The Evaluation Framework
KENFAP Services Limited (KSL) expressed interest to undertake priority value chain analysis in selected constituencies in Kenya and was successfully considered for the award of the same. After various communications, consultations and ensuing discussions, KSL
presented their proposed approach to UNDP which led to the awarding and signing of the contract. UNDP provided requisite literature which KSL used to undertake intensive review and produce a draft inception report. The draft inception report was discussed at a multi-stakeholder inception workshop where the initial thoughts and stakeholder discussions and inputs enabled finalization of the inception report. The same was presented to UNDP for approval. Data collection tools/instruments were developed for administration to focus group discussions at constituency level. Data collected at the constituency level was analyzed for consolidation of multiple outputs into case studies from each of the constituencies and comparative analyses of inter constituency outputs.
Deductive inferences of the value chain opportunities and follow-up conclusions from both primary and secondary data have been consolidated into this report. This report details value chain possibilities and exploitation approaches in each of the studied constituencies. The methodology utilised for the studies included: consolidation of facts through literature review; acquisition of constituency-based input through focus group discussions with the use of an interview guide and pre-discussion, identification and prioritization of lead value chains through pair wise ranking, actual value chain analyses and the ensuing identification of entrepreneurial options, articulation of those options and requisite reporting. These activities are discussed in detail below.
3.1.1 Scope of study
The analysis was conducted in 24 selected political constituencies in Kenya. Twenty (20) constituencies were within the UNDP priority value chain programme. These include Kapenguria, Mt. Elgon, Saboti, Laikipia East, South Mugirango, Tetu, Bura, Garsen, Mandera East, Wajir South, Sigor, Turkana Central, Turkana South, Baringo East, Mukuruweini, Gichugu, Kandara, Mathira, Kieni and Igembe South.
Thereafter, an additional four constituencies under the Business Alliance Against Chronic Hunger (BAACH) namely Gatanga, Yatta, Siaya and Bungoma were incorporated into the study.

Priority Value Chain Analysis Study in Selected Districts Kenya
15
Figure 1: Map of Kenya showing the areas of study
• Mukurweini Constituency: Ceramics and Rabbit Keeping• Yatta Constituency: Poultry and Dairy Goat• Gatanga Constituency: Talent academy, Holticulture High value/High Value
indigenous vegetables.• Kandara Constituency:avocado,Dairy cattle• Gichugu constituency: Passion fruits, Rabbit Keeping• Tetu Constituency: Rabbit Keeping, Tomatoes• Mathira constituency: Dairy Cattle,Holticulture• Kieni East Constituency: Fish farming, indigenous poultry• Laikipia East Constituency: Creative arts, Indigenous Poultry• Igembe south Constituency; Dairy Cattle Production. Indigenous poultry• Kapenguria Constituency: Beef cattle. Poultry• Sigor Constituency; Beef cattle, Poultry
• Turkana Central Constituency: Goat Production, processing and market-ing, Fish production
• Turkana south constituency: Goat production, processing and marketing value chain, Fresh Vegetable production and Marketing value chain
• Bungoma Constituency:Poultry,Dairy cattle• Siaya District constituency; fresh vegetables farming, poultry• Baringo east constituency: Bee keeping, Improved animal Production• South Mugirango Constituency: Fresh Vegetables, Bananas• Garsen Constituency: Beef Cattle, Dairy Cattle• Bura Constituency: Goat and Camel• Wajir South constituency: Milk Production, Vegetables• Mandera east Constituency:Camel,Sheep and Goats• Mt Elgon Constituency; Irish Potatoes, Dairy Cattle• Saboti Constituency: Irish Potatoes, Dairy cattle
Source: consultant’s own
3.1.2 Literature review
Prior to the collection of primary data, Intensive literature review formed part of the initial exercise carried out by the consulting firm, KENFAP Services Ltd (KSL). The United Nations Development Program (UNDP) provided some of the documents which included reports and case studies that formed part of the literature review. Other sources of secondary data were documents such as the national plans, district development plans (DDPs) where applicable, district strategic plans, reports, books, vision 2030, and ongoing initiatives from the virtual
Key:

Priority Value Chain Analysis Study in Selected Districts Kenya
16
and e-libraries collected from institutions such as the Kenya National Bureau of Statistics, Kenya Revenue Authority, Ken Invest, Ministry of Agriculture, Ministry of Trade, Ministry of Planning National Development and Vision 2030, Ministry of Industrialization, Ministry of Youth Affairs and Sports amongst others. The documents were critically read and reviewed to garner information and utilize the same to critique the primary data towards enhancement or nullification. Information was also gathered through direct institutional responses through consultation with relevant institutions including UNDP, EntWise consultancy, and African Development Initiative Kenya among others.
3.1.3 Development of the data collection tools
Different tools to be used in the survey were developed including interview guide, observation guide and key informant interview guide. This involved the design of a sufficiently enriched interview guide to capture as much information as possible. The interview guide was sub-divided into five main areas of focus in order to address the core concerns of the select value chain, identify possibilities and flag out business opportunities. The priority value chains were evaluated with respect to the six generic stages including pre-inception/ production, production, post product management/ handling, transformation, marketing and consumption. Through this process, several possible engagement opportunities were identified by way of further enhancing the priority value chain. Those were later on interrogated to clearly articulate how engagement opportunities could be realized in view of entry, growth, sustainability and exit strategy. The instruments specifically focused on the following thematic interrogation:
• Entry: The first part of the interview guide focused on identifying the entry strategy for each of the selected business cases. Some of the variables that were captured included gender involvement, role of the youth, policy issues, engagement possibilities and inception requirements.
• Growth: The second part of the interview guide focused on skills required to realize the business cases. SWOT analysis along the different stages of the value chain was conducted to identify growth/development constraints and opportunities, some of which were further articulated to drive the business cases.
• Sustainability: The discussion focused on market & market demand, tastes and preferences, information sources and availability, business development resources and scope engagement.
This discussion further focused on other existing business ventures that the youth have been engaged in, negative and positive effects of engaging in such businesses and other factors related to the businesses. The competitive edge whether positive or negative was articulated with respect to the existing chains.
• Exit strategy: Throughout the interrogation process, efforts were made to identify fall back mechanisms and outgrowth concerns with respect to the engagement opportunity. This enables the investors to shift gear or exit to some related forms of engagement.
• General questions formed the last part of the interview guide. They captured variables such as demography, level & quality of education, income levels & sources, employment amongst others. The general questions were applicable to all the value chains and therefore the information captured was the same for the two identified priority value

Priority Value Chain Analysis Study in Selected Districts Kenya
17
chains in each study area. This was useful in ascertaining the performances of the proposed interventions.
An observation guide was developed to capture constituency information including livelihood systems and patterns, economic activities, physical features and infrastructure. A key informant guide was also developed to capture information relevant to validate that gathered from the focus group discussions. These targeted key informants deemed to be knowledgeable in the identified value chains and the constituencies.
3.1.4 Preparation for data collection
Training for the enumerators was held to make it possible for the whole team to have a common and clear understanding of the tools and the methodology to be used. The participants were taken through the objectives of the study, concept of value chain analysis, pair wise ranking and the interview guide. The mode of administration of the interview guide was substantially discussed, to enable the paired interviewers articulate the expected data as they proceeded to different parts of the country.
The team appreciated that the constituencies had a diverse number of value chains and by extension possible income generating activities that could contribute to business and employment opportunities for the youth as well as to the economy of the constituency. Consequently, to objectively identify and select the lead value chains, the team developed a criterion that was used in the prioritization of the same. The criterion was discussed by the whole team and agreed upon to include the following:
• Quick return on investment• Market availability• Growth potential• Availability of skills required and supportive services locally (labor and technology
requirements)• Business and employment opportunities for the youth
The whole team consisting of 14 people participated in the pre-testing of the interview guide which was undertaken in Mukurweini constituency. The interview guide was later finalized with input from the pre testing exercise.
3.1.5 Distribution of responsibilities For effectiveness and ease of undertaking the assignment, the 24 constituencies were divided into 7 different clusters based on their regional uniformity in terms of agro ecological zones/bio-geographical indicators, possible economic activities, relationships in terms of socio economic status, uniqueness of the region and cross sectional validation. Different members of the study team were assigned the clusters which included: Eastern, Central, Coast, Rift Valley, North Eastern Turkana and Cross Country. The cross country which had a variation of agro ecological zones was specifically designed as a crosscutting one to form a representative sample for the team leader. Cluster leaders were to be supported by research assistants who recorded data during the focus group discussions. Clustering of the 24 constituencies/ districts and apportionment of responsibility was as tabulated below. For each constituency visited, the focus group discussions were held in venues within the district headquarters on the dates also captured in the table below.

Priority Value Chain Analysis Study in Selected Districts Kenya
18
Table 2: Schedule of field study
Cluster Constituency Date Venue Responsibility
Lead personnel Assistant
Eastern / Central
Mukurweini 10/6/2010 DC’s Boardroom, Mukurweini Dr. John Mutunga
Whole team
Yatta
Gatanga
Kandara
Gichugu
12/7/2010
13/7/2010
14/7/2010
15/7/2010
DC’s Boardroom, Yatta
DC’s Boardroom, Gatanga
CDF’s Boardroom, Kandara
CDF’s Boardroom, Gichugu
Prisca Githuka N i c h o l a s Mutembei
Eastern / Central
Tetu
Mathira
Kieni
Laikipia East
Igembe South
16/7/2010
19/7/2010
20/7/2010
21/7/2010
22/7/2010
CDF’s Boardroom
CDF’s Boardroom, Karatina
DC’s Boardroom, Chaka
DC’s Boardroom, Nanyuki
CDF’s Boardroom, Maua
Peter Mwangi N a t h a n Gikunda
Rift valley Kapenguria
Sigor
Saboti
Mt. Elgon
Bungoma
16/8/2010
17/8/2010
18/8/2010
19/8/2010
20/8/2010
District Development Planning Boardroom, Kapenguria
District Development Planning Boardroom, Sigor
DC’s Boardroom, Kitale
District Development Planning Boardroom, Kapsokwony
District Development Planning Boardroom, Bungoma South
Prisca Githuka Grace Ronoh
Cross country
Siaya
Baringo East
South Mugirango
15/7/2010
16/7/2010
20/8/2010
District Business Service Centre (DBSC), Siaya
DC’s Boaradroom, Chemoligot Baringo East
CDF’s hall, Nyamarambe
Dr. John Mutunga
Delfina Kaaniru
Coast Bura
Garsen
13/7/2010
15/7/2010
Bangale Primary School, Bangale
CDF’s Office, Garsen
Gorret Kamau Grace Ronoh
North Eastern
Wajir South
Mandera East
20/7/2010
22/7/2010
CDF’s Office, Wajir
Mandera East County Hall
Anita Msabeni Rose Memeu
Turkana Turkana Central
Turkana South
12/8/2010
13/8/2010
County council office, Lodwar town
County council office, Lodwar town
Kevin Kinusu Samuel Ariong
Source: consultant’s own
3.1.6 Organization of the focus group and verification of the priority value chainsThe focus group discussions mainly comprised of officials/members of the Constituency Development Association (CDAs). The CDA’s are registered or in the process of registration and comprised members who are residents, associates and corporates interested in the social, economic and development goals in the constituency. Other participants in the FGD were officials from Ministry of Agriculture, Ministry of Livestock Development, Ministry of

Priority Value Chain Analysis Study in Selected Districts Kenya
19
Cooperatives, youth representatives and officials from other relevant Ministries, departments and organizations working with youth in the constituency.
Respondents were taken through the background of the study, the definition and explanation of the value chain concept and value chain analysis process. Definitions of sector, sub-sector and value chain were also carefully expounded for due clarification and understanding. Respondents were then taken through the objectives of the study which includes identifying the 2 key lead sub-sectors in the constituency with the greatest potential to create business and employment opportunities for the youth.
Respondents were further taken through the aforementioned criterion which was utilized in identification and selection of the two lead subsectors. Using the criteria, the respondents were asked to propose sub-sectors that could be lead in line with the current economic activities in the constituency. The respondents came up with potential value chains in each of the 24 constituencies, which were listed on a flip chart and subjected to a critical evaluation.
Pair wise ranking methodology was utilized in the prioritization of the value chains whenever either the priorities earlier identified differed with their propositions or just as verification checks. Identified value chains were critically subjected to this methodology in line with the pre-determined criterion and consensus built on the top priorities.
3.2 Interrogation of the value chainsDuring the discussions, the following generic value chain mapping was used to clearly bring out the issues in the value chains identified.

Priority Value Chain Analysis Study in Selected Districts Kenya
20
Figure 2: Generic value chain mapping
Detailed value chain
Marketing
ProductionPre-production
Processing
Consumption Product handling
•Advisory on choice of enterprise•Inputs and equipments (raw materials)•Acquisition of factors of production•Contractual obligation•Incubation•Interpretation of available research information•etc
•Production /assembly •management
•Investment
•Sorting and cleaning•Grading•Preparation & Drying•Packaging•Labeling/branding•Storage•Transport•Bulking
Main outlet•Open air market •Organized marketing chains•Institutions •Retail sector
•Value transformation•Investments
•Preparation for consumption
•Advanced transformation •Canning & preservation
•Transportation /distribution•Raw product selling•Finished processed products selling•Registration/ trademark•Market intelligence service•Promotion activities •Standardization & certification
Primary
Secondary
Association, chambers, institutions and consumer organizations –service providers
Government (line ministries) and public agencies – regulatory framework
Source: Consultant’s own
At the pre-production/inception stage, respondents discussed all the functions undertaken in preparation for production. These include advisory on choice of enterprise, Inputs and equipments (raw materials), acquisition of factors of production, inputs and equipment, contractual obligations, incubation and interpretation of available research information among others. At the production stage, respondents discussed the functions undertaken including production/assembly, management and Investment. In product handling, issues on sorting and cleaning, grading, preparation and drying, packaging, labeling/branding, storage, transport and bulking were analyzed. In marketing stage, information on transportation/distribution, raw product selling, finished processed products selling, registration/trademark, market intelligence services, promotional activities, standardization and certification were explored in details. Processing encompasses information on value transformation; investments as well as preparation for consumption among others were discussed. Finally, at the consumption stage, main market outlets including open air market, organized marketing chains, institutions and retail sectors were explored as well as product and consumer related matters.
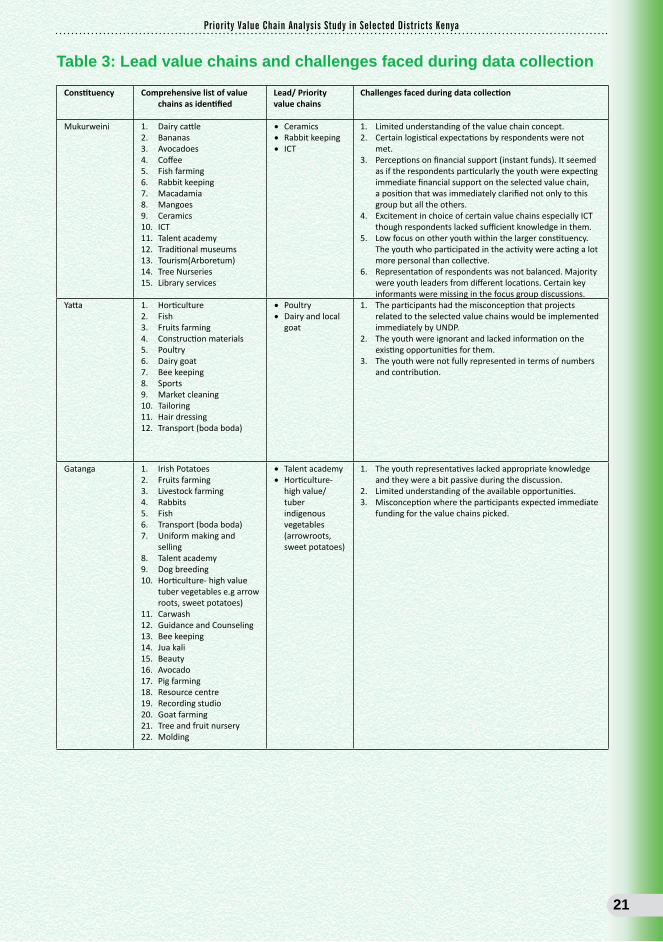
The table below shows a summary of the identified potential value chains, the selected two lead value chains and the challenges faced during data collection in each of the 24 constituencies
Priority Value Chain Analysis Study in Selected Districts Kenya
21
Table 3: Lead value chains and challenges faced during data collection
Constituency Comprehensive list of value chains as identified
Lead/ Priority value chains
Challenges faced during data collection
Mukurweini 1. Dairy cattle2. Bananas3. Avocadoes4. Coffee5. Fish farming6. Rabbit keeping7. Macadamia8. Mangoes9. Ceramics10. ICT11. Talent academy12. Traditional museums13. Tourism(Arboretum)14. Tree Nurseries15. Library services
• Ceramics• Rabbit keeping• ICT
1. Limited understanding of the value chain concept.2. Certain logistical expectations by respondents were not
met.3. Perceptions on financial support (instant funds). It seemed
as if the respondents particularly the youth were expecting immediate financial support on the selected value chain, a position that was immediately clarified not only to this group but all the others.
4. Excitement in choice of certain value chains especially ICT though respondents lacked sufficient knowledge in them.
5. Low focus on other youth within the larger constituency. The youth who participated in the activity were acting a lot more personal than collective.
6. Representation of respondents was not balanced. Majority were youth leaders from different locations. Certain key informants were missing in the focus group discussions.
Yatta 1. Horticulture2. Fish3. Fruits farming4. Construction materials5. Poultry6. Dairy goat7. Bee keeping8. Sports9. Market cleaning10. Tailoring11. Hair dressing12. Transport (boda boda)
• Poultry• Dairy and local
goat
1. The participants had the misconception that projects related to the selected value chains would be implemented immediately by UNDP.
2. The youth were ignorant and lacked information on the existing opportunities for them.
3. The youth were not fully represented in terms of numbers and contribution.
Gatanga 1. Irish Potatoes 2. Fruits farming 3. Livestock farming 4. Rabbits 5. Fish 6. Transport (boda boda)7. Uniform making and
selling 8. Talent academy 9. Dog breeding 10. Horticulture- high value
tuber vegetables e.g arrow roots, sweet potatoes)
11. Carwash 12. Guidance and Counseling 13. Bee keeping 14. Jua kali 15. Beauty 16. Avocado17. Pig farming18. Resource centre 19. Recording studio20. Goat farming21. Tree and fruit nursery22. Molding
• Talent academy• Horticulture-
high value/ tuber indigenous vegetables (arrowroots, sweet potatoes)
1. The youth representatives lacked appropriate knowledge and they were a bit passive during the discussion.
2. Limited understanding of the available opportunities.3. Misconception where the participants expected immediate
funding for the value chains picked.

Priority Value Chain Analysis Study in Selected Districts Kenya
22
Kandara 1. Poultry 2. Catering 3. Pig farming4. Tree nursery 5. Horticulture (tomato)/
green houses6. Dairy cattle7. SACCO8. Avocado 9. Passion fruits10. Bananas11. Rabbit keeping12. Dairy goats13. Talents academy 14. Bakery 15. Bee keeping16. Firewood17. Cereals 18. Fish farming19. Detergent and soaps20. ICT21. Tourist centers
• Avocado• Dairy cattle
1. There was another meeting for the administrators that day as the President was touring the region, which delayed the starting time but all went well.
2. Youth became impatient due to delay of the meeting. 3. Some youth members were biased in support of the value
chains they had interest in without bearing in mind that they were representatives of the larger constituency.
Gichugu 1. Rabbit keeping 2. Sericulture3. Bee keeping4. Cyber café5. Boda boda 6. Dairy cattle 7. Tomatoes8. French beans9. Wimax tower10. Fish farming11. Poultry12. Dairy goat13. Floriculture14. Strawberry15. Passion fruits16. Maize (green)17. Pumpkin 18. Talents development and
marketing19. Building and construction/
bricks making20. SACCO21. Salon 22. Tree nursery
• Passion fruit• Rabbit keeping
1. It came out clearly that the youth were marginalized with respect to making important constituency decisions. The CDA and other influential people impose ideas on them, which brought out heated debates between the groups during the session.
2. The perception that funds will be availed immediately to start the selected value chains related projects.
Tetu 1. Horticulture- tomatoes2. Dairy goats3. Information
Communication Technology (ICT)
4. Coffee 5. Fish Farming6. Rabbit Keeping7. Bee Keeping8. Indigenous chicken9. Sericulture-silk worm
farming10. Avocados
• Rabbit keeping• Tomatoes
1. Limited participation by the youth.2. Low concentration levels.3. Lack of proper understanding of the value chain concept.
Mathira 1. Cabbage production2. Tree tomatoes3. Dairy goats 4. Dairy cattle5. Rabbit keeping 6. Bananas7. Fish farming8. Green house enterprises -
fresh leafy vegetables9. ICT
• Dairy cattle• Horticulture-
Fresh leafy vegetables ( green houses)
1. Limited participation by the youth.2. Low concentration levels.3. Lack of proper understanding of the value chain concept.

Priority Value Chain Analysis Study in Selected Districts Kenya
23
Kieni 1. Horticulture2. ICT3. Indigenous poultry
(Chicken)4. Fish farming5. Beef cattle production6. Dairy cattle production7. Bee keeping8. Rabbit keeping9. Dairy goat production10. Sericulture
• Fish farming• Indigenous
poultry
1. Congestion at the interview venue.2. Very high expectations by the participants.
Laikipia East 1. Dairy goat production2. Rabbit keeping3. Poultry (chicken)4. Fish farming5. Bee keeping6. Creative arts7. Camel milk8. Aloe vera9. Orch plant10. Eco-tourism services11. Sheep and goats (Shoats)
• Creative arts• Indigenous
poultry
1. Limited participation by the youth2. Low concentration levels3. Lack of proper understanding of the value chain concept
Igembe South 1. Honey value chain2. Dairy cattle production 3. Indigenous chicken4. Green houses 5. Fish farming6. Tomatoes7. Sports8. Carpentry 9. Tailoring 10. Driving11. Saloon12. Bakery13. Potatoes
• Dairy cattle production
• Indigenous poultry
1. The meeting started late, at around 1:30 pm.2. Problems of communication with the CDA chairman.3. Limited participation by the youth.4. Low concentration levels.5. Lack of proper understanding of the value chain concept.
Kapenguria 1. Bee keeping.2. Jua kali (carpentry)3. Greenhouse (tomato and
onion farming)4. Mushroom5. Sand harvesting6. Tree nursery7. Beef cattle (trading)8. Dairy cattle production9. Poultry (indigenous and
exotic10. Arts theatre and sports11. Maize (posho mill)12. Goat production (local/
indigenous variety.)13. Mineral water
processing.14. Hotel and food kiosks.15. Charcoal burning16. Herbalists (medicinal
plants).17. Motorcycle (boda boda)18. ICT and computer
services.19. Car wash.20. Sports.21. Uniform/clothes making.22. Mangoes, avocadoes23. Onions.24. Brick making
• Beef cattle and goats
• Poultry
1. Some of the youth were not well versed in the English language. This was countered by mixing both English and Kiswahili languages during the discussions.
2. Some of the youth were identifying more with the returns (monetary) than the other criterias under discussion.

Priority Value Chain Analysis Study in Selected Districts Kenya
24
Sigor 1. Gold mining2. Beekeeping3. Goats (buying and selling)4. Fish farming5. Beef cattle6. Jua kali (washing vehicles)7. Onions8. Tomatoes9. Fruits (Mangoes, oranges,
lemon, paw paws)10. Maize11. Baking12. Metal works13. Bananas14. Camel15. Poultry ( indigenous)16. Boda boda
• Beef cattle• Local sheep and
goats
1. Poor road network2. Hot weather and therefore the participants were
requesting for water.3. Limited understanding of the interrogation purpose since
they wanted us to identify another subsector after we had already prioritized and analyzed the two lead value chains.
Saboti 1. Horticulture2. Brick making 3. Maize4. Beans5. Beekeeping6. Dairy cattle7. ICT8. Poultry9. Irish potatoes10. Oranges11. Passion fruit12. Boda boda13. Matatu14. Flower farming15. Sweet potatoes
• Irish potatoes• Dairy cattle
• The meeting started late. • The participants were very impatient since they had been
informed that the exercise was a meeting and would take 2 hours only. They wanted us to complete the assignment quickly.
Mt. Elgon 1. Beekeeping2. Horticulture3. Dairy farming4. Timber /tree nursery5. Passion fruit6. Fish farming7. Tree planting8. Tea9. Poultry10. Maize11. Tomato 12. Irish potatoes13. Boda boda14. Onions15. Tourism 16. Beans
• Irish potatoes• Poultry• Dairy cattle
• Misconception that we were developing a program for the region.
• A few individuals were convinced that dairy cattle production should be a lead value chain despite the fact that it was third in order of priority. This was resolved by interrogation of the dairy cattle value chain also.
• Unbalanced gender representation –There was no female representation from the youth groups.
Bungoma 1. Poultry
2. Sugarcane3. Maize4. Beans5. Horticulture6. Onions7. Tomatoes8. Kales9. Tourism10. Dairy cattle 11. Tree nursery12. Brick making13. Fish farming14. Dressmaking 15. Beekeeping
• Poultry • Dairy cattle
• The meeting started late.• Misconception that we were developing a program for the
region.

Priority Value Chain Analysis Study in Selected Districts Kenya
25
Siaya 1. Indigenous poultry2. ICT3. Boda boda4. Brick Making5. Cassava6. Fresh vegetables (leafy)7. Fish farming8. Performing arts9. Community based tourism10. Executive transport11. Mangoes
• Fresh vegetable farming
• Poultry
1 Fairly argumentative respondents thus time wastage in covering only the introduction.
2 Politically influenced development initiatives work better.3 Highly placed expectations4 Imagination that the whole interventions would start soon
after.
Baringo East 1. Beef production2. Improved animal
production3. Sheep and goats
production4. Beekeeping and honey
processing5. Maize farming6. Sorghum production7. Acca production ( Gum
Arabica)8. Eco- tourism
• Beekeeping• Improved
animal production
1. Very poor road network that even challenged the researchers.
2. Late arrival of essential goods and information.3. Serious gender imbalance in the focus group discussion
(only one lady).4. Over expectations on outcomes.5. Long distances to the venue due to vastness of the
constituency.6. Representation of the very local people fairly lacking.
South Mugirango
1. Fresh vegetables production
2. Bananas 3. Pineapples4. Indigenous poultry5. Stone carving6. Tree nursery7. Tree planting (
afforestation)
• Fresh vegetables
• Bananas
1. Fairly adult- dominated interactions.2. Lack of land for youth to engage in agriculture.3. Mindset changing a bit difficult.4. The ratio of women to men among the participants was
wanting. 5. The participants were not sure of some of the details
required especially supply of agricultural information within the area.
6. Lack of enthusiasm in answering of questions.
Garsen 1. Dairy2. Livestock (beef, skin and
hooves)3. Mangoes 4. Khat (Miraa) 5. Shops6. Boda boda 7. Tailoring 8. Matatu9. M-Pesa10. Café 11. Entertainment-discos,
videos, bars, water vendors,
• Beef cattle• Dairy cattle
1. Poor roads.2. Initial disagreement on logistics which was later cleared.
Bura 1. Cows (Dairy) production2. Camel production 3. Goat production 4. Chicken rearing5. Selling of cold drinks 6. Barber shops
• Goat• Camel
1. Language barriers. An interpreter was used to translate the questions which were administered through Swahili to Somali for the participants to understand.
2. Confusion on the venue. I.e. two meetings arranged on same day at Bangale and Bura town. This was countered by carrying out the meeting in Bangale and going to Bura for verification from key informants.
3. Mode of transport was very complicated. There was no direct means from Bura to Garsen. The researchers had to go to Garissa, then Hola then Garsen.

Priority Value Chain Analysis Study in Selected Districts Kenya
26
Wajir South 1. Milk production 2. Beef trade3. Skin/leather trade4. Cloths trade5. Vegetable production/
trade6. Beekeeping and honey
production
• Milk production• Vegetables
1. Communication barrier, not well versed in English and Kiswahili.
2. Limited understanding of the value chain model.3. Cultural prejudice to all activities identified and discussed.4. Limited concentration span – heat, and preparing for lunch
time prayers.5. Perceptions about financial support, that is, they expected
instant funds.6. Limited knowledge on the various value chains that they
identified.7. Unbalanced gender representation -2 women invited to the
discussion.8. Participation affected by other logistical interests.9. Unsettled consultations with low level of participation at
times.
Mandera East 1. Simsim production and sale
2. Milk production 3. Hides/skin trade4. Livestock trade5. Mango production and
sale6. Beef trade7. Fodder production and
sale
• Camel• Sheep and
Goats
1. Communication barrier, not well versed in English and Kiswahili.
2. Limited understanding of the value chain model.3. Limited concentration span.4. Perceptions about financial support, that is, they expected
instant funds.5. Limited knowledge on the various value chains that they
identified.6. Unbalanced gender presentation, with only one woman
invited to the discussion.
Turkana South 1. Livestock (Goat) production, processing and marketing
2. Horticulture (fresh vegetable ) production and marketing
3. Boda Boda services4. M-pesa Services5. Hotel/Conference facilities6. Tree planting
• Goat production, processing and marketing Value Chain
• Fresh Vegetable production and marketing Value Chain
1. Interruptions when the consultation happened to take long.2. Harsh hot temperatures; uncomfortable for long meetings.
Turkana Central 1. Livestock (goat) production, processing and marketing
2. Fish production, processing and marketing
3. Irrigation along river banks4. Building and construction5. Weaving and basketry6. Jua Kali work shops7. Burial services
• Goat production, processing and marketing
• Fish production and processing
1. Interruptions when the consultation happened to take long.2. Harsh hot temperatures; uncomfortable for long meetings.
Source: consultant’s own

Priority Value Chain Analysis Study in Selected Districts Kenya
27
Chapter 4
The Value Chain Analyses Results and Discussions
Value chain analysis is undertaken to clearly articulate the various actors/ operators and their functions at micro; and supporters at meso and macro levels. Using these, the study has hived out all the possibilities in terms of opportunities and constrains for the
constituency specific value chains. A value chain map was used to best demonstrate these possibilities.
4.1 The generic value chain mapping outcomesSix (6) specific value chain stages were carefully mapped out including; pre-inception/production, production, post production handling, transformation, marketing and consumption. It becomes important to note that products could be marketed soon after production, meaning that they could bypass the transformation stage. This is predicted to be the African agricultural development demise where, by and large, products are mainly sold in their raw form to date. For producers, consumption may also occur soon after harvest meaning that both transformation and marketing functions are bypassed. On the other hand, not all products have special (unique) post handling operations meaning that even part of handling may be avoided. During the value chain mapping, extra caution was taken to ensure that the entire value chain stages were undertaken, some of which yielded information that was not so common to the community of focus. The generic value chain mapping was conducted at the field level as reported in chapter 3, and the outcomes in form and content described below.
Pre-production/inception entailing pre-investment or pre- initiation value chain stage was conducted for the multiplicity of the value chains in the 24 focal research areas. Being preparatory in nature, the pre- production stage encompasses all the operations that set the stage for inception to occur. Outcomes of this stage analyses included but not necessarily limited to the acquisition of factors of production and putting them into the utmost levels of operational readiness for production/enterprise initiation. Some business cases or engagement options were derived at this stage though not solely for the stage as many adopted a cross-stage approach in their content meaning that cross functional attributes were apparent.
The production process that encompasses ordering and utilization of productive resources to garner results was analyzed through the chain approach. Through such a process, care must be taken to optimize outputs, failure to which, results may fall short of expectations. Results indicate that different event products and service lines require a multiplicity of production actions, which could be accumulatively regarded as crucial to the raw material production. Based on the fact that priority value chain was integrated through the study, unlocking the production potential leads to yield improvement under the agricultural domain value chains. Several challenges as identified required alleviation for benefit optimization in improving outputs and outcomes. Several business cases (see Chapter 5) were clear derivatives of the production process constraint redressing mechanisms; in as far as amplification of the concerned value chain was the primary concern.
Post production management/handling forms the third and equally important value chain stage. If not properly handled, losses ranging from 25% to 75% of products depending on the nature and extent of protection may be incurred, especially for the highly perishable

Priority Value Chain Analysis Study in Selected Districts Kenya
28
agricultural goods. Analytical work yielded a few business cases of post production handling nature, the sole problem being the investment costs and the extent/state of the country’s development.
Processing/transformational attributes were quite preferred as engagement options’ developed stage during the value chain analyses processes probably because it is largely not significantly ventured into. To say the least, transformation has not been much exploited leading to lots of produce existing and trading/exchanging in raw form. It is no wonder that the migration from agriculture has not really occurred in the African context due to slow transformation of the African agricultural products. The youth were enthusiastic that the analytical process could open the window of opportunity for off farm alternative engagement as realized in most constituencies. With most of the business cases deriving their focus on transformation, there is therefore great demand for more engagement forms in the domain.
The market function may occur at the raw produce or the finished/transformed produce level. However, the function has its intricacies in both structure ad functions if survivability was to be premised. Moreover, this forms the bulk of the chain based promotion where chain amplification will majorly rely on the uptake of products and services from the production process. The market (commodity exchange) functions could alone cause/make a difference in whatever is to happen to a value chain in view of the impact to a given community. With the demand and supply dependence on equilibrium market prices, marketing can make or break a given value chain. Results indicate that some business venturing occur in the function of the commodity exchange at various conceptual levels.
Consumption has not really come out as a strong driver towards value chain promotion apart from locating and sustaining a given outlet, which could be regarded as a market function. However, many consumption promoting outlets could be set up to stimulate demand for specific products through increased consumption of the same. Only a few business cases centered on consumption pass despite a variety of combinations being apparently feasible. The product differentiation can stimulate consumption and diversification of product outlet. The focus on consumer tastes and preferences can stimulate off take of chain based products thus stimulating the chain activities.
Table 4: Comprehensive value chain analysis
Value chain` Constituency Comprehensive value chain analysis Business case
Pre-production Production Product handling Transformation Marketing and trading
Consumption
Rabbit keeping -
Mukurweini
Gichugu
Tetu
formation of slaughter groups
entering into Contracting
Housing
Acquisition of Breeding stock
Inputs (feeds and Drugs)
Technical package
Cost benefit analysis
Market survey
Rabbit husbandry practices (feeding, watering disease control, breeding etc)
Adherence to contracts requirements
Market intelligence information
rabbit Promotion for breeding purposes
sorting , grading and valuation
packaging in cages
wool rabbit Product Promotion for unit selling
establishment of collection and slaughter unit
slaughtering
skill enhancement
inspection
packaging/canning
mincing and packing (sausage)
parts packaging
branding and labeling
Product Promotion
Contracting
Promotion and marketing of breeding stock, mature rabbits, rabbit products (pelt, meat, minced products, canned products, Rabbit urine/droppings for fertilizer)
Transportation
Product awareness (value of rabbit products)
Market penetration
Household level skill enhancement (cooking lessons, recipe promotion,
Rearing and selling of breeding stock
Establishment and operationalisation of slaughter slab
Establishment of promotion and consumer units in urban centres

Priority Value Chain Analysis Study in Selected Districts Kenya
29
Value chain` Constituency Comprehensive value chain analysis Business case
Pre-production Production Product handling Transformation Marketing and trading
Consumption
Talent academy/ creative arts
Gatanga
Laikipia East
Consolidate investment group
Identification and categorization of the investment packages/skills
Acquisition of relevant business intelligence
Develop a bankable business plan(s)
Consolidate and realize factors of production
Site selection and planning
Design and construction of the requisite infrastructure
Need identification
Develop product curricula
Preparation of the different products
Training and skill enhancement – talent search and development (auditions)
Management and quality control
Categorization trade marking and copy right reserve
Acquisition of product specific intellectual property rights (IPR)
Innovate appropriate storage and retrieval mechanisms for products – catalogues and product libraries (CDs, VHS, etc)
Generation of packaged products – (DVDs, VCDs, CDs, VHS, etc)
Sorting, branding, labeling
Develop skills and competencies (talents)
Produce documentaries
Develop recognition and reward systems ( Accreditation, certification etc)
promote and popularize Performing groups and theatres (TVs, travelling theatres, concerts)
promote and popularize documentary off take
generate and distribute promotional materials – brochures etc
Sensitization of products - local media, roadshows
Identify and sensitize target group (capture target audience)
Continuously interest niche market
Establishment of a talent development and promotion centre – training, recording, documentaries. Theatric activities, artifacts
Chicken :( Both exotic and indigenous)
Indigenous chicken
Yatta
Kapenguria
Mt. Elgon
Bungoma
Siaya
Kieni
Laikipia East
Igembe South
Formation of breeding, hatchery and marketing groups
Acquisition of Breeding stock, Inputs (e.g. feeds and Drugs, , feeders)
Technical package (advisory services)
entering into Contracting
Prepare bankable business plans
Market survey
Establishment of hatchery/collection centre and breeding unit
Chicken husbandry practices (feeding, watering disease control, breeding etc)
Adherence to contracts requirements
Market intelligence information
Change of mindset from subsistence to commercial chicken production (enhance commercial production of indigenous breeds)
Disaggregate and differentiate products (eggs, meat, live chicken, manure, fish feeds)
Collection, grading, weighing, sorting/grading and storage of the products (eggs, chicks, etc)
Enhance quality control of the products
Establish cold storage
Packing
Slaughtering
Inspection to ensure quality
Packaging
Grading and branding
separating into parts (drumsticks, wings, neck, back)
product diversification- sausages, minced chicken, marinated chicken
canning
production of pillows and decorations from feathers
Promotion and marketing of chicken products (advertising)
trademark
Transportation
Establish appropriate Distribution channels
Contracting
Marketing
Product awareness
Market penetration
Market outlets – eating houses,
Establishment of a one stop shop comprising of a hatchery, breeder and collection centre
Establishment of a processing plant

Priority Value Chain Analysis Study in Selected Districts Kenya
30
Value chain` Constituency Comprehensive value chain analysis Business case
Pre-production Production Product handling Transformation Marketing and trading
Consumption
Camel (milk) Bura
Mandera East
Zoning production areas
Registration of producers
Contracting
Identification and citing of collection centers
Acquisition of transport mechanisms
Promote Range improvement initiatives (increase pasture capacities)
Lobby for appropriate legislation of camel milk
Establishment of collection centers - Lay out minimum hygiene requirements
Establish and agree on enforcement mechanisms - delivery timings, quality, handling
Set up minimum standards and infrastructure for clean milk intake
Establishment of cold storage facilities at collection centres
Observe quality control requirements
Enhance product transportation to available outlets
Product primary grading and packaging
Enhance product handling skills
Innovate product handling equipments for producers and collection centre itself e.g. aluminum containers
Invest in Expanded scale for preservation capacity – accessible and affordable to producers
Promote indigenous processing technologies (e.g. milk fermentation
Promote Product grading, packaging, labeling and branding
Establish modern processing facilities at the secondary collection centers
Promote Production of long shelf life milk
Promote production of other products – cheese, butter, ghee, powdered milk
Product differentiation and promotion
Create niche market and Promote local consumption (buying and selling) in urban centers of production zones
Formation of marketing associations/cooperatives – to promote camel milk consumption based on its unique qualities
Develop a community based camel milk promotion and marketing strategy
Enhance product knowledge
Create awareness on uniqueness of the camel milk (health benefits)
Widen the distribution mechanism of camel milk and milk products
Establishment of a milk processing and promotion centre
Dairy cattle
Dairy goat
Kandara
Mathira
Igembe South
Saboti
Mt. Elgon
Bungoma
Garsen
Wajir South
Yatta
Growing fodder and pastures for the animals
Acquisition of appropriate milk handling equipment - –stainless steel
Construction of Housing for the cattle
AI services
Drugs and medication
Commercial feeds and feed supplements
Availability of sufficient water
Registration and herd book keeping (STUD book)
Dairy cattle Management practices (Feeding, watering, disease and pest control)
Good Milking practices
Milk filtration, cooling and storage
Establishing collection centers
Clean milk handling, collection and storage
cold storage (coolers)
Milk processing – pasteurization and homogenization,
Product diversification - pasteurized milk, fermented, flavored, cream, yoghurt, ghee, cheese, powder milk, UHT
Establish efficient transportation systems
Distribution
Trademark
Contracting
Cooperatives
Market intelligence
Establish appropriate distribution channels
Product knowledge
Establishment and operationalisation of an animal feeds factory
Establishment of a milk processing plant

Priority Value Chain Analysis Study in Selected Districts Kenya
31
Value chain` Constituency Comprehensive value chain analysis Business case
Pre-production Production Product handling Transformation Marketing and trading
Consumption
Local sheep and goats
Beef Cattle
Local goats only
Improved animal production
Sigor
Mandera East
Kapenguria
Sigor
Garsen
Yatta
Bura
Turkana South
Turkana Central
Kapenguria
Baringo East
Information on breeding and breeding stock
Formation of producer and marketing groups
Information on available Veterinary services (pest and disease control, drugs)
Information on requirements for Supportive infrastructure
Information on Credit services
Acquisition of breeding stock and Breeding
Animal housing
Animal Management practices (Feeding, watering, Rearing, disease and pest control etc)
Animal branding/tattooing for identification
Registration and herd book keeping (STUD book)
Range improvement
Provision of extension and veterinary services (Public and private)
Awareness creation on differentiated market channels
Provision of value addition information
Establishment of auction yards – sorting, grading and pricing
Branding based on rules of origin
Establishment of hoarding grounds (fattening, disease control etc)
Transportation to market centre
Establishment of a SHOATS abattoir
Inspection and certification
Production and Differentiation of various products and pricing regimes primary processing – meat and skin products, horns, hoofs and bones, blood and bone
Secondary level processing along specialized lines– tanning, meat canning, glue production and blood and bone meal, leather (for livestock feed processing)
Tertiary level processing – shoes, belts, bags,
Promotion of diversified products from primary and secondary processing
Market intelligence
Branding
Cold storage transport system to large urban centers
Establishment of appropriate distribution channels
Promotion of diversified shoats products availability at local and national levels
s
Buying , fattening and selling of local sheep and goats
Establishment of a meat processing plant (abattoir)
Establishment of a tannery
Establishment of bone meal plant
Fruit production and processing
Avocado
Passion fruit
Bananas
Tomatoes
Kandara
Gichugu
South Mugirango
Tetu
Assess the feasibility of fruit production
Formation of producer groups
Coach producer groups on husbandry, marketing, gross/net margins
Site selection and planning
Awareness building on credit sources
Information on appropriate husbandry (seedling base or top working, pest and disease control)
Information on sources of planting materials and inputs
Information on service providers and markets
Establishment and nurturing of fruit tree nurseries
Conduct relevant crop husbandry practices (Land preparation, planting, weeding, crop protection, harvesting etc)
Pay particular attention to fruit fly control
Identify outlets for the variety of products
Enter into necessary contractual agreements
Establish necessary linkages and synergies with appropriate stakeholders
initiate and conducting relevant consultations among group members
Establish collection centres (multipurpose)
Develop collection framework and procedures
Development of Packing and packaging materials(for transportation)
Observe the standards and control ( sorting, grading, weighting, pricing)
Develop multipurpose processing unit
Product diversification as per the commodity
Avocado – primary: oil, juice, secondary: soap
Passion – primary: juice, secondary: adding flavor
banana – primary: juice, puree, flour, crisps secondary: cakes, wine, ingredients for baby formula food
tomato – primary: puree, paste, juice, soup, sauce, canned
Promotion for specific fruit type marketing
specific Product promotion and marketing (primary and secondary products)
transportation and distribution channels
branding and labeling
Product patenting (IPR)
Market penetration
Sensitization on whole fruits consumption
Product awareness – new products sensitization among local and urban populations
Establishment of market outlets
Enter into contractual agreements with processors to supply puree/pulp, and concentrates
Establishing multipurpose fruit processing plant

Priority Value Chain Analysis Study in Selected Districts Kenya
32
Figure 3: Value chain mapping of the chicken value chain
Source: Consultant’s own
Legend
Local Authority, Public Health Officers, Ministry Of Livestock Development, NEMA, KEBS
MOLD, KARI Consumer organization/
NGOs, FOMOLD, MOA, NGOs
DVM, PHO
Function Constraints and opportunities
Operators Consumer
Meso Level
Service provider
Government
Macro Level
Macro Level
Hoteliers
Open air market
Vaccination Actual production
Outlet shops Suppliers
Animal feed stockiest/
Setting up a breeding unit
Hardware shops and timber marts
Poultry farmers
Supermarkets Poultry farmers
Consumers
Provision of poultry feeds
Breeding
Slaughter slabPackaging/ branding Transportation
Brokers Butchers
Incubation of chicks, Brooding chicks
Pre- production Production Processing Product handling Marketing Consumption
Formation of breeding, hatchery and marketing groups Acquisition of breeding stock, inputs (e.g. feeds and drugs, feeders) Technical package (advisory services) Entering into contract Prepare bankable business plans Market survey Establishment of hatchery/collection centre and breeding unit requirements Market intelligence information Change of mindset from subsistence to commercial chicken production
Chicken husbandry practices (feeding, watering disease control, breeding Adherence to contracts Disaggregate and differentiate products (eggs, meat, live chicken, manure, fish feeds) Collection, weighing, sorting/grading and storage of the products (eggs, chicks, etc) Enhance quality control of the products Establish cold storage Packing
Slaughtering Inspection to ensure quality Packaging Grading and branding Separating into parts (drumsticks, wings, neck, back)
Product diversification- sausages, minced chicken, marinated chicken Canning Production of pillows and decorations from feathers
Promotion and marketing of chicken products (advertising) Trademark Transportation Establish appropriate Distribution channels
Product awareness
Market penetration
Market outlets – eating houses

Priority Value Chain Analysis Study in Selected Districts Kenya
33
Figure 4: Price mapping of the chicken value chain
At farm gate at wholesale market at retail market Production Product
handling
Marketing
300
9% 19%9%
200100
1,080 800
Cost of production – 200
Transport- Storage- 300
Cooking, license, employees, handling, etc
Supply
Margin per chicken in Kshs
Sales price per chicken in Kshs
Share of end prices
Note: The sales price per chicken is the price at which the chicken/ products are sold at each level.
The margin is the difference between the selling price and the cost price (the selling price at the previous level) plus the various costs incurred at that stage.
The percentages are the ratio of the margin to the retail price. It shows the income distribution along the value chain.
Source: consultant’s own

Priority Value Chain Analysis Study in Selected Districts Kenya
34
Figure 6: Chicken BDS mapping
Pre- intervention activities
Project activities Outputs Impacts
Facilitate integration into value chains 1) Form / link producer groups with lead firms; promote inter-firm collaboration and strategic alliances (vertical and horizontal linkages) 2) Upgrade through promotion of commercially viable business services (private extension agents, agro vets stockist, embedded services by lead firms, training 3) Improve enabling Environment, especially end markets
Market Access: Increase in sustainable market outlets for chicken producers Training and Extension: Increase in provision of commercially viable extension (e.g. training, technical assistance, advisory services, information services, and new technologies) to chicken producers Input Supply: Increase in commercially viable provision of inputs (e.g. agro vets supplies).
• Increased participation of smallholders in high-value portions of chicken value chains / markets • Improved competitiveness in the entire value chain • Sustainable upgrading of SMEs.
Value chain Performance: Growth in sales, productivity, and trade in overall chicken value chain Firm-level Performance: Increased sales, productivity, and trade for participating smallholders in chicken
• Improved household incomes for chicken smallholders • Increased remunerative employment for the youth.
Outcomes
• Design interventions and compete & award tenders.
• Identify priority solutions / Services and other needs for the chicken value chain
opportunities in value chain
• Analyze constraints and
• Select the value chain
Physical, Social & Economic Context
Source: Consultant’s own
Source: consultant’s own

Priority Value Chain Analysis Study in Selected Districts Kenya
35
Value chain` Constituency Comprehensive value chain analysis Business case
Pre-production Production Product handling Transformation Marketing and trading
Consumption
Ceramics (clay)
Mukurweini Identify and zone ceramics productive areas
Develop a detailed bankable BP for ceramic production/refining and products (crockery,
Conduct detailed site/area planning to establish appropriate position of processing plant
Conduct EIA and SIA
Sensitize community especially land owners (ceramic zones ) on usefulness and extent of extraction/excavation of the clay (ceramic content)
Negotiate and realize long term extraction mechanisms (contracts)
Establish the investment entity (youth, Constituency?)
Operationalise the bankable business plan
Develop a cyclical progressive clay excavation framework and land reclamation
Conduct a thorough study on the rejuvenation mechanism of excavated land
Apply the quality standards to price different ceramics products (pricing mechanisms)
Manage the labour force as appropriate
Develop a waste management system
Identify, categorize and differentiate various products based on quality
Develop storage infrastructure for the differentiated clay products
Apply Geographical indicated protection system (Patenting)
Design an appropriately efficient transport mechanism
Institute an attractive package commensurate to the benefits(from the clay)
Establish processing factory within production area
Establish cascaded products processing order
Establish product specific generation lines
Establish value addition unit based on differentiated clay raw materials
Refine and sell differentiated clay products
Establish institution for ceramics value addition
Promote and market differentiated clay products (pots, energy saving jikos, flower pots)
Promote and market differentiated ceramics products (vases, tiles, crockery)
Acquire market product information
Embark on promotional activity on mindset change on local products, origin and value
Establish/conduct branded transportation system
Identify and target niche markets with specifically branded products
Establish a distribution system to entrench the market
Promotion of specifically targeted consumption
Establishment of a ceramics processing and marketing infrastructure
Fish farming
Fishing
Kieni
Turkana Central
Information on Inputs – fish gear ( fishing nets, boats, feeds, stock)
Site identification and selection for processing plant construction.
Design and planning of the processing plant
FF-formation of fish farming groups
FF-site identification of pond location
FF-designing and planning
FF-Information on sources of feeds, fingerlings
FF-Advisory services on fish ponds/farming
FF-Excavation and Construction of the fish ponds
FF-stocking of the fingerlings
FF-Routine management practices (feeding, control of pests, security)
FF-Management of transportation aspects of fingerlings (specialized)
Fishing
FF-Harvesting
Sorting, grading, weighting and pricing
Preservation(Cold storage/ smoking/ sun drying)
Product diversification –
Fillets
Fish bones and Mgongo Wazi(filleting bi-product - fish meal production, buttons
Canned fish
Medical products - supplements, protein (stitching thread)
Training and skill enhancement for processing by the constituents
Scaling and gutting to enhance product marketability
Specialized transport systems
Packaging and branding of products
Develop Communication infrastructure to support timely supply and delivery
Establish Appropriate distribution channels and marketing units
Market outlets- fast foods,
Product knowledge
Promote various cooking methods – deep frying, roasting, boiling
Realize and managing fish processing plant
FF-fish feed production and distribution

Priority Value Chain Analysis Study in Selected Districts Kenya
36
Value chain` Constituency Comprehensive value chain analysis Business case
Pre-production Production Product handling Transformation Marketing and trading
Consumption
Beekeeping Baringo East Inception study on appropriate technology and equipment
Decision on modern honey production
Formation of producer groups
Reforestation and planting of appropriate forage trees
Identify sources of hives, equipment,
Site selection and decisions on location
Popularize the modern hive technology
Purpose to progressively Break socio-cultural barriers
Practical training on hive handling
Acquisition of appropriate hives
Establishment of apiaries
Organization (sequencing) of husbandry practices
Establishment of Group dialogue sessions
Establishment of collection centers
Capacity Building on honey harvesting (entrenchment of practical skills)
Establish product quality and standardization procedures and ensure adherence to the same
Adoption of appropriate product handling and packaging procedures
Sorting, grading and pricing of crude honey
Establishment of a modern processing plant at Chemoligot in Nginyang
Process honey into different products – primary: crude honey, refined honey, wax, propolis, royal jelly, venom
Secondary: medicinal products, candles, polish, syrup etc
Packaging, Branding, standardization and quality control
Product patenting
encourage local honey consumption
Modern honey production and processing
Production of appropriate modern hives
Fresh vegetables
Indigenous vegetables/tubers
Irish potatoes
Mathira
South Mugirango
Siaya
Wajir South
Turkana South
Gatanga
Saboti
Mt. Elgon
Site selection and planning for production of fresh vegetables
Business plan-cost benefit analysis
Formation of producer groups
Coach producer groups on husbandry, marketing, gross/net margins
Identification and choice of superior inputs
Marketing survey
Determination of source of farm input(fertilizers, pesticide sprayer, jembe etc) Information on appropriate husbandry
Awareness building on credit sources
Identification of appropriate irrigation/water harvesting technologies
Identify sources, information and technology of certified/clean seeds production(Irish potatoes)
Establishment and nurturing of seedling nurseries
Conduct relevant crop husbandry practices (Land preparation, planting, weeding, crop protection, crop rotation, spraying harvesting etc)
Identify outlets for the variety of products
Enter into necessary contractual agreements
Establish necessary linkages and synergies with appropriate stakeholders
initiate and conducting relevant consultations among group members
Establish collection and information centre
Develop collection framework and procedures
Development of Packing and packaging materials(for transportation)
Observe the standards and control ( sorting, grading, weighting, pricing)
Establish appropriate storage facilities (cold storage)
Drying or desiccation
To enhance and promote milling plant (Tubers)
Product diversification-vegetables -dried ,fresh and blenched(semi cooked) canned vegetables
Tubers-Flour porridge/baking, Baby food formula, Crisps chips soaps
Promotion for specific marketing of vegetables
specific Product promotion and marketing (primary and secondary products)
transportation and distribution channels
branding and labeling
Product patenting (IPR)
Processing of the vegetables
Buying and selling of the vegetables in bulk
Seed potato production
Processing plant (for value addition of potatoes-chips
Establishment and operationalization of fresh vegetable promotion centre
Establishment of cold storage and collection centre

Priority Value Chain Analysis Study in Selected Districts Kenya
37
4.2 Detailed presentation of the value chain clusters:
Value chain analyses yielded results on the basis of the chain enterprise of choice, the specificity and peculiarity to the geographical and agro-ecological locality, and the extent to which a given enterprise (value chain) is amplified (common and developed) in the given region (constituency/district). Only a few of the identified priority value chains appeared singly and/or uniquely alone (viz beekeeping in Baringo East and ceramics in Mukurweini). Within the 24 constituencies/districts, several value chains were prioritized in two constituencies (viz talent academy in Gatanga and Laikipia East, camel milk production and processing in Bura and Mandera East and Fish farming/fishing in Kieni East and Turkana Central respectively). All the rest of the value chains appeared in multiplicity of other constituencies. The latter informed the study team to adopt some cluster approach to put together those value chains which share certain major characteristics. Through this process, eleven (11) clusters were derived as follows:
• Rabbit production, processing and marketing • Talent academy and creative arts• Chicken (indigenous and exotic) production, product processing and marketing• Camel milk production, processing and marketing• Dairy cattle and goat production, milk processing and marketing• Beef, chevon, mutton production, processing and marketing• Fruit production, processing and marketing• Ceramic materials extraction, production of ceramics and marketing• Fish farming and fishing, product processing and marketing• Honey production, processing and marketing• Fresh vegetable and tubers production, processing and marketing
Each of the value chain was analyzed at the constituency (20 in number) or the district (4 in number) level. To consolidate the immense information gathered through the process and to capture an acceptable level of detail, several value chains were clustered together. Some information may have been assumed at the generalized presentation version which could be extracted from the individual constituency reports where necessary, availed by the KENFAP Services Limited study crew. In other words, the constituency based reports are further enhanced in form and content, while this particular combined version bears the elements in their summarized version.
4.3 Engagement options or business casesThe value chain analyses yielded several business possibilities from the various stages as identified in the form of constraints resolution mechanisms or uptake of opportunities. Each possibility was unique in its own fashion and specifically targeted a certain value chain stage or a multiplicity of stages. The cases were later on clustered in view of the commonality factor with regard to those cases that are apparent in several value chains. Although specificities and peculiarities can not be completely assumed, broad overview and categorization was adopted to enhance the business case clustering. These cases are presented in the table below:

Priority Value Chain Analysis Study in Selected Districts Kenya
38
Table 5: Specific value chain based engagement options/business cases/entrepreneurial opportunities
Value chain District/ constituency Business/entrepreneurial opportunity
• Rabbit production, processing and marketing
• Mukurweini• Gichugu• Tetu
• Raising and selling of breeding stock• Establishment and operationalization of
slaughter slabs• Talent Academy / creative arts • Gatanga
• Laikipia East• Establishment of a talent development and
promotion centre• Acquisition of tools for Production
(recording, documentaries and theatric activities)
• Chicken production, processing and marketing
• Yatta • Kapenguria• Mt. Elgon• Siaya• Kieni • Igembe South• Bungoma • Laikipia East
• Establishment of a one-stop- shop comprising of a hatchery, brooder, chicken collection centres and slaughter slab
• Camel milk production, processing and marketing
• Bura• Mandera East
• Establishment of a milk processing and promotion centre
• Dairy cattle and goat production, processing and marketing
• Kandara• Mathira• Igembe South • Saboti • Mt. Elgon• Bungoma• Garsen• Wajir South • Yatta
• Establishment and management of a milk processing plant
• Establishment and operationalization of an animal feeds factory
• Beef, Chevon and Mutton production, processing and marketing
• Sigor• Mandera East• Kapenguria• Garsen• Yatta• Bura• Turkana South• Turkana Central • Baringo East
• Buying, fattening and selling of stock• Establishment of a meat, hide and skins and
related processing plant
• Fruit production, processing and marketing
• Kandara• Gichugu • South Mugirango• Tetu
• Establishment of some multi purpose fruit processing plant
• Ceramic materials extraction, production of ceramics and marketing
• Mukurweini • Establishment of a ceramics processing and marketing infrastructure
• Fish farming and fishing, product processing and marketing
• Kieni • Turkana Central
• Realization and management of fish processing plant
• Fish feed production and distribution
• Honey production, processing and marketing
• Baringo East • Modern honey production and distribution of appropriate modern hives
• Fresh vegetable and tubers production, processing and marketing
• Mathira• South Mugirango• Siaya• Turkana South• Gatanga• Saboti• Mt. Elgon• Wajir south
Processing/value addition of the chain based products including:
• Seed potato production and bulking• Establishment and operationalization of
fresh vegetable and tubers promotional centres
• Establishment of cold storage chains and market outlets
• Realization of a processing plant
Source: consultant’s own

Priority Value Chain Analysis Study in Selected Districts Kenya
39
Chapter 5
Articulation of the Youth Engagement Options
Four (4) broad categories of business cases, identified as the youth engagement options could be hived out of the study results. The detailed version of the cases (contained in constituency specific reports) encompasses the necessary peculiar actions per the
orientation of the enterprise case. Principally, broad based categories were agreed upon by the research team to both cluster and elaborate the options under the clusters. Apparently, initiation or actual realization of each business or engagement option will follow the constituency/district based interpretations.
The options encompassing promotion of specific value chains come in to advantageously amplify the chain through introduction of improved delivery mechanisms, or alleviation of the identified constraints to promote the chains’ competitiveness. Lots of emphasis appears to edge on promotion of transformation, a largely missing aspect of African agricultural set-up. The options are elaborated with respect to entry (initiation requirements and actions), growth (developmental aspects), sustainability (long term operations) and the exit strategy (transition and form transformation) aspects. These steps are considered to be particularly important as they define the critical success factors of the identified engagement options as derived from the study towards strong investment choices.
Resources are obviously required to yield results from the identified options. The research team took a deliberate option to focus on the available financial package in the market to both reduce dependency on grant, make the engagement options more realistic, people based and sustainable. In each of the constituency based reports, a clear computation of the requirements for establishment, minimizing and sustainability of the engagement options has been realized, implying that in each constituency of choice, the youth could actually be engaged sooner than later. As a back up to the human and financial resource requirements, the study clearly points out the intake/inception (entry) process which specifically detail the form into which youth could be ordered to engage. This promoted cooperative model squarely resting in the hands of communities has been proven to stand long-term strain, as long as the community is effectively engaged. The idea is to encourage youthful Kenyans to learn and try out locally driven economic engagements without necessarily relying on off-site employment.
If successful, as the research team fore-sees, then we will easily cause an economic turnaround where non-farm agriculture will form the basis for effective migration out of agriculture and yield the much needed jobs. The mainstream private sector will also see the opportunity in engaging small holder farmers in production for transformation or market ventures. A large scale practice of this concept would quickly transform the mental cum psychological dependence on employment among individuals and communities to becoming entrepreneurs and employers. This will further change our education and research system to focus a lot more on chain based promotional attributes, and addressing the core identified constraints in various sectors of the national economy. The conviction to start with the youth was a very logical and plausible idea.
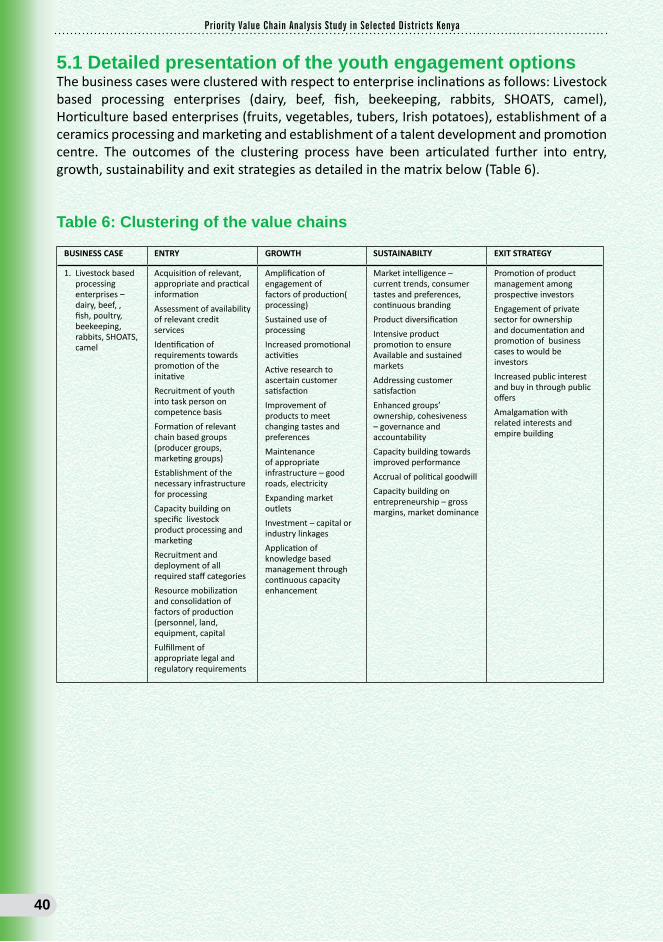
Priority Value Chain Analysis Study in Selected Districts Kenya
40
5.1 Detailed presentation of the youth engagement optionsThe business cases were clustered with respect to enterprise inclinations as follows: Livestock based processing enterprises (dairy, beef, fish, beekeeping, rabbits, SHOATS, camel), Horticulture based enterprises (fruits, vegetables, tubers, Irish potatoes), establishment of a ceramics processing and marketing and establishment of a talent development and promotion centre. The outcomes of the clustering process have been articulated further into entry, growth, sustainability and exit strategies as detailed in the matrix below (Table 6).
Table 6: Clustering of the value chains
BUSINESS CASE ENTRY GROWTH SUSTAINABILTY EXIT STRATEGY
1. Livestock based processing enterprises – dairy, beef, , fish, poultry, beekeeping, rabbits, SHOATS, camel
Acquisition of relevant, appropriate and practical information
Assessment of availability of relevant credit services
Identification of requirements towards promotion of the initative
Recruitment of youth into task person on competence basis
Formation of relevant chain based groups (producer groups, marketing groups)
Establishment of the necessary infrastructure for processing
Capacity building on specific livestock product processing and marketing
Recruitment and deployment of all required staff categories
Resource mobilization and consolidation of factors of production (personnel, land, equipment, capital
Fulfillment of appropriate legal and regulatory requirements
Amplification of engagement of factors of production( processing)
Sustained use of processing
Increased promotional activities
Active research to ascertain customer satisfaction
Improvement of products to meet changing tastes and preferences
Maintenance of appropriate infrastructure – good roads, electricity
Expanding market outlets
Investment – capital or industry linkages
Application of knowledge based management through continuous capacity enhancement
Market intelligence – current trends, consumer tastes and preferences, continuous branding
Product diversification
Intensive product promotion to ensure Available and sustained markets
Addressing customer satisfaction
Enhanced groups’ ownership, cohesiveness – governance and accountability
Capacity building towards improved performance
Accrual of political goodwill
Capacity building on entrepreneurship – gross margins, market dominance
Promotion of product management among prospective investors
Engagement of private sector for ownership and documentation and promotion of business cases to would be investors
Increased public interest and buy in through public offers
Amalgamation with related interests and empire building

Priority Value Chain Analysis Study in Selected Districts Kenya
41
BUSINESS CASE ENTRY GROWTH SUSTAINABILTY EXIT STRATEGY
2. Horticulture based enterprises – fruits, vegetables, tubers, Irish potatoes
Action research
Strategic siting
Physical infrastructure through hiring and purchase of space
Recruitment of farmers into horticultural product engagement
Formation of producer groups and management committees
Awareness creation
Capacity building
Production ordering in the wards
Election of management committees
Recruitment of staff
Establishment of input supply line
Resource acquisition
Expand information gathering and synergies
Capacity building of management committee and staff
Establishment and continuous polishing of the standards operating procedures
Expand owner recruitment
Promotion of sub centers functions among community members
Establishment of necessary linkages and synergies
Produce market sourcing
Expansion of collection and handling units
Promotion of real success stories through the local media
Inculcating promotional activities into the leadership and clergy
Product promotion among users and others
Improve on nature of products with time
Improved organization of staff and efficient service delivery
Strong focus on efficiency and effectiveness
Integration of accountability mechanisms
Increased focus on community involvement
Negotiation of soft credit terms
Linkage with other devolved funds
Sharpening the entities edge against competitors
Conducting action research on shortcoming for knowledge based management
Initiate and promote improvement plan over time
Promoting growth through product differentiation and branding
Promotion of transformation initiatives
Promotion of product management among prospective investors for ease of buying
Transformational investment
Engage community in management of the businesses
3. Establishment of a ceramics processing and marketing infrastructure
Relevant, appropriate and practical information acquisition
Availability of affordable credit services
Promotion of the value chain initiatives
Identification and zoning of ceramic production areas
Price differentiation
Engage landowners and community (youth) from the initial stages, and legalize the engagements.
Organize youth for relevant engagement.
Recruitment of youth into production and participation in the value chain
Capacity building on production, value addition and marketing of ceramics
Resource mobilization and consolidation of factors of production (personnel, land, equipment, capital)
Appropriate legislation
Acquisition and engagement of the sustained acquisition and use of factors of production
Sustain production of ceramic products
Engagement of credit facilities
Availing of other supportive services –research, managerial etc
Appropriate infrastructure – good roads, electricity
Expanding markets
Investment – capital, processing unit
Products promotion and market expansion
Market intelligence – current trends, consumer tastes and preferences, continuous branding
Product diversification
Intensive product promotion to ensure Available and sustained markets
Customer satisfaction
Enhanced groups cohesiveness – governance, accountability
Cultivated political goodwill
Lobby for appropriate legislation
Capacity building on entrepreneurship – gross margins, market dominance
Promotion of product management among prospective investors
Enhance community and landowners’ involvement and ownership
Involve private sector for ownership
Promote and document benefits of the ceramics

Priority Value Chain Analysis Study in Selected Districts Kenya
42
BUSINESS CASE ENTRY GROWTH SUSTAINABILTY EXIT STRATEGY
Establishment of a talent development and promotion centre
Relevant and appropriate information acquisition
Availability of affordable credit and supportive services
Promotion of the holistic value chain – arts, artifacts, theatre, sports etc
Recruitment of youth into producer groups and marketing groups
Capacity building on arts and talents
Resource mobilization and consolidation of factors of production (personnel, equipment, capital)
Appropriate legislation
Site selection
Acquisition and engagement of the sustained acquisition and use of factors of production
Sustain production
Engagement of credit facilities
Availing of other supportive services –research, managerial etc
Appropriate infrastructure – halls, stadia, exhibition halls, electricity , recording studios and equipment
Expanding markets
Investment – capital, industries,
Market intelligence – current trends, consumer tastes and preferences, continuous branding
Product diversification
Intensive product promotion to ensure Available and sustained markets
Customer satisfaction
Enhance groups cohesiveness – governance, a nd accountability
Cultivated political goodwill
Enforce appropriate legislation – copyrights
Change of mindsets
Promotion of products among prospective investors
Promote and document industry benefits
Acquisition of appropriate information and dissemination to the market
Involve private sector for ownership
Involve youth
Source: Consultant’s own
5.2 Skills Gap in the 24 selected constituencies Skill gap analyses are vital in helping the constituency and development agencies understand gaps in performance and possible areas for training and development. The skill gap analyses will act as a benchmark for the competencies needed for ideal performance/ implementation of the business cases in the 24 selected constituencies.
Table 7: Skills Gap in the 24 selected constituencies
CONSTITUENCY VALUE CHAINS IDENTIFIED SKILL GAP
Mukurweini • Ceramics• Rabbit keeping
• Science of ceramics• Entrepreneurial skills • Water treatment skills• Rabbits breeding
Yatta • Poultry• Dairy goat
• Dairy goat breeding and husbandry skills• Clean Milk production and handling • Chicken value addition skills (transformation)• Records keeping
Gatanga • Talent academy• Horticulture-high value/
tuber indigenous vegetables
• Formal performing art training• Vegetable handling and preservation skills • Savings and investment
Kandara • Avocado• Dairy cattle
• Avocado and milk handling skills (post harvest)• Marketing skills
Gichugu • Passion fruit• Rabbit keeping
• Marketing skills • Rabbits breeding skills • Fruits processing skills • ICT skills

Priority Value Chain Analysis Study in Selected Districts Kenya
43
Tetu • Rabbit keeping• Tomatoes
• Green house farming • Fruits handling skills • Marketing skills • Rabbits breeding skills
Mathira • Dairy cattle• Horticulture
• Marketing skills • Horticulture handling and preservation skills
Kieni • Fish farming• Indigenous poultry
• Fish preparation for market skills • Fish handling and preservation skills
Laikipia East • Creative arts• Indigenous poultry
• Marketing skills • Entrepreneurial skills • Formal creative art skills
Igembe South • Dairy cattle production• Indigenous poultry
• Negotiation skills • Investment skills
Kapenguria • Beef cattle• Poultry
• Marketing skills • Negotiation skills
Sigor • Beef cattle• Local sheep and goats
• Meat handling skills (beef and goats)• Marketing skills • Record keeping skills • Conflict management skills
Saboti • Irish potatoes• Dairy cattle
• Marketing skills • Record keeping skills • Post harvest potatoes handling and processing skills• Blight detection skills

Priority Value Chain Analysis Study in Selected Districts Kenya
44
Mt. Elgon • Irish potatoes• Poultry
• Post harvest handling and processing • Marketing skills • Conflict management skills• Blight detection skills
Bungoma • Poultry • Dairy cattle
• Modern dairy farming • Entrepreneurial skills • Poultry breeding skills
Siaya • Fresh vegetable farming• Poultry
• Vegetable farming and preservation skills (post harvest handling)• Appropriate Entrepreneurial skills
Baringo East • Bee keeping• Improved animal
production
• Modern hive construction • Bee farming and harvesting skills • Honey processing skills
South Mugirango • Fresh vegetables• Bananas
• Vegetable farming and preservation skills (post harvest handling)• Water harvesting and storage skills• Marketing skills • Bananas value addition/ processing
Garsen • Beef cattle• Dairy cattle
• Entrepreneurial skills • Record keeping skills• Water harvesting and storage skills
Bura • Goat• Camel
• Marketing skills • Record keeping skills• Entrepreneurial skills
Wajir South • Milk production• Vegetables
• Milk and vegetables post production handling skills • Record keeping skills• Conflict management skills• Water harvesting and storage skills
Mandera East • Camel• Sheep and Goats
• Entrepreneurial skills• Record keeping skills • Hygiene skills• Water harvesting and storage skills • Group dynamics skills
Turkana South • Goat production, processing and marketing Value Chain
• Fresh Vegetable production and marketing Value Chain
• Vegetable production skills • Record keeping skills • Entrepreneurial skills • Modern animals production • Hygiene skills • Conflict management skills
Turkana Central • Goat production, processing and marketing
• Fish production
• Fishing skills • Post harvest handling and processing skills• Record keeping skills• Entrepreneurial skills• Hygiene skills
Generally, the following skills lack in all the constituencies• Engineering
• Agriculturalists • Medical practitioners

Priority Value Chain Analysis Study in Selected Districts Kenya
45
Chapter 6
Conclusions and Recommendations
6.1 Conclusions
The study exposed a range of underlying factors affecting the business environment and its ability to absorb the ever increasing number of the youth. There is however need for some efforts in the direction of making the possibilities a reality. Among the many
findings the study conclud es the following:-
• There is need to underscore the importance and uniqueness of identifying priority investment options prior to actual investment
• It is important to involve youth and community in identifying possibilities and options for engagement
• Most of the priority value chains identified are agricultural which clearly concurs with the placement of the Kenyan economy as agricultural based (WDR, 2008)
• There is need for supportive services and operational infrastructure development to fast track realization of any identified business ideas.
• Value chain analysis offers a comprehensive mechanism for identification and concretization of youth engagement possibilities.
• Most proposed businesses can be easily established using the available resources and the skills at the devolved level.
• It is important to recognize the role majority of youth can play in deciding their
plight under the current socio economic order.
• The ASAL environment is peculiar. May require some specialized interventions.
• Some of the technologies available are not adequately appropriate for the ASAL environments e.g. beehives in Baringo East.
• The majority of the identified options refer to pre inception physical investments, although other stages are also implied.
• There are several ongoing enterprises that can be easily up-scaled and fall under the following categories: transport – boda boda, financial – M-pesa, saccos, and many agricultural based among others.
• In most of the constituencies, the demanded competencies are available, but only requiring basic polishing and guiding.

Priority Value Chain Analysis Study in Selected Districts Kenya
46
• Specific skills gap exist in view of local institutional outputs and the business cases as identified in the study
• There is a general preference by the youth to acquire education and skills from institutions outside the constituency.
• There is a general preference by the youth to acquire employment and alternative engagement from opportunities existing outside the constituency.
• Youth prefer employment as compared to self employment/entrepreneurship.
• Political inclinations/support to some extent affect the uptake of business opportunities
• Three types of unique problems were clearly identifiedo Problems associated with illiteracy and ignorance requiring specific
interventionso Presence of highly qualified youth and few engagement opportunitieso Cultural inclinations and the associated effects
• Devolved funds available at the constituency level could be accessed if the economic activities identified are effectively transformed into bankable business plans.
6.2 Recommendations
In order to engage the youth and lay out strategies to tackle the youth bulge and the attendant problems, the following recommendations are made.
• Correctly identify and place the contribution of the youth in the entire economic order through incorporation of true youth representation in all development structures at all levels, and having a platform for sharing information and updating the youth on ongoing projects/initiatives.
• Develope and implement programmes focusing on attracting the youth and rural communities to agribusiness. Additionally streamline this intervention within government structures.
• Clear articulation and recognition of the role of majority of the youth in deciding their plight under the current socio economic order, through deliberate efforts to appreciate and involve the youth at all stages of project/initiative development.
• Design specific and appropriate resolution mechanisms for peculiar ASAL area environment through carrying out issue specific baseline surveys to inform the development processes.
• Further research to effectively detail/resolve problems associated with identified

Priority Value Chain Analysis Study in Selected Districts Kenya
47
technological options e.g. beehives in Baringo East.
• Adopt enterprise and value chain development approaches to identify specific entry points into the businesses for recognition of interventional options, formulation and adoption of appropriate programs.
• Stagger identified entreprises through piloting and fully support investments in the specific pilot areas.
• Critically review easily adoptable business ventures with respect to the associated problems/issues through prioritization of the ventures and providing advise on the best approach for example the boda boda services and M-pesa among others.
• Verification on the available skills and competencies through skill gap analyses and the development of back up mechanisms such as review of existing curriculum and the introduction of new curriculum to tertiary institutions to deliver more rounded and qualified youth.
• Invest in rural non- farm economic activities to contain the youth in the rural areas, and facilitate out migration from agriculture.
• Impact attitudinal change by mainstreaming entrepreneurial skills and focusing of the young generation with expertise for self employment.
• Develop appropriate youth structures or empower the existing ones for ownership
and management of the identified business cases in the constituencies.
• Delink the identified opportunities from any form of political alignment through involvement of the community from the project/initiative planning stage, with special emphasis on the youth, and competitive recruitment for the relevant positions while focusing on the identified interests of the community.
• Carry out further studies on the effects of the environmental setting (cultural,
ignorance, illiteracy among others) in determining the feasibility of business development.
• Deliberate/intentional planned migration from out of farm to non- farm agriculture through creation of opportunities for private sector investment through development of appropriate business plans with clear returns on investment.

Priority Value Chain Analysis Study in Selected Districts Kenya
48
References
Export Processing Zones Authority, 2005. Meat Production in Kenya Export Processing Zones Authority, 2005. Dairy Industry in KenyaGovernment of Kenya, 2010. Dairy Master Plan Volume II Government of the Republic of Kenya, 2007. Kenya Vision 2030, the government printer
Government of Kenya 2009. Ministry of Trade Strategic Plan, 2008-2012Government of Kenya 2009. Ministry of Youth Affairs and Sports, Youth leisure, Recreation and Community Service Component of the MOYAS Strategic Plan (2007-2012)Government of Kenya, 2009. National Youth Policy Ministry of Youth Affairs and Sports
Government of Kenya, 2009. National Youth Situation Analysis Report 2009, Ministry of Youth Affairs and Sports Government of Kenya, 2010. The Kenya 2009 Kenya Population and Housing Census, Kenya National Bureau of Statistics
Government of the Republic of Kenya, 2008. The Ministry of Trade Vision 2030, Sector Plan for Trade, 2008-2012Kenya Institute for Public Policy Research and Analysis, 2009. Kenya Economic Report, 2009Kleemann Gunter (ed.) Wiesbaden, 1999. Service Management in Livestock DevelopmentMinistry of Agriculture, 2005. National Irish Potato PolicyMinistry of Agriculture2010. Yatta District Brief, 2010Self help Africa, 2010. Dairy Cattle Training Manual, 2010Ssajjiemba Faustin Kennedy, 2008. Value chain analysis – Fresh tomatoes in Uganda and Kenya
United Nations Development Program, 2010. Kenya National Human Development Report, 2009
URL’shttp://www.biosciences.elewa.org/JABS/2009/16/10.pdfhttp://www.fao.org
http://www.infonet-biovision.org
http://www.ke.undp.org
http://www.kenyakim.com
http://www.kilimo.go.ke http://makeadiff.in/blog/2010/02/25/the-mad-national-conference-2010/http://www.youthaidscoalition.org

Priority Value Chain Analysis Study in Selected Districts Kenya
49
Annex
Quantification and costing of an investment modelThe Fresh vegetable value chain business/ engagement opportunitiesDuring the analysis of the fresh vegetable value chain, in the pre-production stage, a very viable investment opportunity was identified. This was as a result of the lack of a centralized unit for all information required for the production and sale of fresh vegetables. This opportunity would be handled by the establishment of a fresh vegetable promotion centre.
Due to its small size, the fresh vegetable market in South Mugirango lacked sufficient quantities of vegetables that would be collected and transported to different markets. However, the establishment of fresh vegetable promotion centre would avail an increase in quantities that would be sufficient for transportation to other neighboring markets. These fresh vegetables would need to be collected at various locations in South Mugirango, thus the need to establish collection centers that would be managed by the youth.
Fresh Vegetable Production and Promotion ServicesAnalysis of the vegetable promotion value chain established that most of the stakeholders engaged in the promotion of fresh vegetables but lacked sufficient information. These stakeholders include those who sell farm inputs (seeds, fertilizers and agro-chemicals). In some cases, they do not have the knowledge to specifically advise prospective produce users on the detailed value chain specific content but only give information on the details available on that particular product required according to the details on the product label. Some are not licensed to provide certain products thus resulting in the provision of sub- standard products.
The Ministry of Agriculture office in South Mugirango has information on the general topography of the area but information on soil conditions and suitability for vegetable production/ promotion is not available to the farmers. This is mainly due to the lack of effective sensitization of the community on the availability of the information. The information is also not farmer specific; it has not been tailored for the specific farmer’s productive land. There is therefore a great opportunity for the South Mugirango youth to establish and run a resource centre for fresh vegetable promotion which could be centrally located at the district headquarters and supported with sub-centers. Such a centre could specialize in data acquisition and management and grow to a one-stop-shop for all those who aspire to promote fresh vegetables in this area. Information considered useful for selling in such centers include, soil types and characteristics, fertilizers based on soil types, classification of the various vegetable types suitable for the area, information on products and service providers, together with contacts for such points. Information on costs of production can also be availed at the centre.
Requirements for establishment of a Fresh Vegetables Promotion Centre (FVPC)Establishment of a vegetable promotion and resource centre infrastructure will include a

Priority Value Chain Analysis Study in Selected Districts Kenya
50
building that would house the variety of information acquisition, compilation units, storage and retrieval capacity, a meeting area and various offices. The information would later be packaged upon assessment of the needs of the enquiring farmer. From the same district, youthful personnel who are readily available would be sought to support initiatives of the centre and the related promotional activities.
Required investments for Fresh Vegetables Promotion Centre (FVPC) and Fresh Vegetable Collection Centre (FVCC)The education levels in the community are considerably high thus availing skilled and semi-skilled youth to participate in effectively establishing and running the centres. There are several tertiary institutions including the Moi Institute of Technology, Gusii Institute of Technology, Kenya Institute of Highways, Kenya Institute of Management, St. Ann Computer College and Kisii University College all of which are known to produce intermediate level, and high level or professional competencies which would usefully package the resource centres and the envisaged sub units across the constituency landscape. Education support initiatives are available in the district including the Constituency Development Fund (CDF) bursaries. About 20% drop out of primary schools resulting from early marriages, lack of school fees, early pregnancies and child labour implying that they are all available to provide casual labour. We therefore have no scarcity of managers, middle level technicians and casual labour suppliers. Those institutions offer such courses as tailoring, building and construction, motor mechanics, shoe making, carpentry, business management and nursing among others. Taking the above as the experts packaging, it is therefore apparent that establishment of a resource centre would not have a problem with the personnel to be engaged in the variety of disciplines that would run the business effectively. Several cost centres are envisaged among which include the actual centre infrastructural establishment, establishment of information sources; business contacts with the data sources, acquisition of data capture and storage facilities, marketing of the centre and operational costs among others are as below:
a) Estimates of costs of establishing a center
Inputs
Loan Amount 6,872,800.0
Annual Interest Rate 12.00%
Term of Loan in Years 5
First Payment Date 1/1/2011
Frequency of Payment Monthly
Summary
Rate (per period) 1.000%Payment (per period) 152,882
Total Payments 9,172,898.44 Total Interest 2,300,098.44
Interest Savings (0.04)

Priority Value Chain Analysis Study in Selected Districts Kenya
51
No.Due
Date Payment DueAdditional
Payment Interest Principal Balance
6,872,800
1 1/1/2011 152,881.64 0.00 68,728.00 84,153.64 6,788,646.362 2/1/2011 152,881.64 0.00 67,886.46 84,995.18 6,703,651.183 3/1/2011 152,881.64 0.00 67,036.51 85,845.13 6,617,806.054 4/1/2011 152,881.64 0.00 66,178.06 86,703.58 6,531,102.475 5/1/2011 152,881.64 0.00 65,311.02 87,570.62 6,443,531.856 6/1/2011 152,881.64 0.00 64,435.32 88,446.32 6,355,085.537 7/1/2011 152,881.64 0.00 63,550.86 89,330.78 6,265,754.758 8/1/2011 152,881.64 0.00 62,657.55 90,224.09 6,175,530.669 9/1/2011 152,881.64 0.00 61,755.31 91,126.33 6,084,404.33
10 10/1/2011 152,881.64 0.00 60,844.04 92,037.60 5,992,366.7311 11/1/2011 152,881.64 0.00 59,923.67 92,957.97 5,899,408.7612 12/1/2011 152,881.64 0.00 58,994.09 93,887.55 5,805,521.2113 1/1/2012 152,881.64 0.00 58,055.21 94,826.43 5,710,694.7814 2/1/2012 152,881.64 0.00 57,106.95 95,774.69 5,614,920.0915 3/1/2012 152,881.64 0.00 56,149.20 96,732.44 5,518,187.6516 4/1/2012 152,881.64 0.00 55,181.88 97,699.76 5,420,487.8917 5/1/2012 152,881.64 0.00 54,204.88 98,676.76 5,321,811.1318 6/1/2012 152,881.64 0.00 53,218.11 99,663.53 5,222,147.6019 7/1/2012 152,881.64 0.00 52,221.48 100,660.16 5,121,487.4420 8/1/2012 152,881.64 0.00 51,214.87 101,666.77 5,019,820.6721 9/1/2012 152,881.64 0.00 50,198.21 102,683.43 4,917,137.2422 10/1/2012 152,881.64 0.00 49,171.37 103,710.27 4,813,426.9723 11/1/2012 152,881.64 0.00 48,134.27 104,747.37 4,708,679.6024 12/1/2012 152,881.64 0.00 47,086.80 105,794.84 4,602,884.7625 1/1/2013 152,881.64 0.00 46,028.85 106,852.79 4,496,031.9726 2/1/2013 152,881.64 0.00 44,960.32 107,921.32 4,388,110.6527 3/1/2013 152,881.64 0.00 43,881.11 109,000.53 4,279,110.1228 4/1/2013 152,881.64 0.00 42,791.10 110,090.54 4,169,019.5829 5/1/2013 152,881.64 0.00 41,690.20 111,191.44 4,057,828.1430 6/1/2013 152,881.64 0.00 40,578.28 112,303.36 3,945,524.7831 7/1/2013 152,881.64 0.00 39,455.25 113,426.39 3,832,098.3932 8/1/2013 152,881.64 0.00 38,320.98 114,560.66 3,717,537.7333 9/1/2013 152,881.64 0.00 37,175.38 115,706.26 3,601,831.4734 10/1/2013 152,881.64 0.00 36,018.31 116,863.33 3,484,968.1435 11/1/2013 152,881.64 0.00 34,849.68 118,031.96 3,366,936.1836 12/1/2013 152,881.64 0.00 33,669.36 119,212.28 3,247,723.9037 1/1/2014 152,881.64 0.00 32,477.24 120,404.40 3,127,319.5038 2/1/2014 152,881.64 0.00 31,273.20 121,608.44 3,005,711.0639 3/1/2014 152,881.64 0.00 30,057.11 122,824.53 2,882,886.5340 4/1/2014 152,881.64 0.00 28,828.87 124,052.77 2,758,833.7641 5/1/2014 152,881.64 0.00 27,588.34 125,293.30 2,633,540.4642 6/1/2014 152,881.64 0.00 26,335.40 126,546.24 2,506,994.2243 7/1/2014 152,881.64 0.00 25,069.94 127,811.70 2,379,182.5244 8/1/2014 152,881.64 0.00 23,791.83 129,089.81 2,250,092.7145 9/1/2014 152,881.64 0.00 22,500.93 130,380.71 2,119,712.0046 10/1/2014 152,881.64 0.00 21,197.12 131,684.52 1,988,027.4847 11/1/2014 152,881.64 0.00 19,880.27 133,001.37 1,855,026.1148 12/1/2014 152,881.64 0.00 18,550.26 134,331.38 1,720,694.7349 1/1/2015 152,881.64 0.00 17,206.95 135,674.69 1,585,020.0450 2/1/2015 152,881.64 0.00 15,850.20 137,031.44 1,447,988.6051 3/1/2015 152,881.64 0.00 14,479.89 138,401.75 1,309,586.85

Priority Value Chain Analysis Study in Selected Districts Kenya
52
52 4/1/2015 152,881.64 0.00 13,095.87 139,785.77 1,169,801.0853 5/1/2015 152,881.64 0.00 11,698.01 141,183.63 1,028,617.4554 6/1/2015 152,881.64 0.00 10,286.17 142,595.47 886,021.9855 7/1/2015 152,881.64 0.00 8,860.22 144,021.42 742,000.5656 8/1/2015 152,881.64 0.00 7,420.01 145,461.63 596,538.9357 9/1/2015 152,881.64 0.00 5,965.39 146,916.25 449,622.6858 10/1/2015 152,881.64 0.00 4,496.23 148,385.41 301,237.2759 11/1/2015 152,881.64 0.00 3,012.37 149,869.27 151,368.0060 12/1/2015 152,881.68 0.00 1,513.68 151,368.00 0.00
Cost Centre Unit cost Total cost
Building Infrastructure Total cost of construction at Headquarter 1,500,000.00 Rent payment for five sub-centers 300,000.00
Communication infrastructure(marketing and promotion of the enterprise)
Estimated at Head quarter 500,000.00Five sub-centers 150,000.00
Data collection and processing Estimated at Head quarter 500,000.00Five sub-centers 50,000.00
Information storage and packaging Estimated at Head quarter and five sub centres 200,000.00 100,000.00
Establishment of business relations and links with stakeholders
Estimated at Head quarter and five sub centres 250,000.00250,000.00
Sub-totals Estimated at Head quarter and five sub centres 2,950,000.00850,000.00
Add: Miscellaneous 10% for total HQ costs 295,000.00
Five sub- centres 85,000.00
Total
Headquarter 3,245,000.00
Five sub- centres 935,000.00
Kshs. 4,180,000
b) Operation and maintenance costs
Initial establishment cost = Kshs. 4,180,000.00RemunerationsBasic salaries and wages (Approximately) Centre Manager Kshs. 30,000.00 Asst. Manager Kshs. 20,000.00 Data Officer Kshs. 20,000.00 Promotion and marketing Officer Kshs. 20,000.00 Extension Officer Kshs. 20,000.00 5 sub centre task persons @ 12,000 Kshs. 60,000.00 Office attendant/ receptionist Kshs. 10,000.00 Cleaners (2 @ 5,000) Kshs. 10,000.00 Security personnel Kshs. 14,000.00
Total Kshs. 204,000.00Add 10% miscellaneous allowance Kshs. 20,400.00
Total Kshs. 224,400.00 x 12Grand Total Kshs. 2,692,800.00

Priority Value Chain Analysis Study in Selected Districts Kenya
53
The initial outlay is expected to be provided by application of a term loan; therefore it is assumed that there shall be no salary increments during the loan repayment period.
c) Cost of the borrowed money:
Total loan amount = Kshs. 6,873,800Total Repayment = principal /period in years + total interest /period in years.Interest rate is assumed to be 12%Repayment period is 5 years as this kind of loan is a term loan.
Loan amortization schedule:Comparison Table
Assuming no extra payments
Frequency Payment Total InterestAnnually 1,906,581.61 9,532,908.05 2,660,108.05 Semi-Annually 933,793.30 9,337,933.00 2,465,133.00 Quarterly 461,960.12 9,239,202.40 2,366,402.40 Bi-Monthly 306,869.99 9,206,099.70 2,333,299.70 Monthly 152,881.64 9,172,898.40 2,300,098.40 Semi-Monthly 76,302.17 9,156,260.40 2,283,460.40 Bi-Weekly 70,422.92 9,154,979.60 2,282,179.60 Weekly 35,181.89 9,147,291.40 2,274,491.40
d) Expected revenue calculations
The centre is expected to offer information packages for the farmers. It was established that Kshs. 100 per package was a viable cost. Assuming that the headquarter sells five packages per hour while the sub centre handles three packages, the expected revenue will be;100*5*8= Kshs. 4,000 per day4,000*24= Kshs. 96,000 per monthTotal income per year from the Headquarter =96,000 *12 =Kshs. 1,152,000 100*3*8*5 =Kshs. 12,000 per day12,000*24 =Kshs. 288,000 per month Total income per year from the sub- centres =Kshs. 288,000*12 =Kshs 3,456,000Total income from the entire investment =Kshs. 4,608,000 p.a
Cash flow analysisThe centre is assumed to achieve its target revenue of Kshs. 4,608,000 p.a in phases such that the total revenue with respect to the payment period; by a fifth every year.

Priority Value Chain Analysis Study in Selected Districts Kenya
54
Cash flow projections for the first five years:
Year
Estimated income
Estimated annual costs
Annual Loan repayment
Total out flow
Variance
1 921,600 224,000 1,906,582 2,130,582 (984,982)2 1,843,200 224,000 1,906,582 2,130,582 (63,382)3 2,764,800 224,000 1,906,582 2,130,582 858,218 4 3,686,400 224,000 1,906,582 2,130,582 1,779,818 5 4,608,000 224,000 1,906,582 2,130,582 2,701,418
With effective marketing and promotion of the centre and effective sensitization of the farmers, increase in the quantities of packages sales per month would cause the investment to be very successful.
Establishment and operation of the Fresh Vegetable Collection Centers. (FVCC)
Through the value chain analysis, a clear gap was identified concerning the organization of production and marketing of vegetables within and possibly outside the constituency. Thus the need for establishment of a centre for collection of the fresh vegetables at centralized locations that would enhance their easy transportation to the markets.
To sustain the operations of the collection centres, the participating farmers would be required to register with the centre so as to identify all the beneficiaries. Subscription of Kshs 100 per month and renewal of the same was found very viable. The revenue should be ideal to off-set all the centre costs.
Cost of Establishing and operation of a collection center
South Mugirango has 11 wards therefore the need for a centralized collection centre was found to be more viable.
Management cost of the centre
Payee Total
Manager Kshs 20,000 20,000
Assistant manager Kshs 15,000 15,000
Three support assistants Kshs 10,000 each 30,000
Two cleaners Kshs 6,000 each 12,000
TOTAL 77,000
Administration costs estimated at Kshs 30,000 per monthSub-total costs = Kshs. 107,00010% allowance for miscellaneous costs = Kshs. 10,700Total operational costs = Kshs. 117,700 per monthTotal Cost per year = Kshs. 1,412,400.00

Priority Value Chain Analysis Study in Selected Districts Kenya
55
To sustain such a centre, the membership should not be less than 1,177 farmers per year each paying Kshs 100 per month. Since with time such centres will be established per administrative division (wards), there is growth potential in both number of members and amount of money made. This will ensure requisite business growth.
Planting material multiplication units
It was also established that many youth would wish to engage in the multiplication of the fresh vegetable seedlings. However, this was found to be best suited to be undertaken on individual basis or the youths would form groups that would liaise with the promotion centre so as to be the suppliers of the fresh vegetable seedlings.

Priority Value Chain Analysis Study in Selected Districts Kenya
56