VALUATION REPORT - TASE
39
VALUATION REPORT 490,950 sq. m land Afumati Commune, Ilfov County, Romania Intercolony Investments Limited Valuation Date: 31 st of December 2014
Transcript of VALUATION REPORT - TASE
VALUATION REPORT
490,950 sq. m land
Afumati Commune,
Ilfov County, Romania
Intercolony Investments Limited
Valuation Date: 31st
of December 2014

TABLE OF CONTENTS
1 EXECUTIVE SUMMARY
2 VALUATION REPORT
3 PROPERTY REPORT
PROPERTY DETAILS
LEGAL CONSIDERATIONS
VALUATION METHODOLOGY
OPINION OF VALUE
4 MARKET REPORTS
The contents of this Report may only be relied upon by:
(i) Addressees of the Report; or
(ii) Parties who have received prior written consent from CBRE in the form of a reliance letter.
This Report is to be read and construed in its entirety and reliance on this Report is strictly subject to the
disclaimers and limitations on liability on page 7. Please review this information prior to acting in reliance
on the contents of this Report. If you do not understand this information, we recommend you seek
independent legal counsel.

EXECUTIVE SUMMARY
2
1
EXECUTIVE
SUMMARY

EXECUTIVE SUMMARY
3
EXECUTIVE SUMMARY
The Property
Address: Afumati Commune, Ilfov County, Romania
Best Use: agricultural land
Property rights
From the client’s information and documentation provided to us we understand that the
above mentioned property is owned on the equivalent of freehold of SC TACTICAL
PROPERTY SRL.
Fair Value
€1,476,000 (ONE MILLION FOUR HUNDRED SEVENTY THOUSANDS
EUR), exclusive of VAT
Forced Sale Value
The forced sale value or the liquidation value is the estimated amount of money that an
asset could quickly be sold for; when it is allowed insufficient time to sell on the open
market, thereby reducing its exposure to potential buyers. The forced sale value can
involve a seller compelled to sell and a buyer(s) that purchase(s) fully aware of the
seller’s disadvantage. Forced sale value is a situation when the transaction is actually
closed and does not represent a type of value according Valuation Standards. As a
consequence of this aspect, the analysis of estimated price in a forced sale does not
meet the valuation conditions, being an exception of the Valuation Standards
requirements.
We estimate the forced sale value for the analysed real estate property based on the
following criteria:
Property type;
Location;

EXECUTIVE SUMMARY
4
Medium exposure time for an agricultural land, on the open market, is
approximately 12-18 months, considering the existing demand for similar
properties, but the restricted access to mortgage and liquidities;
In case of a forced sale with an exposure time on the open market less than 6 months,
we estimate a 50% discount from current market value.
Based on the above specifications, in our opinion, forced sale value of the analyzed
property, as at 31st
December 2014, is:
€738,000 (SEVEN HUNDRED THIRTY EIGHT THOUSAND EUROS)

VALUATION REPORT
5
2
VALUATION REPORT

VALUATION REPORT
6
VALUATION REPORT
Report Date 09th
of March 2015
Addressee Intercolony Investments Limited
Client Intercolony Investments Limited
The Property The property consists in 40 land parcels situated in 7
different fields, having the total area of 490,950 sq m.
Ownership Purpose Investment
Instruction To provide our opinion on the Fair Value of the subject
property as at the Valuation Date in accordance with
client’s instruction dated 10th
February 2015.
Valuation Date 31st
of December 2014
Capacity of Valuer External
Purpose Financial reporting
Fair Value €1,476,000 (ONE MILLION FOUR HUNDRED
SEVENTY THOUSANDS EUR), exclusive of VAT
Our opinion of Fair Value is based upon the Scope of
Work and Valuation Assumptions attached.
Compliance with
Valuation Standards
The valuation has been prepared in accordance with The
RICS Valuation – Professional Standards January 2014
(“the Red Book”). In addition, the valuation is also
prepared in compliance with IFRS 13 (International
Financial Reporting Standards 13 – fair value
measurement).
The property details on which valuation is based on are
as set out in this report.
Special Assumptions None.
Assumptions We have made various assumptions as to tenure, town
planning, and the condition of the site – including
ground and groundwater contamination – as set out

VALUATION REPORT
7
below.
If any of the information or assumptions on which the
valuation is based are subsequently found to be
incorrect, the valuation figures may also be incorrect and
should be reconsidered.
The allocations of value for any land distribution must
not be used in conjunction with any other appraisal and
are invalid if so used.
Market Conditions The values stated in this report represent our objective
opinion of Market Value in accordance with the
definition set out above as of the date of
valuation. Amongst other things, this assumes that the
properties had been properly marketed and that
exchange of contracts took place on this date.
Going forward, we would draw your attention to the fact
that the current volatility in the global financial system
has created a significant degree of turbulence in
commercial real estate markets across the
world. Furthermore, the lack of liquidity in the capital
markets means that it may be very difficult to achieve a
sale of property assets in the short-term. We would
therefore recommend that the situation and the
valuations are kept under regular review, and that
specific marketing advice is obtained should you wish to
effect a disposal.
Valuer The Property has been valued by a valuer who is
qualified for the purpose of the valuation in accordance
with the RICS Valuation – Professional Standards January
2014 (The Red Book).
Independence The amount representing the payment for our drafting
this report has no connection whatsoever with
mentioning in the report a certain value (from the
valuation) or interval of values that might be favourable
to the client nor is it influenced by the occurrence of a
subsequent event.
Conflict of Interest We have no personal interest or bias with respect to the
subject matter of this appraisal report or the parties
involved.

VALUATION REPORT
8
Reliance This report is for the use only of the party to whom it is
addressed for the specific purpose set out herein and no
responsibility is accepted to any third party for the whole
or any part of its contents.
The appraiser will not be required to give testimony or
appear in court because of having made this appraisal,
with reference to the property in question, unless
previous arrangements have been made.
Publication
Liability Notice
Neither the whole nor any part of our report nor any
references thereto may be included in any published
document, circular or statement nor published in any
way without our prior written approval of the form and
context in which it will appear.
This valuation report (the “Report”) has been prepared
by CBRE Real Estate Consultancy SRL (“CBRE”)
exclusively for Intercolony Investments Limited (the
“Client”) in accordance with the terms of the instruction
letter dated 10th
of February 2015 (“the Instruction”).
The Report is confidential. It must not be disclosed to any
person other than the Client without CBRE's prior written
consent. CBRE has provided this report on the
understanding that it will only be seen and used by the
Client and no other person is entitled to rely upon it,
unless CBRE has expressly agreed in writing.
Where CBRE has expressly agreed that a person other
than the Client can rely upon the report then CBRE shall
have no greater liability to any party relying on this
report than it would have had if such party had been
named as a joint client under the Instruction.
CBRE’s maximum aggregate liability to all parties,
howsoever arising under, in connection with or pursuant
to reliance upon this Report, and whether in contract,
tort, negligence or otherwise shall not exceed the lower
of:
(i) 25% of the value of the property to which the
relates on the date of the Instruction; or
(ii) 20,000 Euro; and
CBRE shall not be liable for any indirect, special or
consequential loss or damage howsoever caused,

VALUATION REPORT
9
whether in contract, tort, negligence or otherwise, arising
from or in connection with this Report. Nothing in this
Report shall exclude liability which cannot be excluded
by law.
Yours faithfully
Ovidiu Ion, MRICS
Director
Head of Valuation
For and on behalf of
CBRE
T: +40 21 302 50 81
Yours faithfully
Florin Ianculescu-Popa
Senior Valuer
For and on behalf of
CBRE
T: +40 21 302 50 84

VALUATION REPORT
10
SCOPE OF WORK & SOURCES OF
INFORMATION
Sources of
Information
We have carried out our work based upon information
supplied to us by the client, which we have assumed to
be correct and comprehensive.
Information furnished by others is assumed to be true,
correct and reliable. A reasonable effort has been
made to verify such information; however, the appraiser
assumes no responsibility for its accuracy. If, for any
reason, future investigations should prove any data to
be in substantial variance with that presented in this
report, the appraiser reserves the right to alter or
change any or all conclusions and/or estimates of
value.
The Property Our report contains a brief summary of the property
details on which our valuation has been based on.
Inspection No inspection.
Areas We rely on the areas as provided by the client to us. We
did not perform effective measurements of the real
estate.
A legal description may not have been furnished, and it
is assumed that the physical characteristics of the
property, with regard to metres and bounds and road
frontages, are essentially as depicted on the plat of the
property.
Environmental
Matters
We have not carried out any investigation into the past
or present uses of the Property, nor of any neighbouring
land, in order to establish whether there is any potential
for contamination and have therefore assumed that
none exists.
Condition We have not carried out any surveys, tested services,
made site investigations, nor any evidence report to
provide the condition of the site.

VALUATION REPORT
11
Town Planning The real estate is assumed consistent with all the
regulations and restrictions related to zoning and use,
except for the situation when non-compliance is
identified, described and considered in this report.
It is assumed that all applicable zoning and use
regulations and restrictions have been complied with,
unless nonconformity has been stated, defined and
considered in the appraisal report.
We have not made verbal enquiries with the local
authority. We have relied upon the planning
information provided by Intercolony Investments Limited.
Titles, Tenures and
Lettings
Details of title/tenure under which the Property is held
and of lettings to which it is subject are as supplied to
us. We have not generally examined nor had access to
all the deeds, leases or other documents relating
thereto. Where information from deeds, leases or other
documents is recorded in this report, it represents our
understanding of the relevant documents. We should
emphasise, however, that the interpretation of the
documents of title (including relevant deeds, leases and
planning consents) is the responsibility of your legal
adviser.
We have not conducted credit enquiries on the financial
status of any tenants. We have, however, reflected our
general understanding of purchasers’ likely perceptions
of the financial status of tenants.

VALUATION REPORT
12
VALUATION ASSUMPTIONS
Valuation Basis
The value of each of the properties has been assessed
in accordance with the relevant parts of RICS Valuation
– Professional Standards (January 2014). In particular,
we have assessed the Fair Value of the properties in
accordance with VS3.5 item 2. Under these provisions,
the term "Fair Value" means:
"The price that would be received to sell an asset, or
paid to transfer a liability, in an orderly transaction
between market participants at the measurement date".
No allowances have been made for any expenses of
realisation nor for taxation which might arise in the
event of a disposal. Acquisition costs have not been
included in our valuation.
No account has been taken of any inter-company
leases or arrangements, nor of any mortgages,
debentures or other charges.
The Property The property is valued as agricultural land.
All measurements, areas and limits are approximately
considered based on survey plans provided to us.
Environmental
Matters
In the absence of any information to the contrary, we
have assumed that:
(a) the Property is not contaminated and is not adversely
affected by any existing or proposed environmental law;
(b) any processes which are carried out on the Property
which are regulated by environmental legislation are
properly licensed by the appropriate authorities.
Repair and Condition In the absence of any information to the contrary, we
have assumed that:
(a) there are no abnormal ground conditions, nor
archaeological remains, present which might adversely
affect the current or future occupation, development or
value of the property;
(b) the Property is free from infestation or latent defect.

VALUATION REPORT
13
Title, Tenure,
Planning and Lettings
Unless stated otherwise within this report, and in the
absence of any information to the contrary, we have
assumed that:
(a) the Property possesses a good and marketable title
free from any onerous or hampering restrictions or
conditions;
(b) all buildings have been erected either prior to
planning control, or in accordance with planning
permissions, and have the benefit of permanent
planning consents or existing use rights for their current
use;
(c) the Property is not adversely affected by town
planning or road proposals;
(d) all buildings comply with all statutory and local
authority requirements including building, fire and
health and safety regulations;
(e) only minor or inconsequential costs will be incurred
if any modifications or alterations are necessary in order
for occupiers of each Property to comply with the
provisions of the relevant disability discrimination
legislation;
(f) there are no tenant’s improvements that will
materially affect our opinion of the rent that would be
obtained on review or renewal;
g) tenants will meet their obligations under their leases;
h) there are no user restrictions or other restrictive
covenants in leases which would adversely affect value;
(i) where appropriate, permission to assign the interest
being valued herein would not be withheld by the
landlord where required; and
(j) vacant possession can be given of all
accommodation which is unlet or is let on a service
occupancy.

PROPERTY REPORT
14
3
PROPERTY REPORT
PROPERTY REPORT
15
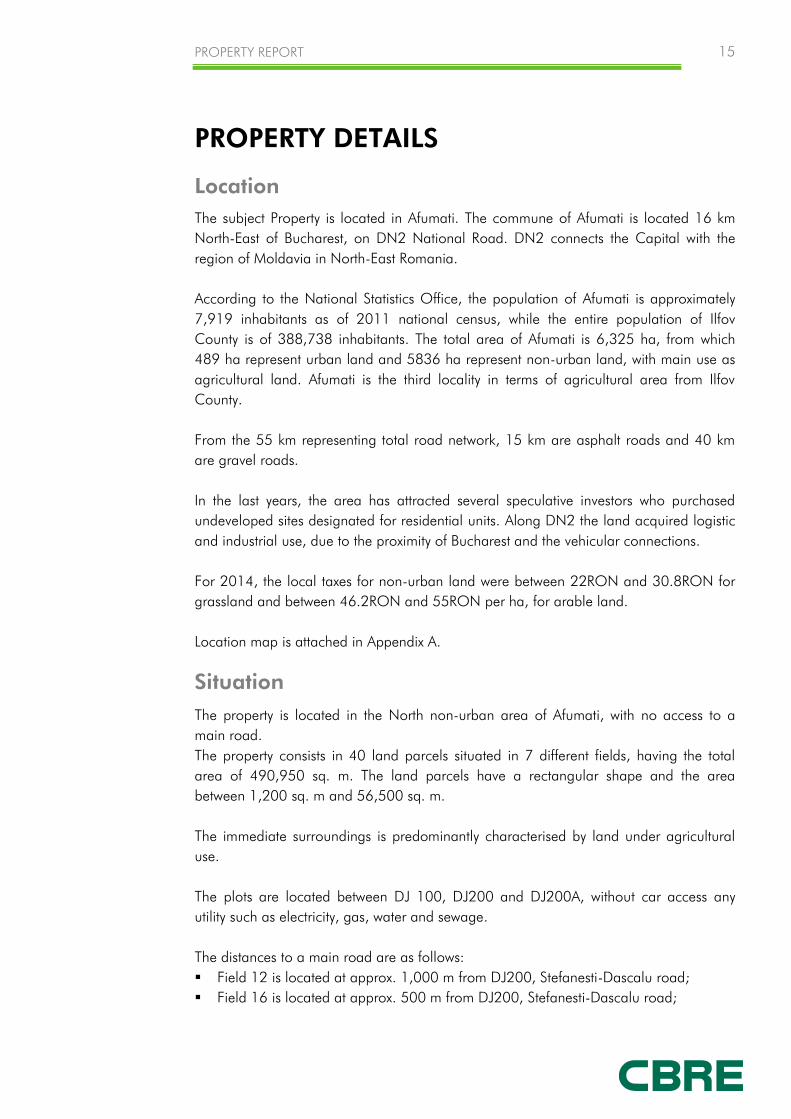
PROPERTY DETAILS
Location
The subject Property is located in Afumati. The commune of Afumati is located 16 km
North-East of Bucharest, on DN2 National Road. DN2 connects the Capital with the
region of Moldavia in North-East Romania.
According to the National Statistics Office, the population of Afumati is approximately
7,919 inhabitants as of 2011 national census, while the entire population of Ilfov
County is of 388,738 inhabitants. The total area of Afumati is 6,325 ha, from which
489 ha represent urban land and 5836 ha represent non-urban land, with main use as
agricultural land. Afumati is the third locality in terms of agricultural area from Ilfov
County.
From the 55 km representing total road network, 15 km are asphalt roads and 40 km
are gravel roads.
In the last years, the area has attracted several speculative investors who purchased
undeveloped sites designated for residential units. Along DN2 the land acquired logistic
and industrial use, due to the proximity of Bucharest and the vehicular connections.
For 2014, the local taxes for non-urban land were between 22RON and 30.8RON for
grassland and between 46.2RON and 55RON per ha, for arable land.
Location map is attached in Appendix A.
Situation
The property is located in the North non-urban area of Afumati, with no access to a
main road.
The property consists in 40 land parcels situated in 7 different fields, having the total
area of 490,950 sq. m. The land parcels have a rectangular shape and the area
between 1,200 sq. m and 56,500 sq. m.
The immediate surroundings is predominantly characterised by land under agricultural
use.
The plots are located between DJ 100, DJ200 and DJ200A, without car access any
utility such as electricity, gas, water and sewage.
The distances to a main road are as follows:
Field 12 is located at approx. 1,000 m from DJ200, Stefanesti-Dascalu road;
Field 16 is located at approx. 500 m from DJ200, Stefanesti-Dascalu road;

PROPERTY REPORT
16
Field 19 and Field 20 are located at approx. 600 m from DJ100, Afumati-Stefanesti
road;
Field 21 and Field 22 are located at approx. 1,000 m from DJ200, Stefanesti-
Dascalu road;
Field 32 is located at approx. 1,200 m from DJ200A, Afumati-Petrachioaia road.
Environmental Considerations
We have not been provided with copies of any environmental reports or certificates from
the Owners of the Property. We would recommend that clarification should be sought
from your legal representatives in relation to any contamination concerns or health and
safety issues that could be present at the Property.
We have not conducted any environmental analysis of the Property. We have therefore
assumed that there are no environmental issues affecting the Property, or if so, that
contamination is minor in nature and will not materially affect the continued use of the
Property.
Town Planning
We have not made any further verbal enquiries to the planning department and have
assumed that the current use of the Site does not contravene any town planning
regulations. We were provided with documents by the current owner and have assumed
these to be complete and correct.

PROPERTY REPORT
17
VAT
We have not been advised whether the property is elected for VAT.
All values stated in this report are exclusive of VAT.

PROPERTY REPORT
18
LEGAL CONSIDERATIONS
Ownership Titles
We understand that SC TACTICAL PROPERTY SRL holds the property freehold.
According to the Cadastral Documentation, the property has a total area of 490,950 sq.
NO. FIELD PLOT NO. CADASTRAL NO.
1 16 65/7 1418/1
2 19 90/29 1781
3 19 90/30 1891
4 19 90/31 1780
5 19 90/32 1537
6 19 90 536
7 19 90 1273
8 19 90/43 964
9 19 90/27 1307
10 19 90/23/1 1265
11 19 90/23 1460
12 19 90/23/1 1266
13 19 90/33/2 2705
14 19 90/33/1 2707
15 19 90/28 n/a
16 19 90/17 2737
17 19 90/5 1479/1
18 20 94/25 2840
19 21 100 1785
20 21 100 61705
21 21 100 1888
22 21 100 2722
23 21 100 1183
24 21 100 2278
25 21 100/27 1176
26 21 100/7 2606
27 21 100/4 1248
28 22 102/7 1681
29 12 45 2221
30 12 45 2020
31 12 45/47 2609
32 12 45/7 2431
33 12 45/7 2232
34 12 45/8 2376
35 12 45/16 1228
36 12 45/17 1229
37 12 45/6 2700
38 32 136 1505
39 32 135/41 2172
40 32 136/38 1763

PROPERTY REPORT
19
VALUATION METHODOLOGY
Market Comparison Approach
In assessing the market value of the property, we have carried out the market
comparison approach.
We have analysed the agricultural lands, which are in offer stage in the area of Afumati
Commune.
We performed several tasks in developing an opinion of land value:
Gather data on actual sales as well as offers and options.
Identify the similarities and differences in the data.
Identify the highest and best use of each potential comparable sale.
Adjust the sale prices of the comparable to account for the dissimilar
characteristics of the appraised land.
Form a conclusion as to the market value of the subject land.
It is usually reasonable to assume that the subject property will sell for an amount similar
to the adjusted sale prices of the comparable properties or less than the adjusted list
prices of properties on the market or recently off the market.
Land offers in Afumati Commune area
The average asking prices vary between €1.20/sq m and €7/sq m depending on the size
of the land parcel and the proximity to a main road and utilities.
A limited number of investment transactions characterize local market and the use of
investment data is restricted due to the lack of public accessibility to private sector
information. When transactions actually occur, the terms of the exchange are not
disclosed to the public, thereby precluding positive comparability.
As the local market is of immature, non-transparent and strictly confidential natures,
absolute reliable comparable properties to subject site were not available to us. In order
NO. LOCATION TOTAL AREA ASKING PRICE PRICE/SQ. M
1 Afumati 1,000,000 1,200,000 1.20
2 Gradistea 28,000 33,600 1.20
3 Petrachioaia Surlari 25,000 37,500 1.50
4 Petrachioaia 57,500 86,250 1.50
5 Balaceanca- Cernica 12,000 22,000 1.83
6 Bucuresti_Urziceni E85 Area 10,000 20,000 2.00
7 Gradistea 1,000,000 2,500,000 2.50
8 Afumati Ganeasa 25,000 75,000 3.00
9 Afumati Petrachioaia 12,600 50,400 4.00
10 Afumati Petrachioaia 36,000 252,000 7.00

PROPERTY REPORT
20
to support assessed market values, we have to rely on our market knowledge, experience
and discussion with other local agents in the market.
The adjustments that have been made are based on the following criteria:
Adjustment for negotiation 10 – 30% based on local market facts (interviews
with brokers, local investors)
Location: negative or positive adjustments according to the location in the
studied area
Size and access: negative or positive adjustments according to the size, access,
facilities and shape of the each plot
It is usually reasonable to assume that the subject will sell for an amount similar to the
adjusted sale prices of the comparable properties or less than the adjusted list prices of
properties on the market or recently off the market.
The offers data were adjusted to reflect the differences between them and the subject
property. After adjustments were made, the data ranges from 2 to 5 EUR /sq m.
From this interval of prices we have chosen 4 EUR / sq m as a reference value for the
subject property and allocated this value to Field 16 and Field 19 which are the closest
to the facilities and have better access.
A ranking analysis was used to differentiate the subject fields’ values for specific elements
of comparison such as access and distance to facilities. The technique can be used to
test the specific elements of comparison for their market sensitivities. The subject fields
were ranked according to overall comparability with Field 16 and Field 19.
After making the adjustments, the value for the subject property is as follows:
Field 16, Field 19 – €4/ sq. m;
Field 20, Field 21 and Field 22 - €3/ sq. m;
Field 12, Field 32 - €2.5/ sq. m.
FIELD NO. AREA (SQ M)
UNITARY VALUE
(EUR/ SQ M) VALUE (EUR)
FIELD 16 10,650 4 42,600
FIELD 19 115,300 4 461,200
FIELD 20 26,000 3 78,000
FIELD 21 82,800 3 248,400
FIELD 22 11,000 3 33,000
FIELD 12 198,800 2.5 497,000
FIELD 32 46,400 2.5 116,000
Total land 490,950 1,476,200

PROPERTY REPORT
21
OPINION OF VALUE
Fair Value
Given the purpose of the valuation and considering the data available and the inherent
characteristics of the property as well we consider that the fair value of the subject
property as at 31st
of December 2014 is:
€1,476,000 (ONE MILLION FOUR HUNDRED SEVENTY THOUSANDS EUR),
exclusive of VAT
Our opinions of values are based upon the Scope of Work and Valuation Assumptions &
Considerations included in the present report.

LOCATION PLANS
22
A
LOCATION PLANS

LOCATION PLANS
23
LOCATION PLANS
MARKET REPORTS
24
4
MARKET REPORTS
MARKET REPORTS
25
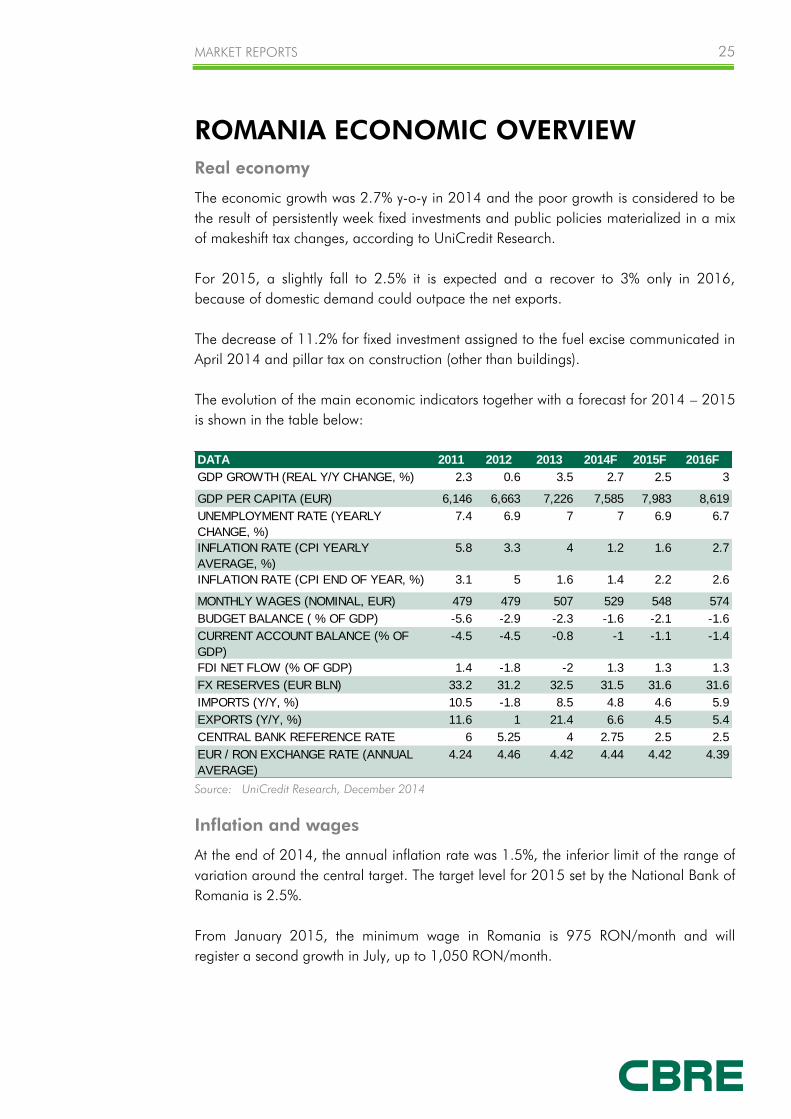
ROMANIA ECONOMIC OVERVIEW
Real economy
The economic growth was 2.7% y-o-y in 2014 and the poor growth is considered to be
the result of persistently week fixed investments and public policies materialized in a mix
of makeshift tax changes, according to UniCredit Research.
For 2015, a slightly fall to 2.5% it is expected and a recover to 3% only in 2016,
because of domestic demand could outpace the net exports.
The decrease of 11.2% for fixed investment assigned to the fuel excise communicated in
April 2014 and pillar tax on construction (other than buildings).
The evolution of the main economic indicators together with a forecast for 2014 – 2015
is shown in the table below:
Source: UniCredit Research, December 2014
Inflation and wages
At the end of 2014, the annual inflation rate was 1.5%, the inferior limit of the range of
variation around the central target. The target level for 2015 set by the National Bank of
Romania is 2.5%.
From January 2015, the minimum wage in Romania is 975 RON/month and will
register a second growth in July, up to 1,050 RON/month.
DATA 2011 2012 2013 2014F 2015F 2016F
GDP GROWTH (REAL Y/Y CHANGE, %) 2.3 0.6 3.5 2.7 2.5 3
GDP PER CAPITA (EUR) 6,146 6,663 7,226 7,585 7,983 8,619
UNEMPLOYMENT RATE (YEARLY
CHANGE, %)
7.4 6.9 7 7 6.9 6.7
INFLATION RATE (CPI YEARLY
AVERAGE, %)
5.8 3.3 4 1.2 1.6 2.7
INFLATION RATE (CPI END OF YEAR, %) 3.1 5 1.6 1.4 2.2 2.6
MONTHLY WAGES (NOMINAL, EUR) 479 479 507 529 548 574
BUDGET BALANCE ( % OF GDP) -5.6 -2.9 -2.3 -1.6 -2.1 -1.6
CURRENT ACCOUNT BALANCE (% OF
GDP)
-4.5 -4.5 -0.8 -1 -1.1 -1.4
FDI NET FLOW (% OF GDP) 1.4 -1.8 -2 1.3 1.3 1.3
FX RESERVES (EUR BLN) 33.2 31.2 32.5 31.5 31.6 31.6
IMPORTS (Y/Y, %) 10.5 -1.8 8.5 4.8 4.6 5.9
EXPORTS (Y/Y, %) 11.6 1 21.4 6.6 4.5 5.4
CENTRAL BANK REFERENCE RATE 6 5.25 4 2.75 2.5 2.5
EUR / RON EXCHANGE RATE (ANNUAL
AVERAGE)
4.24 4.46 4.42 4.44 4.42 4.39

MARKET REPORTS
26
The gross average national wage in August 2014 was 2,331 RON/ month (equiv. of
525 EUR), slightly higher than the similar period of 2013. The highest average values
were registered in air transport industry as 5,277 RON/ month (equiv. of 1,188 EUR)
and the lowest values in hotel and restaurants industry as 1,366 RON/month (equiv. of
308 EUR).
With 3,240 RON/ month (729 EUR), the average salary in Bucharest is approx. 38%
higher than the national average.
Foreign investment
Foreign Direct Investments in the first half of year 2014 were EUR 1.2 billion. The level
for this year was slightly lower than in the precedent year, but considerably higher than in
2012. FDI level in 2013 registered the highest level of the last 4 years – EUR 2.7 billion,
with an increase of 26.8%.
The highest level was registered in 2008, when EUR 9.5 billion were attracted in the
Romanian economy. The construction and real estate sectors accounted for approx.
13% out of the total level of 2008.
Foreign Direct Investments Romania, 2007 – 2014* estimated
Source: CBRE based on National Bank of Romania
Remittances
For many years, money transfers from Romanians working abroad have been a lifeline
for the economy, with an important impact on the real estate market as well. The highest
level of remittances of EUR 6.51 billion was registered in 2008, whilst 2013 witnessed
the lowest level in the last 8 years of EUR 3.0 billion (EUR 3.7 billion in 2012).

MARKET REPORTS
27
Remittances, 2005 - 2014
Source: CBRE based on National Bank of Romania
National Bank of Romania ('NBR') Interest Rate
The monetary policy interest rate is the interest rate on NBR’s main open-market
operations. The interest rates on the NBR's standing facilities, i.e. the deposit facility and
the lending facility, were set at +/- 4 percentage points around the monetary policy rate
as from 7 May 2008.
As of beginning of 2014, the monetary policy interest rate was decreased 5 times from
3.75% in January to 2.75% in November.
Romania National Bank’s monetary policy interest rate, 2007 – December
2014
Source: CBRE based on National Bank of Romania 2015

MARKET REPORTS
28
Exchange rate
Romanian currency was in December 2014 RON 4.45/ 1 EUR, at a slightly lower level
as of beginning of the year (RON 4.5219/ 1 EUR).
During the last 2 years there were 2 peak levels: RON 4.64/ EUR 1 in August 2012
and RON 4.55/ EUR 1 in June 2013.

MARKET REPORTS
29
LOCAL ECONOMY- BUCHAREST
Demographic Data
Bucharest is the capital and political, economic and cultural centre of the country, with a
population of 1,883,425 according to the latest population census, as of October
2011. The capital is by far the highest populated city in Romania, with about 9% of
entire country’s population:
The population/ city and population/ county in Romania
Source: CBRE based on National Institute of Statistics
The number of people living in Bucharest is expected to grow in the coming years,
despite the general decreasing trend registered over the past 10 years both across the
country and across Bucharest. Several factors determine the increase of population as
the city gathers more than half of the foreign investments in Romania and the average
net salary is the highest thus attracts skilled labour force from across the country, no
taking into account the foreigners that are employed by the multinational corporations
with branches in Bucharest.
Population Composition
The population in Bucharest according to age groups, comparative for Bucharest/Ilfov
county and overall Romania is structured as follows:
CITYPOPULATION /
CITY
RANKING
PER CITYCOUNTY
POPULATION /
COUNTY
RANKING
PER COUNTY
Bucharest 1,883,425 1 Bucharest 1,883,425 1
Cluj Napoca 324,576 2 Iasi 772,348 2
Timisoara 319,279 3 Prahova 762,886 3
Iasi 290,422 4 Cluj 691,106 4
Constanta 283,872 5 Constanta 684,082 5

MARKET REPORTS
30
Structure of Population by age groups
Source: CBRE based on National Institute of Statistics
As seen above, the younger population in Bucharest (aged under 20 years old) is
smaller, percentagewise) as compared with Ilfov and overall Romania (16% vs. approx.
22%). As a consequence, the population aged 20 – 64 (which contributes significantly to
the GDP) is more consistent in Bucharest (69% vs. 65% for Ilfov and 62.5% for
Romania). The older population (of over 65 years old) is the most numerous in overall
Romania (approx.16%) while in Bucharest is 14.4% and Ilfov County the percentage is
approx. 13%.
Income
In August 2014, with gross 3,240 RON/ month (729 EUR), the average salary in
Bucharest is approx. 38% higher than the national average.
Comparison Wages Bucharest/Romania EUR
Source: CBRE based on National Institute of Statistics, 2014

MARKET REPORTS
31
However, it is widely believed that real earnings all over Romania are around 30%
higher than the declared ones, as people supplement their income with shadow market
activities or just do not declare their full earnings. Taking this into consideration the
monthly net income for a person in Bucharest could be nearer to EUR 680.
Gross Domestic Product
Bucharest is the centre of the Romanian economy and industrial output, accounting for
approximately 23% of the country's GDP and about one-quarter of Romania’s industrial
production, although it is only inhabited by 9% of the nation’s population.
Additionally, Bucharest’s citizens and companies pay almost one third of national taxes.
The GDP/capita in Bucharest was of approx. EUR 14,772/capita in 2012 and in 2013 it
is estimated to reach EUR 15,636/ capita.
GDP/Capita in Bucharest EUR
Source: CBRE based on National Commission for Prognosis 2014
Employment
In Bucharest, the total number of employees was of 895,196 persons in August 2014.
More than three quarters of Bucharest’s workforce activates in the services sector (78%),
while the industry and construction represent 21% of the total number of employees in
Bucharest. The agriculture and other services account for less than 1% of the total
workforce population.
According to the National Institute of Statistics, the unemployment rate in Bucharest
(related to the total active population) was relatively constant since June 2011 until June
2014 to 2.0% - 2.1%. This level is approx. 2.3 times lower than the national average of
4.9% (as of June 2014). The only county with lower unemployment rate is Ilfov County
(1.5%), but the majority of the population living in this county is working in Bucharest.
0
5,000
10,000
15,000
20,000
25,000
2008 2009 2010 2011 2012 2013*2014*2015*2016*2017*
EU
R/
capi
ta

MARKET REPORTS
32
Evolution Unemployment Rate Bucharest – Romania – Ilfov County
Source: CBRE based on National Institute of Statistics, 2014

MARKET REPORTS
33
INVESTMENT MARKET COMMENTARY
General Overview
The investment volume in Romania in H1 2014 rose by 222% compared to H1 2013,
reaching approx. EUR 402.4 million. This represents the highest volume per half year
since H1 2008.
H1 2014 H2 2013
CEE Investment Volume (EUR bln) 3,723 5,024
Romania Total Investment Volume (EUR mln) 402.4 217.9
No Transactions 15 8
Average Transactions Size (EUR mln) 27 27
Positive macroeconomic forecast place GDP growth at around 3% for 2014 and 3.2%
for 2015. Excluding Russia, CEE investment volume on the rise versus H1 2013,
reaching a total of EUR 2.56 billion, with Poland, Czech Republic generating the highest
investment volume.
Profile of transactions was quite diverse in terms of sector (office segment leading with
58% of total volume), in terms of type of properties (prime properties generating 55% of
total volume), in terms of buyer typology (developers and institutional funds the most
active, out of which Globalworth generating 54% of volume).
Land transactions are on the rise in terms of number, volume value and type of
properties. Three major types of buyers active in the market: retailers, industrial/
production occupiers and office developers.
On the back of increased investors’ interest, prime yield for office segment compressed
at 8%. Other yields stable. In terms of prime rent, the evolution is relatively stable: EUR
60/sq m/mth - shopping centre, EUR 18/sq m/mth - office and EUR 3.8 /sq m/mth-
industrial.
MARKET REPORTS
34
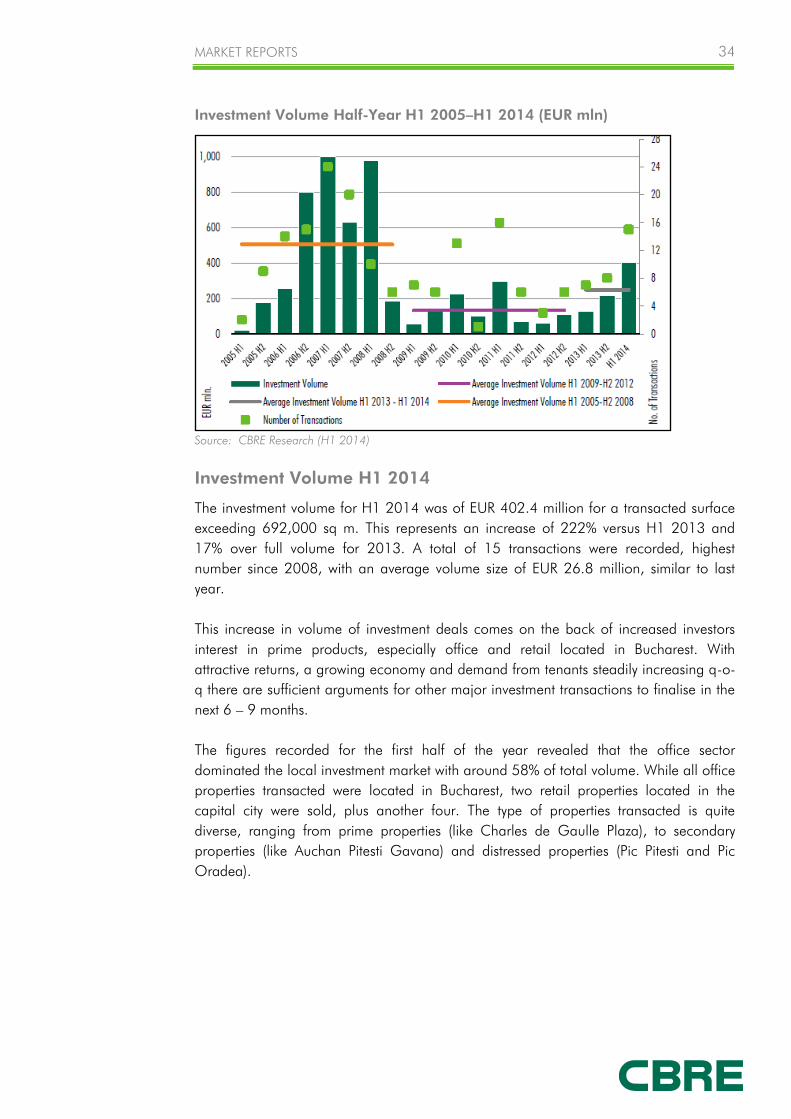
Investment Volume Half-Year H1 2005–H1 2014 (EUR mln)
Source: CBRE Research (H1 2014)
Investment Volume H1 2014
The investment volume for H1 2014 was of EUR 402.4 million for a transacted surface
exceeding 692,000 sq m. This represents an increase of 222% versus H1 2013 and
17% over full volume for 2013. A total of 15 transactions were recorded, highest
number since 2008, with an average volume size of EUR 26.8 million, similar to last
year.
This increase in volume of investment deals comes on the back of increased investors
interest in prime products, especially office and retail located in Bucharest. With
attractive returns, a growing economy and demand from tenants steadily increasing q-o-
q there are sufficient arguments for other major investment transactions to finalise in the
next 6 – 9 months.
The figures recorded for the first half of the year revealed that the office sector
dominated the local investment market with around 58% of total volume. While all office
properties transacted were located in Bucharest, two retail properties located in the
capital city were sold, plus another four. The type of properties transacted is quite
diverse, ranging from prime properties (like Charles de Gaulle Plaza), to secondary
properties (like Auchan Pitesti Gavana) and distressed properties (Pic Pitesti and Pic
Oradea).

MARKET REPORTS
35
Profile of transacted properties by value (EUR)
Source: CBRE Research (H1 2014)
First half of 2014 registered a quite diverse range of properties transacted - from retail
(6 properties - total value EUR 56.6 mln), to industrial (1 property - total value EUR 12
mln), residential (2 properties - total value EUR 101.7 mln) and office (6 properties -
total value EUR 232.1 mln).
Investment transactions in H1 2014
Source: CBRE Research, official press releases (H1 2014)
In terms of profile of buyers - again their profile is quite diverse, ranging local
companies (generating 17% of total investment volume), to developers (like Immochan
or Globalworth) and institutional funds. While 2013 was dominated by transactions
closed by NEPI, in H1 2014 the dominance comes from Globalworth with 54% of total
investment volume.

MARKET REPORTS
36
Romania Investment Volume H1 2010 – H1 2014 (EUR mln)
Source: CBRE Research (H1 2014)
CEE Investment & Yields
In H1 2014 total commercial real-estate investment volume in CEE region, excluding
Russia, reached EUR 2.56 billion, an increase by 15% compared to volumes of last year.
Including Russia, the investment volume reached a decrease, on the back of a
substantial 60% fall in investment flows in Russia.
Poland and Czech Republic account for the majority of the investment turnover in the
region, with Poland attracting a strong interest from investors, while Czech Republic
registered an increase of 36% y-o-y. Some of the most important H1 transactions in the
region: sale of Rondo 1, office skyscraper in Warsaw, Poland , worth EUR 300 million,
Poznan City Center, a recently opened 58,000 sq m shopping center in Poznan, Poland,
or Allee shopping center in Budapest, Hungary, previously owned by ING Real Estate.
On the back of investors interest for prime office projects in Bucharest, prime yield for
this sector compressed to 8% with potential future compression in the next 6 months, if
current pending transactions are to be finalised. Other segments yields are stable, with
potential for compression for both retail and industrial segment by the end of the year.

MARKET REPORTS
37
Prime Yields CEE Region Q2 2014
Source: CBRE Research (Q2 2014)
Land Market
Comparable with commercial real-estate investment transactions, number and volume of
land transactions are on the rise. We have recorded 15 major land transactions, in all
parts of Romania for a total cumulated surface of 630,000 sq m.
We have identified three major categories of buyers of land properties: retailers (mainly
Lidl, Dedeman, Kaufland, Leroy Merlin) looking to buy properties in prime and
secondary cities, industrial occupiers interested in plots of land for the development of
factories (Dr. Oetker, Best Food, Continental) and real-estate developers securing prime
properties in major cities for future landmark developments (NEPI, Globalworth and
Kiseleff Development). Timisoara was a “hot” area for land transactions, with 47% of the
total transacted surface in H1 2014 concluded here, followed by Bucharest, Brasov and
a number of tertiary cities, interesting mostly for future industrial developments.
Pricing for land properties continues to vary depending of future use, location &
accessibility, availability in the area. Having said this, prime properties located in
Bucharest or in prime cities in Romania, suitable for retail or office development can be
transacted at prices between EUR 200 - 500 / sq m, with very special properties fetching
prices in excess of EUR 500 / sq m.
Outlook
Better than initially forecasted macroeconomic indicators provide a positive and
encouraging environment for completion of capital markets deals.
Several important investment transactions for office segment are expected to be
completed in the next 6 - 9 months, on the back of increased investors’ interest for
outstanding quality properties located in Bucharest.
Following this consistent interest from investors, prime yield compressed to 8% with
further potential for compression to 7.5% - 7.75%.

MARKET REPORTS
38
While land transactions continue to be a market dominated by distressed sales, there is
a revived interest from developers and retailers for prime properties, priced within the
market parameters. We expect the number of such transactions to grow in the next
quarters.