
Mercer Capital | Valuation Insight | Capital Structure in 30 Minutes

www.icai.orgFebruary/2019/Revised
The Institute of Chartered Accountants of India(Set up by an Act of Parliament)
New Delhi
ISBN : 978-81-8441-000-0
Valu
ation : P
rofessionals' In
sight
Valuation : Professionals' Insight
Valuation Standards Board ICAIand
ICAI Registered Valuers Organisation
Series-2

Valuation: Professionals Insight
Series -2
Valuation Standards Board
ICAI Registered Valuers Organisation The Institute of Chartered Accountants of India
(Set up by an Act of Parliament) New Delhi

© The Institute of Chartered Accountants of India
All rights reserved. No part of this publication may be reproduced, stored in a retrieval system, or transmitted, in any form, or by any means, electronic mechanical, photocopying, recording, or otherwise, without prior permission, in writing, from the publisher.
Disclaimer: The views and opinions expressed in this article are those of the author and based on his experience and not necessarily those of the Institute or any other regulatory body. Examples of analysis performed, methodologies and approaches described within these articles are only examples which have been truncated with a lot of specifics omitted for brevity of these articles. They should and must not be utilized ‘as-is’ in the real-world without having sufficient guidance or experience or otherwise consulting a professional valuer.
First Edition : February 2019 Committee/Department : Valuation Standards Board E-mail : [email protected] Website : www.icai.org Price : 150` /- ISBN No : 978-81-8441- Published by : The Publication Department on behalf of the
Institute of Chartered Accountants of India. ICAI Bhawan, Post Box No. 7100, Indraprastha Marg, New Delhi – 110 002, India.
Printed by : Sahitya Bhawan Publications, Hospital Road,
Agra 282 003 Feb/2019/1,000

Message
Valuation as a profession was required to be disciplined for bringing in
uniformity in the practices and procedures followed by Valuation
professionals.
In this direction, the Government of India has come out with a legal
framework for this niche area of practice.
Also, the Institute of Chartered Accountants of India through Valuation
Standards Board has issued Valuation Standards which are first of its kind in
India for financial valuation, the same Valuation Standards have also been
adopted by ICAI Registered Valuers Organisation.
In addition to the various joint initiatives of Valuation Standards Board with
ICAI RVO, the ICAI RVO is facilitating the members in enrolling the members
as Registered valuers. ICAI RVO has planned to associate with industry
chambers for organising training/ workshops in India, to train and develop the
Valuers on a continuous basis.
I am very happy that the Valuation Standards Board of ICAI and ICAI
Registered Valuers Organisation (ICAI RVO) have taken the joint initiative
and are bringing this Second Series of publication on ‘Valuation:
Professionals’ Insight’ to help the professionals in understanding various
aspects of business valuation from the perspective of other professionals.
I would like to thank the Institute of Chartered Accountants of India for all the
joint initiatives with ICAI RVO. My appreciation to Valuation Standards Board
(VSB) of ICAI under the Chairmanship of CA. M. P. VijaKumar and to the
members of the Board of ICAI RVO, Shri I. Y. R Krishna Rao, Shri Samir
Kumar Barua, Shri Ashok Haldia and Shri biswamohan Mahapatra for this
joint endeavour. I would sincerely thank CA. Naveen N. D. Gupta, CA.
Prafulla P. Chhajed, CA. Nilesh S. Vikamsey and CA. Dhinal A. Shah – the
Directors of ICAI RVO, for their guidance and support in this initiative.
I would like to appreciate the efforts put in by CA. Sarika Singhal, Secretary Valuation Standards Board who is involved in compiling and contributing the articles.
I am sure that this publication would be of great help to the valuers and other stakeholders.
Justice Anil R. Dave (Retd.) Chairman,
ICAI Registered Valuers Organisation
Date: 10th January, 2019
Place: New Delhi
Foreword With the notification of Section 247 of the Companies Act, 2013 and the Companies (Registered Valuers and Valuation) Rules, 2017, the valuation profession in India is also being regulated and disciplined like other professions through a Regulatory framework. This profession got statutory status in October, 2017 for the valuations related to the Companies Act, 2013 and the Insolvency and Bankruptcy Code, 2016.
Before this regulatory framework put in place, Valuation practices were not uniform and there were varied perspectives of the valuers, regulators and other stakeholders with regard to valuation. Nevertheless, the important aspects of valuation i.e. trust and confidence of people on valuation remains the same. Valuation is the most fundamental term during a financing round but is crucial to understand while deriving the value. In this direction, it becomes important to understand the various viewpoints on valuation to make a considered view.
I compliment the Valuation Standards Board and ICAI Registered Valuers Organisation in taking this joint initiative of bringing out this Second Series of the publication titled- ‘Valuation: Professionals’ Insight’ containing the views/ opinion/ in the form of Articles from valuation professionals.
I extend my appreciation to the entire Valuation Standards Board and especially to CA. M. P. Vijay Kumar, Chairman Valuation Standards Board and CA. Dhinal A. Shah Vice-Chairman, Valuation Standards Board to bring this publication in the form of a Series.
I am sure that this Series of the publication also would be immensely helpful for the members and other interested readers.
CA. Naveen N.D. Gupta President ICAI
Director ICAI RVO
Date: 10th January, 2019
Place: New Delhi

Preface The Valuation Standards Board of the Institute of Chartered Accountants of India has issued ICAI Valuation Standards 2018. These ICAI Valuation Standards have been made applicable by ICAI for all valuation engagements on mandatory basis under the Companies Act 2013 for members. In respect of Valuation engagements under other Statutes like Income Tax, SEBI, FEMA etc, it will be on recommendatory basis for the members of the Institute. These Valuation Standards are effective for the valuation reports issued on or after 1st July, 2018.
ICAI has formulated Valuation Standards on the basis of detailed study of global practices followed and are in line with/ comparable to the International Valuation Standards in terms of Valuation Premises, Valuation Bases, Valuation Approaches and Methodologies, Considerations for arriving at a value, Factors to be considered while arriving at a value, Format of Valuation Report and Contents of Valuation Report etc.
ICAI Valuation Standards are at par with the international practices and have been formulated as per the applicable laws, customs, usages and business environment prevailing in India and Judgements taken pertaining to Valuation. They deal with India’s special needs and conditions arising from the India’s economic, social and legal environment.
Though the compliance with the Valuation Standards are recommendatory for chartered accountants who are not enrolled with ICAI Registered Valuers Organisation for Valuation under any Statute except under the Companies Act 2013. We encourage the members to follow the Valuation Standards 2018 so as to adopt uniform and best practices.
As part of its continuous endeavor towards enrichment of knowledge, the Valuation Standards Board jointly with ICAI Registered Valuers Organisation has decided to bring out Second Series of the publication titled “Valuation: Professionals’ Insights” covering some practical insights on valuation, to share these insights to valuers’ and users of valuation reports.
This publication is a compilation of diverse valuation topics authored by leaders in the profession. Its purpose is to advance knowledge and understanding of the professional practices.
We may mention that the views expressed in this publication are the views of the authors and are not the views of the Institute. The purpose of this
publication is to provide an overview of the valuation involved in mergers, amalgamation, options, business, case studies by compiling articles.
We wish to express our sincere thanks to President of ICAI and Director ICAI RVO CA. Naveen N. D. Gupta and Vice President, CA. Prafulla P Chajjed for their guidance and support to the activities of the Board.
We express our sincere gratitude towards the Board of ICAI RVO comprising of Hon’ ble Mr. Justice Anil R. Dave (Retd.), Chairman of the Board and other Directors, Shri I.Y.R Krishna Rao, Shri Biswamohan Mahapatra, Shri Ashok Haldia, CA. Nilesh S. Vikamsey, Immediate Past President, ICAI for joining in this endeavour.
We wish to place on record, the appreciation to all Members of the Board, Co-opted members and Special Invitees for their support and guidance in bringing out this publication.
We would also like to thank CA. V Pattabhi Ram, CA. Srinivas Reddy, S. Ramakrishnan, Shri Sachin Shirol, CA Rajan Wadhawan, CA. T. V. Balasubramanian, CA Siddharth Banwat, CA Kush Vatsaraj, CA. Manoj Sharma, CA. Devarajan Krishnan, CA. Parag Kulkarni, CA. Abraham Mathews, CA. Dipam A. Patel, CA. S Srikanth, CA. Aparna Khatri, CA. M.
CA. Yogesh Sundaram, CA. Amrish Garg, CA. Rajalakshmi Sriram, CA. Gandharv Jain, CA. Chander Sawhney, CA Shruthi Sathyanarayanan, and CA. Manish Baxi who have contributed articles.
We sincerely appreciate CA. Sarika Singhal, Secretary Valuation Standards Board for contributing articles and providing the technical and administrative support.
We are sure that this Second Series of the publication would be warmly received by the members and they would find it immensely useful in improving quality of their valuation assignment.
CA. M. P. Vijay Kumar CA. Dhinal A. Shah Chairman Vice Chairman Valuation Standards Board, ICAI Valuation Standards Board, ICAI
Date: 10th January, 2019
Place: New Delhi

Contents
1. Rising Domain of Valuation and Emerging Professional
Opportunities for Indian CAs................................................................. 1
2. Distinguishing Features of ICAI Valuation Standards 2018 ...................15
3. Valuation – Some Basics Relating to Cash Flow and Discount Rate .....22
4. Levels of Value ...................................................................................32
5. Effect of Due Diligence on Valuation – A Practical Perspective.............44
6. Terminal Value – The Elephant in the Valuation ...................................48
7. Discount Cash Flow Method – Key Considerations ..............................51
8. Valuations under the Discounted Cash Flows Approach .......................55
9. Handling Negative Working Capital in the DCF Model ..........................61
10. Cash Flow Projections – How important it is for Valuation through DCF? .....................................................................................66
11. IND AS 113 – Fair Value Measurement ...............................................70
12. Factors of Valuation ............................................................................75
13. Valuation under various Laws ..............................................................86
14. Regulatory Valuations in India and Professional Opportunities .............93
15. Bias in Valuation ............................................................................... 102
16. Start-Up Valuation ............................................................................. 107
17. Start-ups & Valuation ........................................................................ 114
18. Valuation of Fixed Income Securities ................................................. 123
19. Valuation of Financial Guarantees – Increasing Complexities under IND AS 109 Decoded .............................................................. 130
20. ESOP as a Share Based Transaction ................................................ 139
21. Valuation of Options .......................................................................... 145
22. Purchase Price Allocation .................................................................. 153
23. Drug Dealings of 2018 – An Overview ............................................... 159
Bibliography ...................................................................................... 168

Chapter 1
Rising Domain of Valuation and Emerging Professional
Opportunities for Indian CAs
With the introduction and subsequent adoption of Ind AS by many Indian companies, the emphasis on valuation has increased. Valuation field is gaining importance now and is considered as one of the most critical areas in finance. It plays a key role in many areas of finance such as buy/sell, solvency and merger and acquisition. It also plays an important role in the Insolvency Resolution regime where Liquidation value has to be ascertained by Resolution professional through the Registered Valuers. Further, the concept of registered valuers has been institutionalised by including a separate chapter on Registered Valuers leading to the formalisation and regulation of the Registered valuers under the Companies Act, 2013. The Rules notified by Ministry of Corporate Affairs (MCA) have also opened a new domain for professionals called Registered Valuers. It offers a host of opportunities to the existing professionals including Chartered Accountants, Company Secretaries, Cost Accountants and MBA/ PGDBM in finance. Read on to know more…
The Ministry of Corporate Affairs (MCA) has notified Section 247 of the Act and Companies (Registered valuers and valuation) Rules, 2017 as on 18th October, 2017.
Section 247 of the Companies Act, provides that where a valuation is required to be made in respect of any property, stocks, shares, debentures, securities or goodwill or any other assets (herein referred to as the assets) or net worth of a company or its liabilities under the provision of this Act, it shall be valued by a person having such qualifications and experience and registered as a valuer in such manner, on such terms and conditions as may be prescribed and appointed by the audit committee or in its absence by the Board of Directors of that company.
Valuation Professionals Insight
2
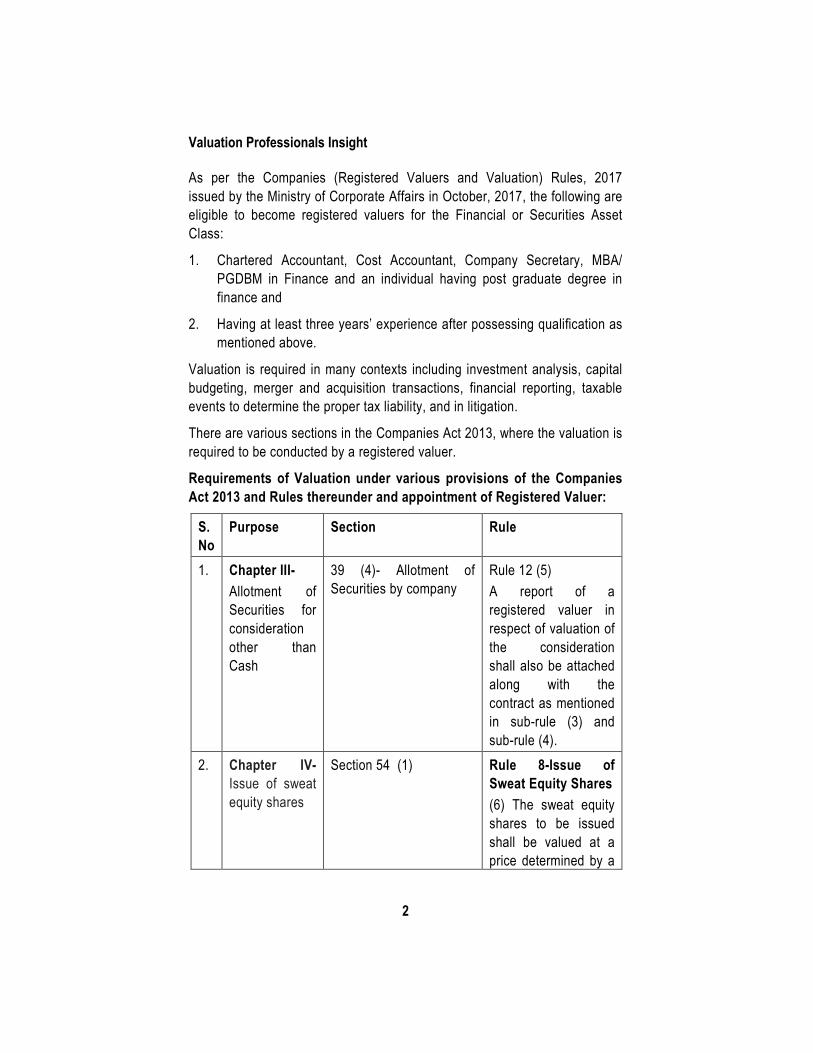
As per the Companies (Registered Valuers and Valuation) Rules, 2017 issued by the Ministry of Corporate Affairs in October, 2017, the following are eligible to become registered valuers for the Financial or Securities Asset Class:
1. Chartered Accountant, Cost Accountant, Company Secretary, MBA/ PGDBM in Finance and an individual having post graduate degree in finance and
2. Having at least three years’ experience after possessing qualification as mentioned above.
Valuation is required in many contexts including investment analysis, capital budgeting, merger and acquisition transactions, financial reporting, taxable events to determine the proper tax liability, and in litigation.
There are various sections in the Companies Act 2013, where the valuation is required to be conducted by a registered valuer.
Requirements of Valuation under various provisions of the Companies Act 2013 and Rules thereunder and appointment of Registered Valuer:
S. No
Purpose Section Rule
1. Chapter III- Allotment of Securities for consideration other than Cash
39 (4)- Allotment of Securities by company
Rule 12 (5) A report of a registered valuer in respect of valuation of the consideration shall also be attached along with the contract as mentioned in sub-rule (3) and sub-rule (4).
2. Chapter IV- Issue of sweat equity shares
Section 54 (1) Rule 8-Issue of Sweat Equity Shares (6) The sweat equity shares to be issued shall be valued at a price determined by a
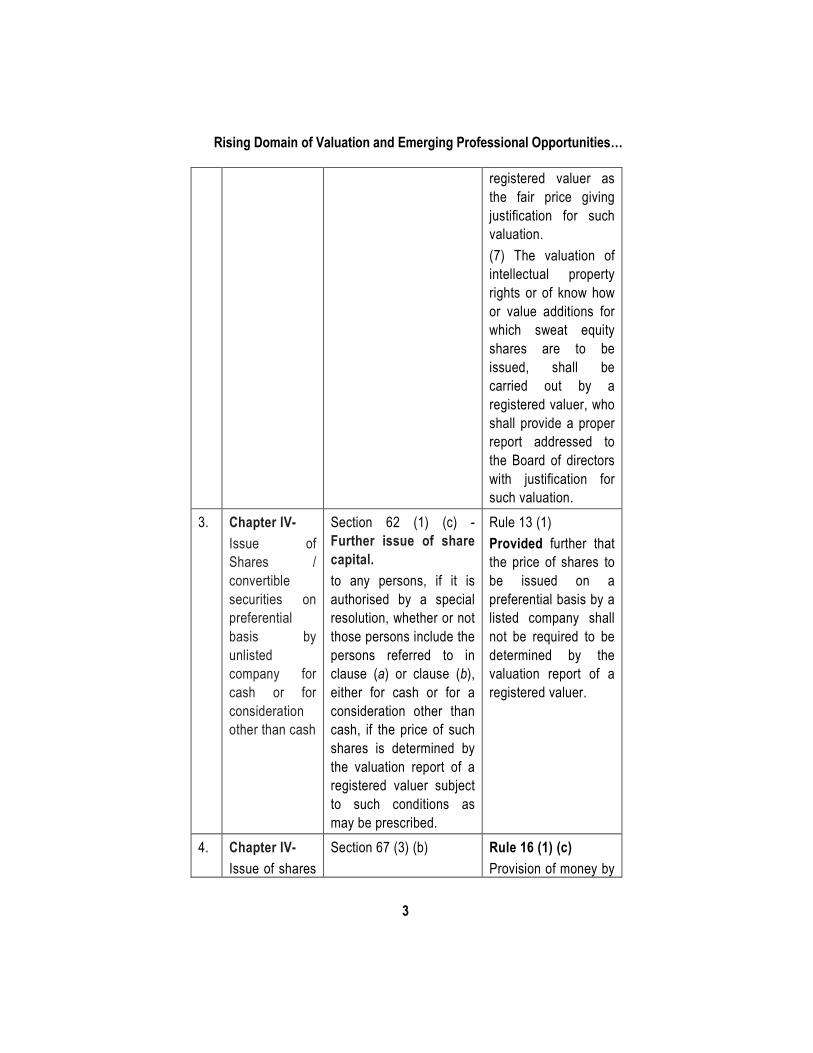
Rising Domain of Valuation and Emerging Professional Opportunities…
3
registered valuer as the fair price giving justification for such valuation. (7) The valuation of intellectual property rights or of know how or value additions for which sweat equity shares are to be issued, shall be carried out by a registered valuer, who shall provide a proper report addressed to the Board of directors with justification for such valuation.
3. Chapter IV- Issue of Shares / convertible securities on preferential basis by unlisted company for cash or for consideration other than cash
Section 62 (1) (c) - Further issue of share capital. to any persons, if it is authorised by a special resolution, whether or not those persons include the persons referred to in clause (a) or clause (b), either for cash or for a consideration other than cash, if the price of such shares is determined by the valuation report of a registered valuer subject to such conditions as may be prescribed.
Rule 13 (1) Provided further that the price of shares to be issued on a preferential basis by a listed company shall not be required to be determined by the valuation report of a registered valuer.
4. Chapter IV- Issue of shares
Section 67 (3) (b) Rule 16 (1) (c) Provision of money by
Valuation Professionals Insight
4
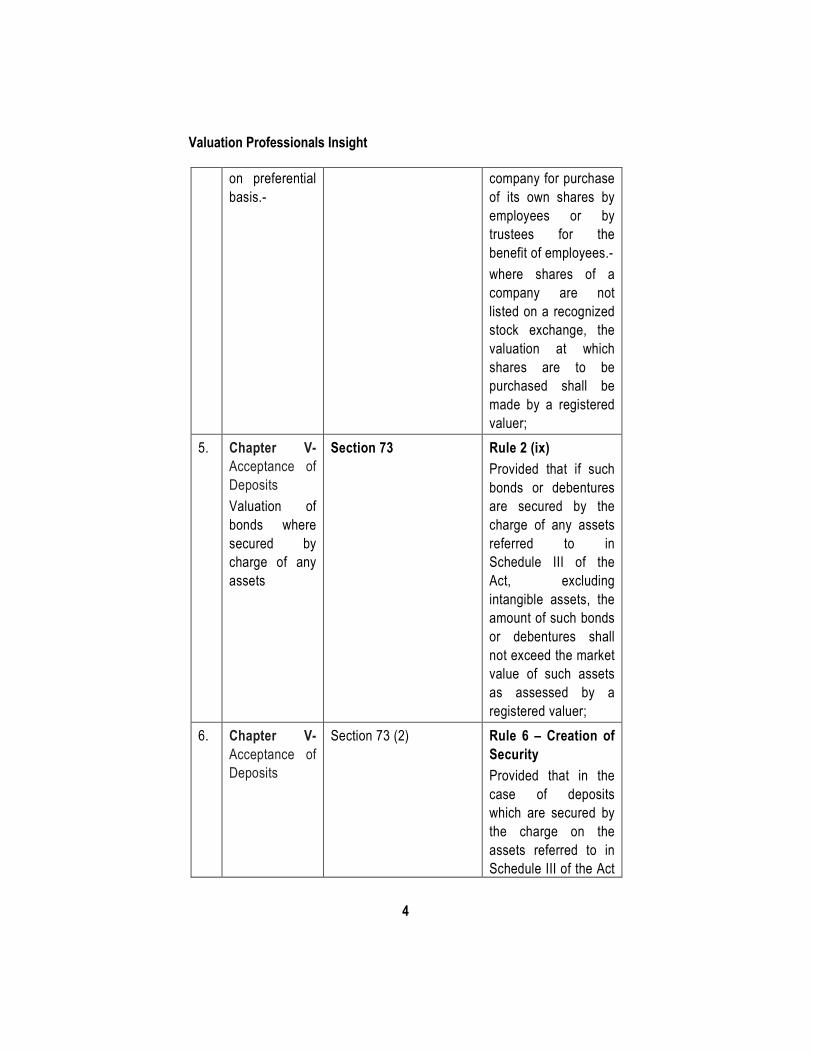
on preferential basis.-
company for purchase of its own shares by employees or by trustees for the benefit of employees.- where shares of a company are not listed on a recognized stock exchange, the valuation at which shares are to be purchased shall be made by a registered valuer;
5. Chapter V- Acceptance of Deposits Valuation of bonds where secured by charge of any assets
Section 73 Rule 2 (ix) Provided that if such bonds or debentures are secured by the charge of any assets referred to in Schedule III of the Act, excluding intangible assets, the amount of such bonds or debentures shall not exceed the market value of such assets as assessed by a registered valuer;
6. Chapter V- Acceptance of Deposits
Section 73 (2) Rule 6 – Creation of Security Provided that in the case of deposits which are secured by the charge on the assets referred to in Schedule III of the Act
Rising Domain of Valuation and Emerging Professional Opportunities…
5
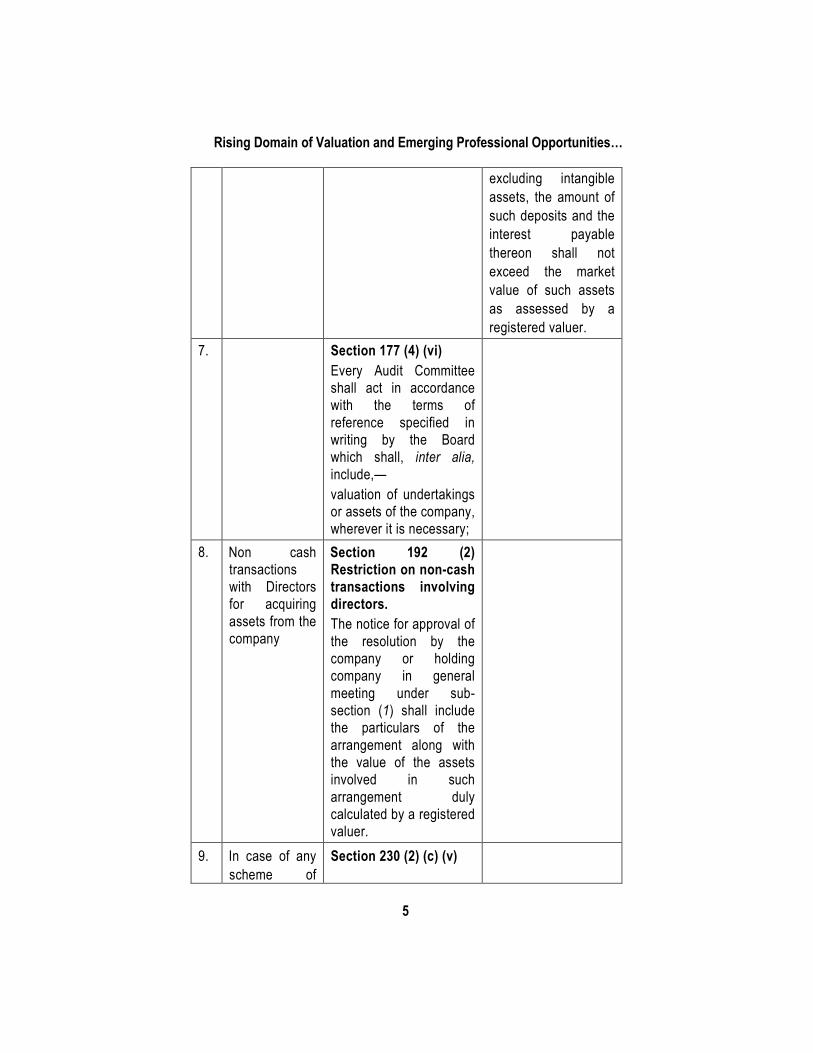
excluding intangible assets, the amount of such deposits and the interest payable thereon shall not exceed the market value of such assets as assessed by a registered valuer.
7. Section 177 (4) (vi) Every Audit Committee shall act in accordance with the terms of reference specified in writing by the Board which shall, inter alia, include,— valuation of undertakings or assets of the company, wherever it is necessary;
8. Non cash transactions with Directors for acquiring assets from the company
Section 192 (2) Restriction on non-cash transactions involving directors. The notice for approval of the resolution by the company or holding company in general meeting under sub-section (1) shall include the particulars of the arrangement along with the value of the assets involved in such arrangement duly calculated by a registered valuer.
9. In case of any scheme of
Section 230 (2) (c) (v)
Valuation Professionals Insight
6
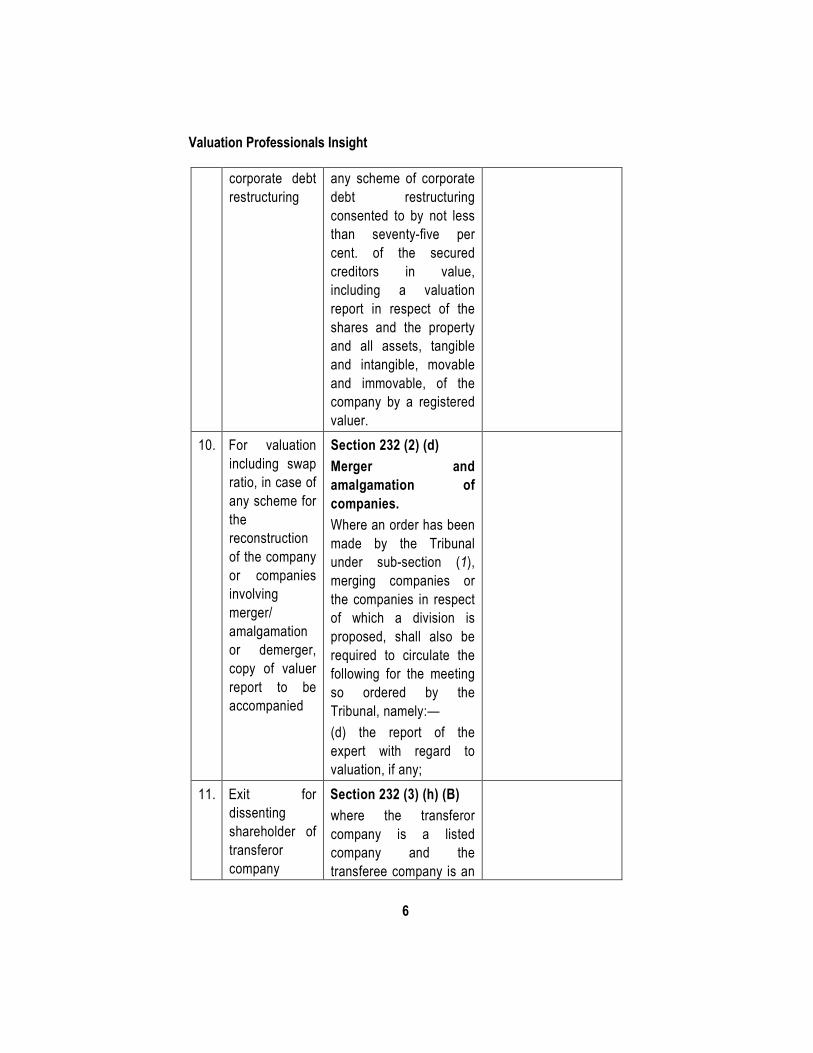
corporate debt restructuring
any scheme of corporate debt restructuring consented to by not less than seventy-five per cent. of the secured creditors in value, including a valuation report in respect of the shares and the property and all assets, tangible and intangible, movable and immovable, of the company by a registered valuer.
10. For valuation including swap ratio, in case of any scheme for the reconstruction of the company or companies involving merger/ amalgamation or demerger, copy of valuer report to be accompanied
Section 232 (2) (d) Merger and amalgamation of companies. Where an order has been made by the Tribunal under sub-section (1), merging companies or the companies in respect of which a division is proposed, shall also be required to circulate the following for the meeting so ordered by the Tribunal, namely:— (d) the report of the expert with regard to valuation, if any;
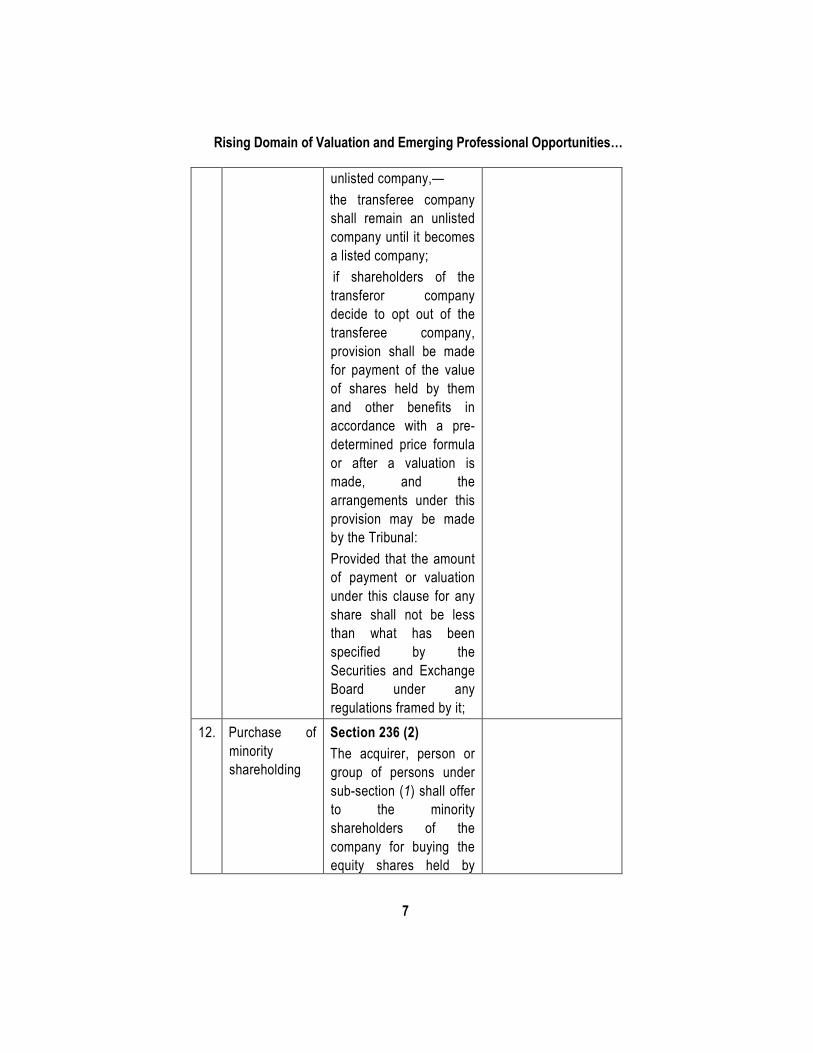
11. Exit for dissenting shareholder of transferor company
Section 232 (3) (h) (B) where the transferor company is a listed company and the transferee company is an
Rising Domain of Valuation and Emerging Professional Opportunities…
7
unlisted company,— the transferee company
shall remain an unlisted company until it becomes a listed company;
if shareholders of the transferor company decide to opt out of the transferee company, provision shall be made for payment of the value of shares held by them and other benefits in accordance with a pre-determined price formula or after a valuation is made, and the arrangements under this provision may be made by the Tribunal: Provided that the amount of payment or valuation under this clause for any share shall not be less than what has been specified by the Securities and Exchange Board under any regulations framed by it;
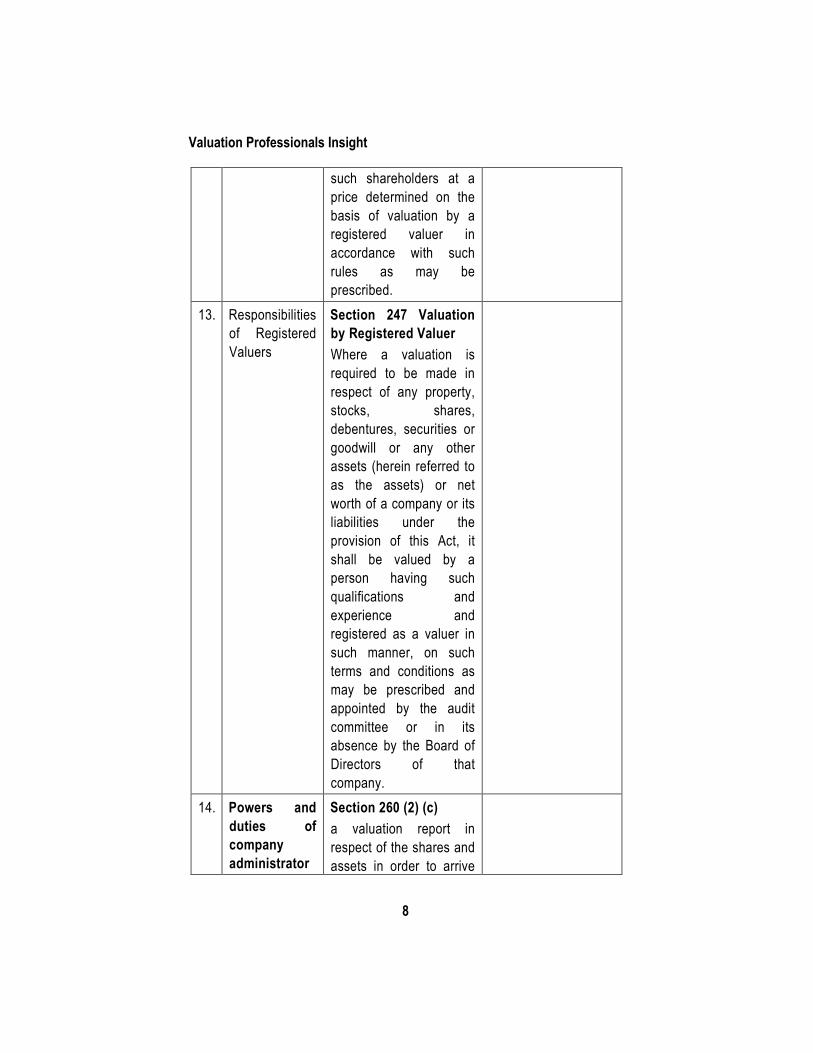
12. Purchase of minority shareholding
Section 236 (2) The acquirer, person or group of persons under sub-section (1) shall offer to the minority shareholders of the company for buying the equity shares held by
Valuation Professionals Insight
8
such shareholders at a price determined on the basis of valuation by a registered valuer in accordance with such rules as may be prescribed.
13. Responsibilities of Registered Valuers
Section 247 Valuation by Registered Valuer Where a valuation is required to be made in respect of any property, stocks, shares, debentures, securities or goodwill or any other assets (herein referred to as the assets) or net worth of a company or its liabilities under the provision of this Act, it shall be valued by a person having such qualifications and experience and registered as a valuer in such manner, on such terms and conditions as may be prescribed and appointed by the audit committee or in its absence by the Board of Directors of that company.
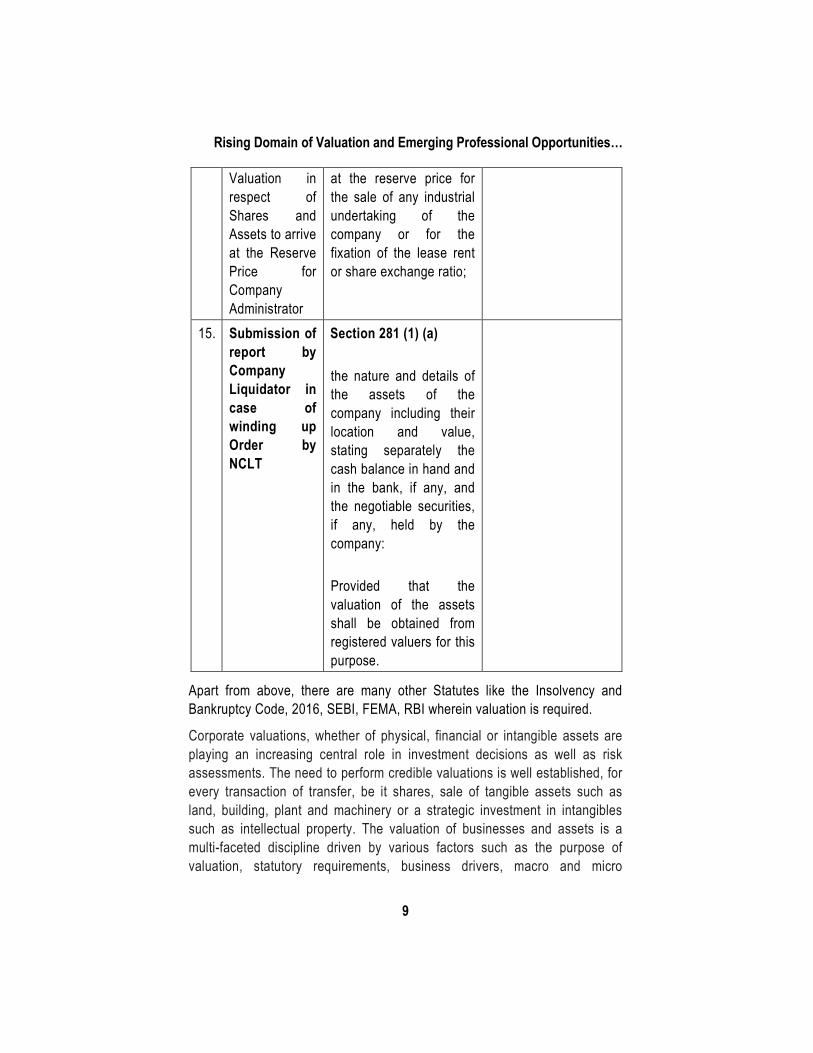
14. Powers and duties of company administrator
Section 260 (2) (c) a valuation report in respect of the shares and assets in order to arrive
Rising Domain of Valuation and Emerging Professional Opportunities…
9
Valuation in respect of Shares and Assets to arrive at the Reserve Price for Company Administrator
at the reserve price for the sale of any industrial undertaking of the company or for the fixation of the lease rent or share exchange ratio;
15. Submission of report by Company Liquidator in case of winding up Order by NCLT
Section 281 (1) (a) the nature and details of the assets of the company including their location and value, stating separately the cash balance in hand and in the bank, if any, and the negotiable securities, if any, held by the company:
Provided that the valuation of the assets shall be obtained from registered valuers for this purpose.
Apart from above, there are many other Statutes like the Insolvency and Bankruptcy Code, 2016, SEBI, FEMA, RBI wherein valuation is required.
Corporate valuations, whether of physical, financial or intangible assets are playing an increasing central role in investment decisions as well as risk assessments. The need to perform credible valuations is well established, for every transaction of transfer, be it shares, sale of tangible assets such as land, building, plant and machinery or a strategic investment in intangibles such as intellectual property. The valuation of businesses and assets is a multi-faceted discipline driven by various factors such as the purpose of valuation, statutory requirements, business drivers, macro and micro
Valuation Professionals Insight
10
economic environment, government policies as applicable to the asset being valued. Theoretically, there are established approaches for valuation. However, the application of the correct approach and principles is crucial in determining an accurate fair value.
Recognising the need to have the consistent, uniform and transparent valuation policies and harmonise the diverse practices in use in India, the Council of the Institute of Chartered Accountants of India (ICAI) has issued the ICAI Valuation Standards 2018 which are 1st of its kind in India.
The Valuation Standards that have been issued by ICAI will help the members in maintaining the consistency in issuing the Valuation reports. These Standards will also help in providing appropriate content and disclosures in the valuation report.
These standards come as ICAI’s consistent drive to guide its members for ensuring high quality work and standards.
The last few decades have witnessed amazing strides in the scope of our profession. We have seen a paradigm shift in the range of services rendered by chartered accountants. It has occurred due to widespread changes in the macro-economic scenario, regulatory and legal environment and prevalent industry practices. With the growing role of Companies Act, 2013, Insolvency and Bankruptcy Code, 2016, SEBI in controlling the financial market, the subject of Valuation has gained considerable importance.
Institutional Set Up under the Companies (Registered Valuers and Valuation) Rules, 2017 1. Authority, i.e., The Insolvency and Bankruptcy Board of India
2. Registered Valuers Organisation
3. Registered Valuers
ICAI Registered Valuers Organisation For this specific purpose, the Institute of Chartered Accountants of India has formed a Section 8 private company which has been recognized by the IBBI as a Registered Valuers Organisation (ICAI RVO) to enroll and regulate registered valuers or valuer member as its members in accordance with the Companies (Registered Valuers and Valuation) Rules, 2017, and functions
Rising Domain of Valuation and Emerging Professional Opportunities…
11
incidental thereto. ICAI RVO is registered for Securities or Financial Assets Class.
Some of the important Roles of ICAI RVO are as follows-
(a) ensure compliance with the Companies Act, 2013 and rules, regulations and guidelines issued thereunder governing the conduct of registered valuers organisation and registered valuers;
(b) employ fair, reasonable, just, and non-discriminatory practices for the enrolment and regulation of its members;
(c) be accountable to the authority in relation to all bye-laws and directions issued to its members;
(d) develop the profession of registered valuers;
(e) promote continuous professional development of its members;
(f) continuously improve upon its internal regulations and guidelines to ensure that high standards of professional and ethical conduct are maintained by its members; and
(g) provide information about its activities to the authority.
Rule 5 (1) of the Companies (Registered Valuers and Valuation) Rules, 2017 provides that the authority shall, either on its own or through a designated agency, conduct valuation examination for one or more asset classes, for individuals, who possess the qualifications and experience as specified in Rule 4, and have completed their educational courses as member of a Registered Valuers Organisation, to test their professional knowledge, skills, values and ethics in respect of valuation:
Rule 5 (2) provides that the authority shall determine the syllabus for various valuation specific subjects or assets classes for the valuation examination on the recommendation of one or more Committee of experts constituted by the authority in this regard.
IBBI has notified the syllabus and mandated a 50 hours training by the Registered Valuers Organisation which is a precondition to take examination to become Registered valuer.
Initiatives taken by ICAI RVO 1. 50 Hours Educational Course by ICAI Registered Valuers
Organisation which is a precondition to become Registered Valuer:
Valuation Professionals Insight
12
Registered Valuers Organisations have been given the mandate to conduct 50 hours educational course for its valuer members which is a precondition for IBBI Registered Valuers Organisation.
In this direction, from June, 2018 onwards, ICAI RVO has conducted the 50 hours training across the country and batches have been held at Delhi (2), Mumbai (2), Kolkata (2), Chennai, Bangalore, Ahmedabad (2), Jaipur, Gurugram, Coimbatore, Hyderabad, Salem, Ernakulam, Pune, Indore, Baroda.
The next batches are planned at Chandigarh, Chennai, Delhi, Mumbai, Ludhiana, Rohtak etc.
2. Valuer Members trained:
As on date around 1200 members have been trained by ICAI RVO at its Educational course of 50 hours.
3. Registration of Registered Valuers with IBBI for the Asset Class Securities or Financial Assets:
As on date 176 Registered Valuers have been registered by the Insolvency and Bankruptcy Board of India under the Asset Class Securities or Financial Assets. Out of which, 113 registered valuers (64%) are ICAI RVO members.
4. Study Modules for Educational Course by ICAI RVO:
Three Study Modules for Educational Course have been prepared to help the members in understanding the subject better
i. Module 1 covers in detail Overview and Concepts of Valuation
ii. Module 2 Covers in detail Valuation Approaches and Methods
iii. Module 3 covers- Judicial Pronouncements
5. Launch of ICAI RVO Learning Management System:
ICAI RVO has launched its Learning Management System which is an e-learning platform which delivers the concepts of the syllabus prescribed by the Insolvency and Bankruptcy Board of India in the form of study material and supplemented by mock test in Multiple Choice Questions format.
Rising Domain of Valuation and Emerging Professional Opportunities…
13
This Learning Management System facilitates the members in preparing for IBBI Valuer Examination.
6. Release of ICAI Valuation Standards 2018 and adoption of the same by ICAI RVO
ICAI through its Valuation Standards Board has brought out ICAI Valuation Standards 2018 which are first of its kind in India. The ICAI Valuation Standards are Mandatory for the members enrolled with ICAI RVO under the Companies Act 2013 till the time the Valuation Standards are issued by the Government as per Companies (Registered Valuers and valuation) Rules, 2018.
The ICAI Standards are recommendatory for chartered accountants for valuation under other Statutes.
7. Publications issued:
(i) Technical Guide on Valuation: The Valuation Standards Board of ICAI has brought out the publication on “Technical Guide on Valuation”. This publication comprehensively covers various aspects of valuation. The publication briefly outlines the manner in which members may furnish the Report on Valuation.
(ii) Valuation: Professionals' Insight: The Valuation Standards Board of ICAI jointly with ICAI RVO has brought out the publication “Valuation: Professionals' Insight”. The purpose of this publication is to provide an overview of the valuation involved in mergers, amalgamation, options, business, case studies by compiling articles. This publication covers some practical insights on valuation, to share these insights to valuers and users of valuation reports.
8. Awareness programmes on ICAI Valuation Standards 2018: ICAI is organizing awareness programmes on ICAI Valuation Standards 2018 across the country.
For other details, a professional may refer the website of ICAI Registered Valuers Organisation. The url of website is www.icairvo.in
Conclusion While the law provide opportunities to all professionals for enrolling as Registered Valuers, Valuation is a highly specialised field which can be
Valuation Professionals Insight
14
performed by the professionals having a blend of finance, accounting and law and Chartered accountants are best suited for valuation as at various levels of chartered accountancy, the syllabus includes various topics and methodology of Valuation which creates a strong knowledge base for Chartered Accountants.
The Institute of Chartered Accountants of India has formed a Section 8 private company which has been recognised by the IBBI as a Registered Valuers Organisation (ICAI RVO) to enrol and regulate registered valuers or valuer member as its members in accordance with the Companies (Registered Valuers and Valuation) Rules, 2017, and functions incidental thereto. ICAI RVO is registered for Securities or Financial Assets Class.
Recognising the need to have the consistent, uniform and transparent valuation policies and harmonise the diverse practices in use in India, the Council of the Institute of Chartered Accountants of India (ICAI) has issued the ICAI Valuation Standards 2018 which are 1st of its kind in India. These will help ICAI members in maintaining the consistency in issuing the Valuation reports.
Chapter 2
Distinguishing Features of ICAI Valuation Standards 2018
The Institute of Chartered Accountants of India has issued the ICAI Valuation Standards, 2018 in June, 2018
Applicability of Valuation Standards:
These ICAI Valuation Standards have been made applicable by ICAI for ICAI members for all valuation engagements on mandatory basis under the Companies Act 2013. In respect of Valuation engagements under other Statutes like Income Tax, SEBI, FEMA etc, it will be on recommendatory basis for the members of the Institute. These Valuation Standards are effective for the valuation reports issued on or after 1st July, 2018.
ICAI has formulated Valuation Standards on the basis of detailed study of global practices followed. The followings are in line with/ comparables to the International Valuation Standards:
• Valuation Premises
• Valuation Bases
• Valuation Approaches and Methodologies
• Considerations for arriving at a value
• Factors to be considered while arriving at a value
• Format of Valuation Report
• Contents of Valuation Report etc.
Distinguishing features of ICAI Valuation Standards 2018 1. ICAI Valuation Standards 2018 Standards have been formulated as
per the applicable laws, customs, usages and business environment prevailing in India, Judgements taken pertaining to Valuation. They deal with India’s special needs and conditions arising from the India’s economic, social and legal environment. ICAI Valuation Standards
Valuation Professionals Insight
16
2018 are home-grown standards which address local issues, concerns and questions.
2. ICAI Valuation Standards 2018 are known widely and available easily and the same can be communicated, applied, monitored and enforced by the various stakeholders in valuation.
3. Principles adopted by the ICAI Valuation Standards are globally accepted (subject to few changes from India perspective).
4. Standards have been formulated also considering the Fair Value principles as per Ind AS 113 as notified by the Ministry of Corporate Affairs as the requirements for valuation under Companies Act is essentially in context of fair value requirements of Ind AS Financial Statements. Market Value ICAI Valuation Standard 102 defines Market Value in detail as per Ind AS 113 principles. Income tax/ SEBI/ Companies Act/ FEMA regulations/ Accounting standards usually use terminology of ‘Fair Value’. While the underlying valuation principles of Market Value and Fair value (as per the valuation principles/ standards) are similar, use of a different terminology may create misunderstanding to users. However, Para 19 of ICAI Valuation Standard 102 allows to have market value separately from Fair Value, if circumstances require. Market Rent ICAI Valuation Standard do not provide for the definition of Market Rent as the ICAI Standards are for Valuation of Securities or Financial Assets. Relative Value As Per Para 8 of ICAI Valuation Standards 102; Valuation for determination of share exchange ratio/ share entitlement ratio in the case of amalgamation/ mergers/ demerger are usually based on Relative Value, which is an accepted concept based on past judicial precedents in India Other basis of Value
Other basis of Value (IFRS/ OECD/ US IRS, etc) need to be customised to specifically include Indian tax/ regulatory requirements
Distinguishing Features of ICAI Valuation Standards 2018
17
(eg valuation carried out based on formula prescribed in SEBI/ Income tax regulations) as per Para 7 of ICAI Valuation Standard 102.
Equitable Value/ Investment Value/ Synergistic Value
Equitable Value/ Investment Value/ Synergistic Value basis considers Participant specific perspective. Use of multiple basis of value may create misunderstanding amongst users. Therefore, ICAI valuation Standards have not defined these values.
Highest and best use
ICAI Valuation Standard 102 under para 39 to 48 provides detailed guidance on Highest and Best Use.
An entity's current use of a non-financial asset may be presumed to be its highest and best use unless market or other factors suggest that a different use by participants would maximise the value of the asset. Also, in certain cases, assessment of highest and best use may involve considerable subjectivity/ technical assessment and the Valuer may base his evaluation considering inter-alia relevant inputs from the client, information available in public domain.
ICAI Valuation Standard 102 provides for the definition of Market participants as per Ind AS 113 in para 24.
5. Para 58 to 60 of ICAI Valuation Standard 102 also defines integration cost to be part of Specific Considerations.
6. Fairness opinion as required under SEBI Guidelines has been provided.
7. Internationally Market Price of traded assets has been covered as one of the valuation method under Market Approach in ICAI Valuation Standard 103.
Under ICAI Valuation Standards the same has been captured in Para 18-20. It is believed that Market Price is very important method in Market Approach as in many Regulations such as SEBI Regulations, Income Tax Act, FEMA, etc. suggests usage of this method.
8. Determination of DLOM & DLOC under Market Approach
As per Para 38- 48, of ICAI Valuation Standard 103, DLOMs and
Valuation Professionals Insight
18
DLOCs may be applied on the professional judgement of the valuer considering the factors such as size and nature, amount/extent of control, time and cost associated with marketing, restrictions on transfer of subject asset, etc. Due to lack of empirical Data specific to Indian markets, it is believed that it should be left to the judgement of the professionals.
9. Under ICAI Valuation Standard 103, DLOM and DLOC need to be applied under Income approach while valuing illiquid securities and minority interest, which is believed to be more appropriate in such cases.
10. Format of Report has been provided.
11. Specific guidance has been provided for Subsequent Events.
12. It has been specifically provided that the valuer has to disclose the identity of the expert along with the reliance placed on such expert’s report. This is pertinent since, in many cases, the valuer may appoint another expert to undertake valuation of specialised asset types like financial instruments, etc.
13. ICAI Valuation Standards specifically provide to include the valuer’s signature along with his identity and other details. This helps in fixing responsibility for the contents of a valuation report.
14. The ICAI Valuation Standard 202 on ‘Valuation Report and Documentation’ is very comprehensive than the International Standards. There are many important aspects which are included in the ICAI Valuation Standards. A summary of such aspects is set out below:
(a) Contents of the valuation report
Para 10 to Para 35 of ICAI Valuation Standard 202 provides detailed guidance on Contents of Valuation Report.
(b) Independence of the valuer
Since the independence of the valuer is an important aspect determining the reliability of the valuation report, the ICAI Valuation Standard 202 provides specific guidance (paragraph 14) that the valuer shall be independent of the asset as well as the client for whom the valuation is being undertaken. Further, the ICAI Valuation Standard
Distinguishing Features of ICAI Valuation Standards 2018
19
also states that the valuer should be independent of the user of a valuation report, where the valuation assignment is commissioned by one party but the report is intended to be relied on by another user. (c) Reliance on use of experts Paragraph 12 of the ICAI Valuation Standard 202 specifically requires the valuer to disclose the identity of the expert along with the reliance placed on such expert’s report. This is pertinent since, in many cases, the valuer may appoint another expert to undertake valuation of specialised asset types like financial instruments, etc. (d) Disclosure about conflict of interest Conflict of interest / perceived conflict of interest is an important impediment in reliance placed on valuation reports. In case such conflict of interest is not disclosed, there could be significant misrepresentation. Para 15 of the ICAI Valuation Standard 202 requires a valuer to disclose conflict of interest. Further, ICAI Valuation Standards prohibit the acceptance of a valuation assignment in case of any conflict of interest, where local laws prohibit such acceptance. (e) Signature on the valuation report Para 27 and 28 of ICAI Valuation Standard 202 requires the valuer to specifically include the valuer’s signature along with his identity and other details. This helps in fixing responsibility for the contents of a valuation report. (f) Management representations Since a lot of information provided by management is used in undertaking valuation, separate paragraphs have been included in the ICAI Valuation Standard 202 (Para 36 to 38) on accepting management representations and extent of placing reliance on them. (g) Documentation Since documentation is the only way of ascertaining the quality and extent of procedures carried out by the valuer, the ICAI Valuation Standard 202 provided detailed guidance on how and what to document in para 39 to 48. Detailed guidance on maintenance of records has been provided in compliance with the Companies Act, 2013 which provides for maintenance of records for a period of 8 years.
Valuation Professionals Insight
20
15. ICAI Valuation Standard 103 encourages use of multiple method/approaches
ICAI Valuation Standard 103 encourages use of multiple method/approaches for valuation in such instances to produce a reliable indication of value. It is believed that usage of multiple method gives greater comfort on outcome as all aspects (Income/Multiples, etc) is looked at while finalising the valuation. As compared to single method usage of multiple methods gives a better comfort. The Standard also provides that if the difference in the values under different approaches/ methods is material, the valuer need to consider certain factors given in paragraph 10 to consider whether the approach/method considered is appropriate or not.
ICAI valuation Standards provides option for Usage of Multiple Valuation Methods. It has been left to the Valuer’s discretion to use one or Multiple Methods and give weightages. It is well established by Indian judiciary that multiple methods and weighting same, are considered to be a better approximation of fair value in many cases rather than a single method value. The erstwhile CCI valuation guidelines, the FDI valuation guidelines, Income tax valuation guidelines, etc., recognise multiple method valuation and appropriate weighting or establishing a range.
16. Detailed paras on Scope of Work and Terms of Engagement Letter have been given.
17. ICAI Valuation Standards do not recommend preparation of cash flows as certain professional bodies governing the valuers do not permit Valuers to be party to such projections. Under ICAI Valuation Standard 103 in para 65, the valuer is required to undertake analysis of projections to assess risk inherent in its achievability.
18. Detailed guidance has been provided on Analyses and Evaluation of asset to be valued. It has been provided that Analyses of asset to be valued is based on the following information:
1. non-financial information
2. ownership information
3. financial information; and
4. general information
Distinguishing Features of ICAI Valuation Standards 2018
21
In addition to the above mentioned distinguishing features, it is stated that ICAI Valuation Standards 2018 provide principles and detailed guidance and are user friendly for Indian Valuers.
The Standards are written Standards which are developed in India by the Institute of Chartered Accountants of India and adopted by ICAI Registered Valuers Organisation in response to the local needs and conditions after notifications of Companies (Registered Valuers and Valuation) Rules, 2017 and it is mandatory for the Registered valuers enrolled with ICAI RVO to follow ICAI Valuation Standards 2018 and ICAI Council has made it recommendatory for the chartered accountants to follow ICAI Valuation Standards 2018 as of now.
The Valuers will find it useful as the ICAI Valuation Standards 2018 complies with the requirements of Companies (Registered Valuers and Valuation) Rules, 2017. For Example provides minimum content of the Valuation Report as specified in the said Rules, Code of Conduct of Registered Valuers.
To Conclude Though the compliance with the Valuation Standards 2018 are recommendatory for chartered accountants who are not enrolled with ICAI Registered Valuers Organisation for Valuation under any Statute except under the Companies Act 2013. We encourage you to follow the Valuation Standards 2018 so as to adopt uniform and best practices.
Chapter 3
Valuation – Some Basics Relating to Cash Flow and Discount Rate
WE BELIEVE THAT the value of an asset, and of business, comes from the cash that it is expected to generate and not from the profit that it is likely to report. Remember: while it is easy to tinker with profit, it's hard to fudge cash flow.
Secondly, unlike profit, cash flow does not make a song and dance over capital and revenue. It does not create a fuss over methods of depreciation and of inventory valuation. And it is unconcerned about the number of years over which non-cash assets are to be written off. The element of discretion does not enter in identifying cash flow and to that extent, there is less corruption in valuation!
Finally, you can never spend profits; you can only pay cash. Hence, it is cash flow that counts (pun unintended).
Size, Timing, and Quality of cash flow Three points relating to cash flow matters.
One is the size of the cash flow. The higher the cash flow, the more is the value. Between two companies, one of which receives more money than the other, other things remaining the same, the first company commands more value.
Second is the timing of the cash flow. The earlier the cash flows in; the more is the value. Between two companies one of which receives the money today, and the other receives it a year later, other things remaining the same, the first company commands more value.
Third is the quality of the cash flow. The term ‘quality’ means ‘repeatability.' A cash flow that is repeatable is more valuable than a cash flow that is one time. Cash flow of Rs 10 million through product sales is better than cash flow of Rs 10 million received through the disposal of a building. This is because you don't get to sell building every year, while you get to sell products every year. Similarly, the promise of regular money from an unknown company is better than a pledge of a one-time cash payment from a reputed company.
Valuation – Some Basics Relating to Cash Flow and Discount Rate
23
We believe that the client-company knows his business better and is in the best position to prepare the projected financials. The valuation-analyst should have a perception of the big picture to be able to assess whether the projections are prima-facie reliable. He should be able to ask the right questions and flag dubious assumptions. Trust is an essential ingredient of the valuation process, yet as the adage goes, “trust; nevertheless verify.”
Probability estimates When we project cash flow, there is no guarantee that they would match the actual cash flow of the future. The reason is that nobody has seen tomorrow. Since one shot estimates can go horribly wrong, it is advisable to make multiple estimates of cash flow with probability estimates. Ideally, three estimates of cash flow may be made: one, which is optimistic; the second, which is pessimistic; and the third, which is ‘most-likely.’ Probabilities are judgmental and are normally based on events that happened in the past. While such estimates are a function of individual judgment and your judgment is as good as mine, in the absence of any specific rationale, a 17% probability could be assigned to each of the optimistic and pessimistic estimate and a 66% probability to the most likely cash flow. The final number would be the weighted average cash flow with the probability of occurrence as the weight.
The exercise must be carried out for each line item in the cash flow statement.
The reason for making a line-o-line measurement is that the probability of some cash flows is more precise than that of other cash flows. For instance, there is less uncertainty about wage payments where wages are time-based and agreed upon with the labor union, than there is about sales. Mark it: sale value is dependent on many imponderables like volume, price, and the probability of realization.
Timing In the world of finance, it is often assumed that all cash flows take place at the end of the year. However, this is entirely unrealistic. In the real world, payment happens in the course of the year. The rental advance is payable at the beginning of the year, while the rent is paid every month. Managers take a year-end number to be conservative. Remember: the further away the cash flow is, the less is the value. If however a more realistic option of choosing in-the-course-of-the-year is taken one must average out the year beginning and year-end present value factor. We like to believe in averages.
Valuation Professionals Insight
24
Value of a player in franchise How does a franchise decide upon how much to pay for a player? If you think it is based on the skill set of the cricketer, you are wrong. At the IPL you would notice that rooky Indians got paid far more than established foreigners. Different factors come into play in deciding the number. Some of them are:
• The popularity of the player
• Advertisement value of the player
• Merchandise that can be sold because of the player
• Availability of the player for the entire season
• Chances of his being selected into the team
• At what point in time does he come into the auction
• Which slot is he going to fit into the team?
• Who is he competing against?
• How are others bidding for him?
The technically best players are not the ones who command the highest values. They may be critical for the team’s chances, but they aren’t paid the best. Remember, how pay hikes happen in the company? It’s not the technically soundest person who gets the best money.
Factors that drive cash flow We stressed these to tell you that different factors drive each line of cash flow. Let’s look at another example, namely, sales to understand this. Sale projection for a hand-held is a function of:
• Models
• Volume
• Selling price
• Discounts
• Demographic changes
• Segmenting, targeting and positioning
• Credit period
Valuation – Some Basics Relating to Cash Flow and Discount Rate
25
• History of bad debts
In contrast royalty payments are more straightforward and are linked to royalty agreements.
Foreign currency and forward rate Certain cash flows are likely to be in dollars (foreign currency). In such a case we must convert them to rupee cash flows.
The conversion is done at the ruling forward rate. Such rates are readily available on Bloomberg. Alternatively you can use the interest rate parity theory to arrive at an estimate of forward rate. The IRPT seeks to eliminate arbitrage opportunities. Often, in India, the actual forward rate does not tie with the estimated forward rate. This is because the dollar is not fully fungible. It cannot move in and out of India quickly.
In such a scenario there is significant alpha against these values. This means that the observed rates are different from the estimated rate. For instance, if the historical estimated 3m forward rate in say Jan 1, 2016, was Rs 65 while the IRPT suggested say 63, this implies that the observed rate is away by (2/65 x 100) = say 3.5%.
You might like to compute such alpha over an extended period and arrive at the average alpha and apply the average to the imputed numbers. Also in the computations, the time period should be consistent. For the 3m forward rate, the 3m risk-free rate is to be considered while for the 1year forward rate; the 1year risk-free rate is to be taken. Further, while picking up the forward rate, be conservative rate. While considering inflows, you must consider the bid price and while looking at outflows, the ask price.
The IRPT uses the respective country’s risk-free rates. You may source these from the respective country’s central bank website.
Horizon value There is a point beyond which estimates turn out to be elevator-like. It is not possible to make realistic judgments. For instance, is it possible for you to imagine where you would be 20-years from today? Well, you might have a broad vision, but you will not be able to predict it with any degree of accuracy. There was a time when for project evaluation exercise projections were made for a ten-year period with appropriate estimates made for three years and then stagnating the numbers of the third year for the balance period.
Valuation Professionals Insight
26
Sometimes the increment from the fourth year was a fixed percentage. In later evaluations were scaled down to 7-years. Today, with the kind of innovations and technology advancements that are taking place, estimates are possible only for 5-years on the outside except in the case of long-term project like road projects where you may be required to make it for 15 years. In any case, projection periods turn out to be far short of the actual life of the asset.
There are therefore two options for the computation of horizon value that is value for cash flows beginning in the year beyond which cash flow estimates are not possible.
One, you could make an estimate of the realizable value of those assets. This is perhaps the best way forward. But unfortunately, these may not have a ready-made market! This takes us into the realm of horizon value. Here the assumption is that the cash flow of the last visible year will continue permanently into the future. We can also assume a particular growth rate. In that case, the horizon value is the present value of a growing perpetuity. The anomaly, in this case, is obvious. First, assets are not expected to last infinitely into the future. The second is a judgment about growth rate. While any rate is a fair rate, corporates do not take a rate of increase, which is higher than the rate at which the GDP is growing. Looks quite fair enough. One might argue that it could be broken down to the rate at which each sector is growing! We think it may even be best, at least most conservative to take a zero growth rate. However, it could undervalue the asset.
In many cases, the horizon value may turn out to be a significant percent of the final PV. A thumb rule is to restrict the horizon value to 50% of the present value of the asset. In other words, it is kept at a maximum of 100% of the cash flow based computed present value.
Assets that don't contribute to the cash flow Some assets don't add to cash flow but are part of the asset portfolio of the company. For example real estate. Let’s say residential accommodation for senior staff. Now these have to be naturally valued separately and added to the value of the asset. The appropriate thing would be to take its liquidation value without getting into the jazz of doing a cash flow based evaluation. A second one could be the buildings that are owned by the company. You should impute a rental value cost to it in arriving at profits. After that separately evaluate the building. For this asset you may like to do a Relative
Valuation – Some Basics Relating to Cash Flow and Discount Rate
27
Valuation of which we talk a little later here. Other examples of surplus assets could be investment portfolio. These have a readily available market, and we should hence take those market values.
Human value When you buy a business you automatically hire the employees in the business. Would the selling company want a price for it? Should you do a human resource valuation? Our view is “No.” Humans, unlike assets, can walk away from your organization at the drop of a hat. You, in that sense, have no control over them. However, a selling company would want a payment for handing over a bunch of ready-to-use employees. Our view is that the amount it seeks for having assembled a strong workforce represents the premium on the workforce and be taken as a value of the firm. Typically this should be equal to the amount that you would pay a recruitment agency for recruiting people. If the market rate for such recruitment is 1- month salary, you should be ready to make that payment and hence the valuation will go up by that number. Also because the recruitment happens instantaneously and occurs in one-shot you may have to consider a higher value than the standard rates. Something like 2-months would be in order.
For whom is the valuation Is the valuation intended for procuring the shares of the company or is it to arrive at the value of the company. This assumes importance because valuing a business is different from valuing the shares. Remember, a business consists of both stock capital and debt capital.
Traditionally it is the business that is valued. That being the situation you should consider the cash flows that belong to the firm and discount it at the appropriate cost of capital. In arriving at the cash flow to the firm the, method of financing it is to be ignored. This is because how a company is financed cannot increase or decrease the value of business. It can only increase or decrease the value to the shareholder.
To cut a long story short, if you are valuing a firm, you should not deduct the interest payment and the principal repayments to the long-term lenders. This is because interest is towards time value of money. Discounting also recognizes time value of money. To deduct interest and at the same time discount the cash flows at what we will soon learn, WACC, will be a double count.
Valuation Professionals Insight
28
B. Discount Rate Herein about, we get into a slew of complicated areas. A few quick points are in order.
It's the business risk rate Cash flows are of the firm. The discount rate is the risk associated with the cash flow. Since the cash flows are of the firm, the discount rate should be the business risk discount rate. This means that ideally the discount rate cannot and should not depend on the way in which the company is financed.
Basically, in a capital budgeting exercise you first identify whether the asset is worth it. After that, you decide on how it should be funded. Mark it business valuation is valuation of a bundle of assets and hence the same rules will apply.
Financial risk and WACC When a company adds debt to its capital structure, it does not increase the risk of the business per se. It only enhances the risk for the shareholder. Let me provide you with an example. Suppose a business carries a risk of 15%. If you use equity money, you expect to earn 15% for the equity shareholders. If you use 50% debt, and let's say debt cost 10%, you need to make 20% for the equity shareholder. This means that equity shareholders expect 20% because the introduction of debt made life riskier for them. Remember, the WACC continues to be 15%. As you add more debt, the WACC remains unchanged, and the risk for equity shareholders keeps climbing. This is the underlying philosophy in valuation. To do otherwise and thus downplay the WACC would be sad. So long as we understand WACC to mean what the project is required to earn for its risk, you could call it that.
We believe that how a company funds itself is a matter of its internal convenience and beliefs. The discount rate is guided by it but is by no means driven by it. Let me give you an example. Let us say that you raise Rs 100 crore. Assume that you decide to put it in a restaurant business. What is the rate of return you would want? 20%? Alternately you choose to put it in the movie business. Would you want to earn the same rate of return? Fat chance. You would surely want to make a higher rate because the movie business carries greater risk and therefore calls for discounting at a higher discount rate. The WACC of your company has no role to play. If you go by the same WACC for every business, the riskier project has the greater probability of being selected!
Valuation – Some Basics Relating to Cash Flow and Discount Rate
29
Our example of restaurant business and movie business now shows that the discount rate will have to be SBU specific and not some overall corporate WACC unless the company, for whatever reason, has chosen to do so.
If you wish to swear by the WACC as in being a weighted average of cost of equity and cost of debt these must be computed separately. The capital asset pricing model, despite its inherent limitations, is almost the default formula for arriving at the cost of equity. The cost of debt would be the post-tax yield to maturity. The weights could either be book value weights or market value weights, with both having their pluses and minuses. On average, corporate prefer to use the easy to find, readily audited book value weight.
The capital asset pricing model, as we know, uses Beta as the proxy for risk and arrives at the required rate of return. This required rate is then considered as the cost of equity capital. Now, beta is computed with the help of volatility of rates of return of the stock in the market. For entities that are not listed like private limited companies and partnership firms, the beta has to be derived from a proxy company. Like in the case of Relative Valuation, which we discuss a few paragraphs later, the proxy company should be carefully chosen.
The overall beta (weighted average of debt and equity beta) of the proxy company is assumed to be the overall beta of the computation company. After that, based on the debt-equity ratio of the computation company, the beta of equity of the computation company is arrived at. In technical lingo, first un-lever the levered beta and then re-lever it.
Country risk and IRPT Another factor that assumes significance is that investments made in different countries cannot be discounted at the same rate. It will depend on a couple of things. One, risk rates in that country; and two, the expected movement of currencies belonging to the two nations.
Let’s take the second thing first. Let us say you intend to set up a trading business in Africa. Assume that India and Africa carry the same sovereign risk. Let’s also say that the trading business has the same risk in both countries. Despite these, the discount rate will depend on how the cash flows are expressed and the currency price movement.
Suppose W Ltd has invested in the trading business in Africa. Suppose the India discount rate is 12%. Suppose the African currency (ANR) appreciates
Valuation Professionals Insight
30
annually against the Indian Rupee (INR) by 2%. If the cash flows are in INR, the discount rate will be 12%. If they are in ANR, the discount rate will be 9.8% approx. Mark it, the business will have to earn 9.8%, the balance 2.2% will come courtesy currency appreciation! Essentially, a part of the total return comes from currency fluctuation and hence the balance alone needs to be earned from business operations. If it is currency depreciation, then a compensatory extra has to come from business operations.
At a different level, in arriving at business risk, a number of aggregations may have to be done. Suppose the base case risk is 12%. If Africa is riskier than India and if the additional risk is 2% we must add that number. This is the sovereign risk. If in addition, the business risk is higher by 1% that too should get added. If there are liquidity concerns such as the stock is not listed on the market, or there is no significant second-hand market for used products, you will have to increase the discount rate by a few notches. Assuming the premium for that is 1%, the total discount rate will be 12+2+1+1 = 16%.
Our sense is that:
(a) If political, economic, social, legal, and technological factors aren’t good in the country of investment you need to increase the discount rate to reflect the higher risk.
(b) Organizations that are family owned may have to carry a higher discount rate as often the succession planning is done very efficiently and awaits the passing away of the patriarch.
(c) A record of the history of the country and the corporation would help decide on risk matrix.
Proxies and cost of capital conundrums A change in D/E ratio should not affect the discount rate because the appropriate discount rate is the business risk rate. But if a company is bent on using the WACC, a change in D/E for sure affects the WACC. In such a situation one can make the simplistic assumption of retaining the original discount rate or might have multiple discount rates across the valuation period.
One may therefore use the cost of equity and the cost of debt to work out the appropriate business risk. Here if we believe that the costs are perfect, the WACC would then become the business risk. The cost of equity of a un-levered company is the appropriate discount rate for the company.
Valuation – Some Basics Relating to Cash Flow and Discount Rate
31
The computation of the cost of equity is critical. The widely held view is that it is the rate of return the company has to earn to service the requirement of the shareholder. What is the rate of return that investors want? The best way to answer it is to ask each of the investors what they want, identify how much they have invested, and then arrive at a weighted average! Now, that is impractical.
The capital asset pricing model helps find the cost of equity. Let's consider Company A as the proxy company. Compute the beta of equity of A Ltd.. From this arrive at the overall beta of A Ltd. This will now also be the Beta of the B Ltd., the computation company. Given the beta of debt of the B Ltd., we can arrive at the beta of equity of B Ltd. This would help us arrive at the cost of equity of B Ltd.
Where taxes are involved, the beta computations are to be adjusted for tax. That is, wherever you have D you must replace it with D x (1-T)
What should be the tax rate? Should it be the (a) marginal tax rate (b) effective tax rate of the company (c) tax rates adjusted for tax concessions? There is no unanimity of view in this regard. One sense is that an initial evaluation should be done by disregarding all tax benefits except perhaps the benefit of depreciation and carry forward of losses that happen on that project. This is because these tax concessions despite statements to the contrary can be withdrawn, and taken out in a jiffy. Your purchase should stand the test of economic value that is value without accounting for tax benefits.
All the preparation, all the readiness, may not help if a black swan event happens. The importance of good fortune just cannot be underplayed.
Chapter 4
Levels of Value
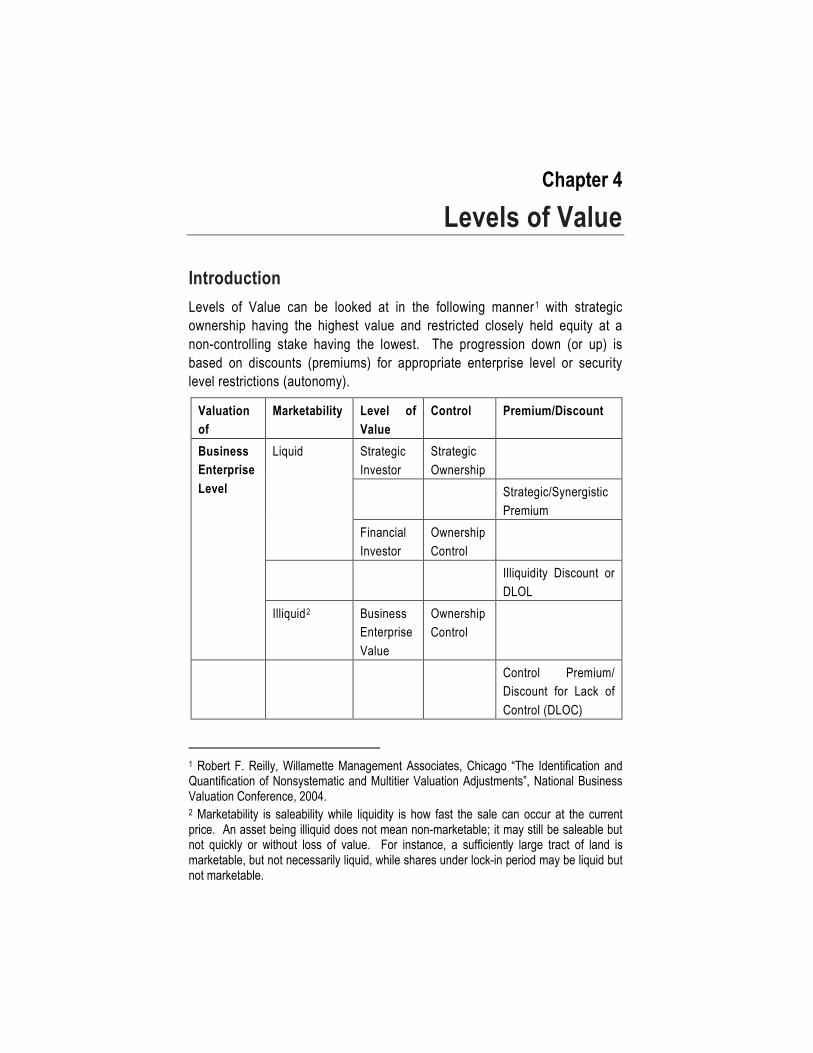
Introduction Levels of Value can be looked at in the following manner1 with strategic ownership having the highest value and restricted closely held equity at a non-controlling stake having the lowest. The progression down (or up) is based on discounts (premiums) for appropriate enterprise level or security level restrictions (autonomy).
Valuation of
Marketability Level of Value
Control Premium/Discount
Business Enterprise Level
Liquid Strategic Investor
Strategic Ownership
Strategic/Synergistic Premium
Financial Investor
Ownership Control
Illiquidity Discount or DLOL
Illiquid2 Business Enterprise Value
Ownership Control
Control Premium/ Discount for Lack of Control (DLOC)
1 Robert F. Reilly, Willamette Management Associates, Chicago “The Identification and Quantification of Nonsystematic and Multitier Valuation Adjustments”, National Business Valuation Conference, 2004. 2 Marketability is saleability while liquidity is how fast the sale can occur at the current price. An asset being illiquid does not mean non-marketable; it may still be saleable but not quickly or without loss of value. For instance, a sufficiently large tract of land is marketable, but not necessarily liquid, while shares under lock-in period may be liquid but not marketable.
Levels of Value
33
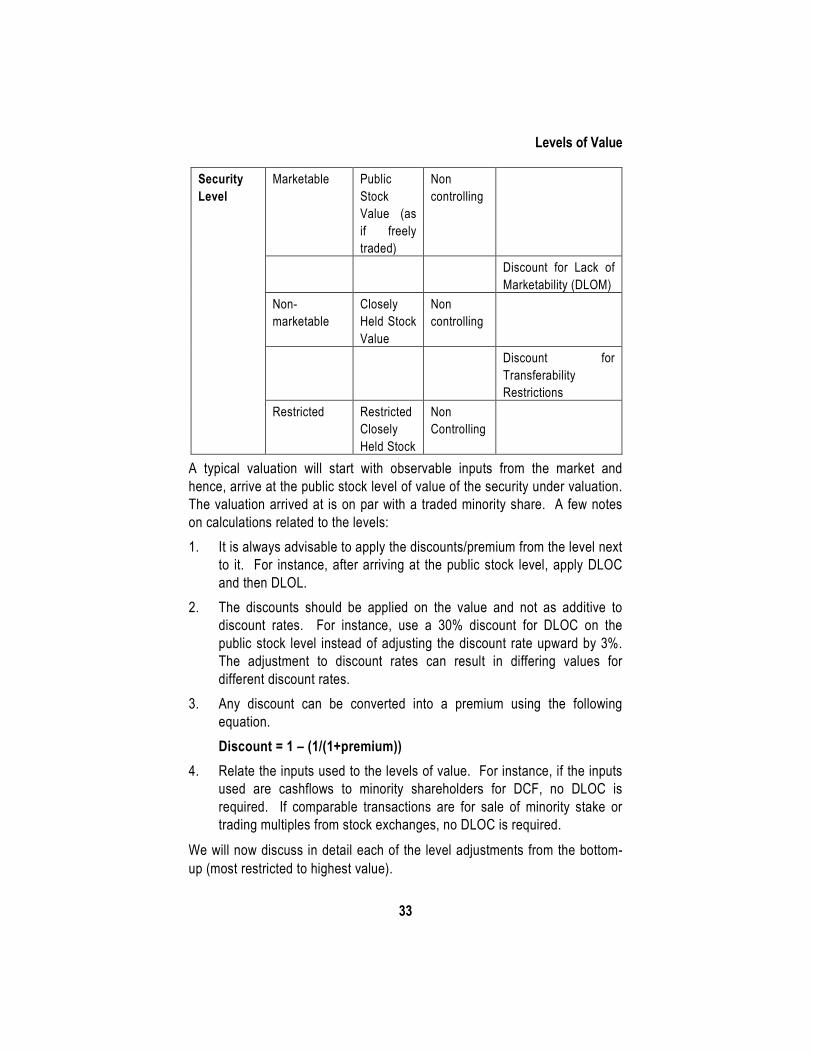
Security Level
Marketable Public Stock Value (as if freely traded)
Non controlling
Discount for Lack of Marketability (DLOM)
Non-marketable
Closely Held Stock Value
Non controlling
Discount for Transferability Restrictions
Restricted Restricted Closely Held Stock
Non Controlling
A typical valuation will start with observable inputs from the market and hence, arrive at the public stock level of value of the security under valuation. The valuation arrived at is on par with a traded minority share. A few notes on calculations related to the levels: 1. It is always advisable to apply the discounts/premium from the level next
to it. For instance, after arriving at the public stock level, apply DLOC and then DLOL.
2. The discounts should be applied on the value and not as additive to discount rates. For instance, use a 30% discount for DLOC on the public stock level instead of adjusting the discount rate upward by 3%. The adjustment to discount rates can result in differing values for different discount rates.
3. Any discount can be converted into a premium using the following equation. Discount = 1 – (1/(1+premium))
4. Relate the inputs used to the levels of value. For instance, if the inputs used are cashflows to minority shareholders for DCF, no DLOC is required. If comparable transactions are for sale of minority stake or trading multiples from stock exchanges, no DLOC is required.
We will now discuss in detail each of the level adjustments from the bottom-up (most restricted to highest value).
Valuation Professionals Insight
34
Discount for Transferability Restrictions A company’s shares become less valuable when there are restrictions on transferability. For instance, in comparison to a closely-held public company, a private limited company has a higher restriction on transferability of shares due to statutory restrictions. The valuer should read the governing byelaws, articles of association or partnership agreement to understand the restrictions better. Some of the older articles of association (under Companies Act, 1956) may have a provision for right of first refusal to existing shareholders or right of first offer by existing shareholders before the shares can be sold to external parties. Some of them may even provide for valuation to be fixed by a valuer appointed by the Board or for a formula-based valuation. All these provisions act as additional barrier on transfer of shares and require the valuer to have a separate discount for transferability restrictions. Each factor must be considered under the circumstances prevailing for the security/interest being valued.
Discount for Lack of Marketability A Discount for Lack of Marketability (DLOM) is “an amount or percentage deducted from the value of an ownership interest to reflect the relative absence of marketability.”3 Marketability is defined as “the ability to quickly convert property to cash at minimal cost”4 and in addition, “with a high degree of certainty of realizing the anticipated amount of proceeds”5. The Honorable SC has highlighted marketability as one of the criteria to be used by a valuer in the Hindustan Lever6 case.
In a United States decision, Bernard Mandelbaum, et al v. Commissioner of Internal Revenue (1995), Judge Laro outlines several factors to be considered for determining marketability discount (which came to be known as Mandelbaum factors). These are:-
1. Private vs. Public Sales of Shares 3 International Glossary of Business Valuation Terms, as adopted in 2001 by American Institute of Certified Public Accountants, American Society of Appraisers, Canadian Institute of Chartered Business Valuators, National Association of Certified Valuation Analysts, and The Institute of Business Appraisers. 4 International Glossary, Ibid 5 Shannon P. Pratt, Alina V. Niculita, Valuing a Business, The Analysis and Appraisal of Closely Held Businesses, 5th ed (New York: McGraw Hill, 2008), p.39. 6 Hindustan Lever Employees' Union Vs. Hindustan Lever Limited And Ors.
Levels of Value
35
2. Financial Statement Analysis
3. Company’s dividend policy
4. Nature of company, its history, position in the industry and its economic outlook
5. Company’s management
6. Amount of control in transferred shares
7. Restrictions on transferability of shares
8. Holding period for stock
9. Company’s redemption policy
10. Costs associated with making a public offering.
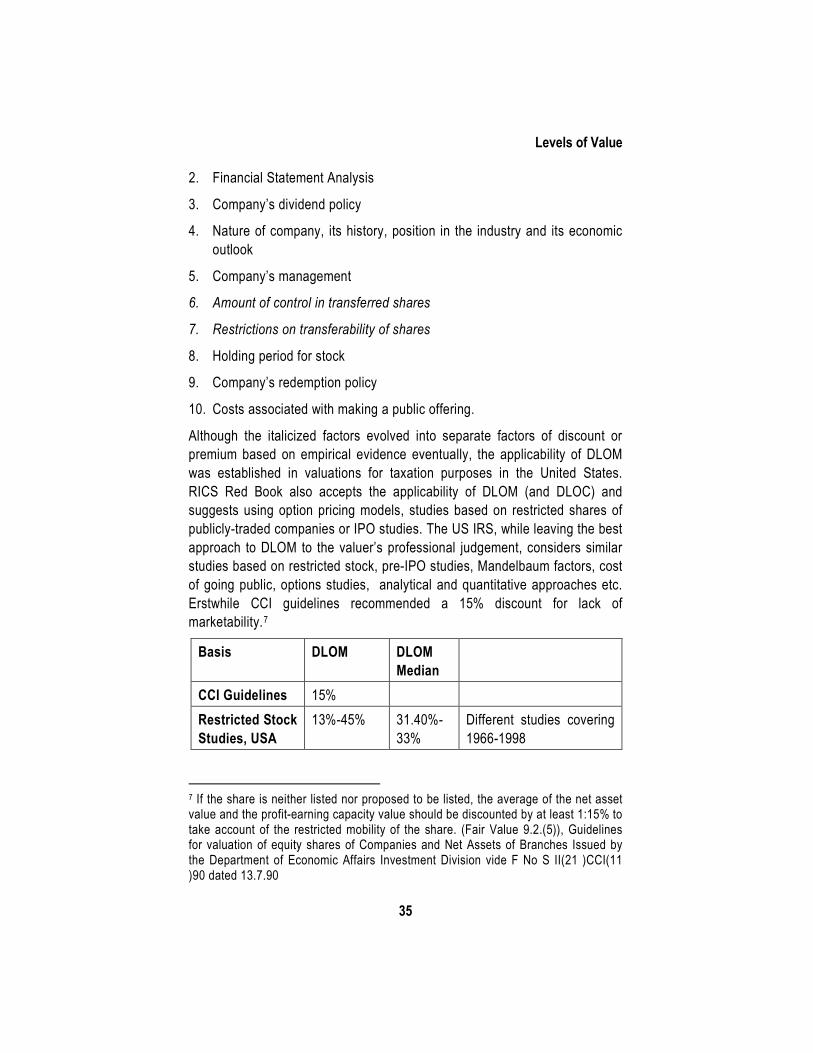
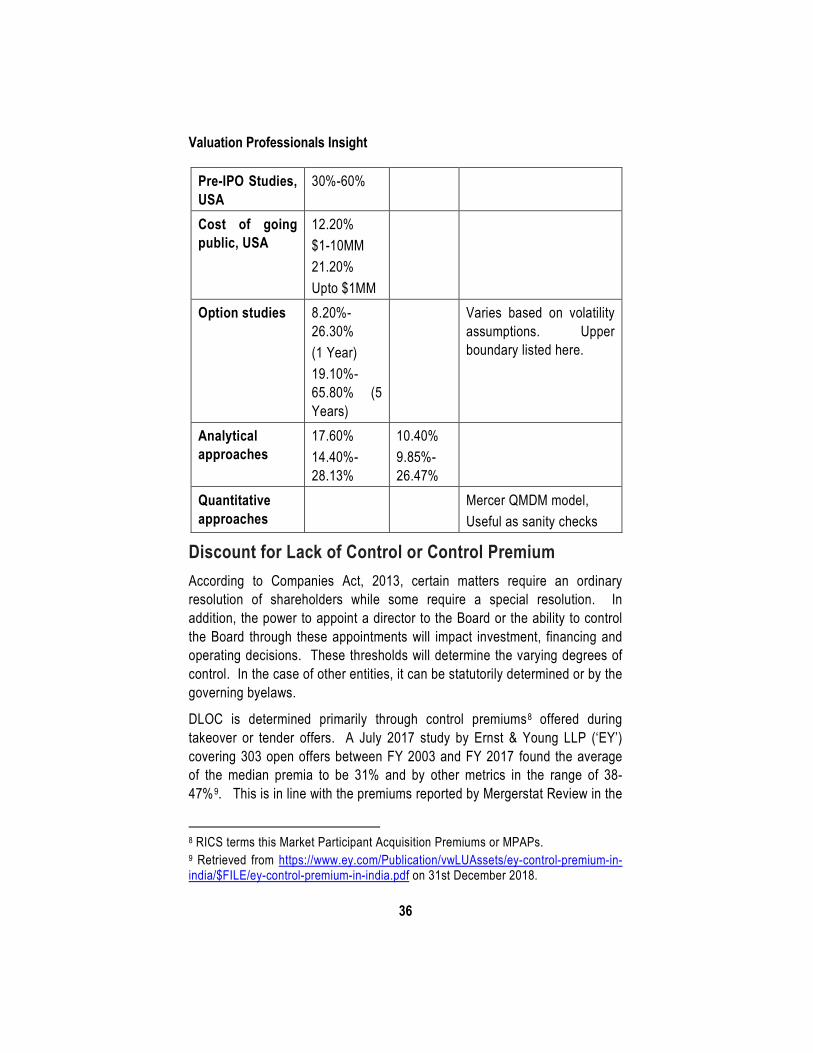
Although the italicized factors evolved into separate factors of discount or premium based on empirical evidence eventually, the applicability of DLOM was established in valuations for taxation purposes in the United States. RICS Red Book also accepts the applicability of DLOM (and DLOC) and suggests using option pricing models, studies based on restricted shares of publicly-traded companies or IPO studies. The US IRS, while leaving the best approach to DLOM to the valuer’s professional judgement, considers similar studies based on restricted stock, pre-IPO studies, Mandelbaum factors, cost of going public, options studies, analytical and quantitative approaches etc. Erstwhile CCI guidelines recommended a 15% discount for lack of marketability.7
Basis DLOM DLOM Median
CCI Guidelines 15% Restricted Stock Studies, USA
13%-45% 31.40%-33%
Different studies covering 1966-1998
7 If the share is neither listed nor proposed to be listed, the average of the net asset value and the profit-earning capacity value should be discounted by at least 1:15% to take account of the restricted mobility of the share. (Fair Value 9.2.(5)), Guidelines for valuation of equity shares of Companies and Net Assets of Branches Issued by the Department of Economic Affairs Investment Division vide F No S II(21 )CCI(11 )90 dated 13.7.90
Valuation Professionals Insight
36
Pre-IPO Studies, USA
30%-60%
Cost of going public, USA
12.20% $1-10MM 21.20% Upto $1MM
Option studies 8.20%-26.30% (1 Year) 19.10%-65.80% (5 Years)
Varies based on volatility assumptions. Upper boundary listed here.
Analytical approaches
17.60% 14.40%-28.13%
10.40% 9.85%-26.47%
Quantitative approaches
Mercer QMDM model, Useful as sanity checks
Discount for Lack of Control or Control Premium According to Companies Act, 2013, certain matters require an ordinary resolution of shareholders while some require a special resolution. In addition, the power to appoint a director to the Board or the ability to control the Board through these appointments will impact investment, financing and operating decisions. These thresholds will determine the varying degrees of control. In the case of other entities, it can be statutorily determined or by the governing byelaws.
DLOC is determined primarily through control premiums8 offered during takeover or tender offers. A July 2017 study by Ernst & Young LLP (‘EY’) covering 303 open offers between FY 2003 and FY 2017 found the average of the median premia to be 31% and by other metrics in the range of 38-47%9. This is in line with the premiums reported by Mergerstat Review in the
8 RICS terms this Market Participant Acquisition Premiums or MPAPs. 9 Retrieved from https://www.ey.com/Publication/vwLUAssets/ey-control-premium-in-india/$FILE/ey-control-premium-in-india.pdf on 31st December 2018.
Levels of Value
37
US, though the EY study is shorter compared in length. However, this range should be used with a high degree of caution. The numbers vary widely from year-to-year and from industry to industry and depend largely on the period of comparison of prices (5 days, 2 weeks, 26 weeks etc). The EY study observes that “There was a significant degree of variability in the overall premiums as well as within each year.” and that “There was strong negative linear correlation between control premiums and movement in the equity markets (BSE Sensex movement being used as a proxy). Control premiums came down with rising markets and vice-versa.”
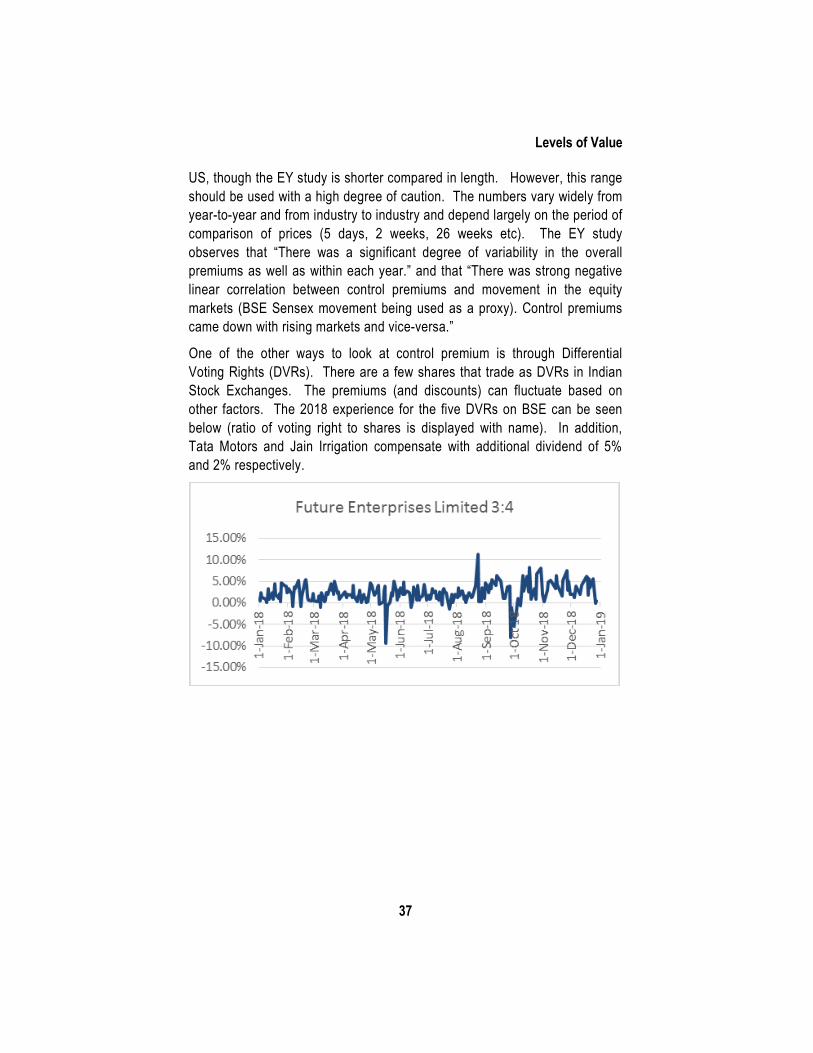
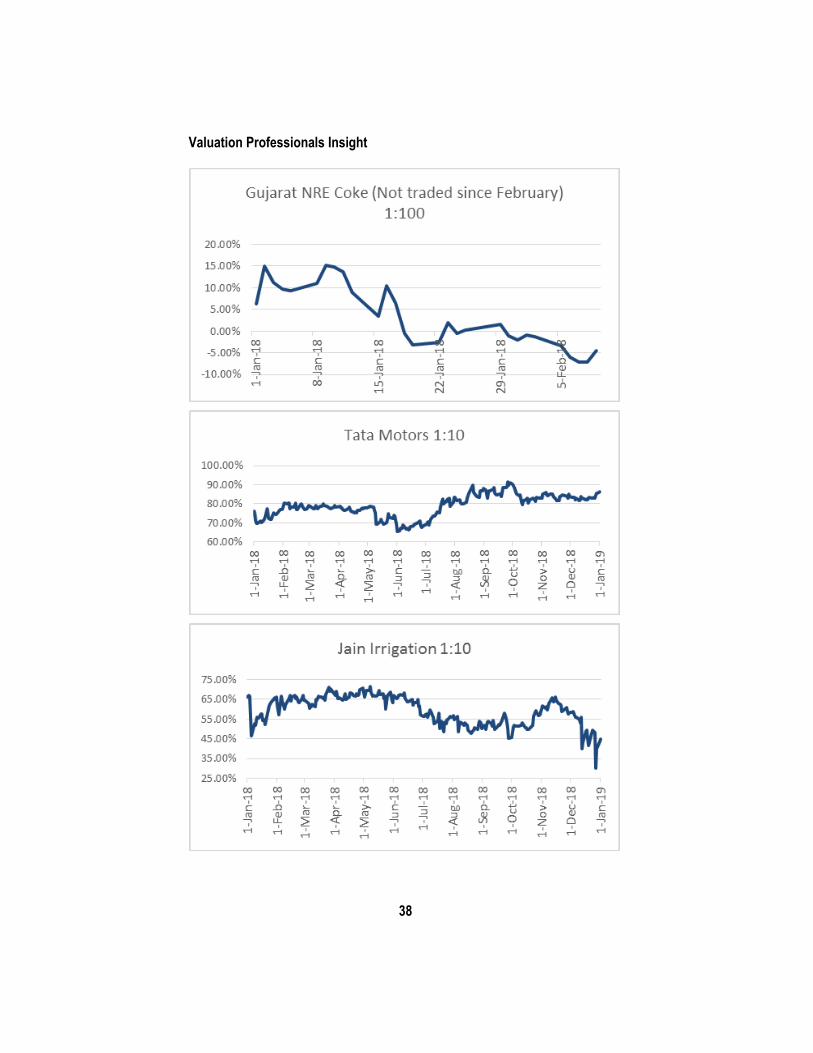
One of the other ways to look at control premium is through Differential Voting Rights (DVRs). There are a few shares that trade as DVRs in Indian Stock Exchanges. The premiums (and discounts) can fluctuate based on other factors. The 2018 experience for the five DVRs on BSE can be seen below (ratio of voting right to shares is displayed with name). In addition, Tata Motors and Jain Irrigation compensate with additional dividend of 5% and 2% respectively.
Valuation Professionals Insight
38
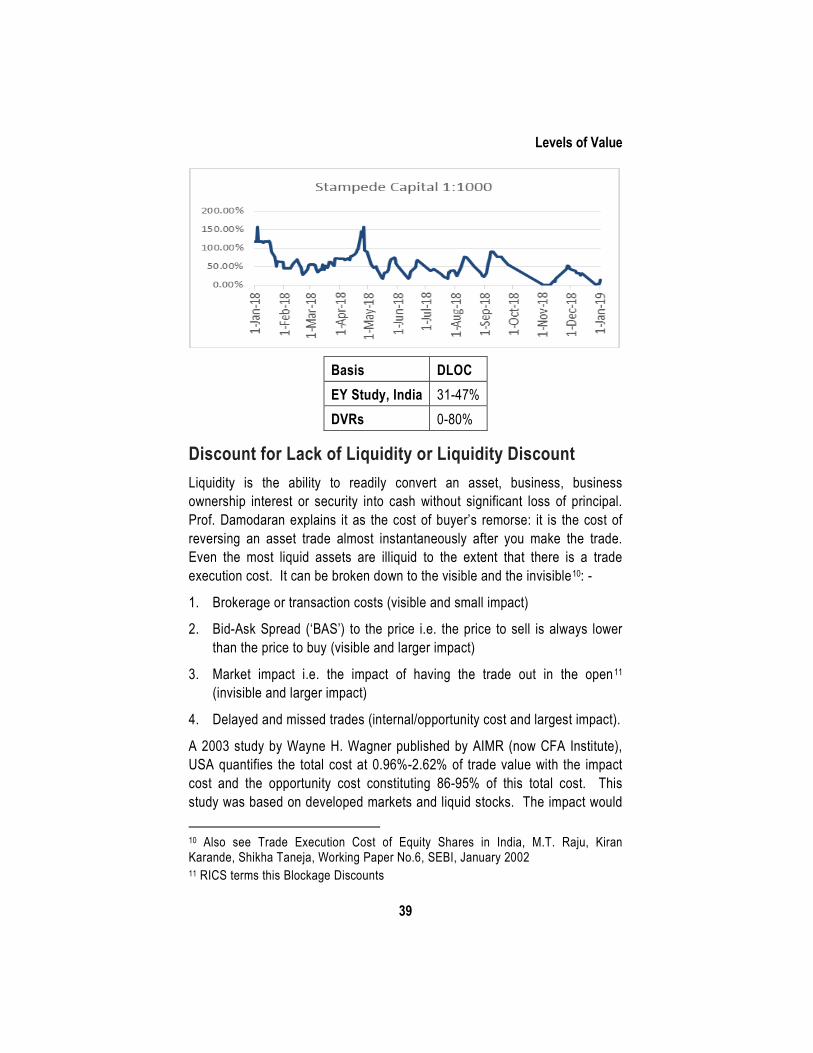
Levels of Value
39
Basis DLOC EY Study, India 31-47% DVRs 0-80%
Discount for Lack of Liquidity or Liquidity Discount Liquidity is the ability to readily convert an asset, business, business ownership interest or security into cash without significant loss of principal. Prof. Damodaran explains it as the cost of buyer’s remorse: it is the cost of reversing an asset trade almost instantaneously after you make the trade. Even the most liquid assets are illiquid to the extent that there is a trade execution cost. It can be broken down to the visible and the invisible10: -
1. Brokerage or transaction costs (visible and small impact)
2. Bid-Ask Spread (‘BAS’) to the price i.e. the price to sell is always lower than the price to buy (visible and larger impact)
3. Market impact i.e. the impact of having the trade out in the open11 (invisible and larger impact)
4. Delayed and missed trades (internal/opportunity cost and largest impact).
A 2003 study by Wayne H. Wagner published by AIMR (now CFA Institute), USA quantifies the total cost at 0.96%-2.62% of trade value with the impact cost and the opportunity cost constituting 86-95% of this total cost. This study was based on developed markets and liquid stocks. The impact would 10 Also see Trade Execution Cost of Equity Shares in India, M.T. Raju, Kiran Karande, Shikha Taneja, Working Paper No.6, SEBI, January 2002 11 RICS terms this Blockage Discounts
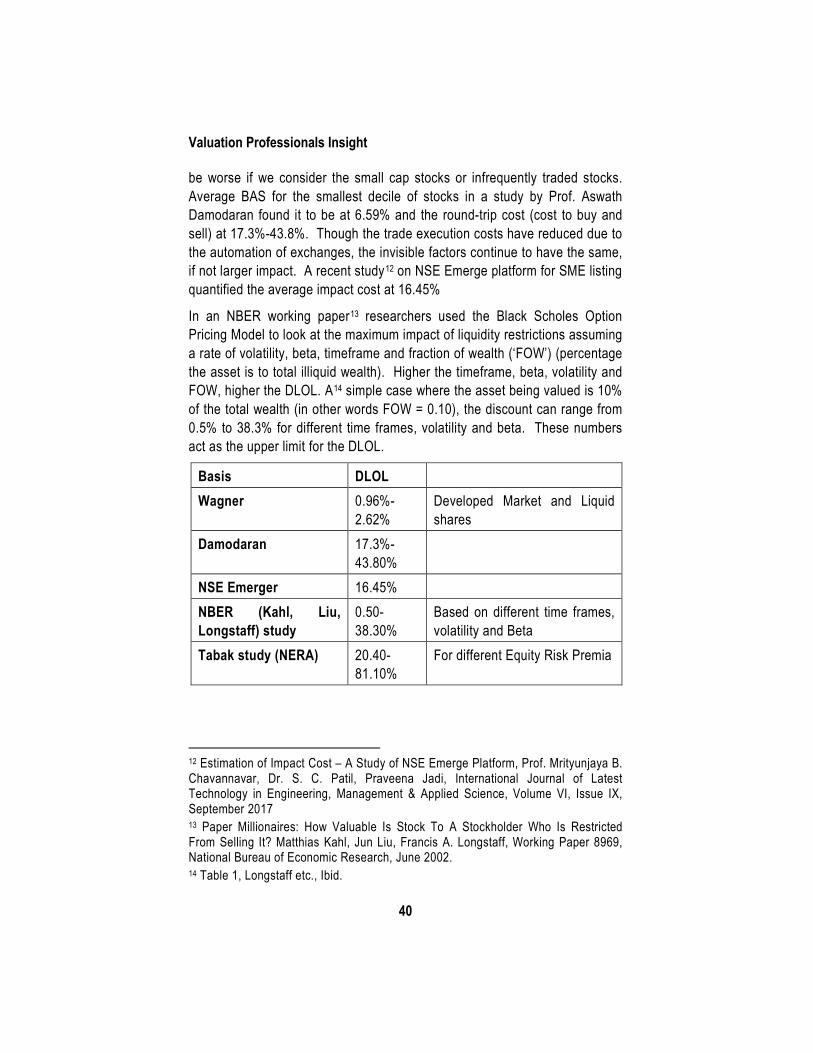
Valuation Professionals Insight
40
be worse if we consider the small cap stocks or infrequently traded stocks. Average BAS for the smallest decile of stocks in a study by Prof. Aswath Damodaran found it to be at 6.59% and the round-trip cost (cost to buy and sell) at 17.3%-43.8%. Though the trade execution costs have reduced due to the automation of exchanges, the invisible factors continue to have the same, if not larger impact. A recent study12 on NSE Emerge platform for SME listing quantified the average impact cost at 16.45%
In an NBER working paper13 researchers used the Black Scholes Option Pricing Model to look at the maximum impact of liquidity restrictions assuming a rate of volatility, beta, timeframe and fraction of wealth (‘FOW’) (percentage the asset is to total illiquid wealth). Higher the timeframe, beta, volatility and FOW, higher the DLOL. A14 simple case where the asset being valued is 10% of the total wealth (in other words FOW = 0.10), the discount can range from 0.5% to 38.3% for different time frames, volatility and beta. These numbers act as the upper limit for the DLOL.
Basis DLOL Wagner 0.96%-
2.62% Developed Market and Liquid shares
Damodaran 17.3%-43.80%
NSE Emerger 16.45% NBER (Kahl, Liu, Longstaff) study
0.50-38.30%
Based on different time frames, volatility and Beta
Tabak study (NERA) 20.40-81.10%
For different Equity Risk Premia
12 Estimation of Impact Cost – A Study of NSE Emerge Platform, Prof. Mrityunjaya B. Chavannavar, Dr. S. C. Patil, Praveena Jadi, International Journal of Latest Technology in Engineering, Management & Applied Science, Volume VI, Issue IX, September 2017 13 Paper Millionaires: How Valuable Is Stock To A Stockholder Who Is Restricted From Selling It? Matthias Kahl, Jun Liu, Francis A. Longstaff, Working Paper 8969, National Bureau of Economic Research, June 2002. 14 Table 1, Longstaff etc., Ibid.
Levels of Value
41
Synergy effects Synergy sounds like magic to valuers rooted in numbers. It is the creation of one plus one equaling to three, increase in the value of the combined entity by bringing together two entities. Read Warren Buffett describing in his folksy style the impact of synergies on acquisition using a fairy tale analogy
“Many managers are apparently over exposed in impressionable childhood years to the story in which the imprisoned handsome prince is released from the toad’s body by a kiss from the beautiful princess. Consequently, they are certain that the managerial kiss will do wonders for the profitability of the target company.
Such optimism is essential. Absent that rosy view, why else should the shareholders of company A want to own an interest in B at a takeover cost that is two times the market price they’d pay if they made direct purchases on their own.
In other words, investors can always buy toads at the going price for toads. If investors instead bankroll princesses who wish to pay double for the served many kisses, those kisses better pack some real dynamite. We’ve observed many kisses, but very few miracles. Nevertheless, many managerial princesses remain serenely confident about the future potency of their kisses even after their corporate backyards are knee-deep in unresponsive toads” – Warren Buffett, Letter to the Shareholders (1981), February 26, 1982.
Before looking at the reasons for the supposed cynicism by valuers in considering synergies, let us look at potential sources of synergy. Synergies may arise in any of the visible components of FCF (operating profit after tax, non-cash deductions, Net working capital, or capital expenditure) or WACC.
1. Revenue synergies – arising from better pricing, cross-selling, marketing or selling similar products, gaining access to new markets or customer segments, sharing distribution channels, reduction or elimination of competition
2. Cost synergies – Reduction of costs of employees, administrative or factory overheads, elimination of excess facilities, increase in purchasing power
3. Financial synergies – tax strategies, debt capacity, cashflows with less than perfect correlation
Valuation Professionals Insight
42
Revenue synergies tend to play out in the product markets and are subject to the market forces beyond the control of the firm. Hence, it is the least predictable and reliable of the three. Under cost synergies, cost reduction strategies are under the control of the combined entity and hence, the most reliable. In addition, these are recurring in nature as are any economies of scale benefits. Elimination of excess facilities and similar asset reduction strategies have a high degree of reliability but are one-time in nature. These are buyer specific synergies and hence, valued as such.
Under financial synergies, tax strategies are easier to understand and harder to realize considering the limitations imposed on carry forward losses and change in ownership. Similarly, debt capacity synergies are easier to understand in that they reduce the cost of borrowing or increase the ability to raise debt. However, quantifying this reduced cost of borrowing is not necessarily a synergy. If the individual firms are able to optimize their debt equity ratios on a stand-alone basis and achieve the same result, this is not a synergy. When the synergy is the result of better borrowing power due to a shift in the optimum debt capacity needed to lower WACC, this can be quantified as a synergy. Typically, this result is achieved through diversification or combining two entities with less than perfectly correlated cashflows to achieve a more stable total cashflow.
Synergies may also be in the form of real options15.
15 Applied Mergers & Acquisitions, Robert F. Bruner, Wiley (2004)
Levels of Value
43
Valuation of synergies in the form of real options should take the approach of valuing other real options available with the transaction.
Summary It is often repeated that valuation is both an art and a science. Which of its aspects is a science or an art is sometimes not clear and in mixing up these two, the valuer makes unforgivable errors. The aspects of building a discount rate and using cashflows approach the science spectrum while the application of the right range of discounts or premiums for marketability, illiquidity, control or synergies are closer to the art end of the spectrum involving a lot of judgement on the part of the valuer. The object of the above discussion was to enlighten the valuer to the best practices available in each of these areas and to assist in applying the professional judgement in the right zones.
Chapter 5
Effect of Due Diligence on Valuation – A Practical Perspective
Executive summary Valuation is not just about numbers. You have to be clear about the organization's 'culture' that would lead to the numbers. This is truer in the case of mergers and acquisitions. A valuation expert has to do a proper due diligence especially in the context of a history of failed mergers.
XXX
Everyday acquisitions and mergers are happening all around us. N R Narayana Murthy, Chief Mentor, Infosys famously said, “making an acquisition is like falling in love; you can’t know when and how it will happen.” In this backdrop, due diligence is “finding out how much the bride has been dressed up!”
First, we must know reasons why mergers fail since a majority of the mergers fail to achieve what were its stated objectives!
‘Clash of culture tops’ the list and is extremely critical for a successful merger. It is the people who make up the organization and not the other way around. Thus, the culture in each organization which has been cobbled together by the people, may not meet each other’s expectations when two organizations become one. It is like a marriage and needs a significant amount of preparedness and willingness to adapt to each other. Failure to integrate such diverse cultures lead to crashes.
Many times, the euphoria for the acquisition leads to significant over pricing. This leads to the cost not being justified in the math of acquisition. Similarly, many times, acquisitions lead to leveraging beyond the ability of the acquirer and may be based on over-optimistic plans resulting in a financial crunch on the combined entity in the post-acquisition period.
At times, it is the poor business fit, which hits the merger and the business case for the acquisition or consolidation has been justified without adequate application of mind. Letting the heart lead the decision could lead to
Effect of Due Diligence on Valuation – A Practical Perspective
45
disastrous consequences. Sometimes, it may merely be a case of matters beyond the control of the acquirer such as regulatory delays, which may lead to its downfall. Regulatory delays could be due to competition commission requirements of permissions for the merger, other regulators such as TRAI, having a say on the decision and so on. The originally contemplated business case may be obviated by such delays resulting in the plan becoming infructuous.
Due diligence in the context of a merger or acquisition is not merely a financial audit but an assessment of the benefits and problems of the proposed acquisition by inquiring into all relevant aspects of the past, present, and future of the business to be acquired merged. It is usual for such due diligence to encompass technical or business diligence, financial and legal diligence.
From a valuation perspective, due diligence focuses on potential overvalued assets, under-recorded liabilities, quality of management, tax position and structure and its impact to the future, the robustness of the projected cash flows, and all other matters of significant interest to the acquirer which mainly are the value drivers.
There are several examples of hidden liabilities like show cause notices received which are yet to be translated into demands, letters of comforts issued to banks, which is not disclosed in the financial statements, product and other liabilities arising from past transactions. Then there are tax liabilities, agreement for buyback securities, environmental problems, and claims or unfunded gratuity.
The first step from a valuation perspective is to understand the basis of valuation being contemplated in the transaction as the due diligence findings or evaluation have a direct bearing on the same. Transactions may be examined by valuation on times revenue, EBIDTA, PAT, unit of asset or performance.
Implications on Valuation Now let’s look at some practical aspects of due diligence and its implications to valuation:
Common business terminologies could vary: When Dai-Ichi bank of Japan merged with Nippon Kangyo to form the then biggest bank in the world called Dai-Ichi Kangyo, the two company executives found even the definition
Valuation Professionals Insight
46
of the word, ‘loan’ differed between the banks! They had to put out a 200-word glossary explaining the meaning of various banking terms before they could even start!
GAAP could present differences: Use of different GAAPs may lead to differences in the way things are shown in the financials and accordingly the understanding will have to be after suitably adjusting for such differences. For instance, Tea replanting expenses were charged off to expenditure under Indian GAAP (non IndAS) while the same in neighboring Sri Lanka were capitalized. Such differences could lead to different ways of looking at EBIDTA / PAT in the two countries. Another case in example is a German company being acquired by a Joint Venture company wherein an Indian, and a UK company are partners. This difference may first and foremost require a comparison of German GAAP vs. UK GAAP vs. Indian GAAP. Of course, these are being largely reduced now with the introduction of IFRS in multiple countries.
Monopolies or Competition related regulations: These are critical, especially in large deals and may delay the process significantly thereby leading to some of the proposed business plans becoming infructuous.
Free flow of foreign exchange: Some countries, including India, have restrictions on free flow of foreign exchange. This restriction may have to be factored in any future transaction.
Employee regulations: Some countries require employee approvals for the merger, and some states may have restrictions on lay off / termination, a revision to their remuneration and benefits, and visa implications on change of control, to name a few.
Localization: Countries have a restriction on local holding requirements, which may vary from merely needing regional directors (and thus additional costs) to necessarily having local partners to even impact on the company’s visa quotas and import-export tariff structures.
Taxation: Most often this is triggered with implications around carrying forward of tax losses, the continuance of tax benefits provided, applicable tax rates due to change in ownership structure, and impact of DTAA on changes of structure.
Legal Costs: Most cross border deals have significant legal costs. There is a need to have clear clarity on this and its impact on the transaction by itself.

Effect of Due Diligence on Valuation – A Practical Perspective
47
Local regulations: Varying regulations, especially in cross border deals may lead to scenarios such as different voting rights, subsidiary’s rights to hold shares in the holding company, exemption from various disclosures, which could lead to a situation of not knowing in full, the implication of the potential transaction.
Key man impact: In many SME deals, the key man makes much difference, and it is he who generates the bulk of the revenue and not necessarily the entity. Thus, the income could move with him, when he sells the entity, and therefore the entity may be at a loss. This may have implications in huge corporates also. For instance, the day a rumor e-mail went around that Steve Jobs had a heart attack, Apple’s stocks tanked by $10 Billion. Similarly, on the day Jamie Dimon was fired from Citibank, its shares fell by $11 Billion. Interestingly on the day he was announced as CEO of Banc One later, its stock went up by $7 Billion.
All of this is to reiterate the statement that valuation, while it is carried out on a spreadsheet needs to consider some of the harsh non-financial realities. The valuation expert needs to go deep into the company and get to know about it as he would know the back of his palm.
Chapter 6
Terminal Value – The Elephant in the Valuation
In 1896, Italian economist Vilfredo Pareto made a famous observation that ~80% of the land (wealth) in Italy was owned by 20% of the population. He then carried out surveys on a variety of other countries and found to his surprise that a similar distribution prevailed. Management gurus in the 20th century coined the term “Pareto Principle” (also known as 80/20 Rule) which states that roughly 80% of the effects come from 20% of the causes. It is an axiom of business management that “80% of sales come from 20% of clients”. The 80/20 Rule has practical applications in economics, business management, sports and in every sphere of life.
In a valuation exercise, intrinsic value of a company/business estimated using the Discounted Cash Flow (DCF) method depicts a similar trait. About 70%-80% of the value of a company/business is derived from “Terminal Value” and the remaining from the explicit forecast period (generally 5-10 years). Terminal value is, by far, the largest single cash flow in any DCF valuation. However, most analysts spend 80% of their efforts in accurately estimating the cash flows for the explicit forecast period. A food for thought – Shouldn’t analysts make more efforts towards precisely estimating the terminal value?
According to the ICAI Valuation Standards 2018, the Discounted Cash Flow (DCF) method values the asset by discounting the cash flows expected to be generated by the asset for the explicit forecast period and also the perpetuity value (or terminal value) in case of assets with indefinite life. The DCF method is one of the most common methods for valuing various assets such as shares, businesses, real estate projects, debt instruments, etc. The important inputs for the DCF method are – cash flows, discount rate, and terminal value.
Terminal Value represents the present value at the end of explicit forecast period of all subsequent cash flows to the end of the life of the asset or into perpetuity (if the asset has an indefinite life). In case of assets having indefinite or very long useful life, it is not practical to project the cash flows for such indefinite or long periods. Therefore, the analyst needs to determine the
Terminal Value – The Elephant in the Valuation
49
terminal value to capture the value of the asset at the end of explicit forecast period.
The commonly used methods for estimating terminal value are:
• Gordon (Constant) Growth Model: The terminal value under this method is computed by dividing the perpetuity maintainable cash flows with the discount rate as reduced by the stable growth rate.
Terminal Valuen = Expected FCFn+1 / (Discount Rate – Expected Growth Rate)
• Exit Multiple: The estimation of terminal value under this method involves application of market-evidence based capitalization factor or market multiple (EV/EBITDA, EV/Sales, etc.) to the perpetuity earnings/income.
• Salvage or Liquidation Value: The terminal value is calculated as the salvage or realizable value less costs to be incurred for disposing such an asset.
As analysts, let’s critically introspect the methods used for estimating terminal value
• Gordon (Constant) Growth Model: The estimation of sustainable growth rate is of great significance because even a minor change in the growth rate can have a large impact on the terminal value. If the expected growth rate tend towards the discount rate, terminal value will approach infinity and then turn negative if expected growth rate exceeds the discount rate. The expected growth rate should be constrained (capped) to be less than or equal to the growth rate of the economy in which the business operates. If the growth rate of the company is more than the growth rate of the economy for infinite period (perpetuity), the business will eventually become larger than the economy. In the long run, high growth rate of a thriving business will tend to approach the growth rate of the economy as the business gets bigger. Similarly, high growth rate of an emerging economy will converge to the global average growth rate sooner than later. A more observable number as a cap on the sustainable growth rate should be “risk free rate” used in the valuation exercise.
• Exit Multiple: The estimation of terminal value using the exit multiple method undercuts the notion of intrinsic value, which is what DCF method is designed to measure. The exit multiple uses some operating metric (revenue, earnings, etc.) in terminal year to get to a terminal
Valuation Professionals Insight
50
value. The multiple that is used to estimate the terminal value comes from looking at what peer group companies are trading in the market. The analyst will be using the “Market Approach” to determine the single largest component of cash flow in the DCF method, which is an “Income Approach”. In other words, the analyst is pricing the asset rather than determining the intrinsic value of the asset.
• Salvage or Liquidation Value: If the business cease to be a going concern (after the explicit forecast period) and the assets can be liquidated individually, we can use the salvage or liquidation value as terminal value. However, liquidation or salvage value is usually lower than the book value and market value. Using this approach to estimate the terminal value (unless required in special cases such as mines or oil fields) will suppress the value of the business.
In a DCF method of valuation, the analyst has to address the “Elephant in the Room” i.e. Terminal Value. The perpetual growth model is a powerful tool to estimate the terminal value, but it is a mathematical honey trap with the growth rate in the denominator acting as bait for analysts. An analyst has to use the sustainable growth rate more judiciously to avoid falling in the valuation trap.
Chapter 7
Discount Cash Flow Method – Key Considerations
The Discounted Cash Flow (“DCF”) method, an application of the Income Approach is arguably one of the most recognized tools to determine the value of a business. This approach estimates value based on the future cash flows of the business and application of a carefully selected discount rate to arrive at the present value. The cash flows typically vary depending on the type and nature of the business. The associated discount rate is usually a function of the riskiness of the estimated cash flows, with higher rates associated with riskier businesses and vice versa. While DCF method is a reliable and acceptable means to ascertain a robust valuation, necessary care has to be taken to ensure that key assumptions are vetted and common pitfalls are avoided. One needs to remember “GIGO”, i.e. Garbage In Garbage Out. The following is a brief list of useful considerations while applying the DCF:
(a) Projections related assumptions:
As the DCF is based on multi- year forecasts, an advantage of this method is its flexibility to capture changes in future cash flows. In doing so the DCF addresses changes a business is expected to undergo over its life cycle. Informed assumptions form the heart of a DCF analysis, but then again unrealistic assumptions inevitability lead to unrealistic valuations. There can be many issues that require probing, a thorough analysis of the historical data and asking the following questions can be useful:
• Depending on the valuation date, is the business on track so as to achieve its revenue and profitability metrics?
• What is the basis for future revenue growth and changes in profitability? How does this compare to the business’ historical performance?
• In high/rapid growth businesses, has the valuation factored in an adequate increase in operating expenses and personnel costs as well as expansionary capital expenditure? For a manufacturing-centric businesses for example, is there enough production capacity to support the projected growth in product volumes?
Valuation Professionals Insight
52
• How do the projected EBITDA margins compare with historical data and with the industry?
• Any anticipated changes in the Industry dynamics?
(b) Weighted Average Cost of Capital (“WACC”)/Discount rate derivation:
The cost of capital is one of the more sensitive valuation variables, where a 1% increase in the cost of capital can often result in more than 10% variation in value. Diligent attention to the following is critical:
o Ensuring that the cost of capital is assumed in a manner consistent with the risks inherent in the forecasts;
o Using mismatched components within the calculation, that is, short-term risk free rates but long-term risk premiums in periods of flight to quality, using the WACC to discount post-tax cash flows;
o Utilisation of book gearing instead of market value gearing;
o Choice of industry comparable for determining the industry riskiness and the gearing;
o WACC vs Cost of Equity;
o Sensibility checks on whether the resulting cost of capital is in line with market return expectations for a given industry.
(c) Net Working Capital:
Working capital estimates can play an important role in the cash flows of a business and will vary based on the industry and type of operations. While estimating the appropriate level of working capital that should be considered in a DCF analysis, factors to be considered include:
o Projections pertaining to individual components of working capital such as accounts receivable, inventory and accounts payable;
o Historical working capital trends for the business vs. comparable company/ industry trends, as applicable.
(d) Capital Expenditure:
Capital expenditures over the projection period can significantly impact the value arising from a DCF analysis, especially in capital intensive businesses. Ensuring that an adequate level of capital expenditure is projected over the
Discount Cash Flow Method – Key Considerations
53
forecast period to support projected growth/expansionary plans is critical. Additionally, it is important to factor an appropriate level of future maintenance capital expenditure into the DCF. Periodic capital expenditures associated with tangible asset replacements/upgrades should also be vetted and included.
(e) Taxes:
The future effective tax rates that should be associated with each year of the forecast period should be determined based on an analysis of the tax position of the business and should ensure that factors such as historical/current business losses, unabsorbed depreciation, special tax incentives etc. are appropriately factored. Furthermore, the tax rate utilized in computing the WACC should also be consistently thought through.
(f) Terminal Value assumptions:
• Terminal value often constitutes around 50% or more of the business value derived from a DCF and is usually calculated based on the ‘Gordon growth formula’ which takes into consideration the cash flows of the last year of the explicit period and grows them by a long-term growth rate. As such an unrealistic assumption associated with the terminal value can profoundly skew the resulting value.
• Increasing this long-term growth has a significant impact on value. If there is an assumption of a growth rate that is higher than the prevalent long-term inflationary estimates, it implies that the business will continue to grow ad infinitum, which has proven to be almost impossible for any company.
• Other issues associated with the terminal value may include the following:
o Inadequate long-term maintenance capital expenditure as well as working capital assumptions relative to the terminal growth rate;
o Large discrepancy between depreciation and capital expenditure levels;
o Lower effective tax rate (tax losses, limited period for tax exemption) which typically will only be applicable for a few years post the discrete period.
Valuation Professionals Insight
54
In conclusion, Valuation using Discounted Cash Flow Method is a complex process due to several layers of underlying assumptions and approximations. Accordingly, corroborative checks and balances play an important role e.g. the resulting implied multiples from a DCF analysis should be corroborated with comparable company market multiples where possible and any discrepancies should be rationalised. Finally, utilising multiple approaches in order to arrive at a logical and defendable value is an important part of minimising inaccuracies.
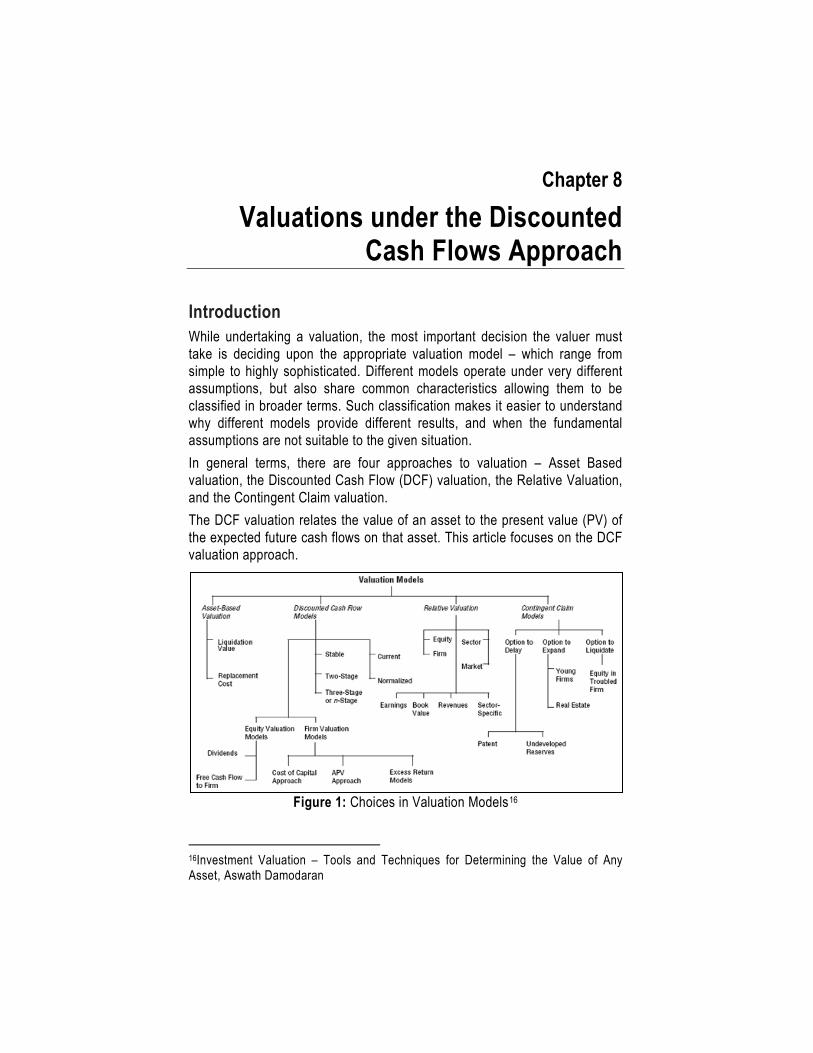
Chapter 8
Valuations under the Discounted Cash Flows Approach
Introduction While undertaking a valuation, the most important decision the valuer must take is deciding upon the appropriate valuation model – which range from simple to highly sophisticated. Different models operate under very different assumptions, but also share common characteristics allowing them to be classified in broader terms. Such classification makes it easier to understand why different models provide different results, and when the fundamental assumptions are not suitable to the given situation. In general terms, there are four approaches to valuation – Asset Based valuation, the Discounted Cash Flow (DCF) valuation, the Relative Valuation, and the Contingent Claim valuation. The DCF valuation relates the value of an asset to the present value (PV) of the expected future cash flows on that asset. This article focuses on the DCF valuation approach.
Figure 1: Choices in Valuation Models16
16Investment Valuation – Tools and Techniques for Determining the Value of Any Asset, Aswath Damodaran
Valuation Professionals Insight
56
In a DCF valuation, the value of an asset is the PV of the expected cash flows of the asset, discounted back at a rate that reflects the riskiness of these cash flows.
In DCF valuation, we begin with a simple proposition – the value of an asset is not what someone perceives it to be worth, but rather it is a function of the expected cash flows on that asset. Put simply, assets with high and predictable cash flows should have higher values than assets with low and volatile cash flows. The DCF valuation also espouses the idea of ‘time value of money’ – the idea that value reduces over time, that a rupee earned in the future is worth less than a rupee earned today – this is precisely why the cash flows are discounted i.e. adjusted, to account for their loss in value given that their realisation is at a later date.
In a DCF, we try to estimate the intrinsic value of an asset based on its fundamentals – the intrinsic value being, the value that would be attached to the asset by an unbiased valuer, who not only estimates the expected cash flows for the firm correctly, given the information available at the time, and also attaches the right discount rate to value these cash flows.
DCF approaches – FCFE v/s FCFF There are two ways of approaching a DCF valuation – the first is to value just the equity stake in the business, the second to value the entire business, which includes, besides equity, the other stakeholders in the firm (debt holders, preference shareholders etc.). While both approaches discount expected cash flows, the relevant cash flows and discount rates are different under each approach.
The value of equity is obtained by discounting expected cash flows to equity holders (i.e. the residual cash flows after all expenses, reinvestment requirements, tax obligations, interest, and debt repayments have been made) at the cost of equity (i.e. the rate of return expected or required by equity investors in the firm). A firm's cost of equity (Ke) represents the returns the market demands or expects for bearing the risk from ownership of the firm. The traditional methods of determining cost of equity are the dividend capitalization model and the capital asset pricing model (CAPM).
Ke under the Dividend model = 𝐸𝑥𝑝𝑒𝑐𝑡𝑒𝑑 𝐷𝑖𝑣𝑖𝑑𝑒𝑛𝑑
𝑀𝑎𝑟𝑘𝑒𝑡 / 𝐶𝑜𝑠𝑡 𝑃𝑟𝑖𝑐𝑒 𝑜𝑓 𝑆ℎ𝑎𝑟𝑒+ 𝐸𝑥𝑝𝑒𝑐𝑡𝑒𝑑 𝐺𝑟𝑜𝑤𝑡ℎ 𝑖𝑛 𝐷𝑖𝑣𝑖𝑑𝑒𝑛𝑑
Valuations under the Discounted Cash Flows Approach
57
Ke under CAPM = Risk Free Rate of Return (Rf) + Beta (β) X Risk Premium (Rp ± α)
CAPM is usually the preferred model to determine Ke since, unlike the dividend capitalization model, it considers a variety of factors while determine the discounting factor. The country specific risk is considered while selecting the Rf. The risks inherent with the specific business or industry of the firm are reflected in the β applied. The model also accounts for expectations of returns from the market through the risk premium i.e. the additional returns over and above Rf that an investor would expect from the firm. Further, the model even allows for consideration of firm specific risks (α) by allowing adjustments (both upwards and downwards) to the Rp.
The value of the firm is obtained by discounting expected cash flows to the firm (i.e. the residual cash flows after all operating expenses, reinvestment requirements, and tax obligations, but prior to any payments to either debt or equity holders) with the weighted average cost of capital (WACC).
The WACC is the blended cost of the different components of finance deployed by the firm, weighted by their value proportions. In other words, the WACC is the weighted average of the Ke and Kd (cost of debt) – it is important to note that while taking weights of debt and equity, the value of equity considered should not only be the nominal value of equity but overall shareholders’ equity (i.e. share capital and free reserves).
The total value of cash flows available for equity holders is commonly referred to as the Free Cash Flows to Equity (FCFE). An important point to note is that FCFE differs from the dividend discount model since it does not determine the value of cash flows in the hands of the equity holder (dividends), but the value in the hands of equity holders arising out of cash flows earned by the firm – it represents a model where we discount potential dividends rather than actual dividends. The total value of cash flows available to the firm is commonly referred to as the Free Cash Flows to Firm (FCFF).
The difference in FCFF and FCFE arise primarily from cash flows associated with debt – interest payments, principal repayments and refinancing – and other non-equity claims such as preferred dividends. For firms at their desired level of leverage, which finance their capex and working capital needs with such mix of debt and equity and use new debt to finance principal repayment of old debt, FCFF would exceed FCFE.
With consistent assumptions about growth and leverage, we should get the same value for our equity using the firm approach (where we value the firm
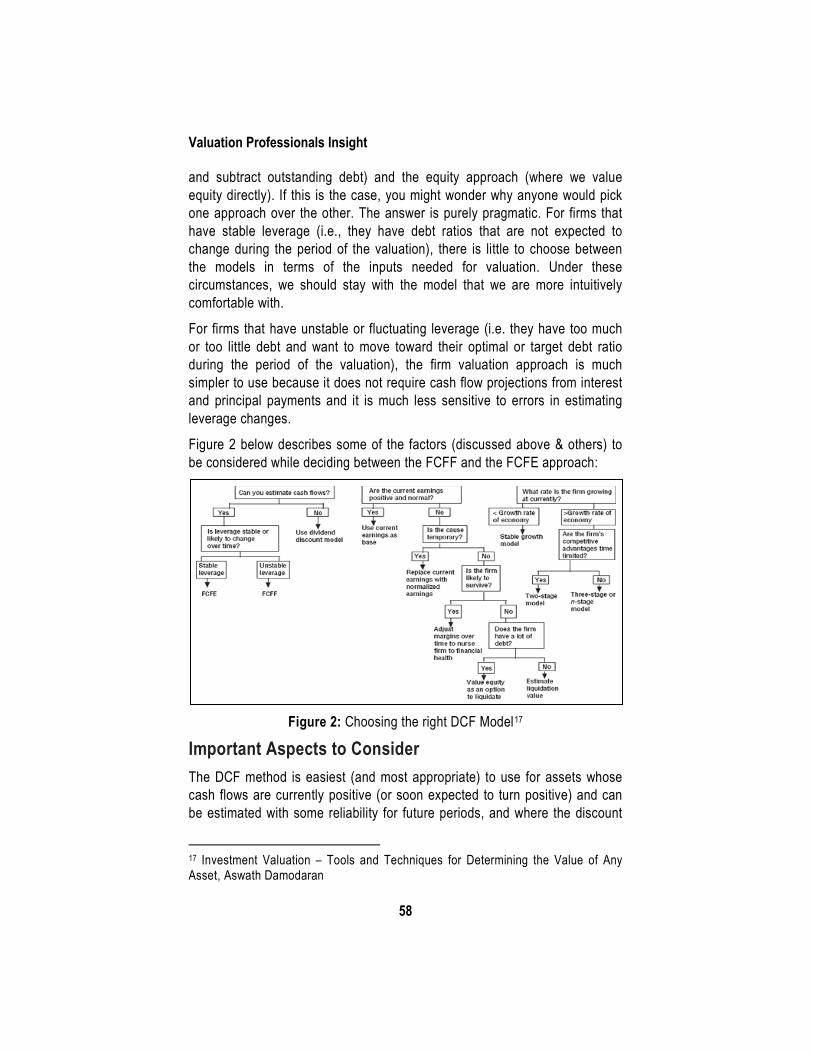
Valuation Professionals Insight
58
and subtract outstanding debt) and the equity approach (where we value equity directly). If this is the case, you might wonder why anyone would pick one approach over the other. The answer is purely pragmatic. For firms that have stable leverage (i.e., they have debt ratios that are not expected to change during the period of the valuation), there is little to choose between the models in terms of the inputs needed for valuation. Under these circumstances, we should stay with the model that we are more intuitively comfortable with.
For firms that have unstable or fluctuating leverage (i.e. they have too much or too little debt and want to move toward their optimal or target debt ratio during the period of the valuation), the firm valuation approach is much simpler to use because it does not require cash flow projections from interest and principal payments and it is much less sensitive to errors in estimating leverage changes.
Figure 2 below describes some of the factors (discussed above & others) to be considered while deciding between the FCFF and the FCFE approach:
Figure 2: Choosing the right DCF Model17
Important Aspects to Consider The DCF method is easiest (and most appropriate) to use for assets whose cash flows are currently positive (or soon expected to turn positive) and can be estimated with some reliability for future periods, and where the discount
17 Investment Valuation – Tools and Techniques for Determining the Value of Any Asset, Aswath Damodaran
Valuations under the Discounted Cash Flows Approach
59
rate (which is a proxy for the risk associated with such asset) can be determined or obtained. The farther we get from this idealized setting, the more difficult DCF valuations become.
A distressed firm which generally has negative and declining revenues expects to lose money for some time in the future. For such firms, estimating cash flows is difficult, since there is a high risk of bankruptcy. For firms expected to fail, DCF does not work very well, since DCF values a firm as a going concern – even if the firm is expected to survive, projections have to be made until the cash flows turn positive, else the DCF would yield a negative value for equity or firm.
Similarly, for many start-ups, due to the long gestation period and rapid cash-burn rates for several years, the DCF approach may not be appropriate, since it would not aide in determining the intrinsic value of the business.
Another important issue to overcome in DCF valuations is estimating the risk of private firms – one solution is to look at the risk of comparable public firms. The other would be to relate the measure of risk to the accounting variables of the private firm which are available. Either way, one should carefully consider whether the finally adopted discount rate is appropriate given the circumstances and facts pertaining to the asset being valued.
Firms that are in cyclical businesses or industries, or that tend follow the economy, face earnings and cash flows that rise during booms and fall during recessions. Cash flows for such firms are usually smoothed out over time, unless the prediction of timing and duration of economic recession and recovery is attempted. It is important to not let economic biases regarding the direction (and strength) the economy is expected to take, taint the estimations of cash flows while valuing such firms. Further, it is important to differentiate whether the trend in cash flows are a response to the vagaries of the economy or due to some other reason that may not be cyclic in nature.
The value under the DCF method would reflect the value of assets that generate cash flows – if a firm has unutilized or idle assets, the value of these assets would not get reflected in the DCF valuation. This also applies to underutilized assets or unutilized patents or licenses, since their value will be understated in the DCF value. This is not an insurmountable issue – the value of assets can also be obtained externally (if such assets are traded on the market) or can be determined by assuming as if they are used optimally or valuing patents using an option pricing model.
Valuation Professionals Insight
60
In the case of firms undergoing restructuring, there are myriad changes to contend with while estimating cash flows. Such firms often sell some of their assets, acquire other assets, change their capital structure, ownership structure, dividend policy, management compensation scheme etc. Such changes make estimation of cash flows difficult and affect the risk associated with the firm. Historical data of such firms would give a misleading picture. However, by ensuring that the expected changes are accurately reflected in the cash flow projections and the discounting rate is adjusted to align with the new financial risk of the firm, a DCF may still be applied. If the firm is involved in an acquisition, any potential synergy needs to be accounted for in the cash flows estimates. While undertaking a DCF valuation, especially a FCFE valuation, due consideration should be given to the difference in the value that would arise based on the consideration of the degree of control that the equity holder has over the firm. The value of equity to an equity holder with controlling stake or significant stake would generally be equal to or close to the proportionate FCFE value. However, for a minority shareholder, the inability to control and influence the decisions and policies of the firm would mean that the value of equity would differ from the proportionate FCFE value. Such ‘control premium’ needs to be kept in mind, especially if the valuation in being undertaken in a situation where control is likely to change hands.
Conclusion The DCF approach is inherently contrarian in the sense that it forces valuers to look for the fundamentals that drive value rather than what market perceptions are. The DCF valuation approach is tailor-made for those who buy into the Warren Buffett adage that what we are buying are not stocks but the underlying businesses. But, in the hands of a sloppy valuer, DCF valuations can be manipulated to generate estimates of value that have no relationship to intrinsic value. A DCF valuation still remains one of the most widely used valuation approaches, but the benefits are often more nuanced that many are willing to admit. DCF valuations also need substantially more information to value a company that other approaches, since we have to estimate cash flows, growth rates, and discount rates, terminal cash flows, etc. Such detailed and exhaustive information may not always be forthcoming or be available from reliable sources. However, when done right, a DCF valuation requires the valuer to closely understand the businesses and assets that they are valuing and ask searching questions about the sustainability of cash flows and risk and generally yields a good estimate of the intrinsic value of a business.
Chapter 9
Handling Negative Working Capital in the DCF Model
Executive summary A key component of the DCF model of business valuation is non-cash working capital, its adjustment to arrive at free future maintainable cash flow, and finally its discounting to arrive at present value. Are the rules of the game same irrespective of whether either the working capital or the changes in working capital are positive or negative?
One of the critical components of the discounted cash flow model of business valuation is ‘non-cash working capital’ and its adjustment to arrive at the free future maintainable cash flows.
The idea behind this is simple. Business projections assume that these investments into additional working capital are required to maintain the ongoing running of the business. Only then the expected cash flows will happen. Consequently, these are not free cash available from the business which the stakeholders can withdraw. Hence they cannot be considered in determining the present value of such cash flows as the value of the business to the stakeholders.
Thus, conceptually, the net working capital is considered as a necessary investment and accordingly, free cash flows are determined after deducting the changes in net non-cash working capital. Discounting in such DCF valuation models is done at the WACC, which is the weighted average cost of capital, which necessarily is the expected return from the given business considering the risks attached to such business.
Non-Cash Working Capital An ongoing business requires investments not only into capital items for the generation of business income but also needs for amounts blocked in trade receivables and inventories, partly offset by the credit enjoyed from trade payables. This amount is referred to as Non-cash working capital.
Valuation Professionals Insight
62
In reckoning for the DCF computation, the non-cash working capital the following merit attention.
• Cash is parked into gilt securities or in cash and cash equivalents, and thus either do not produce any returns or are at invested returns closer at risk-free rates.
• Accordingly, the business risks do not attach to these amounts, and hence these should not be discounted at the business risk-adjusted WACC rates.
• This cash is considered as freely available for the owners of the business.
This being so, it is however possible that the business model may require a significant amount of cash to be held in the business for the day-to-day operations. In such cases, it would be appropriate to consider such requirements also as part of the net working capital needs in the computation of discounted cash flows, as these amounts are a necessary component for the business operations in the given business model.
In general, commercial business models (where the business is growing) lead to a situation of the non-cash working capital being a positive number. However, it is possible that either the non-cash working capital or changes in non-cash working capital are negative in a given period or in the business model itself. We will soon look up some examples.
The more often seen scenario in this is where the changes in non-cash working capital are 'negative' in certain years based on say, efficiencies being squeezed out of the inventory carrying position or the debt collection cycle. Such efficiency drives could lead to cash flow generation from working capital for either a short period or for a few years at a stretch. Needless to mention, this cannot be considered as a source of cash flows for long periods. This source, at best, could be for a short period. Similarly, at times, when the company considers significant CapEx and where for short periods the supplier credit gets skewed, these can happen. This, again, cannot be a source for cash flows in the long run.
Industries Having Negative Non-Cash Working Capital There are some industries and business models, where non-cash working capital position is a regular phenomena. Essentially this means that the credit offered by vendors is significantly higher compared to the inventory levels and the receivable cycles. Such scenarios arise in the case of restaurant
Handling Negative Working Capital in the DCF Model
63
business, where the suppliers offer credit, but the sales are largely for cash and inventory levels are low with most items held in stock only for a day or two.
Another example is the business of stock exchanges, where business partners are required to maintain a cash deposit with the Exchange for operations. As the services grow, the size of such cash deposit also increases, proportionately. At the same time, all costs recoverable by the exchange are in the ordinary course adjusted from the amounts payable and hence, minimal current assets are required to be maintained by this business.
A third example of negative working capital position is the operation of petrol pumps (in countries where government companies do not control petroleum supplies). The oil companies typically allow a 30 – 60 day credit period while the petrol pump sells fuel for immediate realization through cash or credit card.
In a business model leading to a negative working capital position, this cannot be considered as free cash flow to the owners as there is a liability to repay these amounts in due course. Thus, these amounts have to be repaid, and at best can be invested at the risk-free rate of return.
In such cases, it is in the best interest of the business to renegotiate with the vendor and get some discount instead of the credit offered. This would enable the company to have better profitability and valuation. In business scenarios, this is more likely to happen, where feasible.
Impact in DCF Valuation One of the underlying assumptions in the DCF model is that the net working capital is invested in the business and the cash flows adjusting for this is only available as free cash flow for the owners. Thus, the free cash flows arising to the owners in the future years is discounted at the business’s risk rate to arrive at the present value of the business.
This assumption may continue to be appropriate even when for a few years due to efficiencies being squeezed out or when expansions are planned, and the net working capital adjustment is negative (releasing cash to the owners).
However, when the business model itself leads to negative non-cash working capital, this assumption is not appropriate. The said additional cash is not freely available to the owners, given the need for the business to ensure that the money is protected for a “certain payout” to be effected in the future. The payout of the cash is a specific future event should be invested only in risk-
Valuation Professionals Insight
64
free return to protect the payment and is not free cash available for the owners.
To reiterate, when the non-cash working capital is positive, it is considered that the working capital liability recognized therein can be met from the current assets reasonably, and only the net working capital is an investment into the business. There is adequate positive working capital to meet the liability from that itself. While, where the working capital liability exceeds the working capital asset, its settlement has to be funded by a much higher risk applicable to non-current assets.
Illustration: A simple illustration to consider the implication.
The risk-free rate is 6% per annum, and WACC is 15%. If sale and purchase as under are made today both for cash terms, the value would be the net realization as under:
The base case of sale and purchase is made for cash with Sale value being Rs 110/- and the purchase being Rs 100/- leading to a net realization of Rs 10/-
If the sale happens with one-month credit term for both sales and purchase, the net amount of Rs.10 is to be adjusted for time value of money and at 15% discounting, the present value would be Rs.9.88.
However, if the sale happens for cash but the purchase is with a credit term of 1 month, the business gets a cash realization of Rs.110/- today, and the business has to pay the creditor a sum of Rs.100/- at the end of one month. In such a scenario, the owner cannot dispose of the amount of Rs.110/- at his convenience and would have to set aside such a sum as to be able to realize Rs.100/- by the end of month 1 to be able to pay the vendor for his dues. As this is a guaranteed payout, the business cannot free this money for the owners but will have to invest in a risk-free manner to be able to meet the liability, which would work out to Rs.99.50. Thus, the free cash flow can be considered only as Rs.110 – Rs.99.50 = Rs.10.50. As against this, if the cash flows are discounted at the business’s risk rate of 15%, then the free cash flow would work out to Rs.110 – Rs.98.77 = Rs.11.23.
How to Consider In DCF Valuation – Practical Insights The above illustration gives a simplistic view of the implication of negative non- cash working capital in the determination of DCF valuation.
Handling Negative Working Capital in the DCF Model
65
From a practical perspective of addressing this, two options could be considered:
One, the DCF valuation is calculated in the same manner, but from that, the net non-cash current liability as at the end of the specific period discounted to today’s present value at the risk-free rate be reduced from the DCF value computed to provide the estimate of the equity valuation. Two, the non-cash current asset position, if it is negative, be ignored and in consideration of the benefit enjoyed by the entity with the extra credit, the interest income earned from such amounts be included in the EBIDTA. In the ordinary course, such interest income from cash surpluses would have been reduced from the EBIDTA considered in DCF valuation, which can be modified for this purpose.
The foregoing gives you some insight into how to handle valuation situations that involve negative working capital or of a case where consistent increase in working capital is negative.
Chapter 10
Cash Flow Projections – How important it is for Valuation through
DCF? It is widely accepted that Discounted Cash Flow Method (DCF) is one of the important and significantly used method under Income approach. However, in valuation exercise carried using DCF method, a significant time is spent on determining the discount rate, growth rate for terminal value while the cash flow projections are given less priority and are generally an extrapolation of historical data. However, someone who has worked to derive intrinsic value of an entity would understand that future cash flows play most significant part in determining the value.
Prof Damodaran in one of his blog states that in both academia and practice, far more attention is paid to discount rate than to the estimation of cash flow. In all the theory used in discounted cash flow developed by academics over last 5-60 years, 90-95% or perhaps even more of the papers, research done on discounted cash valuation is about the D that is discount rate whether you look at CAPM, Arbitrage pricing model or, Modern portfolio theory model etc. While in academia, this focus can be traced to the fact that it is far easier to build theory and general models for discount rate than cash flow, in practice, this focus can be traced to:
− An over estimation of the impact of discount rates on the value
− A need for control
While a significant time and energy is spent on Discount rate, considerably less time is devoted to Cash flow determination. Practitioners many a time spend more than 50-60% of time in determining discount rate. As per Prof Damodaran, Cost of Capital of 80% of Global companies (As on January 2016) is between 5.96% (10th Percentile) to 11.83% (90th percentile) while median is 8.76%. Using cost of capital which is slightly plus or minus of these ranges may not impact valuation significantly however in comparison, carrying out valuation with loosely prepared projected cash flow can lead to serious valuation diversion as in DCF value is determined by brining future cash flow to the present time.
Cash Flow Projections – How important it is for Valuation through DCF?
67
Considering above, a natural question then arises is how come Cash flow projections is not given its due importance in Valuation process?
Before we further delve into this aspect it is fair to look at some guidance from ICAI Valuations Standards (IVS) issued by Institute of Chartered Accountant of India (ICAI). ICAI Valuation Standard 103 – Valuation Approaches and Methods, defined following as important inputs for determining value of an asset through Discounted Cash Flow (DCF) Method:
− Cash Flows
− Discount Rate; and
− Terminal Value
ICAI Valuation Standard 103 further states that while generally, historical financial statements are used as the base for preparation of projections, if in future, changes in circumstances are anticipated the assumptions underlying the projections shall reflect differences on account of such differences vis-à-vis the historical financial statements. Further, A valuer shall by employing procedures such as ratio analysis, trend analysis to determine historical trends, gather necessary information to assess risks inherent in the achievability of the projections.
While cash flow determination involves making various assumptions specially with regard to revenue, COGs, Expenses etc. each of these elements needs to be analyzed in depth to determine the best possible set of cash flow number. The process becomes significant in case of startup and younger entities where there is no historical basis to fall back upon as in such case the projections are primarily dependent upon the assessment of promoters who naturally have positive bias on the business performance.
Further, as per “ICAI Valuation Standard 201 – Scope of Work, Analyses and Evaluation” issued by ICAI RVO, while valuation shall not be constituted as an audit or review in accordance with the auditing standards applicable in India, accounting/ financial/ commercial/ legal/ tax/ environmental due diligence or forensic/investigation services and shall not include verification or validation work however a valuer is expected to get understanding of Business of the entity and financial projections on which valuation is based.
ICAI Valuation Standards have clearly reflected the intent that while a firm under valuation exercise is free to develop and provide cash flow and financials projection however valuer is expected to vet the same to ensure sanity.
Valuation Professionals Insight
68
DCF values a company by determining the present value of its future cash flow. In addition to cash flow from operations, reinvestment of funds in capital expenditure and non-cash working capital are equally important. While historical numbers can be good base to start however the future cash flows need to be determined keeping in mind the business dynamics, changing circumstance in future.
James Montier, in his article “The Danger of DCF” states that there are no evidences that Analysts are capable of forecasting either short-term of long-term growth. An analysis done by one of his of team-mate reflected that in the US, the average 24-month forecast error is 93%, and the average 12-month forecast error is 47% over the period 2000-2006. Just in case you think this is merely the result of the recession in the early part of this decade, it isn’t. excluding those years makes essentially no difference at all. The data for Europe is no less disconcerting. The average 24-month forecast error is 95%, and the average 12-month forecast error is 43%. He further goes on to state that, Frankly, forecasts with this scale of error are totally worthless.
While we need not get disheartened by above data and stop using DCF for valuation however this surely raises a serious question that If this is the scale of forecast error in projecting cash flow, then isn’t it the critical area where a valuer should spend his significant time to evaluate.
Needless to mention that while DCF valuation should be taken with pinch of salt, however one must not forget the saying that “Garbage in garbage out” which is equally applicable in the valuation process. If cash flow projections are not done appropriately then final value obtained shall surely be far away from realistic value of the business.
In practice, including a company specific risk premium to account for differences between the forecasted and expected cash flows is generally accepted by valuation professionals. The publications of the American Society of Appraisers (ASA) and the American Institute of Certified Public Accountants (AICPA) suggest in their guides to valuation that company specific risk premium be included in the discount rate as an adjustment for the riskiness of the forecast. These adjustments are qualitative, at best.
So how one deals with this situation? Is there any accurate way to project Cash flow of company? Needless to mention that it is next to impossible to accurately project future earning or cash flow to any company. However, DCF valuation process is one of prevalent method and one needs to carry

Cash Flow Projections – How important it is for Valuation through DCF?
69
out this exercise of determining cash flows to determine value of a business. What is required is to not loosely extend the historical numbers to future and carry out a comprehensive analysis of historical numbers, firm’s business, industry dynamics and carry out certain sanity checks. While cash flows are commonly created by extending historical financials into the future, it is always good that projections are created through more fundamental analysis of perceived future opportunities for the product, firm, its division or industry.
One must keep in mind that cash flow projection for valuation can be done at firm level or equity level depending upon the value we aim to arrive at. It is important to be clear on this at the start so as to avoid any double counting of numbers at later stage. For determining value for Equity using cash flow to firm, popularly known as FCFF (Fee cash flow to firm) can lead to wrong value if appropriate adjustments are not done in cash flow or through debt reduction.
Further it is important to keep the assumptions as simple as possible. The more assumptions or variables we enter into cash flow projections, it become more prone to biases or error e.g. Non- cash working capital investment can be worked out at current assets and current liabilities level or one can try to determine the values for each component of working capital components however in such case, assumptions shall need to be made for each of such components.
There is no dispute that Discounted Cash flow method is most popularly used method under Income approach, however one must critically evaluate the Cash flow projections to determine the correct value.
References: ICAI Valuation standards
• Blog posts (Prof. Ashwath Damodaran)
• Valuation when cash flow forecasts are Biased (Richard S. Ruback, Harvard Business School)
• Dangers of DCF (James Montier, Société General)
Chapter 11
IND AS 113 – Fair Value Measurement
Background Before we deep dive into the Indian Accounting Standard 113 (IND AS 113) on Fair Value Measurement, it is important to note that this standard does not by itself require any specific fair value measurement. Instead, it only provides the necessary framework for fair value measurement in those cases where any other accounting standard requires or permits fair value measurement. The primary role of IND AS 113 is to define fair value, lay down a framework for fair value measurement and also to provide guidance about required disclosures related to fair value measurement.
While the unit of account for a fair value measurement is required always for a particular asset or liability, in practice it could be either a standalone asset or liability or a group of assets or liabilities. For instance, a fair value measurement of a financial instrument would be that of a standalone asset, while the fair value measurement of a cash generating unit would usually be that of a group of assets forming a business. However, in any particular case, whether a standalone asset is to be valued or a group of assets is to be valued would be guided by the originating accounting standard that required or permitted such fair value measurement in the first place.
IND AS 113 defines fair value as ‘the price that would be received to sell an asset or paid to transfer a liability in an orderly transaction between market participants at the measurement date’. This definition revolves around an exit price mechanism as at the measurement date.
One of the key principles underlying fair value measurement under IND AS 113 is the market participant concept. The standard requires that the assumptions used in the fair value measurement must reflect the assumptions that market participants would use in such fair value measurement. This concept inherently assumes that market participants would usually act in their best economic interest. Such fair value measurement based on market participant assumptions would ensure that fair
IND AS 113 – Fair Value Measurement
71
values are not vitiated by entity specific intentions and instead reflect a broader market perspective.
The ‘highest and best use’ concept is another important principle introduced by IND AS 113. This mandates that a fair value measurement must assume the highest and best use of the assets by market participants, irrespective of its present actual use while also considering its physical, legal and financial feasibility. However, this principle is to be applied primarily for valuation of non-financial assets.
Apart from all the above key aspects, the main focus on IND AS 113 lies in guidance on valuation techniques and use of relevant inputs for valuations.
Valuation Techniques The valuation techniques can be broadly classified into market approach, cost approach and income approach.
• Market Approach
The market approach uses prices and other relevant information generated by market transactions involving identical or comparable assets, liabilities or a group of assets and liabilities, such as a business. Although IND AS 113 by itself does not lay down the specific methods available for use within each valuation approach, based on generally accepted valuation practices in India, the market approach can broadly include valuation methods such as market prices method, comparable companies’ multiples method, comparable transactions’ multiples method and price of recent investments method. Under the market prices method, the instrument’s own quoted prices form a basis for fair value measurement. The comparable companies’ multiples method uses the implied multiples (of earnings / revenues / assets) of quoted comparable companies as the basis for valuation. The comparable transactions’ multiples method uses similar implied multiples from recent transactions / deals / acquisitions in similar sector. The price of recent investment methodology primarily uses the valuation benchmarks based on latest recent rounds of funding / transactions in the subject matter of valuation.
• Cost Approach
The cost approach reflects the amount that would be required currently to replace the service capacity of an asset (akin to a current replacement cost). This can be based on either adjusted historical cost or even replacement cost estimates.
Valuation Professionals Insight
72
• Income Approach
The income approach converts future amounts (e.g. cash flows or income and expenses) to a single current (i.e. discounted) amount. When the income approach is used, the fair value measurement reflects current market expectations about those future amounts. The discounted cash flow method is the most familiar method of valuation under the income approach.
As far as selection of valuation technique to be used in any fair value measurement, there is no one-size-fits-all guidance. Like in any valuation, the choice of valuation techniques and methods would depend on the facts and circumstances of each case including availability of information. In some cases, a single valuation technique will be appropriate, while in some other cases use of multiple valuation techniques may be warranted. While using multiple valuation techniques, it would be also important to consider the deviation in fair values under different techniques and also their range of fair values. Even while using multiple valuation techniques, the valuer might have to arrive at a single conclusion based on use of appropriates weightages and other factors if any.
Since fair value measurements under IND AS 113 are most likely to be a recurring annual / quarterly exercise, it is important to maintain consistency with respect to selection of valuation techniques for the same fair value measurement for each subsequent period, unless a change in circumstances warrants for a change in selection of valuation techniques. In such cases, this may also be construed as a change in accounting estimate.
In certain cases where initial transaction price itself is the fair value at initial recognition, the standard provides for a calibration approach using applicable valuation techniques and inputs at the initial measurement date to calibrate the transaction price, which shall then thereafter be used for valuation techniques and inputs to be considered for the related future recurring fair value measurements.
Valuation Inputs Under each of the above valuation techniques, every fair value measurement would require the use of various inputs and assumptions.
Inputs that are developed using market data, such as publicly available information about actual events or transactions, and that reflect the
IND AS 113 – Fair Value Measurement
73
assumptions that market participants would use when pricing the asset or liability are referred to as ‘observable inputs’.
Inputs for which market data are not available and that are developed using the best information available about the assumptions that market participants would use when pricing the asset or liability are referred to as ‘unobservable inputs’.
As per IND AS 113, an entity shall use valuation techniques that are appropriate in the circumstances and for which sufficient data are available to measure fair value, maximising the use of relevant observable inputs and minimising the use of unobservable inputs. For this purpose, IND AS 113 lays down a fair value hierarchy that categorizes such inputs into three levels viz. Level 1, Level 2 and Level 3. It is important to note that these levels are for valuation inputs or assumptions, and not directly for selection of valuation techniques or methods. As per such fair value hierarchy, the highest priority of usage is to be given to Level 1 inputs wherever available, thereafter followed by Level 2 inputs and Level 3 inputs respectively.
It is also pertinent to note that most times a single fair value measurement may require multiple inputs which form part of different levels of such hierarchy. In such case, the fair value measurement is categorized to be in its entirety in the same level of the fair value hierarchy as the lowest level input that is significant to the entire fair value measurement.
The following are broad principles for each level of fair value hierarchy as laid down under IND AS 113:
• Level 1 Inputs Level 1 inputs are quoted prices in active markets for identical assets at the measurement date. A quoted price in an active market provides the most reliable evidence of fair value and must be usually used without adjustment to measure fair value whenever available. The standard also specifies that adjustments, if necessary, are permitted only in certain specified circumstances.
• Level 2 Inputs
Level 2 inputs are inputs other than the above quoted prices that are observable for the asset either directly or indirectly. This generally includes quoted prices for similar assets in active markets, quoted prices for identical or similar assets in markets that are not active, market-corroborated inputs or other inputs that are observable such as interest
Valuation Professionals Insight
74
rates, credit spreads, etc. While using Level 2 inputs, it is more common to make adjustments for various factors to account for dissimilarities between such comparable or similar assets and the subject asset being valued.
• Level 3 Inputs
Level 3 inputs are unobservable inputs for the asset or liability. However, the standard clearly states that such unobservable inputs are to be used only to the extent that the relevant observable inputs in the earlier levels of hierarchy are not available. A familiar example of Level 3 unobservable input could be the projected cash flows that was developed using the entity’s own data which could not be corroborated using market benchmarks.
As is evident from all of the above, the crux of IND AS 113 lies in the guidance given to prioritize the use of more market corroborated inputs and assumptions to lend more reliability to the fair value measurements.
A resultant outcome of the above is also that the standard lays down detailed disclosure requirements for fair value measurements, including valuation techniques used, applicable level of fair value hierarchy, sensitivity analysis for use of significant unobservable inputs and such other similar requirements.

Chapter 12
Factors of Valuation
This article focuses on:
• How risk free rate differs from one country to another and creates complexity in valuation of multinational company
• How professionals wrongly calculate implied cost of equity
• Right approach to calculate implied cost of equity under 2 models - Residual Income Method and Dividend Distribution Method (see case study)
• Using Microsoft Excel 'What if analysis' to gain implied cost of equity of a listed company
Introduction Paradigm of valuation changes with every small business change. As a valuer you would agree that even a tiny alteration in input can have a massive impact on a valuation. On a negotiation table, crucial conclusions distinguish a good valuer from not so good valuer primarily on rationalization of inputs and validation of process of valuation. A conventional wisdom of valuation is a collective reflection of assumptions and critical thinking. Hence, it becomes imperative for any valuer to corroborate justification of data and postulations.
Two Factors of Valuation Whenever professional receives a valuation engagement, he needs to elect two key factors:
1. Method
2. Valuation Perspective
Method Perspective Discounted Cash Flow Dividend Discount Model Residual Income Model Earnings Growth Model
Enterprise Value or Equity Value
In either of these models, critical input is ‘a discount rate to be used’ to reach
Valuation Professionals Insight
76
a present value of the equity. We use ‘Cost of Equity (ke)’ as a discount factor under Equity Value perspective. Though CAPM is a most celebrated model to estimate ke, the model is criticized as Beta coefficient is not a good estimator of expected risk premium. There are 3 factors that influence ke – 1.Risk free Interest Rate, 2. Equity Risk Premium and 3.Beta Coefficient
Equity Risk Premium may be calculated on the basis of long term historical average. Beta Coefficient on the other hand may be calculated on the basis of more recent historical period. Every intelligent strategy to deliver high average returns ends up delivering high market beta.
Valuation is calculation at a specific point in time and must echo current conditions at valuation date and current expectations of market participants.
Every valuer hypothesizes – efficiency of financial market (i.e. price = intrinsic value) and forecast is not slanted with excessive optimism. However, under unusual market conditions, normalization of input data is necessary.
Enterprise valuation subsumes WACC as a rate of discounting. WACC is calculated using Ke, Kd and market weights of Equity and Debt. Estimation of WACC based on Modigliani Miller Approach hypothesizes zero bankruptcy costs while evidence suggests that even companies rated BBB (investment grade) have a debt beta coefficients persistently greater than zero.
Risk Free Rate Under CAPM, valuation practitioners usually consider risk free rate as an approximation of yields on long term government bonds of the country where company’s headquarter is located. However, in case of multinational companies, this solution may not be practicable. This is because two different companies that compete is same markets on a global basis, which are exposed to the same risks (except different country risks) and use same functional currency (e.g. USD), should always be valued on the basis of same cost of capital regardless of the country where they are headquartered (eg. India, Srilanka or Pakistan) even though yield spreads between their respective government bonds of the two countries are wide [Risk Free Rate on 10 Year Govt. Bond Country wise – India (7.59%), Srilanka (11.50%), Pakistan (13.59%)].
Calculation of Implied Cost of Equity Let us now understand how to calculate implied cost of equity (ke) of a listed company. Once you get the ke of listed company, it can be used as a basis to estimate ke of unlisted company you are valuing after relevant adjustments.
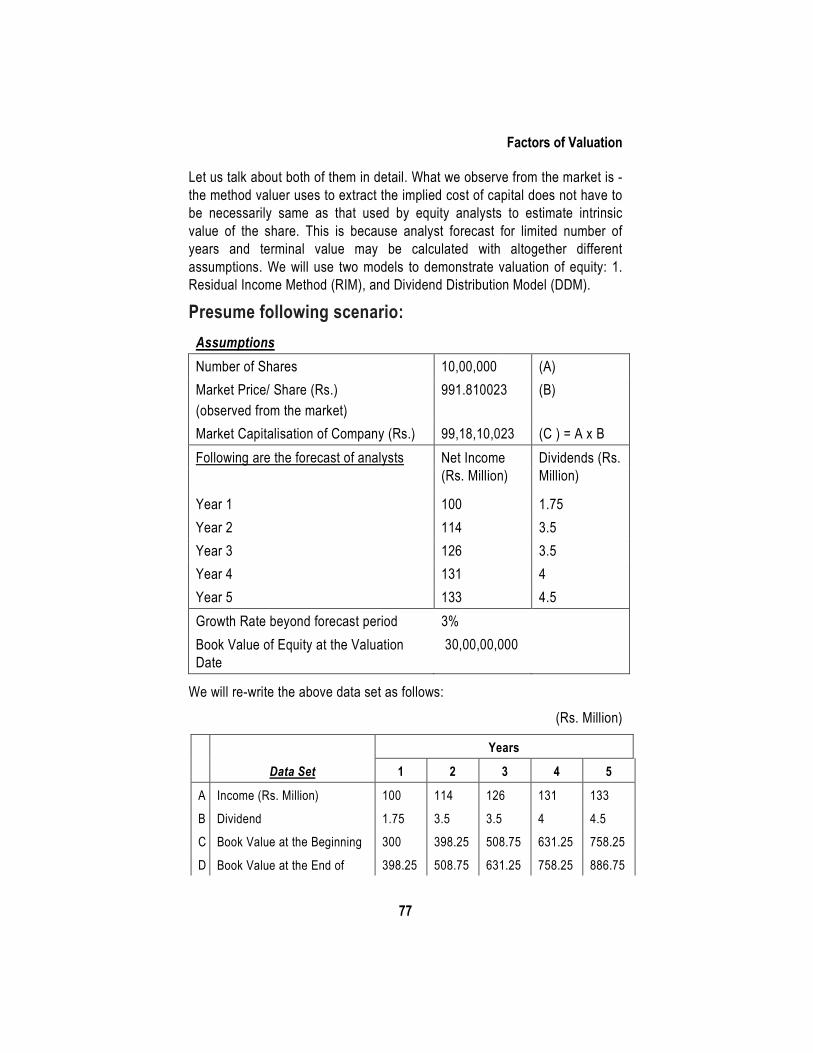
Factors of Valuation
77
Let us talk about both of them in detail. What we observe from the market is - the method valuer uses to extract the implied cost of capital does not have to be necessarily same as that used by equity analysts to estimate intrinsic value of the share. This is because analyst forecast for limited number of years and terminal value may be calculated with altogether different assumptions. We will use two models to demonstrate valuation of equity: 1. Residual Income Method (RIM), and Dividend Distribution Model (DDM).
Presume following scenario: Assumptions Number of Shares 10,00,000 (A) Market Price/ Share (Rs.) (observed from the market)
991.810023 (B)
Market Capitalisation of Company (Rs.) 99,18,10,023 (C ) = A x B Following are the forecast of analysts Net Income
(Rs. Million) Dividends (Rs. Million)
Year 1 100 1.75 Year 2 114 3.5 Year 3 126 3.5 Year 4 131 4 Year 5 133 4.5 Growth Rate beyond forecast period 3% Book Value of Equity at the Valuation Date
30,00,00,000
We will re-write the above data set as follows:
(Rs. Million)
Years
Data Set 1 2 3 4 5
A Income (Rs. Million) 100 114 126 131 133
B Dividend 1.75 3.5 3.5 4 4.5
C Book Value at the Beginning 300 398.25 508.75 631.25 758.25
D Book Value at the End of 398.25 508.75 631.25 758.25 886.75
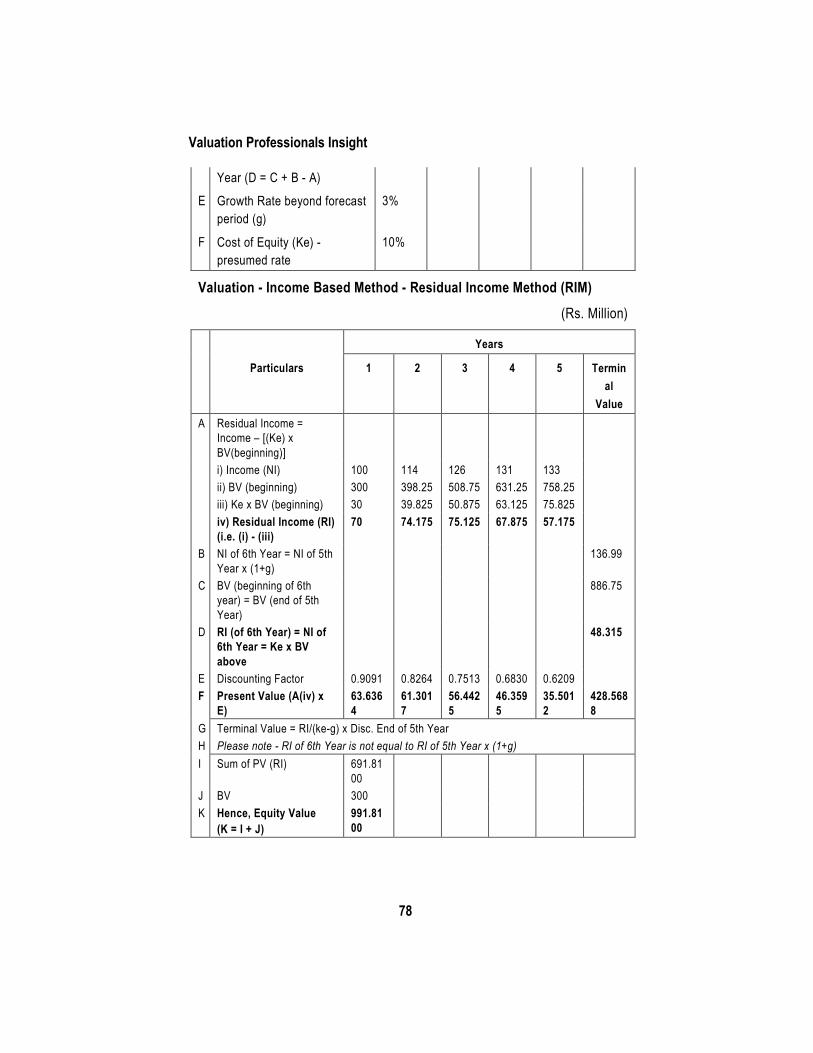
Valuation Professionals Insight
78
Year (D = C + B - A)
E Growth Rate beyond forecast period (g)
3%
F Cost of Equity (Ke) - presumed rate
10%
Valuation - Income Based Method - Residual Income Method (RIM) (Rs. Million)
Years
Particulars 1 2 3 4 5 Terminal
Value A Residual Income =
Income – [(Ke) x BV(beginning)]
i) Income (NI) 100 114 126 131 133 ii) BV (beginning) 300 398.25 508.75 631.25 758.25 iii) Ke x BV (beginning) 30 39.825 50.875 63.125 75.825 iv) Residual Income (RI)
(i.e. (i) - (iii) 70 74.175 75.125 67.875 57.175
B NI of 6th Year = NI of 5th Year x (1+g)
136.99
C BV (beginning of 6th year) = BV (end of 5th Year)
886.75
D RI (of 6th Year) = NI of 6th Year = Ke x BV above
48.315
E Discounting Factor 0.9091 0.8264 0.7513 0.6830 0.6209 F Present Value (A(iv) x
E) 63.6364
61.3017
56.4425
46.3595
35.5012
428.5688
G Terminal Value = RI/(ke-g) x Disc. End of 5th Year H Please note - RI of 6th Year is not equal to RI of 5th Year x (1+g) I Sum of PV (RI) 691.81
00
J BV 300 K Hence, Equity Value
(K = I + J) 991.8100
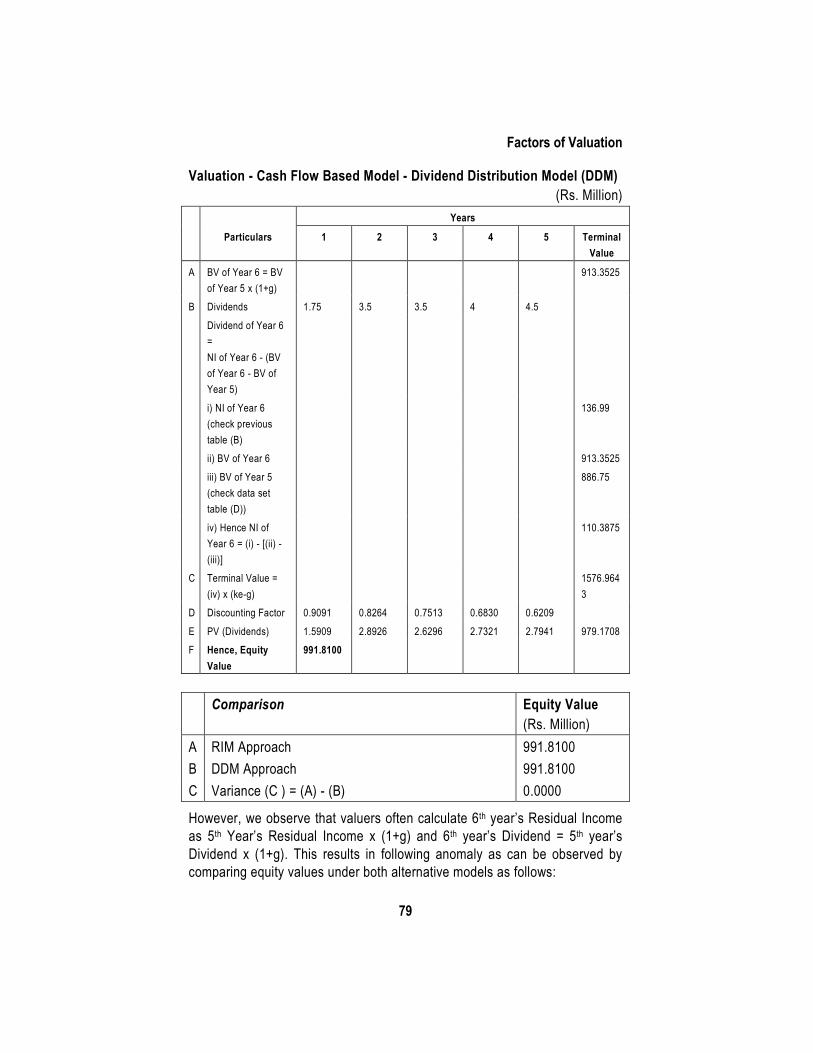
Factors of Valuation
79
Valuation - Cash Flow Based Model - Dividend Distribution Model (DDM) (Rs. Million)
Years
Particulars 1 2 3 4 5 Terminal Value
A BV of Year 6 = BV of Year 5 x (1+g)
913.3525
B Dividends 1.75 3.5 3.5 4 4.5
Dividend of Year 6 = NI of Year 6 - (BV of Year 6 - BV of Year 5)
i) NI of Year 6 (check previous table (B)
136.99
ii) BV of Year 6 913.3525
iii) BV of Year 5 (check data set table (D))
886.75
iv) Hence NI of Year 6 = (i) - [(ii) - (iii)]
110.3875
C Terminal Value = (iv) x (ke-g)
1576.9643
D Discounting Factor 0.9091 0.8264 0.7513 0.6830 0.6209
E PV (Dividends) 1.5909 2.8926 2.6296 2.7321 2.7941 979.1708 F Hence, Equity
Value 991.8100
Comparison Equity Value
(Rs. Million) A RIM Approach 991.8100 B DDM Approach 991.8100 C Variance (C ) = (A) - (B) 0.0000
However, we observe that valuers often calculate 6th year’s Residual Income as 5th Year’s Residual Income x (1+g) and 6th year’s Dividend = 5th year’s Dividend x (1+g). This results in following anomaly as can be observed by comparing equity values under both alternative models as follows:
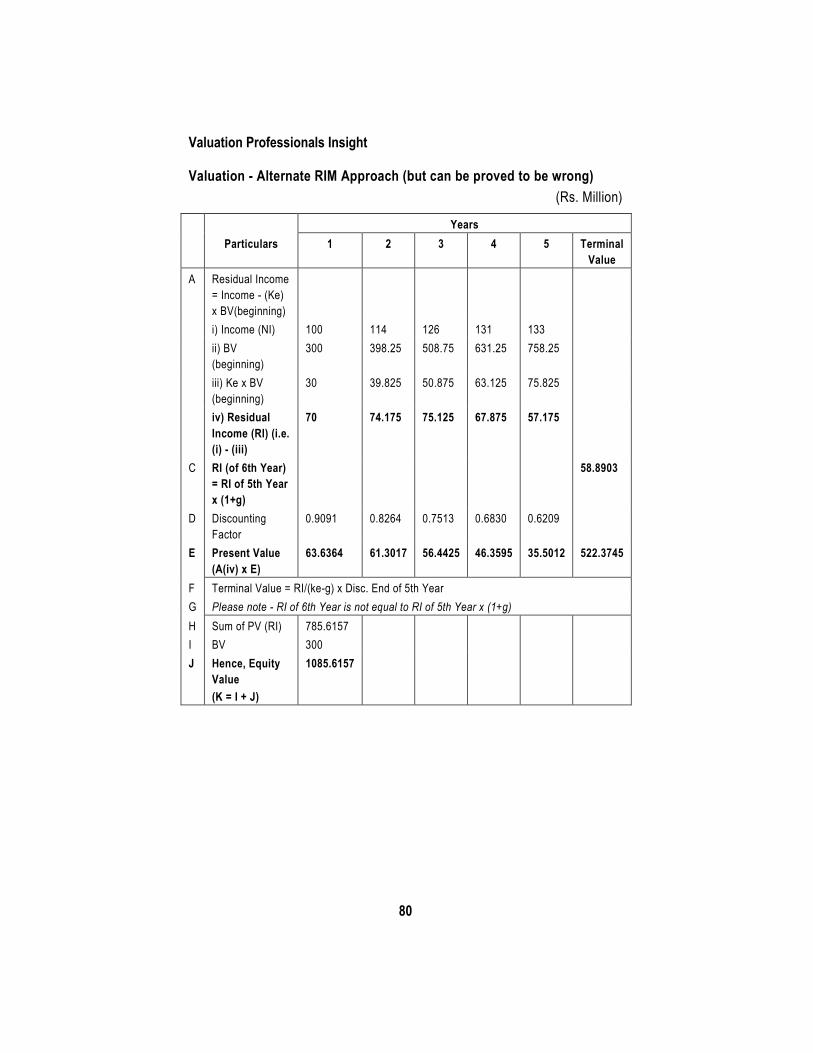
Valuation Professionals Insight
80
Valuation - Alternate RIM Approach (but can be proved to be wrong) (Rs. Million)
Years Particulars 1 2 3 4 5 Terminal
Value A Residual Income
= Income - (Ke) x BV(beginning)
i) Income (NI) 100 114 126 131 133 ii) BV
(beginning) 300 398.25 508.75 631.25 758.25
iii) Ke x BV (beginning)
30 39.825 50.875 63.125 75.825
iv) Residual Income (RI) (i.e. (i) - (iii)
70 74.175 75.125 67.875 57.175
C RI (of 6th Year) = RI of 5th Year x (1+g)
58.8903
D Discounting Factor
0.9091 0.8264 0.7513 0.6830 0.6209
E Present Value (A(iv) x E)
63.6364 61.3017 56.4425 46.3595 35.5012 522.3745
F Terminal Value = RI/(ke-g) x Disc. End of 5th Year G Please note - RI of 6th Year is not equal to RI of 5th Year x (1+g) H Sum of PV (RI) 785.6157 I BV 300 J Hence, Equity
Value (K = I + J)
1085.6157
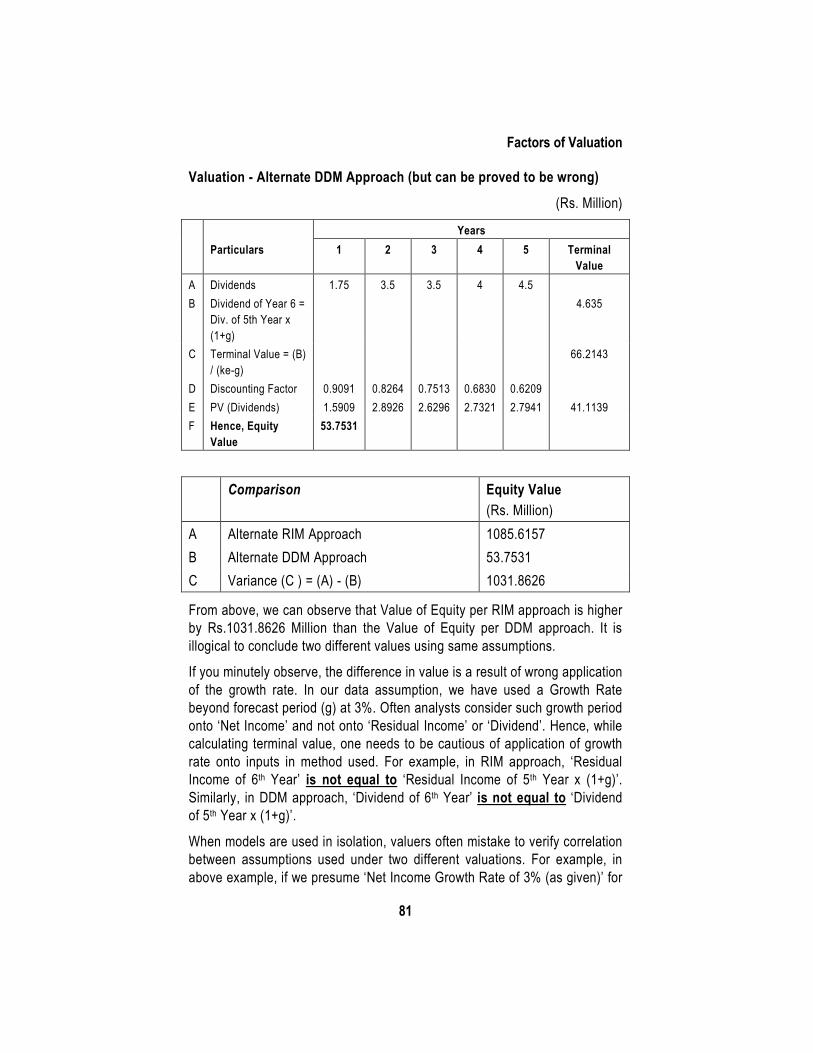
Factors of Valuation
81
Valuation - Alternate DDM Approach (but can be proved to be wrong)
(Rs. Million)
Years Particulars 1 2 3 4 5 Terminal
Value A Dividends 1.75 3.5 3.5 4 4.5 B Dividend of Year 6 =
Div. of 5th Year x (1+g)
4.635
C Terminal Value = (B) / (ke-g)
66.2143
D Discounting Factor 0.9091 0.8264 0.7513 0.6830 0.6209 E PV (Dividends) 1.5909 2.8926 2.6296 2.7321 2.7941 41.1139 F Hence, Equity
Value 53.7531
Comparison Equity Value (Rs. Million)
A Alternate RIM Approach 1085.6157 B Alternate DDM Approach 53.7531 C Variance (C ) = (A) - (B) 1031.8626
From above, we can observe that Value of Equity per RIM approach is higher by Rs.1031.8626 Million than the Value of Equity per DDM approach. It is illogical to conclude two different values using same assumptions.
If you minutely observe, the difference in value is a result of wrong application of the growth rate. In our data assumption, we have used a Growth Rate beyond forecast period (g) at 3%. Often analysts consider such growth period onto ‘Net Income’ and not onto ‘Residual Income’ or ‘Dividend’. Hence, while calculating terminal value, one needs to be cautious of application of growth rate onto inputs in method used. For example, in RIM approach, ‘Residual Income of 6th Year’ is not equal to ‘Residual Income of 5th Year x (1+g)’. Similarly, in DDM approach, ‘Dividend of 6th Year’ is not equal to ‘Dividend of 5th Year x (1+g)’.
When models are used in isolation, valuers often mistake to verify correlation between assumptions used under two different valuations. For example, in above example, if we presume ‘Net Income Growth Rate of 3% (as given)’ for
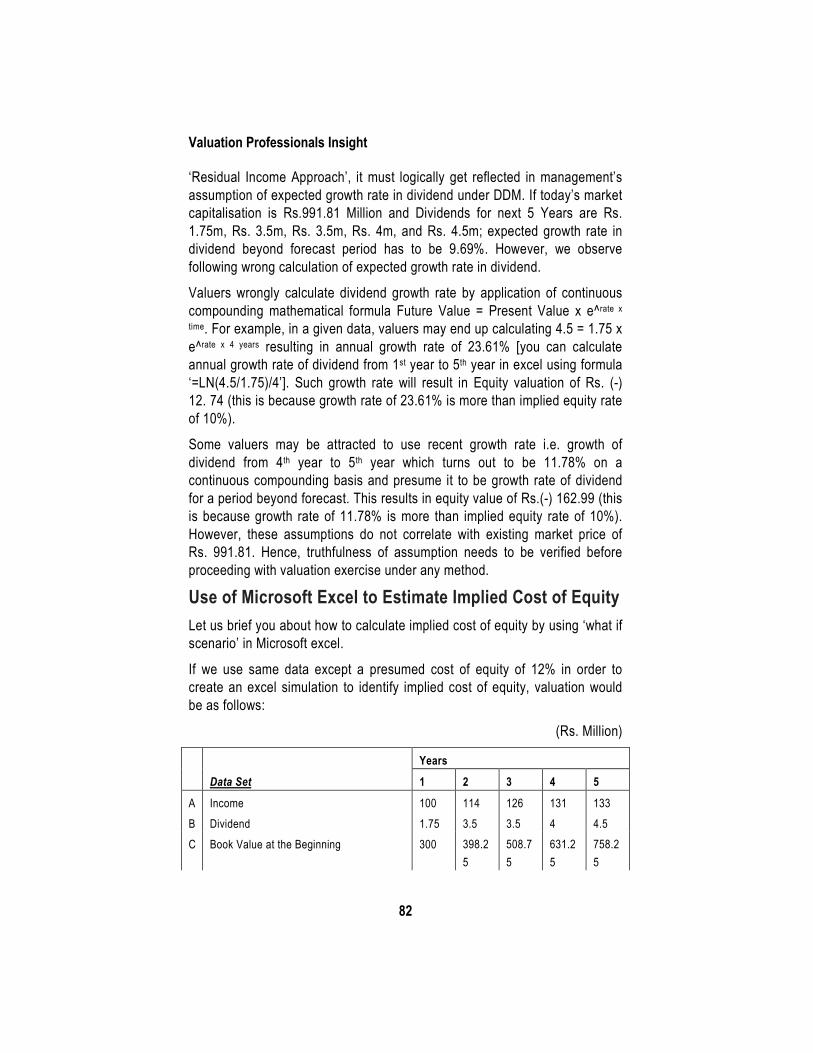
Valuation Professionals Insight
82
‘Residual Income Approach’, it must logically get reflected in management’s assumption of expected growth rate in dividend under DDM. If today’s market capitalisation is Rs.991.81 Million and Dividends for next 5 Years are Rs. 1.75m, Rs. 3.5m, Rs. 3.5m, Rs. 4m, and Rs. 4.5m; expected growth rate in dividend beyond forecast period has to be 9.69%. However, we observe following wrong calculation of expected growth rate in dividend.
Valuers wrongly calculate dividend growth rate by application of continuous compounding mathematical formula Future Value = Present Value x e^rate x
time. For example, in a given data, valuers may end up calculating 4.5 = 1.75 x e^rate x 4 years resulting in annual growth rate of 23.61% [you can calculate annual growth rate of dividend from 1st year to 5th year in excel using formula ‘=LN(4.5/1.75)/4’]. Such growth rate will result in Equity valuation of Rs. (-) 12. 74 (this is because growth rate of 23.61% is more than implied equity rate of 10%).
Some valuers may be attracted to use recent growth rate i.e. growth of dividend from 4th year to 5th year which turns out to be 11.78% on a continuous compounding basis and presume it to be growth rate of dividend for a period beyond forecast. This results in equity value of Rs.(-) 162.99 (this is because growth rate of 11.78% is more than implied equity rate of 10%). However, these assumptions do not correlate with existing market price of Rs. 991.81. Hence, truthfulness of assumption needs to be verified before proceeding with valuation exercise under any method.
Use of Microsoft Excel to Estimate Implied Cost of Equity Let us brief you about how to calculate implied cost of equity by using ‘what if scenario’ in Microsoft excel.
If we use same data except a presumed cost of equity of 12% in order to create an excel simulation to identify implied cost of equity, valuation would be as follows:
(Rs. Million)
Years
Data Set 1 2 3 4 5
A Income 100 114 126 131 133 B Dividend 1.75 3.5 3.5 4 4.5 C Book Value at the Beginning 300 398.2
5 508.75
631.25
758.25
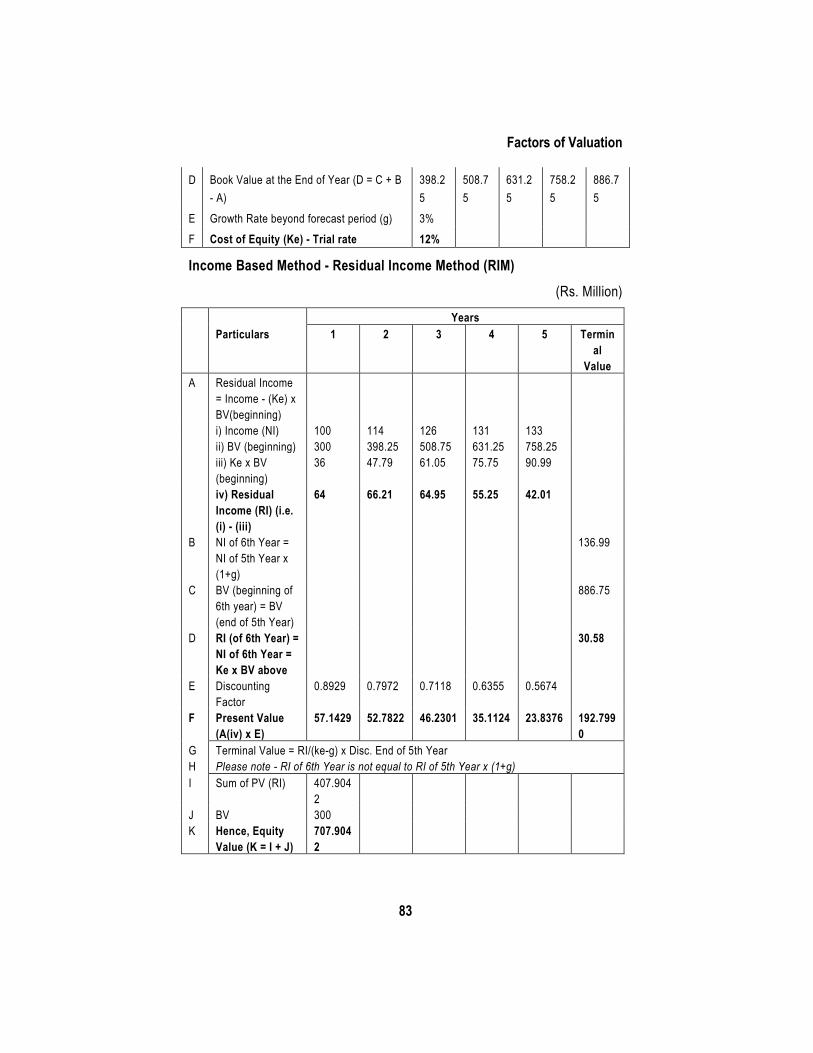
Factors of Valuation
83
D Book Value at the End of Year (D = C + B - A)
398.25
508.75
631.25
758.25
886.75
E Growth Rate beyond forecast period (g) 3% F Cost of Equity (Ke) - Trial rate 12%
Income Based Method - Residual Income Method (RIM)
(Rs. Million) Years Particulars 1 2 3 4 5 Termin
al Value
A Residual Income = Income - (Ke) x BV(beginning)
i) Income (NI) 100 114 126 131 133 ii) BV (beginning) 300 398.25 508.75 631.25 758.25 iii) Ke x BV
(beginning) 36 47.79 61.05 75.75 90.99
iv) Residual Income (RI) (i.e. (i) - (iii)
64 66.21 64.95 55.25 42.01
B NI of 6th Year = NI of 5th Year x (1+g)
136.99
C BV (beginning of 6th year) = BV (end of 5th Year)
886.75
D RI (of 6th Year) = NI of 6th Year = Ke x BV above
30.58
E Discounting Factor
0.8929 0.7972 0.7118 0.6355 0.5674
F Present Value (A(iv) x E)
57.1429 52.7822 46.2301 35.1124 23.8376 192.7990
G Terminal Value = RI/(ke-g) x Disc. End of 5th Year H Please note - RI of 6th Year is not equal to RI of 5th Year x (1+g) I Sum of PV (RI) 407.904
2
J BV 300 K Hence, Equity
Value (K = I + J) 707.9042
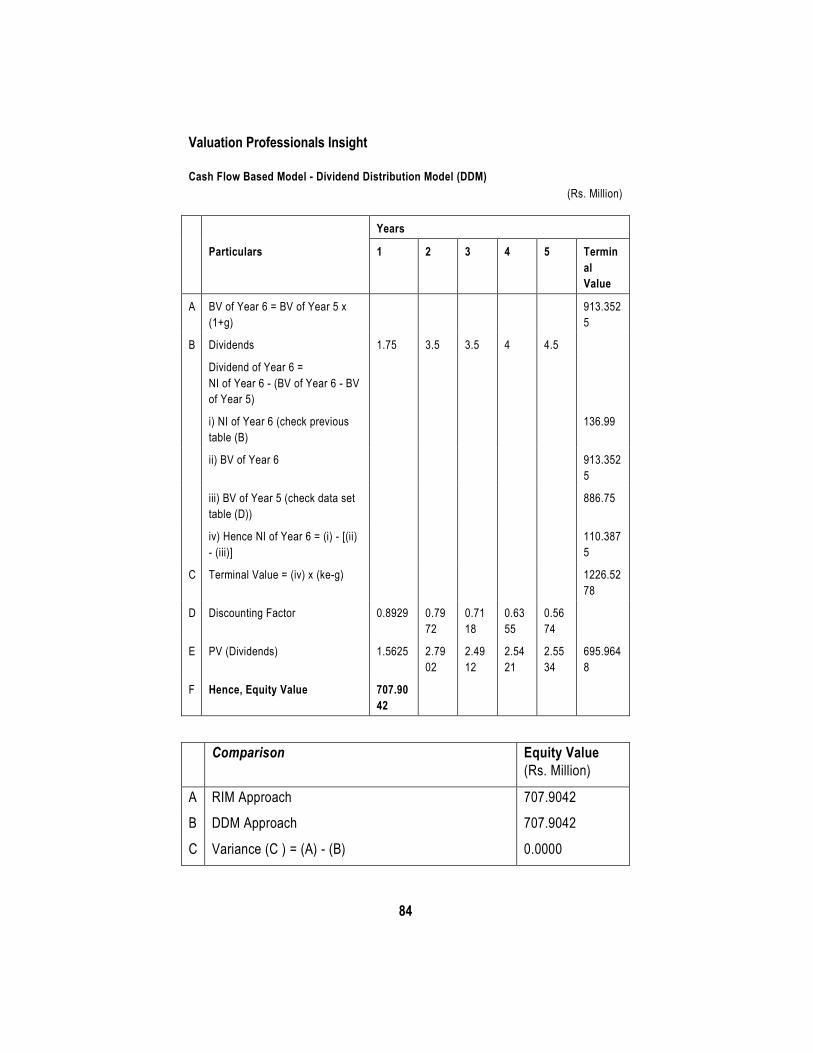
Valuation Professionals Insight
84
Cash Flow Based Model - Dividend Distribution Model (DDM) (Rs. Million)
Years
Particulars 1 2 3 4 5 Terminal Value
A BV of Year 6 = BV of Year 5 x (1+g)
913.3525
B Dividends 1.75 3.5 3.5 4 4.5
Dividend of Year 6 = NI of Year 6 - (BV of Year 6 - BV of Year 5)
i) NI of Year 6 (check previous table (B)
136.99
ii) BV of Year 6 913.3525
iii) BV of Year 5 (check data set table (D))
886.75
iv) Hence NI of Year 6 = (i) - [(ii) - (iii)]
110.3875
C Terminal Value = (iv) x (ke-g) 1226.5278
D Discounting Factor 0.8929 0.7972
0.7118
0.6355
0.5674
E PV (Dividends) 1.5625 2.7902
2.4912
2.5421
2.5534
695.9648
F Hence, Equity Value 707.9042
Comparison Equity Value (Rs. Million)
A RIM Approach 707.9042
B DDM Approach 707.9042
C Variance (C ) = (A) - (B) 0.0000
Factors of Valuation
85
However, we observe in the market that market value per share of a company is Rs. 991.810023. Hence, we need to adjust our trial rate of 12% to that rate such that the valuation equates with market capitalisation. This identified rate is called as ‘implied rate of equity’. We can achieve this goal by using ‘what if analysis’ in Microsoft excel. To use this functionality follow steps:
1. Click ‘Data’
2. Click ‘What if Analysis’
3. Click ‘Goal Seek’
4. Set Cell = Cell which you want to change (we are changing the value of equity to match up with market capitalisation)
5. To value = Market Capitalisation
6. By changing cell = Cell where you have written the Trial presumed cost of equity of 12%
7. Click ‘Ok’
8. Cell you selected in step 6 should automatically change to 10% (which in fact the implied equity we used in our base calculation).
Once you calculate implied cost of equity of a listed company which is similar to your business/ industry, you can then identify the beta related to industry on application of CAPM. CAPM offers ke = Risk Free Rate (rf) + Beta x Risk Premium(rp). Once you identify the Beta, you can further leverage/ deleverage it by application of capital structure. This will help you estimate Cost of Equity/ Implied Cost of Equity of the company you are valuing.
Conclusion Country-wise ‘Risk-free-rate’ may be dissimilar and can add up to complexity in valuing multinational company. Right input with wrong processing still gives a wrong output. As a valuer, you will be questioned on inputs, processes, and perceptions. Finally, the winner of the valuation negotiation is the one who not only persuades story behind the numbers but also validates reliability of numbers used.
Chapter 13
Valuation under various Laws
Section 247 of the Companies Act, 2013 provides for Valuation by Registered Valuers. By virtue of this section, and related sections, the professionalization of valuation under the CA, 2013 has been set in motion. The IBBI has been made the ‘authority’ by the Government of India, Ministry of Corporate Affairs (MCA), to perform the functions under the Companies (Registered Valuers and Valuation) Rules, 2017 (Valuation Rules).
Valuation under the Insolvency and Bankruptcy Code, 2016
Section/ Regulation
Brief description Requirement
Regulation 27 of IBBI (Insolvency Resolution Process for Corporate Persons) Regulations 2016
Appointment of registered valuers
The Insolvency Resolution professional (IRP) shall within 7 days of his appointment, appoint two registered valuers to determine the liquidation value of the corporate debtor in accordance with regulation 35
Regulation 35 of IBBI (Insolvency Resolution Process for Corporate Persons) Regulations 2016
Liquidation value The 2 registered valuers appointed under Regulation 27 shall submit to the IRP, an estimate of the liquidation value. If in the opinion of the IRP, the 2 estimates are significantly different, he may appoint another registered valuer who shall submit an estimate in the same manner. The average of the 2 closest estimates shall be considered the liquidation value
Regulation 3 (2) of IBBI
Initiation of voluntary Where a corporate person intends to liquidate itself voluntarily, the
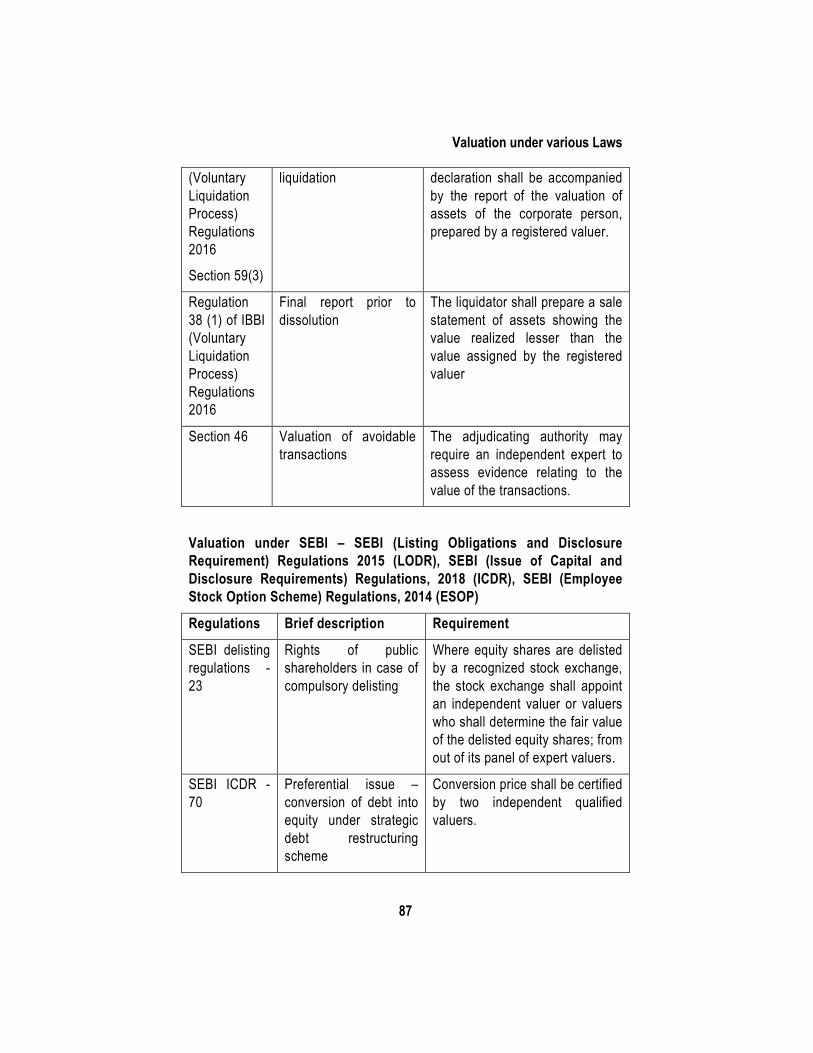
Valuation under various Laws
87
(Voluntary Liquidation Process) Regulations 2016
Section 59(3)
liquidation declaration shall be accompanied by the report of the valuation of assets of the corporate person, prepared by a registered valuer.
Regulation 38 (1) of IBBI (Voluntary Liquidation Process) Regulations 2016
Final report prior to dissolution
The liquidator shall prepare a sale statement of assets showing the value realized lesser than the value assigned by the registered valuer
Section 46 Valuation of avoidable transactions
The adjudicating authority may require an independent expert to assess evidence relating to the value of the transactions.
Valuation under SEBI – SEBI (Listing Obligations and Disclosure Requirement) Regulations 2015 (LODR), SEBI (Issue of Capital and Disclosure Requirements) Regulations, 2018 (ICDR), SEBI (Employee Stock Option Scheme) Regulations, 2014 (ESOP)
Regulations Brief description Requirement
SEBI delisting regulations - 23
Rights of public shareholders in case of compulsory delisting
Where equity shares are delisted by a recognized stock exchange, the stock exchange shall appoint an independent valuer or valuers who shall determine the fair value of the delisted equity shares; from out of its panel of expert valuers.
SEBI ICDR - 70
Preferential issue – conversion of debt into equity under strategic debt restructuring scheme
Conversion price shall be certified by two independent qualified valuers.
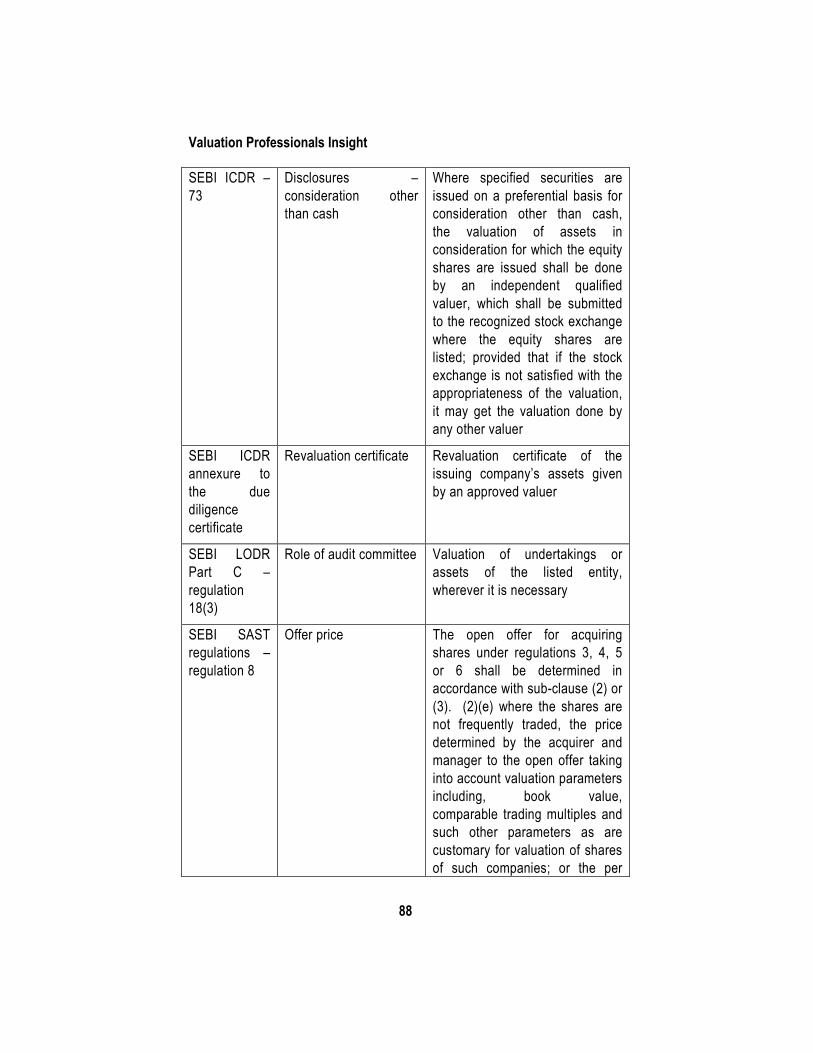
Valuation Professionals Insight
88
SEBI ICDR – 73
Disclosures – consideration other than cash
Where specified securities are issued on a preferential basis for consideration other than cash, the valuation of assets in consideration for which the equity shares are issued shall be done by an independent qualified valuer, which shall be submitted to the recognized stock exchange where the equity shares are listed; provided that if the stock exchange is not satisfied with the appropriateness of the valuation, it may get the valuation done by any other valuer
SEBI ICDR annexure to the due diligence certificate
Revaluation certificate Revaluation certificate of the issuing company’s assets given by an approved valuer
SEBI LODR Part C – regulation 18(3)
Role of audit committee Valuation of undertakings or assets of the listed entity, wherever it is necessary
SEBI SAST regulations – regulation 8
Offer price The open offer for acquiring shares under regulations 3, 4, 5 or 6 shall be determined in accordance with sub-clause (2) or (3). (2)(e) where the shares are not frequently traded, the price determined by the acquirer and manager to the open offer taking into account valuation parameters including, book value, comparable trading multiples and such other parameters as are customary for valuation of shares of such companies; or the per
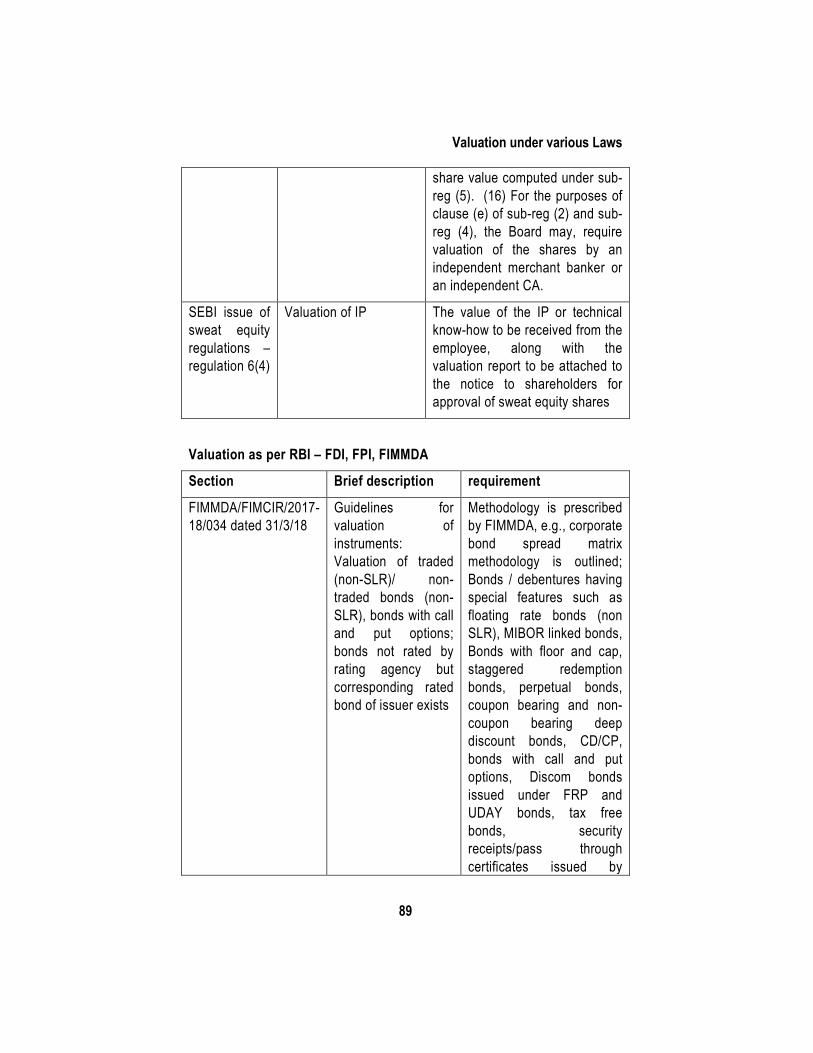
Valuation under various Laws
89
share value computed under sub-reg (5). (16) For the purposes of clause (e) of sub-reg (2) and sub-reg (4), the Board may, require valuation of the shares by an independent merchant banker or an independent CA.
SEBI issue of sweat equity regulations – regulation 6(4)
Valuation of IP The value of the IP or technical know-how to be received from the employee, along with the valuation report to be attached to the notice to shareholders for approval of sweat equity shares
Valuation as per RBI – FDI, FPI, FIMMDA
Section Brief description requirement
FIMMDA/FIMCIR/2017-18/034 dated 31/3/18
Guidelines for valuation of instruments: Valuation of traded (non-SLR)/ non-traded bonds (non-SLR), bonds with call and put options; bonds not rated by rating agency but corresponding rated bond of issuer exists
Methodology is prescribed by FIMMDA, e.g., corporate bond spread matrix methodology is outlined; Bonds / debentures having special features such as floating rate bonds (non SLR), MIBOR linked bonds, Bonds with floor and cap, staggered redemption bonds, perpetual bonds, coupon bearing and non-coupon bearing deep discount bonds, CD/CP, bonds with call and put options, Discom bonds issued under FRP and UDAY bonds, tax free bonds, security receipts/pass through certificates issued by
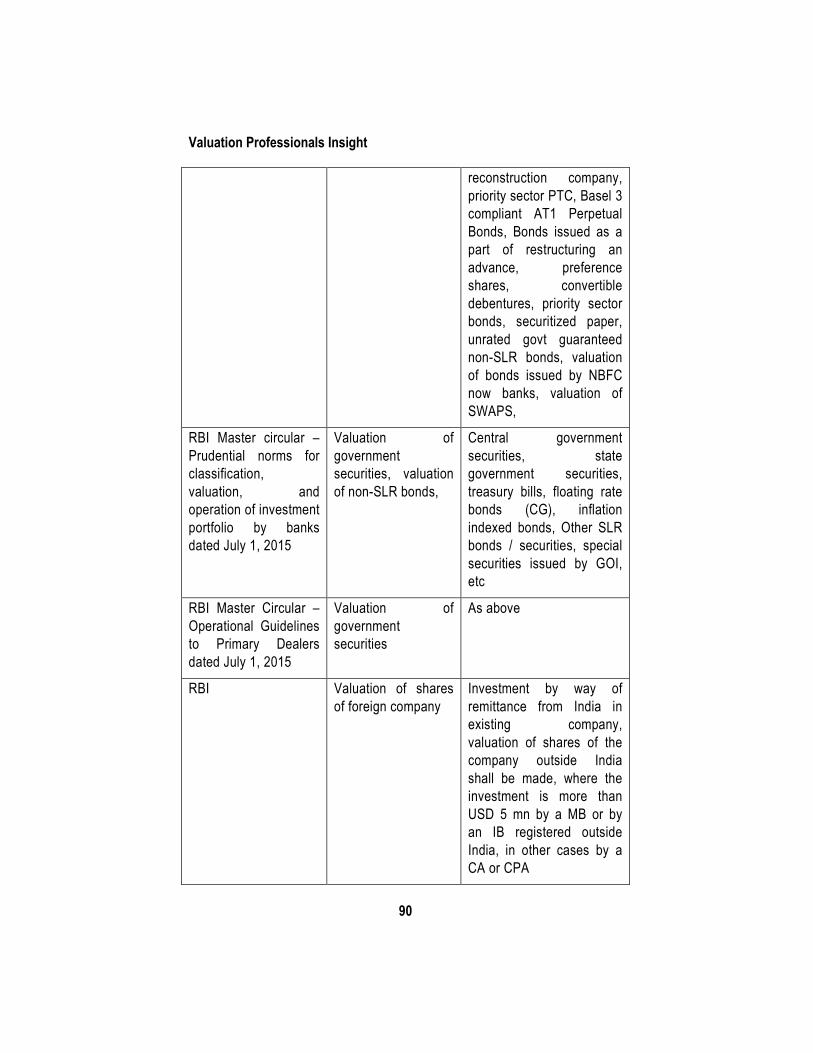
Valuation Professionals Insight
90
reconstruction company, priority sector PTC, Basel 3 compliant AT1 Perpetual Bonds, Bonds issued as a part of restructuring an advance, preference shares, convertible debentures, priority sector bonds, securitized paper, unrated govt guaranteed non-SLR bonds, valuation of bonds issued by NBFC now banks, valuation of SWAPS,
RBI Master circular – Prudential norms for classification, valuation, and operation of investment portfolio by banks dated July 1, 2015
Valuation of government securities, valuation of non-SLR bonds,
Central government securities, state government securities, treasury bills, floating rate bonds (CG), inflation indexed bonds, Other SLR bonds / securities, special securities issued by GOI, etc
RBI Master Circular – Operational Guidelines to Primary Dealers dated July 1, 2015
Valuation of government securities
As above
RBI Valuation of shares of foreign company
Investment by way of remittance from India in existing company, valuation of shares of the company outside India shall be made, where the investment is more than USD 5 mn by a MB or by an IB registered outside India, in other cases by a CA or CPA
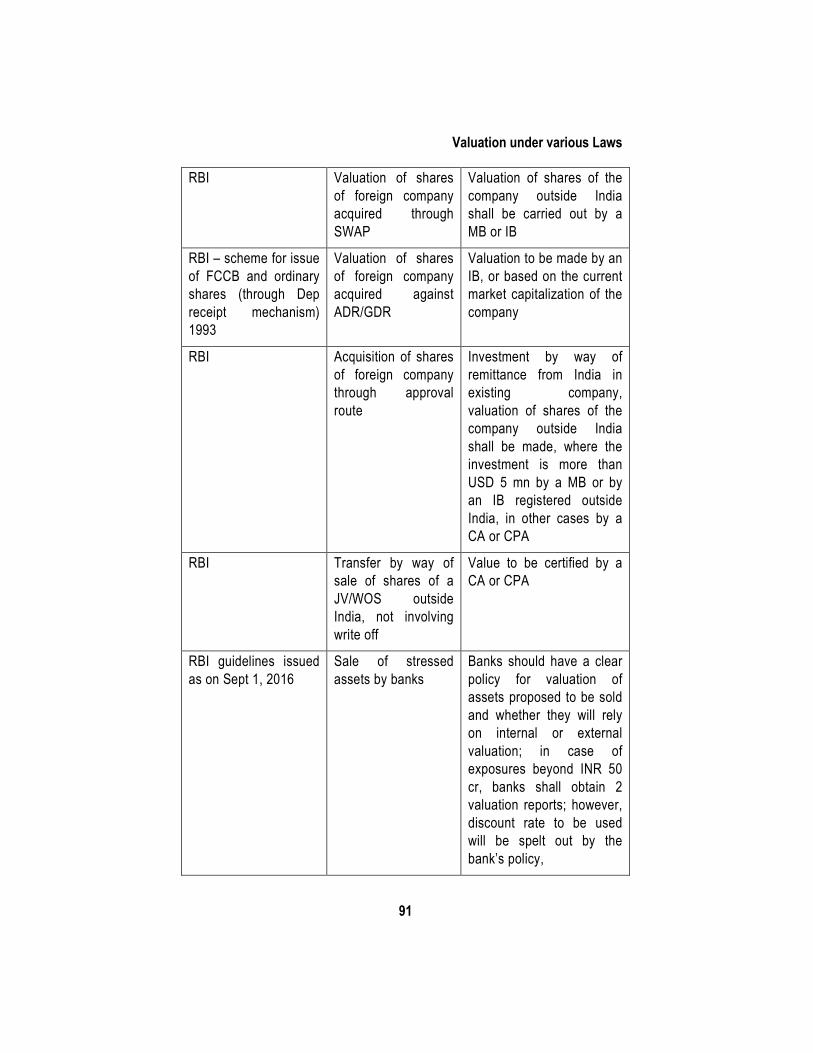
Valuation under various Laws
91
RBI Valuation of shares of foreign company acquired through SWAP
Valuation of shares of the company outside India shall be carried out by a MB or IB
RBI – scheme for issue of FCCB and ordinary shares (through Dep receipt mechanism) 1993
Valuation of shares of foreign company acquired against ADR/GDR
Valuation to be made by an IB, or based on the current market capitalization of the company
RBI Acquisition of shares of foreign company through approval route
Investment by way of remittance from India in existing company, valuation of shares of the company outside India shall be made, where the investment is more than USD 5 mn by a MB or by an IB registered outside India, in other cases by a CA or CPA
RBI Transfer by way of sale of shares of a JV/WOS outside India, not involving write off
Value to be certified by a CA or CPA
RBI guidelines issued as on Sept 1, 2016
Sale of stressed assets by banks
Banks should have a clear policy for valuation of assets proposed to be sold and whether they will rely on internal or external valuation; in case of exposures beyond INR 50 cr, banks shall obtain 2 valuation reports; however, discount rate to be used will be spelt out by the bank’s policy,
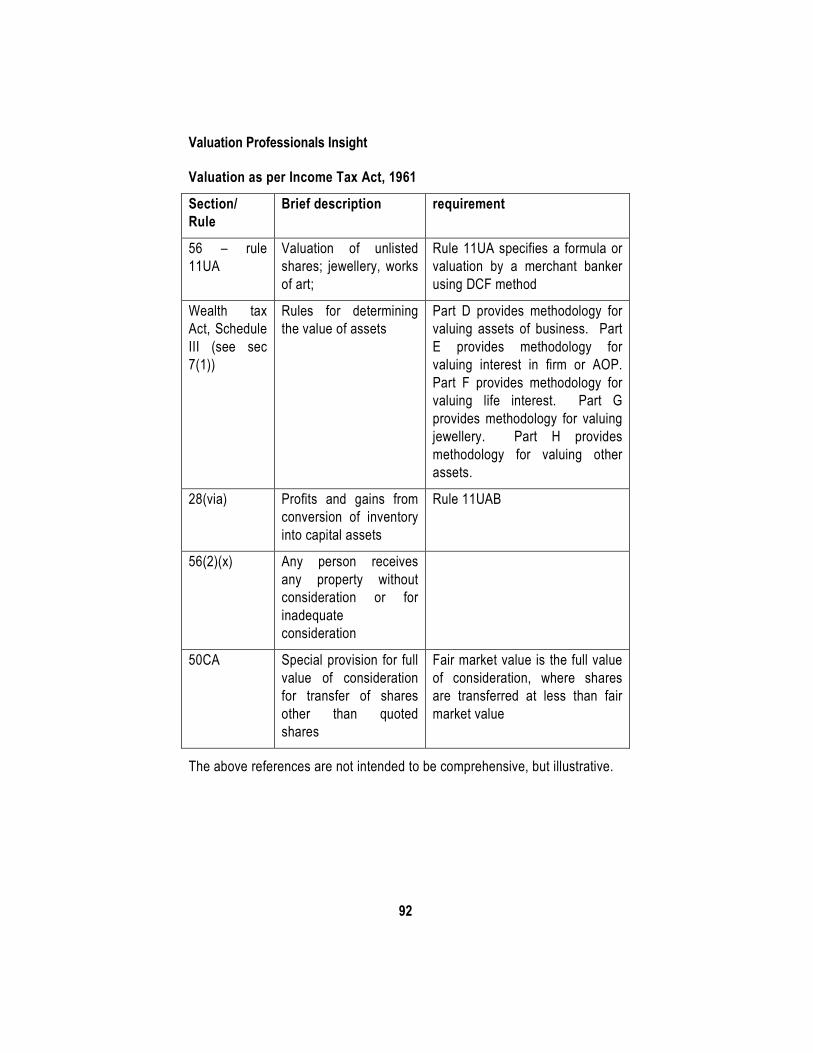
Valuation Professionals Insight
92
Valuation as per Income Tax Act, 1961
Section/ Rule
Brief description requirement
56 – rule 11UA
Valuation of unlisted shares; jewellery, works of art;
Rule 11UA specifies a formula or valuation by a merchant banker using DCF method
Wealth tax Act, Schedule III (see sec 7(1))
Rules for determining the value of assets
Part D provides methodology for valuing assets of business. Part E provides methodology for valuing interest in firm or AOP. Part F provides methodology for valuing life interest. Part G provides methodology for valuing jewellery. Part H provides methodology for valuing other assets.
28(via) Profits and gains from conversion of inventory into capital assets
Rule 11UAB
56(2)(x) Any person receives any property without consideration or for inadequate consideration
50CA Special provision for full value of consideration for transfer of shares other than quoted shares
Fair market value is the full value of consideration, where shares are transferred at less than fair market value
The above references are not intended to be comprehensive, but illustrative.
Chapter 14
Regulatory Valuations in India and Professional Opportunities
Business valuation is critical for transactions including fund raising, mergers & acquisitions (M&A), sale of businesses, strategic business decisions like family or shareholders disputes, voluntary value assessment and also for regulatory compliance, tax and financial reporting.
Though the valuation of a listed company whose shares are actively traded on a nationwide stock exchange in India can be derived from its prevailing market price over a period of time, the valuation of an unlisted company and its shares is the real challenge. For so long, valuation has been debated as an art or science, and substantial part of the litigation in M&A takes place on the issue of valuation as it involves an element of subjectivity that often gets challenged.
The rapid globalization of the world economy has created both opportunities and challenges for organizations leads to uncertainty blowing across global markets. Better corporate governance and growing regulatory and shareholders activism are also leading to requirement of independent business valuations.
Navigation to Valuation Approaches There is no simple recipe to determine the economic worth of a company. However, globally there are three broad approaches to valuation:
Asset approach: The Asset-based valuation values a company on the basis of its underlying assets or resources it controls. Generally, the net asset value (NAV) reflected in books do not usually include intangible assets enjoyed by the business and are also impacted by accounting policies which may be discretionary at times. NAV is thus not perceived as a true indicator of the fair business value. However, it is used to evaluate the entry barrier that exists in a business and is considered viable for companies having reached the mature or declining growth cycle and also for property and investment companies having strong asset base. For appropriate companies having reached the mature or declining growth cycle and also for property and
Valuation Professionals Insight
94
investment companies having strong asset base, asset-based valuation can provide an independent estimate of value and useful insights.
Income approach: The Income based approach of valuations are based on the premise that the current value of any business is a function of the future value that an investor can expect to receive from purchasing all or part of the business. It is generally used for valuing businesses that are expected to continue operating for the foreseeable future. Under the income approach, either single period capitalisation method or single/multi-period discounted future income method could be selected.
Discounted cash flow (DCF) method is the most scientific method of valuation and is frequently applied in practice. However, it brings its own challenges and is quite sensitive to its underlying factors. Sensitivity analysis is an essential tool in applying DCF valuation.
Market Approach: In this approach, value is determined by comparing the subject, company or assets with its peers in the same industry of the same size and region. Most Valuations in stock markets are market based. This is also known as relative valuation approach
Regulatory Valuations in India
The regulatory landscape on valuation in India is challenging. To keep pace with ever evolving economic and business environment, various regulatory bodies in India (FEMA, Income Tax, SEBI, Companies Act, Insolvency Code etc.) have prescribed different and in some cases even conflicting valuation methodologies creating practical difficulties. In some cases, absolute discretion is given to valuers to apply suitable valuation methodologies, in other cases strict adherence to valuation methods like NAV, DCF etc. is prescribed. However, so far none of the regulators have provided any guidance on manner and process of application of valuation methodologies which is left over to the understanding, experience and wisdom of the Valuer. More recently, a few regulators have also prescribed valuation to be conducted as per internationally accepted valuation guidelines and some have put in additional requirement of following with international valuation standards.
The eligibility to perform valuations also varies under different regulations and in most cases chartered accountants (CAs) (or specifically fellow CA or CA with 10 years’ experience) and/or SEBI-registered Merchant Bankers are authorised to conduct valuations in India.
Regulatory Valuations in India and Professional Opportunities
95
It is clarified herein that w.e.f. 1st February, 2019, only a Registered Valuer is authorised to conduct valuation under the Companies Act and Insolvency and Bankruptcy Code.
Broadly, following are the scenarios where business/share valuation is required under different laws in India:
1. Fresh issue and Transfer of shares
Fresh issue and transfer of shares require valuation under Companies Act, 2013, Income Tax Act, 1961 and RBI FEMA Regulations (FEMA).
The Companies Act, 2013 requires a minimum value to be determined for issue of equity shares and convertible securities by the Registered Valuer in accordance with Section 247 of the Companies Act, 2013 read with Companies (Registered Valuers and Valuation) Rules, 2017.
The Income Tax Act, 1961 prescribes a maximum value for issue of shares to be determined by a Merchant Banker (in case of DCF method) or a Chartered Accountant in accordance with Section 56(2) (viib) read with Rule 11 UA (2) of the Income Tax Rules, 1962. There is also a valuation requirement under Income Tax Act for determination of minimum value of in case of transfer and issue of shares in accordance with Section 56(2) (x) read with Rule 11 UA (1) of the Income Tax Rules. Adjusted break-up value method is prescribed for this purpose.
Upon transfer of Shares/Assets, Valuation is also required under Income Tax Act for determination of Fair Value for Indirect Transfer of Assets in accordance with section 9 read with Rule 11 UB and 11UC of Income Tax Rules.
Where Non Residents are involved, FEMA Regulations require Valuation for issue and transfer of shares and fully convertible instruments in accordance with the internationally accepted pricing methodology.
Where shares of a company are Listed (but infrequently traded), its valuation is to be determined in accordance with the price of its comparable companies, book value and other valuation parameters as per Regulation 76A of SEBI (ICDR) Regulations, 2009.

Valuation Professionals Insight
96
2. Business combinations/Mergers & Amalgamations
In case of a merger valuation, the emphasis is on arriving at the “relative” values of the shares of the merging companies to facilitate determination of the “swap ratio”
Merger valuation is required for determination of share swap (exchange) ratio when two or more companies are getting merged or amalgamating with each other pursuant to the orders of the NCLT.
SEBI has recently prescribed the disclosure of following format for determination of share exchange ratio where a Listed Company is involved in Scheme of Arrangement-
XYZ Ltd PQR Ltd Valuation Approach
Value per Share
Weight Value per Share
Weight
Asset Approach X A Y d Income Approach X B Y e Market Approach X C Y f Relative Value per Share
X Y
Exchange Ratio (rounded off) xx
SWAP RATIO:
x (xxx) equity share of XYZ Ltd of Rs 10 each fully paid up for every y (yyy) equity shares of PQR Ltd of Rs 10 each fully paid up.
Note- Reasons for non-adopting any specific valuation approaches shall also be mentioned.
Under Ind AS 103, now all business combinations (except group consolidation) are considered in the nature of purchase and require the acquirer to apportion the consideration paid among tangible and intangible assets. Intangibles need to be separable and identified based on their unique characteristics. The difference amount, if any, between the consideration paid and assets acquired goes to goodwill in the Purchase Price Allocation process.
3. Employee stock options (ESOP)
ESOP valuation is required for accounting purpose for booking
Regulatory Valuations in India and Professional Opportunities
97
compensation loss in Profit and Loss account by company issuing ESOPs. The ESOP accounting valuation is performed at the date of grant of options and is apportioned over the vesting period.
However, the tax impact on perquisites value of ESOPs needs to be determined at time of exercise of options. As per section 17(2)(vi) of the Income Tax Act, 1961 read with Notification no. 94/2009 dated 18 December 2009 issued by the CBDT, only a SEBI-registered (Cat-I) merchant banker is authorised to do ESOP valuation of a company (not listed on a recognised stock exchange in India) for determination of perquisite tax payable in hands of employees.
4. Insolvency & bankruptcy code
In accordance with Regulation 27 of Insolvency and Bankruptcy Board of India (Insolvency Resolution Process for Corporate Persons) Regulations, 2016, 2 Registered Valuers are to be appointed for determination of Fair value and Liquidation value of Assets in accordance with Regulation 35.
It is stated that the Valuation shall be done in accordance with internationally accepted valuation standards, after physical verification of the inventory and fixed assets of the corporate debtor and the average of two closest estimates of value shall be considered as fair value or Liquidation value.
Similarly, in accordance with the Insolvency and Bankruptcy Board of India (Liquidation Process) Regulations, 2016, the Liquidator shall appoint two Registered Valuers to value the Assets or Business where it is intended to be sold as such.
5. Financial reporting Fair Value is required for Financial Reporting in accordance with Indian Accounting Standards (Ind AS) which converge closely to the International Financial Reporting Standards (IFRS).
Besides Ind AS 113 which is a dedicated standard on fair value, there are other Ind AS which guides on valuation and accounting aspects of certain transactions. These are mentioned below-
• Ind AS 103 – Business Combination
• Ind AS 102 – Share based payment
• Ind AS 109 – Financial Instruments
Valuation Professionals Insight
98
• Ind AS 38 – Intangible Assets
• Ind AS 16 – Property Plant & Equipment
• Ind AS 36 – Impairment of Assets
• Ind AS 40 – Investment Property
Fair Value is defined in Ind AS 113 as the price that would be received to sell an asset or paid to transfer a liability in an orderly transaction between market participants at the measurement date.
Fair Value in Ind AS is market based measurement and not an entity specific measurement. In other words, it is measured using the assumptions that market participants would use when pricing the asset or liability, including assumptions about risk. As a result, an entity’s intention to hold an asset or to settle or otherwise fulfill a liability is not relevant when measuring fair value
Fair value hierarchy is also prescribed under Ind AS 113. Preference is given to valuation methods relying on observable inputs. It states that reliance should first be made upon market price of the respective asset (Level-1) and where the market price of respective asset is not available, reliance should then be placed upon market price of the comparable assets (Level-2). However, where there is little, market activity for the asset at the measurement date, unobservable inputs may then be used by beginning with the own data but adjusting the same for the information reasonably available in market (Level-3).
Fair Value techniques are also prescribed in Ind AS 113 as provided below- • Market Approach
Market Approach uses prices and other relevant information generated by market transactions involving comparable assets/liabilities/business, considering qualitative and quantitative factors (Comparable Companies Valuation Method)
• Cost Approach Cost Approach reflects the amount that would be required currently to replace asset (Replacement Cost method)
• Income Approach
Income Approach converts future amounts to current (i.e.
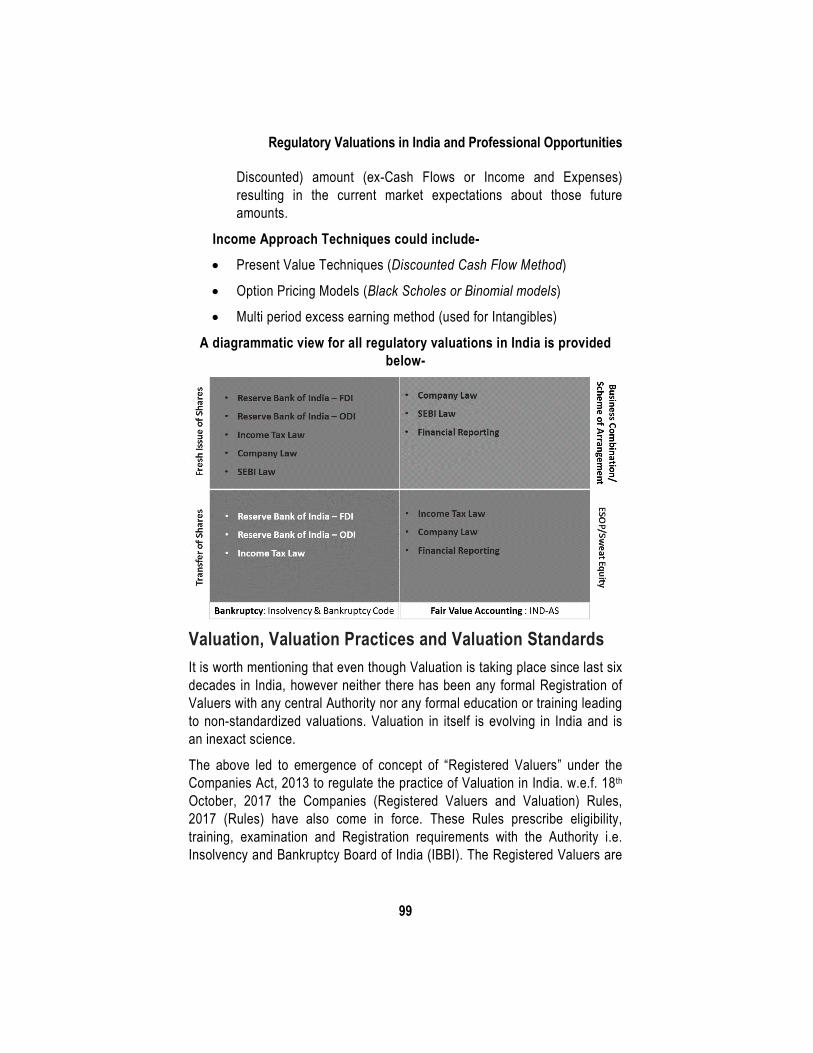
Regulatory Valuations in India and Professional Opportunities
99
Discounted) amount (ex-Cash Flows or Income and Expenses) resulting in the current market expectations about those future amounts.
Income Approach Techniques could include- • Present Value Techniques (Discounted Cash Flow Method)
• Option Pricing Models (Black Scholes or Binomial models)
• Multi period excess earning method (used for Intangibles)
A diagrammatic view for all regulatory valuations in India is provided below-
Valuation, Valuation Practices and Valuation Standards It is worth mentioning that even though Valuation is taking place since last six decades in India, however neither there has been any formal Registration of Valuers with any central Authority nor any formal education or training leading to non-standardized valuations. Valuation in itself is evolving in India and is an inexact science.
The above led to emergence of concept of “Registered Valuers” under the Companies Act, 2013 to regulate the practice of Valuation in India. w.e.f. 18th October, 2017 the Companies (Registered Valuers and Valuation) Rules, 2017 (Rules) have also come in force. These Rules prescribe eligibility, training, examination and Registration requirements with the Authority i.e. Insolvency and Bankruptcy Board of India (IBBI). The Registered Valuers are
Valuation Professionals Insight
100
required to follow valuation standards and a model code of conduct has also been prescribed for Regulation of the Profession.
At present there are no Government prescribed Valuation Standards in India and in many cases the valuation lacks the uniformity and generally accepted global valuation practices. In determining approaches and methods to use, the valuation professional must exercise discretion. Each technique has advantages and drawbacks, which must be considered when applying those techniques to a particular business. Most treatises and court decisions encourage the valuer to consider more than one method, which must be reconciled with each other to arrive at a Value conclusion. Understanding of the internal resources and intellectual capital of the business being valued is as important as the economic, industrial and social environment.
Recently, ICAI has come out with Valuation Standards, 2018 which is mandatory for its RVO members. This ICAI standard guides on Valuation for Asset Class – Securities or Financial Assets including manner of preparation of Valuation Report and ancillary aspects. It is clarified that these ICAI Valuation Standards will be effective till Valuation Standards are notified by the Central Government under Rule 18 of the Companies (Registered Valuers and Valuation) Rules, 2017.
The Central Government is also in the process to frame Valuation Standards in India. The Ministry of Corporate Affairs (MCA) has already formulated a “committee to advise on Valuation matters” by making recommendations in formulation and laying down of valuation standards and policies for compliance by companies and registered valuers in accordance with Rule 19 of the Companies (Registered Valuers and Valuation) Rules, 2017. The committee includes representatives of CBDT, RBI, SEBI, IBBI, MCA, IRDAI as well as the representatives/nominee of Industry and Registered Valuer Organisations (RVO’s).
Conclusion With the emergence of valuation as a discipline in India and recent implementation of Ind AS, more debates are happening on valuations, complex valuation methods are getting recognised. Our experience says that the regulation of the valuation profession in India is a step in right direction as it would bring in serious valuation professionals and also with valuation standards in place, the right principles can be applied by the valuers leading to more standardised process, basis of conclusions, reporting formats and disclosures. However, the important and pervasive element of ‘valuer’s
Regulatory Valuations in India and Professional Opportunities
101
judgement’ cannot be taken out of the valuation process leading to differences in value conclusions and needs evaluation on a case-to-case basis.
Strictly speaking, as of now, the Registered Valuer provisions cover the Companies Act, 2013 and Insolvency and Bankruptcy Code, 2016 however once these get streamlined, the other Regulators are also expected to converge their respective regulations.
It’s high time now that Professionals interested in practicing in this field come forward and gain academic and practical knowledge of valuation principles, concepts, valuation approaches, methodologies, code of conduct and the Valuation Standards.
Chapter 15
Bias in Valuation
We live in an age where availability of information is abundant. By typing in a few keywords and clicking a few buttons, we get information that was not imaginable a couple of decades ago! A crucial part of valuation is to check the reliability of the information used in the valuation exercise. The same has also been considerably mentioned in the ‘Framework for the Preparation of Valuation Report in accordance with the ICAI Valuation Standards’.
Bias in valuation can be double edged:
− Bias in the information that is relied upon by the valuer
− Bias in the perception of the valuer
Bias in the information that is relied upon by the valuer In spite of having the relevant expertise and knowledge for carrying out the valuation of the target asset, including that of financial modelling, and obtaining the data relevant to frame an opinion, the valuer may still end up having an arbitrary conclusion on the value of the target asset if the information set that is relied upon by the valuer is biased. The classic example that can be thought of is when a valuer picks up information from a research report on a particular company circulated by a financial brokerage house. The said brokerage house may have a position in the company, and its research on the fundamentals and operations of the particular company may be biased in favour of the position it holds in the particular company.
If a valuer depends on the information source, which is itself biased, the impact of the use of the said information in the valuation exercise carried out by the valuer is significant.
A valuer has to always exercise due care when she selects the information, in addition to the information bearing other characteristics of reliability, correctness, relevance; it also being free from bias.
Bias in the perception of the valuer The more common bias in valuation is that in the perception of the valuer. A valuer is bound to have priors and preconceptions about the target asset,
Bias in Valuation
103
based on the knowledge she has about the target asset. When a valuer starts the valuation of the target asset, it is shaped by the prior views that the valuer has about the target asset. If the valuer has been assigned to find value of Apple Inc.’s, the valuer’s perception is impacted by the views the valuer holds towards Apple Inc.’s products. The more the valuer knows about the target asset, the more likely it is that the valuation of the target asset may be biased by the prior views of the valuer. It is almost like a valuation assignment is never started with a ‘blank slate’.
Another impact on the valuation assignment is the proximity of the valuer with the management of the target asset. As a part of the valuation assignment, it is expected out the valuer to know about the management of the target asset. If the valuer already knows the management of the target asset or develops proximity with the management of the target asset, it does affect the valuation of the target asset.
The hard reality of people deciding on the value of the target asset before starting the valuation exercise, has been the backdrop to the paradigm shift of the valuation profession in the country. The government needed to intervene, the valuation professionals needed to be regulated and the business fraternity needed to be explained that transactions happen on the basis of value and not on the price determined between the parties. People deciding on the value of the target asset and then tweaking valuation models and assumptions underlying the valuation exercise has led to the regulatory bodies taking steps like coming out with Valuation Standards.
Sources of bias The human mind is susceptible to bias.
A sub-conscious bias exists when the valuer gets influenced by what everyone is thinking about a particular target asset. If everyone is liking a particular target asset and the valuer is asked to value the same, it is highly probable that the valuer would also like the target asset and value with a bias towards the target asset.
A suggestion bias exists when if in a conversation while discussing the engagement, if a team member or someone senior throws up a number to the value of the target asset, without giving a proper thought to the same, that number somehow finds a way into valuation of the target asset. This happens more often in the case of publicly traded entities, where the valuer also
Valuation Professionals Insight
104
inherently benchmarks the findings of the other approaches used in valuing the target asset against the market price of the target asset, and the suggestion bias inherently slides into the valuation of the target asset.
A monetary bias exists when the payment for the valuation assignment comes from a particular party. A monetary bias is the inclination of the valuer towards the interest of the party making the payment of fees for the valuation assignment. Irrespective of the honesty of the valuer, there is an inherent nature of monetary bias, no matter how miniscule, it does exist. A monetary bias also exists when the valuer herself has a position in the target asset i.e. whether she is holding an interest in the target asset or has parted/short an interest in the target asset.
Manner in which bias creeps in Some of the following tricks are usually applied in the valuation process where there exists a bias towards the value. The source of bias may be a sub-conscious bias towards the value of the target asset or even a suggestion bias based on the market price of the target asset, or even a monetary bias!
While valuing the target asset using the discounted cash flow, if the valuer’s prior bias leads to a higher valuation than the one arrived at after conducting the exercise, the valuer is biased to modify the working in a manner that leads to a figure near to where her bias is. The ways in which it can be commonly done are already known to those practising valuation for a while now, which include:
− Use a higher growth rate for considering the terminal cash flow
− Assuming no reinvestment in capital expenditure over the forecast period cash flow
− Considering one-time income extraordinary as regular income
− Assuming a lower beta
− Using a higher target debt ratio without adjusting other variables
and many other tweaks, which may be adopted by the valuer to reflect her bias.
Instances of bias − Peer group selection eliminating certain entities from the peer group,
Bias in Valuation
105
which are otherwise comparable, but only as they do not reflect the resultant value based on the bias of the valuer.
− Selection of the pricing metric (book-value to price, EV/EBITDA, etc.) which best suits the bias of the valuer on the value of the target asset rather than using the one which is most appropriate to the situation.
− Bias of a person appointed as a valuer by the start-up company, which is looking for investment from an angel investor. Vice versa, bias of a valuer appointed by an angel investor looking for investment in a start-up. What do you think would be the prior perception of both of them?
− Bias of a person valuing the target asset when instructed by the manager to whom the person performing the valuation reports to. Even more, when:
• The manager conveys that he holds a long position in the target asset and he loves the target asset
• The manager conveys that he holds a short position in the target asset and he is pessimistic about the future of the target asset
− Bias of a person appointed by a person, under a divorce settlement, to value the worth of net-worth that would go to the spouse.
− Bias of a person appointed by the transferee company, in a friendly merger transaction, when valuing the transferor company.
− Another case of dichotomy is when the assessee values an asset for tax purposes vis-à-vis a tax department appointed valuer valuing the same asset for tax purposes. Same asset being valued for the other side!
The way out! Acceptance. Acceptance of the fact that bias exists is the first step towards elimination of its impact on the valuation. It is human to have a bias. Even if a spreadsheet is developed specifically for computing value on the basis of set parameters, or a programme is developed to collate information and process it neutrally without human intervention; even the developer of the said spreadsheets/programmes is human, who is prone to bias, and whose bias shall make way into the manner in which the spreadsheets/programmes operate. Being in denial of existence of bias restricts the corrective action that is necessary to be taken for elimination of the impact of bias on the result of valuation.
Valuation Professionals Insight
106
Being honest with oneself is the starting point for elimination of bias in a valuation. However, it is easier said than done. By following processes and scientific formulae and combination of matrices, the effect of bias can be reduced from the valuation. The society expects registered valuers to be independent in their approach to valuation of target assets, which comes as a state of mind rather than something that can be taught of learnt from books. Being objective in valuation is primarily important and should not be compromised. Being aware about the existence of bias in a valuation is itself the start of the journey towards elimination of the effect such bias has on the valuation.
Chapter 16
Start-Up Valuation
Executive summary The valuation of start-ups is different from that of mature companies in so far as there is no history to fall back on. You make projections that you cannot even casually test out. That said, valuation still has to be carried out in the search for money. This takes us into a series of time-tested ideas that is explored in this writing.
I picked up a great insight during the Ketan Parekh Scam which was reinforced later by the US-64 crisis, the Global Trust Bank collapse, and a host of other events that came with the ripple effect created by the Dot-com-Tech-Boom-Crash. I demonstrate that insight by holding up a gold plated ‘Cross’ pen and asking people to guess its “value.” I get mixed reactions.
The casual observer would suggest atrociously low values like rupees fifty, rupees hundred, and so on. The slightly more knowledgeable who own or have seen a CrossTM pen would place the value near thousand which would be a reasonable estimate of its written down value. Others would estimate it at Rs 1500 after asking to see it and weighing it in their hands. This Rs 1500 is incidentally the price I paid to acquire it.
At this point, I introduce the twist. I inform the audience that a popular movie actress had used the particular pen when I had met her at a recent film shoot! The audience, invariably, goes bonkers at this juncture. A few ladies with suppressed disgust would give quotes which are very low. Men in bright colored shirts, on the other hand, openly quote figures that run to tens of thousands.
I hope the discerning reader who has come thus far would have seen the point in all this. There is nothing called value that is universally correct. To presume this is to build a superstructure of theory on a foundation of fallacy. The fact is, “All value is a perception.” Both, the lady who gave a quote below intrinsic value and the gentleman who offered an indecently high one, were equally and thoroughly wrong.
Financial Asset valuation involves the assessment of ‘performance’ as well as ‘potential.’ Finally, each valuation expert brings with him a perception of the
Valuation Professionals Insight
108
asset and its future potential for growth. The valuation premise sits somewhere in the middle.
Startup Valuation I may be accused of being clichéd but the age-old statement is more true in the case of start-ups: valuation is both a science and an art; more an art than a science.
Setting up of new businesses, starting from scratch and building businesses organically, was always there. However, the term start-up in the current context does not refer to any company that is newly set-up. It is a new business that is fast growing and aims to fulfill a demand in the marketplace by offering a unique product, process, or service, but is still overcoming problems.
The major roadblock with startup valuation is the absence of past performance indicators. Yes, there is no ‘past’ to go by, only a future to imagine. While this is exciting and fun for the founders, for the investor this is dicey. This lack of clarity in values could be a possible reason why start-up investors are usually serial entrepreneurs themselves who have built such businesses and cashed out on them. Thus, the market forces in the industry in which it operates dictate a startup’s value. Specifically, the market forces in play today dictate the current amount and the current perception of what the future will bring.
The Three Startup Waves A historical analysis would show that there have been three distinct r waves in the evolution of startup businesses.
Internet Wave: Entrepreneurs who started companies between 1994 and 2002 imagined the possibilities of a new world with the Internet. Yahoo!, Amazon, and Google in the US, and Just Dial, MakeMyTrip.com, and Naukri.com in India are typical examples.
Globalization Wave: Entrepreneurs who started their companies between 2003 and 2008 did not internalize the rules of doing business before or during the dotcom bubble burst, yet could not imagine a life without the Internet, and were naturally more global in their thinking than their predecessors. They are the global entrepreneurs. Facebook and Twitter in the US and Flipkart and Zomato in India are examples of companies started in the globalization wave.
Start-Up Valuation
109
Smartphone Wave—Entrepreneurs who started their companies in 2009 or later, do not have muscle memory of the world before the financial crisis and cannot imagine a life without mobile apps. These are the smartphone entrepreneurs. Uber and Airbnb in the US, and Ola and Oyo Rooms in India are perfect examples.
Stages of Funding in Startup Valuation Startups go through a series of 'funding stages.' Their valuation differs with each round of funding.
Seed Funding: Known as the 'friends and family' round because it's usually people known to the business owner who provides the initial investment. Seed funding can also come from someone not known to the founder called an 'Angel Investor,' and is given in exchange for a percentage of the equity of the business.
Round A Funding: The ‘Round A’ funding is used to establish a product in the market, and take it to the next level.
Round B Funding: The start-up has established itself but needs to expand. Enter Round B funding.
Debt Funding: When a startup is entirely built it can raise money through a loan.
Leveraged Buyout (LBO): Buying a company with borrowed money.
Initial Public Offering (IPO): The general public step in to fund the operations.
Usually startups reach Round B funding and at this stage get acquired by a competitor or new entrant at premium valuations. In spite of the learning from the Dot Com crash and the global financial meltdown startups are still seen as high-value propositions.
It is a fact that there is severe over-valuation in the start-up space. Thus, start-ups rarely wish to test their valuations in an initial public offering (IPO) as IPOs have consistently valued start-ups below the estimate arrived at by the original investors. Examples are Square, best known for its mobile payments and financial services business, and Trivago, a famous German hotel search engine.
Determinants of Startup Valuations Here is a list of positive factors that drives value up.
Valuation Professionals Insight
110
• Traction: The bigger the customer base, the better the valuation
• Reputation: The track record of the founder for coming up with good ideas or running successful businesses, or if the product, procedure or service already has a good reputation then a startup is likely to get a higher valuation.
• Prototype: Any prototype that a business has that displays the product or service will add to the valuation.
• Revenues: Thought rare, revenue streams like charging users will make a company more valuable.
• Supply and Demand: If more business owners are seeking money than investors willing to invest, this could affect the business valuation.
• Distribution Channel: If there is a proper distribution channel the value of a startup will be high.
• Booming Industry: If an industry is booming or popular (like mobile gaming) investors could pay a premium.
Here is a list of negative factors that drives value down.
The following is a list of negative factors
• Track record: The startup is in an industry that has a poor track record in recent times.
• Low margins: The products are of low margin, making it difficult to profit early.
• Competition: Participating in a highly competitive market
• Poor management: If the management is not up to mark.
• Product: If the product doesn't work
Startup Valuation Methodologies The primary difference between startup valuation and matured business valuation is that startup businesses have little or no revenue to show. Because of this, it is difficult to value them.
With businesses that receive steady revenue and earnings, it is more comfortable. Valuation is done by considering the value of the business as a multiple of their EBITDA. This approach will not work for startups as there is no substantial information event to make educated guesses.
Start-Up Valuation
111
Here are a few methods that can be looked at
The Book Value Method
This method is based solely on the tangible assets of the company. It doesn't consider growth or revenue and is usually applied when a startup is going out of business.
Cost-to-Duplicate Method
This method involves calculating how much it would cost to build another company just like it from scratch. The idea is simple. No one would want to pay more than it would cost to duplicate. It is relatively easy to do this as there are verifiable expense records. However, the method doesn't reflect the company's future potential for generating sales, profits and return on investment, doesn't capture doesn't capture intangibles like brand value, that the venture might possess. This value is a "lowball" estimate of value.
Discounted Cash Flow (DCF) Method:
This usual suspect involves predicting future cash flows and discounting it back at a required rate of investment return. A higher discount rate is applied to startups to recognize the higher risk.
First Chicago Method
This method combines a Discounted Cash Flow approach and Market Multiple ways to give a fair estimate of startup value. It works out
• Worst-case scenario
• Normal case scenario
• Best-case scenario
Valuation is done for each of these situations and finally multiplied with a probability factor to arrive at a weighted average value.
Venture Capital Method
This method is used for showing the pre-money valuation of pre-revenue startups. It uses the following formulas:
• Return on Investment (ROI) = Terminal Value ÷ Post-money Valuation
• Post-money Valuation = Terminal Value ÷ Anticipated ROI
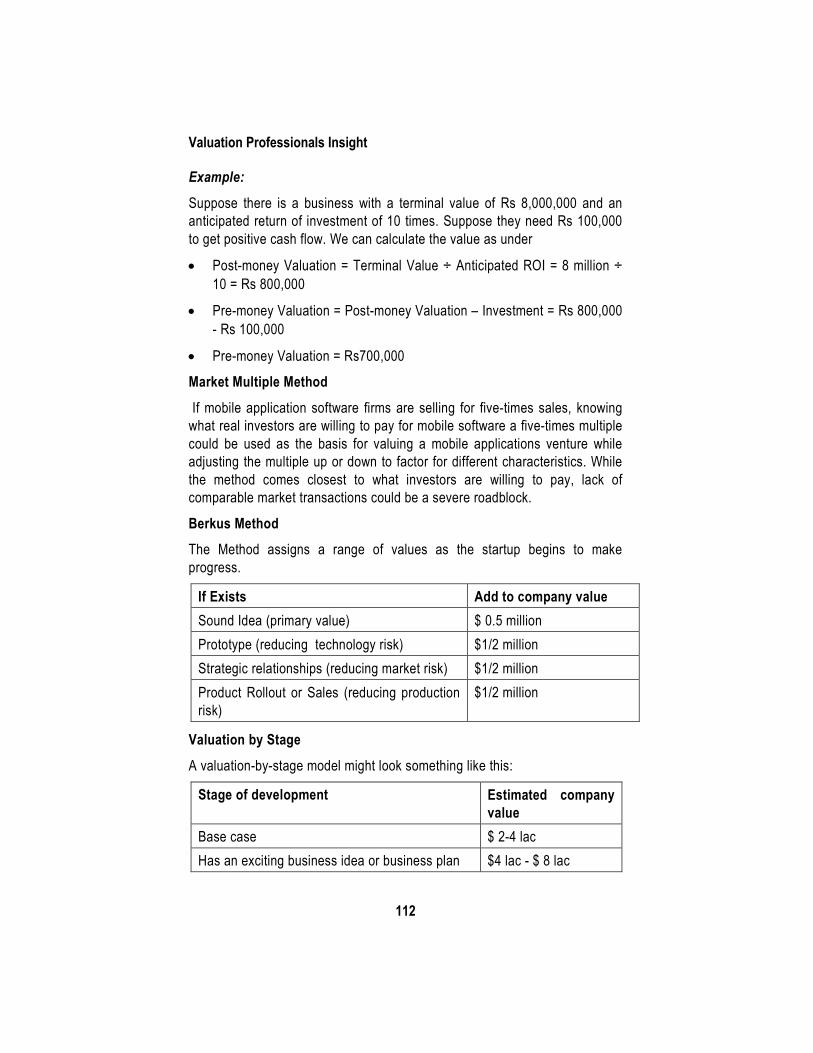
Valuation Professionals Insight
112
Example:
Suppose there is a business with a terminal value of Rs 8,000,000 and an anticipated return of investment of 10 times. Suppose they need Rs 100,000 to get positive cash flow. We can calculate the value as under
• Post-money Valuation = Terminal Value ÷ Anticipated ROI = 8 million ÷ 10 = Rs 800,000
• Pre-money Valuation = Post-money Valuation – Investment = Rs 800,000 - Rs 100,000
• Pre-money Valuation = Rs700,000
Market Multiple Method
If mobile application software firms are selling for five-times sales, knowing what real investors are willing to pay for mobile software a five-times multiple could be used as the basis for valuing a mobile applications venture while adjusting the multiple up or down to factor for different characteristics. While the method comes closest to what investors are willing to pay, lack of comparable market transactions could be a severe roadblock.
Berkus Method The Method assigns a range of values as the startup begins to make progress.
If Exists Add to company value Sound Idea (primary value) $ 0.5 million Prototype (reducing technology risk) $1/2 million Strategic relationships (reducing market risk) $1/2 million Product Rollout or Sales (reducing production risk)
$1/2 million
Valuation by Stage
A valuation-by-stage model might look something like this:
Stage of development Estimated company value
Base case $ 2-4 lac Has an exciting business idea or business plan $4 lac - $ 8 lac
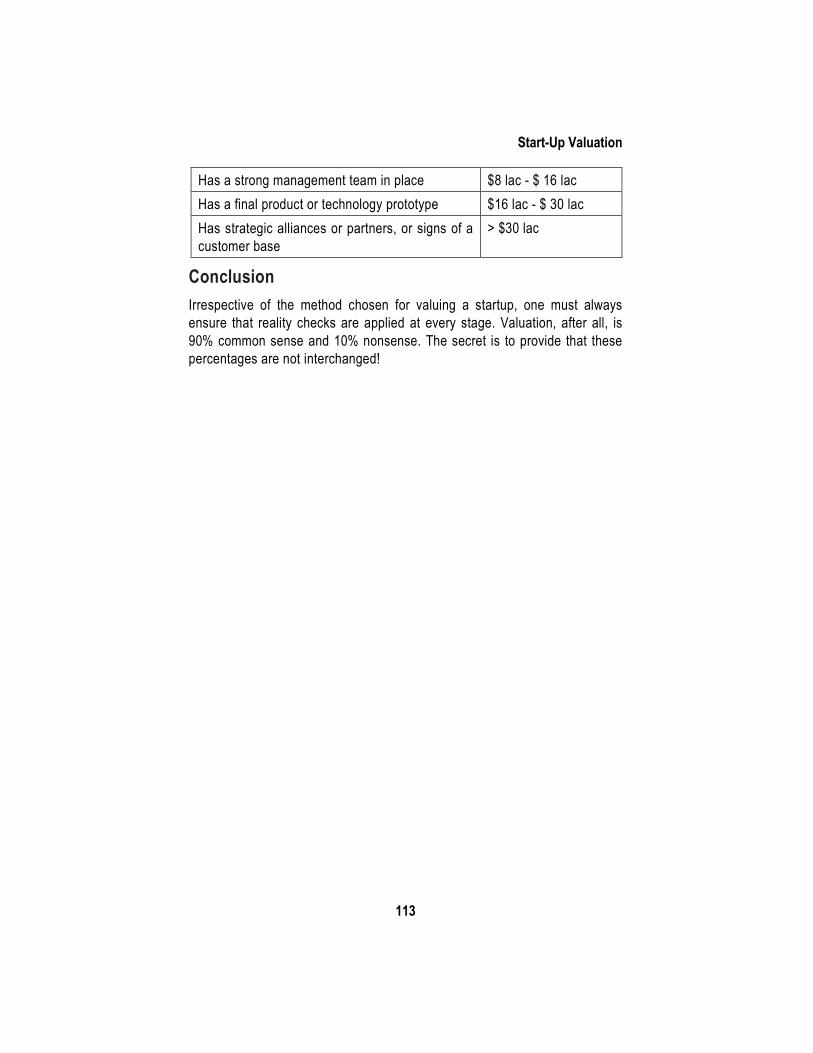
Start-Up Valuation
113
Has a strong management team in place $8 lac - $ 16 lac Has a final product or technology prototype $16 lac - $ 30 lac Has strategic alliances or partners, or signs of a customer base
> $30 lac
Conclusion Irrespective of the method chosen for valuing a startup, one must always ensure that reality checks are applied at every stage. Valuation, after all, is 90% common sense and 10% nonsense. The secret is to provide that these percentages are not interchanged!
Chapter 17
Start-ups & Valuation
Introduction A start-up refers to a new business venture, generally started by individual founders or entrepreneurs, that aims to develop a viable and scalable business model to meet a marketplace need or problem. India is one of the hubs for start-ups and recognizing this, the Government introduced its flagship initiative, the ‘Startup India’ program. It intends to build a strong ecosystem that is conducive for the growth of startup businesses.
Start-ups are generally funded through a variety of instruments such as equity/preference share capital, debt, convertible debt/preference shares by private investors/venture capitalists who demand an assessment of the venture’s viability and the value thereof. Further, the Indian Regulatory framework also requires a fair value assessment of the venture at the stage of infusing funds / transferring shares. In a nutshell, valuation of start-ups is one of the emerging areas of practice for a valuer and this article attempts to provide a few insights on the same.
Impact of certain Income-tax related developments on start-up valuation While there is an article in the 1st Professional Insights Publication on various regulatory aspects to be looked at while valuing an unquoted share (which is usually the case in case of start-ups), the discussion below attempts to provide a snapshot of certain Income-tax provisions and related recent developments a valuer needs to be mindful of.
Section 56(2)(viib) of the Income-tax Act, 1961 (‘Act’) Introduced by the Finance Bill, 2012 to curb the menace of black money in India, this section attempts to bring to tax excessive securities premium i.e. amount in excess of fair market value (‘FMV’), received by a closely held company18 from a resident person, for issue of shares. The provision is not applicable in case of funds received by a venture capital undertaking from a venture capital/fund and to such class of persons as may be notified. 18 a company in which the public are not substantially interested
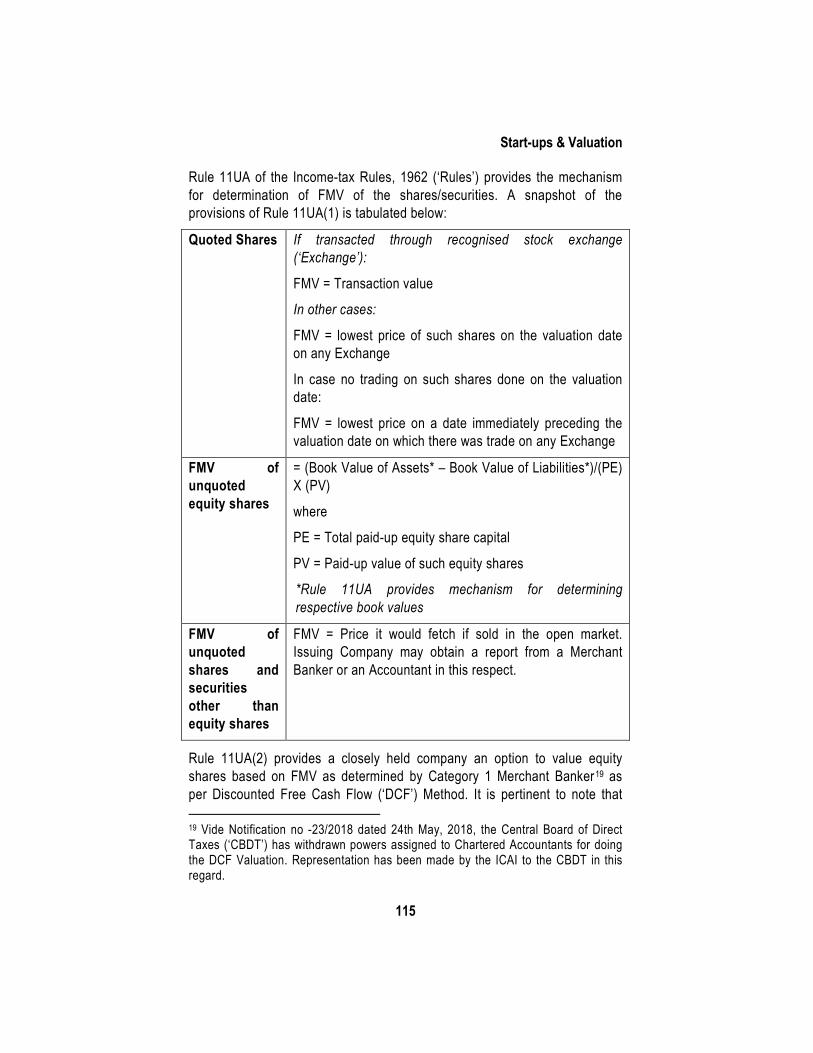
Start-ups & Valuation
115
Rule 11UA of the Income-tax Rules, 1962 (‘Rules’) provides the mechanism for determination of FMV of the shares/securities. A snapshot of the provisions of Rule 11UA(1) is tabulated below:
Quoted Shares If transacted through recognised stock exchange (‘Exchange’):
FMV = Transaction value
In other cases:
FMV = lowest price of such shares on the valuation date on any Exchange
In case no trading on such shares done on the valuation date:
FMV = lowest price on a date immediately preceding the valuation date on which there was trade on any Exchange
FMV of unquoted equity shares
= (Book Value of Assets* – Book Value of Liabilities*)/(PE) X (PV)
where
PE = Total paid-up equity share capital
PV = Paid-up value of such equity shares
*Rule 11UA provides mechanism for determining respective book values
FMV of unquoted shares and securities other than equity shares
FMV = Price it would fetch if sold in the open market. Issuing Company may obtain a report from a Merchant Banker or an Accountant in this respect.
Rule 11UA(2) provides a closely held company an option to value equity shares based on FMV as determined by Category 1 Merchant Banker19 as per Discounted Free Cash Flow (‘DCF’) Method. It is pertinent to note that 19 Vide Notification no -23/2018 dated 24th May, 2018, the Central Board of Direct Taxes (‘CBDT’) has withdrawn powers assigned to Chartered Accountants for doing the DCF Valuation. Representation has been made by the ICAI to the CBDT in this regard.
Valuation Professionals Insight
116
while the taxpayer is given an option to select DCF, recently issued notices have been challenging the values arrived at, thereby alleging income underreporting. A valuer is advised to keep track of developments on this front.
Section 56(2)(viib) permits a further increase in the FMV to the extent it can be substantiated by the issuing company to the satisfaction of the Assessing Officer, based on the value, on the date of issue of shares, of its assets, including intangible assets being goodwill, know-how, patents, copyrights, trademarks, licences, franchises or any other business or commercial rights of similar nature.
It is also relevant to note that vide Notification No. 364(E) dated 11 April 2018 read with Notification No. 34(E) dated 16 January 2019, the CBDT has granted relief from the applicability of this provision to an eligible20 start-up company, if the consideration is received for issue of shares from an investor in accordance with the approval granted by the CBDT. Further, the CBDT recently has done away with the requirement of obtaining a valuation certificate from a Merchant Banker while applying for the above exemption. However, on a practical note, the start-up may want to consider a situation where the CBDT approval is not received as in such case, the requirement of obtaining a valuation report to justify the share price (as on the issue date) would still remain.
Section 56(2)(x) While not applicable to the issuer/ transferor but to the recipient, which includes any person, these provisions tax benefit received by such recipient where the shares/securities so received are underpriced. In such cases, price has to be minimum at book value as per Rule 11UA(1).
Section 50CA
Introduced by the Finance Act, 2017, this section applies to a transferor transferring unquoted shares of a company, at a price lower than FMV. In such a case, the FMV of the shares will be deemed to be the full value of consideration received or accruing as a result of such transfer. FMV in this case will be as per Rule 11UA(1), which is the book value as discussed in the table above.
20 The Notifications provide conditions to be satisfied in order to qualify as an eligible start-up.
Start-ups & Valuation
117
Section 92 of the Act
The Indian Transfer Pricing provisions mandate that international transactions between related parties should be undertaken at arm’s length terms. While Instruction No 2/2015 dated 29 January 2015, issued by the CBDT provides guidance in the context of non-applicability of these rigors to issue of equity shares, the provisions continue to apply to other transactions involving securities/financial instruments. In the context of FMV determination, it has been held21 that the book value methodology prescribed under Rule 11UA will not satisfy arm’s length criteria for transfer pricing purposes as these rules were only intended for application of Section 56 and not for arriving at FMV for comparing an international transaction. Therefore, a valuer will need to evaluate the inter-play between these provisions while undertaking the valuation exercise.
ICAI Valuation Standards 2018 A valuer must also take into account the ICAI Valuation Standards 2018 (‘VS’), which provide guidance for undertaking a valuation exercise. Valuation Standard 103 (VS 103) provides guidance on Valuation Approaches and Methods whereas Valuation Standard 301 (VS 301) lays down the standards to be considered while performing a business valuation. Valuation Standard 303 (VS 303) deals with the valuation of financial instruments such as equity, debt, convertible instruments etc. The Standards require a valuer to use valuation techniques that are appropriate in the circumstances and for which sufficient data is available to measure the value, maximising the use of relevant observable inputs and accordingly minimising the use of unobservable inputs. A valuer could consider the Market, Income and/or Cost Approaches having regard to factors such as: • nature of the asset; • availability of adequate/reliable inputs; • strength/ weakness of each approach/method; • valuation approach/method considered by the market participants. Per VS 303, as financial instruments are generally aligned to market-linked factors, the usage of market-linked methods (using prices and other relevant
21 Chennai ITAT in the case of Ascendas (India) Pvt Ltd (ITA No. 1736/Mds/2011)
Valuation Professionals Insight
118
information generated by market transactions involving identical/comparable assets/companies) with observable inputs is usually the preferred approach to arrive at a value. However, it also provides that valuation of certain financial instruments e.g. equity may be based on the inherent business valuation from which the former derives value. Here, the Income Approach could be considered. VS 103 states that a valuer may, in the cases where there is significant uncertainty on the amount/timing of income/future cash flows (e.g. in case of start-ups), consider other valuation approaches instead of Income Approach or in combination with Income Approach.
To summarise, the Valuation Standards require a valuer to decide on the approach(es) to be adopted for valuing and in the case of a start-up valuation, one could look at the market approach or the income approach or a combination of the two depending on the factors outlined above.
Practical Issues and Recommendations While both the Regulations and VS provide fundamental guidance, at a practical level, every valuation exercise brings along its unique challenges. These increase manifold in the case of a start-up valuation. Some of them are discussed below:
• Negligible Existing Assets:
One of the valuation approaches given in Rule 11UA is to value start-ups on the basis of Net Asset Value (NAV). More often than not, value of a start-up is driven by its idea/ service offering and it is not unusual for start-ups to operate with minimal assets like laptops. Thus, the NAV of a start-up could be negligible, which at times could be not be a correct representative of its true value.
• Novelty of business idea and difficulty in determining projected cash flows:
USP of a start-up is the idea propounded by it and the related products/services it offers. Generally, these are unique with no or negligible history in terms of financial performance. The start-up may report negligible revenues and huge expenses, more so if it is at the set-up stage, resulting in significant operating losses. This issue is compounded by the fact that the promoters want high value demonstrated for the business to attract investments from private investors. Thus inputs, such as historical analysis ratios and reasonable estimates of market share and growth rates, a valuer so often relies on while deriving the future value for a business, are missing in this case,
Start-ups & Valuation
119
requiring him to rely heavily on management estimates, which come with the latter’s biases.
• Difficulty in determining the discount rates:
In the traditional income approach, many of the proxies used to measure risk are market-based. Discount rate for equity is linked inter alia to its beta and the cost of debt is computed basis current market prices of publicly traded bonds. This data is not readily available for start-ups as they are generally not traded publicly.
• Huge Terminal Value (‘TV’):
Comparative to established business, a higher proportion of value in start-ups is based on TV. Accordingly, assumptions about when (and whether or not) the business will reach stable growth (a pre-requisite for estimating TV), and characteristics it reflects in the stable growth period can have a substantial impact on the value.
• Lack of comparable transactions/companies in the public domain:
As mentioned above, one of the factors a professional valuer has to ensure is to maximise the use of relevant observable inputs. However, in the case of start-ups, comparable transactions/ companies are difficult to find, increasing the subjectivity of the valuation.
• Dependence on Promoters:
A start-up is heavily driven by the idea and vision of the founding promoter(s) and their continued involvement is necessary for the venture’s success. This risk, may at times, be countered by incoming investors by getting adequate commitments from the founder-promoters. Factoring this risk appropriately while valuing the start-up is challenging.
• Multiplicity of rights:
Start-ups often give protection to investors in the form of first claims on cash flows from operations and in liquidation and with control or veto rights, etc. Hence, different equity claims in a start-up can affect their value/ rate of return expected by them.
• Illiquidity of the investment:
Start-ups tend to be privately held and are illiquid as compared to investments in their publicly traded counterparts. This illiquidity needs to be factored while determining the value, which is easier said than done.
Valuation Professionals Insight
120
Some Recommendations Given below are a few measures that can be considered by a valuer to reduce subjectivity in the process and arrive at a more reasonable value of the start-up: 1. Applying Venture Capital Method for valuation:
Here, the company’s revenues/earnings are forecasted into the future year when the company can be expected to go public. Present revenue/price-earnings multiples of similar traded companies are applied to these future revenues/earnings to arrive at the exit value. This value is discounted to arrive at the Net Present Value based on the rate of return commensurate to the risk involved in the business, which at times may be as high as 25% to 40%. Companies/promoters with a proven track record of setting up and running successful ventures and those having access to capital at lower rates could see lower discount rates, say between 20% to 30%.
However, there are certain caution areas, which one would need to be mindful of /corrected while applying this approach:
» As this approach focusses on revenues and earnings, at times, factors such as reinvestment required to achieve the growth tend to get ignored.
» At times, these valuations aim for short term estimates cutting them off prematurely and employ a multiple that is usually based on what comparable companies are trading at currently, which may not be the right approach for start-ups with longer gestation periods.
» Target rate used to discount future value is the rate demanded by venture capitalists, who are equity investors. This rate incorporates the likelihood of failure. If this rate is used to discount the future value of the business (and not equity); and if the discount rate (which builds in a probability that the business will not survive) does not change over time, as the business moves through the life cycle, the valuation could be a lower number.
2. Systematic Estimation of future cash flows22: One of the approaches that a valuer may consider is the Top-down approach. The steps involved are summarised below: 22 Source: Valuing Young, Start-up and Growth Companies: Estimation Issues and Valuation Challenges by Aswath Damodaran read with ICAI Valuation Standards 2018
Start-ups & Valuation
121
Step 1 – Determine revenues based on an estimation of:
• potential market for the start-up’s products/services
• present and future size of the market
• market share that could be captured over the valuation period
Amongst other factors, quality of the product/service being offered and company’s ability to counter competition, revenue numbers of current market participants/leaders could be useful in the estimation exercise. While assessing the impact of these factors, the valuer can have recourse to inputs based on market research / inputs of an expert having adequate knowledge of the industry in which the start-up operates, if the situation so demands. The ICAI issued Standards provide guidance in this regard.
Step 2 – Determine Operating Margin:
• first, estimate margin in the stable growth phase (‘target margin’) – this could be based margin of established companies in similar business
• thereafter, estimate how the current profit margin/loss would evolve over the explicit forecasted period to reach this target margin
Factors such as expected fixed costs and competition impact over the explicit period could create challenges in estimation.
Step 3 – Determine investments for growth:
It is not uncommon for start-ups to reflect absurdly high growth rates in the initial years. This is partly due to the fact that once the idea is accepted by the market, the take-off may be quick and partly on account of the fact that base numbers being low, growth rates appear exponential. It is imperative for a valuer to estimate how much the business is reinvesting to generate the forecasted growth as this would (1) impact cash outflows that can be delivered to investors; and (2) in start-ups, often result in negative cash flows, which will have to be covered with new capital infusions diluting stake held by existing shareholders/require them to make fresh investments to keep the business going.
Step 4 – Computing tax impact:
Start-ups generally witness losses in the initial years. In the initial years of profits, set-off of losses zeroises / minimises tax outflow. Once these losses are exhausted; the marginal tax rate should be used unless the facts support a lower rate.
Valuation Professionals Insight
122
Step 5 – Check for internal consistency:
In the above steps as the operating income and reinvestment are estimated separately and hence maybe inconsistent. The valuer could test for consistency by computing an imputed return on capital as under:
Imputed Return on Capital (ROIC) = Expected Operating Income after tax (in period t)
Capital Invested (in period t-1)
This ROIC, as the business approaches stable growth phase, can be compared to both the industry average ROIC and to the company’s own stable period cost of capital. If the imputed ROIC is higher than the industry average/cost of capital, it indicates reinvestment forecasted are insufficient, given the expected earnings.
Conclusion While there is a plethora of literature and guidance assisting a valuer in doing his job well, the success or otherwise of a valuation assignment rests on the shoulders of the valuer, the depth of his knowledge of the business, factors impacting it and ultimately, his judgment. This holds true even more in the case of a start-up valuation where the valuer is entering uncharted territory. A healthy dose of knowledge coupled with an attitude of skepticism will help the valuer stay on course.
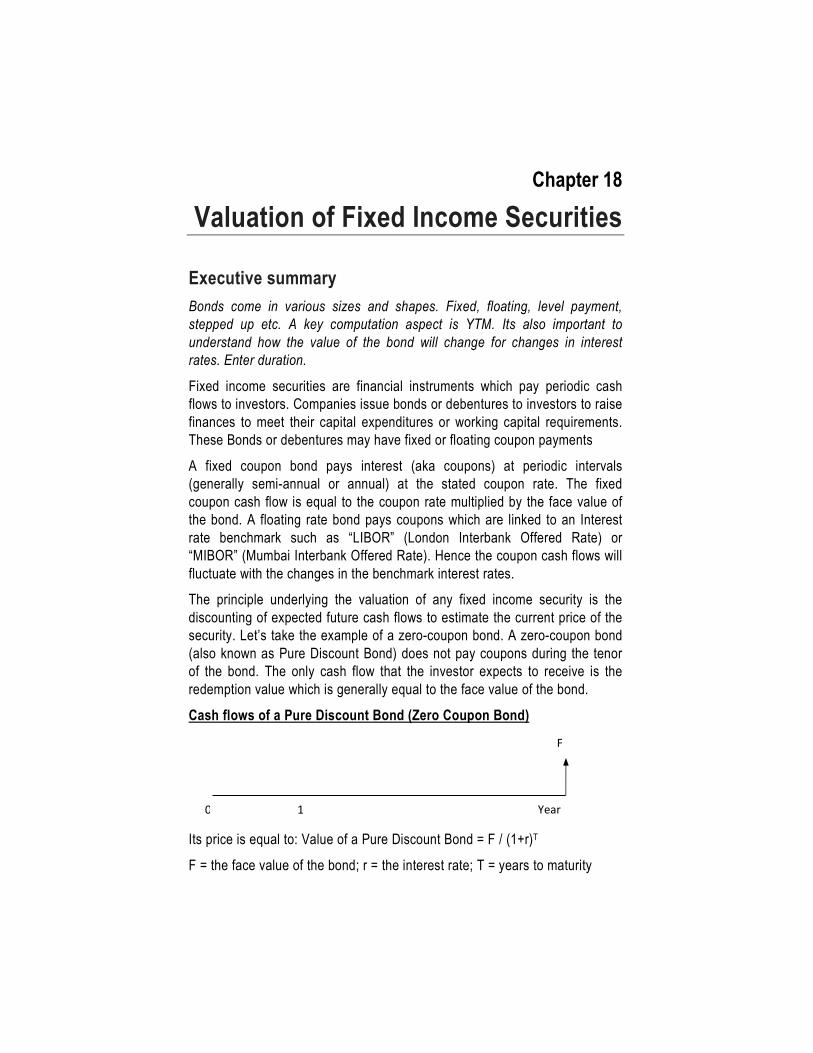
Chapter 18
Valuation of Fixed Income Securities
Executive summary Bonds come in various sizes and shapes. Fixed, floating, level payment, stepped up etc. A key computation aspect is YTM. Its also important to understand how the value of the bond will change for changes in interest rates. Enter duration.
Fixed income securities are financial instruments which pay periodic cash flows to investors. Companies issue bonds or debentures to investors to raise finances to meet their capital expenditures or working capital requirements. These Bonds or debentures may have fixed or floating coupon payments
A fixed coupon bond pays interest (aka coupons) at periodic intervals (generally semi-annual or annual) at the stated coupon rate. The fixed coupon cash flow is equal to the coupon rate multiplied by the face value of the bond. A floating rate bond pays coupons which are linked to an Interest rate benchmark such as “LIBOR” (London Interbank Offered Rate) or “MIBOR” (Mumbai Interbank Offered Rate). Hence the coupon cash flows will fluctuate with the changes in the benchmark interest rates.
The principle underlying the valuation of any fixed income security is the discounting of expected future cash flows to estimate the current price of the security. Let’s take the example of a zero-coupon bond. A zero-coupon bond (also known as Pure Discount Bond) does not pay coupons during the tenor of the bond. The only cash flow that the investor expects to receive is the redemption value which is generally equal to the face value of the bond.
Cash flows of a Pure Discount Bond (Zero Coupon Bond)
Its price is equal to: Value of a Pure Discount Bond = F / (1+r)T
F = the face value of the bond; r = the interest rate; T = years to maturity
Year
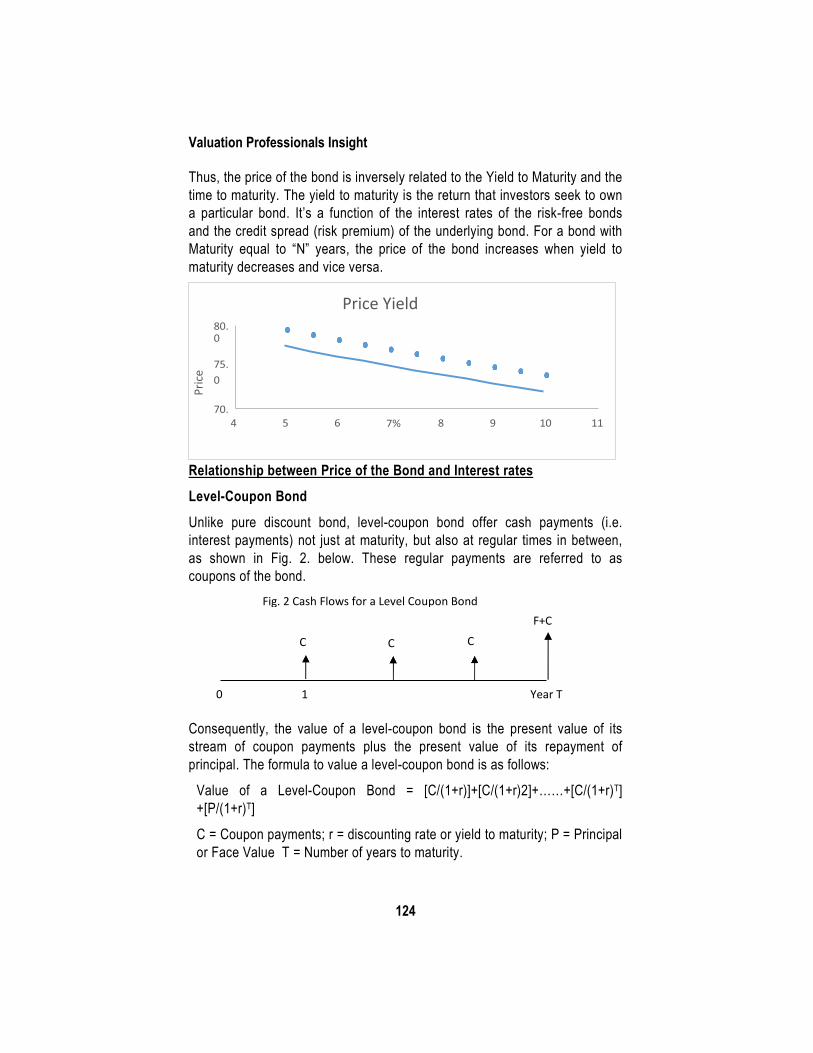
Valuation Professionals Insight
124
Thus, the price of the bond is inversely related to the Yield to Maturity and the time to maturity. The yield to maturity is the return that investors seek to own a particular bond. It’s a function of the interest rates of the risk-free bonds and the credit spread (risk premium) of the underlying bond. For a bond with Maturity equal to “N” years, the price of the bond increases when yield to maturity decreases and vice versa.
Relationship between Price of the Bond and Interest rates Level-Coupon Bond
Unlike pure discount bond, level-coupon bond offer cash payments (i.e. interest payments) not just at maturity, but also at regular times in between, as shown in Fig. 2. below. These regular payments are referred to as coupons of the bond.
Consequently, the value of a level-coupon bond is the present value of its stream of coupon payments plus the present value of its repayment of principal. The formula to value a level-coupon bond is as follows:
Value of a Level-Coupon Bond = [C/(1+r)]+[C/(1+r)2]+……+[C/(1+r)T] +[P/(1+r)T]
C = Coupon payments; r = discounting rate or yield to maturity; P = Principal or Face Value T = Number of years to maturity.
Price Yield
Fig. 2 Cash Flows for a Level Coupon Bond F+C
Year T
Pric
e
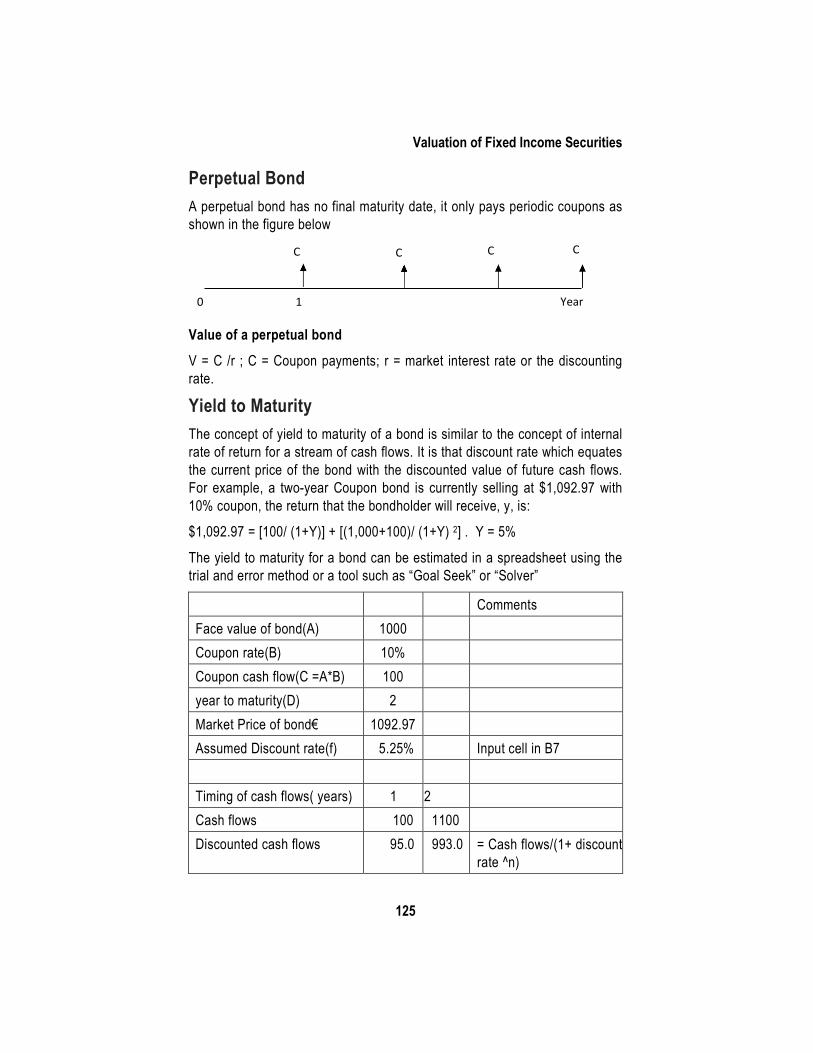
Valuation of Fixed Income Securities
125
Perpetual Bond A perpetual bond has no final maturity date, it only pays periodic coupons as shown in the figure below
Value of a perpetual bond
V = C /r ; C = Coupon payments; r = market interest rate or the discounting rate.
Yield to Maturity The concept of yield to maturity of a bond is similar to the concept of internal rate of return for a stream of cash flows. It is that discount rate which equates the current price of the bond with the discounted value of future cash flows. For example, a two-year Coupon bond is currently selling at $1,092.97 with 10% coupon, the return that the bondholder will receive, y, is:
$1,092.97 = [100/ (1+Y)] + [(1,000+100)/ (1+Y) 2] . Y = 5%
The yield to maturity for a bond can be estimated in a spreadsheet using the trial and error method or a tool such as “Goal Seek” or “Solver”
Comments Face value of bond(A) 1000 Coupon rate(B) 10% Coupon cash flow(C =A*B) 100 year to maturity(D) 2 Market Price of bond€ 1092.97 Assumed Discount rate(f) 5.25% Input cell in B7
Timing of cash flows( years) 1 2 Cash flows 100 1100 Discounted cash flows 95.0 993.0 = Cash flows/(1+ discount
rate ^n)
Year
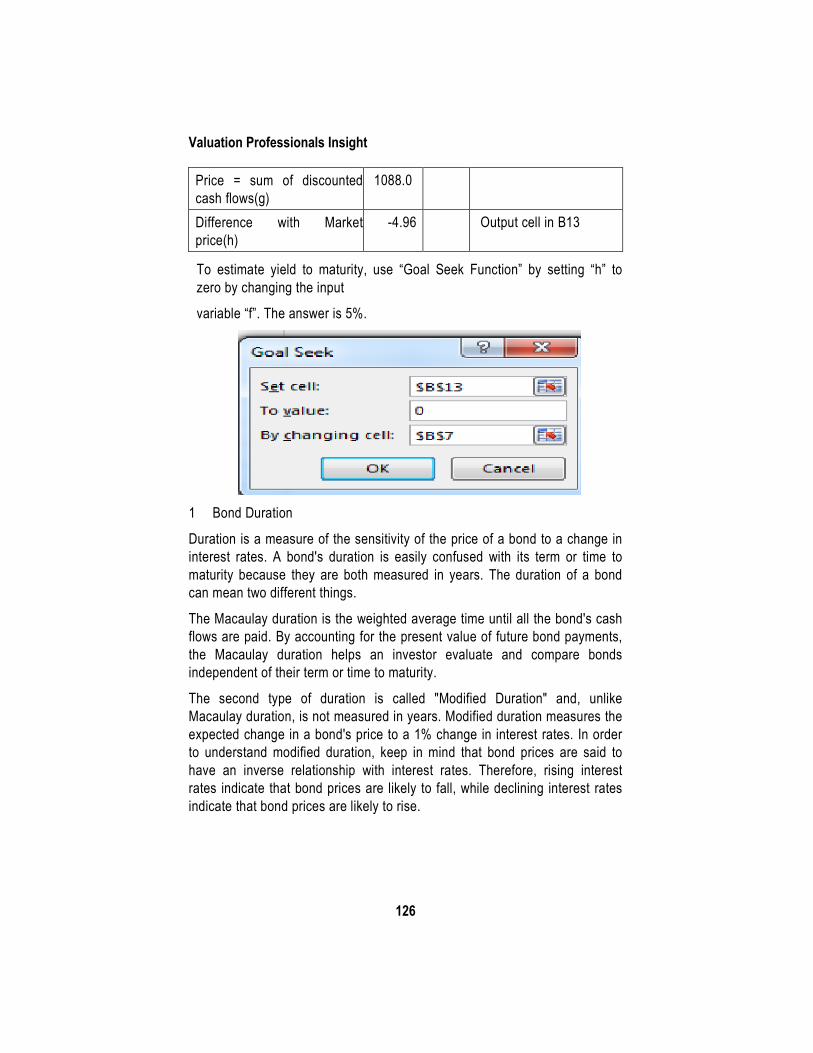
Valuation Professionals Insight
126
Price = sum of discounted cash flows(g)
1088.0
Difference with Market price(h)
-4.96 Output cell in B13
To estimate yield to maturity, use “Goal Seek Function” by setting “h” to zero by changing the input
variable “f”. The answer is 5%.
1 Bond Duration
Duration is a measure of the sensitivity of the price of a bond to a change in interest rates. A bond's duration is easily confused with its term or time to maturity because they are both measured in years. The duration of a bond can mean two different things.
The Macaulay duration is the weighted average time until all the bond's cash flows are paid. By accounting for the present value of future bond payments, the Macaulay duration helps an investor evaluate and compare bonds independent of their term or time to maturity.
The second type of duration is called "Modified Duration" and, unlike Macaulay duration, is not measured in years. Modified duration measures the expected change in a bond's price to a 1% change in interest rates. In order to understand modified duration, keep in mind that bond prices are said to have an inverse relationship with interest rates. Therefore, rising interest rates indicate that bond prices are likely to fall, while declining interest rates indicate that bond prices are likely to rise.
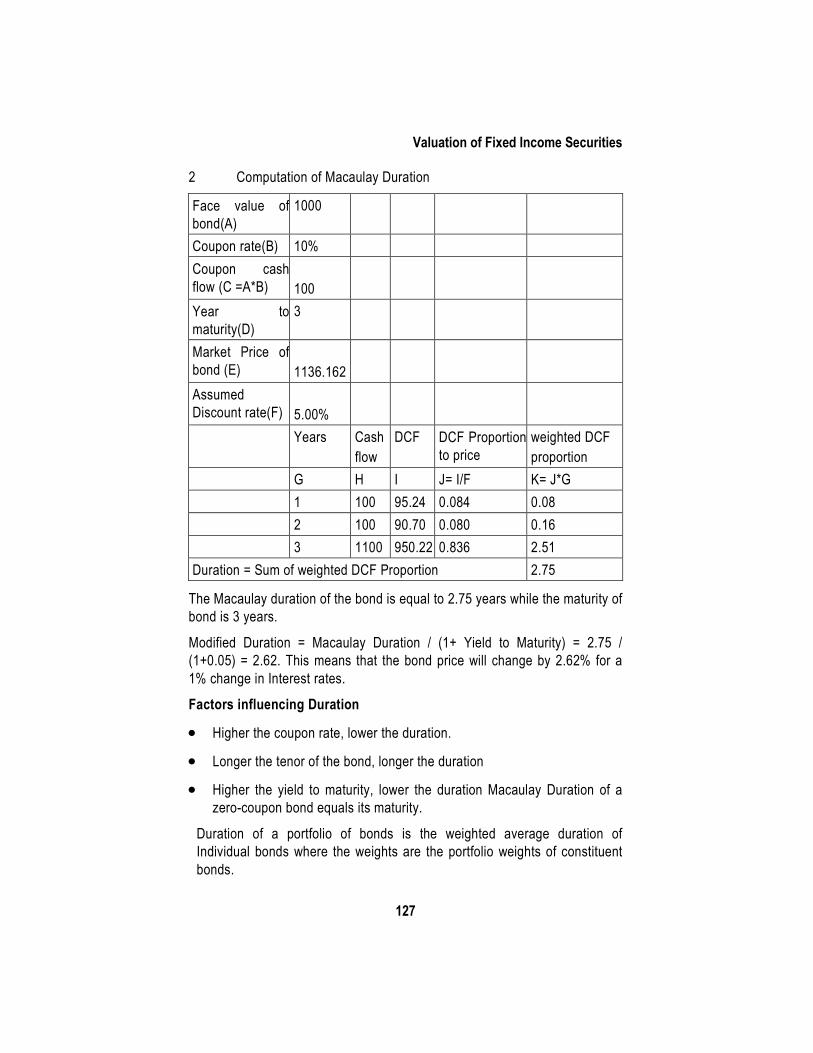
Valuation of Fixed Income Securities
127
2 Computation of Macaulay Duration
Face value of bond(A)
1000
Coupon rate(B) 10% Coupon cash flow (C =A*B)
100
Year to maturity(D)
3
Market Price of bond (E)
1136.162
Assumed Discount rate(F)
5.00%
Years Cash flow
DCF DCF Proportion to price
weighted DCF proportion
G H I J= I/F K= J*G 1 100 95.24 0.084 0.08 2 100 90.70 0.080 0.16 3 1100 950.22 0.836 2.51 Duration = Sum of weighted DCF Proportion 2.75
The Macaulay duration of the bond is equal to 2.75 years while the maturity of bond is 3 years.
Modified Duration = Macaulay Duration / (1+ Yield to Maturity) = 2.75 / (1+0.05) = 2.62. This means that the bond price will change by 2.62% for a 1% change in Interest rates.
Factors influencing Duration
• Higher the coupon rate, lower the duration.
• Longer the tenor of the bond, longer the duration
• Higher the yield to maturity, lower the duration Macaulay Duration of a zero-coupon bond equals its maturity.
Duration of a portfolio of bonds is the weighted average duration of Individual bonds where the weights are the portfolio weights of constituent bonds.
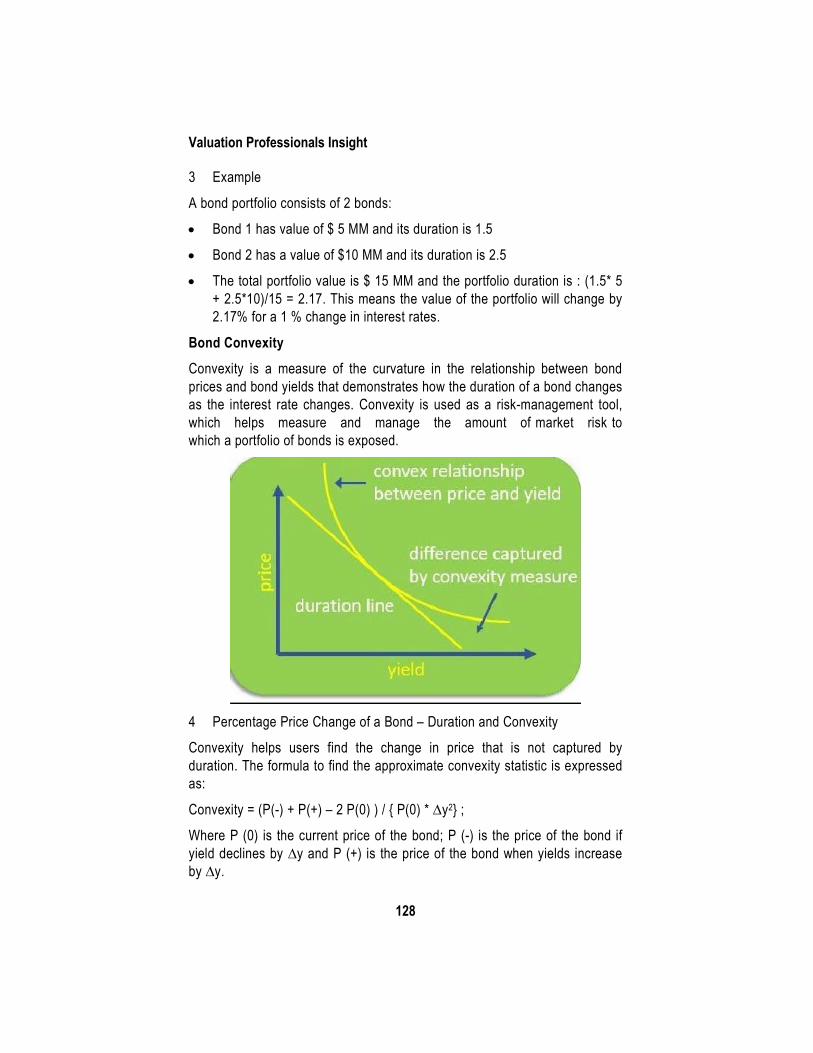
Valuation Professionals Insight
128
3 Example
A bond portfolio consists of 2 bonds:
• Bond 1 has value of $ 5 MM and its duration is 1.5
• Bond 2 has a value of $10 MM and its duration is 2.5
• The total portfolio value is $ 15 MM and the portfolio duration is : (1.5* 5 + 2.5*10)/15 = 2.17. This means the value of the portfolio will change by 2.17% for a 1 % change in interest rates.
Bond Convexity Convexity is a measure of the curvature in the relationship between bond prices and bond yields that demonstrates how the duration of a bond changes as the interest rate changes. Convexity is used as a risk-management tool, which helps measure and manage the amount of market risk to which a portfolio of bonds is exposed.
4 Percentage Price Change of a Bond – Duration and Convexity
Convexity helps users find the change in price that is not captured by duration. The formula to find the approximate convexity statistic is expressed as:
Convexity = (P(-) + P(+) – 2 P(0) ) / { P(0) * ∆y2} ;
Where P (0) is the current price of the bond; P (-) is the price of the bond if yield declines by ∆y and P (+) is the price of the bond when yields increase by ∆y.
Valuation of Fixed Income Securities
129
Using Duration and convexity, the correct price change for a bond is estimated as
∆p = - Duration * ∆Y + 0.5* Convexity * ∆Y2
Where ∆p represents the change in price and ∆Y the change in yield.
5 Conclusion
We learnt about the pricing of fixed income securities and the relationship between price of a bond and interest rates. We also learnt about sensitivity measures such as Duration and Convexity which capture the dynamics of the non-linear relationship between price and yields. The concept of duration and convexity can be aggregated to a portfolio of bonds to measure the impact of change in bond portfolio values for changes in interest rates.
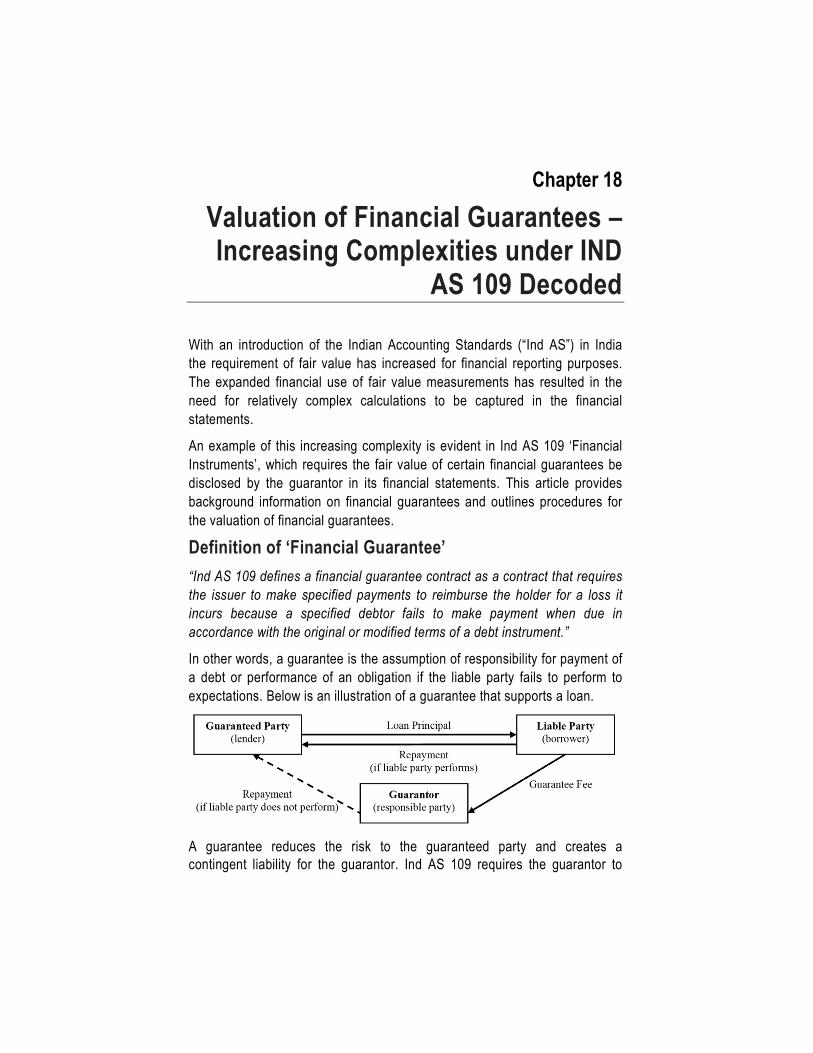
Chapter 18
Valuation of Financial Guarantees – Increasing Complexities under IND
AS 109 Decoded
With an introduction of the Indian Accounting Standards (“Ind AS”) in India the requirement of fair value has increased for financial reporting purposes. The expanded financial use of fair value measurements has resulted in the need for relatively complex calculations to be captured in the financial statements.
An example of this increasing complexity is evident in Ind AS 109 ‘Financial Instruments’, which requires the fair value of certain financial guarantees be disclosed by the guarantor in its financial statements. This article provides background information on financial guarantees and outlines procedures for the valuation of financial guarantees.
Definition of ‘Financial Guarantee’ “Ind AS 109 defines a financial guarantee contract as a contract that requires the issuer to make specified payments to reimburse the holder for a loss it incurs because a specified debtor fails to make payment when due in accordance with the original or modified terms of a debt instrument.”
In other words, a guarantee is the assumption of responsibility for payment of a debt or performance of an obligation if the liable party fails to perform to expectations. Below is an illustration of a guarantee that supports a loan.
A guarantee reduces the risk to the guaranteed party and creates a contingent liability for the guarantor. Ind AS 109 requires the guarantor to
Valuation of Financial Guarantees – Increasing Complexities under…
131
recognize the fair value of the financial guarantee contract on the transaction date.
Valuation of Financial Guarantees (Underlying Principles) Two underlying principles in guarantee valuation are:
First, the value of a risk-free transaction is equal to the value of a risky transaction plus the value of the guarantee. This relationship, which combines the risky transaction with the guarantee results in a synthetic risk-free transaction, can be stated as
(1) Value of Guarantee = Value of Risk-Free Transaction - Value of Risky Transaction Second, the second basic valuation principle is that the value of any contingent liability, including guarantees, equals its expected present value.
(2) Value of Guarantee = Present Value of the Probability-Weighted Estimated Cash Flows Fair Value Hierarchy
The valuation methodologies discussed in this article also consider the fair value hierarchy as prescribed in Ind AS 113 which are:
Level 1: Models and values based on external, quoted prices in active markets for identical assets/liabilities.
Level 2: Models and values based on external, quoted prices for similar assets/liabilities (with adjustments).
Level 3: Models and values based on internal inputs.
Valuation Methodologies A. Market Value Method
The market value method is the simplest to apply, but the required inputs are seldom available. It is consistent with Level 1 of the fair value hierarchy. Generally, it can be applied in two cases.
In the first case, the comparable risk-free (guaranteed) and risky (non-guaranteed) instruments exist with the liable party, the market values of these instruments are known and the value of the guarantee is simply the difference in the value of the risky and risk-free instruments. This could be applied to a guarantee on an entity that has both typical (risky) debt and guaranteed debt.
Valuation Professionals Insight
132
In the second case, a fee is received for providing the guarantee and the guarantee’s value is equal to the fee.
B. Credit Spread Method
The credit spread method is consistent with Level 2 of the fair value hierarchy. This method is based on the first valuation principle i.e.
Value of Guarantee = Value of Risk-Free Transaction - Value of Risky Transaction
The value of the guarantee calculated this way is valid only when the guarantor’s probability of default is zero.
Alternatively, we may calculate the approximate value of guarantee when the guarantor is not default-free by applying the below mentioned relationship,
Value of Guarantee = Value of Guaranteed Transaction - Value of Risky Transaction
The credit spread is the difference in the risky rate (i.e. non-guaranteed rate) and the rate with a guarantee. The value of the guaranteed obligation/loan is calculated by discounting the expected cash flows (principal and coupon payments under the risky rate) at the guaranteed rate, while the value of the non-guaranteed loan is discounted at the risky rate. The difference between the guaranteed and non-guaranteed values of the loan is the value of the guarantee. In general, discounting a risky loan at the risky rate for that loan should equal the initial amount lent, i.e., the value of the risky (non-guaranteed) loan is equal to the principal. Thus, in reality, the discounted cash flows at the guaranteed rate are being compared with the amount lent.
In most cases (the standard approach), the true/market discount rate of the guaranteed transaction is not known. In such instances, one can assume that the discount rate of the guaranteed transaction is the risk-free rate. This is a conservative assumption that will overstate the guarantee’s value. The higher the creditworthiness of the guarantor, the lower the deviation from the true value of the guarantee in the future. The below mentioned alternatives could be applied to value the guarantee more precisely.
Alternative one, the discount rate (bank lending rate) of the guarantor may be assumed as the discount rate of the guaranteed transaction. In effect, this says that the guaranteed transaction’s “risk” is equal to the risk that the guarantor will not perform. In reality, the guaranteed transaction is slightly
Valuation of Financial Guarantees – Increasing Complexities under…
133
less risky than this, because its “risk” actually occurs only when both the liable party and the guarantor fail to perform. Consequently, this approach will also tend to overstate the value, albeit slightly.
A second alternative is a theoretically correct method that accounts for the joint probability that both the liable party and the guarantor fail to perform. This method is the most accurate, but can be more complicated than the other methods.
If the standard approach is applied, the value of a particular guarantee will be the same regardless of the creditworthiness of the guarantor. If the first or second alternative approaches are used, the value (i.e., liability recognized) of a particular guarantee will be increased (decreased) as the credit worthiness of the guarantor increases (decreases).
The risky rate can be obtained or estimated in a number of ways, including a review of the known cost of debt (or borrowing rate), the applicable corporate bond yields and the cost of debt of entities with comparable credit ratings (or from comparable project financing rates).
C. Contingent Claims Valuation Methods
Guarantee contracts represent contingent claims into the future. Consequently, the methodology for pricing contingent claims could be applied to estimate the value of guarantees. This valuation approach can be used to value almost any type of guarantee.
The contingent claims method is consistent with Level 3 of the fair value hierarchy, and it is based on the second valuation principle described earlier:
Value of Guarantee = Present Value of the Probability - Weighted Estimated Cash Flows
There are various valuation methodologies within the Contingent Claims Valuation methods which can be applied to determine the fair value of a financial guarantee depending upon the availability of relevant inputs for the application of these methodologies. Some of the methods are:
(a) Loan Guarantee as a Put Option
(b) Binomial Tree with the Actual Probabilities of Default
(c) Binomial Tree with Given Risk-Neutral Probabilities of Default
(d) Monte Carlo Simulation Method

Valuation Professionals Insight
134
Based on the availability of relevant inputs, the put option method is one of the most practical methods to apply to determine the fair value of financial guarantee in Indian context. Accordingly, in this article, we have explained in detail the computation of fair value of financial guarantee as a put option
Guarantee as a put option
A risk-free loan is equivalent to a risky loan and a guarantee, is also equivalent to a portfolio of a risky loan and a put option. A put option gives the owner the right, but not the obligation, to sell an asset for a pre-specified price (the exercise price) on or before a certain maturity date.
A guarantee is a put option on the assets of the firm with an exercise price equal to the face value of the debt.
Consider the following:
Let ‘V’ be the value of a firm and ‘F’ be the face value of its debt. For simplicity, assume there are no coupon payments and all the debt mature on a specified date. Also consider a put option purchased by the lender on the assets of the firm, with an exercise price F.
Two scenarios are possible at maturity, one where the value of the firm is less than F and the other where it is greater than F. When V is greater than F, full repayment of debt can be expected and the put option is not exercised so its value is zero. However, when V is less than F, then the put option is exercised and has a net value of F-V, with the lender receiving the exercise price, F, for assets which are worth V.
Thus, when V is greater than F, the value of the risky bond is F. But, when V is less than F, the value of the bond is V since debt holders are priority claimants on assets of the firm. The value of the risk-free bond is always F, by definition. The difference between the value of the risky bond and the risk-free bond is also the value of the put option.
Therefore, from the above analysis it follows that:
Value of Risky Loan = Value of Risk-free Loan - Value of Put Option.
In other words,
Value of Risky Loan = Value of Risk-free Loan - Value of Loan Guarantee.
A comparison of the above two equations indicates that the value of the guarantee can be estimated by computing the value of the put option.
Valuation of Financial Guarantees – Increasing Complexities under…
135
The guarantee, or option, value is sensitive to factors such as the time to maturity, the volatility of the underlying asset, the value of the underlying asset, and the claims of other debt and equity holders. To capture the time-varying effects of these and other parameters, a fully specified dynamic model is needed, as in contingent claims, or option pricing, analysis.
As shown by Merton (1977), a loan guarantee for a single, homogenous term discount debt is equivalent to a put option written on the assets of the borrower, with:
• An exercise price equal to the maturity value of the debt obligation,
• Maturity corresponding to that of the loan and;
• The value of the firm’s assets as the underlying.
Observe that at any point of time there are two possible outcomes: the liable party is either solvent or bankrupt.
In the first case, the guarantor is not called upon, because the firm has sufficient funds to honour its commitments. In the second case, the value of debt (Dt) is higher than the value of the firm (Vt), and the guarantor has to cover the difference (Dt - Vt). Thus, the payoff of the guarantee is either 0 (when Vt ≥ Dt; i.e., the firm is solvent), or Dt - Vt (when Vt < Dt).
As a result, Guarantee Payoff = max {0, Dt - Vt}. For computing the fair value of guarantee, the Black-Scholes option pricing formula can be applied. Giving the value of guarantee (G) as
𝐺 = −𝑉0 × 𝑁(−𝑑1) + 𝐷 × 𝑒−𝑟𝑡 × 𝑁(−𝑑2)
where
𝑑1 = ln �𝑉0
𝐷�+ �𝑟 + 𝜎𝑣
2
2� 𝑡
𝜎𝑣√𝑡
𝑑2 = 𝑑1 − 𝜎𝑣√𝑡
N(.) is the cumulative standard normal density function; 𝜎𝑣 is the volatility of the returns on the borrower’s assets (“Asset Volatility”); D is the amount of debt interest and principal due to be repaid at time t; and V0 is the value of the borrower’s assets today. Notice that N(-d2) is just the risk-neutral probability of default.
The above solution for the value of the guarantee requires estimates of both the market value of the borrower’s assets, V, and the volatility of their returns,
Valuation Professionals Insight
136
𝜎𝑣 . Both of these variables cannot be observed. However, if the liable party is a publicly traded company, we can observe the company’s equity value today, E0, and its volatility, 𝜎𝐸. Black and Scholes (1973) demonstrated that a firm’s equity at maturity of the debt can be interpreted as the value of a call option on its own assets, i.e.: Et = max {0, Vt - D}
Thus, using the Black-Scholes call option formula gives us the value of the equity today:
𝐸0 = 𝑉0 × 𝑁(𝑑1)− 𝐷 × 𝑒−𝑟𝑡 × 𝑁(𝑑2)
where N(.), d1 and d2 are as before.
By applying Ito’s lemma to dE(V ,t), we can get the following relationship:
𝜎𝐸 = 𝑁(𝑑1) 𝜎𝑣 𝑉0
𝐸0
Accordingly, we have two equations that have to be solved for the two unknowns, V0 and 𝜎𝑣. By applying the concept of Merton theory and using solver function in excel, we can calculate V0 and 𝜎𝑣. Together with the other known variables, D and t, they can be inserted in the previously described formula for the loan guarantee (G) and thus obtain the value of the guarantee.
Illustration: Determination of fair value of financial guarantee by the Contingent Claim Method (as a Put Option).
Key Facts:
A Holding Company “H” has given a financial guarantee for a loan taken by its Subsidiary Company “S” having the following terms:
• Term Loan Amount: INR 1,00,000
• Tenure: 1 year
Other points for consideration
• Subsidiary Company is a listed company having market capitalization of INR 25,000 as of the valuation date
• Subsidiary Company has no loan other than the term loan of INR 1,00,000
• Equity Volatility (1-year) on the equity stock of “S”: 60%
• Corporate Guarantee has been given for the entire loan amount of INR 1,00,000
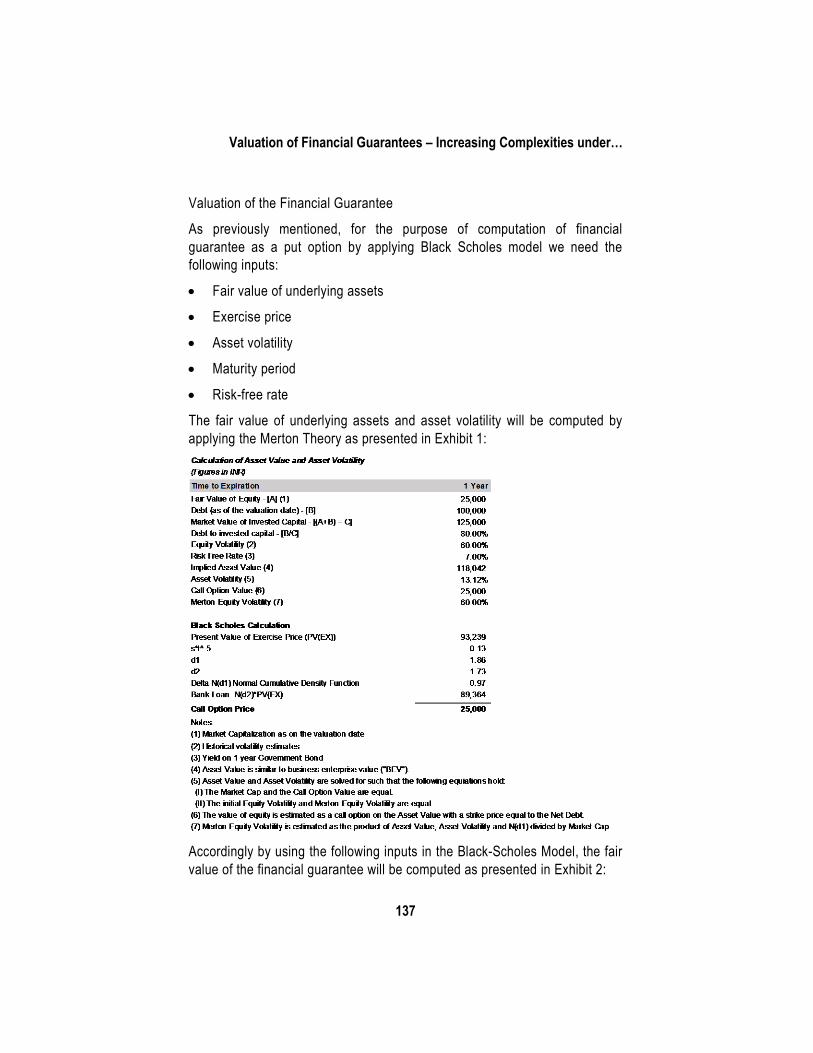
Valuation of Financial Guarantees – Increasing Complexities under…
137
Valuation of the Financial Guarantee
As previously mentioned, for the purpose of computation of financial guarantee as a put option by applying Black Scholes model we need the following inputs:
• Fair value of underlying assets
• Exercise price
• Asset volatility
• Maturity period
• Risk-free rate
The fair value of underlying assets and asset volatility will be computed by applying the Merton Theory as presented in Exhibit 1:
Accordingly by using the following inputs in the Black-Scholes Model, the fair value of the financial guarantee will be computed as presented in Exhibit 2:
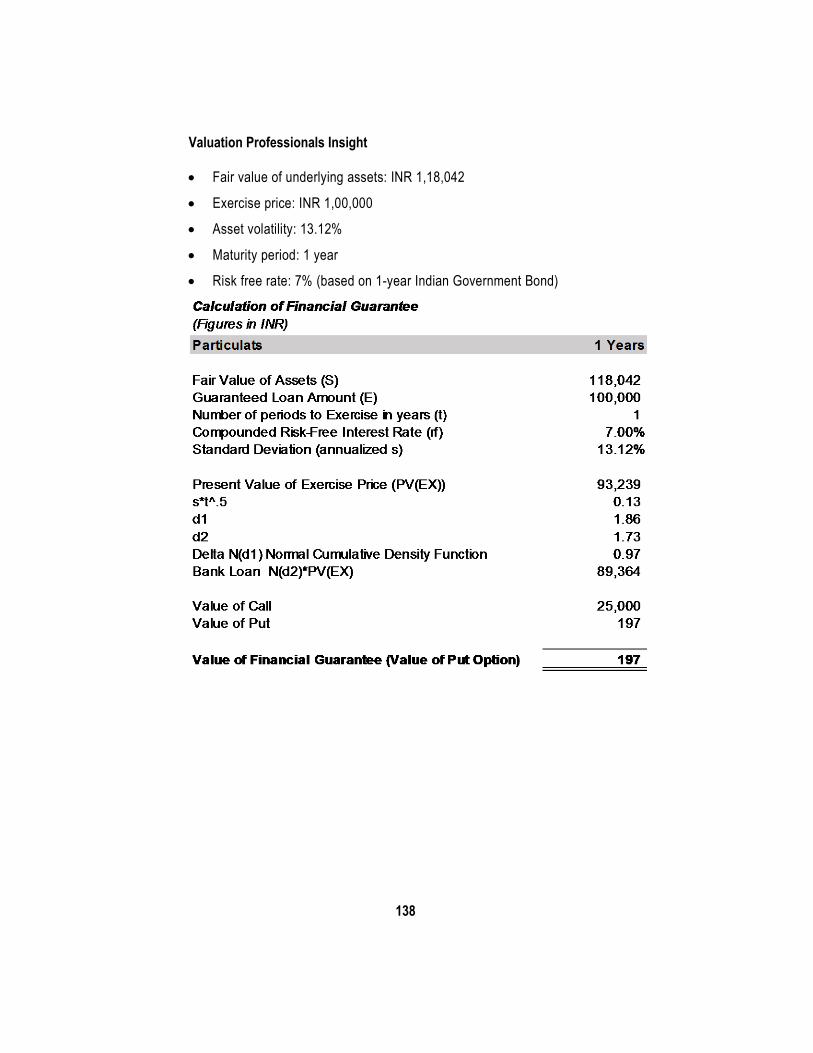
Valuation Professionals Insight
138
• Fair value of underlying assets: INR 1,18,042
• Exercise price: INR 1,00,000
• Asset volatility: 13.12%
• Maturity period: 1 year
• Risk free rate: 7% (based on 1-year Indian Government Bond)
Chapter 19
ESOP as a Share Based Transaction
1. Share Based Payment Transactions (SBT) are those where an entity receives goods or services and settles the payment through issue of equity instruments such as shares or share options. The basic test is the existence of an arrangement between the entity (or its group company) and a party (supplier or employee). Even if the goods and services are not specifically identifiable wholly or in part, as long as the consideration is settled through equity instruments, the transaction qualifies as an SBT.
2. In an SBT, there is a need to recognize the accounting impact of the transaction when the goods or services are received by the entity.
(a) Goods may be in the nature of raw materials, consumables etc. in which case the SBT is accounted as an expense; or assets, in which case the SBT is capitalized as an asset. A liability is correspondingly created for the outstanding shares to be issued.
(b) Services may be in the nature of employees performing as per their employment contract. The SBT is expensed as a compensation expense over the period of the arrangement. A liability is created for the outstanding shares to be issued every year over the period of the arrangement.
3. In case of goods received, the measurement of the date and value of goods received is usually reliable. Recognizing the accounting impact would be based on the value of the goods received. However, in the case of services received, a reliable measure of valuing the services is not available. For example, in the case where employees are awarded stock options as an incentive over and above their remuneration, it is difficult to attribute a value to the component of service rendered by the employee to earn or vest-in the options. In such cases, the value of the equity instrument (shares or options) which is awarded as the consideration is taken as the value of the services. This gives rise to a need for valuation of the equity instruments (shares or options).
ESOPs : features 4. Corporates are globally adopting asset-light business models and rely
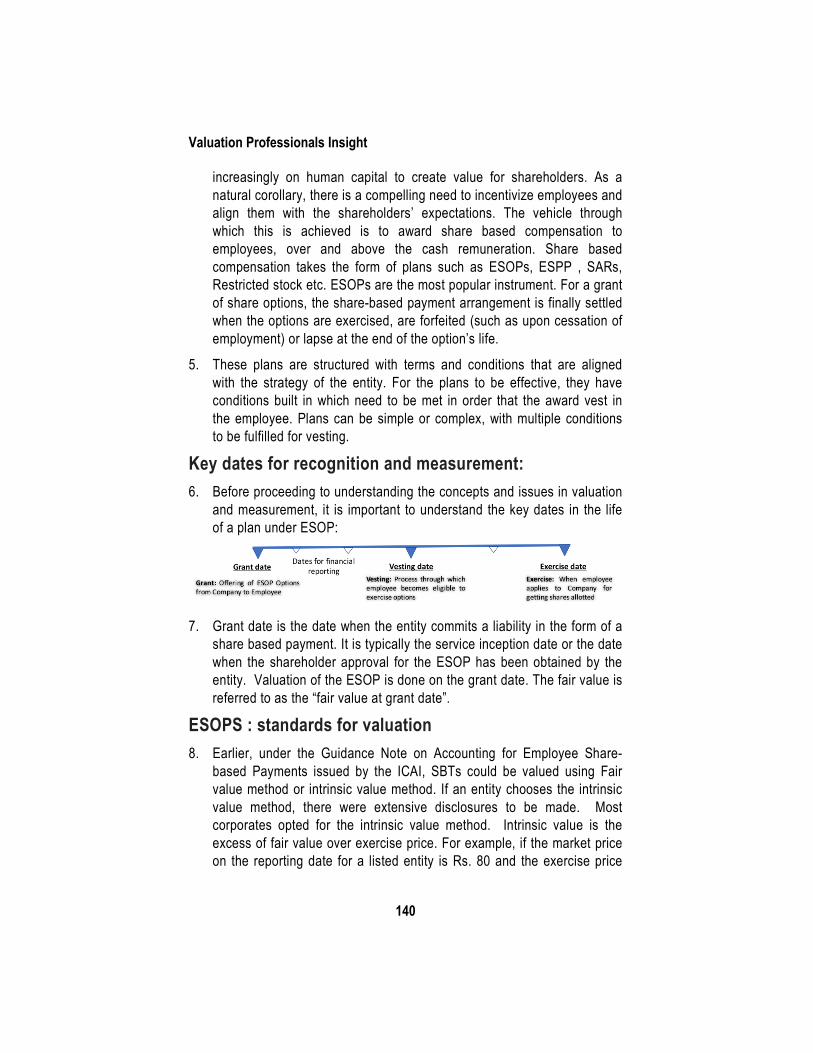
Valuation Professionals Insight
140
increasingly on human capital to create value for shareholders. As a natural corollary, there is a compelling need to incentivize employees and align them with the shareholders’ expectations. The vehicle through which this is achieved is to award share based compensation to employees, over and above the cash remuneration. Share based compensation takes the form of plans such as ESOPs, ESPP , SARs, Restricted stock etc. ESOPs are the most popular instrument. For a grant of share options, the share-based payment arrangement is finally settled when the options are exercised, are forfeited (such as upon cessation of employment) or lapse at the end of the option’s life.
5. These plans are structured with terms and conditions that are aligned with the strategy of the entity. For the plans to be effective, they have conditions built in which need to be met in order that the award vest in the employee. Plans can be simple or complex, with multiple conditions to be fulfilled for vesting.
Key dates for recognition and measurement: 6. Before proceeding to understanding the concepts and issues in valuation
and measurement, it is important to understand the key dates in the life of a plan under ESOP:
7. Grant date is the date when the entity commits a liability in the form of a
share based payment. It is typically the service inception date or the date when the shareholder approval for the ESOP has been obtained by the entity. Valuation of the ESOP is done on the grant date. The fair value is referred to as the “fair value at grant date”.
ESOPS : standards for valuation 8. Earlier, under the Guidance Note on Accounting for Employee Share-
based Payments issued by the ICAI, SBTs could be valued using Fair value method or intrinsic value method. If an entity chooses the intrinsic value method, there were extensive disclosures to be made. Most corporates opted for the intrinsic value method. Intrinsic value is the excess of fair value over exercise price. For example, if the market price on the reporting date for a listed entity is Rs. 80 and the exercise price
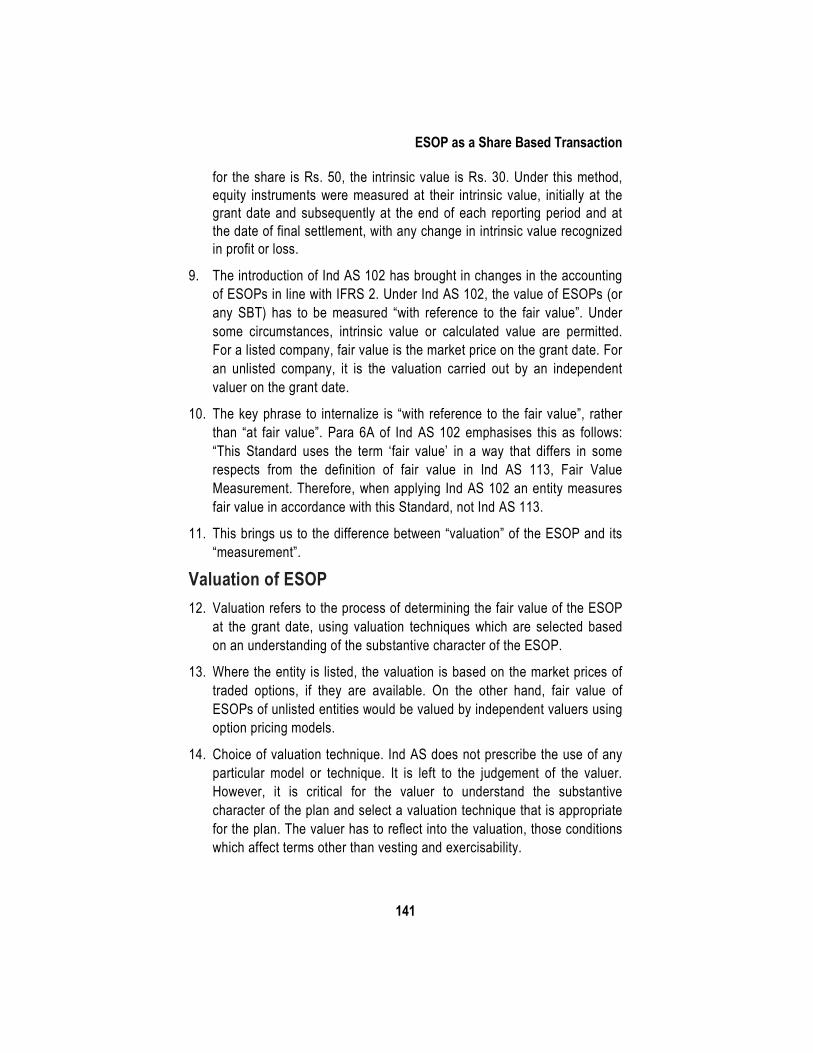
ESOP as a Share Based Transaction
141
for the share is Rs. 50, the intrinsic value is Rs. 30. Under this method, equity instruments were measured at their intrinsic value, initially at the grant date and subsequently at the end of each reporting period and at the date of final settlement, with any change in intrinsic value recognized in profit or loss.
9. The introduction of Ind AS 102 has brought in changes in the accounting of ESOPs in line with IFRS 2. Under Ind AS 102, the value of ESOPs (or any SBT) has to be measured “with reference to the fair value”. Under some circumstances, intrinsic value or calculated value are permitted. For a listed company, fair value is the market price on the grant date. For an unlisted company, it is the valuation carried out by an independent valuer on the grant date.
10. The key phrase to internalize is “with reference to the fair value”, rather than “at fair value”. Para 6A of Ind AS 102 emphasises this as follows: “This Standard uses the term ‘fair value’ in a way that differs in some respects from the definition of fair value in Ind AS 113, Fair Value Measurement. Therefore, when applying Ind AS 102 an entity measures fair value in accordance with this Standard, not Ind AS 113.
11. This brings us to the difference between “valuation” of the ESOP and its “measurement”.
Valuation of ESOP 12. Valuation refers to the process of determining the fair value of the ESOP
at the grant date, using valuation techniques which are selected based on an understanding of the substantive character of the ESOP.
13. Where the entity is listed, the valuation is based on the market prices of traded options, if they are available. On the other hand, fair value of ESOPs of unlisted entities would be valued by independent valuers using option pricing models.
14. Choice of valuation technique. Ind AS does not prescribe the use of any particular model or technique. It is left to the judgement of the valuer. However, it is critical for the valuer to understand the substantive character of the plan and select a valuation technique that is appropriate for the plan. The valuer has to reflect into the valuation, those conditions which affect terms other than vesting and exercisability.
Valuation Professionals Insight
142
Measurement of ESOP 15. Measurement goes beyond estimation of the fair value. The
measurement objective for equity instruments awarded to employees is to estimate the fair value at the grant date of the equity instruments that the entity is obligated to issue when employees have rendered the requisite service and satisfied any other conditions necessary to earn the right to benefit from the instruments.
16. “Measurement” as per Ind AS 102 refers to the amount that is considered for accounting and reporting purposes. It is based on the fair value at the grant date. The fair value per instrument is considered based on the valuation; no change is made to it. However, for accounting and reporting purposes, measurement is arrived at by adjusting the fair value with the probable effects of certain types of conditions. The adjustment is done by changing the number of instruments that are likely to vest upon fulfilment of these conditions.
17. The following chart depicts the timing of valuation and measurement.
Impact of conditions on the valuation of ESOP 18. There are four types of conditions that typically feature in ESOPs:
Service, performance market and other conditions. ESOPs are often structured with combinations of these conditions, rendering them complex instruments to value and measure.
19. Some conditions have a valuation impact and some have measurement impact. It depends on the nature of the condition. Conditions that affect the employee’s ability to vest in the equity instruments, are not directly factored into the fair value. Conditions that affect exercise price, term, quantity of instruments, conversion ratio etc. are factored in the fair value on grant date for every possible outcome.
20. Vesting conditions: In a typical ESOP, certain conditions are drafted as
ESOP as a Share Based Transaction
143
part of the ESOP plan that need to be fulfilled by the employee for the equity instrument to vest as per the plan.
(i) Service conditions: that the employee has to serve “x” number of years of service for the equity instrument to vest.
(ii) Performance conditions : that , apart from a service condition, the employee also achieves a specific target such as sales of a particular product or obtains a regulatory approval to market specified products
(a) The conditions affect the vesting or exercisability are not factored in the fair value on the grant date. Since service and performance conditions affect the employee’s ability to vest in the equity instrument, it is not directly factored into the fair value.
(b) However, they are considered for measurement of accounting impact. When it becomes probable that the condition will be fulfilled, they are accounted as compensation. To the extent the condition is not fulfilled, they are not recognized for measurement in accounting.
21. Non vesting conditions
(a) Market conditions: the options vest only when the entity’s share prices touch a specific level or when the exercise price is linked to the Sensex. This condition is not directly related to the employee’s performance or ability to earn or vest-in the instrument. Hence it is directly factored into the computation of fair value at grant date. Since every possible outcome needs to be mapped as an input, in computing the fair value to incorporate market conditions, path dependent models such as Monte Carlo simulation and lattice models are deployed.
(b) Other conditions: when the options are indexed to a factor other than service, performance or market. These could be in the nature of restricted stock options that indexes the quantityof shares that will vest to oil price changes.
22. Reload options :
Where the employee is automatically granted additional options (with exercise price of additional options being equal to the market price on the date of reload) in exercise of her options in the original plan, the granting
Valuation Professionals Insight
144
of additional options is treated as a separate plan and does not affect the valuation of the original plan being valued.
23. Contingent features:
When an employee departs during the grant period and joins a competitor or if an employee makes a material misstatement or violates the code of conduct, adversely impacting the entity’s reputation, then there is a claw back feature that kicks in where the employee is forced to return the equity vested. This does not affect the fair value of the plan. It is treated as a credit to the income.
24. Post vesting Restrictions:
(a) These are conditions that restrain the employee from selling or transferring vested shares or options to third parties.
(b) It is a condition imposed after the employee has earned the right to the shares and has the effect of altering the employee’s expected exercise behaviour post vesting. The effect of non transferability is taken into account by reflecting the effects of employees’ expected exercise and post-vesting employment termination behavior in estimating fair value.
Conclusion The list of possible conditions and possible combinations of conditions in an ESOP is hardly an exhaustive list. The conditions in an ESOP need to be thoroughly understood by the valuer as a prerequisite to the selection of valuation technique. An entity may grant different types of instruments, each with its own unique set of substantive characteristics and the entity may use a different valuation technique for each different type of instrument. A grasp of the substantive character of the ESOP and its terms and conditions would set the ground for the valuer to exercise sound judgement on the valuation techniques to be deployed.
Chapter 23
Valuation of Options
Meaning of Options An option is a financial contract that gives an investor the right, but not the obligation, to either buy or sell an asset at a strike price by an expiration date. Since it is a right and not an obligation, the holder of an option can choose not to exercise the right and can allow option to expire.
Assets that requires option valuations The following characteristics of assets requires option valuations
1. Those derive value their value from the values of other assets.
2. The cash flows on the assets are contingent on the occurrence of specific events.
Call options and Put options Call options are an agreement that give the option buyer the right, but not the obligation, to buy a stock, bond, commodity or other instrument at a specified price within a specific time period. The stock, bond, or commodity is called the underlying asset.
A put option is an option contract giving the owner the right, but not the obligation, to sell a specified amount of an underlying security at a specified price within a specified time frame.
A call option gives the buyer the right to buy the underlying asset at the strike price or the exercise price at any time prior to the expiration date of the option.
A put option gives the buyer, the right to sell the underlying asset at the strike price or the exercise price, at any time prior to the expiration of the option.
The exercise price or the strike price is the price at which an underlying asset can be purchased or sold at when trading a call or put option. It is the price at which trade is taken and established when a contract is first written.
As an example, if an investor owns call option for a stock trading at Rs.100 with an exercise price of Rs.90, it means the call options are trading in the
Valuation Professionals Insight
146
money by Rs.10. The exercise price is lower than the price which the stock is currently trading. The call options give the investor the right to buy the stock at Rs.90 even though it is trading at Rs.100, allowing investor to make Rs.10 profit per stock. The net gain on the stock would be Rs.10 less the premium or cost paid for the cost of an option.
If an investor holds the option at Rs.110 and the option is out of the money by Rs.10. It would not be beneficial for the call buyer to exercise that option.
In the same exercise, the put option can be explained. If put option with strike price of Rs.110 with the stock price of Rs.100 will give an investor, the profit of Rs.10 per stock. He has right to sell at Rs.110 when stock prices are trading at Rs.100 which will leave him a profit of Rs.10. The net gain on the stock would be Rs.10 less the premium or cost paid for the cost of an option.
Determinants of Option Value There are several factors that determine the value of an option.
1. The current price of the underlying stock or security
This is one of the most important factors that determines the value of an option. Assuming all other factors remain constant, the higher the stock price, the greater will be the value of call option and the lower will be the value of the put option.
2. The Exercise or Strike Price
The higher the strike price for a given set of values of the other variables, the lower will be the value of a call option and the higher will be the value of a put option.
3. Dividends
Normally dividend payments will lead to drop in stock prices. Therefore, dividends paid during the life of an option, will lead to reduction in call values and increase in put values.
4. Variance in the value of the underlying asset
The higher the volatility or variance in the underlying asset, the greater the value of the option. It is always perceived that an increase in the volatility results in positive reaction and helps the increase in the value of an option. It applies to both call as well put option.
Valuation of Options
147
5. Time to expiration of stock or underlying asset
The greater the time to expiration, both calls and puts are more valuable. If you give more time of expiration to an underlying asset to move, it will result in increasing the value of both the types of options.
6. Risk free interest rate
This factor considers the opportunity cost whilst buyer pays premiums for an option. This can be explained with an example: Purchasing 100 shares at Rs.100 will require Rs.10, 000, which assuming a trader borrows money for trading, will lead to interest payments. Purchasing the call option at Rs.12 in a lot of 100 contracts will cost only Rs.1, 200. Effectively, the differential of Rs.8, 800 (Rs.10,
000-Rs.1, 200) will result in savings of outgoing interest payments on this loaned amount. Alternatively, the saved capital of Rs.8, 800 can be kept in an interest bearing account and will result in interest income – at 7% i.e. Rs.616. Hence, an increase in interest rates will lead to either saving in outgoing interest on loaned amount or an increase in the receipt of interest income on the saving account. Both will be positive for this call position and savings. Therefore, a call option’s price increases to reflect this benefit from increased interest rates. This also reduces the value of puts. In nutshell, increase in interest rates, increases call option values and reduces value of puts.
Summary of Determinants that affect value of an option
S. No Factor Call Value Put Value
1. Increase in underlying assets value
Increases Decreases
2. Increase in volatility Increases Increases
3. Increase in Exercise or Strike price
Decreases Increases
4. Dividends pay out Decreases Increases
5. Increase in time to expiration
Increases Increases
6. Increase in interest rates Increases Decreases
Valuation Professionals Insight
148
Option Pricing Models An Option pricing theory in any model or theory based approach for calculating the fair value of an option. The Option pricing models are mathematical models that use certain variables to calculate the theoretical value of an option. The evolution of the modern-day options market is attributed to the 1973 pricing model published by Fischer Black and Myron Scholes. The Black-Scholes formula is used to derive a theoretical price for financial instruments with a known expiration date. The Cox, Ross, and Rubinstein binomial options pricing model is also widely used.
Options may also be classified according to their exercise time:
1. European style options may be exercised only at the expiration date.
2. American style options can be exercised anytime between purchase and expiration date.
The abovementioned classification of options is extremely important because choosing between European-style or American-style options will affect our choice for the option pricing model.
We will now study these two models i.e. Binomial Model and Black-Scholes Model.
The Binomial Model The simplest method to price the options is to use a binomial option pricing model. This model uses the assumption of perfectly efficient markets. Under this assumption, the model can price the option at each point of a specified timeframe.
Under the binomial model, we consider that the price of the underlying asset will either go up or down in the period. Given the possible prices of the underlying asset and the strike price of an option, we can calculate the payoff of the option under these scenarios, then discount these payoffs and find the value of that option as of today.
The binomial option model is a formation for the asset price that can move to one of two possible prices. The binomial model assumes that the given stock price, can either change by X% or by Y%, during the next period where X and Y are specified. Since the stock price can take on only either of two possible values at the end of the period, the model is called Binomial. There are assumptions under this model as follows:

Valuation of Options
149
Assumptions under the Binomial Model 1. There is one risk free rate in the economy and everyone can borrow or
lend unlimited amounts at this rate.
2. There are no transaction costs or taxes
3. No margin requirements
4. The securities are infinitely divisible and investors can trade in fractions
5. The possibility to use the full proceeds from a short sale, if an asset is sold short.
6. Possible direct consequence of arbitrage. If an option value deviates from the value of the replicating portfolio, the investors can create an arbitrage position.
The Binomial Tree – Two Period Binomial Model Period 1 Period 2
In the picture above, where stock prices can move either up to Su or down to Sd in any time period, the replicating portfolio for a call with strike price ‘KP’ will involve borrowing ‘B’ and acquiring ‘X’ number of the underlying asset, where X = Number of units of the underlying asset bought = Cu – Cd Su - Sd

Valuation Professionals Insight
150
Where Cu = Value of the call if the stock price is Su
Cd= Value of the call if the stock price is Sd
The portfolios replicating the option are created at each step and valued, providing the values for the option in that time period. The final outcome from the binomial option is a statement of the value of the option in terms of the replicating portfolio, consists of ‘X’ shares of the asset and risk free rate
Value of the call = Current value of the underlying asset * X – Borrowing that required to replicate the option.
The Black-Scholes Model The Black-Scholes model was developed mainly for the pricing European options on stocks. The model operates under the certain assumptions regarding the distribution of the stock price and the economic environment.
Assumptions under the Black-Scholes Model 1. There are no frictions in the market such as transaction costs or taxes.
2. No margin requirements
3. The investor is entitled to use the full proceeds from a short sale, if an asset is sold short.
4. Investors can trade in fractions of securities
5. A single riskless rate of return in the economy and it is constant.
6. No dividends paid during the life of a security
7. All securities are traded continuously
8. Securities follow lognormal process
9. Arbitrage opportunities will be fully exploited till they cease to exist.
The main variables used in the Black-Scholes model include:
- Price of underlying asset (S) is a current market price of the asset
- Strike price (K) is a price at which an option can be exercised - Volatility (σ) is a measure of how much the security prices will move in
the subsequent periods. Volatility is the trickiest input in the option pricing model as the historical volatility is not the most reliable input for this model
Valuation of Options
151
- Time until expiration (T) is a time between calculation and option’s exercise date
- Interest rate (r) is a risk-free interest rate
Monte Carlo Simulation Model There are other valuation models which include Monte Carlo Simulation that helps to understand the impact of risk and uncertainty in financial, project management and other forecasting models. It performs risk analysis by building models of possible results by substituting a range of values—a probability distribution—for any factor that has inherent uncertainty. It then calculates results over and over, each time using a different set of random values from the probability functions.
Greek Symbols The rate of change of the option price is denoted by various symbols and it is better to understand these symbols. These symbols are called ‘Greek’
1. Delta Δ – Delta represents the rate of change of the option premium with respect to the price of the underlying asset, keeping all the other variables constant.
2. Gamma ("γ ") – The rate of change of Delta with respect to the asset price is called Gamma of the option. It is always positive and tends to be at its peak when the option is near the money.
3. Vega - It is the derivative of the option price with respect to the volatility or the standard deviation of the rate of return of the underlying asset. The Vega will be positive for both call and put options.
4. Theta θ - Theta is a measure of the time decay of the option premium. It is expressed as the negative of the rate of change of the option premium with respect to time to maturity.
5. Rho ρ - Rho represents the rate of change of the option premium with respect to the riskless rate of interest. For call options, it will be positive and negative for put options.
Conclusion In this article, we have attempted to explain the meaning of options with the types, determinants of options, Option models and the meaning of Greek

Valuation Professionals Insight
152
symbols. This article is also useful for the students who are undertaking valuation of securities or financial assets examination. The key terms have been given in the article to understand the meaning of various option models, Greek symbols etc.
Chapter 22
Purchase Price Allocation
The last several years have seen an increased focus by companies on mergers and acquisitions as a means of stabilising their operations and increasing stakeholder value by achieving strategic expansion and cost reduction through business combinations. These transactions provide inorganic growth and significant benefits to an acquirer, but the related accounting process is very complex.
A transaction would be perceived differently owing to the new accounting standards i.e. Indian Accounting Standards (“Ind AS”) kicking in India. Ind AS focuses on the substance of the transaction rather than merely the form or nomenclature of the transaction.
One of the key impact areas is Business combination as defined in Ind AS 103. It not only deals with amalgamation but also all such transactions which result in acquisition of control over business or an entity (by way of demergers, slump sale, share purchase, capital reduction, buy back etc.)
Ind AS 103 ‘Business Combinations’ requires an extensive analysis to be performed in order to accurately identify, recognize and measure the tangible & intangible assets acquired and liabilities assumed in a business combination at fair value.
The accounting for intangible assets acquired in a business combination is particularly challenging for several reasons. Intangible assets are by nature less detectable than tangible ones. Most of the intangibles are not recognised in the acquiree’s pre-acquisition financial statements. Determining their fair value usually involves estimation techniques as quoted prices are rarely available.
Where an ‘intangible resource’ is not recognised as an intangible asset, it is subsumed into goodwill. Some acquirers might be motivated to report fewer intangibles, and higher goodwill, because most intangible assets must be amortised whereas goodwill undergo an impairment testing only. However, a high goodwill figure can create the impression that the acquirer overpaid for the acquired business. Further, it may also raise questions on the correct application of Ind AS 103.
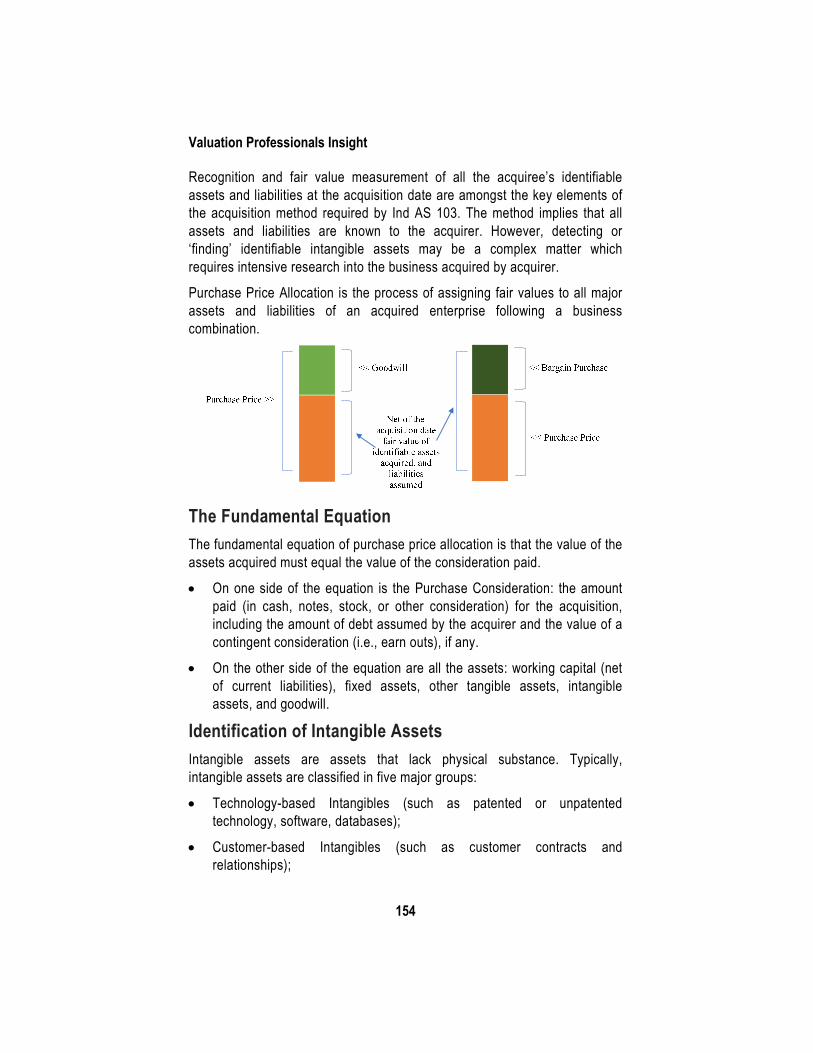
Valuation Professionals Insight
154
Recognition and fair value measurement of all the acquiree’s identifiable assets and liabilities at the acquisition date are amongst the key elements of the acquisition method required by Ind AS 103. The method implies that all assets and liabilities are known to the acquirer. However, detecting or ‘finding’ identifiable intangible assets may be a complex matter which requires intensive research into the business acquired by acquirer.
Purchase Price Allocation is the process of assigning fair values to all major assets and liabilities of an acquired enterprise following a business combination.
The Fundamental Equation The fundamental equation of purchase price allocation is that the value of the assets acquired must equal the value of the consideration paid.
• On one side of the equation is the Purchase Consideration: the amount paid (in cash, notes, stock, or other consideration) for the acquisition, including the amount of debt assumed by the acquirer and the value of a contingent consideration (i.e., earn outs), if any.
• On the other side of the equation are all the assets: working capital (net of current liabilities), fixed assets, other tangible assets, intangible assets, and goodwill.
Identification of Intangible Assets Intangible assets are assets that lack physical substance. Typically, intangible assets are classified in five major groups:
• Technology-based Intangibles (such as patented or unpatented technology, software, databases);
• Customer-based Intangibles (such as customer contracts and relationships);
Purchase Price Allocation
155
• Marketing-based Intangibles (such as trademarks, distribution arrangements, and non-compete agreements);
• Artistic / Creative Intangibles (such as plays, books, and movies); and
• Contract-based Intangibles (such as licensing/royalty arrangements or supplier contracts).
Intangible assets can be considered either “identifiable” (and therefore need to be valued separately) or “not identifiable” (and can be considered as a part of goodwill).
There are two criteria for determining if an intangible asset is identifiable and needs to be valued are as under:
• Separability - Separable means the asset can be separated and sold off or licensed independently from the business. It does not matter whether there is an intent to sell off the asset. If it could be sold, then it must be valued.
• Contractual or other legal right - A contractual or legal right must be valued even if it is not separable. An example might be a wireless spectrum license: if a firm bought a wireless communications company, the license would need to be valued even though it is difficult to imagine how the business could operate without the right to use the spectrum.
How the Identified Intangible Assets Are Valued The valuation methodologies are broadly classified into three approaches:
• the Income Approach (in which future economic benefits such as earnings or cash flow are capitalized),
• the Market Approach (in which the prices paid in actual transactions of the same or a similar asset are used as the basis of value), and
• the Asset Approach (which is often considered as the cost to replace the asset and can include a reasonable return on the asset).
While the Market Approach is considered as the most preferable basis for determining the value of an asset, relevant market transactions often are not available. As a result, the Income Approach is used frequently based on either a discounted cash flow or discounted earnings analysis.
This discussion focusses on the several income approach methods that are used in the business enterprise valuation and intangible asset valuation. This
Valuation Professionals Insight
156
discussion also focuses on the measurement of the discount rate that is applied within the income approach valuation methods.
The income approach is a valuation method that provides an estimate of the fair value of an asset based on the cash flows that an asset (or business) is expected to generate over its remaining useful life.
In the valuation of intangible assets, various methods can be used to value various intangibles identified. For any purchase price allocation, the cost of capital can be viewed from three different perspectives, as discussed in the following quotations:
On the asset side of a firm’s balance sheet, it is the rate that should be used to discount to a present value the future expected cash flow (WARA – Weighted Average Return on Assets).
On the liability side, it is the economic cost to the business of attracting and retaining capital in a competitive environment, in which investors (capital providers) carefully analyze and compare all return-generating opportunities (WACC – Weighted Average Cost of Capital).
On the investor’s side, it is the return one expects and requires from an investment in a business’s debt or equity. While each of these perspectives might view the cost of capital differently, they are all dealing with the same number (IRR – Internal Rate of Return).
This discussion describes about the importance of WACC, WARA and IRR and their reconciliation.
The estimation of an overall rate of return for the acquired company is required before determining the stratification of the rates of return for the acquired assets. The comparison of the WACC to the WARA allows the analyst to reconcile the rates of return required by providers of capital with the rates of return earned by the acquired assets.
Weighted Average Cost of Capital
The overall cost of capital is commonly referred to as the WACC. The WACC is calculated as the return on the investment in the acquired company by a market participant.
The WACC is comprised of a required rate of return on equity which is estimated by a rate building process (e.g., capital asset pricing model, the build-up model, etc.) and an after-tax rate of return on debt capital.
Purchase Price Allocation
157
Further, an analysis of an appropriate long-term market participant capital structure for the acquired company is required. Using an estimated required rate of return on equity capital, an estimated after-tax cost of debt capital, and a market participant capital structure, the WACC of the acquired company can be estimated.
Weighted Average Return on Assets
In general, the risk profile of each asset category should be considered when estimating the appropriate rates of return. The analyst should consider the liquidity of the assets on the balance sheet on a spectrum from working capital (most liquid) to the intangible assets (least liquid). In addition, the analyst can consider the assets based on their ability to be financed by debt or equity.
It is typical to select a rate of return for working capital at or near the cost of debt (depending on the available debt financing estimated with the market participant capital structure and the purchase price paid) and a rate of return consistent with the estimated cost of equity for the acquired company’s intangible assets.
Internal Rate of Return
The Internal Rate of Return (IRR) is the rate of return that equates the estimated future cash flows of the business with the transaction value. Calculate internal rate of return by carrying out the business valuation; Ensure that business plan used for the valuation of business and calculating IRR is same as that for purchase price allocation.
WACC, WARA and IRR Analysis Conceptually, the IRR should be consistent with the WACC. This should be the case for all types of prospective financial statements (PFI), such as conditional, probability-weighted, and PFI with “mixed” attributes. If the implied IRR and WACC differ, it may be an indication that entity-specific synergies are included in the PFI, that cash flows are not consistent with the expectations of market participants, or that the price paid for the business was not representative of its fair value. If such a scenario exists, the valuation specialist would analyze the assumptions in the PFI to ensure that only market participant assumptions are reflected (that is, excludes entity-specific synergies or biased PFI) to derive expected cash flows for the overall entity and asset. Alternatively, if there is evidence of the price not reflecting fair value, the valuation specialist would need to impute fair value for the
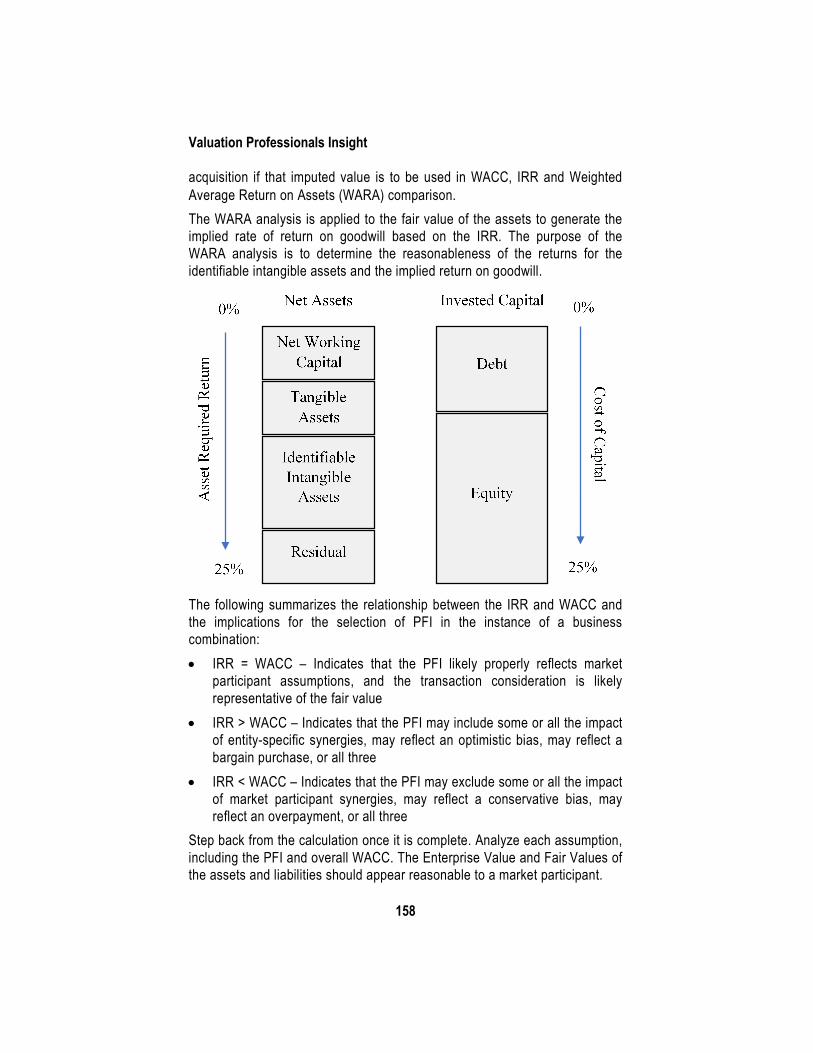
Valuation Professionals Insight
158
acquisition if that imputed value is to be used in WACC, IRR and Weighted Average Return on Assets (WARA) comparison. The WARA analysis is applied to the fair value of the assets to generate the implied rate of return on goodwill based on the IRR. The purpose of the WARA analysis is to determine the reasonableness of the returns for the identifiable intangible assets and the implied return on goodwill.
The following summarizes the relationship between the IRR and WACC and the implications for the selection of PFI in the instance of a business combination: • IRR = WACC – Indicates that the PFI likely properly reflects market
participant assumptions, and the transaction consideration is likely representative of the fair value
• IRR > WACC – Indicates that the PFI may include some or all the impact of entity-specific synergies, may reflect an optimistic bias, may reflect a bargain purchase, or all three
• IRR < WACC – Indicates that the PFI may exclude some or all the impact of market participant synergies, may reflect a conservative bias, may reflect an overpayment, or all three
Step back from the calculation once it is complete. Analyze each assumption, including the PFI and overall WACC. The Enterprise Value and Fair Values of the assets and liabilities should appear reasonable to a market participant.
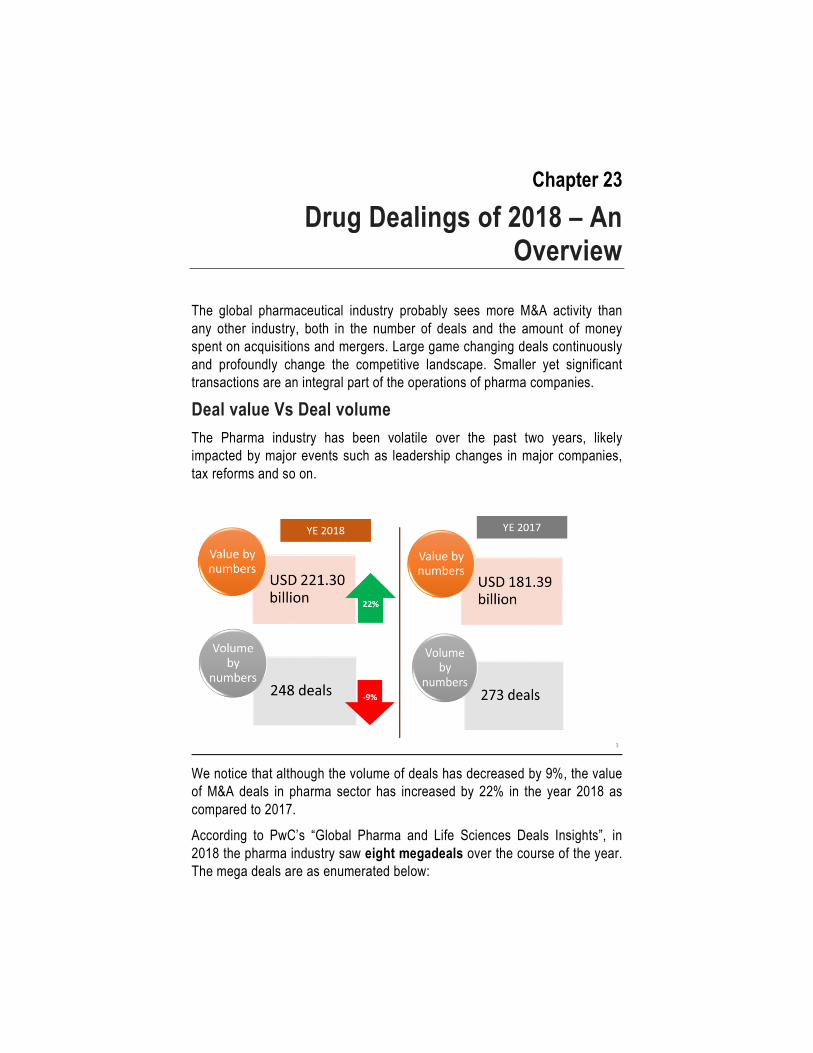
Chapter 23
Drug Dealings of 2018 – An Overview
The global pharmaceutical industry probably sees more M&A activity than any other industry, both in the number of deals and the amount of money spent on acquisitions and mergers. Large game changing deals continuously and profoundly change the competitive landscape. Smaller yet significant transactions are an integral part of the operations of pharma companies.
Deal value Vs Deal volume The Pharma industry has been volatile over the past two years, likely impacted by major events such as leadership changes in major companies, tax reforms and so on.
We notice that although the volume of deals has decreased by 9%, the value of M&A deals in pharma sector has increased by 22% in the year 2018 as compared to 2017.
According to PwC’s “Global Pharma and Life Sciences Deals Insights”, in 2018 the pharma industry saw eight megadeals over the course of the year. The mega deals are as enumerated below:
Valuation Professionals Insight
160
Announced date
Target Name
Target Nation
Acquirer name
Acquirer nation
Value (USD million)
19-Apr-18 Shire PLC Channel Islands
Takeda Pharmaceutical
Japan 81,667
22-Jan-18 Bioverativ Inc.
United States
Sanofi France 11,474
22-Jan-18 Juno Therapeutics, Inc.
United States
Celgene Corporation
United States
9,305
9-Apr-18 AveXis, Inc.
United States
Novartis AG Switzerland
8,696
7-Jan-18 Impact Biomedicines, Inc.
United States
Celgene Corporation
United States
7,000
29-Jan-18 Ablynx NV Belgium Sanofi France 5,492
3-Dec-18 Tesaro, Inc.
United States
GlaxoSmithKline plc
United Kingdom
5,468
3-Dec-18 GSK Bangladesh Ltd./GSK CH Ltd.
Bangladesh
Unilever PLC; Hindustan Unilever Limited
United Kingdom
5,323
Table 1 – Eight mega pharma deals 2018
The largest announced transaction of the year was Takeda’s acquisition of Shire. The Japanese pharma giant announced to purchase Shire for approximately USD 81.7 billion, which is USD 70.2 billion larger than the second largest deal of the year as seen from Table 1 above.
In addition to the above deals, an important development was that of Pfizer and GlaxoSmithKline (GSK) announcing a Joint Venture to create a premier global consumer healthcare company on December 19, 2018 which is poised to become the world’s biggest seller of over-the-counter medical products.
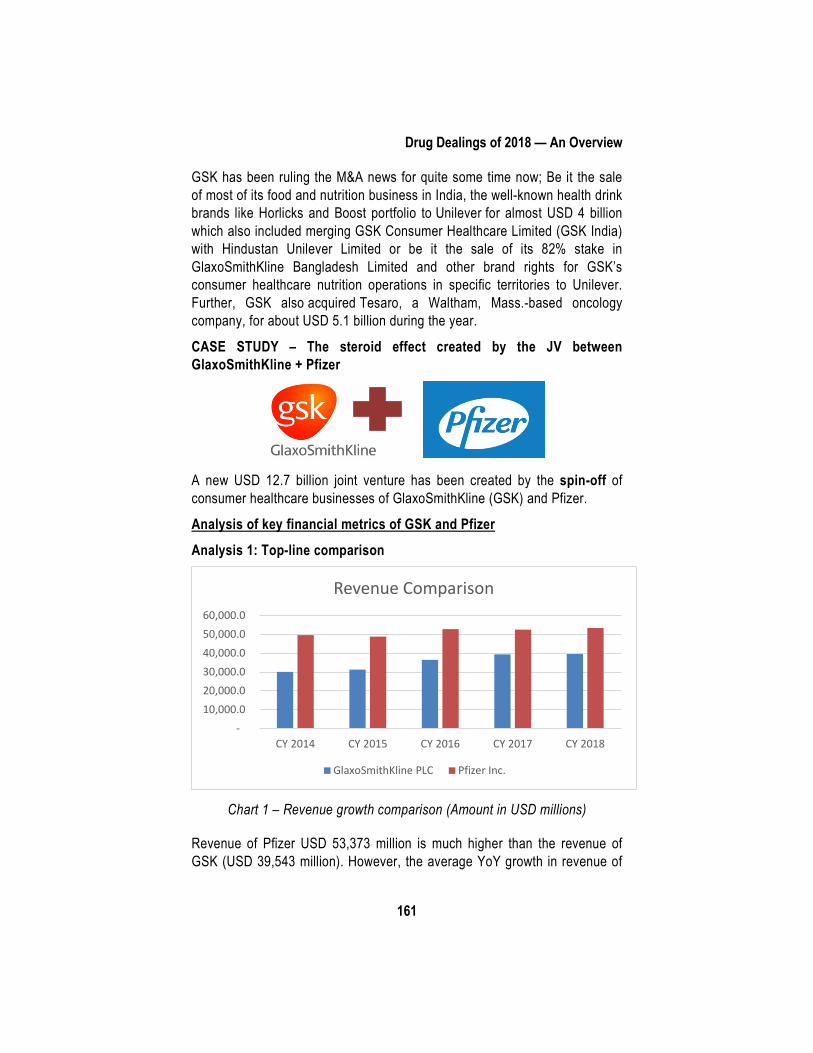
Drug Dealings of 2018 — An Overview
161
GSK has been ruling the M&A news for quite some time now; Be it the sale of most of its food and nutrition business in India, the well-known health drink brands like Horlicks and Boost portfolio to Unilever for almost USD 4 billion which also included merging GSK Consumer Healthcare Limited (GSK India) with Hindustan Unilever Limited or be it the sale of its 82% stake in GlaxoSmithKline Bangladesh Limited and other brand rights for GSK’s consumer healthcare nutrition operations in specific territories to Unilever. Further, GSK also acquired Tesaro, a Waltham, Mass.-based oncology company, for about USD 5.1 billion during the year.
CASE STUDY – The steroid effect created by the JV between GlaxoSmithKline + Pfizer
A new USD 12.7 billion joint venture has been created by the spin-off of consumer healthcare businesses of GlaxoSmithKline (GSK) and Pfizer.
Analysis of key financial metrics of GSK and Pfizer
Analysis 1: Top-line comparison
Chart 1 – Revenue growth comparison (Amount in USD millions)
Revenue of Pfizer USD 53,373 million is much higher than the revenue of GSK (USD 39,543 million). However, the average YoY growth in revenue of
- 10,000.0 20,000.0 30,000.0 40,000.0 50,000.0 60,000.0
CY 2014 CY 2015 CY 2016 CY 2017 CY 2018
Revenue Comparison
GlaxoSmithKline PLC Pfizer Inc.
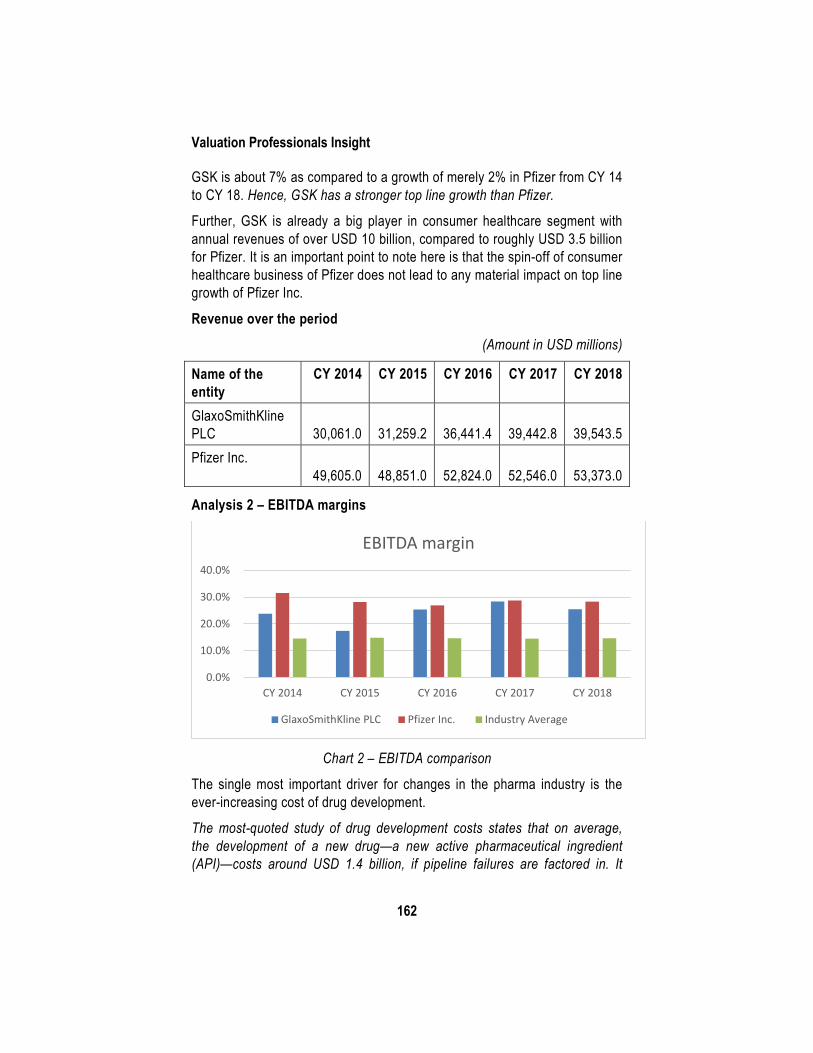
Valuation Professionals Insight
162
GSK is about 7% as compared to a growth of merely 2% in Pfizer from CY 14 to CY 18. Hence, GSK has a stronger top line growth than Pfizer.
Further, GSK is already a big player in consumer healthcare segment with annual revenues of over USD 10 billion, compared to roughly USD 3.5 billion for Pfizer. It is an important point to note here is that the spin-off of consumer healthcare business of Pfizer does not lead to any material impact on top line growth of Pfizer Inc.
Revenue over the period (Amount in USD millions)
Name of the entity
CY 2014 CY 2015 CY 2016 CY 2017 CY 2018
GlaxoSmithKline PLC
30,061.0
31,259.2
36,441.4
39,442.8
39,543.5
Pfizer Inc. 49,605.0
48,851.0
52,824.0
52,546.0
53,373.0
Analysis 2 – EBITDA margins
Chart 2 – EBITDA comparison
The single most important driver for changes in the pharma industry is the ever-increasing cost of drug development.
The most-quoted study of drug development costs states that on average, the development of a new drug—a new active pharmaceutical ingredient (API)—costs around USD 1.4 billion, if pipeline failures are factored in. It
0.0%
10.0%
20.0%
30.0%
40.0%
CY 2014 CY 2015 CY 2016 CY 2017 CY 2018
EBITDA margin
GlaxoSmithKline PLC Pfizer Inc. Industry Average
Drug Dealings of 2018 — An Overview
163
usually takes ten years from synthesis to approval, thus USD 1.2 billion capital costs accrue, which results in average total cost of USD 2.6 billion to develop a new drug.
Even though the revenue of GSK and Pfizer (together referred to as “Companies”) are ever increasing, the EBITDA as a % of revenue of these Companies are showing a marginal decline due to the above reason of increasing costs. The necessity of new drug development increases day by day as newer diseases and complications are discovered.
However, the EBITDA margins of both the Companies are much higher than the average EBITDA margin of pharma and life sciences industry.
EBITDA margins over the period
Name of the entity CY 2014
CY 2015
CY 2016
CY 2017
CY 2018
GlaxoSmithKline PLC 23.8% 17.5% 25.4% 28.4% 25.5% Pfizer Inc. 31.6% 28.2% 27.0% 28.7% 28.3% Industry Average 14.6% 14.9% 14.7% 14.5% 14.7%
The proposed spin-off will help the resultant company gain from the synergies arising out of the deal and thus result in substantial cost synergies as detailed in the “Outcome of the deal” section. The expected cost synergies would lead to improvement in the EBITDA margins.
Why the deal actually happened?
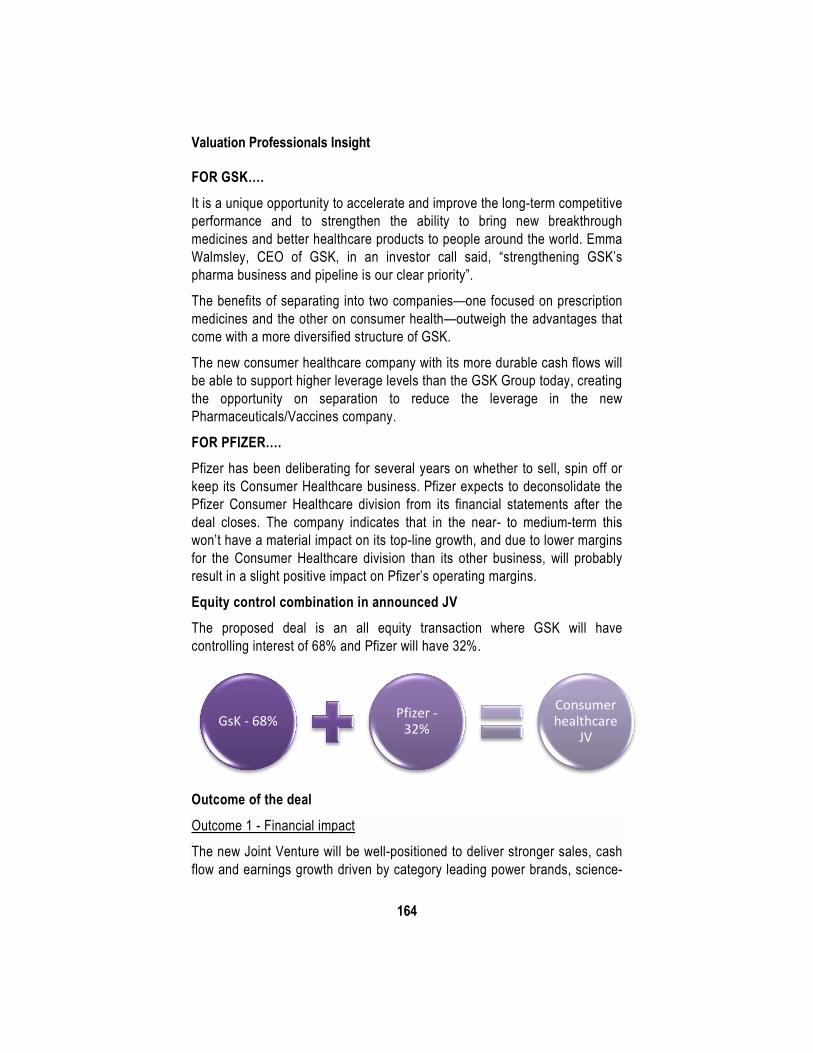
Valuation Professionals Insight
164
FOR GSK….
It is a unique opportunity to accelerate and improve the long-term competitive performance and to strengthen the ability to bring new breakthrough medicines and better healthcare products to people around the world. Emma Walmsley, CEO of GSK, in an investor call said, “strengthening GSK’s pharma business and pipeline is our clear priority”.
The benefits of separating into two companies—one focused on prescription medicines and the other on consumer health—outweigh the advantages that come with a more diversified structure of GSK.
The new consumer healthcare company with its more durable cash flows will be able to support higher leverage levels than the GSK Group today, creating the opportunity on separation to reduce the leverage in the new Pharmaceuticals/Vaccines company.
FOR PFIZER…. Pfizer has been deliberating for several years on whether to sell, spin off or keep its Consumer Healthcare business. Pfizer expects to deconsolidate the Pfizer Consumer Healthcare division from its financial statements after the deal closes. The company indicates that in the near- to medium-term this won’t have a material impact on its top-line growth, and due to lower margins for the Consumer Healthcare division than its other business, will probably result in a slight positive impact on Pfizer’s operating margins.
Equity control combination in announced JV The proposed deal is an all equity transaction where GSK will have controlling interest of 68% and Pfizer will have 32%.
Outcome of the deal
Outcome 1 - Financial impact
The new Joint Venture will be well-positioned to deliver stronger sales, cash flow and earnings growth driven by category leading power brands, science-
GsK - 68% Pfizer - 32%
Consumer healthcare
JV
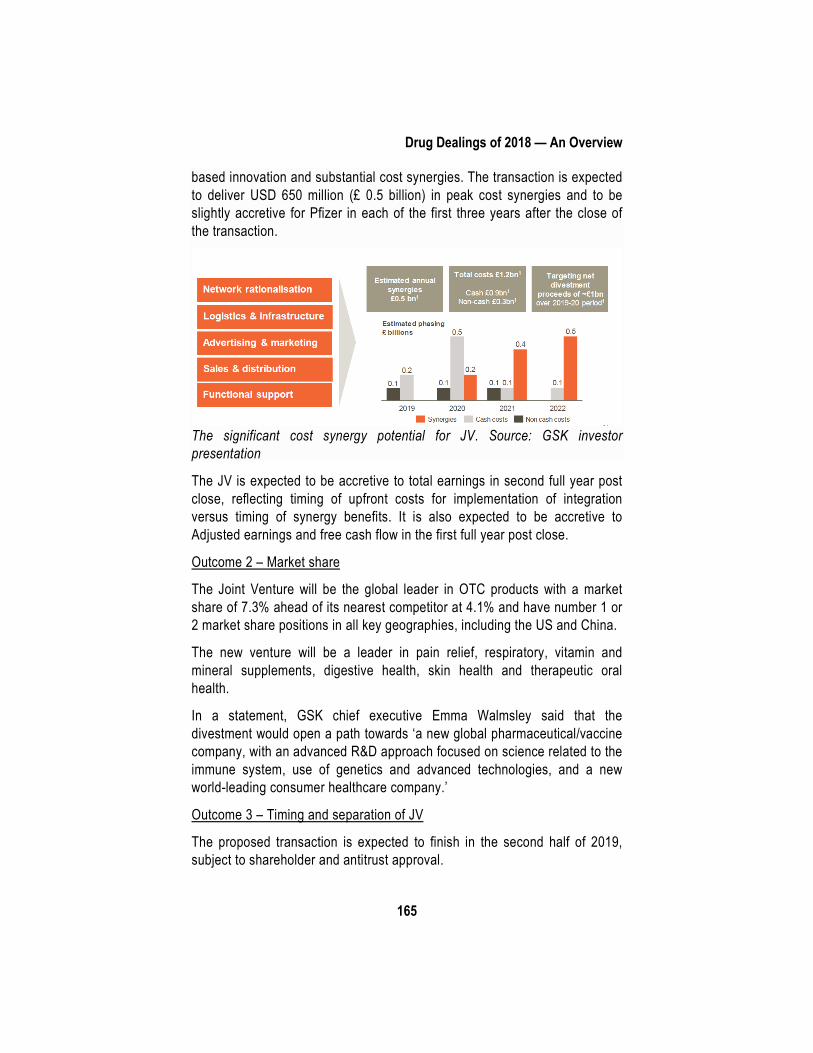
Drug Dealings of 2018 — An Overview
165
based innovation and substantial cost synergies. The transaction is expected to deliver USD 650 million (£ 0.5 billion) in peak cost synergies and to be slightly accretive for Pfizer in each of the first three years after the close of the transaction.
The significant cost synergy potential for JV. Source: GSK investor presentation
The JV is expected to be accretive to total earnings in second full year post close, reflecting timing of upfront costs for implementation of integration versus timing of synergy benefits. It is also expected to be accretive to Adjusted earnings and free cash flow in the first full year post close.
Outcome 2 – Market share
The Joint Venture will be the global leader in OTC products with a market share of 7.3% ahead of its nearest competitor at 4.1% and have number 1 or 2 market share positions in all key geographies, including the US and China.
The new venture will be a leader in pain relief, respiratory, vitamin and mineral supplements, digestive health, skin health and therapeutic oral health.
In a statement, GSK chief executive Emma Walmsley said that the divestment would open a path towards ‘a new global pharmaceutical/vaccine company, with an advanced R&D approach focused on science related to the immune system, use of genetics and advanced technologies, and a new world-leading consumer healthcare company.’
Outcome 3 – Timing and separation of JV
The proposed transaction is expected to finish in the second half of 2019, subject to shareholder and antitrust approval.
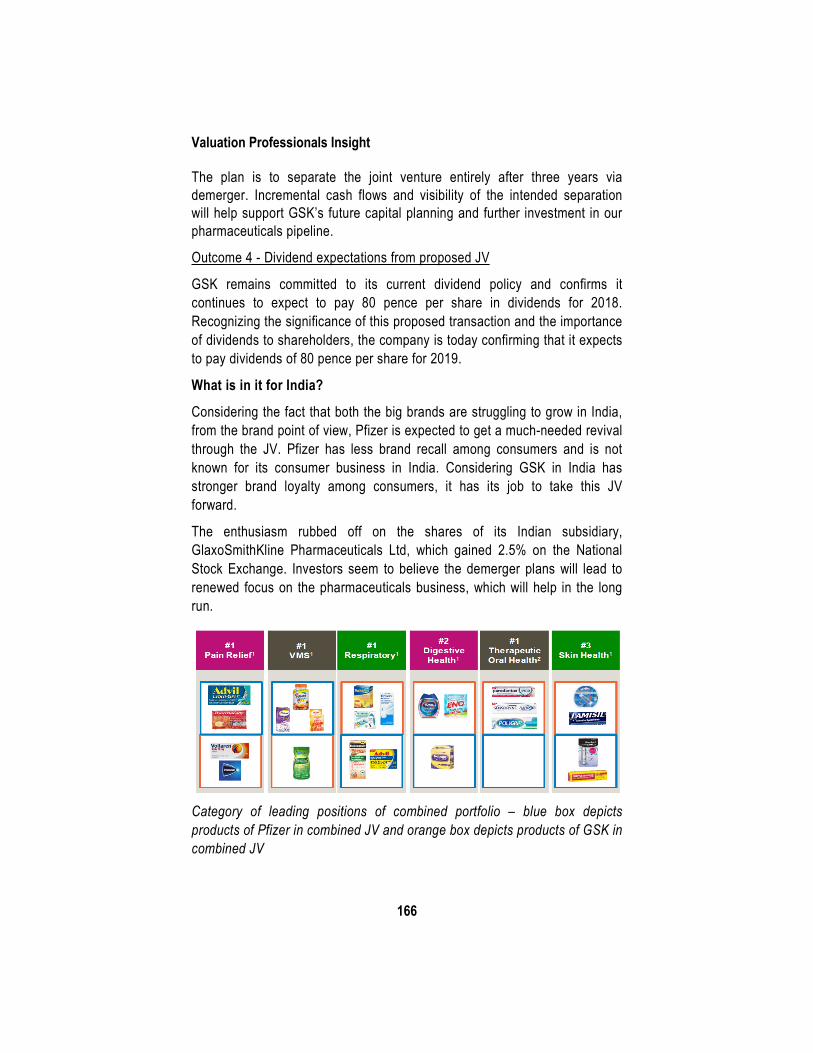
Valuation Professionals Insight
166
The plan is to separate the joint venture entirely after three years via demerger. Incremental cash flows and visibility of the intended separation will help support GSK’s future capital planning and further investment in our pharmaceuticals pipeline.
Outcome 4 - Dividend expectations from proposed JV
GSK remains committed to its current dividend policy and confirms it continues to expect to pay 80 pence per share in dividends for 2018. Recognizing the significance of this proposed transaction and the importance of dividends to shareholders, the company is today confirming that it expects to pay dividends of 80 pence per share for 2019.
What is in it for India?
Considering the fact that both the big brands are struggling to grow in India, from the brand point of view, Pfizer is expected to get a much-needed revival through the JV. Pfizer has less brand recall among consumers and is not known for its consumer business in India. Considering GSK in India has stronger brand loyalty among consumers, it has its job to take this JV forward.
The enthusiasm rubbed off on the shares of its Indian subsidiary, GlaxoSmithKline Pharmaceuticals Ltd, which gained 2.5% on the National Stock Exchange. Investors seem to believe the demerger plans will lead to renewed focus on the pharmaceuticals business, which will help in the long run.
Category of leading positions of combined portfolio – blue box depicts products of Pfizer in combined JV and orange box depicts products of GSK in combined JV
Drug Dealings of 2018 — An Overview
167
But positive changes at the parent company do not automatically trickle down to Indian subsidiaries.
Sales at GSK Pharma in India have slowed as a result of the product rationalization exercise. The local unit stepped up its focus on key brands and more profitable products. The Company will continue to manufacture and sell over 70 brands, are now focusing increasing efforts on 20 key brands to drive growth in identified therapy areas," said in its September quarter results statement of GSK Pharma. However, even with a handful of products that include Sensodyne, Crocin, Eno, Voltaren, Centrum, Caltrate, Anacin and Anne French, the combined sales of these products is estimated to be between Rs 1,000 and Rs 1,500 crore. Pfizer said it is excluding Corex, Gelusil and Becosules from the JV, having declared earlier that they are to be considered for a strategic review. The JV is expected to have No 1 or No 2 position in India. On a lighter note, let’s hope we Indians get fruitier Gelusil and more minty Sensodyne… What actually happens? Let’s wait and watch…

Bibliography • https://economictimes.indiatimes.com/news/international/business/gsk-
and-pfizer-to-combine-consumer-health-businesses/articleshow/67158355.cms
• PwC - Global Pharma and Life Sciences Deals Insights 2018 • https://www.chemistryworld.com/news/gsk-and-pfizer-joint-venture-
creates-new-consumer-healthcare-giant/3009938.article • https://www.businesswire.com/news/home/20181218005970/en/Pfizer-
GlaxoSmithKline-Announce-Joint-Venture-Create-Premier • https://www.gsk.com/en-gb/media/press-releases/glaxosmithkline-plc-
and-pfizer-inc-to-form-new-world-leading-consumer-healthcare-joint-venture/
• https://www.livemint.com/Money/XVEWDuE2v9R1cYPNrW4qTI/What-the-GSK-Pfizer-merger-means-for-their-Indian-units.html
• http://www.morningstar.co.uk/uk/news/172773/gsk-pfizer-joint-venture-no-impact-on-company-value.aspx
• https://www.biospace.com/article/pfizer-and-glaxosmithkline-team-to-create-consumer-healthcare-business/
• Annual reports of Pfizer Inc and GlaxoSmithKline PLC (2018)