Mercer Capital | Valuation Insight | Capital Budgeting in 30 Minutes
14
www.mercercapital.com MERCER CAPITAL Memphis | Dallas | Nashville Capital Budgeting in 30 Minutes A Guide for Directors and Shareholders by Travis W. Harms, CFA, CPA/ABV Executive Summary Switching costs for capital investment are high and do-overs are expensive. A capital project is simply any use of the company’s capital resources in the present with a view toward earning a return on that investment over time, and may take the form of acquisitions, capital expenditures, research & development, or other investments. Net present value and internal rate of return are the two primary tools used to determine whether the forecasted marginal cash flows are sufficient to justify the proposed project. However, a healthy capital budgeting process goes beyond mere financial feasi- bility to address the proposed project’s “fit” within the overall corporate strategy. The purpose of this whitepaper is to assist directors and shareholders in evaluating proposed capital projects and contributing to capital budgeting decisions that enhance value.
-
Upload
mercer-capital -
Category
Economy & Finance
-
view
148 -
download
1
Transcript of Mercer Capital | Valuation Insight | Capital Budgeting in 30 Minutes
wwwmercercapitalcom
MERCER CAPITAL Memphis | Dallas | Nashville
Capital Budgeting in 30 MinutesA Guide for Directors and Shareholdersby Travis W Harms CFA CPAABV
Executive Summary
Switching costs for capital investment are high and do-overs are expensive A capital project is simply any use of the companyrsquos capital resources in the present with a view toward earning a return on that investment over time and may take the form of acquisitions capital expenditures research amp development or other investments Net present value and internal rate of return are the two primary tools used to determine whether the forecasted marginal cash flows are sufficient to justify the proposed project However a healthy capital budgeting process goes beyond mere financial feasi-bility to address the proposed projectrsquos ldquofitrdquo within the overall corporate strategy The purpose of this whitepaper is to assist directors and shareholders in evaluating proposed capital projects and contributing to capital budgeting decisions that enhance value
copy 2016 Mercer Capital 2 wwwmercercapitalcom
Capital Budgeting in 30 MinutesA Guide for Directors and Shareholdersby Travis W Harms CFA CPAABV
This whitepaper is a continuation of our series focused on de-mystifying corporate finance for board members and shareholders Companies face three principal corporate finance decisions
1 Capital Structure What is the appropriate mix of debt and equity financing for the Company
2 Capital Budgeting What is the appropriate mix of capital projects for the Company to invest in
3 Distribution Policy What is the appropriate mix of current income and capital appreciation for the Companyrsquos shareholders
In this installment we explore the capital budgeting question in more depth
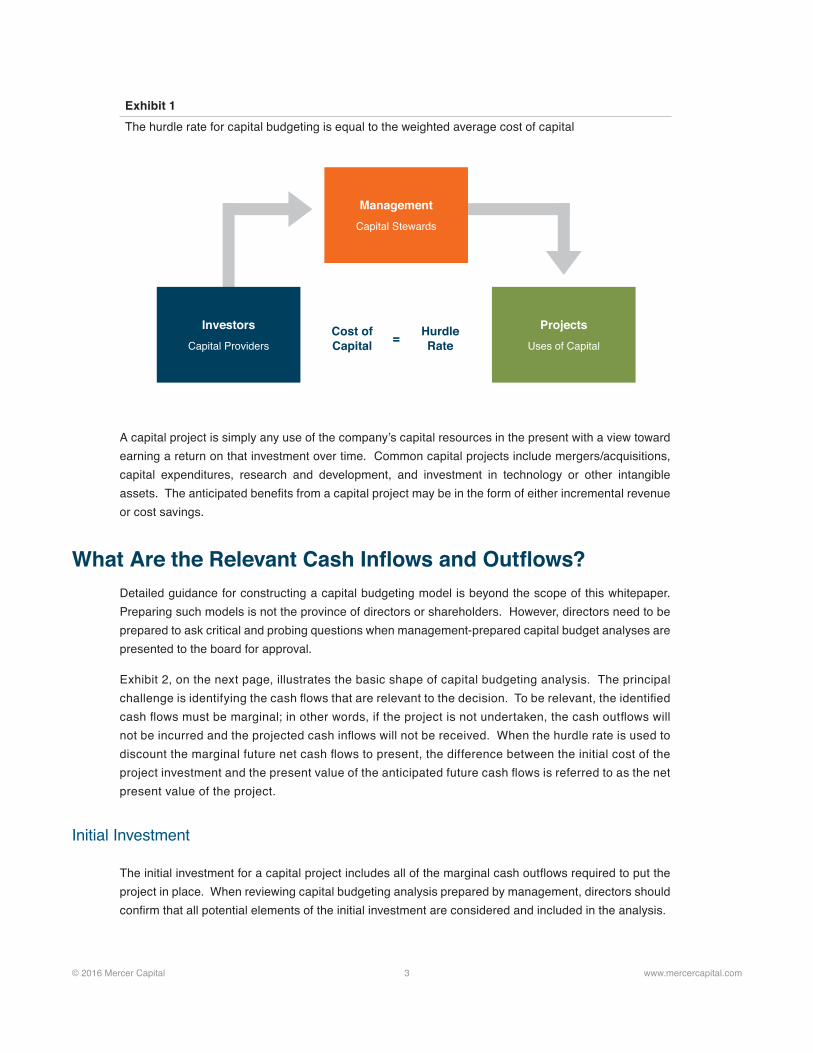
The Objective of Capital Budgeting DecisionsFrom the boardrsquos perspective it can be helpful to think of management as stewards of the capital entrusted to the company by lenders and shareholders In this model management has the task of allocating the companyrsquos capital resources to projects anticipated to generate returns sufficient to meet the expectations of the capital providers When making capital structure decisions the blended return expectations of the capital providers is referred to as the weighted average cost of capital or WACC For capital budgeting decisions those return expectations are referred to as the hurdle rate As depicted in Exhibit 1 the hurdle rate for capital budgeting purposes is equal to the WACC in capital structure analysis
Capital budgeting is a disciplined process for identifying evaluating and monitoring capital projects that will generate a return equal to or greater than the hurdle rate
copy 2016 Mercer Capital 3 wwwmercercapitalcom
A capital project is simply any use of the companyrsquos capital resources in the present with a view toward earning a return on that investment over time Common capital projects include mergersacquisitions capital expenditures research and development and investment in technology or other intangible assets The anticipated benefits from a capital project may be in the form of either incremental revenue or cost savings
What Are the Relevant Cash Inflows and OutflowsDetailed guidance for constructing a capital budgeting model is beyond the scope of this whitepaper Preparing such models is not the province of directors or shareholders However directors need to be prepared to ask critical and probing questions when management-prepared capital budget analyses are presented to the board for approval
Exhibit 2 on the next page illustrates the basic shape of capital budgeting analysis The principal challenge is identifying the cash flows that are relevant to the decision To be relevant the identified cash flows must be marginal in other words if the project is not undertaken the cash outflows will not be incurred and the projected cash inflows will not be received When the hurdle rate is used to discount the marginal future net cash flows to present the difference between the initial cost of the project investment and the present value of the anticipated future cash flows is referred to as the net present value of the project
Initial Investment
The initial investment for a capital project includes all of the marginal cash outflows required to put the project in place When reviewing capital budgeting analysis prepared by management directors should confirm that all potential elements of the initial investment are considered and included in the analysis
Exhibit 1The hurdle rate for capital budgeting is equal to the weighted average cost of capital
ManagementCapital Stewards
InvestorsCapital Providers
ProjectsUses of Capital
Cost of Capital = Hurdle
Rate
copy 2016 Mercer Capital 4 wwwmercercapitalcom
bull Transaction Consideration In a merger or acquisition the initial investment is the purchase price which should include both cash and non-cash components
bull Capital Expenditures For other types of projects the most obvious form of initial investment is the direct cost of capital assets required for the project The relevant cost includes all ship-ping engineering and installation costs incurred to put the assets in service
bull Assets Previously Owned A proposed capital project may be able to use existing corporate assets such as vacant land Since there is no direct cash outlay for such assets it may be tempting to treat such assets as ldquofreerdquo in the analysis This temptation should be resisted If not used in the proposed capital project the asset could be sold the net after-tax proceeds foregone are a relevant component of the initial investment
bull Working Capital In addition to fixed assets many capital projects require investment in working capital assets (for example inventory) prior to commencing operations
bull Operating Expenses In addition to costs that are customarily capitalized the initial invest-ment in a project may include other operating expenses If the expenses would not otherwise be incurred they should be included in the initial investment
Annual Net Operating Cash Flows
The annual net operating cash flows for a capital project must be forecast The following discussion identifies the key components of such a forecast and critical areas for evaluation
bull Marginal Revenue The forecast for marginal revenue is largest single determinant of whether a capital project will prove attractive Revenue forecasts should be related to the addressable
Exhibit 2The relevant cash flows for capital budgeting analysis are marginal (ie will not exist in the absence of the project)
Time = 0 Time = 1 through Time = n Time = n
Initial Investment
Marginal Revenues Expense SavingsMarginal Operating Expenses
Marginal Income TaxesIncremental Capital Investment
Terminal Value
($1000) $250 $350 $300 $150 $400
$1124
$124 Net Present Value
Future marginal cash flows discounted to present at hurdle rate
copy 2016 Mercer Capital 5 wwwmercercapitalcom
market for the product competitor product offerings production capacity pricevolume anal-ysis and other factors as appropriate Capital projects often replace or otherwise cannibalize existing revenue sources for the company cannibalized revenues should be deducted to derive marginal revenue attributable to the project Unlike forecasts for business valuation which are generally assumed to persist indefinitely revenue forecasts for discrete capital projects will often need to consider total useful life including an estimate of the rate at which revenues will decline as the project reaches the end of its useful life
Some capital projects are designed to generate cost savings rather than incremental revenue In such cases the projected cost savings represent the ldquorevenuerdquo for the project
bull Marginal Operating Expenses Operating expense forecasts should be related to the revenue forecast Distinguishing fixed from variable costs is often helpful both in assessing the reason-ableness of the expense forecast and in preparing sensitivity analysis The expenses included in the model should be limited to cash operating expenses In other words depreciation (a non-cash expense) and interest (a financing expense) should be excluded from the forecast
As with the revenue forecast the expense forecast should identify marginal costs in other words costs that will not be incurred if the project is not undertaken Segregating fixed and variable costs can be a valuable step in confirming that the identified fixed costs are truly marginal to the project
bull Marginal Income Taxes While not included in the forecast of cash operating expenses the tax shield from depreciation should be factored explicitly into the estimate of cash taxes Keeping with the theme of marginal analysis the appropriate tax rate for capital budgeting analysis is the marginal not the average effective tax rate Some projects may give rise to specific tax credits or other benefits ndash if so those benefits should be credited to the analysis
bull Incremental Capital Investment The cash flow forecast should also take account of incremental capital investment needs for items such as maintenance capital expenditures expenditures to build capacity to meet anticipated demand and working capital to support sales growth If revenues are projected to slow as the project approaches the end of its life the corresponding release of working capital is a source of cash flow
Terminal Value
Since most capital projects have finite lives the terminal value is limited to after-tax proceeds from sale of capital assets and liquidation of working capital assets Mirroring the initial investment operating costs associated with winding down the project should be deducted from the projected terminal value
How Are Available Capital Projects RankedAs shown in Exhibit 2 identifying marginal cash flows is the first step of the capital budgeting project The next step is to assess what the marginal cash flows suggest regarding the desirability of the project
copy 2016 Mercer Capital 6 wwwmercercapitalcom
from a financial perspective The two primary techniques for evaluating and ranking potential capital projects are net present value and internal rate of return
Net Present Value (NPV)
Net present value is a measure of the value created by a prospective capital project The net present value is determined by discounted the projected marginal cash flows to the present at the hurdle rate (which is the weighted average cost of capital) If the present value exceeds the initial investment the net present value will be positive signaling that the projected is attractive finan-cially On the other hand if the present value is less than the initial investment the net present value will be negative
While the theoretically superior method of evaluating projects net present value is not an intuitive concept Furthermore when there are financial constraints on the total amount available for capital investment net present value does not provide direct guidance on ranking available projects
Internal Rate of Return (IRR)
The internal rate of return for a capital project is the discount rate which equates the present value of the projected marginal cash flows with the initial investment for a project In other words the IRR is the hypothetical hurdle rate at which the project would have a net present value of $0 Since discount rates and present values are inversely related it takes a higher discount rate to reduce a more robust set of marginal cash flows to present value As a result for a given initial investment greater levels of projected marginal cash flow will yield higher IRRs
Exhibit 3Net present value and internal rate of return are the two primary measures for evaluating capital projects
Projected Marginal Cash Flows
Initial Investment Annual Net Operating Cash Flows
Terminal Value
($1000) $250 $350 $300 $150 $400
Net Present Value Internal Rate of Return
Use hurdle rate to measure presentvalue of projected marginal cash flows
Solve for the discount rate at which the net present value = $0
At 115 hurdle rate NPV = $124 NPV = $0 at discount rate of 176
Project financially attractive ifNPV gt $0
Project financially attractive ifIRR gt WACC (Hurdle Rate)
copy 2016 Mercer Capital 7 wwwmercercapitalcom
Exhibit 3 compares net present value and internal rate of return for a given project With a couple of fairly obscure exceptions that lie beyond our scope both NPV and IRR will yield the same conclusion regarding the financial desirability of a given project The IRR is the more intuitive of the two measures
In the face of scarce financial resources however neither measure provides an unambiguous basis for ranking and selecting from among multiple potential projects
bull Since net present value measures the value created by a project one might be tempted to simply rank projects by the magnitude of the NPV However the NPV is not scaled to project life as a result it is not obvious for example if a six-year project with an NPV of $500 is more desirable than a four-year project with a $350 net present value While there are techniques for making such comparisons the ultimate consideration cannot be reduced to a spreadsheet what capital projects will be available at the conclusion of the project with the shorter life
bull The internal rate of return calculations implicitly assume that all projected cash flows can be reinvested at the IRR through the duration of the project For high IRR projects this may not be feasible As with NPV there are techniques to work around this issue but the fundamental ques-tion remains is the calculated IRR sustainable Furthermore the IRR does not address the size of the investment Are shareholders better served by a project with an IRR of 175 and NPV of $200 or an IRR of 140 and an NPV of $300 If the projects are of equal duration the higher NPV project is theoretically superior However the higher IRR project might be interpreted as having a greater margin of safety and therefore represent a less risky allocation of capital
When ranking capital projects amid financial constraints management should carefully explain the ratio-nale for ranking projects to the board with reference to both measures
What Non-Financial Constraints Does the Company FaceThe tools described in the previous section (NPV and IRR) are useful for prioritizing and ranking capital projects given a limited capital budget which projects should be pursued However firms are likely to be constrained by non-financial limitations as well Board members should confirm that manage-ment has identified relevant non-financial constraints and has considered such constraints in developing capital project recommendations Potential non-financial constraints include the following
bull Management time and attention Does the existing management team have the available ldquobandwidthrdquo to manage the existing operations and oversee the proposed capital project A successful capital project that imperils the existing business because of the resulting manage-ment inattention may be counter-productive
bull Infrastructure and systems Are the companyrsquos information technology resources sufficient and adaptable to the proposed capital project What about human resources finance sales and marketing
bull Human capital and expertise Does the companyrsquos existing staff have the skills and compe-tencies necessary to execute on the proposed capital project If the project will require an influx of new employees are qualified individuals available in the relevant labor markets
copy 2016 Mercer Capital 8 wwwmercercapitalcom
The objective in evaluating non-financial constraints is not to inhibit growth but rather to ensure that the relevant cash flows used in the financial analysis are measured appropriately Most non-finan-cial constraints have financial solutions Additional senior managers can be hired systems can be upgraded and wages can be adjusted to attract qualified candidates By explicitly evaluating the pres-ence of such non-financial constraints however board members can ensure that the financial costs associated with remedying those constraints are incorporated in the financial analysis
What Is the Strategic Rationale for the Proposed ProjectFinancial spreadsheets are remarkably malleable with enough tweaks to the assumptions nearly any proposed project can appear financially attractive As a result a positive NPV and attractive IRR should be viewed as threshold requirements for considering a project but neither measure is a sufficient substi-tute for a compelling strategic rationale supporting the proposed projectrsquos ldquofitrdquo
Michael Porterrsquos five forces framework can serve as a useful grid for evaluating the strategic rationale for a proposed capital project
1 Industry rivalry Is the proposed project intended to provide a cost advantage over compet-itors or help differentiate the company from its rivals Will the cost advantage differentiating factor be sustainable or easily copied by peers Examples of such projects include invest-ments in production efficiency and brand development expenditures
2 Threat of new entrants Does the proposed project reduce the threat of new competitors entering the market Does it promote customer loyalty or otherwise reduce the likelihood that existing customers will be lured away by new entrants Acquiring an upstart company with potentially disruptive technology is an example of a capital project addressing this concern
3 Threat of substitutes If completed will the proposed project extend the breadth of the companyrsquos product line Is the project defensive aimed at limiting a potential loss of market share if the company does not act Projects attempting to address this concern include efforts to diversify by adding new or complementary products
4 Bargaining Power of Buyers Is the proposed project intended to increase customer switching costs or otherwise reduce the sensitivity of demand to price increases A firm may elect to acquire a primary competitor in an effort to increase pricing power By acquiring a customer a company may be attempting to capture a greater portion of the total profit along the value chain
5 Bargaining Power of Suppliers Does the proposed project deliver an alternative source of raw materials In addition to vertically-integrating acquisitions (ie purchase of a supplier) capital projects modifying the production process to facilitate the use of multiple andor cheaper inputs may address this factor
In short the ldquowhyrdquo of a capital project needs to have an affirmative and compelling strategic rationale a positive NPV is a necessary but not sufficient condition for approving a capital project The framework and questions identified above can help board members confirm that such a rationale exists
copy 2016 Mercer Capital 9 wwwmercercapitalcom
What Returns Have Prior Projects EarnedFor a growing company capital budgeting is an ongoing process not a one-time event As a result it is important for the board to monitor realized returns from prior projects to help refine the capital budgeting process for current projects rooting out potential cognitive biases like systematic over-confidence As a component of submitting a capital project for board approval management should also describe the process for measuring and evaluating subsequent performance The discipline of subsequent measurement can increase the quality and reliability of the forecasts used to support project approval
Peer Benchmarking AnalysisThe results of capital budgeting analysis for a group of public peer companies can be inferred from the statement of cash flows Exhibit 4 illustrates the basic relationships among the various sections of the statement of cash flows
By comparing the operating cash flow to the investing cash flow for a business over time we can catego-rize the company as either a cash generator (operating cash flow exceeds investing cash flow) or a cash user (investing cash flow exceeds operating cash flow) Since investing cash flows tend to be lumpy it is best to make such comparisons on a multi-year basis
Exhibit 5 on the following page summarizes the results of our analysis of small-cap and mid-cap compa-nies in the Russell 2000 index (excluding financials) for the three-year period ending 2015
Exhibit 4If operating cash flows exceed investing cash flows funds are available for distribution to capital providers otherwise companies must access additional external capital to support investing activities
Portfolio of Capital Projects in Place
Operating Cash Flow
Equity Providers
Investing Cash Flow
Debt Providers
copy 2016 Mercer Capital 10 wwwmercercapitalcom
The overall universe of companies is reasonably balanced between the two groups with cash genera-tors accounting for 48 of all observations and cash users representing 52 of the sample We draw the following observations from the analysis summarized in Exhibit 5
bull The cash generators are on balance larger than the cash users with median revenue of $666 million more than twice that of the cash users This suggests that there is a life cycle factor in capital budgeting analysis ndash smaller firms tend to be more aggressive with regard to capital investment
bull Beyond mere size the cash generators present a lower-risk financial profile than the cash users with greater profitability lower leverage (and borrowing costs) and lower betas
bull The more aggressive investment posture of the cash users leads to higher growth rates in revenue and EBITDA The pertinent question is whether the incremental revenue and profit growth is sufficient to compensate for the incremental capital deployed in the business In other words did the capital projects generate positive net present values While the answer to that question is not directly observable corresponding shareholder returns provide indirect evidence
bull Over the three-year period ending in 2015 annualized shareholder returns to the cash generators (97) exceeded those to the shareholders of cash users (91) While we make no effort to discern whether such difference is statistically significant we note that the relative proximity suggests that ndash on balance ndash the capital projects executed by the cash users had net present values approximating $0 In other words for this sample of companies over this period heavy investment translated into significant revenue and profit growth but did not generate superior shareholder returns
Exhibit 5
Cash Generators
Cash Users
Number of Companies in Group 683 744
Investment per $100 of Operating Cash Flow $055 $172
Financial Profile amp Risk
Revenue (millions) $666 $319
EBITDA Margin 123 73
Leverage (Debt EBITDA) 15x 35x
Effective Borrowing Cost 47 58
Beta 109 121
Growth Characteristics
3-yr Revenue Growth 42 143
3-yr EBITDA Growth 33 136
Valuation amp Market PerformanceEnterprise Value EBITDA 104x 113x
3-yr Annualized Return 97 91
Note - Median measures for each group data from CapIQ Mercer Capital analysis
copy 2016 Mercer Capital 11 wwwmercercapitalcom
Exhibit 6Dispersion of shareholder returns is wider for cash users than for cash generators
As shown on Exhibit 6 significant investment increases the likelihood of abnormally positive or negative shareholder returns Approximately one-third of cash users enjoyed annualized shareholder returns greater than 20 compared to less than 30 for cash generators On the down side nearly 12 of cash users suffered annualized shareholder returns of -20 or worse compared to just 75 for cash generators Heavy capital investment increases the variability of subsequent returns to shareholders increasing the likelihood of both big paydays and big losses
As shown on Exhibit 7 the magnitude of capital investment should relate to the availability of attractive capital projects
00
50
100
150
200
250
300
350
400
lt -20 -20 to -10 -10 to 0 0 to 10 10 to 20 gt 20
o
f Tot
al C
ompa
nies
Annualized Return Cohorts
Cash Generators Cash Users
Exhibit 7The availability of attractive investment opportunities should determine whether a given company is a cash user or a cash generator
Expe
cted
Ret
urn
Cost of Capital = Hurdle Rate
Cash Users
Cash Generators
copy 2016 Mercer Capital 12 wwwmercercapitalcom
Given the connection between availability of attractive capital projects and status as a cash generator or cash user one should expect to find discernable patterns across industry sectors Exhibit 8 summarizes the relative composition of the industry sectors in our sample
The industry effect on capital budgeting is pronounced in Exhibit 8
bull The preponderance of cash generators among firms in the consumer discretionary consumer staples and industrials sectors is consistent with more limited investment opportunities in mature industries
bull Recent woes in the energy and materials sectors have dried up operating cash flows increasing the number of cash users
bull The healthcare sector which includes biotechnology pharmaceuticals technology and equip-ment in addition to healthcare services offered the most abundant investment opportunities with cash users accounting for more than 80 of firms and median compound annual revenue growth in the sector of 154
bull The information technology sector is maturing with nearly equal representation among cash generators and cash users
bull Telecommunications and utilities are mature but capital intensive industries The payoff to capital investment in telecommunications over the period analyzed was uninspiring with median annualized shareholder returns of 84 for cash users compared to 197 for cash generators
The purpose of peer benchmarking analysis is not to suggest that all companies in a given industry should behave similarly Rather the purpose is to allow the board and shareholders to identify the
Exhibit 8Availability of attractive projects varies by industry
0 20 40 60 80 100
Utilities
Telecommunications
Materials
Information Technology
Industrials
Healthcare
Energy
Consumer Staples
Consumer Discretionary
Relative Composition of Companies in Sector
Cash Generators Cash Users
copy 2016 Mercer Capital 13 wwwmercercapitalcom
similarities and dissimilarities between the subject company and the peer group and understand the factors contributing to the differences For example if a company is a cash user with a peer group dominated by cash generators management should be able to identify the unique strategic advantage possessed by the company such that it will realize positive net present values on incremental capital investment while the peer group managers seem to be reaching the opposite conclusion
ConclusionFrom the perspective of the board of directors capital budgeting is the process of allocating capital to available projects The optimal portfolio of projects will cohere with the companyrsquos broader strategy to generate returns in excess of the hurdle rate
bull Identifying the relevant cash flows is essential to an appropriate financial review of the proposed project Relevant cash flows are those that would not be received or expended in the absence of the proposed project
bull The two principal tools for evaluating capital projects from a financial perspective are net present value and internal rate of return
bull The capital budgeting process should also consider non-financial constraints faced by the company such as limited management resources existing infrastructure and capacity and the availability of human capital and expertise
bull Beyond financial projections management should be able to identify the strategic rationale for the proposed project In other words a positive net present value is essential but project approval should also depend on non-financial strategic considerations
bull A healthy capital budgeting process includes a disciplined process for evaluating prior invest-ment decisions with a view toward identifying chronic cognitive biases
bull The appropriate pace of capital investment depends on the availability of attractive capital projects Benchmarking the pace of capital investment and corresponding investment returns for a group of peers can provide the board with context to evaluate the ldquofitrdquo and desirability of proposed capital projects
Switching costs for capital investment are high and do-overs are expensive Using the concepts and techniques summarized in this whitepaper will enable directors and shareholders to assess whether managementrsquos capital investment plans will enhance or detract from the value of the company
Travis W Harms CFA CPAABV9016852120 | harmstmercercapitalcom
Mercer Capitalrsquos ability to understand and determine the value of a company has been the cornerstone of the firmrsquos services and its core expertise since its founding
Mercer Capital is a national business valuation and financial advisory firm founded in 1982 We offer a broad range of valuation services including corporate valuation gift estate and income tax valuation buy-sell agreement valuation financial reporting valuation ESOP and ERISA valuation services and litigation and expert testimony consulting In addition Mercer Capital assists with transaction-related needs including MampA advisory fairness opinions solvency opinions and strategic alternatives assessment
We have provided thousands of valuation opinions for corporations of all sizes across virtually every industry vertical Our valuation opinions are well-reasoned and thoroughly documented providing critical support for any potential engagement Our work has been reviewed and accepted by the major agencies of the federal government charged with regulating business transactions as well as the largest accounting and law firms in the nation on behalf of their clients
Contact a Mercer Capital professional to discuss your needs in confidence
Mercer Capital
Travis W Harms CFA CPAABV 9013229760harmstmercercapitalcom
Timothy R Lee ASA 9013229740leetmercercapitalcom
Nicholas J Heinz ASA 9016852120heinznmercercapitalcom
Bryce Erickson ASA MRICS 2144688400ericksonbmercercapitalcom
Matthew R Crow CFA ASA 9016852120crowmmercercapitalcom
Z Christopher Mercer FASA CFA ABAR 9016852120mercercmercercapitalcom
MERCER CAPITAL
Memphis5100 Poplar Avenue Suite 2600Memphis Tennessee 381379016852120
Dallas12201 Merit Drive Suite 480Dallas Texas 752512144688400
Nashville102 Woodmont Blvd Suite 231Nashville Tennessee 372056153450350
wwwmercercapitalcom
Contact Us
Copyright copy 2016 Mercer Capital Management Inc All rights reserved It is illegal under Federal law to reproduce this publication or any portion of its contents without the publisherrsquos permission
Media quotations with source attribution are encouraged Reporters requesting additional information or editorial comment should contact Barbara Walters Price at 9016852120 This article
does not constitute legal or financial consulting advice It is offered as an information service to our clients and friends Those interested in specific guidance for legal or accounting matters should
seek competent professional advice Inquiries to discuss specific valuation matters are welcomed To learn more about Mercer Capital visit our web site at wwwmercercapitalcom
copy 2016 Mercer Capital 2 wwwmercercapitalcom
Capital Budgeting in 30 MinutesA Guide for Directors and Shareholdersby Travis W Harms CFA CPAABV
This whitepaper is a continuation of our series focused on de-mystifying corporate finance for board members and shareholders Companies face three principal corporate finance decisions
1 Capital Structure What is the appropriate mix of debt and equity financing for the Company
2 Capital Budgeting What is the appropriate mix of capital projects for the Company to invest in
3 Distribution Policy What is the appropriate mix of current income and capital appreciation for the Companyrsquos shareholders
In this installment we explore the capital budgeting question in more depth
The Objective of Capital Budgeting DecisionsFrom the boardrsquos perspective it can be helpful to think of management as stewards of the capital entrusted to the company by lenders and shareholders In this model management has the task of allocating the companyrsquos capital resources to projects anticipated to generate returns sufficient to meet the expectations of the capital providers When making capital structure decisions the blended return expectations of the capital providers is referred to as the weighted average cost of capital or WACC For capital budgeting decisions those return expectations are referred to as the hurdle rate As depicted in Exhibit 1 the hurdle rate for capital budgeting purposes is equal to the WACC in capital structure analysis
Capital budgeting is a disciplined process for identifying evaluating and monitoring capital projects that will generate a return equal to or greater than the hurdle rate
copy 2016 Mercer Capital 3 wwwmercercapitalcom
A capital project is simply any use of the companyrsquos capital resources in the present with a view toward earning a return on that investment over time Common capital projects include mergersacquisitions capital expenditures research and development and investment in technology or other intangible assets The anticipated benefits from a capital project may be in the form of either incremental revenue or cost savings
What Are the Relevant Cash Inflows and OutflowsDetailed guidance for constructing a capital budgeting model is beyond the scope of this whitepaper Preparing such models is not the province of directors or shareholders However directors need to be prepared to ask critical and probing questions when management-prepared capital budget analyses are presented to the board for approval
Exhibit 2 on the next page illustrates the basic shape of capital budgeting analysis The principal challenge is identifying the cash flows that are relevant to the decision To be relevant the identified cash flows must be marginal in other words if the project is not undertaken the cash outflows will not be incurred and the projected cash inflows will not be received When the hurdle rate is used to discount the marginal future net cash flows to present the difference between the initial cost of the project investment and the present value of the anticipated future cash flows is referred to as the net present value of the project
Initial Investment
The initial investment for a capital project includes all of the marginal cash outflows required to put the project in place When reviewing capital budgeting analysis prepared by management directors should confirm that all potential elements of the initial investment are considered and included in the analysis
Exhibit 1The hurdle rate for capital budgeting is equal to the weighted average cost of capital
ManagementCapital Stewards
InvestorsCapital Providers
ProjectsUses of Capital
Cost of Capital = Hurdle
Rate
copy 2016 Mercer Capital 4 wwwmercercapitalcom
bull Transaction Consideration In a merger or acquisition the initial investment is the purchase price which should include both cash and non-cash components
bull Capital Expenditures For other types of projects the most obvious form of initial investment is the direct cost of capital assets required for the project The relevant cost includes all ship-ping engineering and installation costs incurred to put the assets in service
bull Assets Previously Owned A proposed capital project may be able to use existing corporate assets such as vacant land Since there is no direct cash outlay for such assets it may be tempting to treat such assets as ldquofreerdquo in the analysis This temptation should be resisted If not used in the proposed capital project the asset could be sold the net after-tax proceeds foregone are a relevant component of the initial investment
bull Working Capital In addition to fixed assets many capital projects require investment in working capital assets (for example inventory) prior to commencing operations
bull Operating Expenses In addition to costs that are customarily capitalized the initial invest-ment in a project may include other operating expenses If the expenses would not otherwise be incurred they should be included in the initial investment
Annual Net Operating Cash Flows
The annual net operating cash flows for a capital project must be forecast The following discussion identifies the key components of such a forecast and critical areas for evaluation
bull Marginal Revenue The forecast for marginal revenue is largest single determinant of whether a capital project will prove attractive Revenue forecasts should be related to the addressable
Exhibit 2The relevant cash flows for capital budgeting analysis are marginal (ie will not exist in the absence of the project)
Time = 0 Time = 1 through Time = n Time = n
Initial Investment
Marginal Revenues Expense SavingsMarginal Operating Expenses
Marginal Income TaxesIncremental Capital Investment
Terminal Value
($1000) $250 $350 $300 $150 $400
$1124
$124 Net Present Value
Future marginal cash flows discounted to present at hurdle rate
copy 2016 Mercer Capital 5 wwwmercercapitalcom
market for the product competitor product offerings production capacity pricevolume anal-ysis and other factors as appropriate Capital projects often replace or otherwise cannibalize existing revenue sources for the company cannibalized revenues should be deducted to derive marginal revenue attributable to the project Unlike forecasts for business valuation which are generally assumed to persist indefinitely revenue forecasts for discrete capital projects will often need to consider total useful life including an estimate of the rate at which revenues will decline as the project reaches the end of its useful life
Some capital projects are designed to generate cost savings rather than incremental revenue In such cases the projected cost savings represent the ldquorevenuerdquo for the project
bull Marginal Operating Expenses Operating expense forecasts should be related to the revenue forecast Distinguishing fixed from variable costs is often helpful both in assessing the reason-ableness of the expense forecast and in preparing sensitivity analysis The expenses included in the model should be limited to cash operating expenses In other words depreciation (a non-cash expense) and interest (a financing expense) should be excluded from the forecast
As with the revenue forecast the expense forecast should identify marginal costs in other words costs that will not be incurred if the project is not undertaken Segregating fixed and variable costs can be a valuable step in confirming that the identified fixed costs are truly marginal to the project
bull Marginal Income Taxes While not included in the forecast of cash operating expenses the tax shield from depreciation should be factored explicitly into the estimate of cash taxes Keeping with the theme of marginal analysis the appropriate tax rate for capital budgeting analysis is the marginal not the average effective tax rate Some projects may give rise to specific tax credits or other benefits ndash if so those benefits should be credited to the analysis
bull Incremental Capital Investment The cash flow forecast should also take account of incremental capital investment needs for items such as maintenance capital expenditures expenditures to build capacity to meet anticipated demand and working capital to support sales growth If revenues are projected to slow as the project approaches the end of its life the corresponding release of working capital is a source of cash flow
Terminal Value
Since most capital projects have finite lives the terminal value is limited to after-tax proceeds from sale of capital assets and liquidation of working capital assets Mirroring the initial investment operating costs associated with winding down the project should be deducted from the projected terminal value
How Are Available Capital Projects RankedAs shown in Exhibit 2 identifying marginal cash flows is the first step of the capital budgeting project The next step is to assess what the marginal cash flows suggest regarding the desirability of the project
copy 2016 Mercer Capital 6 wwwmercercapitalcom
from a financial perspective The two primary techniques for evaluating and ranking potential capital projects are net present value and internal rate of return
Net Present Value (NPV)
Net present value is a measure of the value created by a prospective capital project The net present value is determined by discounted the projected marginal cash flows to the present at the hurdle rate (which is the weighted average cost of capital) If the present value exceeds the initial investment the net present value will be positive signaling that the projected is attractive finan-cially On the other hand if the present value is less than the initial investment the net present value will be negative
While the theoretically superior method of evaluating projects net present value is not an intuitive concept Furthermore when there are financial constraints on the total amount available for capital investment net present value does not provide direct guidance on ranking available projects
Internal Rate of Return (IRR)
The internal rate of return for a capital project is the discount rate which equates the present value of the projected marginal cash flows with the initial investment for a project In other words the IRR is the hypothetical hurdle rate at which the project would have a net present value of $0 Since discount rates and present values are inversely related it takes a higher discount rate to reduce a more robust set of marginal cash flows to present value As a result for a given initial investment greater levels of projected marginal cash flow will yield higher IRRs
Exhibit 3Net present value and internal rate of return are the two primary measures for evaluating capital projects
Projected Marginal Cash Flows
Initial Investment Annual Net Operating Cash Flows
Terminal Value
($1000) $250 $350 $300 $150 $400
Net Present Value Internal Rate of Return
Use hurdle rate to measure presentvalue of projected marginal cash flows
Solve for the discount rate at which the net present value = $0
At 115 hurdle rate NPV = $124 NPV = $0 at discount rate of 176
Project financially attractive ifNPV gt $0
Project financially attractive ifIRR gt WACC (Hurdle Rate)
copy 2016 Mercer Capital 7 wwwmercercapitalcom
Exhibit 3 compares net present value and internal rate of return for a given project With a couple of fairly obscure exceptions that lie beyond our scope both NPV and IRR will yield the same conclusion regarding the financial desirability of a given project The IRR is the more intuitive of the two measures
In the face of scarce financial resources however neither measure provides an unambiguous basis for ranking and selecting from among multiple potential projects
bull Since net present value measures the value created by a project one might be tempted to simply rank projects by the magnitude of the NPV However the NPV is not scaled to project life as a result it is not obvious for example if a six-year project with an NPV of $500 is more desirable than a four-year project with a $350 net present value While there are techniques for making such comparisons the ultimate consideration cannot be reduced to a spreadsheet what capital projects will be available at the conclusion of the project with the shorter life
bull The internal rate of return calculations implicitly assume that all projected cash flows can be reinvested at the IRR through the duration of the project For high IRR projects this may not be feasible As with NPV there are techniques to work around this issue but the fundamental ques-tion remains is the calculated IRR sustainable Furthermore the IRR does not address the size of the investment Are shareholders better served by a project with an IRR of 175 and NPV of $200 or an IRR of 140 and an NPV of $300 If the projects are of equal duration the higher NPV project is theoretically superior However the higher IRR project might be interpreted as having a greater margin of safety and therefore represent a less risky allocation of capital
When ranking capital projects amid financial constraints management should carefully explain the ratio-nale for ranking projects to the board with reference to both measures
What Non-Financial Constraints Does the Company FaceThe tools described in the previous section (NPV and IRR) are useful for prioritizing and ranking capital projects given a limited capital budget which projects should be pursued However firms are likely to be constrained by non-financial limitations as well Board members should confirm that manage-ment has identified relevant non-financial constraints and has considered such constraints in developing capital project recommendations Potential non-financial constraints include the following
bull Management time and attention Does the existing management team have the available ldquobandwidthrdquo to manage the existing operations and oversee the proposed capital project A successful capital project that imperils the existing business because of the resulting manage-ment inattention may be counter-productive
bull Infrastructure and systems Are the companyrsquos information technology resources sufficient and adaptable to the proposed capital project What about human resources finance sales and marketing
bull Human capital and expertise Does the companyrsquos existing staff have the skills and compe-tencies necessary to execute on the proposed capital project If the project will require an influx of new employees are qualified individuals available in the relevant labor markets
copy 2016 Mercer Capital 8 wwwmercercapitalcom
The objective in evaluating non-financial constraints is not to inhibit growth but rather to ensure that the relevant cash flows used in the financial analysis are measured appropriately Most non-finan-cial constraints have financial solutions Additional senior managers can be hired systems can be upgraded and wages can be adjusted to attract qualified candidates By explicitly evaluating the pres-ence of such non-financial constraints however board members can ensure that the financial costs associated with remedying those constraints are incorporated in the financial analysis
What Is the Strategic Rationale for the Proposed ProjectFinancial spreadsheets are remarkably malleable with enough tweaks to the assumptions nearly any proposed project can appear financially attractive As a result a positive NPV and attractive IRR should be viewed as threshold requirements for considering a project but neither measure is a sufficient substi-tute for a compelling strategic rationale supporting the proposed projectrsquos ldquofitrdquo
Michael Porterrsquos five forces framework can serve as a useful grid for evaluating the strategic rationale for a proposed capital project
1 Industry rivalry Is the proposed project intended to provide a cost advantage over compet-itors or help differentiate the company from its rivals Will the cost advantage differentiating factor be sustainable or easily copied by peers Examples of such projects include invest-ments in production efficiency and brand development expenditures
2 Threat of new entrants Does the proposed project reduce the threat of new competitors entering the market Does it promote customer loyalty or otherwise reduce the likelihood that existing customers will be lured away by new entrants Acquiring an upstart company with potentially disruptive technology is an example of a capital project addressing this concern
3 Threat of substitutes If completed will the proposed project extend the breadth of the companyrsquos product line Is the project defensive aimed at limiting a potential loss of market share if the company does not act Projects attempting to address this concern include efforts to diversify by adding new or complementary products
4 Bargaining Power of Buyers Is the proposed project intended to increase customer switching costs or otherwise reduce the sensitivity of demand to price increases A firm may elect to acquire a primary competitor in an effort to increase pricing power By acquiring a customer a company may be attempting to capture a greater portion of the total profit along the value chain
5 Bargaining Power of Suppliers Does the proposed project deliver an alternative source of raw materials In addition to vertically-integrating acquisitions (ie purchase of a supplier) capital projects modifying the production process to facilitate the use of multiple andor cheaper inputs may address this factor
In short the ldquowhyrdquo of a capital project needs to have an affirmative and compelling strategic rationale a positive NPV is a necessary but not sufficient condition for approving a capital project The framework and questions identified above can help board members confirm that such a rationale exists
copy 2016 Mercer Capital 9 wwwmercercapitalcom
What Returns Have Prior Projects EarnedFor a growing company capital budgeting is an ongoing process not a one-time event As a result it is important for the board to monitor realized returns from prior projects to help refine the capital budgeting process for current projects rooting out potential cognitive biases like systematic over-confidence As a component of submitting a capital project for board approval management should also describe the process for measuring and evaluating subsequent performance The discipline of subsequent measurement can increase the quality and reliability of the forecasts used to support project approval
Peer Benchmarking AnalysisThe results of capital budgeting analysis for a group of public peer companies can be inferred from the statement of cash flows Exhibit 4 illustrates the basic relationships among the various sections of the statement of cash flows
By comparing the operating cash flow to the investing cash flow for a business over time we can catego-rize the company as either a cash generator (operating cash flow exceeds investing cash flow) or a cash user (investing cash flow exceeds operating cash flow) Since investing cash flows tend to be lumpy it is best to make such comparisons on a multi-year basis
Exhibit 5 on the following page summarizes the results of our analysis of small-cap and mid-cap compa-nies in the Russell 2000 index (excluding financials) for the three-year period ending 2015
Exhibit 4If operating cash flows exceed investing cash flows funds are available for distribution to capital providers otherwise companies must access additional external capital to support investing activities
Portfolio of Capital Projects in Place
Operating Cash Flow
Equity Providers
Investing Cash Flow
Debt Providers
copy 2016 Mercer Capital 10 wwwmercercapitalcom
The overall universe of companies is reasonably balanced between the two groups with cash genera-tors accounting for 48 of all observations and cash users representing 52 of the sample We draw the following observations from the analysis summarized in Exhibit 5
bull The cash generators are on balance larger than the cash users with median revenue of $666 million more than twice that of the cash users This suggests that there is a life cycle factor in capital budgeting analysis ndash smaller firms tend to be more aggressive with regard to capital investment
bull Beyond mere size the cash generators present a lower-risk financial profile than the cash users with greater profitability lower leverage (and borrowing costs) and lower betas
bull The more aggressive investment posture of the cash users leads to higher growth rates in revenue and EBITDA The pertinent question is whether the incremental revenue and profit growth is sufficient to compensate for the incremental capital deployed in the business In other words did the capital projects generate positive net present values While the answer to that question is not directly observable corresponding shareholder returns provide indirect evidence
bull Over the three-year period ending in 2015 annualized shareholder returns to the cash generators (97) exceeded those to the shareholders of cash users (91) While we make no effort to discern whether such difference is statistically significant we note that the relative proximity suggests that ndash on balance ndash the capital projects executed by the cash users had net present values approximating $0 In other words for this sample of companies over this period heavy investment translated into significant revenue and profit growth but did not generate superior shareholder returns
Exhibit 5
Cash Generators
Cash Users
Number of Companies in Group 683 744
Investment per $100 of Operating Cash Flow $055 $172
Financial Profile amp Risk
Revenue (millions) $666 $319
EBITDA Margin 123 73
Leverage (Debt EBITDA) 15x 35x
Effective Borrowing Cost 47 58
Beta 109 121
Growth Characteristics
3-yr Revenue Growth 42 143
3-yr EBITDA Growth 33 136
Valuation amp Market PerformanceEnterprise Value EBITDA 104x 113x
3-yr Annualized Return 97 91
Note - Median measures for each group data from CapIQ Mercer Capital analysis
copy 2016 Mercer Capital 11 wwwmercercapitalcom
Exhibit 6Dispersion of shareholder returns is wider for cash users than for cash generators
As shown on Exhibit 6 significant investment increases the likelihood of abnormally positive or negative shareholder returns Approximately one-third of cash users enjoyed annualized shareholder returns greater than 20 compared to less than 30 for cash generators On the down side nearly 12 of cash users suffered annualized shareholder returns of -20 or worse compared to just 75 for cash generators Heavy capital investment increases the variability of subsequent returns to shareholders increasing the likelihood of both big paydays and big losses
As shown on Exhibit 7 the magnitude of capital investment should relate to the availability of attractive capital projects
00
50
100
150
200
250
300
350
400
lt -20 -20 to -10 -10 to 0 0 to 10 10 to 20 gt 20
o
f Tot
al C
ompa
nies
Annualized Return Cohorts
Cash Generators Cash Users
Exhibit 7The availability of attractive investment opportunities should determine whether a given company is a cash user or a cash generator
Expe
cted
Ret
urn
Cost of Capital = Hurdle Rate
Cash Users
Cash Generators
copy 2016 Mercer Capital 12 wwwmercercapitalcom
Given the connection between availability of attractive capital projects and status as a cash generator or cash user one should expect to find discernable patterns across industry sectors Exhibit 8 summarizes the relative composition of the industry sectors in our sample
The industry effect on capital budgeting is pronounced in Exhibit 8
bull The preponderance of cash generators among firms in the consumer discretionary consumer staples and industrials sectors is consistent with more limited investment opportunities in mature industries
bull Recent woes in the energy and materials sectors have dried up operating cash flows increasing the number of cash users
bull The healthcare sector which includes biotechnology pharmaceuticals technology and equip-ment in addition to healthcare services offered the most abundant investment opportunities with cash users accounting for more than 80 of firms and median compound annual revenue growth in the sector of 154
bull The information technology sector is maturing with nearly equal representation among cash generators and cash users
bull Telecommunications and utilities are mature but capital intensive industries The payoff to capital investment in telecommunications over the period analyzed was uninspiring with median annualized shareholder returns of 84 for cash users compared to 197 for cash generators
The purpose of peer benchmarking analysis is not to suggest that all companies in a given industry should behave similarly Rather the purpose is to allow the board and shareholders to identify the
Exhibit 8Availability of attractive projects varies by industry
0 20 40 60 80 100
Utilities
Telecommunications
Materials
Information Technology
Industrials
Healthcare
Energy
Consumer Staples
Consumer Discretionary
Relative Composition of Companies in Sector
Cash Generators Cash Users
copy 2016 Mercer Capital 13 wwwmercercapitalcom
similarities and dissimilarities between the subject company and the peer group and understand the factors contributing to the differences For example if a company is a cash user with a peer group dominated by cash generators management should be able to identify the unique strategic advantage possessed by the company such that it will realize positive net present values on incremental capital investment while the peer group managers seem to be reaching the opposite conclusion
ConclusionFrom the perspective of the board of directors capital budgeting is the process of allocating capital to available projects The optimal portfolio of projects will cohere with the companyrsquos broader strategy to generate returns in excess of the hurdle rate
bull Identifying the relevant cash flows is essential to an appropriate financial review of the proposed project Relevant cash flows are those that would not be received or expended in the absence of the proposed project
bull The two principal tools for evaluating capital projects from a financial perspective are net present value and internal rate of return
bull The capital budgeting process should also consider non-financial constraints faced by the company such as limited management resources existing infrastructure and capacity and the availability of human capital and expertise
bull Beyond financial projections management should be able to identify the strategic rationale for the proposed project In other words a positive net present value is essential but project approval should also depend on non-financial strategic considerations
bull A healthy capital budgeting process includes a disciplined process for evaluating prior invest-ment decisions with a view toward identifying chronic cognitive biases
bull The appropriate pace of capital investment depends on the availability of attractive capital projects Benchmarking the pace of capital investment and corresponding investment returns for a group of peers can provide the board with context to evaluate the ldquofitrdquo and desirability of proposed capital projects
Switching costs for capital investment are high and do-overs are expensive Using the concepts and techniques summarized in this whitepaper will enable directors and shareholders to assess whether managementrsquos capital investment plans will enhance or detract from the value of the company
Travis W Harms CFA CPAABV9016852120 | harmstmercercapitalcom
Mercer Capitalrsquos ability to understand and determine the value of a company has been the cornerstone of the firmrsquos services and its core expertise since its founding
Mercer Capital is a national business valuation and financial advisory firm founded in 1982 We offer a broad range of valuation services including corporate valuation gift estate and income tax valuation buy-sell agreement valuation financial reporting valuation ESOP and ERISA valuation services and litigation and expert testimony consulting In addition Mercer Capital assists with transaction-related needs including MampA advisory fairness opinions solvency opinions and strategic alternatives assessment
We have provided thousands of valuation opinions for corporations of all sizes across virtually every industry vertical Our valuation opinions are well-reasoned and thoroughly documented providing critical support for any potential engagement Our work has been reviewed and accepted by the major agencies of the federal government charged with regulating business transactions as well as the largest accounting and law firms in the nation on behalf of their clients
Contact a Mercer Capital professional to discuss your needs in confidence
Mercer Capital
Travis W Harms CFA CPAABV 9013229760harmstmercercapitalcom
Timothy R Lee ASA 9013229740leetmercercapitalcom
Nicholas J Heinz ASA 9016852120heinznmercercapitalcom
Bryce Erickson ASA MRICS 2144688400ericksonbmercercapitalcom
Matthew R Crow CFA ASA 9016852120crowmmercercapitalcom
Z Christopher Mercer FASA CFA ABAR 9016852120mercercmercercapitalcom
MERCER CAPITAL
Memphis5100 Poplar Avenue Suite 2600Memphis Tennessee 381379016852120
Dallas12201 Merit Drive Suite 480Dallas Texas 752512144688400
Nashville102 Woodmont Blvd Suite 231Nashville Tennessee 372056153450350
wwwmercercapitalcom
Contact Us
Copyright copy 2016 Mercer Capital Management Inc All rights reserved It is illegal under Federal law to reproduce this publication or any portion of its contents without the publisherrsquos permission
Media quotations with source attribution are encouraged Reporters requesting additional information or editorial comment should contact Barbara Walters Price at 9016852120 This article
does not constitute legal or financial consulting advice It is offered as an information service to our clients and friends Those interested in specific guidance for legal or accounting matters should
seek competent professional advice Inquiries to discuss specific valuation matters are welcomed To learn more about Mercer Capital visit our web site at wwwmercercapitalcom
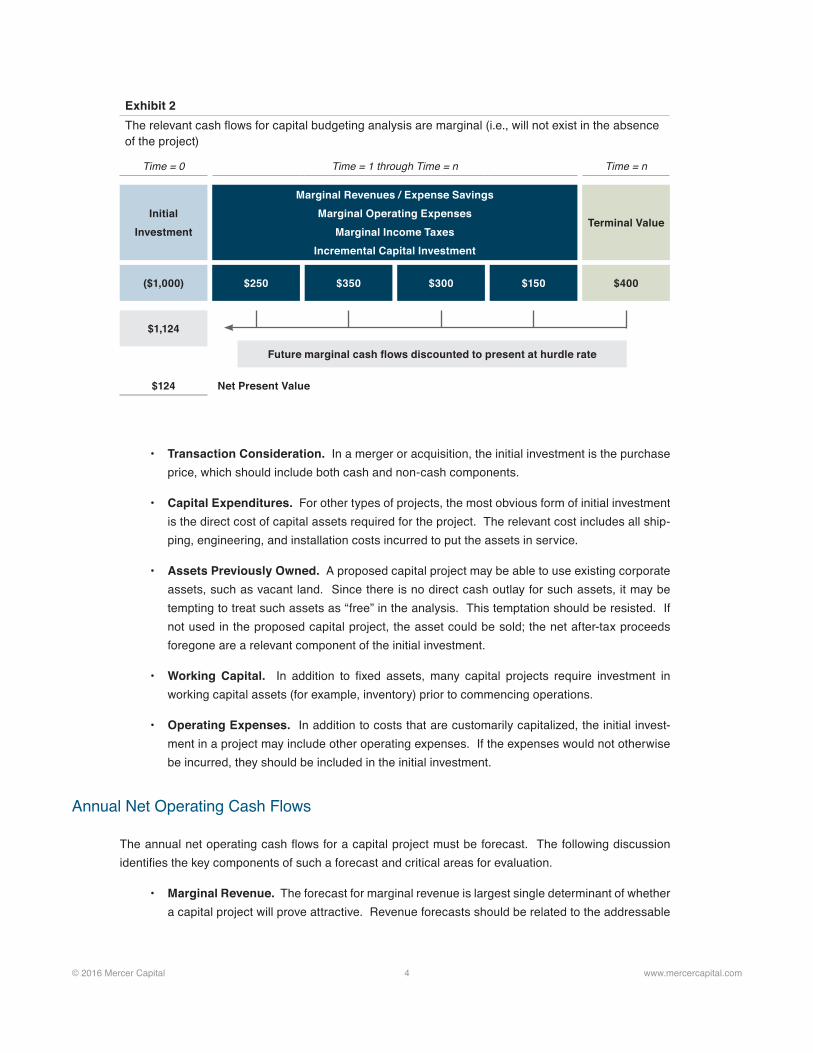
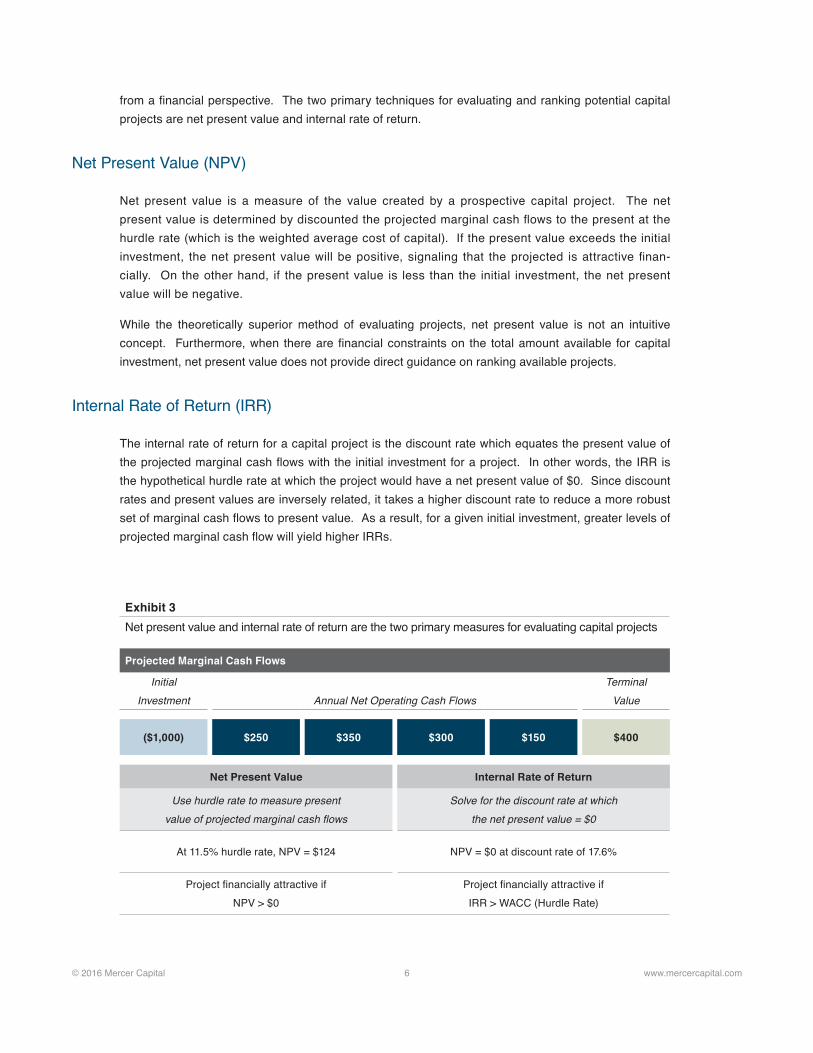
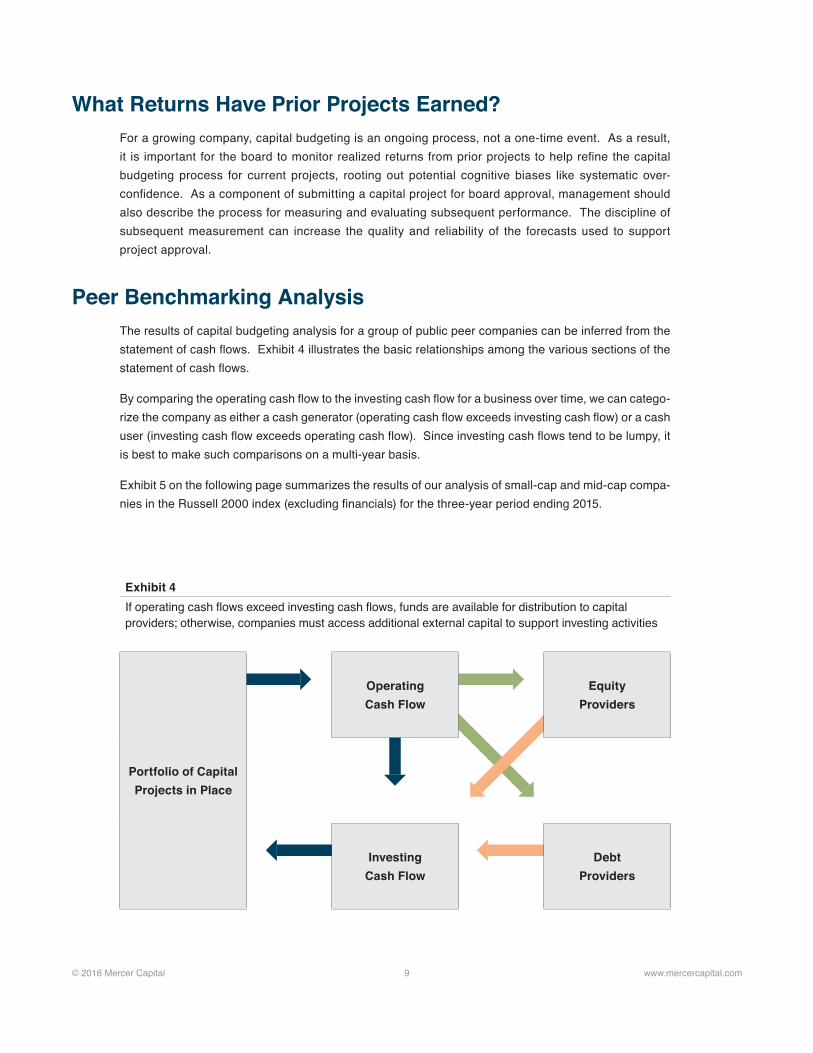
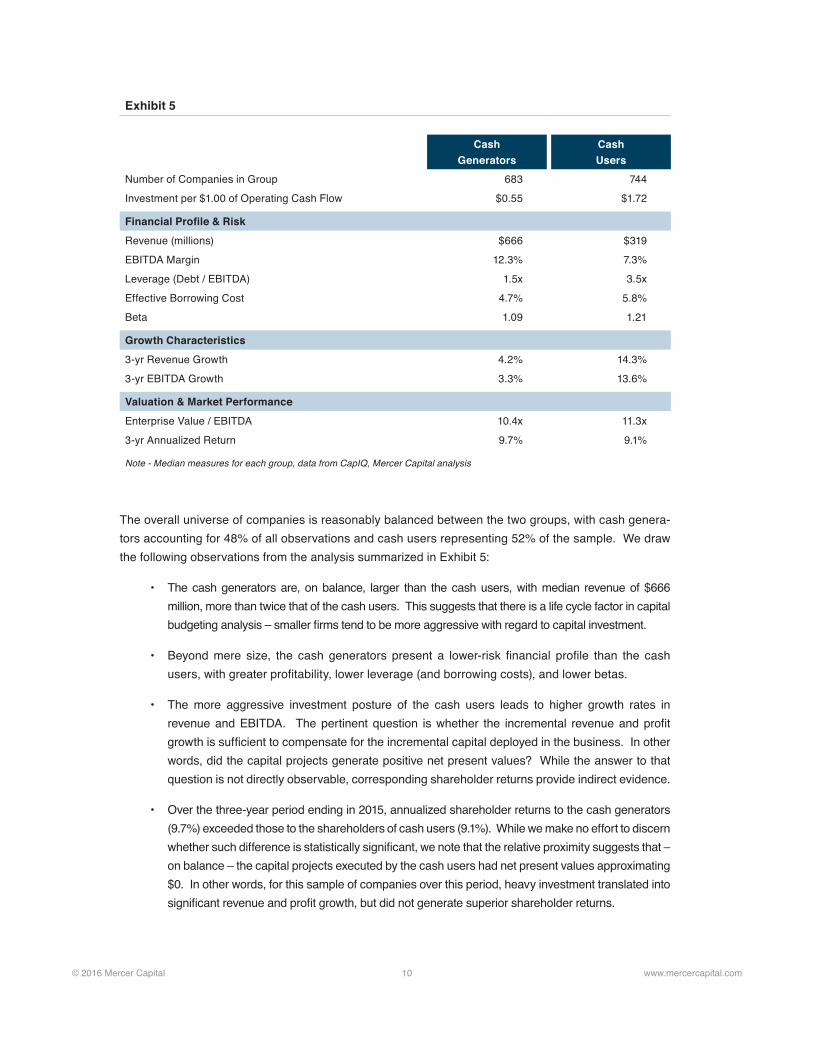
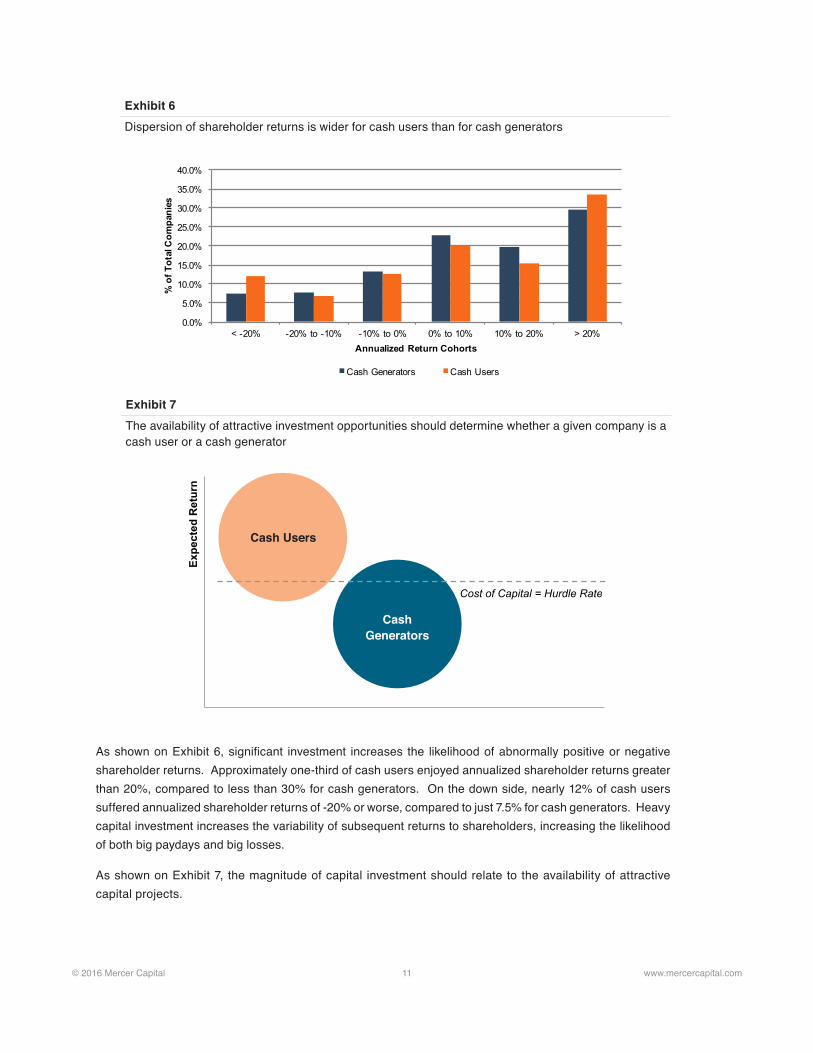
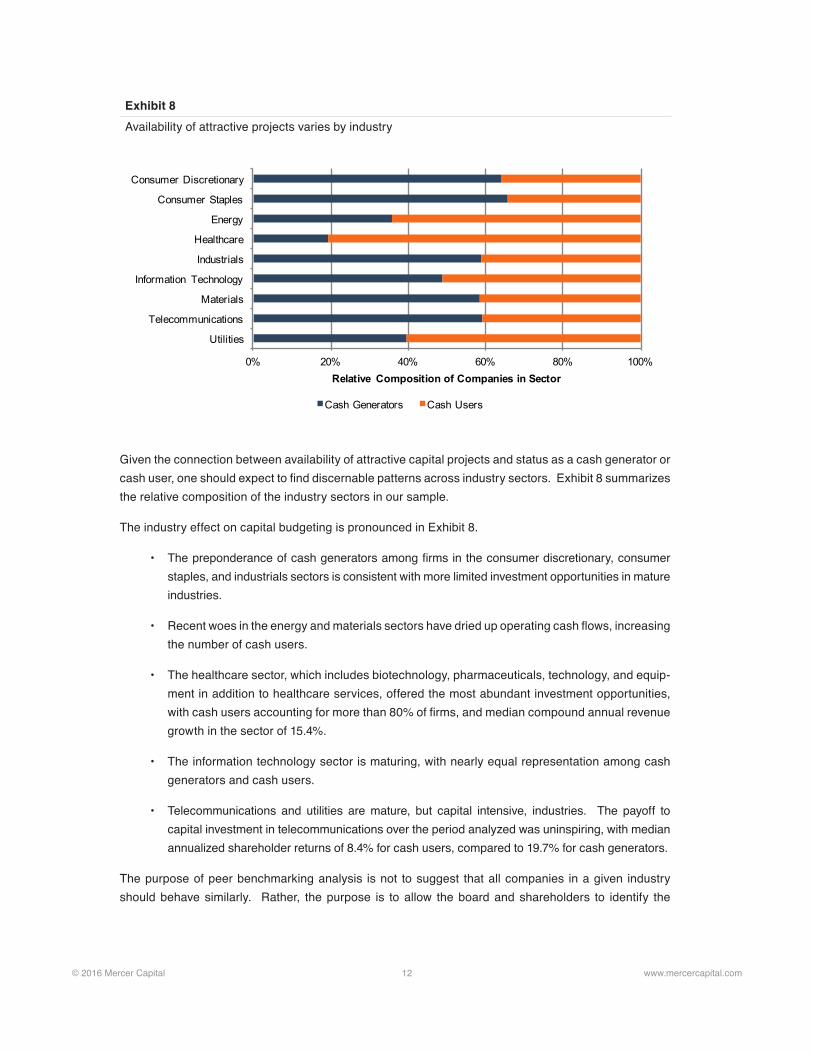