Valuation and Evaluation of Management Alternatives for ...pubs.iied.org/pdfs/8128IIED.pdf ·...
55
Valuation and Evaluation of Management Alternatives for the Pagbilao Mangrove Forest Ron Janssen and Jose E. Padilla CREED Working Paper Series No 9 October 1996
Transcript of Valuation and Evaluation of Management Alternatives for ...pubs.iied.org/pdfs/8128IIED.pdf ·...
Valuation and Evaluation ofManagement Alternatives forthe Pagbilao Mangrove Forest
Ron Janssen and Jose E. Padilla
CREED Working Paper Series No 9
October 1996

Ron Janssen is a Senior Economist at the Institute for Environmental Studies (IVM), Amsterdam. Hemay be contacted at
Institute for Environmental StudiesVrije UniversiteitDe Boelelaan 11151081 HV AmsterdamTHE NETHERLANDS
Tel: 31 20 444 9555Fax: 31 20 444 9553
Jose Padilla is President of Resources, Environment and Economics Centre for Studies (REEC). Hemay be contacted at:
REECUnit 3N, 219 Katipunan AvenueBlueRidge, Quezon CityPhilippines 1109
Tel.: 632 795-428/420Fax.: 632 439-3260

The programme of Collaborative Research in the Economics of Environment and Development (CREED)was established in 1993 as a joint initiative of the International Institute for Environment and Development(IIED), London, and the Institute for Environmental Studies (IVM), Amsterdam. The Secretariat forCREED is based at IIED in London. A Steering Committee is responsible for overall management andcoordination of the CREED Programme.
Environmental Economics Programme, IIED
IIED is an independent, non-profit organisation which seeks to promote sustainable patterns of worlddevelopment through research, training, policy studies, consensus building and public information. TheEnvironmental Economics Programme is one of seven major programmes of IIED; it conducts economicresearch and policy analysis for improved management of natural resources and sustainable economicgrowth in the developing world.
Environmental Economics ProgrammeIIED, 3 Endsleigh StreetLondon WC1H 0DD, UKTel (44 171) 388 2117; Fax (44 171) 388 2826e-mail: [email protected]
Institute for Environmental Studies, (IVM)
IVM is a non-profit research institute, based at Vrije Universiteit, Amsterdam. The Institute's primaryobjective is to carry out multi- and interdisciplinary research on environmental issues, based on cross-fertilisation of monodisciplinary sciences. Environment and the Third World is one of eight major IVMresearch programmes.
IVM, Vrije UniversiteitDe Boelelaan 11151081 HV AmsterdamThe NetherlandsTel: (31 20) 444 9555; Fax: (31 20) 444 9553e-mail: [email protected]
CREED Steering Committee members include:
Prof Johannes Opschoor, Institute for Social Studies, The Netherlands (Chair)Prof Gopal Kadekodi, Institute of Economic Growth, IndiaDr Ronaldo Seroa da Motta, IPEA, BrazilDr Mohamud Jama, Institute for Development Studies, KenyaDr Anantha Duraiappah, IVM, The NetherlandsProf Harmen Verbruggen, IVM, The NetherlandsJoshua Bishop, IIED, UKMaryanne Grieg-Gran, IIED, UK

Abstract
Mangrove forests and swamps are rapidly declining in many parts of the world. This has resulted inthe loss of important environmental and economic functions and products, including forest products,tidal wave control, breeding ground for fish etc. One of the major threats to mangroves in thePhilippines is the rapidly increasing aquaculture industry. In order to understand the importance ofmangroves, insight into the total economic value of mangroves is important. Comparisons are madewith the total value generated by alternative uses such as aquaculture and forestry. In addition toeconomic value, equity and sustainability objectives are taken into account and analyzed accordingto the perspective of different types of decision makers involved..
The aim of this paper is to demonstrate the use of results obtained from valuation of mangroves tosupport an evaluation of management alternatives for the Pagbilao mangrove forest. The structure ofthis paper is as follows: first the study site is introduced; this is followed by a review of managementalternatives for the Pagbilao mangrove forest, and an assessment of the values of the goods andservices linked to these management alternatives. Next, the results from the valuation are used tosupport the selection of the preferred management alternative, first in a cost-benefit approach, thencombined with other types of information in a multi-criteria approach. This paper concludes that ifeconomic efficiency is maximized, conversion to aquaculture is the preferred alternative. However,if equity and sustainability objectives are included commercial forestry is the preferred alternative.
Abrégé
Les forêts et marais en mangroves subissent un déclin rapide en de nombreux endroits du monde,avec pour conséquence la perte d'importants produits et fonctions écologiques et économiques:produits forestiers, contrôle des courants de marées, lieux de reproduction halieutique, etc. AuxPhilippines, l'une des principales menaces pesant sur les mangroves tient à la rapide croissance de lafilière aquacole. Pour comprendre l'importance des mangroves, il faut en discerner la valeuréconomique totale. On procède à des comparaisons entre valeurs totales engendrées par deuxmodes alternatifs d'exploitation des mangroves: aquaculture et foresterie. Outre la valeuréconomique, on tient compte d'objectifs relevant de l'équité et de la durabilité, qu'on analyse dupoint de vue des différents décideurs intervenant dans la gestion des mangroves.
Le but de ce texte est de montrer quel usage on peut faire des résultats d'une estimation de la valeurdes mangroves pour appuyer l'évaluation des options de gestion de la mangrove forestière dePagbilao. Ce texte emprunte le plan suivant: en premier lieu, on présente le site d'étude; puis onprésente les options alternatives de gestion de la mangrove forestière de Pagbilao ainsi qu'uneestimation de la valeur des biens et services afférents à ces alternatives. On utilise ensuite lesrésultats de l'estimation pour appuyer la sélection de l'option de gestion préférée, d'abord dans lecadre d'une approche coût-bénéfice, puis, combinés à d'autres types d'informations, au sein d'uneapproche à critères multiples. Le texte aboutit à la conclusion que pour maximiser l'efficacitééconomique de la mangrove, il faut préférer la conversion à l'aquaculture. Mais si on se fixe aussipour objectifs l'équité et la durabilité, c'est la foresterie commerciale qui devient l'option préférable.

Resumen
Los bosques y pantanos de mangle se deterioran rápidamente en muchos lugares del mundo. Elresultado de este proceso de deterioro tiene una repercusión importante en la pérdida de funcionesy de productos económicos y ambientales, incluyendo productos forestales, control de mareas,criaderos de peces, etc. En Filipinas, una de las mayores amenazas a los manglares es el rápidocrecimiento en la industria de la acuicultura. Para entender la importancia de los manglares, esimportante tener una idea general acerca de su valor económico. Con este propósito, en estetrabajo se hacen comparaciones con el valor total que se genera por usos alternativos como son laacuicultura y la silvicultura. Además de su valor económico, se toman en cuenta objetivos deequidad y sustentabilidad los cuales se analizan de acuerdo a la perspectiva de los distintos actoresque tienen poder decisorio en el manejo de los manglares.
El objetivo de esta monografía es demostrar el uso de los resultados obtenidos en el avalúo demanglares para sustentar una evaluación de alternativas de gestión para el manglar de Pagbilao. Laestructura de esta monografía es la siguiente: primero se describe el lugar de estudio; a ésto le sigueun examen de las alternativas de gestión del manglar de Pagbilao y una evaluación del valor de losbienes y servicios relacionados con estas alternativas de gestión. A continuación, los resultados delavalúo se utilizan como base para justificar la selección de la alternativa de gestión escogida,primero, desde una perspectiva de vista costo-beneficio, y luego en combinación con otros tipos deinformación dentro de un enfoque de criterios múltiples. La monografía concluye que, si se deseamaximizar la eficiencia económica, la alternativa preferida es la conversión a la acuicultura. Sinembargo, si se incluyen en el análisis objetivos de equidad y sustentabilidad, entonces la alternativapreferida sería la silvicultura comercial.

Contents
List of tables
Introduction 1
The Pagbilao Experimental Mangrove Forest 3Forest zones and mangrove tree species 6Mangrove fishery resources 6
Mangrove Resource Management Alternatives 9Past and current uses 9Management alternatives 9
Quanitification and Valuation of Goods andServices from the Mangrove Forest 12
Forest products 12Capture fisheries 13Aquaculture 14
The Decision Problem 15
Valuation: A Benefit Cost Approach 18Valued effects 18Other effects 18Comparison with other studies 20
Evaluation: A Multi-Criteria Approach 23
Conclusions and Recommendations 30
References 34
Appendix A 37

List of tables and figures
Table 1 Areas of mangroves and brackish water fishponds in the Philippines. 2Table 2 Area allocation of the Pagbilao mangrove forest by management option 10Table 3 Effects table 16Table 4 Decision makers and their objectives 17Table 5 Valued effects table 19Table 6 A comparison of net annual benefits of mangrove products and functions. 20Table 7 Performance of the alternatives on three objectives 25Table 8 Decision makers, their objectives and their preferred alternatives. 31
Figure 1 The study site 4Figure 2 Pagbilao mangrove forest, seaward portion 7Figure 3 Pagbilao fishing harbour 7Figure 4 Value to be attached to biodiversity to balance the benefits of preservation
and the benefits of conversion to fishponds of the Pagbilao Mangrove forest. 22Figure 5 A graphic representation of the valued effects table 23Figure 6 A graphical ranking of the valued effects table 24Figure 7 Trade-off between efficiency and equity 26Figure 8 Trade-off between efficiency and environment 26Figure 9 Trade-off between equity and environment 27Figure 10 Efficiency, equity and environment are equally important. 28Figure 11 Efficiency is more important than equity; equity is
more important than environment 28Figure 12 Environment is more important than equity,
equity is more important than efficiency 28
Appendix
Table A1 Wildlife of the mangrove areas, Pagbilao, Quezon, Philippines 37Table A2 Major plant species of the Pagbilao mangrove reserve by zone 38Table A3 Taxonomic identification of fish species found in the Pagbilao mangrove reserve 39Table A4 Habits and foods of fishes in the Pagbilao mangroves 41Table A5 Forest products 42Table A6 Valuation of forest products 43Table A7 Estimates of annual production and value of market-size fishes taking into
account natural mortality of various fish species (kg/ha/yr) 45Table A8 Aquaculture production and computation of present value of net profits
for each management alternative over 25 years aquaculture 46Table A9 Value of annual production of different marketable products for
each management alternative. 47

CREED Working Paper Series No 9 1
Introduction
Mangrove forests can be found in the brackish water margin between land and sea in tropical andsubtropical areas. They are part of rich ecosystems providing a variety of economic andenvironmental functions and products. In traditional subsistence economies the exploitation ofmangrove resources is usually not intensive and settlement is quite sparse. In South East Asia thishas been attributed to the scarcity of freshwater for domestic use and the unsuitability of mangrovesoils for long-term agricultural exploitation. However, in recent years, as traditional economies havebecome increasingly market-integrated and modernised, the building of access roads, the provisionof amenities in these areas, and the improvements in technology have intensified the exploitation andsettlement of mangrove forests. In the Philippines, these changes in mangrove forest use have resulted in a loss of forest cover from approximately 288,035 ha. in 1970 to 23,400 ha. in 1993.
One of the major threats to mangroves in the Philippines is the rapidly increasing aquacultureindustry. In 1993 261,402 ha. of mangrove area were used for brackish water fishponds (Table 1). Although a moratorium has been placed on harvesting of mangroves for timber, the process ofconversion is still taking place. In order to understand the importance of mangroves, insight into thetotal economic value of mangroves is important. Comparisons can then be made with the total valuegenerated by alternative uses such as aquaculture and forestry. Several studies which haveanalysed and valued the environmental functions of mangroves indicate the importance ofinternalising these externalities in environmental management (Opschoor 1987, Ruitenbeek 1992,Barbier 1991, Dixon and Lal 1994, Gren et al. 1994).
Besides estimating the total value of mangrove forests, it is also important to focus on the decisionmakers involved in mangrove forest management. Decision makers exist at different levels, fromfishpond owners at the local level, to the Global Environmental Facility at the international level, andeach has specific objectives which are not always included in the economic valuation of themanagement alternatives. These may include improvement of local employment and income (equityobjectives), and the conservation of intrinsic qualities of the environment (sustainability objectives).
The objective of this paper is to demonstrate the use of results from valuation to support theevaluation of management alternatives for the Pagbilao mangrove forest in the Philippines. Thispaper presents results from the project “Economic Valuation of Mangrove-Fishpond Interactions”,part of the programme for Collaborative Research in the Economics of Environment andDevelopment (CREED).

CREED Working Paper Series No 9 2
Table 1. Area of mangroves and brackish water fishponds (ha)
year mangroves brackish waterfishponds
1970 288,035 168,118
1971 286,650 171,446
1972 284,211 174,101
1973 258,895 176,184
1974 256,156 176,032
1975 254,016 176,032
1976 251,577 176,231
1977 249,138 176,231
1978 246,699 176,231
1979 245,000 176,231
1980 241,801 176,231
1981 239,382 195,832
1982 239,382 195,832
1983 234,504 196,269
1984 232,065 206,525
1985 226,673 205,001
1986 221,280 210,319
1987 143,522 210,458
1988 139,100 210,681
1989 135,700 210,681
1990 132,500 210,681
1991 129,200 225,002
1992 126,300 239,323
1993 123,400 261,402
Source: Forest Management Bureau, Bureau of Fisheries and Aquatic Resources.
The structure of the paper is as follows: first the study site is introduced; this is followed by a reviewof management alternatives for the Pagbilao mangrove forest, and an assessment of the values of thegoods and services linked to these management alternatives. The decision problem is thenformulated. Next the results from the valuation are used to support the selection of the preferredmanagement alternatives, first in a cost-benefit approach then combined with other types ofinformation in a multi-criteria approach. Conclusions and recommendations are presented in thefinal section.

CREED Working Paper Series No 9 3
The Pagbilao Experimental Mangrove Forest
The municipality of Pagbilao is situated in the foothills of Mount Banahaw in the southern part ofQuezon Province in Luzon Island. It is bounded on the north-west by the municipality of Tayabas,north-east by Atimonan, south-east by Padre Burgos and south-west by the City of Lucena (Figure1). It has a total land area of 15,820 ha. covering 27 barangays1 of which 21 are rural and 6 areurban. Pagbilao has 9 coastal barangays of which 6 are fringed with mangroves. Pagbilao has avolcanic terrain with slope of up to 15%.
The population of Pagbilao stood at 41,635 in 1990 (National Statistics Office) with an annualgrowth rate of 2.77% from 1980-1990. The total number of households is 8,450. It is estimatedthat by the year 2000 the municipal population and the number of households will reach 56,730 and11,818 respectively. Over 50% of the population of Pagbilao is of working age and about 97% isliterate. Half of Pagbilao's population depends on agriculture for its livelihood: 77% of the land areais devoted to agriculture with coconut and palay being the dominant crops with respectively 65%and 12% of the total land area planted. Coffee, corn, bananas, root crops, citrus fruits andvegetables are also grown, while copra is the main agricultural product in Pagbilao. In addition,agro-livestock and cottage industries provide considerable employment. Pagbilao is a fourth classmunicipality2 in terms of municipal income. Since municipal income is derived from municipal taxes,which in turn is a function of the income of households and business establishments, it may beinferred that the municipality is relatively poor. Information of the average household income is notavailable but observations of the type of dwellings in the coastal villages show that these are similarto the rest of the Philippines. Poverty is widespread, and emigration in search of more stablesources of income is common. Education is seen as the key to finding employment elsewhere.
Pagbilao has a total of 1,440 ha of forest lands scattered in several barangays. The northern andwestern sides are parts of the Quezon National Forest Park with 983 ha of old-growth tropicaldipterocarp forest. Surrounded by mangrove forest and coral reefs, Pagbilao Bay is one of therichest natural marine areas in Southern Luzon. There are about 2,048 fishermen with 247motorised and 282 non-motorised bancas. There are 56 fishpond operators covering 1,146 has.The collection of tropical aquarium fishes is an important alternative to capture fishing. and currentlyinvolves about 300 collectors.
Coral reef diversity is average with 33 genera recorded. There are 60 species belonging to 18families of coral reef fish. With live coral cover ranging from only 27% - 73%, the coral resourcesare categorised poor to good. There are 10 species of seaweed and 4 species of seagrasses butthese resources are disturbed (Fortes 1993). In the mangroves, there are 128 fish
1 The barangay is the smallest political unit in the Philippines.2 Municipalities are classified based on the following income ranges during the last three years (1990-1992):First class (P15 million or more), second class (P10 M or more but less than P15 M), third class(P7 M or morebut less than P10 M), fourth class (P4 M or more but less than P7 M), fifth class (P2 M or more but less thanP4 M) and sixth class (below P2 M). (Source: Department of Finance Order No. 35-95)

CREED Working Paper Series No 9 4
Map of municipality
Figure 1 here

CREED Working Paper Series No 9 5
belonging to 54 families (Pinto 1987). Ambassis kopsi (Ambassidae) was the most abundantspecies. Gobies (Glossoqobius sp.), mullets (Mugil sp.), snappers (Lutjanus sp.), milk fish(chanos), scads (Scathophagus sp.) and groupers (Serranids) were also found in the area.Crustaceans such as shrimps (Peneaus sp), macrobrachium sp. and crabs (Grapsidae) also dwell inthe mangroves.
Some rare and endangered species can be found in the Quezon National Forest Park. Endangeredspecies include the Rufous hornbill, the Philippine deer (Cervus rusa philippinensis) and thePhilippine monkey (Table A1). Classified as rare birds are the Philippine forest kingfisher, spottedwood kingfisher and Luzon little crow. Rare mammals in the park include the Philippine rind rat. Inthe mangroves, shore birds are the most apparent wildlife species. There are 20 species observedin drained or disused fishponds and inter tidal areas at low tide. Common species include the woodsandpiper, red-necked stint, common sandpiper and wimbrel. Also observed in Tayabas Bay areherons, egrets and bitterns. Nankeen night herons breed in the seaward mangrove fringe and arehunted by the local community. Cattle egrets can be found in the rice fields and some portions ofthe landward parts of the fishponds and coastal area. An endangered species, the Chinese egretwas found foraging in the inter tidal areas of Pagbilao. Terns (Laridae) were also observed whereinthe most common is the whiskered tern and an endemic duck, the Philippine mallard. Bats areidentified as locally important through the collection of guano (bat manure) as a source of income.
A recent estimate (Bina 1988) of remaining mangrove areas in the Philippines shows that, of theoriginal 400,000 - 500,000 ha. thought to have existed in 1918 (Brown and Fischer 1920), about139,725 ha. remain. The distribution of this area is as follows: 16% Luzon, 30% in Palawan, 27%in the Visayas and also 27% in Mindanao (excluding Sulu and Tawi-Tawi). The figure should besmaller now, considering the continued clearing of mangroves for aquaculture and the decimationbrought about by pollution. Of the remaining mangroves only 10,000 has. are old growth and therest are mainly second growth. While around 68% of the denuded mangrove areas are nowdevoted to brackish water aquaculture (Zamora 1990), mangrove areas are not usually directlyconverted to fishponds. Conversion to fishponds follows construction of dikes in unproductivemangal areas. The latter results from unsustainable harvesting of mangrove forest resources. Table1 suggests that most of the mangrove areas lost have been converted to fishponds.
The original area of mangroves in Pagbilao is not known but can be deduced from the existing areaof mangroves and brackish water fishponds. In 1984 the total area of Pagbilao mangrove forestwas around 693 ha. Of this, 396 ha were within public forest lands while 297 ha were ownedprivately (RP-German FRI Project, 1987). Today, what remains of the public forest land is theexperimental forest under the jurisdiction of the Department of Environment and Natural Resources. The legal basis of the experimental forest is Presidential proclamations 2151 and 2152, in 1981,which declared certain islands and/or parts of the country as wilderness areas. These lawswithdrew from entry, sale, settlement and other forms of disposition a large portion of mangroveareas in the country. The primary purpose of these proclamations was to preserve whatever wasleft of the mangrove forest in the country.
The second growth mangrove forest in Pagbilao was further designated as a Genetic Resource Areaand National Training Centre for Mangroves. The specific objectives of a genetic resource areainclude: a) conservation of the genetic diversity of the mangrove ecosystem; b) demonstration of

CREED Working Paper Series No 9 6
practical management for perpetuating mangrove species; c) establishment of sources ofdocumented seeds and seedlings for mangrove reforestation; d) provision of livelihood andrecreational amenities to communities and visitors; and e) to serve as a laboratory for students,scientists, environmentalists, researchers, and other interested parties. Since its declaration, themangrove area has generated scientific interest and has attracted numerous scientists, both local andforeign.
Forest zones and mangrove tree species
The experimental forest has three evident zones. The landward portion borders towards theecotone3. Among the landward tree species are nilad, buta-buta, api-api, pi-api,tinduk-tindukan, etc. (Table A2). Except for api-api and pi-api, most species in this portion aresmall in diameter with plenty of thickets underneath. Vines such as bagnit and gatasan alsoabound. The middleward portion is the part immediately after the landward and constitutes thecentral portion of the forest. This portion has big trees of api-api and pi-api together with busain,pototan, tangal, and malatangal. The forest floor is relatively clear, with vines such as bagnitand gatasan occurring sparsely. The seaward portion begins from the shore towards themiddleward portion (Figure 2). Tree species in this portion are bakawan lalaki, bakawan babae,bagatpat, etc. although they are stunted due to heavy exploitation in the past. Regenerationunderneath is also observed. In the riverine portions, tabigi, pagatpat, nipa, lagolo, pedada,bagnit, and galivario (thorny vine) exist in association with the species as observed in thepreviously described zones wherever the riverine portion is located.
Compared to other mangrove areas in the Philippines, Pagbilao Bay has the highest number (19) oftrue mangrove species, comprising 56% of the total true mangrove species. It also appears to bethe most botanically diverse in terms of number of tree species, associates and variations in thenature of topography and substrate (NRMC 1980). The most important of the true mangrovefamilies observed in Pagbilao are the Rhizophoraceae and Aviceniaceae where the bakawans andapi-api species belong, respectively.
Mangrove fishery resources
The fisheries surveys for this project were conducted to extend and verify the results of previousstudies on fishery resources of the Pagbilao mangrove forest. The most abundant species of fishwere the glass fishes Ambassis kopsi and A. urotaenia, the halfbeak Zenarchopterus buffonisand the juveniles of the ponyfish Leiognathus spp (Appendix table A3). Several species appear tobe residents of Sukol creek and the waterways of Pagbilao Bay based on: (1) high abundance in thepocket seine catches; (2) wide size range including adult sizes; and (3) low abundance or non-occurrence outside the mangroves. Such residents include Ambassis kopsi, A. urotaenia,Zenarchopterus buffonis, Butis butis, Prosposodasys gogorzae,
3 An ecotone is a transition area between two adjacent ecological communities usually exhibiting competitionbetween organisms common to both.

CREED Working Paper Series No 9 7
Figure 2 Seaward section of the Pagbilao mangrove forest
Figure 3 Pagbilao fishing harbour

CREED Working Paper Series No 9 8
Gullaphalus mirabilis, Yongeichthys criniger, Oxyurichthys opthamonema, Acentrogobiusspp, Leiognathus spp., and Valamugil cunnesius. The other gobies in the catch were probablyalso residents but not in high population densities. The Ambassis and Leiognathus spp. are foundall over Pagbilao Bay, even outside the mangrove areas. Snakes are common in the mangroves andin Pagbilao Bay in general. Two colubrid snakes were caught during the study: the dog-facedCerberus rhychops and sea snake Acrochordous granulatus. Both species are known to feed onfish (Table A4). The coastal villages of Pagbilao are dependent on the mangrove fishery resources,the most important of which are the mud crabs and marine crabs. Mostly local artisanal fishersbased in the coastal villages of Pagbilao exploit the mangrove fishery resources in Pagbilao Bay(Figure 3). The fisheries of Tayabas Bay, to which Pagbilao Bay opens, is exploited by both localmunicipal and commercial fishers. Commercial fishers based elsewhere may also exploit TayabasBay fisheries.

CREED Working Paper Series No 9 9
Mangrove Resource Management Alternatives
Past and current uses
Through the years mangroves have provided a livelihood for Pagbilao coastal residents such as thegathering of minor mangrove products like vines for handicraft, shells and crabs for food, nipaleaves for home construction, and bark for tannins. Wide scale conversion into fishpondscontributed to the loss of mangrove areas while excessive harvesting of timber for charcoal and fuelwood degraded the quality of the forest. It is estimated that the total area of fishponds in Pagbilaotown with legitimate fishpond lease agreements (FLAs) is 604.57 ha. This area excludes the area inprivate lands and those which were illegally established.
Although extraction of mangrove forest resources is now prohibited, harvesting still persists on alimited scale. Field visits and interviews have verified the cutting of mangrove branches for fuelwood and poles (but not for timber) and nipa fronds for shingles even after Proclamations 2151 and2152. These low-impact forms of extraction are tolerated but not the wide-scale cutting or clearingof a mangrove patch. An illegal attempt to convert part of the area into fishpond is now under courtlitigation. Trapping of resident fish species is not prohibited and is undertaken by local fishers.
The continuing exploitation of mangrove resources may be attributed to their accessibility. Theexperimental forest is very close to inhabited areas and is easily accessible by boat, by landtransport and on foot. From the nearest village of Palsabangon, access time on foot is about 30minutes, while tricycles can negotiate the same route in about 10 minutes. Work animals such ascarabaos and horses may be used more effectively to transport forest resources such as poles andtimber. Boats are more commonly used in gathering nipa products. Because the Pagbilaomangrove forest is the only in-tact forest remaining close to Manila, it has been the site of frequentmangrove-related studies conducted by the government, university and other research communities,both local and foreign. This is evident in studies cited in the fisheries and forestry reports and fromour own study period.
Management alternatives
In this study eight management alternatives are considered and are described below. The allocationof the area in each management alternative is shown in Table 2. The likely institutional arrangementfor each management alternative is also described as this is an important consideration in resourcevaluation. Sustainability is the overriding consideration in the exploitation of mangrove fishery andforestry resources as well as in aquaculture alternatives. This consideration is imbedded in thespecification of the recommended silvicultural and aquaculture technologies. Therefore allalternatives listed below can be considered sustainable.

CREED Working Paper Series No 9 10
Table 2. Area allocation by management alternative
Fishponds Forest Total Management alternative Production forest buffer
ha % ha % ha % ha
Preservation 0 0 110.7 100 0 0 110.7
Subsistence forestry 0 0 0 0 110.7 100 110.7
Commercial forestry 0 0 110.7 100 0 0 110.7
Aqua-silviculture 28.6 26 66.6 60 15.5 14 110.7
Semi-intensive aquaculture 95.2 86 0 0 15.5 14 110.7
Intensive aquaculture 95.2 86 0 0 15.5 14 110.7Commercial forestry & intensive aquaculture
35 32 60.2 54 15.5 14 110.7
Subsistence forestry and intensive aquaculture
35 32 60.2 54 15.5 14 110.7
1. Preservation (PR). Extraction of forest products is not allowed but the gathering of fish andshellfish, such as molluscs and crabs, is permitted. The current institutional arrangement for theexploitation of fishery resources is open access although a community-based management ofmangrove and bay fishery resources may be arranged. Most dependent on mangrove fisheryresources are the poor artisanal fishers from the coastal villages of Pagbilao.
2. Subsistence forestry (SF). Coastal communities are allowed to obtain wholly or partly theirforest products needs from the forest. The communities themselves manage the forest inaccordance with existing policies on community-based forest management. To sustain the benefits,a maximum allowable harvest not to exceed the capacity of the forest to regenerate and developnaturally, is imposed. This implies that some sort of limited entry into the forest resources will beinstituted. Mangrove stewardship agreements may be signed between the government and thecommunities in alternatives involving extraction of forest products. Thus, the benefits from thisalternative would accrue to the local residents who are generally poor.
3. Commercial forestry (CF). A specified commercial volume of forest products is to beharvested. The required silvicultural system for this is the seed tree method with planting; seed trees(mother trees) are selected to be left to provide propagules for the harvested areas. Similarly, amangrove stewardship agreement between the government and communities may be put in place forthis management alternative. Thus, revenues from commercial mangrove forestry may accrue to thelocal community acting as a co-operative.
4. Aqua-silviculture (AS). Portions of the mangrove area are converted to fishponds while someportions will remain forested. Buffer zones are allocated based on legal requirements of 50 metersfor areas facing the sea and 20 meters along river channels. The remaining area is devoted to aqua-silviculture assuming a 30 to 70 ratio for fishpond and forest. This is a combined use alternativewhereby silviculture and aquaculture are simultaneously practised in one pond compartment. Considering the high investment costs in the construction of pond compartments, coastal dwellersmay not be able to participate in this management alternative. The most likely beneficiaries are those

CREED Working Paper Series No 9 11
who are able to shoulder the investment costs which are the rich, either from Pagbilao but morelikely from elsewhere.
5. Semi-intensive aquaculture (SI). The mangrove forest is converted to fishponds for semi-intensive aquaculture while observing the required buffer zone. The remaining area will be coveredby a system of ponds and water distribution systems. The recommended semi-intensive aquaculturetechnology is an average four crops of milk fish per year with stocking density of about 0.3 fingerlingper m2. The low stocking density and the limited use of chemicals in semi-intensive pond culture arelikely to contribute to sustainability. For the management alternatives involving aquaculture, fishpondlease agreements may be auctioned off. These are likely to go to the wealthy who are able to putup the high costs of pond development.
6. Intensive aquaculture (IA). This alternative is similar to semi-intensive aquaculture in terms ofallocation of area between the required buffer zone and fishponds. The same tenure structure as insemi-intensive aquaculture may emerge with this management alternative. The only difference is thatthe aquaculture technology employed is intensive. The intensive part of the recommendedaquaculture technology applies to the one crop of prawn per year whereby relatively high rates ofstocking (up to 15 fry per m2) and artificial feeding are practised. A second crop of milk fish isimmediately grown with zero input to feed on the remaining fish food in the pond. The rotation ofprawn and milk fish is considered sustainable given the high mortality experienced when growingtwo prawn crops in one year in some parts of the Philippines (Padilla and Tanael 1996).
7. Commercial forestry and intensive aquaculture (CF/IA). This alternative divides the areainto commercial forestry and fishponds for intensive aquaculture. It is intended to satisfy competingdemands on the mangroves. Mangrove stewardship agreements may be signed with thecommunities for the commercial forestry alternative while fishpond leases may be auctioned. Thesilvicultural practice in commercial forestry and the intensive aquaculture technology are asdescribed above.
8. Subsistence forestry and intensive aquaculture (SF/IA). This is similar to the previousalternative except that the remaining forest is used for subsistence purposes. Tenure arrangementswould be similar to the subsistence forestry alternative and the aquaculture alternatives. Thesilvicultural practice in commercial forestry and the intensive aquaculture technology are asdescribed above.
The institutional arrangement for each management alternative is briefly described above.Alternatives including subsistence forestry or commercial forestry require mechanisms for controllingaccess and limiting cutting rates to sustainable levels. The costs of enforcement of such mechanismsare assumed to be lowest in community-based management. Regulations may become self-enforcing if these are formulated and enforced by the community itself.

CREED Working Paper Series No 9 12
Quantification and Valuation of Goodsand Services from the Mangrove Forest
The management alternatives range from preservation to combined uses of mangroves in Pagbilao. Some alternatives permit the use of the entire mangrove forest by an interest group (community orfishpond operators) while the combined use alternatives involve shared use by competing users. Environmental considerations are satisfied in all alternatives, for instance, the rate of timberharvesting is limited to sustainable levels. The prescribed technology for aquaculture allows forlong-term use of the fishponds and can therefore be considered sustainable.
Forest products
The quantification and valuation of goods and services proceeded from field surveys of themangrove reserve in 1995. For the forest resources, the results are summarised in Carandang andPadilla (1996). The mangroves of Pagbilao are all second growth with an average age of 20 years. Three zones or ecotones were identified, ie, landward, middleward and seaward. Sample plotswere established in each ecotone and tree density, tree dimensions and subsequently wood volumewere measured or computed. Projected timber yield was estimated over time using an empiricalequation for the Philippines with stand age and site index as explanatory variables. For 1995, theaverage timber yield in m3 per ha ranges from 2.18 to 3.08 for the various zones. Over 100 years,the computed mean annual increments in m3 per ha are respectively, 1.18, 1.67 and 1.49 for theseaward, middleward and landward zones. Litter traps were also set within the same plots toestimate litter fall which were then dried in an oven to determine nutrient content.
Fuel wood, timber and nipa shingles are the primary forest products that may be derived from thePagbilao mangrove reserve. In estimating the quantity of forest products, a sustainable cuttingregime is recommended based on sound silvicultural practices. The specified breakdown of forestproducts, particularly timber, takes into account the forest management regime which is eithersubsistence or commercial exploitation. In subsistence forestry the breakdown of forest productsfollows the requirements of the coastal communities which are mostly fuel wood, charcoal and poles(timber) for fences and posts. In commercial forestry, high value products to be produced areprimarily timber with incidental fuel wood from tree branches (Table A5). In subsistence forestryabout 262 m3 of wood products may be harvested compared to 272 m3 per year in commercialforestry.
Valuation for subsistence use is different from valuation for commercial use. Computations aredescribed in Table A6. In subsistence forestry, the use value of the forest products derived fromthe mangroves should be net of the gathering cost. When households are denied access tomangrove forest resources, the value attached to the forest products is equivalent to the cost theyincur in obtaining alternative products. Such cost is equal to the market price of the alternativeproduct plus the transport cost from the market to the point of use. Thus, the shadow price offorest products is the market price of the alternative product plus the transport cost less gatheringcosts. In a commercial forestry regime, it is assumed that the co-operative’s objective is tomaximise the value of net benefits to be derived from the forest. Net benefit is the stumpage value

CREED Working Paper Series No 9 13
which is equal to the market price of the good less the costs of transport, extraction and relatedcosts incurred in managing the forest. Thus, in forest product valuation, shadow prices werecomputed for non-traded products. For simplicity, the alternative product is the same regardless ofwhether it is used for subsistence or commercial purposes. For traded forest products such as nipa,actual market price is used which is then adjusted by transport and gathering costs.
For the five alternatives which permit harvesting of forest products, the highest value for suchproducts may be derived in commercial forestry at over 400,000 pesos/year followed bysubsistence forestry at about 350,000 pesos/year. On the other hand, the combination ofsubsistence forestry with intensive aquaculture yields only 187,000 pesos/year. In terms ofproduction value per unit area, ie, economic efficiency, commercial forestry is superior tosubsistence forestry.
Capture fisheries
A taxonomic identification of resident and transient fish species was conducted to assess fisheriesproductivity of the mangrove reserve. The fisheries component of this study (Ong and Padilla 1996)updated some information generated in more thorough studies in previous years (eg., de la Paz andAragones 1985; Pinto 1985 and 1988; Fortes 1984). The experimental forest supports both on-site (resident species) and off-site (transient species) fisheries. Only the top 6 resident and 6transient species groups are presented in the paper although about 45 species in 25 families wereidentified in the fisheries component of this study. The most abundant resident species are glassfishes and crabs while mullets and juvenile shrimps are the major transient species.
The estimation of a sustainable harvest of fishery resources presents difficulties as the fisheriessurveys for this study, as well as in previous studies, did not cover stock assessment. Simplifiedassumptions were made to arrive at some measure of abundance based on the number of eachspecies caught by the sampling gears. Moreover, the results of the survey of one creek were raisedto arrive at an estimate for the entire mangrove forest. Sustainable harvests are then estimated foreach species group using simple rule-of-thumb such as Gulland’s 50% exploitation rate, which setsfishing mortality equal to natural mortality.
Most fish are found in the mangrove reserve as juveniles, hence, the equivalent weight in terms ofadult fish is first estimated. It is computed by multiplying sustainable harvest by the percentagedeviation from market sizes of the fish found in the creek. This is assumed to account for lossesfrom natural mortality and predation as the fish grow to market size. The results show that theexperimental forest supports a small on-site fishery and contributes minimally to off-site fisheries(upper part of Table A7). The estimates of sustainable yields would be a very small fraction ofPagbilao Bay fisheries even in the absence of data on total catches for the entire Bay. For the othermanagement alternatives, fisheries productivity is linked primarily to nutrient production. The ratiobetween the quantity of nutrient production in each management alternative and in the preservationalternative is used to adjust fisheries production. Likewise, the impact of chemical discharges in theaquaculture alternatives are also factored in by assuming zero production of vertebrate species forboth residents and transients.

CREED Working Paper Series No 9 14
The valuation of market-size fish found in the forest uses market prices of adult fish observed duringthe field surveys. The following are the steps in the valuation. First is the computation of the in-situvalue of the fish which is the relevant figure in valuation. It is estimated that 87.75% of the landedprice of fish covers the costs of harvesting, the remainder is the value of the fish in-situ (NSCB1996). Next, the estimates of the value of fisheries production for the waterways are first convertedto the entire forest. It is assumed that the relevant production area is three times the area of thewaterways (Sukol Creek, Palsabangon and Nahalinhan Rivers) which comes to about 30.75 ha. This is used to multiply the gross value of the contribution to fisheries which are then divided by thetotal area of the mangrove forest (110.7 ha) to arrive at the average value of the production for theentire forest. The value figures in lower part Table A7 may be interpreted as conservative estimatesof the value of fisheries production. The preservation of the mangrove forest contributes about1,490 pesos per ha per year to capture fisheries in the area.
Aquaculture
The performance of aquaculture ponds converted from mangroves was also assessed as part of thisstudy (refer to Padilla and Tanael 1996a; 1996b). Due to the changing productivity of aquaculturein the Philippines, several studies are compared to assess the long-term prospects of aquacultureoperations in the mangrove reserve. The primary objective of the aquaculture studies is to identifythe appropriate (sustainable) aquaculture technology and the corresponding production levels. Thetype recommended for aquaculture technology - both semi-intensive and intensive - are described inSection 3.
Conversion of the mangrove forest into fishponds is an attractive alternative when equityconsiderations are not considered. Under controlled conditions in aquaculture systems higher fishproduction levels are achieved at over 6270 kg./ha/year in semi-intensive culture of milk fish or2530 kg./ha/year when rotating intensive prawn culture with extensive milk fish culture (Table A8). Albeit requiring high capital investments and operating expenses, the present value of net profitsfrom aquaculture ranges from 13.2 million pesos/year to 112.4 million pesos/year. Semi-intensiveculture of milk fish turned out to be superior to intensive prawn culture on several counts: a) therecommended technology for the latter -- crop rotation -- while more sustainable gives lowerprofits; b) low prices of prawn in the international market; and c) higher development costs forintensive ponds. Intensive prawn culture may become more profitable than semi-intensive milk fishif more sustainable prawn culture technology is developed and if prawn prices improve. Profitsfrom aquaculture are much higher compared to the value of forest products and capture fisheries. Asummary of all values estimated can be found in Table A9.

CREED Working Paper Series No 9 15
The Decision Problem
A decision problem is characterised by alternatives, effects, decision makers and their objectives. The effects table including the management alternatives for the Pagbilao mangrove forest is shown inTable 3. The management alternatives and technical studies conducted to quantify the effects werepresented in the previous sections. The effects on shore protection, biodiversity and eco-tourismlinked to the different alternatives could not be predicted within these technical studies. Experts inforestry, marine biology zoology were invited to provide judgement on the relative performance ofthe alternatives on these three effects (Carandang, Guarin, Ong 1996). To obtain expert judgementan assessment procedure was used that asked each expert to compare for each effect all pairs ofalternatives on a nine point scale (Janssen 1992). The results are included in Table 3. Note thatSubsistence Forestry performs best on eco-tourism. This alternative performs well because itpreserves not only the ecosystem but also the socio-economic structure linked to subsistenceforestry. The low score of Aqua-Silviculture for biodiversity may be the result of uncertaintiesassociated with this experimental type of aquaculture.
Each type of decision maker has his/her own objectives. Decision makers and their objectives arelisted in Table 4. The fish pond owner will be concerned with the profits generated; localgovernment protects local interests, through income to local government to provide local services, orincome to the local population; the social planner focuses on a national level, finding a balancebetween efficiency and equity objectives. In addition to efficiency and equity objectives, asustainable planner also aims to maintain a minimum level of environmental stocks. This can beexpressed as minimum levels of environmental quality but also as minimum sizes of certainecosystems. Finally, the sustainable world planner - institutionalised as the Global EnvironmentalFacility (GEF) - will try to maximise total environmental benefits from the mangrove forests to theworld as a whole. Because each type of decision maker has his own objectives, each decisionmaker will evaluate the information on the alternatives in a different way. In the last section, resultsfrom valuation and evaluation will be used to select the best alternative for each type of decisionmaker.

CREED Working Paper Series No 9 16
Table 3. Effects table of management alternatives for the Pagbilao Mangrove forestunit PR SF CF AS SA IA CF/IA SF/IA
forest ha 110.70 110.70 110.70 82.10 15.50 15.50 75.70 75.70fishponds ha 28.60 95.20 95.20 35.00 35.00
Fuel wood subsistence m3/year 184.40 99.40Fuel wood commercial m3/year 65.20 42.30 35.00Timber subsistence m3/year 46.40 25.10Timber commercial m3/year 206.70 134.10 110.80Charcoal subsistence m3/year 31.20 22.30Charcoal commercial m3/yearNipa subsistence 1000/year 45.00 22.50Nipa commercial 1000/year 45.00 22.50Soil accretion cm/year 1.00 0.34 0.42 0.22 0.10 0.05 0.13 0.15Milk fish production tons/year 179.32 596.90 65.69 24.15 24.15Prawn production tons/year 175.17 64.40 64.40Variable costs 1000 pesos -2748.00 -9148.00 -15000.00 -5460.00 -5460.00Capital costs 1000 pesos -1287.00 -4284.00 -4284.00 -1575.00 -1575.00Emissions tons/year -20.00 -40.00 -100.00 -50.00 -50.00On site fish 1000 pesos 163.05 158.63 158.63 122.58 8.14 8.14 40.00 40.00Off site fish 1000 pesos 1.94 1.88 1.88 1.46 0.09 0.09 0.28 0.28Shore protection index 1.00 0.37 0.15 0.15 0.13 0.07 0.15 0.15Biodiversity index 1.00 0.72 0.52 0.16 0.22 0.09 0.24 0.44Ecotourism index 0.80 1.00 0.38 0.18 0.14 0.08 0.21 0.30Alternatives: PR: Preservation, SF: Subsistence Forestry, CF: Commercial Forestry, AS: Aqua-Silviculture, IA: Intensive Aquaculture, CF/IA: combination of CommercialForestry and Intensive Aquaculture, SF/IA: Combination of Subsistence Forestry and Intensive Aquaculture

CREED Working Paper Series No 9 17
Table 4. Decision makers and their objectives• Fishpond owner
Maximise profit
• Local governmentMaximise net income to local government and/or to local population.
• Social planner (national government)Maximise total benefits to the Philippines (efficiency)ANDMore equal income distribution (equity)
• Sustainable planner (national government)Maximise total benefits (efficiency)ANDMore equal income distribution (equity)ANDMaintain minimum level of relevant environmental stocks.
• Sustainable world planner (UNEP/GEF)Maximise global environmental benefits from mangrove forests .
CREED Working Paper Series No 9 18
Valuation: a Benefit-Cost Approach
Valued effects
Using the prices derived in the technical studies, the effects table can be transformed to the valuedeffects table shown in Table 5. This table includes valued effects and effects that were not valuedfor reasons described below. Valued effects include effects representing direct and indirect usevalues, such as benefits to forestry and fisheries. Values shown are annual values for the entire area. Alternatives are assumed to be sustainable. This implies that the time horizon can be assumed tobe indefinite. The life time of existing fishponds supports this assumption. Development costs andother capital costs are valued according to the borrowing rate for capital in real terms. It is assumedthat, due to cyclones, once in every five years one of the two yearly fishpond harvests is lost entirely,and is therefore included as a 10 percent reduction of the annual harvest.
From the totals of the valued effects it is clear that the aquaculture alternatives perform better thanthe forestry alternatives and preservation. It is interesting to note that Semi-intensive Aquaculture(SA) performs better than Intensive Aquaculture (IA). This is due to high development costs linkedto intensive aquaculture and to the constraints set by the sustainable management of the ponds. Theperformance of both alternatives is very sensitive, however, to changes in prices of milk fish andprawns. Milk fish are produced for the local market and the price level is relatively stable. Theprice of prawns, however, is determined on the world market and fluctuates strongly. In this study aprice of 185 pesos/kg is used to value prawns. If this price increases above 214 pesos/kg the totalvalue of intensive aquaculture will be higher than the total value of semi-intensive aquaculture. Notealso the bad performance of aqua-silviculture (See also Padilla and Tanael 1996a 1996b).
Other effects
Effects of the alternatives on emissions, soil accretion, shore protection, eco-tourism and biodiversitywere not valued for the following reasons:
• No cost is attributed to emissions because with the production technique selected foraquaculture, emissions are not expected to create any water quality problems. Also there are nocurrent problems with water quality.
• Shore protection is not valued because this is provided under all alternatives, ie, by the
mangrove forest under preservation and forestry alternatives, or by the buffer zones in theaquaculture alternatives. The value is therefore not relevant to the decision.
• Soil accretion may result in the expansion of the forest to the sea. This could be valued
according to the total value of the mangrove forest. Since this is very uncertain and, due tocyclones, may even be non existent, no value is attributed.
Eco-tourism is, at present, non existent. Facilities offered in the past, such as walkways, have notresulted in a substantial influx of tourists. A considerable amount of both local and

CREED Working Paper Series No 9 19
Table 5. Annual values of management alternatives for the Pagbilao mangrove forest.unit PR SF CF AS SA IA CF/IA SF/IA
Valued effectsSubsistence forestry 1000 pesos 349.73 189.34Commercial forestry 1000 pesos 415.84 217.77 229.00Fishponds 1000 pesos 6724.20 22000.00 17000.00 6328.00 6328.00Fish on site 1000 pesos 163.05 158.63 158.63 122.58 8.14 8.14 40.00 40.00Fish off site 1000 pesos 1.94 1.88 1.88 1.46 0.09 0.09 0.28 0.28
Total value 1000 pesos 164.99 510.24 576.35 7066.01 22008.23 17008.23 6597.28 6557.62
Other effectsEmissions tons/year 20.00 40.00 100.00 50.00 50.00Soil accretion cm/year 1.00 0.34 0.42 0.22 0.10 0.05 0.13 0.15Biodiversity index 1.00 0.72 0.52 0.16 0.22 0.09 0.24 0.44Shore protection index 1.00 0.37 0.15 0.15 0.13 0.07 0.15 0.15Eco tourism index 0.80 1.00 0.38 0.18 0.14 0.08 0.21 0.30

CREED Working Paper Series No 9 20
Alternatives: PR: Preservation, SF: Subsistence Forestry, CF: Commercial Forestry, AS: Aqua-Silviculture, IA: Intensive Aquaculture, CF/IA: combinationof Commercial Forestry and Intensive Aquaculture, SF/IA: Combination of Subsistence Forestry and Intensive Aquaculture.
CREED Working Paper Series No 9 21
foreign visitors, however, visit the site for educational or research purposes. Since noalternatives exist on the island of Luzon, no easy accessible alternatives for this function exist. The value of the forest for research is also reflected by the nearby research station. For practicalreasons values attached to education and research are not included.
• If all effects listed above represent the direct and indirect use values of the ecosystem the value
of biodiversity can only be linked to non use values such as the existence , option or even theintrinsic value of the ecosystem. Due to the importance of mangrove ecosystems the value ofbiodiversity is expected to be high. Valuation, however, would involve a contingent valuationapproach, which raises the question about whose values should be included - local, national orworld populations. In addition, it is questionable whether intrinsic values linked to biodiversitycan be captured using valuation techniques, especially where the loss of an ecosystem isirreversible (see, for example, Dixon 1994).
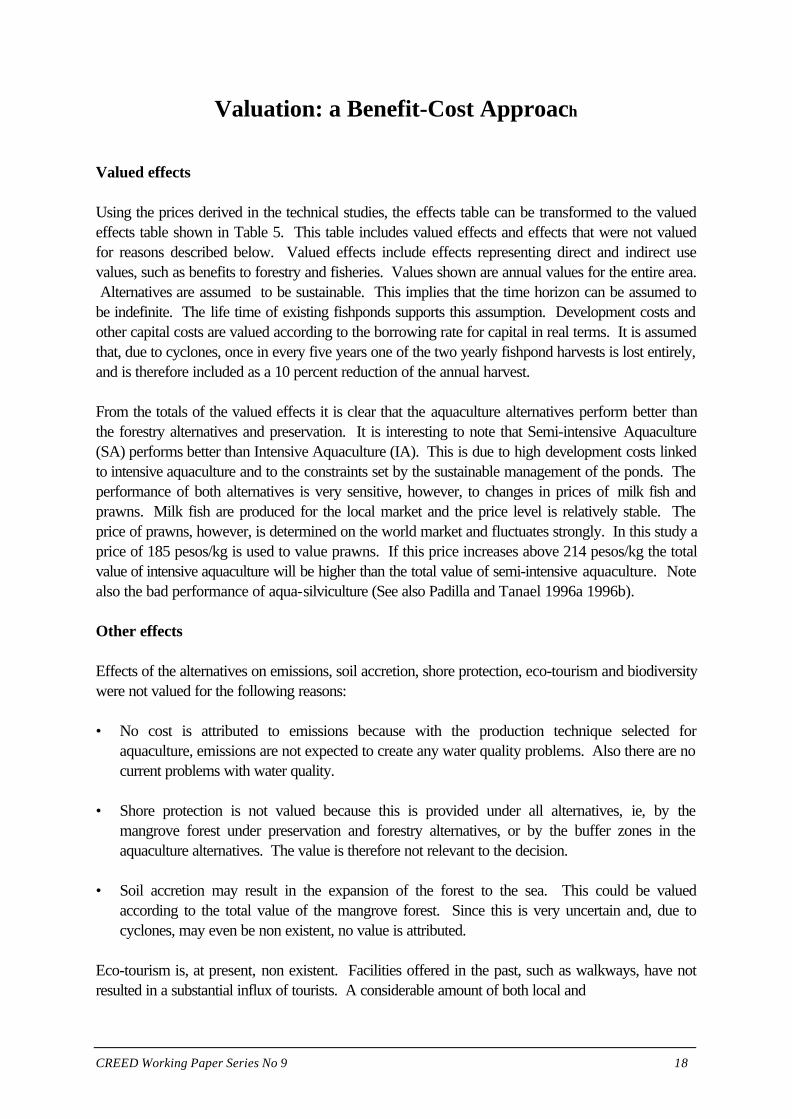
Comparison with other studies
A literature survey was conducted in order to compare results from the Pagbilao studies with othermangrove studies (Spaninks and Beukering, in prep). In Table 6 results from studies in Thailand,Fiji and Indonesia are compared with the Pagbilao study. The values for forestry and fisheries arecomparable for all studies with a relatively high value for forestry products and a relatively low valuefor fisheries products in Pagbilao. The value of aquaculture is listed as a negative value since thisvalue represents the foregone benefits of not converting the forest to fishponds and can therefore beconsidered as an opportunity cost of preservation. The value found by Ruitenbeek for biodiversity isbased on a contingent valuation approach. The value used by Lal for purification involvesconstruction of a sewage treatment plant. Since water pollution is not a problem in Pagbilao thisvalue can not be attributed to prevention of emissions in Pagbilao.
Table 6. A comparison of net annual benefits of mangrove products and functions.Thailand
Christensen(1982)
FijiLal
(1990)
IndonesiaRuitenbeek (1992)
Pagbilao
US$/ha. Pesos/ha.
US$/ha. Pesos/ha.
US$/ha. Pesos/ha.
US$/ha. Pesos/ha.
Forestry 30 750 6 150 67 1675 151 3775Fisheries 130 3250 100 2500 117 2925 60 1490Agriculture 165 4125 52 1300Aquaculture -2106 -52650 -7124 -178100Erosion 3 75Biodiversity 15 375Local uses 230 5750 33 825Purification 5820 145500
The cost of biodiversity

CREED Working Paper Series No 9 22
As indicated above it is very difficult or even impossible to value biodiversity. It is, however,possible to calculate the benefits lost if an alternative is selected that preserves biodiversity butresults in a total value lower than the maximum. In this study the value of aquaculture can beconsidered as an opportunity cost for alternatives that preserve the mangrove forest. Aquaculturegenerates 7,124 US$/ha compared to 211 US$/ha for the commercial forestry alternative. Thisleaves a deficit of 6,913 US$/ha. Under the rules of the Global Environmental Facility (GEF) thisdeficit can be considered to be the incremental costs to keep the forest. The issue is not how muchis this forest worth in terms of biodiversity, but how much should be paid to balance the foregonebenefits of a more profitable alternative without the forest. The deficit is substantial and far removedfrom the value of 15US$/ha as listed by Ruitenbeek. The values for erosion control and local asfound by Ruitenbeek do not bridge this gap. The value found by Lal for purification is not relevantas explained above.
CREED Working Paper Series No 9 23
Figure 4 here
CREED Working Paper Series No 9 24
Evaluation: a Multi Criteria Approach
The starting point of the multi criteria analysis is the valued effects table introduced in the previoussection (Table 5). A graphic presentation of this table is presented in Figure 5. In this presentationeach effect is standardised between 1 (the best alternative) and 0 (the worst alternative). Each rowrepresents an effect. For each effect the highest bar represents the best alternative. For emissions,as an example, Preservation (PR), Subsistence Forestry (SF) and Commercial Forestry (CF) arethe best alternatives. All three do not produce emissions and receive a score of 1. IntensiveAquaculture (IA) produces the most emissions and receives a score of 0. All other alternatives arescaled relatively to these two extremes. Figure 5 clearly shows the trade-off between revenues fromfishponds and all other criteria.
Figure 5 A graphic representation of the valued effects table
This graphic representation can be used to rank the alternatives according to policy priorities. Theeffect that is considered most important is moved to the top row, the second most important effectto the second row etc. In Figure 6 priority is given to environmental effects: biodiversity is moved tothe top row, followed by emissions etc.. By exchanging the columns the alternatives can be rankedvisually. Given the priorities assigned to the effects, Figure 6 shows that Preservation (PR) is the

CREED Working Paper Series No 9 25
best alternative because it is the best alternative for the four effects that are considered the mostimportant, second best for eco-tourism and best for fisheries. Looking at the lower end of theranking it can also be seen that Semi-intensive Aquaculture (SA) will always be preferred overIntensive Aquaculture (IA) because it performs worse for five of the included effects and equal onthe remaining five4.
Figure 6 A graphical ranking of the valued effects table
The previous section dealt with the economic efficiency objective. As was shown in Table 4,decision makers also consider equity and environmental objectives. In the previous section effectswere not differentiated according to income groups. Also effects on the environment were notincluded because these effects could not be valued. Therefore equity and environmental objectiveswere not included. Therefore the decision problem is now redefined into a multi objective decisionproblem with the following three objectives:
• Maximise efficiency: maximise monetary benefits over costs. 4 The ranking shown in Figure 5 was derived using the expected value method to transform the priority order ofeffects to quantitative weights and the weighted sum of weights x standardised effects to derive a performanceindex for the alternatives.

CREED Working Paper Series No 9 26
• Maximise equity: maximise income to local population.• Maximise environmental quality: maximise the balance of positive effects and negative effects to
the environmentIt is assumed that the country-city income distribution parallels the poor-rich income distribution. This is reflected in the ownership of existing fishponds. Equity is defined as the benefits that go tothe local poor. Environmental quality is linked to preservation of environmental functions (Gilbertand Janssen in prep). The performance of the alternatives on these three objectives is shown inTable 7. The first two objectives are measured in monetary terms: all effects are aggregatedaccording to their prices or shadow prices. Environment is defined as an index combining effects onsoil accretion, emissions, shore protection, biodiversity and eco-tourism. The relative weight ofbiodiversity within this index is ten times the relative weight of each of the other effects.
Table 7 Performance of the alternatives on three objectivesunit PR SF CF AS SA IA CF/IA SF/IA
Efficiency 1000 pesos/year 165 510 576 7065 22000 170006588 6558
Equity 1000 pesos/year 165 510 576 3418 8 8 260 230Environment index 12.8 9.0 6.2 -17.9 -37.4 -98.9 -47.1 -45.0
Three scatter diagrams are used to analyse the trade-offs and level of conflict between efficiency andequity (Figure 7), efficiency and environment (Figure 8) and equity and environment and equity(Figure 9). Figure 7 shows the performance of the alternatives on the objectives efficiency andequity. The horizontal axis represents the performance on efficiency and the vertical axis theperformance on equity. Scores are standardised between 0 (the worst alternative) and 100 (thebest alternative). Therefore the most efficient alternative, Semi-intensive Aquaculture (SA), can befound on the far right of the diagram and the most equitable alternative, Commercial Forestry (CF)can be found at the top of the diagram. The ideal alternative for these two objectives wouldcombine optimal performance on efficiency with optimal performance on equity. This idealalternative would have a score of 100, 100 and would be found in the upper right corner of thediagram. It is clear from Figure 7 that in this case this ideal alternative does not exist. Alsocompromise alternatives, combining good or moderate performance on both objectives, do notexist. The level of conflict between both objectives is also reflected by the correlation coefficient. Avalue close to one indicates minimal conflict, a value close to minus one indicates extreme conflict. The value of -0.79 indicates high conflict between efficiency and equity. Addition or removal ofalternatives may influence the relative position of the remaining alternatives and will also influence thecorrelation coefficient. It is therefore important that only alternatives that are relevant to the decisionare included in the evaluation
The line shown in this diagram can be used to rank the alternatives visually. In this diagram equalweight is given to efficiency and equity. This is reflected in the angle of the line. All points on this line

CREED Working Paper Series No 9 27
have the same distance from the ideal alternative5. The alternatives can now be ranked by movingthis line from top right to bottom left. The first to cross the line and therefore the best alternative isCommercial Forestry (CF) almost immediately followed at the other extreme of the diagram bySemi-intensive Aquaculture (SA). A change in relative weight of the two objectives is reflected by achange in angle of the line. The ranking shown in Figure 7 is extremely sensitive to variations in therelative weights of efficiency and equity.
Figure 7. Trade-off between efficiency and equity
0 Efficiency 1000
100
Equ
ity
ρ = -0.79 wx = 0.50
PR
SF
CF
AS
SA
CF/IA
IA
SF/IA
1 CF2 SA3 SF AS5 IA6 CF/IA7 SF/IA8 PR
Figure 8. Trade-off between efficiency and environment
5 Distance is defined here as the sum of the distance along the x axis and the distance along the y axis. Since theline intersects the x axis and the y axis at the same distance form the ideal alternative, all points on the line sharethe same distance to the ideal point.

CREED Working Paper Series No 9 28
100E
nvir
onm
ent
0 Efficiency 1000
ρ = -0.74 wx = 0.50PRSFCF
AS
SA
CF/IA
IA
SF/IA
1 SA2 AS3 PR4 SF5 CF6 SF/IA7 IA CF/IA
The trade-off between efficiency and environment is shown in Figure 8. Conflict is less thanbetween efficiency and equity, but still fairly high at -0.74. Semi-intensive Aquaculture (SA) nowranks as the best alternative. If the relative weight of environment is substantially increased,Preservation (PR) will move to the first position. The most interesting of the three diagrams is shownin Figure 9. In this diagram the trade-off between equity and environment is shown. The correlationcoefficient of 0.68 indicates minimal conflict. Two alternatives can be found near the idealalternative with Commercial Forestry (CF) as the best alternative. Note also the extreme badperformance of Intensive Aquaculture (IA) at the lower left corner of the diagram. The rankingshown to the right of the diagram is fairly insensitive to changes in the relative weights of bothobjectives.
Figure 9. Trade-off between equity and environment

CREED Working Paper Series No 9 29
0 Equity 1000
100E
nvir
onm
ent
ρ = 0.68 wx = 0.50PR SF
CF
AS
SA
CF/IA
IA
SF/IA
1 CF2 SF3 AS4 PR5 CF/IA6 SF/IA7 SA8 IA
In Figures 7,8 and 9 the trade-offs between pairs of objectives were analysed. As a last evaluationstep the ranking according to all three objectives simultaneously is shown in Figures 10, 11 and 12. In Figure 10 all three objectives are considered equally important. This results in CommercialForestry (CF) as the most preferred alternative6. In Figure 11 efficiency is the most importantobjective followed by equity. In Figure 11 environment is the least important objective. This resultsin Semi-intensive Aquaculture (SA) as the most preferred alternative. In Figure 12 priority is givento environment followed by equity and efficiency. In this case Commercial Forestry (CF) ranks asthe best alternative. Note that Preservation (PR) never ranks within the two most preferredalternatives.
Figure 10. Efficiency, equity and environment are equally important.
6 The ranking shown in Figure 5 was derived using the expected value method to transform the priority order ofeffects to quantitative weights and the weighted sum of weights x standardised effects to derive a performanceindex for the alternatives

CREED Working Paper Series No 9 30
Figure 11. Efficiency is more important than equity; equity is more important than environment
Figure 12. Environment is more important than equity, equity is more important than efficiency.
The trade-off between efficiency and equity could be accommodated by policies that reallocateincome from the distant fish pond owners to the local community or by policies that would channelgovernment revenues from the auction of fishpond lease agreements to the local poor. It could alsobe accommodated by new types of ownership arrangements of the fishponds. In practice, attemptsto achieve a more equitable distribution of income from fishponds have failed for political and legalreasons. Change in ownership arrangements has also failed because of limited access to capital bythe local poor.

CREED Working Paper Series No 9 31
Conclusions and Recommendations
This study evaluated the conversion of the 110.7-hectare strip of protected mangrove forest inPagbilao, Philippines, into aquaculture, forestry and combined uses. Two points are emphasised inthe specification of alternative uses of the mangrove forest. The first is that the overridingconsideration is sustainability. For instance, the recommended harvesting rates in forestry optionsare based on sound silvicultural practice. Likewise, the specified aquaculture technology is based onthe recommendations of studies on Philippine milk fish and prawn farming. The second point iscommunity-based management of forest and fishery resources which is now the natural resourcestrategy in the Philippines.
The previous sections have shown that if efficiency is maximised, semi-intensive aquaculture is thepreferred alternative; if equity and environment are also considered important policy objectivescommercial forestry is the best alternative. Policy objectives differ according to the role of thedecision maker involved. Table 8 lists the preferred alternatives according to type of decision makerand their objectives. A short explanation of the position of each decision maker is included below.

CREED Working Paper Series No 9 32
Table 8 Decision makers, their objectives and their preferred alternatives.• Fishpond owner
Maximise profit=> Conversion to semi-intensive aquaculture
• Local governmentMaximise net income to local government and to the local population from the forest=> Increase the licence fees for fishponds and convert to fish pondsOR=> Forestry and fisheries
• Social plannerMaximise total benefits to the Philippines (efficiency)ANDMore equal income distribution (equity)=> Conversion to fishponds if efficiency is emphasised.OR=> Forestry and fisheries if equity is emphasised.
• Sustainable plannerMaximise total benefits (equity)ANDMore equal income distribution (equity)ANDMaintain minimum level of relevant environmental stocks.=> Preservation to maintain a minimum level of mangrove ecosystems. (minimum stock of habitat, biological and genetic diversity)
• Sustainable world planner (UNEP/GEF)Maximise global environmental benefits from mangrove forests=> Pay a maximum of US$ 614748 per year to the PhilippinesOR=> Accept the loss of the Pagbilao forest
• Under the assumption of sustainable management the individual fish pond owner will prefersemi-intensive aquaculture since this alternative generates the largest profits. This preference canalso be observed at existing fish ponds in the Pagbilao region. Many of the existing fish pondsdate from the 1950s which suggests that the management of these ponds is sustainable.
• If local government finds a way to increase the licence fees linked to the various activities to a
level that equals the producer’s surplus, conversion to fish ponds would generate the highestrevenues. If these revenues are ploughed back into the community this would also generate thelargest improvement to equity. However, recent attempts to substantially increase the licencefees have failed due to political resistance. Therefore, in the current situation commercialforestry should be the choice of local government.

CREED Working Paper Series No 9 33
• A social planner should take both efficiency and equity objectives into consideration. In theabsence of mechanisms to transfer income from fishponds to the local poor the choice of thesocial planner is dependent on the priority given to both objectives.
• In addition to a social planner, a sustainable planner will try to maintain a minimal level of
mangroves. It can be argued that on a world and national scale this minimum level is alreadyreached; certainly for the island of Luzon this is the case. The preservation of the forest despitethe potential revenues from fish ponds, suggests that the Philippine government operates as asustainable planner in this case
• If it is accepted that preservation of the mangrove forest is primarily in the interest of the world
community, it is not reasonable to make the Philippines pay the price of preservation. Under thisassumption, the sustainable world planner, institutionalised in the Global Environmental Facility,should be prepared to pay the incremental costs of 614748 US$/ year if he considerspreservation of the forest worthwhile.
For this study much effort has been invested in data collection and modelling. However, results haveto be used with care. This holds particularly for the results linked to off-site fisheries. It proved tobe very difficult to establish a clear link between the size of the mangrove forest and the value of offsite fisheries. A production function approach proved to be unfeasible. Given these limitations thefollowing can be concluded:
• For the Pagbilao mangrove forest, aquaculture is the policy alternative with the highest economicvalue. If equity and environmental considerations are included subsistence forestry is thepreferred alternative.
• Environmental services, such as biodiversity, shore protection and flood mitigation, need to be
priced very highly to make preservation the alternative with the highest value.
This study used a combination of cost-benefit analysis and multi criteria analysis. Althoughbiodiversity is considered crucial to the decision to preserve the forest, it proved impossible to put amonetary value on changes in biodiversity. This raises the question of the limitations of valuation -whether it is possible to value irreversible effects such as the loss of life, the loss of ecosystems, theloss of species, the loss of works of arts etc.
Another crucial issue in the case of Pagbilao is the distribution of wealth. The income from the fishponds goes to distant investors. Also the conversion to fish ponds creates areas that cannot beaccessed by the local population. The equity issue cannot be addressed adequately using cost-benefit analysis. Multi criteria analysis was used to supplement cost-benefit analysis, and proved tobe useful for including equity and environmental objectives. From a methodological point of viewthe following can be concluded:
• It is questionable whether it is possible to value non use values linked to irreversible effects suchas loss of biodiversity.

CREED Working Paper Series No 9 34
• It is recommended to use a combination of cost-benefit analysis and multi criteria analysis ifeffects on biodiversity or other important irreversible effects are important to the decision or ifmajor changes in income distribution are expected.
Additional research is required including the following topics:
• the ecological linkages both within mangrove ecosystems and between mangrove and othercoastal ecosystems is essential.
• an assessment of production functions between mangroves and mangrove related products, such
as fisheries, can be seen as an extension of these efforts. It is questionable, however, whether anassessment of production is feasible in applications such as Pagbilao.
• approaches for valuing environmental values such as biodiversity is necessary. This should
include an appraisal of the appropriateness of valuation to support decisions including this typeof environmental values.
• The conflict between efficiency and equity could be reduced by changes in ownership
arrangements or adequate mechanisms to transfer costs and benefits between income groups. Research on the potential and limitations of existing transfer mechanisms and research on thedevelopment of new mechanisms is therefore important.

CREED Working Paper Series No 9 35
References
Barbier, E., Adams, W. and Kimmage, K. 1991 Economic Valuation of Wetland Benefits: theHadejia-Jama'are Floodplain, Nigeria. LEEC Paper DP 91-02. London EnvironmentalEconomics Centre: London.
Bina, R. 1988. Updating Mangrove Forest Area Statistics in the Philippines. Paper presentedat the NATMANCOM Symposium-Workshop on Mangrove Research, Environment, Policy andInformation, 28-30 November, Quezon City.
Brown, W.H. and Fischer, A.F. 1920. “Philippine Mangrove Swamps.” In: W.H. Brown (ed)Minor Products of Philippine Forests. Vol 1: 9-125. Bureau of Printing: Manila:
Carandang, A. 1996. Personal communication.
Carandang, A. and Padilla, J.E. 1996. Assessment of Forest Resources of the PagbilaoMangrove Forest. Report from the CREED project, Valuation and Evaluation of Mangrove-Fishponds Interaction: the Case of the Philippines. Resources, Environment and EconomicsConsultants, Inc., Philippines and the Institute for Environmental Studies, Free University, TheNetherlands.
Christensen, B. 1982. Management and Utilization of Mangroves in Asia and the Pacific.FAO Environment Paper No. 3. Food and Agricultural Organisation: Rome.
Constanza, R., Farber, S. and Maxwell, J. 1989. “Valuation and Management of WetlandEcosystems.” Ecological Economics 1:335-361.
De la Paz, R. and Aragones, N. 1985. “Mangrove Fishes of Pagbilao (Quezon Province, LuzonIsland), With Notes on their Abundance and Seasonality.” Nat. Appl. Sci. Bull. 37(2): 171-190.
Dixon, J.A. and Lal, P.N. 1994. The Management of Coastal Wetlands: Economic Analysis ofCombined Ecological-Economic Systems. From Partha Dasgupta and Karl-Goran Maler (eds). Environment and Emerging Development Issues. Clarendon Press: Oxford.
Fortes, M.D. 1994. Mangrove Resource Valuation Project: Marine Ecology Component Final Report. Philippine Institute for Development Studies: Makati City, Philippines.
Freeman, M. 1991. “Valuing the Environment under Alternative Management Regimes.”Ecological Economics 3(3): 247-256.
Gammage, S. 1994. Estimating the Total Economic Value of a Mangrove Ecosystem in ElSalvador. Report to the UK Overseas Development Administration. ODA: London.
Guarin, F.Y. 1996. Personal communication.

CREED Working Paper Series No 9 36
Gilbert, A.J. and Janssen, R. (forthcoming) The Use of Environmental Functions to EvaluateManagement Strategies for the Pagbilao Mangrove Forest. CREED Working Paper Series. IIED: London.
Hirsch, D. and Mauser, A. 1992. The Economic Value of Mangroves. Two Case Sudies: MidaCreek and Funzi Bay. Report from a Twinning Project between the School of EnvironmentalStudies, Eldoret, and the University of Amsterdam.
Hodgson, G. and Dixon, J.A. 1988. Logging Versus Tourism in Palawan: an Environmentaland Economic Analysis. East-West Environment and Policy Institute: Honolulu.
Janssen, R. 1992. Multi-objective Decision Support for Environmental Management. KluwerAcademic Publishers: Dordrecht.
Janssen, R. and van Herwijnen, M. 1994. DEFINITE A system to Support Decisions on a FiniteSet of Alternatives (Software package and user manual). Kluwer Academic Publishers: Dordrecht.
Lal, P.N. 1990. Conservation or Conversion of Mangroves in Fiji. Occasional Paper No. 11. East-West Environment and Policy Institute: Honolulu.
Larsson, J., Folke, C. and Kautsky, N. 1993. Ecological Limitations and Appropriation ofEcosystem Support by Shrimp Farming in Columbia. Beijer Discussion Paper Series, No.29. Beijer Institute: Stockholm.
National Mangrove Committee. 1982. Initial Findings: an Assessment of Mangrove Areas asSpawning Grounds for Fishes and Crustaceans. Bakawan 2(2):3.
NSCB. 1996. A Case Study on Natural Resource Accounting: Philippine Marine FisheryResources. National Statistical Coordination Board: Philippines.
Ong, P. 1996. Personal communication.
Ong, P. and Padilla, J.E. 1996. Assessment of Fisheries-Related Functions of the PagbilaoMangrove Forest. Report from the project, Valuation and Evaluation of Mangrove-FishpondsInteraction: the Case of the Philippines. Resources, Environment and Economics Consultants, Inc.,Philippines and the Institute for Environmental Studies, Free University, The Netherlands,
Opschoor, J.B. 1986. A Review of Monetary Estimates of Benefits of EnvironmentalImprovements in the Netherlands. Paper prepared for the OECD Workshop on the Benefits ofEnvironmental Policy and Decision making, Avignon.
Opschoor, J.B. 1987. Duurzaamheid en verandering. Inaugurele rede, Vrije Universiteit,Amsterdam.
Padilla, J.E. and Tanael, M. 1996a. Assessment of Milkfish and Prawn Culture in BrackishWaterponds: abridged version. Report from the project, Valuation and Evaluation of Mangrove-

CREED Working Paper Series No 9 37
Fishponds Interaction: the Case of the Philippines. Resources, Environment and EconomicsConsultants, Inc., Philippines and the Institute for Environmental Studies, Free University, TheNetherlands.
Padilla, J.E. and Tanael, M. 1996b. Evaluation of Integrated Aquaculture and Silviculture. Report from the project, Valuation and Evaluation of Mangrove-Fishponds Interaction: the Case ofthe Philippines. Resources, Environment and Economics Consultants, Inc., Philippines and theInstitute for Environmental Studies, Free University, The Netherlands
Parks, P. and Bonifaz, M. 1994 “Non-sustainable Use of Renewable Resources: MangroveDeforestation and Mariculture in Ecuador”. Marine Resource Economics 9:1-18.
Pinto, L. 1985. Community Structure and Population Dynamics of Mangrove Fishes ofPagbilao, Quezon, Philippines. Ph.D. thesis, University of the Philippines: Diliman, Quezon City.
Pinto, L. 1988. Population Dynamics and Community Structure of Fish in the Mangroves ofPagbilao, Philippines. Journal of Fish Biol. 33 (Supplement A): 35-43.
Ruitenbeek, H.J. 1992. Mangrove Management: an Economic Analysis of ManagementOptions with a Focus on Bintuni Bay, Irian Jaya. Environmental Management Development inIndonesia Project (EMDI) Environmental Reports, 8. Jakarta and Halifax, Indonesia.
Spaninks F. and van Beukering, P. (forthcoming). Economic Valuation of Mangroves: aReview of Techniques and Case Studies with Special Attention to the Production FunctionApproach. CREED Working Paper Series. IIED: London.
Zamora, P.M. 1990 Ecosystems of the Philippines. Proceedings of Symposium on MangroveManagement.
Zamora, P.M. 1989. “Philippine Mangroves: their Depletion, Conversion and DecreasingProductivity.” Wallaceana 58:1-5.
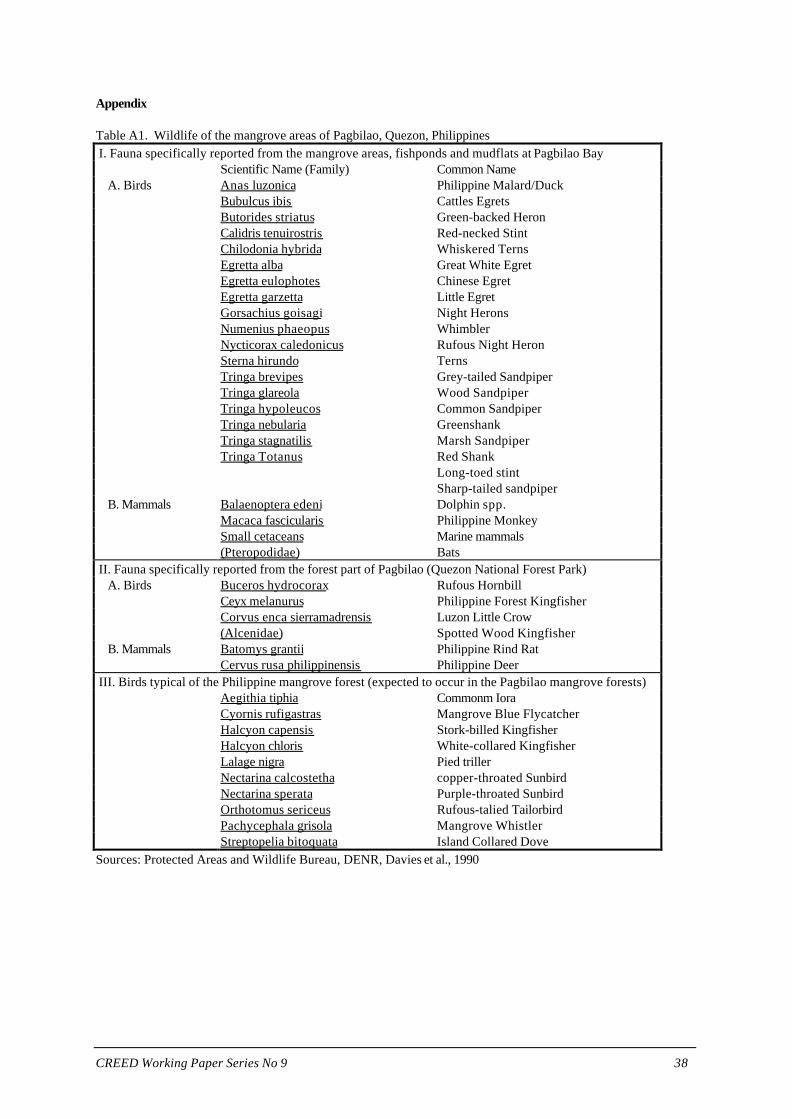
CREED Working Paper Series No 9 38
Appendix
Table A1. Wildlife of the mangrove areas of Pagbilao, Quezon, Philippines I. Fauna specifically reported from the mangrove areas, fishponds and mudflats at Pagbilao Bay
Scientific Name (Family) Common Name A. Birds Anas luzonica Philippine Malard/Duck
Bubulcus ibis Cattles EgretsButorides striatus Green-backed HeronCalidris tenuirostris Red-necked StintChilodonia hybrida Whiskered TernsEgretta alba Great White EgretEgretta eulophotes Chinese EgretEgretta garzetta Little EgretGorsachius goisagi Night HeronsNumenius phaeopus WhimblerNycticorax caledonicus Rufous Night HeronSterna hirundo TernsTringa brevipes Grey-tailed SandpiperTringa glareola Wood SandpiperTringa hypoleucos Common SandpiperTringa nebularia GreenshankTringa stagnatilis Marsh SandpiperTringa Totanus Red Shank
Long-toed stintSharp-tailed sandpiper
B. Mammals Balaenoptera edeni Dolphin spp.Macaca fascicularis Philippine MonkeySmall cetaceans Marine mammals(Pteropodidae) Bats
II. Fauna specifically reported from the forest part of Pagbilao (Quezon National Forest Park) A. Birds Buceros hydrocorax Rufous Hornbill
Ceyx melanurus Philippine Forest KingfisherCorvus enca sierramadrensis Luzon Little Crow(Alcenidae) Spotted Wood Kingfisher
B. Mammals Batomys grantii Philippine Rind RatCervus rusa philippinensis Philippine Deer
III. Birds typical of the Philippine mangrove forest (expected to occur in the Pagbilao mangrove forests)Aegithia tiphia Commonm IoraCyornis rufigastras Mangrove Blue FlycatcherHalcyon capensis Stork-billed KingfisherHalcyon chloris White-collared KingfisherLalage nigra Pied trillerNectarina calcostetha copper-throated SunbirdNectarina sperata Purple-throated SunbirdOrthotomus sericeus Rufous-talied TailorbirdPachycephala grisola Mangrove WhistlerStreptopelia bitoquata Island Collared Dove
Sources: Protected Areas and Wildlife Bureau, DENR, Davies et al., 1990

CREED Working Paper Series No 9 39
Table A2 Major Plant Species of the Pagbilao Mangrove Reserve, By Zone
A. Seaward Portions Nipa (Nypa fruticans) Bakauan lalaki (Rhizophora apiculata Bl.) Bakauan babae (R. mucronata Lamk) Api-api (Avicennia officinalis L.) Pagatpat (Sonneratia alba J. Smith)
B. Middleward Tangal (Ceriops tagal (Perr.) C.B. Robins Pototan (Brugiera sexangula (Lour.) Poir) Api-api (Avicennia officinalis L.) Buta-buta (Excoecaria agallocha L.) Saging-saging (Aegiceras corniculatum (L.) Blco.) Tinduk-tindukan (A. floridum Roem. & Schult.) Piagau (Xylocarpus moluccensis (Lamk.) Roem.) Gapas-gapas (Camptostemon philippinense (Vid.) Becc.) Pototan lalaki (Bruguiera cylindrica (L.) Bl.) Malatangal (Ceriops decandra (Griff) Ding Hou) Tabau (Lumnitzera littorea (Jack.) Voigt.) Taualis (Osbornia octodonta F. Mueller) C. Landward Api-api (A. officinalis L.) Pi-api (A. marina (Forsk.)Vierh. var rumphiana(Hallier) Bakh.) Dungon-late (Herritiera littoralis Dryand. ex. W. ait.) Lagolo (Acrostichum aureum) Buta-buta (Excoecaria agallocha L.) Acanthus sp.
D. Riverines Lagolo (A. aureum) Nipa (N. fruticans) Pagatpat (Sonneratia alba J. Smith) Pedada (S. caseolaris (L.) Engl.) Busain (Bruguiera gymnorhiza (L.) Lamk.) Bakauan lalaki (R. apiculata Bl.) Bakauan babae (R. mucronata Lamk) Api-api (A. officinalis L.) Pi-api (A. marina(Forsk.)Vierh. var rumphiana (Hallier)Bakh.) Bungalon (A. marina (Forsk.) Vierh) Nilad (S. hydrophyllaceae Gaertn.) Tabigi (Xylocarpus granatum Koen.)

CREED Working Paper Series No 9 40
Table A3. Taxonomic identification of fish species found in the Pagbilao mangrove reserve
NMC de la Paz Pinto FortesSpecies Family 1982 Aragones (1985, 1994
1985 1988)
Total species 26 110 128 37Total genera 25 73 82Total families 21 47 54 26Total orders 6 13
Chanos chanos Chanidae x x x xEpinephelus malabaricus Serranidae x x xEpinephelus suillus Serranidae ? xEpinephelus sexfasciatus SerranidaeEpinephelus quoyanus SerranidaeLutjanus johni Lutjanidae x xLutjanus argentimaculatus Lutjanidae x x xLutjanus russelli Lutjanidae x xLutjanus fulviflamma Lutjanidae ? ?Siganus guttatus Siganidae x x x xSiganus javus Siganidae x x xSiganus fuscescens Siganidae x ? x xScatophagus argus Scatophagidae ? x x xValamugil cunnesius Mugilidae ? ? ?Lisa tade Mugilidae ? ? xLeiognathus equulus Leiognathidae x x ?Leiognathus splendens Leiognathidae x xLeiognathus brevirostris Leiognathidae x x xGazza minuta Leiognathidae x xCynoglossus abbreviatus Cynoglossidae ? ?Pseudeorhombus arsius Bothidae x xApogon amboinensis Apogonidae x ? ? xGerres filamentosus Gerreidae x x ? xSillago sihama Sillaginidae x x x xSillago aeolus Sillaginidae ? ?Lethrinus miniatus Lethrinidae ? ? ?Scolopsis taeniopterus NemipteridaeScolopsis affinis NemipteridaeNemipterus nematophorus Nemipteridae xUpeneus tragula Mullidae x x xUpeneus sulphureus Mullidae x x xSphyraena forsteri Sphyraenidae ? ? xStrongylura incisa Belonidae ? ?Tylosurus indicus Belonidae ? ? ?Scomberiodes tol Carangidae x x ?Alepes melanoptera Carangidae x
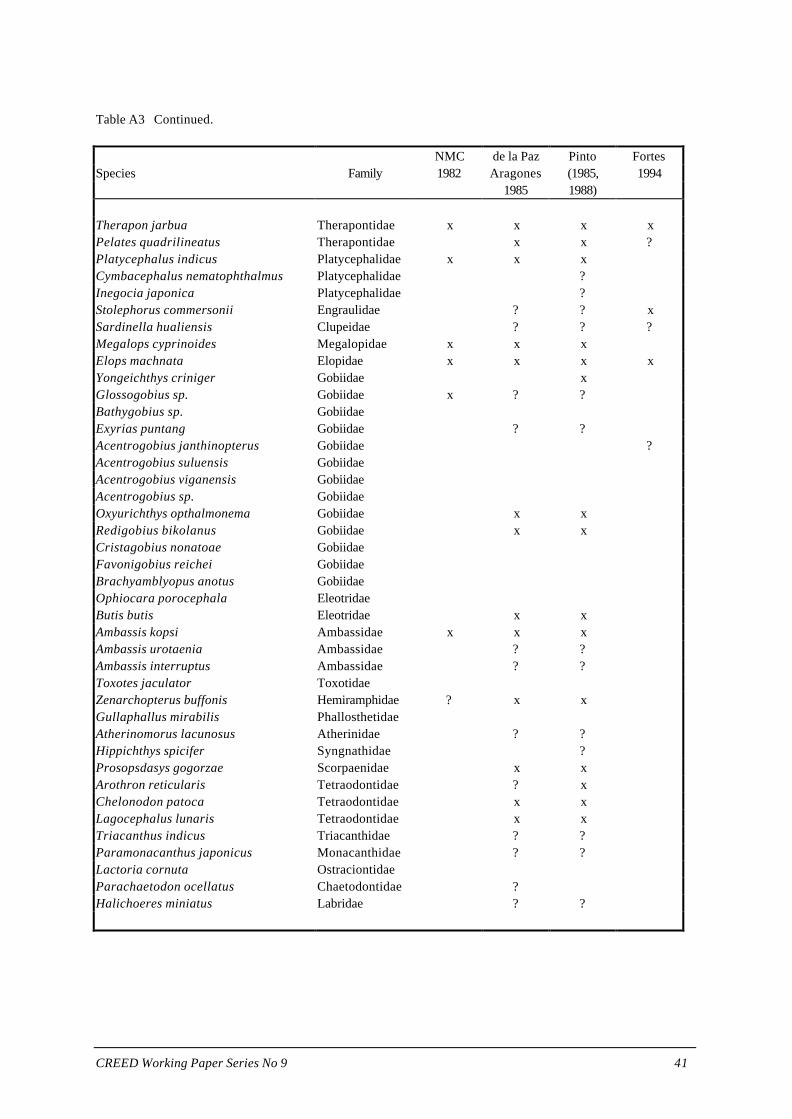
CREED Working Paper Series No 9 41
Table A3 Continued.
NMC de la Paz Pinto FortesSpecies Family 1982 Aragones (1985, 1994
1985 1988)
Therapon jarbua Therapontidae x x x xPelates quadrilineatus Therapontidae x x ?Platycephalus indicus Platycephalidae x x xCymbacephalus nematophthalmus Platycephalidae ?Inegocia japonica Platycephalidae ?Stolephorus commersonii Engraulidae ? ? xSardinella hualiensis Clupeidae ? ? ?Megalops cyprinoides Megalopidae x x xElops machnata Elopidae x x x xYongeichthys criniger Gobiidae xGlossogobius sp. Gobiidae x ? ?Bathygobius sp. GobiidaeExyrias puntang Gobiidae ? ?Acentrogobius janthinopterus Gobiidae ?Acentrogobius suluensis GobiidaeAcentrogobius viganensis GobiidaeAcentrogobius sp. GobiidaeOxyurichthys opthalmonema Gobiidae x xRedigobius bikolanus Gobiidae x xCristagobius nonatoae GobiidaeFavonigobius reichei GobiidaeBrachyamblyopus anotus GobiidaeOphiocara porocephala EleotridaeButis butis Eleotridae x xAmbassis kopsi Ambassidae x x xAmbassis urotaenia Ambassidae ? ?Ambassis interruptus Ambassidae ? ?Toxotes jaculator ToxotidaeZenarchopterus buffonis Hemiramphidae ? x xGullaphallus mirabilis PhallosthetidaeAtherinomorus lacunosus Atherinidae ? ?Hippichthys spicifer Syngnathidae ?Prosopsdasys gogorzae Scorpaenidae x xArothron reticularis Tetraodontidae ? xChelonodon patoca Tetraodontidae x xLagocephalus lunaris Tetraodontidae x xTriacanthus indicus Triacanthidae ? ?Paramonacanthus japonicus Monacanthidae ? ?Lactoria cornuta OstraciontidaeParachaetodon ocellatus Chaetodontidae ?Halichoeres miniatus Labridae ? ?

CREED Working Paper Series No 9 42
Table A4. Habits and other characteristics of selected fish species found in the Pagbilao mangrove reserve
Species Habitat Habit Social Trophic Food ItemsGroupings Level
Chanos chanos E S, B Pg, Gr H algae, invertebratesEpinephelus malabaricus M BP So C fishes, crustaceansLutjanus spp. M BP So, Pg C shrimps, fishSiganus spp. M BP Pg H algae, diatomsLiza tade, Valamugil cunnesius E BP So H algae, diatoms, plant
detritusLeiognathus spp.,Gazza sp. M BP Gr C copepods, polychaetes,
plant detritusApogon amboinensis M BP Gr, Pg C shrimps, fish, plant detritusGobiidae R, E B So, Pg C amphipods, isopods,
nematode, plant detritus
Ambassis spp. E BP Gr C zooplankton. shrimp, plant detritus
Cynoglossus abbreviatus M B So,Pg C crustaceans,forams,diatoms, plant detritus
Pseudorhombus arsius M B So C crustaceans, fishesGerres filamentosus M B Pg C invertebrates, plant
detritusSillago sihama M,E BP Pg C annelids, crustaceansStolephorus commersonii M S Gr C copepods, other
crustaceans, plant detritus
Megalops cyprinoides E,M P So,Pg C small fishesElops machnata M P So C amphipods, isopods,
nematodes, plantdetritus
Source: Pinto (1985) Legend: E= estuarine, M= marine, R= riverine; B= benthic, P= pelagic, BP= benthopelagic, S=surface; So= Solitary, Pg= pair, Gr= gregarious; H= herbivorous, C= carnivorous

CREED Working Paper Series No 9 43
Table A5. Estimates of sustainable production of forest products for various managementalternatives Forest Product Management alternatives
PR SF CF AS SA IA CF/IA SF/IA
I. Potentially Marketable A. Fuel wood (m3/year) 0 184 65 42 0 0 35 99 1. Subsistence 0 184.4 0 0 0 0 0 99.4 2. Commercial 0 0 65.2 42.3 0 0 35.0 0.0
B. Timber (m3/year) 0 46 207 134 0 0 111 25 1. Subsistence 0 46.4 0 0 0 0 0 25.1 2. Commercial 0 0 206.7 134.1 0 0 110.8 0
C. Charcoal (m3/year) 0 31 0 0 0 0 0 22 1. Subsistence 0 31.2 0 0 0 0 0 22.3 2. Commercial 0 0 0 0 0 0 0 0
Sub-Total (Timber) 0 262 272 176 0 0 146 147
D. Nipa shingle (1000/year) 0 45.0 45.0 0 0 0 22.5 22.5
II. Ecological contribution Nutrient prod. (1000kg./year) Nitrogen 70.1 28.6 28.6 22.1 4.2 4.2 20.4 20.4 Phosphorus 23.7 23.0 23.0 17.8 3.4 3.4 16.4 16.4 Potassium 5.7 5.6 5.6 4.3 0.8 0.8 4.0 4.0
Alternatives: PR: Preservation, SF: Subsistence Forestry, CF: Commercial Forestry, AS: Aqua-Silviculture, IA:Intensive Aquaculture, CF/IA: combination of Commercial Forestry and Intensive Aquaculture, SF/IA:Combination of Subsistence Forestry and Intensive Aquaculture.
Notes• Charcoal is zero in commercial forestry as production is not in commercial quantity.
Source: Carandang and Padilla. 1996. Assessment of forest resources of the Pagbilao mangrove Forest.Resources, Environment and Economics Center for Studies, Philippines, and Institute for Environmental Studies, Free University, The Netherlands.

CREED Working Paper Series No 9 44
Table A6. Valuation of Forest ProductsSubsistence Commercial Unit
Forestry Forestry (pesos)A. Nipa Shingles Market price per shingle 2.9 2.9 per piece Transport cost 0.2 0.2 Gathering costs 0.9 0.9 Shadow price 2.2 1.8
B. Timber Products i) Timber alternative: coconut lumber Market price (4.50 pesos/bd.ft) 1,907 1,907 per m3
Transport cost 40 40 Gathering costs 303 303 Shadow price 1,644 1,564
ii) Fuel wood alternative: upland fuel wood Market price (5 pesos/bundle of 0.010 m3 ) 500 500 per m3
Transport cost 310 310 Gathering cost 0 0 Shadow price 810 190
iii) Charcoal: Valuation is similar to fuel wood 810 190 per m3
Source: Carandang and Padilla. 1996. Assessment of forest resource of the Pagbilao mangrove forest.Resources, Environment and Economics Center for Studies, Philippines, and Institute forEnvironmental Studies, Free University, The Netherlands.
Notes:• Gathering of nipa shingles. One person can fill up one boat-load of nipa shingles over 3 hours of work. One
boat-load is equivalent to about 40 shingles. Total harvest in a 6-hour-day work is 80 shingles. Imputed costis the income to be earned from a 6-hour fishing trip where average catch is 2-3 kg equivalent to 75pesos/day if price of fish is 30 pesos/kg. This brings the gathering cost at 0.9 pesos per shingle.
• Timber harvesting. Volume of wood harvested in 5-6 hours of work (including travel time) is about 0.577 m3,
all of which can be loaded to a carabao-drawn cart. Imputed cost is also based on income from fishingwhich is estimated at approximately 130 pesos per m3. The cost of transporting timber from the forest atforest at 100 pesos (173 pesos/) per m3 trip. Total gathering cost is the sum of the two. Cooking withliquefied petroleum gas (LPG) is not considered as the appropriate substitute considering high costs from: a)capital investment in gas stove and the gas tank; and b) uncertainty in availability of refills particularly inareas like Pagbilao.
• Fuel wood harvesting. Four bundles (0.04 m3) may be gathered in about 6 hours traveling to a site 200
meters away. It is assumed that non-working family members do this task and hence the opportunity cost isclose to zero and is assumed to be zero in this case.
• In subsistence forestry, the use value of the forest products derived from the mangroves should be net of
the gathering cost. When households are denied access to mangrove forest resources, the value attached tothe forest products is equivalent to the cost they incur in obtaining alternative products. Such cost is equalto the market price of the alternative product plus the transport cost from the market to the point of use.Thus, the shadow price of forest products is the market price of the alternative product plus the transportcost less gathering costs.

CREED Working Paper Series No 9 45
• In a commercial forestry regime, it is assumed that the co-operative’s objective is to maximise the value of netbenefits to be derived from the forest. Net benefit is the stumpage value which is equal to the market price ofthe good less the costs of transport, extraction and related costs incurred in managing the forest..
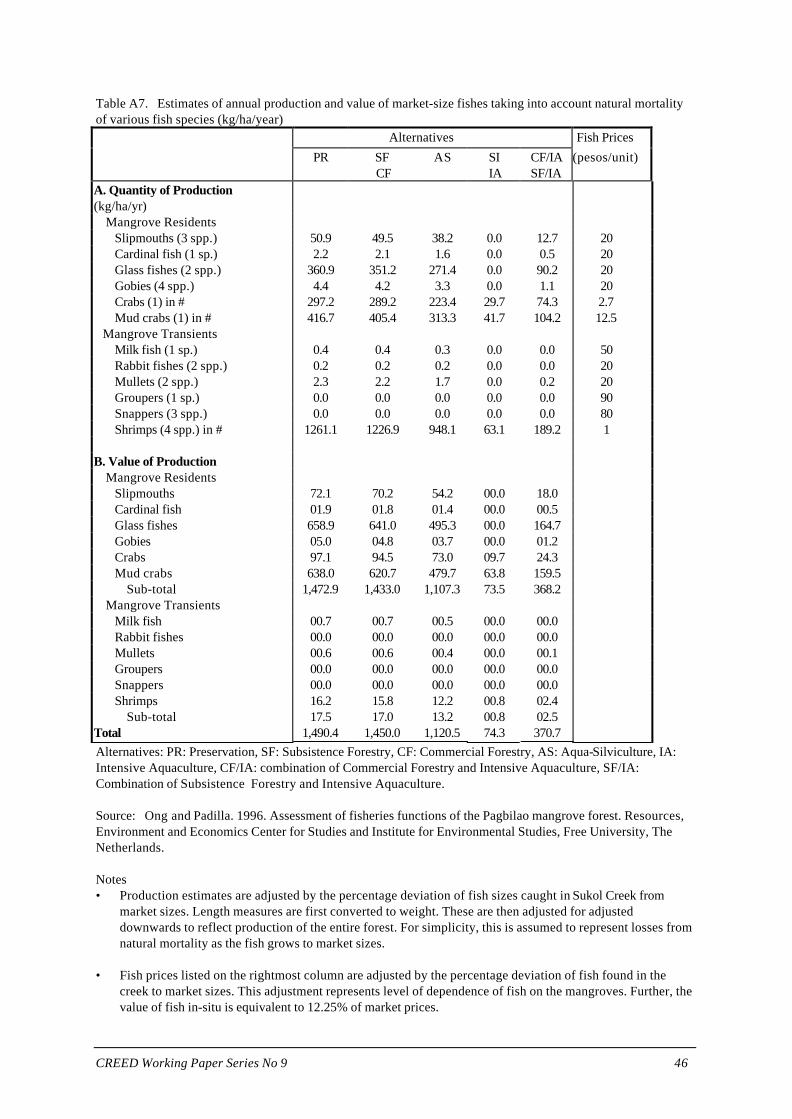
CREED Working Paper Series No 9 46
Table A7. Estimates of annual production and value of market-size fishes taking into account natural mortalityof various fish species (kg/ha/year)
Alternatives Fish Prices
PR SF CF
AS SI IA
CF/IASF/IA
(pesos/unit)
A. Quantity of Production(kg/ha/yr) Mangrove Residents Slipmouths (3 spp.) 50.9 49.5 38.2 0.0 12.7 20 Cardinal fish (1 sp.) 2.2 2.1 1.6 0.0 0.5 20 Glass fishes (2 spp.) 360.9 351.2 271.4 0.0 90.2 20 Gobies (4 spp.) 4.4 4.2 3.3 0.0 1.1 20 Crabs (1) in # 297.2 289.2 223.4 29.7 74.3 2.7 Mud crabs (1) in # 416.7 405.4 313.3 41.7 104.2 12.5 Mangrove Transients Milk fish (1 sp.) 0.4 0.4 0.3 0.0 0.0 50 Rabbit fishes (2 spp.) 0.2 0.2 0.2 0.0 0.0 20 Mullets (2 spp.) 2.3 2.2 1.7 0.0 0.2 20 Groupers (1 sp.) 0.0 0.0 0.0 0.0 0.0 90 Snappers (3 spp.) 0.0 0.0 0.0 0.0 0.0 80 Shrimps (4 spp.) in # 1261.1 1226.9 948.1 63.1 189.2 1
B. Value of Production Mangrove Residents Slipmouths 72.1 70.2 54.2 00.0 18.0 Cardinal fish 01.9 01.8 01.4 00.0 00.5 Glass fishes 658.9 641.0 495.3 00.0 164.7 Gobies 05.0 04.8 03.7 00.0 01.2 Crabs 97.1 94.5 73.0 09.7 24.3 Mud crabs 638.0 620.7 479.7 63.8 159.5 Sub-total 1,472.9 1,433.0 1,107.3 73.5 368.2 Mangrove Transients Milk fish 00.7 00.7 00.5 00.0 00.0 Rabbit fishes 00.0 00.0 00.0 00.0 00.0 Mullets 00.6 00.6 00.4 00.0 00.1 Groupers 00.0 00.0 00.0 00.0 00.0 Snappers 00.0 00.0 00.0 00.0 00.0 Shrimps 16.2 15.8 12.2 00.8 02.4 Sub-total 17.5 17.0 13.2 00.8 02.5Total 1,490.4 1,450.0 1,120.5 74.3 370.7Alternatives: PR: Preservation, SF: Subsistence Forestry, CF: Commercial Forestry, AS: Aqua-Silviculture, IA:Intensive Aquaculture, CF/IA: combination of Commercial Forestry and Intensive Aquaculture, SF/IA:Combination of Subsistence Forestry and Intensive Aquaculture.
Source: Ong and Padilla. 1996. Assessment of fisheries functions of the Pagbilao mangrove forest. Resources,Environment and Economics Center for Studies and Institute for Environmental Studies, Free University, TheNetherlands.
Notes• Production estimates are adjusted by the percentage deviation of fish sizes caught in Sukol Creek from
market sizes. Length measures are first converted to weight. These are then adjusted for adjusteddownwards to reflect production of the entire forest. For simplicity, this is assumed to represent losses fromnatural mortality as the fish grows to market sizes.
• Fish prices listed on the rightmost column are adjusted by the percentage deviation of fish found in the
creek to market sizes. This adjustment represents level of dependence of fish on the mangroves. Further, thevalue of fish in-situ is equivalent to 12.25% of market prices.

CREED Working Paper Series No 9 47
Table A8. Aquaculture production and computation of present value of net Profits for each managementalternative over 25 Years
Management alternativeSemi-intensive Intensive Intensive
aquaculture.Intensive
aquacultureAqua-silvi-
aquaculture: aquaculture: and commercial andSubsistence
culture
Milk fish CropRotation
Forestry Forestry
Production (1000kg) 596.90 240.86 88.55 88.55 179.32
Average Prices (pesos/kg) Milk fish 60 60 60 60 60 Prawn 185 185 185
Gross Revenue (1000 pesos) 35,814 36,347 13,363 13,363 10,759
Variable Costs (1000 pesos) 9,148 14,851 5,460 5,460 2,748
Gross Profit (1000 pesos) 26,666 21,496 7,903 7,903 8,011
Development Costs (1000 pesos) 42,840 42,840 15,750 15,750 12,870
Notes:• Development costs for intensive aquaculture are estimated at P400,000 per ha when exchange rate is
P11/US$. • It is assumed that development costs moved with the exchange rate, hence, it is estimated now at P900,000
per ha. when exchange rate is at P25/US$.• Development cost for semi-intensive ponds is assumed 50% of the amount.

CREED Working Paper Series No 9 48
Table A9. Value of annual production of different marketable products for each management alternative (1000 pesos/year)
AlternativesPR SF CF AS SA IA CF/IA SF/IA
I. Forest Products Fuel wood 0 149.364 12.388 8.037 0 0 6.650 80.514 Subsistence 0 149.364 0 0 0 0 0 80.514 Commercial 0 0 12.388 8.037 0 0 6.650 0 Timber 0 76.282 323.279 209.732 0 0 173.291 41.264 Subsistence 0 76.282 0 0 0 0 0 41.264 Commercial 0 0 323.279 209.732 0 0 173.291 0 Charcoal 0 25.272 0 0 0 0 0 18.063 Subsistence 0 25.272 0 0 0 0 0 0 Commercial 0 0 0 0 0 0 0 18.063 Nipa shingle 0 99.000 81.000 0 0 0 40.500 47.250
Sub-Total 0 349.918 416.667 217.769 0 0 220.441 187.091
II. Aquaculture 0 0 0 6724 22000 17000 6328 6328
III. Capture Fisheries 164.987 160.515 160.515 124.039 8.225 8.225 41.036 41.036 Residents 163.050 158.633 158.633 122.578 8.136 8.136 40.760 40.760 Transients 1.937 1.882 1.882 1.461 0.089 0.089 0.277 0.277
Alternatives: PR: Preservation, SF: Subsistence Forestry, CF: Commercial Forestry, AS: Aqua-Silviculture, IA:Intensive Aquaculture, CF/IA: combination of Commercial Forestry and Intensive Aquaculture, SF/IA:Combination of Subsistence Forestry and Intensive Aquaculture.
Notes: • The value of forest products is derived from Tables A5 and A6; • The value for fisheries is computed by multiplying total value in Table A8 by 110.7 ha.