EVALUATION OF ADDITIONAL REMEDIAL ALTERNATIVES FOR
27
tocTb* iScAl TECHNICAL MEMORANDUM FROM: Dick Glanzman/DEN Bill Bluck/BOI TO: Mark Doolan, RPM, Region VII EPA RECEIVED FEB 0- iiS-J SPFD BRANCH DATE: January 5, 1994 SUBJECT: Evaluation of Additional Remedial Alternatives for the Baxter Springs and Treece Subsites, Cherokee County Superfund Site PROJECT: RME68062.ES EPA requested that CH2M HILL assist them in the development of a Proposal Plan (PP) and subsequently, a Record of Decision (ROD) for the Baxter Springs and Treece Sub- sites, portions of the Cherokee County, Kansas, Superfund Site. The PRP group has completed for these subsites, a Remedial Investigation (RI) Report, Risk Assessment (RA), and Feasibility Study (FS). EPA, in conducting its review of the FS, became concerned that insufficient consideration had been given to development of remedial alternatives that could significantly improve surface water quality, hence improve the aquatic environment in the subsite tributaries and downstream receiving waters. Certain alternatives, such as Alternative 5a that had considered these issues had been screened out earlier in the FS process and, as a result, did not have the opportunity to be compared in the detailed analysis of alternatives. EPA directed CH2M HILL to 1) develop a detailed cost estimate for Alternative 5a using the cost basis used in the FS; 2) establish a methodology to quantitatively judge the effec- tiveness of this alternative in improving surface water quality as compared to Alterna- tive 3; and 3) using such a methodology, try to develop an "additional" alternative that would greatly improve surface water quality in a more costly effective manner than Alternative 5a. 1.0 Introduction DEN100150E9.WP5 72041 Superfund
Transcript of EVALUATION OF ADDITIONAL REMEDIAL ALTERNATIVES FOR

tocTb* iScAl
T E C H N I C A L M E M O R A N D U M
FROM: Dick Glanzman/DEN Bill Bluck/BOI
TO: Mark Doolan, RPM, Region VII EPA RECEIVED
FEB 0- i iS-J
SPFD BRANCH
DATE: January 5, 1994
SUBJECT: Evaluation of Additional Remedial Alternatives for the Baxter Springs and Treece Subsites, Cherokee County Superfund Site
PROJECT: RME68062.ES
EPA requested that CH2M HILL assist them in the development of a Proposal Plan (PP)
and subsequently, a Record of Decision (ROD) for the Baxter Springs and Treece Sub-
sites, portions of the Cherokee County, Kansas, Superfund Site. The PRP group has
completed for these subsites, a Remedial Investigation (RI) Report, Risk Assessment
(RA), and Feasibility Study (FS). EPA, in conducting its review of the FS, became
concerned that insufficient consideration had been given to development of remedial
alternatives that could significantly improve surface water quality, hence improve the
aquatic environment in the subsite tributaries and downstream receiving waters. Certain
alternatives, such as Alternative 5a that had considered these issues had been screened out
earlier in the FS process and, as a result, did not have the opportunity to be compared in
the detailed analysis of alternatives.
EPA directed CH2M HILL to 1) develop a detailed cost estimate for Alternative 5a using
the cost basis used in the FS; 2) establish a methodology to quantitatively judge the effec
tiveness of this alternative in improving surface water quality as compared to Alterna
tive 3; and 3) using such a methodology, try to develop an "additional" alternative that
would greatly improve surface water quality in a more costly effective manner than
Alternative 5a.
1.0 Introduction
DEN100150E9.WP5
72041 Superfund

M E M O R A N D U M Page 2 February 3, 1994
The technical memorandum, containing such an analysis, will subsequently be used by
EPA, in conjunction with the other project documents, to assist in the formulation of a
PP and subsequent completion of a ROD.
2.0 Methodology
2.1 Background
In the FS, a total of seven alternatives were carried through detailed analysis and com
pared to the No-Action Alternative (noted as Alternative 1). The alternatives developed
were focused in reducing risks in two areas: 1) Public Health; and 2) "Ecorisk" as
judged by water quality measurements. Public health risk was reduced principally by
taking steps to reduce human exposure to contaminated mine waste materials to varying
degrees. Alternatives 2 and 3 considered actions at two residences. Alternatives 6a and
c, 7a and c and 8a added increasing levels of management of surface mine wastes, which,
in turn, added to the capital costs. Ground water impacts to public health primarily
consisted of prevention of contamination to the deep aquifer for all the remedial alterna
tives. Institutional controls were also a portion of the actions to protect public health for
both source materials and ground water remedial actions. As regards ecorisk, ground
water contamination of Willow Creek at the Baxter Springs subsite as a result of reducing
discharge from the Bruger Shaft was a component of alternatives, and was included under
groundwater remedial actions.
The main component of ecorisk improvement covered in the range of alternatives that
was developed in the FS for detailed analysis dealt principally with removal of outwash
tailings in four tributaries: Willow Creek and Spring Branch Creek at the Baxter Springs
DEN100150E9.WP5

M E M O R A N D U M Page 3 February 3, 1994
Subsite and Tar Creek and Tar Creek Tributary for the Treece Subsite. The removed
outwash tailings would be relocated to nearby tailings deposits which would also be stabi
lized, capped, regraded and revegetated. In addition to these actions, erosion protection
utilizing stream channels, dikes and diversion ditches would be installed. Short term
water management and sediment control would also be utilized during the construction
phase to protect water quality. Essentially, all the alternatives carried forward into
detailed analysis, except the No-Action and Alternative 2 (which was primarily a public
health only alternative), considered this level of surface water protection. No opportunity
existed in the detailed analysis to further compare and contrast alternatives that contained
other additional actions that would improve surface water quality, thus decreasing
ecorisk.
2.2 Unit Cost Development
In Section 6.4 and Appendix D of the FS, individual components of the remedies under
consideration are described and costed. It should be noted that the costing of Alterna
tive 5a and development of the "additional" alternative will have certain common com
ponents with Alternative 3, namely Source Material and Groundwater actions. Also, in \ Chapters 1 and 5 of the FS, descriptions of the various mine waste units and areas were^
designated, including those that were deemed "largest" as well as those designated as /
"significant" contributors to added metals loading to various tributary surface waters? '
See Drawings No.'s 1.6-1, -2, and -3 as well as 5.2-1 and -2. Appendix A further item
ized various waste units and areas. Consequently, these referenced sections of the FS
were used to develop the component elements shown in Table 1, Detailed Costs of
Alternative 3.
Note that the specific item numbers with their respective unit costs, and individual mine
waste units were designated for each of the four major tributaries of interest.
DEN100150E9.WP5

Table I Detailed Castf-AltenuUve3 Puge 1 of 2
Item Description Unit Cost
($)
Baxter Springs Treoce Baxter Springs Treece
Item Description Unit Cost
($) Spring Branch Willow Creek Tar Creek T.C. Tributary Costs
(J) Costs
(S)
1.0 Source Material Actions
1.1 Residential source removal actions 33,000 ca (1) N/A (1) N/A 35,000 35,00(3
1.2 Institutional conlrols 100,000 ea (1) N/A (1) N/A 100,000 100,000
Subtotals 135,000 135,000
2.0 Groundwater Actions
2.1 Deep aquifer well plug 73,636 ea (3) N/A <8) N/A 220,908 589,088
2.2 Brugcr shaft control 88,000 ca - (1) - - 88,000 0
2.3 Groundwater institutional controls 100,000 ca (1) N/A (1) N/A 100.000 100,000
Subtotals 408,908 689,088
3.0 Surface Water Actiona
3.1 Fill, cap, regrade, and revegetation
tailings piles
39,359/ae
i
BT-23(3.29 ac), BT-6(I0.41 ac)
07-2,(6.26 ac), ST-7(0.82 ac)
BT-8(3.53 ac), BT-9(1.04 ac)
Total-25.35 ac
BT-I,(4.07 ac)
Total—4.07 ac
TT-10(10.8ae), TT-11(I.5 ac)
TT-14M(7.96 ac)
Total-20.26 ac
TT-22(4.73 ac)
Total—4.73 ac 1,157,942 983.58!
3.2 Removsl/dispose of outwash tails 11.00/yd*
Conv. to 35,750/ac
DOW-2 (24.19 ac)-* ^BT6,7,8,and9 ~ -
j.i.
B(5W-4 (9.71 acHBT-23
ToUlU.9 ac
BOW-I (1.36 ac) and BOW-3 (11.87 ac)
-BT-I
Total-13.23 ac
TOW-1 (I.I ac) and TOW-2 (2.3 ac) and TOW-3 (0.22 ac)
-TTIOand 14
Total-3.82 ac
TOW-3 (9.13 ac) and TOW-4 (2.22 ac)-»TT22
Tolal-11.33 ac 1,684,898 542,328
3.3 Stream channelization 183.00/LF 1,000' near BT22 and breach of BT23 repaired
Nil 800' of channel and riprap north TT-8 and dike repair
0 TT-l 1 and 22
185,000 148,000
3.4 Erosion control/diversioo ditches 22.00/LF 300 LF Nil 500 LF Nil 11,000 11,000
DENI0014FF3.WP5

Table 1 Detailed Costs—Alternative 3 Page 2 of 2
Baxter Springs Trecce Baxter Springs Treece
Item Description Unit Cost
<$) Spring Branch Willow Creek Tar Creek T.C, Tributary Costs
«) Costs • <$>
3.5 Dikes and embankments 28.00/LF 500 LP Nil 3.800 LF Nil 14.000 106,400
3.6 Sedimentationbasins 47.397 ea (•) (1) (1) (1) 94,79-4 94.794
3.7 Pond water handling 26.070/mgd 1 mgd 1 mgd 0.5 mgd 0.5 mgd 52,140 26,070
Subtotals 3,199,774 1,912.173
4.0 Subtotal - Direct Costs 3,743,682 2.736,261
5.0 Indirect Costs
5.1 Engineering design 6% of 4.0 224,621 164,176
5.2 Construction management 12.751 of 4.0 475,448 347,505
5.3 Contingency 23.75St of 4.0 889,124 649,862
Subtotals 1.589,193 1,161,543
6.0 Total Cost Estimate 5,332,875 . 3.897.804
Total Cost 9.230,679
DENIOOMFF3.WP5

M E M O R A N D U M Page 4 February 3, 1994
2.3 Alternate 5a Cost Estimate
With the unit costs and specific mine waste units established by tributary for both the
subsites, the next step was referral to Section 5.2.3.5 of the FS to assist in the develop
ment of Table 2, Detailed Costs of Alternative 5a. This alternative, along with others in
the FS, focused on additional methods to improve surface water quality of the various
tributaries by mine waste consolidation and other means, and, as mentioned earlier, had
been screened out so that they could not be further evaluated.
It should be recalled that surface water actions for Alternative 3, focused primarily on
removal of outwash tailings in the four tributaries and consolidating them in key tailings
deposits along with limited channelization, dikes and other surface water management
functions. Alternative 5a, on the other hand, considered remediating virtually all mine
waste units and areas considered the "largest" and "significant" contributors to metals
contamination of this tributary, in addition to that done with alternate 3. This alternative
offers a reasonable upper-bound, or ultimate solution, as regards potential remediation of
mine waste units and areas that clearly degrade surface water quality. As can be seen in
Table 2, appropriate mine waste units/areas were noted for each tributary and, using the
unit costs developed in Table 1, capital costs were then calculated. Indirect costs, for
engineering, construction management, and contingency using the same percentages of
direct costs that were utilized in Alternative 3. Also, source material actions and ground
water actions were identical to that utilized for Alternative 3. Including these additional
"significant" and "largest" mine waste units to be remediated added over $10.3 million to
the capital cost, compared to Alternative 3, bringing total estimated capital costs to
$19.6 million.
DEN100150E9.WP5

Table 2 Detailed Costs—Altereati
(See FS. Section 5.2 J.5 and A veSo ipendii A) 1': i y •• I uf 2
Item Description Unit Cost
<$)
Baxter Springs Tieece Baxter Springs Trti<e
Item Description Unit Cost
<$) Spring Branch Willow Creek Tar Creek T.C. Tributary Costs
(S) Cn5t5
(S)
1.0 Source Material Actions Same aa Alternative No. 3 Same aa Alternative No. 3 135,000 135,000
2.0 Groundwater Actions Same at Alternative No. 3 Same aa Alternative No. 3 408,908 689,088
3.0 Surface Water Actions
3.1 .a Fill, cap, regradc, and revegetatlon tailings piles
39,359/ac
Same aa Allema
Total-25.35 ac
live No. 3
Tolal-4.07/ic
Same aa Alter
Total —20.26 ac
native No. 3
Total —4.73 ac 1,157,942 983,581
3.1 .b Additional "significant" tailings regradedk reconloured, capped, and re vegetated
39,359/ac BT.4 (1.47 ac)
Total-1.47 ac
Nil TT-5(2.42A) + TT-6 (2.46A) + TT-8(32.92A) + TT-I0(I0.8A) + TT-I4(7.96A) + TT-30(0.84 ac) + TT-31(7.62 ac) + T-32(2.J7A) + TT-4I(6.26A) + TT-44(3.66 ac)
Total--77.il ac
TT-17„(5.13 ac) + TT-18(1.343A) + TT-19U.64A) + TT-21(1.36A) + TT-42(3.66A)
Tulal-13.12 ac 57,858 3,567, UK)
3.I.C "Significant* chat piles, would be regarded, recontoured, capped, and revegetatcd
13,410/ac BC-12(53.82 ac)
Toul-53.82 ac
Nil TC-3(50.76A) + TC-4(20.2A) + TC-7(6.67A) + TC-9(40.04A) + TC-15M(24.81A) + TC-6„(I7.35A) +TC-29(3.15A) + TC-37(eit. 2.0 ac)
Total-164.98 ac
TC-20 (3.09A)
Total—3.09 ac 721,726 2.253,819
3.1 .d- "Significant" excavated chat pilea would be regradcd and revcgetaUd
1,905/ac BX-II0.99A) + BX-290.79A) + BX-3I(2I.54A)
Nil TX-7(34.09A) + TX-16(5.94A) + TX-21(11.7A) + TX-5(10.52A) + TX-29(22.04A) 4- TX-30(2.7A) + TX-3KII.79A) + TX-32(6.7IA) + TX-39(22.6A)
TX-20(8.21A),TX-42(9.77A) + TX-43(19.78A) + TX-46(0.5A eat.)
3.2 Remove/dispose of outwaahuila 11.00/yd1
or 35,750/ac
Same aa Altcrnativa No. 3
ToUl-33.9A | Total-13.23 ac
Same at Alternative No. 3
SI-3.82A | Total-II.JSA 1,684,898 542.328
DENI0014FFI.WP3

% « -
Tabic 2 Detailed Costs—Allernati
(Sec FS. Section 5JJ.5 and A •e 5a ipendix A) Page 2 of 2
Item Description Unit Cost
($)
Baxter Springs Treece Baxter
Springs Tn.'vct!
Item Description Unit Cost
($) Spring Braorb Willow Creek Tar Creek T.C. Tributary Costs
(5) Costs
(J)
3.3 Stream channelization 185.00/LF Same as Alternative No. 3
Toul-1,000 LF |
800' (All. 3 + 1,000' TT-8
Toul-1,800 LF
Nil(Alt. 3) + 500' forTT-18, 19
Toul -500 LF 185,000 425,500
3.4 Erosion control/diversion ditches 22.00/LF Same as Alternative No. 3 Same as Alternative No. 3 11,000 11,000
3.5 Dikes and embankments 28.00/LF Same as Alternative No. 3 Same as Alternative No. 3 14.000 106,400
3.6 Sedimentation basins 47,397 ca Seme •• Alternative No. 3 Same as Alternative No. 3 94,794 94,794
3.7 Pond water hsndling 26,000/mgd Same as Alternative No. 3 Same as Alternative No. 3 52,140 26,070
Subtotal 4.035,213 8,327,495
4.0 Subtotal—Direct Cost 4,579,121 9.I51.5HJ
5.0 Indirect Costs
5.1 Engineering 6% of 4.0 274,747 549.095
5.2 Construction Management 12.7% of 4.0 581,548 1,162,251
5.3 Contingency 23.75 %of 4.0 1,087,541 2.173,501
Subtotal 1,943,836 3,884.8-17
6.0 Total Cost Estimate 6.522,957 13,036,430
Total Cost 19,559,387
DENI0014FF1.WP5

M E M O R A N D U M Page 5 February 3, 1994
2.4 Determination of Effectiveness
It was then necessary to develop a method, using existing RI data, to assess whether the
addition of these actions which added over $10 million to the cost to Alternative 3 was a
cost effective action or not. These subsites are very large and the weathering and
oxidation of the various minerals from many different mine wastes as influenced by pre
cipitation, physical location, and other factors, complicates the ability to measure these
changes and subsequently understand how these systems behave in detail, particularly
when the difference between "good" or "bad" is measured in parts per billion. The
extensive data base generated during the RI/FS process was again reviewed to find a
means to assist making this judgement and it was decided that about the only approach
practical would be based upon the zinc mass load measurements found in the FS, notably
summarized, in Figures 1.6-2 and -3, and based upon the hydrology of the tributaries.
As is noted in the FS, the Willow Creek and Spring Branch tributaries are relatively
small flow and contaminant mass load contributors to the Spring River near Baxter
Springs, compared to the river as a whole. Tar Creek and Tar Creek Tributary near
Treece, carry about 10-times the zinc loads by comparison to Willow Creek and Spring
Branch. When referring to Figures 5.2-1 and -2, it becomes very apparent that the quan
tities and aerial extent of the various mine wastes are much greater in the Treece area so
it makes some sense as regards the differences in the mass loads from each.
In order to make comparisons of effectiveness between Alternatives 3 and 5a, it was
decided that, by utilizing the zinc mass load data for each subsite developed during the RI
and estimating mass load reduction based upon remediation of specific mine waste units/
areas, relative estimates of reduction of zinc loads could be made. Some professional
judgements had to be made in making minor adjustments to make the comparisons.
Calculations for the estimated zinc mass load reductions for Alternative 3 and Alterna
tive 5a can be found in Appendix A. Since the remedies actual effectiveness is difficult
DEN100150E9.WP5

Table 3 Mass Load Reduction and Effectiveness Estimate—Alternative 3
Description Baxter Springs Treece
• Zinc Mass load - no action (lbs./day)
507 lbs./day 4,693 lbs./day
• Load Reduction -Alt 3 @100% efficiency @85% efficiency @65% efficiency
216 lbs./day 184 lbs./day 140 lbs./day
110 lbs./day 94 lbs./day 72 lbs./day
• Capital Cost - Alt 3 items 3.1, 3.2, 3.3 (Table 1)
$3,028,840 $1,673,909
• Cost/lb. of zinc/per subsite reduction (85% efficiency)
$16,461/lb. $ 17,808/lb.
• Weighted average cost/lb. for both subsites @85% effectiveness
$16,916
DEN100150F1.WP5

Table 4 Mass Load Reduction and Effectiveness Estimate—Alternative 5a
Description Baxter Springs Treece
• Zinc Mass load - no action (lbs./day)
507 lbs./day 4,693 lbs./day
• Load Reduction -Alt 5a @ 100% efficiency @85% efficiency @65% efficiency
474 lbs./day 403 lbs./day 308 lbs./day
4,585 lbs./day 3,898 lbs./day 2,980 lbs./day
• Capital Cost - Alt 5a items 3.1a, b, c, d, 3.2, 3.3 (Table 2)
$3,863,279 $8,089,231
• Cost/lb./subsite of zinc reduction (85 % efficiency)
$9,586/lb. $2,075/lb.
• Weighted average cost/lb. for both subsites @ 85% effectiveness
$2,779/lb.
DEN100150F1.WP5

M E M O R A N D U M Page 7 February 3, 1994
2.6 Development of a More
Cost EfTective Alternative
It can be seen, however, that the effectiveness of spending considerable monies in
remedying outwash tailings in the four tributary drainages as part of Alternative 3, is
really not very cost effective since the data clearly indicates that these wastes are not
truly significant contributors to the degradation of surface water quality. This fact was
considered in subsequently assessing additional engineering actions specifically geared to
improving surface water quality for the next phase of the work. During the development
of this report, discussions were held with EPA representatives regarding other concerns
that they have regarding outwash tailings. Although these concerns became more qualita
tive than quantitative in nature, there is evidence to support the following:
(a) The outwash tailings do have elevated metals concentrations and pose
potential health risks via inhalation or ingestion while people recreate in
these drainages.
(b) The outwash tailings, if uncontrolled, will continue to add sediment and
dissolved metal loads to downstream reaches of the tributaries and subse
quently to the Spring and Neosho Rivers and therefore pose ongoing
adverse threats to macroinvertebrates in the ecosystem.
Given these factors, it became apparent that remediation of the outwash tailings in all
four tributaries should be included in the subsequent development of a surface water
quality improvement remedy that is more cost effective and fits somewhere between
Alternatives 3 and 5a.
DEN100150E9.WP5

M E M O R A N D U M Page 8 February 3, 1994
Referring back to FS Figures 1.6-3 and 5.2-2, it can be noted that the big load increase
occurs in the Tar Creek drainage between stations TC-1 and TC-2 where mass loads
increase from 36 lbs/day to 3,674 lbs/day or over 81 percent of the whole drainages'
mass load. Almost all of the identified mine waste areas were designated as "largest"
according to the FS. From station TC-2 to TC-3, the gain in zinc is over 800 lbs./day
with one additional "largest" mine waste source noted (TT-8). It was therefore decided
to modify Alternative 5a to only remedy the mine waste areas designated as "largest"
rather than both varieties and include remediation of the outwash tailings as did Alterna
tive 3 and 5a. A subsequent cost estimate for Modified Alternative 5a was developed and
is noted as Table 5. Capital cost for this alternative was determined to be approximately
$13.36 million or about $4.1 million more than Alternative 3 and about $6.2 million less
than Alternative 5a. A similar mass load reduction and effectiveness estimate for this
alternative was developed and is noted as Table 6. As can be seen, weighted cost/pound
for zinc reduction drops to $2,283 per pound. Details of the estimate are found in
Appendix A.
2.7 Development of Operating and
Maintenance Costs and NPV Calculations
In addition to the capital cost estimate for each alternative, EPA guidance requires that
annual operating and maintenance costs (O&M Costs) be developed for each alternative in
the detailed analysis. In addition, for each alternative, a present worth or Net Present
Value (NPV) calculation is also conducted on the combined capital and O and M costs for
a 30-year period using a 5 percent discount rate. In reviewing the FS, it appears the
present worth was calculated .on a 5-year basis rather than 30-years. Both time frames
will be calculated so guidance is met but comparability to the FS can be measured as
well.
DEN100150E9.WP5

9
TableS Modified Alternative 5a Page 1 of 2
Item Description Unit Cost
($)
Baxter Springs Trecce Baxter Springs Treece
Item Description Unit Cost
($) Spring Branch Willow Creek Tar Creek T.C. Tributary Costs
(5) Costs
(5)
1.0 Source Material Actions Same at Alternative 3 Some ai Alternative 3 135,000 135,000
2.0 Groundwater Actions Same as Alternative 3 Seme aa Alternative 3 408,908 689.088
3.0 Surface Water Actions
3.1a Per Alt #3 - fill, cap, rcgrade, and revegetate tailings piles
3.1b Add "lorgest" tails to fill, regrade, revegetate
3.1c Add *largest" chat piles to be rcgraded, recontoured, capped and revegetated
3. Id Add "largest" excavated chat piles to be regraded and revegetated
39,359/ac
39,359/ac
13,410/ac
1,905/ac
Same aa Ahem TOUI 25.35.A
nil
nil
nil
ntive 3 Total—4.07A
nil
nil
nil
Same as A Total- 20.26A
TT30(.84) + TT3I(7.62) + TT32(2.57) + TT33(.7I) + TT8(32.92) Total-44.66ac
TC3(50.76a) + TC29(24.4a) Total —75.16 ac
TX7(34.05) + TX29(24.4) + TX3I (11.79a), Total -70.28 ac
ternative 3 Total-4.73A
nil
nil
nil
1.157,942 983,581
1.767,773
1,007,896
133.884
3.2 Removal/dispose of oulwash tails 11.00/yd or
35,750/ac
Same as Allcm
33 .9 tc
stive 3
13.23 ac
Same as A
3.82 ac
tentative 3
11.35 ac 1.684,898 542,328
3.3 Stream channelization 185/lf 1,000 LF nil 800 LF nil 185.0u0 148,000
3.4 Erosion control/diversion ditches 22/if 500 LF nil 500 LF nil 11.000 11,000
3.5 Dikes and embankments 28/lf 500 LF nil 3,800 LF nil 14,000 106,400
3.6 Sedimentation basins 47,397 ea (1) (1) (1) (1) 94,794 94,7:)4
3.7 Pond water handling 26,070/mgd 1 mgd 1 mgd 0.5 mgd 0.5 mgd 52,140 26,070
Subtotals 3,199,774 4,811,726
4.0 Subtotal-Direct Costs 3,743,682 5.635,814
5.0 Indirect Cosis
DEN 100150F3.WP5

Table 5 Modified Alternative 5a Page 2 of 2
Item Description Unit Cost
<$)
Baxter Springs Treece Baxter Springs Tro^ce
Item Description Unit Cost
<$) Spring Branch Willow Creek Tar Creek T.C. Tributary Costs
<S) Costs
<*)
5.) Engineering design 6% of 4 224,621 338,149
5.2 Construction management 12.7% of 4 475,448 715,748
5.3 Contingency 23.75% of 4 889,124 1,338,51)6
Subtotals 1.589,193 2,392,403
6.0 Total Cost Estimate 5,332.875 8,028.217
Total Cost 13.361,092
DENI00I50F3.WP5

Table 6 Mass Load Reduction and Effectiveness Estimate —Modified Alternative 5a
Description Baxter Springs Treece
• Zinc Mass load - no action (lbs./day)
507 lbs./day 4,693 lbs./day
• Load Reduction -Alt 5' @100% efficiency @85% efficiency @65% efficiency
216 lbs./day 184 lbs./day 140 lbs./day
3,701 lbs./day 3,146 lbs./day 2,406 lbs./day
• Capital Cost -Modified Alternative 51 items 3.1a, b, c, d, 3.2, 3.3 (Table 5)
$3,027,840 $4,573,462
• Cost/lb. of zinc reduction (85 % efficiency)
$16,456 $1,454
• Weighted average cost/lb. for both subsites @85% effectiveness
$2,283/lb.
DEN100150F1.WP5
M E M O R A N D U M Page 9 February 3, 1994
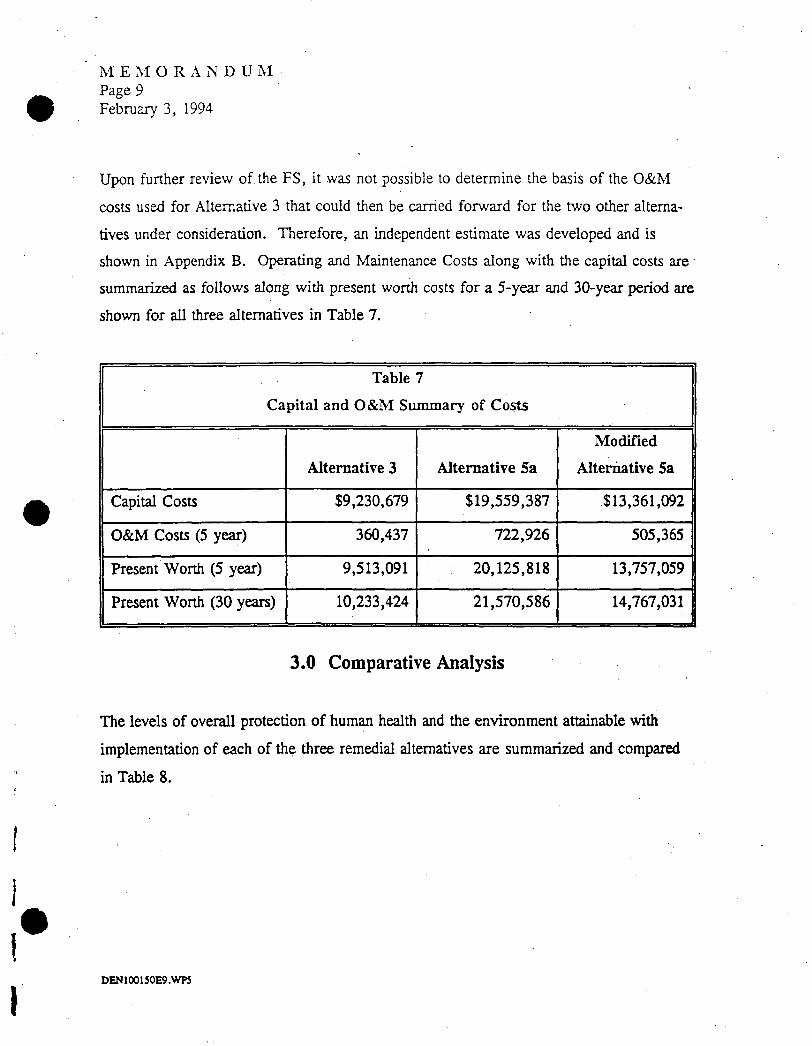
Upon further review of the FS, it was not possible to determine the basis of the O&M
costs used for Alternative 3 that could then be carried forward for the two other alterna
tives under consideration. Therefore, an independent estimate was developed and is
shown in Appendix B. Operating and Maintenance Costs along with the capital costs are
summarized as follows along with present worth costs for a 5-year and 30-year period are
shown for all three alternatives in Table 7.
Table 7
Capital and O&M Summary of Costs
Alternative 3 Alternative 5a
Modified
Alternative 5a
Capital Costs $9,230,679 $19,559,387 $13,361,092
O&M Costs (5 year) 360,437 722,926 505,365
Present Worth (5 year) 9,513,091 20,125,818 13,757,059
Present Worth (30 years) 10,233,424 21,570,586 14,767,031
3.0 Comparative Analysis
The levels of overall protection of human health and the environment attainable with
implementation of each of the three remedial alternatives are summarized and compared
in Table 8.
DEN 100150E9 .WP5

Table 8 Comparative Analysis of Alternatives Page 1 of 3
Criteria/Description Alternative 3 Alternative 5a Modified Alternative 5a
1. Protection of Public Health and the Environment A. Source Materials
Human Health Risks
Environmental Risks
Assuming institutional controls are implemental and enforced, Alternative 3 would minimize risks associated with current and future exposures to source materials. Removal and consolidation of outwash tailings reduces risk to recrcators. Risks to macroinvertebrates and other terrestrial biota will be reduced due to removal of outwash tailings and some control of their sources.
Same as Alternative 3
Same as Alternative 3
Same as Alternative 3
Same as Alternative 3
B. Groundwater
Human Health Risks
Environmental Risks
Assuming institutional controls are implemented and enforced, Alternative 3 would prevent future health risks from consumption of shallow groundwater. Protection of deeper aquifer addresses future potential risks.
Remedial actions at Broger shaft to reduce environmental discharge to Willow Creek will reduce contaminant loading to Willow Creek, that may contribute to infrequent exceedances of TRVs in portions of Willow Creek.
Same as Alternative 3
Same as Alternative 3
Same as Alternative 3
Same as Alternative 3
C. Surface Water Human Health Risks No risks to human health are attributed
to surface water. Same as Alternative 3 Same as Alternative 3
DEN 10015142. WP5

Table 8 Comparative Analysis of Alternatives Page 2 of 3
Criteria/Description Alternative 3 Alternative Sa Modified Alternative 5a
Environmental Risks Removal of outwash tailings and stabilization of major sources of outwash tailings will reduce zinc (and other metals) loading to the Spring and Neosho Rivers by about 5 percent. It cannot be determined if TRVs or AWQCs could be met in various reaches of the tributaries on a continuous basis.
Removal of outwash tailings and reclamation and/or stabilization of all other "largest" and "significant" mine waste sources will reduce zinc (and other metals) loading to the Spring and Neosho Rivers by about 83 percent. It is very probably that major improvements in water quality will result than with Alternative 3 but it cannot be determined that TRVs or AWQCs could he met in various reaches of the tributaries on a continuous basis.
Removal of outwash tailings and reclamation and/or stabilization of "largest" mine waste sources will reduce zinc (and other metals) loading to the Spring and Neosho rivers by about 64 percent. It is probable that there will still be dramatic improvements in water quality but less than Alternative 5a and again, it cannot be determined whether TRVs or AWQCs could be met in various reaches of the tributaries on a continuous basis.
2. Will Remedies Meet ARARs? See Subsection 7.1.2 of F.S. Doubtful that zinc reduction significant to meet TRVs or AWQCs.
Same as Alternative 3 but zinc load reduction very significant. Cannot determine if TRVs or AWQCs can be met.
Same as Alternative 3 but zinc lead reduction significant. Cannot determine if TRVs or AWQCs can be met.
3. Long-Term Effectiveness and Permanence
Magnitude of Residual Risks
If institutional controls implemented and enforced, current and future residual risks will be minimized. Removal of outwash tailings reduces risk to recreators and reduces ongoing contaminated sediment loads to receiving waters.
Surface water quality improvements minimal based on small zinc load reductions.
Same as Alternative 3
Major surface water quality improvements expected in tributaries.
Same as Alternative 3.
Significant surface water quality improvements as great as Alternative 5a.
DEN10015142.WP5

Table 8 Comparative Analysis of Alternatives P;i^e 3 of 3
Criteria/Description Alternative 3 Alternative 5a Modified Alternative 5a
Adequacy/Reliability of Controls
Proposed engineering methods are adequate and reliable. Potential disturbances of capped materials could result in future risks.
Same as Alternative 3 Same as Alternative 3
4. Reduction of Mobility, Toxicity, and Volume Through Treatment
Not applicable Not applicable Not applicable
S. Short-Term Effectiveness Protection of Local Communities, Worker Protection, Environmental Impacts
Potential short-term risks to communities, workers, and environment are manageable and acceptable. Some siltation will occur as a result of outwash tailings removal.
Same as Alternative 3 Same as Alternative 3
Time Required to Reach Remedial Goals
Alternative 3 could be completed within 2- to 3-year time frame with ongoing post-remediation O&M for foreseeable future
Same as Alternative 3 but completion about 4 to 5 years.
Same as Alternative 3 but completion about 3 to 4 years
6. Implementability Alternative 3 is Technically Feasible. Proposed institutional controls are implementable. All materials and services are readily available.
Same as Alternative 3 Same as Alternative 3
7. Cost Capital Costs
Baxter Springs $5,333 million $6,523 million $5,333 million Treece $3,898 million $13,036 million $8,028 million
Total Capital Costs $9,231 million $19,559 million $13,361 million
Annual O&M Costs $72,087 $144,585 $101,073
Total Present Worth (30 years at 5 percent discount)
$10,233 million $21,571 million $14,767 million
Total Present Worth (S Years at S percent discount)
$9,513 million $20,126 million $13,757 million
DEN10015142.WP5

Appendix A Zinc Mass Load Calculations
I. Base Case - Baxter Springs (Figure 1.6-2 basis)
A. Spring Branch
(Note load loss between SB-1 and SB-2)
• Use SB1 and SB1A as basis (conservative) = 456 lbs./day
• SBA1 @11 lbs./day, SBA2 @ 60 lbs./day (438 lbs./day from lower outwash area)
B. Willow Creek
• WC-1 @ 51 lbs./day
• Most load upgradient of station WC-1A (38 lbs./day)
C. Total - use 456 + 51 = 507 lbs./day into Spring River
n. Base Case - Treece
A. Tar Creek
Upgradient TC-1 @ 36 lbs./day TC-1B @ 923 lbs./day TC-2 @ 3,674 lbs./day TC-3 @ 4,479 lbs./day
B. Tar Creek Tributary
TT-la @ 29 lbs./day TT-1 @ 214 lbs./day
C. Total - use 4,479 + 214 = 4.693 lbs./day
DEN100150EA.WP5 A-l

III. Alternate 3 - Reduction Estimate
Baxter Springs
Willow Creek - Based upon outwash tails BOW-1 and BOW-2. In tributaries where maximum load reduction at 100% efficiency would equal 36 lbs./day Zn.
Spring Branch - Based upon outwash tail BOW-2, area to be remediated is (33.9 + 25.35) 59.25 Ac out of 143.86 Ac deemed to be "significant" or "largest." Assuming reduction proportionate to area, maximum load reduction would be
~~~~ x (449-11) = 180 lbs./day Zn 143.86
Total reduction
if remedy 100% effective = 216 lbs./day or 43% reduction
if remedy 85% effective = 184 lbs./day or 36% reduction
if remedy 65% effective = 140 lbs./day or 28% reduction
Treece
Tar Creek Drainage - Based upon outwash tails TOW-12 and 2, area to be remediated totals 24.08 Ac from a total mine waste area of 395 Ac (6.1 %). About 222 Ac is below TC-2. In this drainage, 82% (3,674 lbs./day Zn) comes from above station TC-2. Again, assuming load reduction proportional to affected area remediated, the remaining 18% of the mass load (805 lbs./day) may be reduced by I f24.08Acl\ \ 222 Ac / 10.8% or 87 lbs./day
Tar Creek Tributary -Calculations on same basis yields x 214 = 23 lbs./day
DEN100150EA.WP5 A-2

Total reduction
if remedy 100% effective = 110 lbs./day or 2.3% reduction
if remedy 85% effective = or
94 lbs./day 2.0% reduction
if remedy 65% effective = or
72 lbs./day 1.5% reduction
IV. Alternate 5a—Reduction Estimate
We will use the same load reduction estimating basis as done for alternative 3. Since this remedy deals with all "largest" and "significant" defined sources, it is assumed that other minor waste units contribute no load and ignores the upgradient mass loads (assumes they pass through).
For Baxter Springs
Willow Creek (same as alternate 3) = 36 lbs./day reduction
Spring Branch All 143.86 Ac will be remediated = 438 lbs./day reduction
Tar Creek Tributary - 70.55 Ac will be remediated = (214 - 29) = 185 lbs./day
reduction
If remedy 100% effective = 4,585 lbs./day or 98% reduction
If remedy 85% effective = 3,898 lbs./day or 83% reduction
If remedy 65 % effective = 2,980 lbs./day or 64% reduction
DEN 100150EA.WP5 A-3

V. Modified Alternative 5a-Load Reduction Estimate
We will use same basis of load reduction used for alternative 5a.
Baxter Springs
Willow Creek (same as alternate 3) = 36 lbs./day reduction
Spring Branch (same as alternate 3) = 180 lbs./day reduction
If remedy 100% effective — 216 lbs./day or 43% reduction
If remedy 85 % effective = 184 lbs. /day or 36% reduction
If remedy 65 % effective = 140 lbs./day or 28% reduction
Treece
Tar Creek Tributary (same as alternate 3) 23 lbs./day reduction
Tar Creek Outwash Tails Benefit (same as alternate 3) = 87 Ibs./day reduction
Reach TC-1 to TC-2
"Largest" TT-33 0.71 Ac TT-30 0.84 Ac rr-3i 7.62 Ac TT-32 2.57 Ac TC-3 50.76 Ac TC-29 3.15 Ac TX-7 34.09 Ac TX-29 22.04 Ac TX-31 11.79 Ac Subtotal 133.57
"Significant" TX-32 - 6.71 Ac Grand Total 140.28 Ac
% waste area to be remediated - 122.57 -r 140.28 = 95%
DEN100150EA.WP5 A-4

Station TC-1 to TC-2
If remedy 100% effective = .95 x 3,638 - 3,456/Ibs. day reduction
Reach TC-2 to TC-3
"Largest" Subtotal
"Significant"
TT-8
TC-16 TC-15 TC-9 TC-37 TC-7 TC-4 TX-25 TT-5 TT-6 TT-41 TX-25 TX-39
Subtotal
Total
STA TC-2 to TC-3
If remedy 100% effective =
32.92 Ac 32.92 Ac
17.35 Ac 24.81 Ac 40.04 Ac
? Ac 6.67 Ac 20.2 Ac
10.52 Ac 2.42 Ac 2.46 Ac 6.26 Ac
10.52 Ac 22.6 Ac
163.85 Ac
196.77 Ac
2^ x 805 196.77
= 135 lbs./day reduction
Treece Summary
23 lbs. + 87 lbs. + 3,456 lbs. + 135 lbs. if 100% effective
= 3,701 lbs./day reduction
If remedy 85% effective = 3,146 lbs./day reduction
If remedy 65% effective = 2,406 lbs./day reduction
DEN100150EA.WP5 A-5

Appendix B G&M Cost Estimates
Assumptions
1. Source Materials Actions:
• One residence each at Baxter Springs and Treece - assume normal maintenance done by homeowner.
• Sampling done once/5 year period to monitor for each site. Labor and analytical cost—$10.000 all alternatives.
2. Groundwater Actions
• Deep well plugging-assume some inspection and well maintenance required once in 5 years representing 5 % of capital cost. 5% (11 @ 73,636/ea) = $40.500 all alternatives.
• Bruger Shaft - assume one time repair over 5 years @ 10% of capital cost = $8.800 all alternatives.
3. Surface Water Actions
a. Annual Inspections-2 engineers/1 week/® $1,000/day = $5,000 all alternatives
b. Assume for a given remedy, one fifth of the sites require some regrading, reseeding, including stream channels, dikes and embankments. Costs are estimated to be 5% of installed capital costs (items 3.1, 3.2 and 3.3) for each alternative over a 5 year period.
Alt 3 - .05 x $4,702,749 = $235,137
Alt 5a - .05 x $11,952,510 = $597,626
Modified Alt 5a - .05 x $7,061,302 = $380,065
c. Surface Water Sampling and Analysis
Four sample rounds/year @ 12 mandays each plus analytical costs. Five years total 5 [4x12 mo @ 150.00/md + 5,000 annually] = $61,000 for each alternative.
DEN100150ED.WPS B-l

Summary of 5 year O&M Costs
Alt.3 Alt 5a Atl 5a
1. Source Material 10,000 10,000 10,000
2. Groundwater 49,300 49,300 49,300
3. Surface Water
a. Inspections 5,000 5,000 5,000
b. Repairs 235,137 597,626 380,065
c. Sample & Analysis 61.000 61.000 61.000
Total 5 year costs $360,437 $722,926 $505,365
DEN100150ED.WP5 B-2