Valuation and Asset Pricing - New York Universitypeople.stern.nyu.edu/igiddy/inv5-capm.pdf ·...
29
Giddy/NYU Valuation and Asset Pricing/1 Valuation and Asset Pricing Prof. Ian Giddy New York University New York University Stern School of Business Copyright ©2001 Ian H. Giddy Valuation and Asset Pricing 3 Valuation and Asset Pricing Capital Asset Pricing Beta and the Security Market Line Identifying Undervalued and Overvalued Securities Estimating Betas Arbitrage Pricing Model Applications
Transcript of Valuation and Asset Pricing - New York Universitypeople.stern.nyu.edu/igiddy/inv5-capm.pdf ·...
Giddy/NYU Valuation and Asset Pricing/1
Valuation and Asset Pricing
Prof. Ian GiddyNew York University
New York UniversityStern School of Business
Copyright ©2001 Ian H. Giddy Valuation and Asset Pricing 3
Valuation and Asset Pricing
� Capital Asset Pricing� Beta and the Security Market Line� Identifying Undervalued and Overvalued
Securities� Estimating Betas� Arbitrage Pricing Model� Applications

Giddy/NYU Valuation and Asset Pricing/2
Copyright ©2001 Ian H. Giddy Valuation and Asset Pricing 4
Capital Allocation Line:Risk-Free Plus Risky Asset
rf=7%
E(rS)=17%
σσσσ S=27%
10%
S
Expected Return
Risk
7%
AN EQUITY FUND
TREASURIES
Copyright ©2001 Ian H. Giddy Valuation and Asset Pricing 5
The Minimum-Variance Frontier of Risky Assets
σ
Efficient frontier
Individual assets
Global minimum-variance portfolio
E(r)

Giddy/NYU Valuation and Asset Pricing/3
Copyright ©2001 Ian H. Giddy Valuation and Asset Pricing 6
Optimal Overall Portfolio
σ
Indifference curve
Opportunity set
CALE(r)
P
Optimal complete portfolio (one example)
OPTIMAL RISKY PORTFOLIOOPTIMAL RISKY PORTFOLIO
Copyright ©2001 Ian H. Giddy Valuation and Asset Pricing 7
The Capital Asset Pricing Model
CAPM Says:�All investors will choose
to hold the market portfolio, ie all assets, in proportion to their market values
�This market portfolio is the optimal risky portfolio
�The part of a stock’s risk that is diversifiable does not matter to investors.
σ
CAL(P)E(r)
rf

Giddy/NYU Valuation and Asset Pricing/4
Copyright ©2001 Ian H. Giddy Valuation and Asset Pricing 8
The Capital Asset Pricing Model
CAPM Says:�The total risk of a financial
asset is made up of two components.A. Diversifiable
(unsystematic) riskB. Nondiversifiable
(systematic) risk �The only relevant risk is
nondiversifiable risk. σ
CAL(P)E(r)
rf
Copyright ©2001 Ian H. Giddy Valuation and Asset Pricing 9
Types of Risk
PortfolioRisk
σσσσkp
Number of Securities (Assets) in Portfolio1 5 10 15 20 25
}}
TOTAL RISK
NONDIVERSIFIABLE RISK
DIVERSIFIABLE RISK

Giddy/NYU Valuation and Asset Pricing/5
Copyright ©2001 Ian H. Giddy Valuation and Asset Pricing 10
M = Market portfoliorf = Risk free rate
E(rM) - rf = Market risk premium
E(rM) - rf = Market price of risk
= Slope of the CAL
Risk Premium: The Market
MMσσσσσσσσ
Copyright ©2001 Ian H. Giddy Valuation and Asset Pricing 11
M = Market portfoliorf = Risk free rate
E(rs) - rf = Stock’s risk premium
E(rs) - rf = Stock’s reward-to-risk ratio
= Market price of risk
Risk Premium: Individual Stock
MMβi σσσσσσσσ

Giddy/NYU Valuation and Asset Pricing/6
Copyright ©2001 Ian H. Giddy Valuation and Asset Pricing 12
Derivation of the CAPM
� Risk Premium for the Market Portfolio:S = E[(RM) - Rf] / σM
� Risk premium for security’s risk per unit of contribution to the market portfolio risk:
[E(Rs) - Rf] / βSσM
� Setting the two values equal to each other:[E(RM) - Rf] / σM = [E(RS) - Rf] / βSσM
� From which one derives the CAPM’sexpected return-beta relationship:
E(RS) = Rf + βS[E(RM) - Rf]
Copyright ©2001 Ian H. Giddy Valuation and Asset Pricing 13
The Equation for the CAPM
rj = RF + βj (rm - RF)where:rj = Required return on asset j;RF = Risk-free rate of return
βj = Beta Coefficient for asset j;rm = Market return
The term [βj(rm - RF)] is called the risk premium and (rm-RF) is called the market risk premium
Giddy/NYU Valuation and Asset Pricing/7
Copyright ©2001 Ian H. Giddy Valuation and Asset Pricing 15
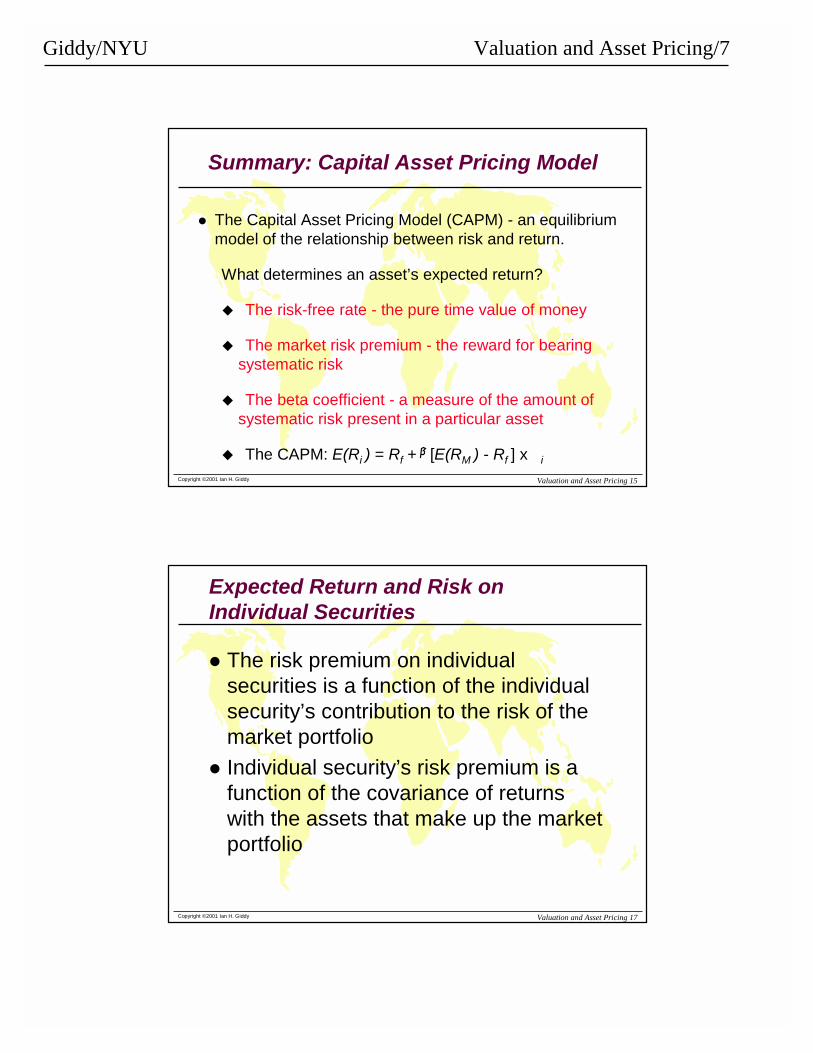
Summary: Capital Asset Pricing Model
� The Capital Asset Pricing Model (CAPM) - an equilibrium model of the relationship between risk and return.
What determines an asset’s expected return?
� The risk-free rate - the pure time value of money
� The market risk premium - the reward for bearing systematic risk
� The beta coefficient - a measure of the amount of systematic risk present in a particular asset
� The CAPM: E(Ri ) = Rf + [E(RM ) - Rf ] x i
Copyright ©2001 Ian H. Giddy Valuation and Asset Pricing 17
Expected Return and Risk on Individual Securities
� The risk premium on individual securities is a function of the individual security’s contribution to the risk of the market portfolio
� Individual security’s risk premium is a function of the covariance of returns with the assets that make up the market portfolio

Giddy/NYU Valuation and Asset Pricing/8
Copyright ©2001 Ian H. Giddy Valuation and Asset Pricing 18
Graphic Depiction of CAPM
REQUIREDRETURN
15% rjwith bj = 2.0
10% rm
5% RF
0 .50 1.0 1.5 2.0 . . .
SecurityMarketLine
Market RiskPremium: 5%
Stock’s RiskPremium: 10%
Beta (Nondiversifiable Risk)
SML = rj= .05 + ββββ j(.10-.05)Given: RF = 5%; rm = 10%
Copyright ©2001 Ian H. Giddy Valuation and Asset Pricing 19
E(r)E(r)
E(E(rrMM))rrff
SMLSML
MMßßßß = 1.0= 1.0
Security Market Line

Giddy/NYU Valuation and Asset Pricing/9
Copyright ©2001 Ian H. Giddy Valuation and Asset Pricing 20
Security Market Line
Nondiversifiable Risk, β0 .50 1.0 1.5 2.0 . . .
SML
}Market RiskPremium: 4%
Asset Z’s Risk Premium: 6%
1716151413121110
987654321
rz =
rm =
RF =
RequiredReturn, (%)
β RF β m β z
Copyright ©2001 Ian H. Giddy Valuation and Asset Pricing 21
SML Relationships
Slope of SML = E(rm) - rf
= market risk premium
E(ri) = rf + β[E(rm) - rf]
β== [COV(ri,rm)] / σm2

Giddy/NYU Valuation and Asset Pricing/10
Copyright ©2001 Ian H. Giddy Valuation and Asset Pricing 22
Sample Calculations for SML
E(rm) - rf = .08 rf = .03Xeptional Inc.βx = 1.25
E(rx) = .03 + 1.25(.08) = .13 or 13%Yknot Inc.βy = .6
E(ry) = .03 + .6(.08) = .078 or 7.8%
Copyright ©2001 Ian H. Giddy Valuation and Asset Pricing 23
E(r)E(r)
RRxx=13%=13%SMLSML
m
ßßßß1.01.0
RRmm=11%=11%RRyy=7.8%=7.8%
3%3%
xßß1.251.25
yßß.6.6
.08.08
Graph of Sample Calculations
Giddy/NYU Valuation and Asset Pricing/11
Copyright ©2001 Ian H. Giddy Valuation and Asset Pricing 28
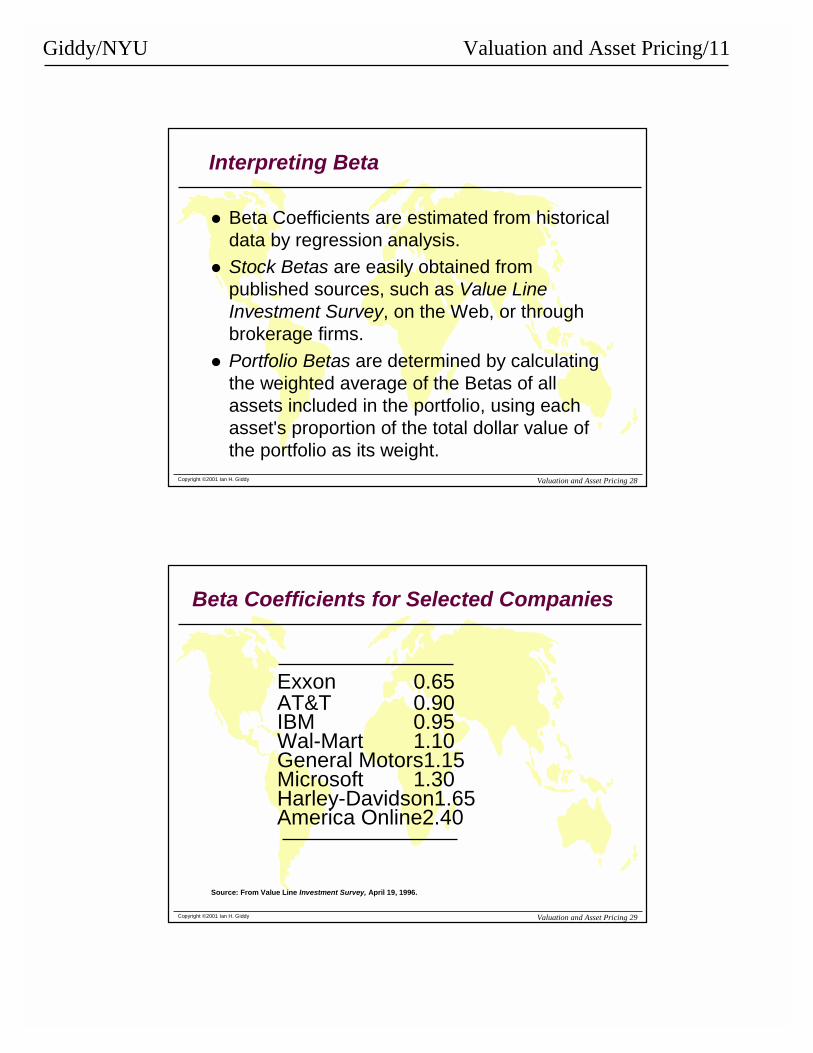
Interpreting Beta
� Beta Coefficients are estimated from historical data by regression analysis.
� Stock Betas are easily obtained from published sources, such as Value Line Investment Survey, on the Web, or through brokerage firms.
� Portfolio Betas are determined by calculating the weighted average of the Betas of all assets included in the portfolio, using each asset's proportion of the total dollar value of the portfolio as its weight.
Copyright ©2001 Ian H. Giddy Valuation and Asset Pricing 29
Beta Coefficients for Selected Companies
Exxon 0.65AT&T 0.90IBM 0.95Wal-Mart 1.10General Motors1.15Microsoft 1.30Harley-Davidson1.65America Online2.40
Source: From Value Line Investment Survey, April 19, 1996.

Giddy/NYU Valuation and Asset Pricing/12
Copyright ©2001 Ian H. Giddy Valuation and Asset Pricing 30
Disequilibrium Example
� Suppose a security with a β of 1.25 is offering expected return of 15%
� According to SML, it should be 13%� Underpriced: offering too high of a rate
of return for its level of risk
Copyright ©2001 Ian H. Giddy Valuation and Asset Pricing 31
E(r)E(r)
15%15%SMLSML
ßß1.01.0
RRmm=11%=11%
rrff=3%=3%
1.251.25
Disequilibrium Example
Giddy/NYU Valuation and Asset Pricing/13
Copyright ©2001 Ian H. Giddy Valuation and Asset Pricing 32
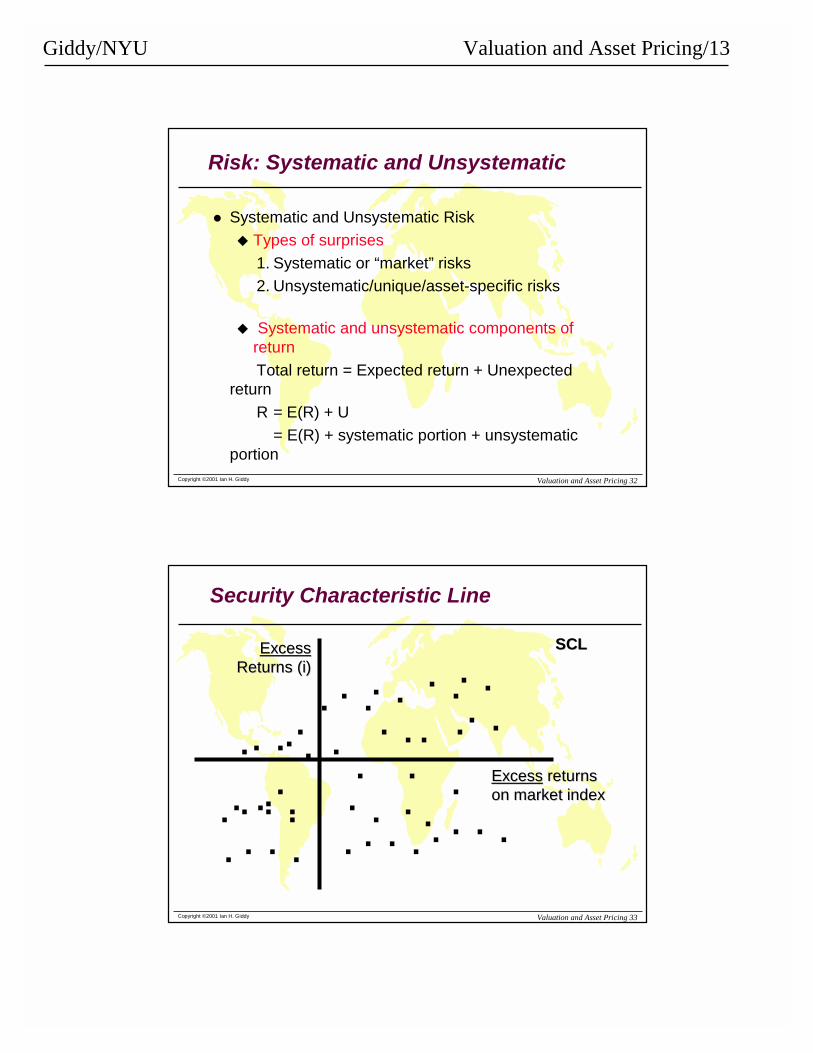
Risk: Systematic and Unsystematic
� Systematic and Unsystematic Risk� Types of surprises
1. Systematic or “market” risks2. Unsystematic/unique/asset-specific risks
� Systematic and unsystematic components of returnTotal return = Expected return + Unexpected
returnR = E(R) + U
= E(R) + systematic portion + unsystematic portion
Copyright ©2001 Ian H. Giddy Valuation and Asset Pricing 33
Security Characteristic Line
ExcessExcessReturns (i)Returns (i)
SCLSCL
..
....
. .. ... .
.. .
. ..
...
. .. ..
. ..
. .
. ..
. ..
. .
.
. ... .. .. .
ExcessExcess returnsreturnson market indexon market index
Giddy/NYU Valuation and Asset Pricing/14
Copyright ©2001 Ian H. Giddy Valuation and Asset Pricing 34
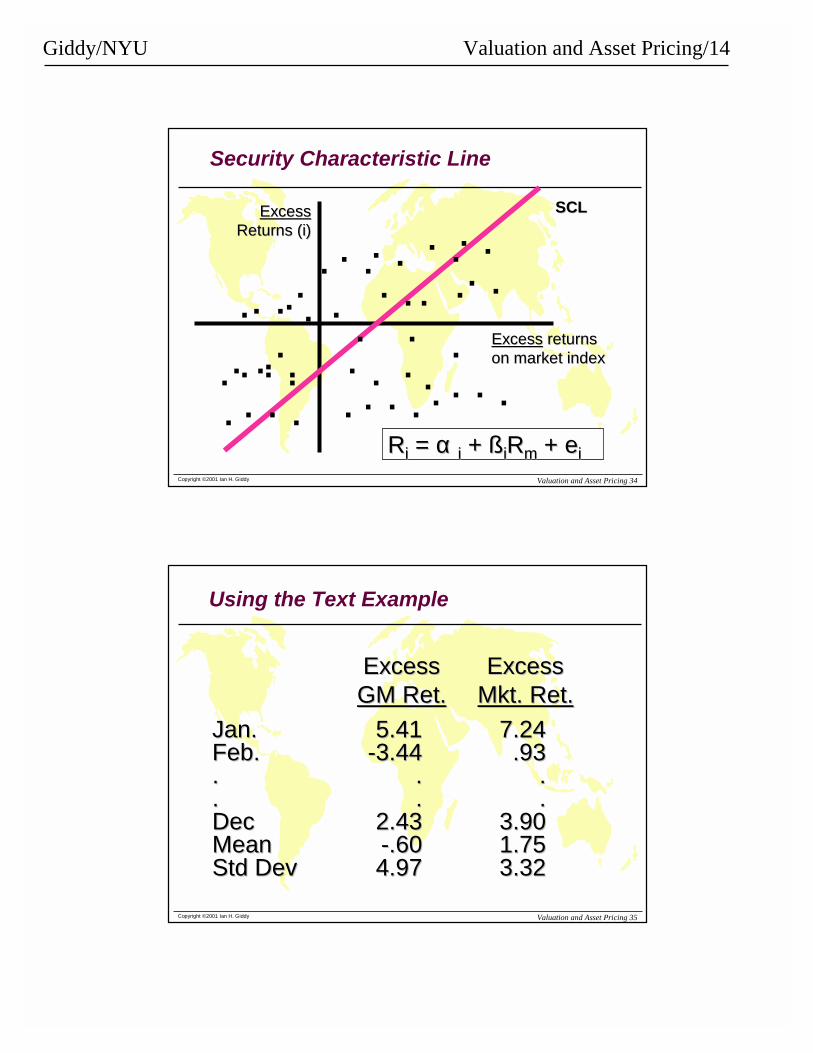
Security Characteristic Line
ExcessExcessReturns (i)Returns (i)
SCLSCL
..
....
. .. ... .
.. .
. ..
...
. .. ..
. ..
. .
. ..
. ..
. .
.
. ... .. .. .
ExcessExcess returnsreturnson market indexon market index
RRii = = αα ii ++ ßßiiRRmm ++ eeii
Copyright ©2001 Ian H. Giddy Valuation and Asset Pricing 35
Using the Text Example
Jan.Jan.Feb.Feb.....DecDecMeanMeanStd DevStd Dev
5.415.41--3.443.44
..
..2.432.43--.60.604.974.97
7.247.24.93.93
..
..3.903.901.751.753.323.32
ExcessExcessMkt. Ret.Mkt. Ret.
ExcessExcessGM Ret.GM Ret.
Giddy/NYU Valuation and Asset Pricing/15
Copyright ©2001 Ian H. Giddy Valuation and Asset Pricing 36
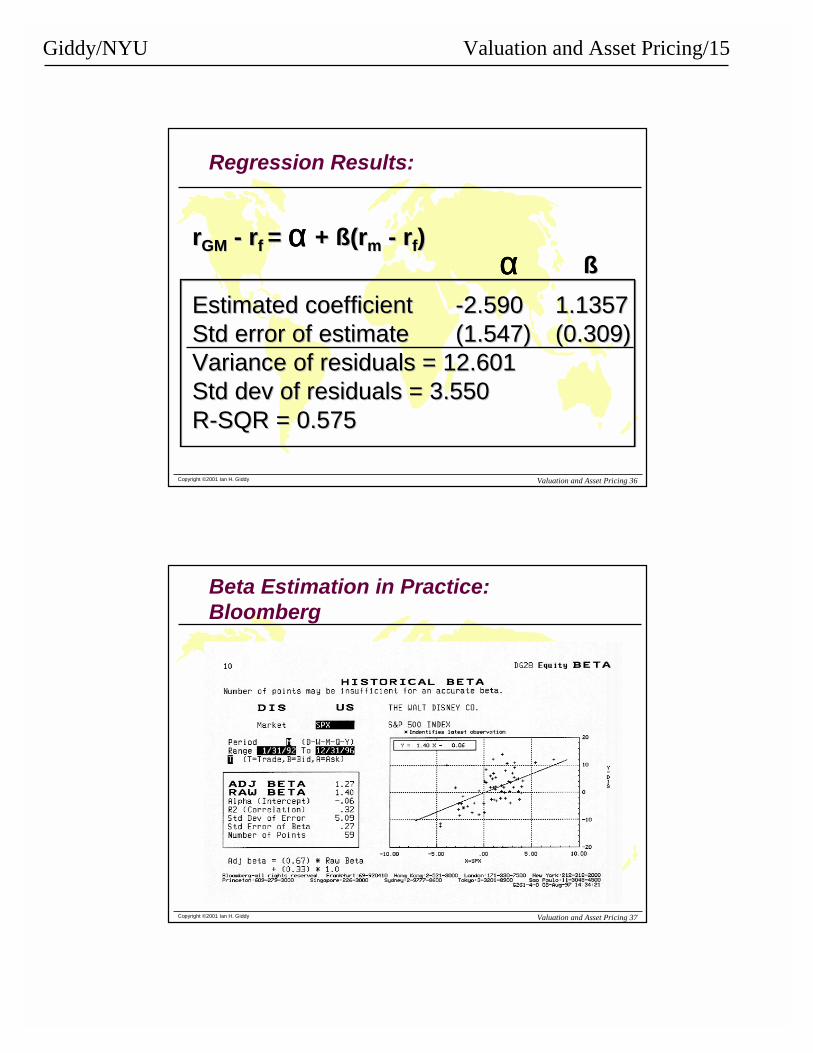
Estimated coefficientEstimated coefficientStd error of estimateStd error of estimateVariance of residuals = 12.601Variance of residuals = 12.601Std dev of residuals = 3.550Std dev of residuals = 3.550RR--SQR = 0.575SQR = 0.575
ßß--2.5902.590(1.547)(1.547)
1.13571.1357(0.309)(0.309)
rrGMGM -- rrff = + ß(= + ß(rrmm -- rrff))
Regression Results:
αααααααα
Copyright ©2001 Ian H. Giddy Valuation and Asset Pricing 37
Beta Estimation in Practice: Bloomberg
Giddy/NYU Valuation and Asset Pricing/16
Copyright ©2001 Ian H. Giddy Valuation and Asset Pricing 38
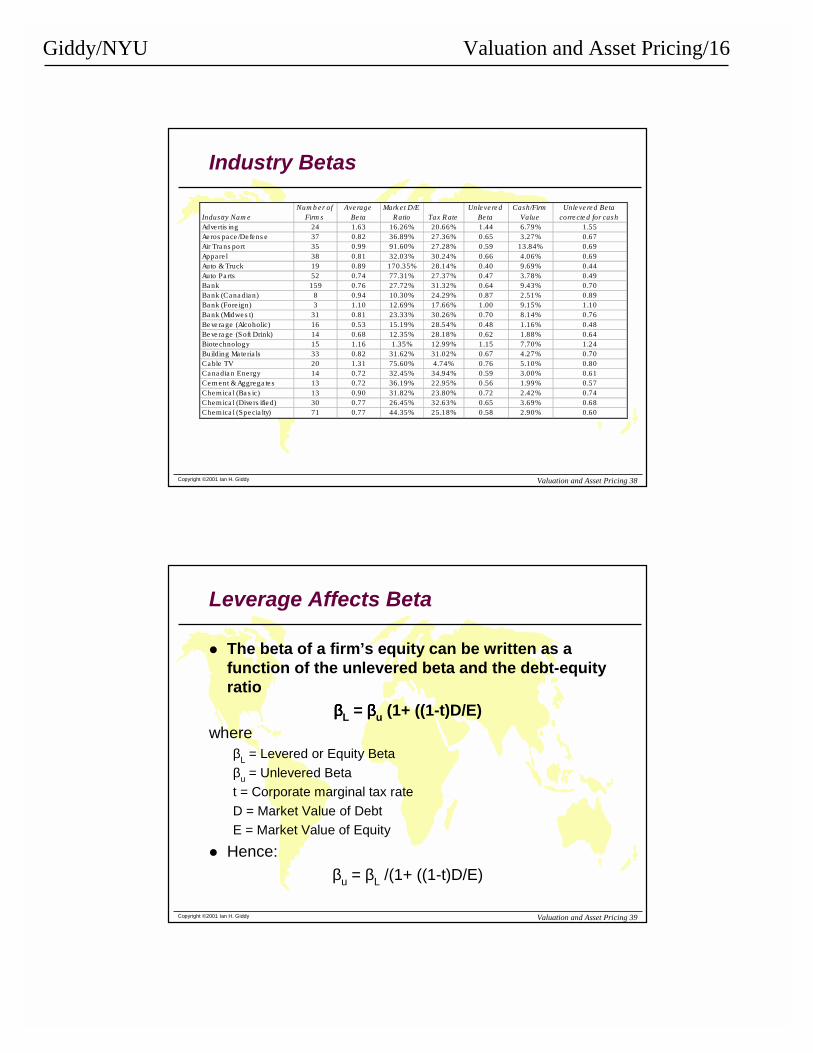
Industry Betas
Indus try Nam eNum b er of
Firm sAve rage
Be taMark e t D/E
R atio Tax R ateUnle ve re d
Be taCash/Firm
ValueUnle ve re d Be ta
corre cte d for cashAdve rtis ing 24 1.63 16.26% 20.66% 1.44 6.79% 1.55Ae ros pace /De fe ns e 37 0.82 36.89% 27.36% 0.65 3.27% 0.67Air Tra ns port 35 0.99 91.60% 27.28% 0.59 13.84% 0.69Appa re l 38 0.81 32.03% 30.24% 0.66 4.06% 0.69Auto & Truck 19 0.89 170.35% 28.14% 0.40 9.69% 0.44Auto Pa rts 52 0.74 77.31% 27.37% 0.47 3.78% 0.49Ba nk 159 0.76 27.72% 31.32% 0.64 9.43% 0.70Ba nk (Cana dia n) 8 0.94 10.30% 24.29% 0.87 2.51% 0.89Ba nk (Fore ign) 3 1.10 12.69% 17.66% 1.00 9.15% 1.10Ba nk (Midwe s t) 31 0.81 23.33% 30.26% 0.70 8.14% 0.76Be ve ra ge (Alcoholic) 16 0.53 15.19% 28.54% 0.48 1.16% 0.48Be ve ra ge (Soft Drink) 14 0.68 12.35% 28.18% 0.62 1.88% 0.64Biotechnology 15 1.16 1.35% 12.99% 1.15 7.70% 1.24Building Ma te ria ls 33 0.82 31.62% 31.02% 0.67 4.27% 0.70Ca ble TV 20 1.31 75.60% 4.74% 0.76 5.10% 0.80Ca na dia n Ene rgy 14 0.72 32.45% 34.94% 0.59 3.00% 0.61Ce m ent & Aggrega te s 13 0.72 36.19% 22.95% 0.56 1.99% 0.57Chem ica l (Ba s ic) 13 0.90 31.82% 23.80% 0.72 2.42% 0.74Chem ica l (Dive rs ifie d) 30 0.77 26.45% 32.63% 0.65 3.69% 0.68Chem ica l (Spe cia lty) 71 0.77 44.35% 25.18% 0.58 2.90% 0.60
Copyright ©2001 Ian H. Giddy Valuation and Asset Pricing 39
Leverage Affects Beta
� The beta of a firm’s equity can be written as a function of the unlevered beta and the debt-equity ratio
ββββL = ββββu (1+ ((1-t)D/E)where
βL = Levered or Equity Betaβu = Unlevered Betat = Corporate marginal tax rateD = Market Value of DebtE = Market Value of Equity
� Hence:βu = βL /(1+ ((1-t)D/E)

Giddy/NYU Valuation and Asset Pricing/17
Copyright ©2001 Ian H. Giddy Valuation and Asset Pricing 40
Betas: Leverage and Cash
Estimated BetaWith current leverage
From regression
Unlevered BetaWith no leverage
Bu=Bl/(1+D/E(1-T))
Leverage
Find cash ratioCash/Firm Value
Pure business betaBp=Bu/(1-CR)
Cash
Copyright ©2001 Ian H. Giddy Valuation and Asset Pricing 41
Estimating Expected Returns: September 30, 1997
� Disney’s Beta = 1.40� Riskfree Rate = 7.00% (Long term
Government Bond rate)� Risk Premium = 5.50% (Approximate
historical premium)� Expected Return = 7.00% + 1.40
(5.50%) = 14.70%
Giddy/NYU Valuation and Asset Pricing/18
Copyright ©2001 Ian H. Giddy Valuation and Asset Pricing 42
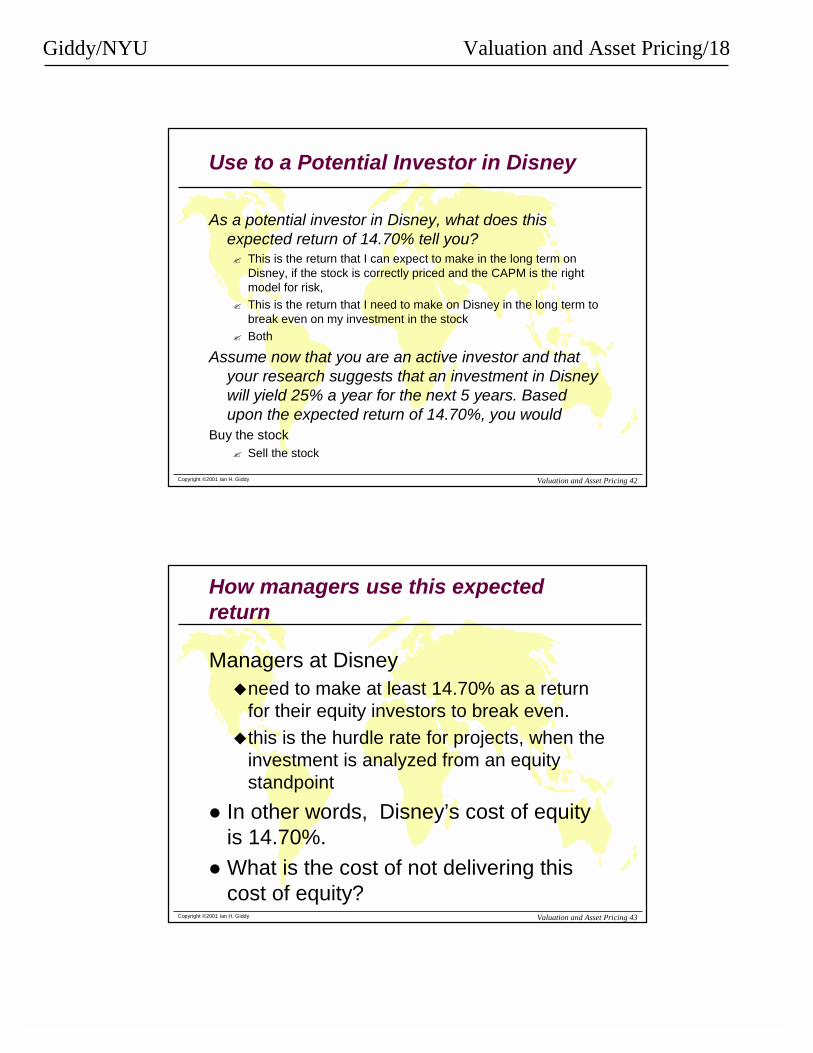
Use to a Potential Investor in Disney
As a potential investor in Disney, what does this expected return of 14.70% tell you?� This is the return that I can expect to make in the long term on
Disney, if the stock is correctly priced and the CAPM is the right model for risk,
� This is the return that I need to make on Disney in the long term to break even on my investment in the stock
� Both
Assume now that you are an active investor and that your research suggests that an investment in Disney will yield 25% a year for the next 5 years. Based upon the expected return of 14.70%, you would
Buy the stock� Sell the stock
Copyright ©2001 Ian H. Giddy Valuation and Asset Pricing 43
How managers use this expected return
Managers at Disney�need to make at least 14.70% as a return
for their equity investors to break even.�this is the hurdle rate for projects, when the
investment is analyzed from an equity standpoint
� In other words, Disney’s cost of equity is 14.70%.
� What is the cost of not delivering this cost of equity?

Giddy/NYU Valuation and Asset Pricing/19
Copyright ©2001 Ian H. Giddy Valuation and Asset Pricing 44
Beta Differences: A Look Behind Betas
Beta = 1Average Stock
Beta > 1
Beta < 1
Above-average Risk
Below-average RiskGovernment bonds:Beta = 0
Exxon: Beta=0.65: Oil price Risk may not be market risk
General Electric:Beta = 1.15: Multiple Business Lines
Low Risk
High Risk
Microsoft:Beta = 0.95: Size has its advantages
America Online: Beta = 2.10: Operates in Risky Business
BETA AS A MEASURE OF RISK
Time Warner: Beta = 1.45: High leverage is the reason
Philip Morris:Beta = 1.05: Risk from Lawsuits ????
Oracle: Beta = 0.45: Betas are just estimates
Copyright ©2001 Ian H. Giddy Valuation and Asset Pricing 45
What’s the Beta of a Portfolio?
Giddy/NYU Valuation and Asset Pricing/20
Copyright ©2001 Ian H. Giddy Valuation and Asset Pricing 46
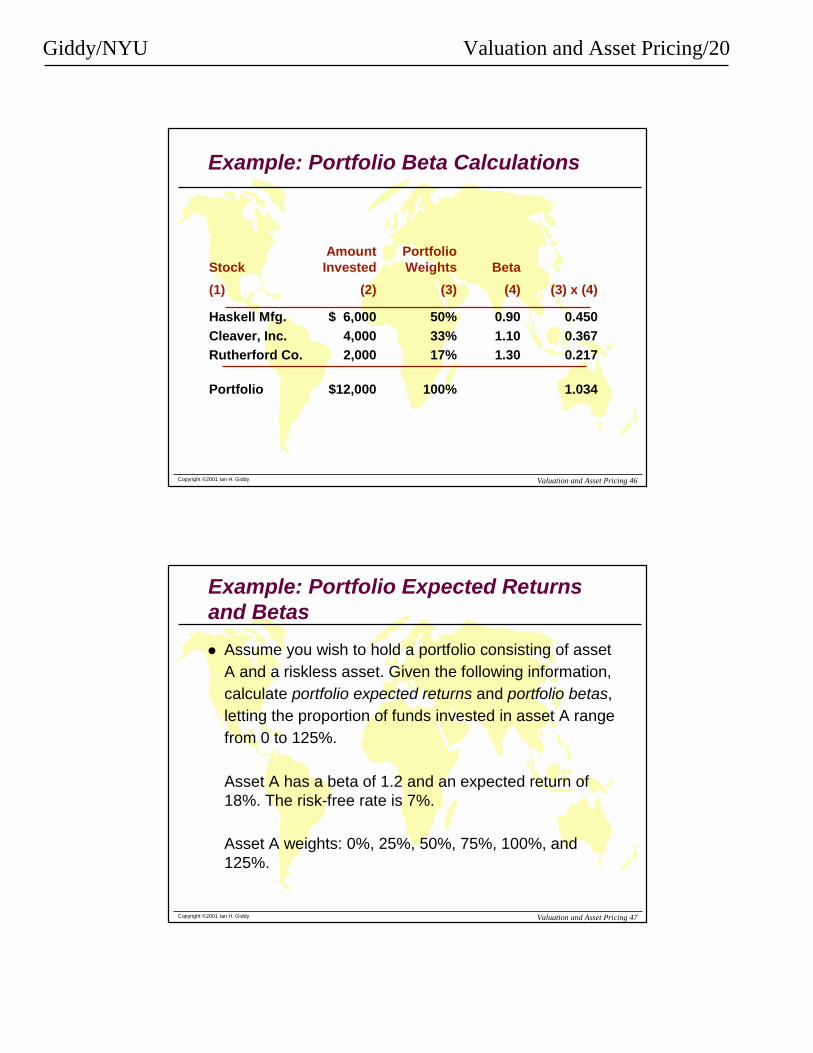
Example: Portfolio Beta Calculations
Amount PortfolioStock Invested Weights Beta(1) (2) (3) (4) (3) x (4)
Haskell Mfg. $ 6,000 50% 0.90 0.450Cleaver, Inc. 4,000 33% 1.10 0.367Rutherford Co. 2,000 17% 1.30 0.217
Portfolio $12,000 100% 1.034
Copyright ©2001 Ian H. Giddy Valuation and Asset Pricing 47
Example: Portfolio Expected Returns and Betas� Assume you wish to hold a portfolio consisting of asset
A and a riskless asset. Given the following information, calculate portfolio expected returns and portfolio betas, letting the proportion of funds invested in asset A range from 0 to 125%.
Asset A has a beta of 1.2 and an expected return of 18%. The risk-free rate is 7%.
Asset A weights: 0%, 25%, 50%, 75%, 100%, and 125%.

Giddy/NYU Valuation and Asset Pricing/21
Copyright ©2001 Ian H. Giddy Valuation and Asset Pricing 48
Example: Portfolio Expected Returns and Betas (concluded)
Proportion Proportion PortfolioInvested in Invested inExpected Portfolio
Asset A (%) Risk-free Asset (%) Return (%) Beta
0 100 7.00 0.0025 75 9.75 0.3050 50 12.50 0.6075 25 15.25 0.90
100 0 18.00 1.20125 -25 20.75 1.50
Copyright ©2001 Ian H. Giddy Valuation and Asset Pricing 49
Summary: CAPM Equilibrium
� Investors, in the aggregate, hold the market portfolio.
� The market porfolio will be on the efficient frontier and will be the optimal risky portfolio. All investors hold the same risky portfolio (M), adding T-bills to their portfolios to obtain desired risk levels
� The risk premium on the market portfolio is proportional to the variance of the market portfolio and the degree of risk aversion of investors.
Giddy/NYU Valuation and Asset Pricing/22
Copyright ©2001 Ian H. Giddy Valuation and Asset Pricing 51
Resulting Equilibrium Conditions
� All investors will hold the same portfolio for risky assets – market portfolio
� Market portfolio contains all securities and the proportion of each security is its market value as a percentage of total market value
Copyright ©2001 Ian H. Giddy Valuation and Asset Pricing 52
� Risk premium on the market depends on the average risk aversion of all market participants
� Risk premium on an individual security is a function of its covariance with the market
Resulting Equilibrium Conditions (cont.)
Giddy/NYU Valuation and Asset Pricing/23
Copyright ©2001 Ian H. Giddy Valuation and Asset Pricing 55
Some Comments on CAPM
� Since Beta coefficients are derived from historical data, they are best viewed as approximations of future expectations of actual risk-return behavior.
� CAPM is based upon an assumed efficient market which, although seemingly unrealistic, is supported empirically in active markets such as the New York Stock Exchange.
� While CAPM is not applicable to all assets, it does provide a conceptual framework that is useful in linking risk and return in financial decisions.
Copyright ©2001 Ian H. Giddy Valuation and Asset Pricing 56
Arbitrage Pricing Theory
Arbitrage - arises if an investor can construct a zero investment portfolio with a sure profit
� Since no investment is required, an investor can create large positions to secure large levels of profit
� In efficient markets, profitable arbitrage opportunities will quickly disappear

Giddy/NYU Valuation and Asset Pricing/24
Copyright ©2001 Ian H. Giddy Valuation and Asset Pricing 57
Arbitrage Example from Text
Current ExpectedStandardStock Price$ Return% Dev.%A 10 25.0 29.58B 10 20.0 33.91C 10 32.5 48.15D 10 22.5 8.58
Copyright ©2001 Ian H. Giddy Valuation and Asset Pricing 58
Arbitrage Portfolio
Mean S.D. Correlation
PortfolioA,B,C 25.83 6.40
0.94Dreck 22.25 8.58

Giddy/NYU Valuation and Asset Pricing/25
Copyright ©2001 Ian H. Giddy Valuation and Asset Pricing 59
Arbitrage Action and Returns
E. Ret.E. Ret.
St.Dev.St.Dev.
* P* P* D* D
Short 3 shares of D and buy 1 of A, B & C to Short 3 shares of D and buy 1 of A, B & C to form Pform P
You earn a higher rate on the investment You earn a higher rate on the investment than you pay on the short salethan you pay on the short sale
Copyright ©2001 Ian H. Giddy Valuation and Asset Pricing 60
Security Characteristic Line
ExcessExcessReturns (i)Returns (i)
SCLSCL
..
....
. .. ... .
.. .
. ..
...
. .. ..
. ..
. .
. ..
. ..
. .
.
. ... .. .. .
ExcessExcess returnsreturnson market indexon market index
RRii = = αα ii ++ ßßiiRRmm ++ eeii

Giddy/NYU Valuation and Asset Pricing/26
Copyright ©2001 Ian H. Giddy Valuation and Asset Pricing 61
The APT
A regression
rj - rF = αα j + βj (rm - rF) + ej
Diversification can get rid of theunsystematic errors
Arbitrage ensures Alpha’s are zero
Copyright ©2001 Ian H. Giddy Valuation and Asset Pricing 62
The APT
A regression
rj - rF = βj (rm - rF)

Giddy/NYU Valuation and Asset Pricing/27
Copyright ©2001 Ian H. Giddy Valuation and Asset Pricing 63
The APT
A regression
rj = rF + βj (rm - rF)
Copyright ©2001 Ian H. Giddy Valuation and Asset Pricing 64
The APT
CAPM
rj = RF + βj (rm - RF)APT
rp = RF + βp (rm - RF)Multifactor APTrp = RF + βp1 (rp1 - RF) + βp2 (rp2 - RF)
Giddy/NYU Valuation and Asset Pricing/28
Copyright ©2001 Ian H. Giddy Valuation and Asset Pricing 65
APT and CAPM Compared
� APT applies to well diversified portfolios and not necessarily to individual stocks
� With APT it is possible for some individual stocks to be mispriced - not lie on the SML
� APT is more general in that it gets to an expected return and beta relationship without the assumption of the market portfolio
� APT can be extended to multifactor models
Copyright ©2001 Ian H. Giddy Valuation and Asset Pricing 80
Diversification and Asset Pricing: Summary
� Investors diversify, because you get a better return for a given risk.
� There is a fully-diversified “market portfolio” that we should all choose
� The risk of an individual asset can be measured by how much risk it adds to the “market portfolio”
� The CAPM tells us how the required return relates to the relevant risk.

Giddy/NYU Valuation and Asset Pricing/29
Copyright ©2001 Ian H. Giddy Valuation and Asset Pricing 81
Summary of Risk and Return
I. Total risk - the variance (or the standard deviation) of an asset’s return.
II. Total return - the expected return + the unexpected return.III. Systematic and unsystematic risks
Systematic risks are unanticipated events that affect almost all assets to some degree.Unsystematic risks are unanticipated events that affect single assets or small groups of assets.
IV.The effect of diversification - the elimination of unsystematic risk via the combination of assets into a portfolio.
V. The systematic risk principle and beta - the reward for bearing risk depends only on its level of systematic risk.
VI.The reward-to-risk ratio - the ratio of an asset’s risk premium to its beta.
VII. The capital asset pricing model: E(Ri) = Rf + Betai [E(RM) - Rf].
Copyright ©2001 Ian H. Giddy Valuation and Asset Pricing 85
Contact
Prof. Ian H. GiddyNYU Stern School of BusinessTel 212-998-0426; Fax [email protected]://giddy.org