Validation using 3D CT of the new interpretation of ...
83
Validation using 3D CT of the new interpretation of Gerasimov’s nasal projection method for forensic facial approximation by Geneviève Maltais Lapointe A Thesis submitted to the Faculty of Graduate Studies of The University of Manitoba in partial fulfilment of the requirements of the degree of MASTER OF ARTS Department of Anthropology University of Manitoba Winnipeg Copyright © 2013 by Geneviève Maltais Lapointe
Transcript of Validation using 3D CT of the new interpretation of ...

Validation using 3D CT of the new interpretation of Gerasimov’s nasal projection
method for forensic facial approximation
by
Geneviève Maltais Lapointe
A Thesis submitted to the Faculty of Graduate Studies of
The University of Manitoba
in partial fulfilment of the requirements of the degree of
MASTER OF ARTS
Department of Anthropology
University of Manitoba
Winnipeg
Copyright © 2013 by Geneviève Maltais Lapointe

ii
ABSTRACT
Approximating the facial features for forensic facial approximation is challenging,
especially the nose. Numerous methods have been published to position the tip of the
nose in profile with variable results. Gerasimov’s two-tangent method is the most
commonly used. However, a recent article published by Ullrich and Stephan (2011) states
that the method was not properly performed and provides new guidelines. This research
used a sample of CT scans from a Denmark population (N=66) to determined which of
Gerasimov’s literal translation or Ullrich and Stephan’s (2011) new version of the two-
tangent method is the most accurate. A combination of the two methods was also
evaluated to determine the effect of each tangent independently, and the effect of
intraobserver error. It was determine that the new guidelines result in smaller mean
difference but no method can accurately position the tip of the nose due to the lack of
experience from the practitioner.

iii
ACKNOWLEDGEMENTS
A great thank you to my supervisor Dr. Rob Hoppa for his insight and support
through the completion of this thesis. You are an invaluable supervisor. Thank you to the
two other members of my committee who provided constructive suggestions and
comments, Dr. Todd Garlie and Dr. Stacie Burke.
I want to recognize the financial support in completing this research from the
Social Sciences and Humanities Research Council of Canada, and the University of
Manitoba.
Finally, to my parents – thank you for your support and encouragement every step
of the way. Despite the distance you are always there for me and this could not have
happened without you.

iv
TABLE OF CONTENTS
ABSTRACT....................................................................................................................... ii ACKNOWLEDGEMENTS ............................................................................................ iii
TABLE OF CONTENTS ................................................................................................ iv LIST OF TABLES ............................................................................................................ v
LIST OF FIGURES ......................................................................................................... vi INTRODUCTION ............................................................................................................ 1
LITERATURE REVIEW ................................................................................................ 5 History of facial approximation................................................................................... 7 Russian/Anatomical method ........................................................................................ 9 American/Tissue depth method................................................................................. 10 Manchester/Combination method............................................................................. 13 Facial features ............................................................................................................. 14 Nasal projection method............................................................................................. 17 CT and facial approximation..................................................................................... 22 Gerasimov’s two-tangent method.............................................................................. 24
MATERIALS .................................................................................................................. 26
METHODS ...................................................................................................................... 30 Nasal projection testing .............................................................................................. 35 Additional variables.................................................................................................... 40 Intraobserver error..................................................................................................... 41
RESULTS ........................................................................................................................ 42 Repeated-measures ANOVA...................................................................................... 47 One sample t-test......................................................................................................... 49 Additional analysis...................................................................................................... 51
DISCUSSION/CONCLUSION...................................................................................... 53 Tangent selection......................................................................................................... 54 Nasal projection methods ........................................................................................... 56 Intraobserver error..................................................................................................... 58 Outliers......................................................................................................................... 59 General discussion ...................................................................................................... 61 Future directions......................................................................................................... 65 Conclusion ................................................................................................................... 67
LITERATURE CITED .................................................................................................. 71

v
LIST OF TABLES
Table 1: Four tangent combinations ................................................................................. 37 Table 2: Pairwise comparison distance from reference point 1........................................ 47 Table 3: Pairwise comparison distance from reference point 2........................................ 48 Table 4: Repeated-measures ANOVA, difference X and Y ............................................. 49 Table 5: T-test of differences (test value = 0)................................................................... 50 Table 6: T-test of absolute distance (test value = 0) ......................................................... 51 Table 7: Independent samples t-test for sex...................................................................... 52 Table 8: Comparison of mean differences (mm) .............................................................. 57 Table 9: Summary of the data........................................................................................... 69

vi
LIST OF FIGURES
Figure 1: Excluded scan, nasal soft tissue distortion ........................................................ 27 Figure 2: Excluded scan, missing nasal soft tissue ........................................................... 27 Figure 3: Excluded scan, damaged nasal bone. ................................................................ 28 Figure 4: Age histogram male and female........................................................................ 29 Figure 5: DICOM file with CT scan views....................................................................... 30 Figure 6: Soft and hard tissue mask.................................................................................. 31 Figure 7: 3D model of skull with Nasion and measurement ............................................ 32 Figure 8: 3D model of soft and hard tissue....................................................................... 32 Figure 9: Image A (not to scale) with scaling guides ....................................................... 34 Figure 10: Position and size numbers after scaling .......................................................... 34 Figure 11: Cartesian axis and reference point................................................................... 35 Figure 12: Nasal projection tangents ................................................................................ 37 Figure 13: Reference points .............................................................................................. 37 Figure 14: Scatterplot Method 1 ....................................................................................... 43 Figure 15: Scatterplot Method 2 ....................................................................................... 43 Figure 16: Scatterplot Method 3 ....................................................................................... 44 Figure 17: Scatterplot Method 4 ....................................................................................... 44 Figure 18: Nasal tip position from differences and quadrants.......................................... 45 Figure 19: Boxplots of absolute distance from Ref point 1 .............................................. 46 Figure 20: Boxplots of absolute distance from Ref point 2 .............................................. 46 Figure 21: Direction of error from tangents...................................................................... 55 Figure 22: Nasal bone of Individual 09011340 ................................................................ 59 Figure 23: Tangent placement for individual 09011340................................................... 59 Figure 24: Additional example of modified tangent......................................................... 60

1
INTRODUCTION
The discovery of human remains necessitates an investigation to establish if they
are archaeological or of forensic significance. In situations where the remains are deemed
forensically significant, law enforcement officials have the duty to identify the individual
and determine the circumstances surrounding his/her death. In some cases the remains are
found in a state of extreme decomposition or are completely skeletonised. This hinders
the ability to provide a positive identification for the remains. In such scenarios,
investigators will often use methods that rely on the comparison of antemortem to
postmortem records of the individual. These include fingerprinting, dental records and/or
a genetic profile depending on the state of the remains. However, the process requires
that law enforcement has a putative identification to request any available antemortem
records. If there is no presumed identity, the expertise of the forensic anthropologist can
be used to create a biological profile. The anthropologist uses osteological knowledge
and techniques generally accepted in the scientific community as accurate to estimate the
age, sex, ancestry and stature of the individual. However, the biological profile does not
equate to a positive identification but is an important and useful tool to create more
specific investigative leads by narrowing down the search for a positive match.
In situations where a large number of cases match a single biological profile, the
police can use forensic facial approximation, which refers to the process of applying clay
to the skull or replica of the skull to produce an estimate of the visage. A forensic or
medical artist uses the information contained in the anthropologist’s biological profile
(age, sex, ancestry) to choose the appropriate guidelines and methods to approximate the
face. The resulting face is widely published in the media with the hope that a friend or

2
family member will recognize the individual. Forensic anthropologists and other
practitioners emphasize that forensic facial approximation is not a method of positive
identification but merely a tool used to generate leads (Snow et al., 1970; George, 1987;
Rhine, 1990; Tyrrell et al., 1997; Fernandes et al., 2012).
Despite the fact that the process of facial approximation, based on a presumed
relationship between the hard and soft tissue, has been criticized by many as being
impossible (Suk, 1935; Montagu, 1947; Brues, 1958), many researchers have tried to
evolve the process to be more accurate and precise, and to prove the existence of tissue
correlation. Published tables of soft tissue thicknesses have changed over time from
focusing on white Europeans (Welcker, 1883; His, 1895; Kollmann and Büchly, 1898) to
incorporating a wide range of different population groups including South African black,
South African mixed and Chinese (Phillips and Smuts, 1996; Cavanagh and Steyn, 2011;
Chen et al., 2011). Facial approximation practitioners and biological anthropologist are
continuously working toward improving traditional techniques and developing new
techniques to more accurately portray different facial features. Finally, the scientific
community is continually trying to improve its understanding of the relationship between
the soft tissue of the face and the underlying bony structure.
A facial approximation based on accurate soft-tissue tables and craniofacial
interrelationship is not considered successful until it is recognized. The facial recognition
process is complex and is influenced by familiarity, the interrelationship between the
facial features and the overall shape of the face (Bruce and Young, 1998; Starbuck and
Ward, 2007). The eyes, mouth and nose are important features for recognition (Briggs
and Martakis, 1998). Helmer et al. (1993) compared two facial approximations of the

3
same individual and concluded that the nose, as well as the mouth and eyes, can be
reconstructed reliably, which is a conclusion also supported by Wilkinson et al. (2006).
The shape, size and projection of the nose are the most important for a profile and three-
quarter view of the face. In addition, the external nose is mainly composed of cartilages
that rarely survive intense decomposition, making this facial feature difficult to
approximate. Many guidelines used to predict nasal projection were initially based on a
presumed relationship between the soft and hard tissues of the face (Stephan, 2003), and
research on the accuracy of the different methods to predict the position of the tip of the
nose are inconsistent. The validation studies, including the most commonly used method,
the two-tangent method, also provided inconsistent results (Stephan et al., 2003; Rynn
and Wilkinson, 2006; López et al., 2010; Rynn et al., 2010) and have also been criticized
for being performed incorrectly (Ullrich and Stephan, 2011).
The two-tangent method is a simple and quick way to determine nasal projection
and was the first guideline ever published (Gerasimov, 1971). However, there is a clear
need for more research to understand why the accuracy results are inconsistent and to
validate recently published claim (Ullrich and Stephan, 2011). Therefore the main goal of
my research is to investigate how the two-tangent method should be performed in order
to provide the most accurate nasal projection. To do so the two-tangent method, as
initially tested by Stephan et al. (2003), Rynn and Wilkinson (2006), López et al. (2010)
and Rynn et al. (2010) will be compared to the new method outlined by Ullrich and
Stephan (2011) to determine which one produces an approximation of the nose that most
accurately reflects an individual’s true nose. Two additional two-tangent methods with
combined tangent definition are also compared to better understand discrepancies in the

4
positioning of the nasal tip. Finally, there is a debate about the definition of the true nose,
either defined according to the nasal spine line or the Frankfurt Horizontal plane (Rynn
and Wilkinson, 2006). As a result, the accuracy of the method to approximate both
definitions of the true nose will be evaluated. The research contributes to the forensic
facial approximation literature by validating the recent claim made by Ullrich and
Stephan (2011) that the current nasal projection validation studies are inadequate and
filling a gap in knowledge about what affects the placement of nasal projection.
The first section of this research is meant to provide an overview of the current
literature in the field of forensic facial approximation. It starts with a brief historical
perspective and a review of the three main schools of thought to better understand the
current research trend and gap in knowledge. This is followed with a summary of the
existing nasal projection method and the use of computed tomography (CT) scans with an
emphasis on Gerasimov’s two-tangent method. The next two sections describe the sample
and present the methodology, including the statistical analysis used to answer the
research questions. These sections include a detailed step-by-step summary to allow for
repeatability by other researchers. The results of the different statistical procedures
performed on the recorded data are then presented. The discussion section explores the
meaning of the statistical analysis in relation to the purpose of the research and highlights
which tangents and overall methods result in less error, the effect of the experience of the
practitioner, and discusses the presence of outliers in the data. In addition, there is a
general discussion that places the results of this research within the broader forensic
facial approximation literature. Finally, a few pages are dedicated to summarizing the
research and conclusions reached.

5
LITERATURE REVIEW
During the last century, the process of applying clay to the skull or replica of the
skull to produce a face has been referred to by researchers using different terms
including; facial restoration, reconstruction, reproduction, reconstitution, and
approximation. The terms most commonly used are facial reconstruction and facial
approximation. However, Rhine (1990) rightfully argued that several terms have more
than one meaning and are used to describe other processes. For example, the term
reconstruction is most commonly used in anthropology to refer to the reassembly of
skeletal parts from broken pieces. As a result, he recommends the adoption of the term
facial reproduction because it is not used to refer to other processes within the fields of
forensics, anthropology or medicine (Rhine, 1990). On the other hand, George (1987)
explained that the term reproduction implies a perfect copy, which is not possible, and
that the term approximation is more appropriate. In recent years, these different terms
have been replaced by the term approximation by a several researchers in the field
(Stephan, 2002a; Davy-Jow et al., 2012; Guyomarc’h et al., 2012), and is the term used in
this research.
Facial approximation is based on the premise that there is a predictable
relationship between the soft and hard tissues of the face, which allow the practitioner to
approximate the visage of the individual from the skull. Forensic anthropologists and
other practitioners emphasize that the face resulting from forensic facial approximation
cannot be use to claim a positive identification but is a tool used for recognition and to
generate investigative leads (Snow et al., 1970; George, 1987; Rhine, 1990; Tyrrell et al.,
1997; Fernandes et al., 2012). The use of scientific approximation of faces for this

6
purpose has been carried out since the end of the 19th century with a varying degree of
success (Verzé, 2009). The Russian anthropologist Mikhail Gerasimov (1907-1970) was
one of the first to develop guidelines for facial approximation (Verzé, 2009) and claimed
a success rate of 100% (Helmer et al., 1993). On the other hand, research and case studies
from the end of the 20th century did not perform as well (Reichs and Craig, 1998).
Nevertheless, the scientific community continued working toward developing better
techniques to predict facial features, collecting more soft tissue depth data, better
understanding of its relationship with the under laying hard tissue, and improving
methods to evaluate the success of facial approximations.
The different methods of forensic facial approximation can be divided into
manual and computerized techniques and can be applied to both two-dimensional and
three-dimensional approximations. The computerized approximation techniques were
initially developed to remove the perceived subjectivity introduced by the forensic artist
(Wilkinson, 2004). However, the computerized approaches require manual intervention,
such as choosing the facial templates, features, and sculptural distortions, thereby greatly
inhibiting the goal of decreasing subjectivity (Wilkinson, 2005). The computerized
methodology for facial approximation will not be discussed in this study since the
process is based on the same theories dictating the manual approaches (Claes et al.,
2010). The following section will provide a detailed review of the three most prominent
schools of thought in the field of facial approximation. There will be a discussion of the
two main critiques related to approximating the shape and position of the different facial
features: the lack of standardization and the unpredictability of subtle facial features
(George, 1987; 1993; Helmer et al., 1993; Reichs and Craig, 1998; Stephan, 2005).

7
Finally, there will be an in-depth review of the existing methods to predict the position of
the tip of nose and a review of the previous research testing the accuracy of these
methods with a focus on Gerasimov’s work.
History of facial approximation
The anatomist Hermann Welcker was the first to study the relationship between
the soft and hard tissues of the face with the goal of improving the process of facial
[approximation]. In 1883, Welcker measured the soft tissue thickness using a thin blade
(Tyrrell et al., 1997). Similarly, in 1895, the German anatomist Wilhelm His used a thin
sharp needle with a piece of rubber. The facial soft tissue thickness of cadavers was
measured from the displaced rubber when pushed into the soft tissue at a right angle with
the bone (Krogman and İşcan, 1986). The data was used to perform the facial
approximation of the famous composer Johann Sebastian Bach (Wilkinson, 2004). In
1898, following His and Welcker’s steps, the anatomist Julius Kollman added to the
existing soft tissue data by measuring the soft tissue thickness of 99 women and 46 men
(Prag and Neave, 1997). In 1899, Kollman, with the help of the sculptor W. Büchly,
recreated the face of a Stone-Age woman from Auvenier, France (Wilkinson, 2004). This
is considered the first scientific approximation because it used the soft tissue data from a
large sample and Kollman provided technical guidelines to the sculptor.
The facial approximations of historical individuals, including Bach by His (1895)
and Dante by Kollman (1898), were compared to existing portraits and the identification
confirmed from the likenesses (Verzé, 2009). However, in 1913, the anthropologist
Heinrich Von Eggeling devised an experiment to objectively test the likeness of the
approximations with results opposite to previous approximations (Eggeling, 1913). The

8
double blind study resulted in no resemblance and consequently, many people believed
the process was unreliable (Prag and Neave, 1997). Since then, there have been
differences in opinion on the value of facial approximation as an aid to identification, as
well as debates on the validity of the claim that the under laying hard tissue can help
determine the facial soft tissue. Suk (1935), Montagu (1947) and Brues (1958) were
among the first to criticize the process. Suk (1935) believed that it was a great mistake to
think that there was a correlation between the facial features and the underlying skeletal
structure. Similarly, Montagu (1947) emphasized that it is impossible to reconstruct the
facial features, skin creases and facial expression, and that accurate reconstructions are
highly improbable. Brues (1958:562) concluded that facial approximation “is probably
best left to the ample literature of detective fiction.”
Despite these negative reviews, starting in the 1920s, Gerasimov worked on a
technique for facial approximation (Wilkinson, 2004). He created what is referred to as
the ‘Russian method’, which emphasized the need to model the facial muscles on the
skull (Gerasimov, 1971). It was not until 1946 that the American anthropologist Wilton
Krogman proposed different guidelines for facial approximation using facial tissue depth
data (Wilkinson, 2004). The forensic anthropologist Clyde Snow and medical artist Betty
Pat Gatliff developed what is now known as the ‘American method’ based on the work of
Krogman (Snow et al., 1970). The American method involves the use of tables of average
facial soft tissue thickness data (Krogman and İşcan, 1986). Finally, the ‘UK Manchester’
method was developed by British medical artist Richard Neave, which combines the
Russian and the American method (Prag and Neave, 1997). For each approach, the

9
individual’s sex, age, ancestry, body build, and other anatomical peculiarities need to be
determined first by the anthropologist.
Russian/Anatomical method
The first school of thought/approach, based on Gerasimov’s work, is known as the
Russian or anatomical method. The terms Russian and anatomical are used
interchangeably to describe the modern facial approximation approach where the
musculature of the face, as well as other soft tissue structures are built on the skull
without the help of average soft tissue depths (Stephan, 2006). The method is based on
the theory that the skull provides enough information on the origins and insertions of the
facial muscles to allow each muscle to be accurately reproduced. As a result, the forensic
artist requires extensive training and experience with human anatomy or to work in close
collaboration with a specialist in human anatomy (Taylor, 2001). Gerasimov is
considered to be the originator/founder of this muscle-by-muscle approach (Taylor,
2001). However, the anatomical method, as currently used, is not the same as
Gerasimov’s initial approach. The traditional Russian method does not require that the
whole facial musculature be reproduced accurately. Gerasimov simply states: “There is
no doubt that the masticatory muscles can be accurately reconstructed. They are highly
individual in size, volume and shape so that their form can be in each particular case
determined from the skull” (Gerasimov, 1971:53). Stephan (2006) reports that Gerasimov
only included the masseter and temporalis muscles on each side for his facial
approximations.
The traditional Russian method is divided into two stages: 1) The reproduction of
the head itself, where the most important masticatory, neck and shoulder muscles are

10
reconstructed, and 2) The modeling of the facial features, which necessitates special
training and extensive experience (Gerasimov, 1971). According to Gerasimov (1971),
the nasal bone, the shape of the piriform aperture and the “character” of the upper jaw
provides the most important information for the reconstruction of the nose. Similarly, the
alveolar portion of the upper jaw, the width of the dental arch, and the morphology of the
teeth determine the shape of the mouth. The details of the eyes are highly associated with
ancestry and the muscles surrounding the eyes. Finally, Gerasimov (1971) explained that
the mastoid process, the direction of the ascending ramus, the auditory meatus and the
temporal bone are important for reconstructing the external ear. However, the details of
the ear have to be intuitively reconstructed. Gerasimov reported that his method has been
successful in all of his 140 forensic cases (Helmer et al., 1993).
American/Tissue depth method
The second approach is the American or tissue depth method, which relies on
tables of average soft-tissue depths from specific age, sex and ethnic groups to build the
face of the deceased. The appropriate soft-tissue depth table is selected using the
information on age, sex and ancestry provided by the anthropologist (Gatliff and Snow,
1979). Rubber cylinders are cut to the average soft tissue thickness and glued to the skull
at specific bony landmarks. Strips of modeling clay the thickness of the tissue depth
markers are then use to connect the bony landmarks. Finally, the remaining open spaces
are filled with clay maintaining the average thickness (Gatliff, 1984). After the clay has
been applied to the skull, the location, size and shape of the facial features are measured
and positioned.

11
Krogman followed a set of principles, referred to as rules of thumb, to
approximate the four facial features (Krogman and İşcan, 1986). First, the width of the
mouth is “approximately the same as interpupillary distance; or, alternatively, the
distance between two lines radiating out from the junction of the canine and first
premolar on each side” (Krogman and İşcan, 1986:430). Second, the apex of the cornea
touches the centrally located tangent from the superior to the inferior margin of the orbit.
Third, the width of the nasal aperture is approximately 3/5 of the external nose, and the
projection of the nose is three times the length of the nasal spine. Finally, the length of
the ear is equal to the length of the nose, and the most lateral part of the cartilaginous
portion of the ear-tube is located superoposteriorly to the bony portion of the ear-tube.
Krogman and Işcan (1986) published step-by-step instructions for the approximation of
the facial and profile view. However, for a practical and detailed review of the American
method, including a list of the necessary tools and supplies, one should refer to the book
written by Lori Gibson (2008), Forensic art essentials: a manual for law enforcement
artists.
Law enforcement agencies seem to favor the American method because it is based
on published data, which can be referenced in court and is rapid, reducing the overall
monetary cost (Gibson, 2008). In addition, a forensic artist might have less anatomical
training compared to a medical artist and would not be in a position to accurately use the
muscle-by-muscle approach. Nevertheless, the accuracy of the method has been
successfully tested. Gatliff and Snow (1979) reported that since 1967, 70% of their 33
facial approximations using the American approach resulted in the positive identification
of the victim. Wilkinson (2004) and Prag and Neave (1997) state that the American

12
method, as practiced by Gatliff, actually resulted in a success rate of 65% and 72%
respectively. Even if the reported success rates are inconsistent, it appears that the
method is successful beyond chance. The most prominent critique of this technique is that
the use of average soft tissue depth generalizes the face instead of individualizing it
(Stephan, 2005).
The first studies measuring facial soft tissue thickness focused on European
populations (Welcker, 1883; His, 1895; Kollmann and Büchly, 1898), a group that is still
extensively studied. The lack of soft tissue measurements for other groups has been a
recurrent critique of this method (Helmer et al., 1993; Reichs and Craig, 1998). However,
there are now tables available for a variety of other ethnic groups such as North
American Blacks and Hispanics, and numerous African and Asian populations
(Fernandes et al., 2012). Wilkinson (2004) provided all the soft tissue tables published
before 2002 and is a good reference book. More recent soft tissue studies include Slovak
(Panenková et al., 2012), Chinese (Chen et al., 2011) and South African black females
(Cavanagh and Steyn, 2011). Starbuck and Ward (2007) created three facial
approximations using the exact same facial features but modifying the soft tissue
thickness from emaciated to normal and obese. Many observers believed that the faces
were from different individuals. These results demonstrate the importance of choosing
the appropriate tables with accurate measurements. It is generally agreed that the age,
sex, ancestry and body mass index (BMI) influence the soft tissue thickness (Manhein et
al., 2000; De Greef et al., 2006; 2009). Others have argued that the differences between
the means might not be enough to justify using separate tables (Stephan et al., 2005;
Stephan and Simpson, 2008).

13
Since the 19th century, the techniques to measure soft tissue thickness have
greatly evolved. Initially performed on cadavers using needles, modern techniques favor
the use of imaging technology such as ultrasound, computed tomography (CT) or
magnetic resonance imaging (MRI) on living subjects (Stephan and Simpson, 2008). The
use of cadavers presents obvious problems due to the different processes affecting the
body after death, including the loss of muscle tone and shrinkage (Wilkinson, 2004).
Embalming also causes significant changes in facial soft tissue depths (Simpson and
Henneberg, 2002). Finally, gravity affects the soft tissue of the face differently in the
supine position (cadavers) compared to the upright position (living) (Stephan and
Simpson, 2008). As a result, most recent studies have favoured living subjects. Stephan
and Simpson (2008) did a review of the published soft tissue data and provided a table
with the advantages and disadvantages of all soft tissue depth measurement techniques.
Manchester/Combination method
In 1973, Neave was asked to perform the facial approximation of a pair of
Egyptian mummies as part of the Manchester Museum Mummy Project (Prag and Neave,
1997). He used the soft tissue depth data of Kollman and Büchly (1898) but also gave
attention to the areas of muscle insertion and their effect on the face (Prag and Neave,
1997). The success of his approximation triggered the development of what is known as
the Manchester method. The method combined both the anatomical and the soft tissue
depth method. It took several years after the mummy project for Neave to refine his
methodology (Prag and Neave, 1997). During this time, he also qualitatively and
successfully tested the accuracy of his approach using cadavers that were used for
dissection from the University of Manchester Medical School (Neave, 1979). Prag and

14
Neave (1997) stated that all facial approximation methods would result in a success rate
between 50 and 60%, and that the Manchester method was no exception. However,
Wilkinson (2004) reported that Neave claims a success rate of 75%. Regardless of the
actual number, the combination method seems to take advantage of the best aspects of
each method. The soft tissue depth markers provide guidelines to limit artistic
interpretation and the study of the muscle attachments and other details of the skull allow
a better individualization compared to soft tissue means (Taylor, 2001).
The combination method, as practiced by Neave, can be divided into three stages:
the preparation of the skull, the modeling of the shape of the face, and the modeling of
the facial features (Prag and Neave, 1997). During the first stage, a cast of the skull is
created to keep the original as a reference. The second stage involves the placement of
the soft tissue depth markers and the sculpting of the main muscles and muscle groups
based on the position and strength of the muscle insertion. Prag and Neave (1997:28)
stated that: “the exact dimensions of a muscle is not critical as it is the thickness of the
soft tissue that finally determined the fatness or thinness of the face, but their position and
direction of pull and approximate strength are crucial to the reconstruction process” .
Finally, the facial features are modeled using guidelines from Gatliff (1984), Krogman
and Işcan (1986) and George (1987).
Facial features
It is clear from the historical review that there is not a standardized approach to
forensic facial approximation. The success rates reported by the practitioners are also
highly variable across methods. The great number of published methods to determine the
size, shape, and location of the different facial features also reflects the lack of

15
standardization and universal guidelines within the general field of facial approximation.
A limited number of methods to determine facial features have been scientifically tested
and the many guidelines were initially based on a presumed relationship between the soft
and hard tissues (Stephan, 2003). By the end of the 20th century, researchers have tried to
address the critique that subtle facial features cannot be predicted. Helmer et al. (1993)
compared two facial approximations of the same individual by different practitioners and
concluded that the areas with the most discrepancies were the mouth and eyes. They
concluded that the discrepancies were due to the lack of adherence by the practitioner to
the standardized principles of approximation. Nevertheless, according to a study using
computed tomography (CT) scans performed by Wilkinson et al. (2006), the majority of
the facial approximations showed less than 2.5 mm error and that the nose, eyes, jaw line,
forehead and chin can be reconstructed reliably.
The recognition of an individual depends partly on the shape of the face as a
whole (Starbuck and Ward, 2007), but the interrelationship between the features is also
important (Bruce and Young, 1998). “As faces become familiar, there is a shift in
memory so that the internal face features become relatively more salient” (Bruce and
Young, 1998:157). Humans have the ability to perceive subtle differences in shape and
proportions of soft and hard tissues. Even a small difference in facial features can make a
substantial difference in appearance of the face as a whole (Enlow and Hans, 1996).
Changes to the craniofacial skeleton and the associated tissues influence the perceived
age according to the observer’s personal concept of growth and aging (Todd et al., 1980).
In addition, changes to the facial proportions alter the spatial relationship between the
facial features, which is critical for recognition (Neave, 1998). The three most significant

16
features for recognition are the eyes, the mouth and the nose (Briggs and Martakis, 1998).
The shape, size and projection of the nose are the most important for a profile and three-
quarter view of the face.
The nasal region is an area of great interest since it is mainly composed of
cartilages (Anderson et al., 2008), which do not survive decomposition, and is one of the
rare facial features that never stops growing due to the cartilaginous composition (Neave,
1998). These two characteristics make nasal morphology difficult to approximate based
on the hard tissue of the face and have resulted in numerous studies on the anatomy of the
nose and the relationship between the soft and hard tissue. The skeletal framework of the
nose is comprised of the maxillae, the vomer, the ethmoid and the nasal bones (Anderson
et al., 2008). However, the size and shape of the nose is mostly due to the soft tissues
including; skin, fat, muscles, cartilages (septal, lateral, greater alar, lesser alar and
sesamoid) and possibly a ligament, where the nasal septum provides the main support
(Anderson et al., 2008). Anderson et al. (2008) dissected the nose of six male and female
cadavers. Their results highlight the variability present in the nasal structure. They
discovered that the amount and location of fat varies between individuals from root to tip
of the nose. In addition, not all facial muscles associated with the nose are present in all
individuals and the septal cartilage angles downward from the nasal bone. These results
contradict Macho (1989), who stated that the septal cartilage and the nasal bone tend to
follow the same angle.
The nasal tip progressively descends due to gravity and the weakening of the
lower lateral cartilages, and the loss of skin elasticity (Friedman, 2005). Tip drooping
relative to the position of the nasal bridge gives the illusion of a dorsal hump or pseudo-

17
hump (Zimbler et al., 2001; Friedman, 2005). In addition, the nasal tip becomes squarer
due to the weakening of the interdomal ligaments connecting the left and right portion of
the nasal tip. As a whole, the nose continues to grow forward and downward with age
(Albert et al., 2007). The antero-inferior movement of the nose starts to be visible during
the sixth decade of life of the individual (Friedman, 2005). As a consequence, the length
of the nasal bones become less correlated with the soft tissue because the bone stops
growing while the soft tissue continues to grow (Subtelny and Rochester, 1959;
Chaconas, 1969; Genecov et al., 1990). The increased anterior projection of the nose after
skeletal growth seems to indicate that the underlying skeletal hard tissue and soft tissue
are independent (Subtelny and Rochester, 1959; Genecov et al., 1990). However,
McClintock Robinson et al. (1986) did find that a number of soft tissue features
significantly correlated with the underlying skeletal morphology. In their study, patients
with straight nasal profiles tended to have straight noses and the same applied for convex
and concave profiles (McClintock Robinson et al., 1986). Finally, Garlie and Saunders
(1998) found a strong correlation for nasal length between growth and tissue thickness in
subadult males and females.
Nasal projection method
The nasal tip has been extensively studied and there are currently six methods
available in the literature to determine the position of the tip of the nose in profile
(Gerasimov, 1971; Krogman and İşcan, 1986; Macho, 1986; George, 1987; Prokopec and
Ubelaker, 2002; Stephan et al., 2003; Rynn et al., 2010). The first two methods published
are also the most commonly used today by forensic facial approximation practitioners
(Stephan et al., 2003). Similarly, they were both developed based on the experience of the

18
practitioner and presumed correlations between the soft and hard tissues surrounding the
nose rather than on reliable anatomical studies (Gerasimov, 1971; Krogman and İşcan,
1986). The first method ever published and the most commonly used is the two-tangent
method by Gerasimov, where the tip of the nose is positioned at the intersection of two
tangents. The first tangent follows the general direction of the last third of the nasal bone
and the second tangent is the continuation of the anterior nasal spine (ANS) (Gerasimov,
1971). The second method is the threefold-ANS method and was developed by Krogman.
The nasal tip is positioned at three times the length of the ANS plus the average soft
tissue depth, following the direction of the nasal spine (Krogman and İşcan, 1986). The
length is measured from the vomer-maxillary junction which is easier to determine on the
actual skull compared to a replica or 3D model (Stephan et al., 2003; Rynn and
Wilkinson, 2006).
In the following decades, the methods published by Macho (1986), George
(1987), Prokopec and Ubelaker (2002), Stephan (2003) and Rynn et al. (2010) were
developed based on the analysis of various craniometric measurements from lateral
cephalographs or head computed tomography (CT) scans instead of experience. This new
approach to the nasal projection method emerged from the need to validate the presumed
craniofacial relationship on which the two previous methods were based on. Out of the
five new methods, two are based on the input of distances and angles measured from the
hard tissue and put into regression equations (Macho, 1986; Stephan et al., 2003); one
positions the tip of the nose by using the morphology of the nasal aperture (Prokopec and
Ubelaker, 2002); and one uses a sex specific percentage of hard tissue linear

19
measurements (George, 1987). Finally, the last method uses both regression equations
and nasal morphology to determine nasal tip morphology in profile (Rynn et al., 2010).
The two methods using only regression equations are very similar. Macho (1986)
uses the distance between nasion and the anterior nasal spine (ANS), the projection of
rhinion (most distal point on the nasal bone) in relation to the nasion-spina plane (NSP)
to determine the height and length of the external nose. The nasal depth is calculated
using additional measurements such as the distance between rhinion and the ANS, the
distance between nasion and the most prominent point of the nasal bone, and finally the
height of rhinion based on NSP. There are separate regression equations for males and
females and the age of the individual is input into the equation. Finally, the method takes
into consideration the thickness of the soft tissues. Similarly, Stephan et al. (2003)
created a regression equation using linear distances, such as between the tip of ANS and
rhinion to the border of the nasal aperture, to determine pronasale height for males and
females combined, and two equations for pronasale projection for males and females
independently. Unlike Macho (1986), the regression equations necessitates angles
measured from Frankfurt Horizontal Plane (FHP), such as nasal spine angle and nasal
bone angle and are independent from age.
In the same way, the method by Gorge (1987) uses linear measurements to
determine nasal soft tissue measurements. The method was developed using craniometric
measurements taken on lateral radiograph of a sample of white Americans. According to
his research, the horizontal nasal length or nasal projection can be calculated using the
vertical nasal length (nasion to the point of most flexion on the maxilla in profile). The
nasal projection is equal to 60.5% for males and 55% for females of the vertical length

20
and is placed along a line parallel to FHP. Unlike the previous three methods, the
guidelines developed by Prokopec and Ubelaker (2002) do not only provide the position
of the most projecting point of the nose but the complete nasal profile. To do so, seven
measurements are taken from a line drawn at rhinion and parallel to the nasion-prosthion
plane to the edge of the nasal aperture. These measurements are then mirrored on the
other side of the line and two millimeters is added to account for soft tissue thickness.
The ends of each measurement are then joined to create the nasal profile.
Finally, the most recent method combines the use of linear distances between
easily definable bony landmarks entered into regression equations and the nasal
morphology (Rynn et al., 2010). Rynn et al. (2010) explain that the biggest issue with the
two-tangent method is that the practitioner subjectively determines the position of the
tangents. Consequently, they realized that “metrical limitations on the nasal dimensions
would allow the two tangents to be taken into account and incorporated into a method of
estimating the profile of the nose without necessitating the measurements of angles.”
(Rynn et al., 2010:21) In other words, the goal is to minimize subjective error from the
two-tangent method by combining it with six strict regression equations to predict the
nasal profile dimension. The practitioner has to enter three distances (nasion to acanthion,
rhinion to subspinale, nasion to subspinale) into the different regression equations to
determine pronasale anterior projection, vertical height from nasion, projection from
subspinale, nasal length, nasal height and nasal depth. Gerasimov’s two-tangent method
is then performed to complete a more accurate nasal projection.
All the methods available to determine nasal projection are clearly very different
from one another and it can be difficult for the practitioner to decide which one to use. In

21
addition, the accuracy and precision of the different methods have been tested with
varying results (Stephan et al., 2003; Rynn and Wilkinson, 2006; López et al., 2010;
Rynn et al., 2010). The inconsistent results between studies have been partly attributed to
unclear methodological descriptions (Rynn and Wilkinson, 2006). Stephan et al. (2003)
were the first to test the accuracy of four of the previously published methods to
determine nasal projection using lateral cephalograms from 29 males and 30 females of
European ancestry. They used profile tracings of the cephalograms and a Cartesian axis
parallel to the Frankfurt Horizontal Plane (FHP) and perpendicular to nasion in order to
calculate deviation from true nasal position. They concluded that both the two-tangent
and the threefold-ANS method did not perform well. The poor results with the threefold-
ANS method were attributed to the fact that any error in the measurement of the anterior
nasal spine (ANS) will be magnified by the multiplication factor. Finally, the methods by
Prokopec and Ubelaker (2002), and George (1987) performed well with the latter being
the best out of the four. Stephan et al. (2003) concluded their study by providing a new
method based on regression equations and state that it performed better than the four
methods previously tested.
Rynn and Wilkinson (2006) used the same approach as Stephan et al. (2003) to
evaluate the accuracy of all the previously published methods using a sample size of 122
Caucasoid individuals. Their results are for the most part inconsistent with the conclusion
by Stephan et al. (2003) with the exception of the threefold-ANS method, which
performed the worst. The authors concluded that the methods by Prokopec and Ubelaker
(2002), Macho (1986), George (1987) and Stephan et al. (2003) did not accurately predict
nasal projection, with the latter being impractical due to the numerous linear and angular

22
measurements required. They stated that the method by George (1987) overestimates
nasal projection but is a good method for damaged skulls with broken nasal bones or
ANS. Finally, Rynn and Wilkinson (2006) concluded that Gerasimov’s method is the
most accurate to predict a point on the tip of the nose and the variation in results
compared to Stephan et al. (2003) might be due to how the tip of the nose is defined,
whether using FHP or the nasion-prosthion plane (NPP). It was recently stated that “the
NPP as a vertical alignment plane enables fairer analysis of nasal projection” (Rynn et al.,
2012:198). The study also demonstrated that the overestimation of the position of the
nasal tip can be accounted for by the positioning of the first tangent, following the last
third of the nasal bone versus the end of the nasal bone (Rynn and Wilkinson, 2006).
CT and facial approximation
In 1972 Godfrey Hounsfield invented the first CT scanner that was initially used
for clinical applications (Lou et al., 2007). Within the last decade, technological
advancements have allowed for CT scanners to be commonly used in anthropology to
digitize the skull and associated soft tissues (Claes et al., 2010), thereby opening the door
to groundbreaking research into the relationship between the soft and hard tissues of the
face. The resolution of CT scan data has increased greatly since its invention and it is
now possible to create a 3D model of defined anatomical structures, such as the skull,
from the scan. It is important to remember that during the data acquisition, process errors
due to things like limited scanning resolution, will inevitably be introduced and a perfect
copy of the skull is not possible (Claes et al., 2010). In spite of this, Wilkinson et al.
(2006) demonstrated that the reconstructed skull from CT scans can be use to produce a
reliable approximation of the face and that the nose is one of the most accurate

23
approximated areas. Lee et al. (2011) produced comparable results and concluded that
reliable facial prediction is possible. Finally, two other studies compared measurements
between the 3D model and the original object scanned. Sakuma et al. (2010) used a
ready-made box and Hildebolt et al. (1990) used skulls to confirm that 3D-CT scans can
provide accurate measurements.
The study performed by Rynn et al. (2010) was the first to use CT technology
instead of lateral radiographs to determine the accuracy of the nasal projection
methodology. Rynn et al. (2010) used clinical head CT scans from 79 North American
individuals of varied ancestry. They specified that individuals over the age of 50 years
were excluded to limit the effect of age-related changes in nasal morphology on the
results. Their results are consistent with the previous research by Rynn and Wilkinson
(2006), where the two-tangent method has a good level of accuracy, with an error of ±2
mm, and that the threefold-ANS method is effective in approximating nasal projection.
Finally, López et al. (2010) used 34 cephalograms and concluded that George’s (1987)
method performed the worst , and Prokopec and Ubelaker’s (2002) method performed the
best. The two-tangent and threefold-ANS methods rated in second and third position,
respectively. However, the authors state that all methods underestimated the anterior
projection of the nose and had low level of accuracy (López et al., 2010).
In summary, the threefold-ANS method consistently produced bad results
(Stephan et al., 2003; Rynn and Wilkinson, 2006; López et al., 2010; Rynn et al., 2010)
and its use should be discontinued. All the other methods, with the exception of the two-
tangent method, have variable accuracy results but are mostly considered to be
inaccurate. The two-tangent method is the most promising method to determine the

24
position of a point on the tip of the nose. Rynn and Wilkinson (2006) and Rynn et al.
(2010) found that the two-tangent method is the most accurate and determined that the
poor results by Stephan et al. (2003) were due to how the authors defined the tip of the
nose. Finally, López et al. (2010) positioned Gerasimov’s (1971) method in second
position after Prokopec and Ubelaker’s (2002) method. In addition, from a practical point
of view, the two-tangent method is a quick and simple method to perform.
Gerasimov’s two-tangent method
Ullrich and Stephan (2011) stated that the studies by Rynn and Wilkinson (2006)
and Stephan et al. (2003) were not adequate tests of Gerasimov’s method because the
two-tangent method was not applied correctly. Gerasimov’s book, The face finder (1971),
translated from German by Alan Houghton Brodrick, clearly indicates that the two
tangents used to project the nose follow the last third of the nasal bone and the general
direction of the nasal spine (Gerasimov, 1971). However, Ullrich and Stephan (2011)
argue that in practice, Gerasimov did not strictly adhere to these guidelines. Gerasimov
used the last 1-2 mm of the nasal bone for the first tangent and “followed the general
direction of the left or right floor of the anterior part of the nasal aperture (maxillary
bone) laterally adjacent to the anterior nasal spine and vomer bone” (Ullrich and Stephan,
2011:473) for the second tangent. Rynn and Wilkinson (2006) have demonstrated that the
use of the literal translation of the first tangent (last third of the nasal bone) compared to
the new interpretation (last 1-2 mm) results in an overestimation of the projection of the
nose. As a result, all previous studies which use the translation defining either one or both
tangents should be dismissed (Ullrich and Stephan, 2011). Consequently, the accuracy of
Gerasimov’s two-tangent method has not yet been accurately tested.

25
The issue surrounding the use of Gerasimov’s nasal projection method arises
from; 1) The absence of detailed and accurate published guidelines to determine nasal
projection, 2) The presence of minimal information about Gerasimov’s methodology
used after Vosstanovlenie lica po cerepu (Gerasimov, 1955) was published, and 3) Errors
about the method’s underlying principles in the English translation (Ullrich and Stephan,
2011). Gerasimov’s memoir, Ich Suchte Gesichter (1968), is his only published and
translated work (Gerasimov, 1971), and is the only written account referenced for his
facial approximation methodology. Gerasimov’s earlier work, Vosstanovlenie lica po
cerepu (1955), is rarely cited within the English forensic facial approximation literature
(Stephan, 2010; Stephan and Cicolini, 2010; Ullrich and Stephan, 2011; Guyomarc’h and
Stephan, 2012). With Gerasimov’s death, it is impossible to get clarification concerning
his methodology. However, clarification can be sought from his former students such as,
Galina Viacheslavovna Lebdinskaya, Tatyana Sergeevna Balueva, and Elizaveta
Valentinovna Veselovskaya (Lebedinskaya et al., 1993), or with individuals who spent
some time working with Gerasimov such as Herbert Ullrich (Ullrich and Stephan, 2011).
In other words, there is a need for an in-depth review of Gerasimov’s non-translated
work, and discussion with his former students. In addition, efforts should be directed
towards properly translating the work written by Gerasimov (Gerasimov, 1955), as well
as other individuals who had direct contact with him (Ullrich, 1958; 1966; 1967;
Lebedinskaya, 1998)

26
MATERIALS
Based on the current literature pertaining to nasal projection, there is a clear need
for additional validation studies. Consequently, the main objective is to determine the
accuracy of the method presented by Ullrich and Stephan (2010). To do so, this research
used a database of 137 postmortem CT scans from a modern Danish population. The CT
scans were obtained from the Department of Forensic Medicine at the University of
Copenhagen and were collected as part of standard postmortem procedures. CT is a
medical imaging method that uses X-rays to collect cross-sectional data about an object
from many different directions (Kak and Slaney, 2001). An X-ray source is rotated
around the object or patient to produce one-dimensional thin slices at a number of
different angles. These thin slices are then reconstructed to form a two-dimensional
image of high resolution with workable contrast between different soft and hard tissues.
Finally, neighboring slices can be used to reconstruct a three-dimensional model (Webb,
2002). In other words, the internal structure of an object can be visualized with high
resolution in three-dimensions using thin X-ray slices.
Lateral X-rays of the head have generally been used to test the different nasal
projection methods for forensic facial approximation since it is a commonly available
medical imaging technology (Stephan et al., 2003; Rynn and Wilkinson, 2006; López et
al., 2010). However, CT scans provide definite advantages over lateral radiographs such
as; the ability to isolate anatomical structures, to take apart and reassemble the image and
to create accurate 3D models (Vannier et al., 1985). As a result, CT technology provides
more detailed soft and hard tissue information required for accurate research. This study
followed the work of Rynn et al. (2010), which successfully used CT scans to investigate

27
the relationship between the soft and hard tissues of the nose.
Two criteria were used to determine if an individual CT scan was included in the
sample for this study. First, the hard tissue of the nasal region, which includes the nasal
bone, the anterior nasal spine and the floor of the nasal aperture, had to be clearly visible
and not be affected by antemortem trauma or pathology. Second, the soft tissue of the
nose could not be distorted due to postmortem processes, such as the loosening of support
structures. This was to ensure that it was possible to determine the true position of the tip
of the nose. Consequently, a preliminary rendering of the hard and soft tissues in 3D for
each individual was undertaken to assess the presence of distortion, trauma or pathology
and to determine if each scan met the two criteria. After the preliminary evaluation, 31
scans were excluded due to distortion of the soft tissue of the nose (Fig. 1), 35 scans were
excluded because there was missing soft tissue (Fig. 2) and three scans were excluded
because the nasal bone exhibited damage (Fig. 3).
Figure 1: Excluded scan, nasal soft tissue distortion
Figure 2: Excluded scan, missing nasal soft tissue

28
Figure 3: Excluded scan, damaged nasal bone.
Other studies testing nasal projection for forensic approximation also used age as
an exclusion criterion (Stephan et al., 2003; Rynn et al., 2010). The age of the individual
is not only important because the basic methods of facial approximation are ideal for an
age range of 25 to 35 years (Taylor, 2001), but also because the nose is one of two
features that continues to grow due to its cartilaginous composition (Neave, 1998). The
nasal tip progressively descends due to the weakening of the lower lateral cartilage and
surrounding support structures and starts to be visible when individuals are in their 60s
(Friedman, 2005). As a whole, the nose continues to grow forward and downward with
age (Albert et al., 2007). Ideally, every individual of 50 years and older should be
excluded from the sample. However, an additional two individuals were excluded from
the original sample because they did not have a recorded age and less than 50% of the
remaining scans were from individuals under 50 years of age. Consequently, it was
decided to include all ages and to determine if there is a positive correlation between age
and the difference between the predicted and actual nasal projection.
The only other information available for each individual was sex and was
recorded to determine if sex influences the accuracy of the results. Previous studies have
separated males from females in their analysis with similar results for both (Stephan et
al., 2003; Rynn and Wilkinson, 2006; Rynn et al., 2010). Due to the limited amount of

29
information available, it is not possible to account for differences due to body size or
ancestry. In spite of this, Gerasimov’s method is applicable to all populations, regardless
of origin (Gerasimov, 1971). Nevertheless, it was assumed that the modern Danish
sample is homogenous. A total of 71 scans were excluded due to issues identified on the
scans and lack of additional information. The final sample size was 66 with 23 females
(mean age: 53.96) and 43 males (mean age: 49.98). The overall age range was from 21 to
87 years old (Fig. 4). An independent sample t-test showed there was no statistical
difference between mean age for females and males (t=-9.52, df = 64, p = 0.344).
Figure 4: Age histogram male and female

30
METHODS
The CT scans of each individual were stored on the computer as DICOM (Digital
Imaging and Communication in Medicine) data (Lee et al., 2011) and were imported into
MIMICS. The MIMICS software allows the operator to visualize anatomical structures
and create 3D models of the skull and surrounding soft tissues (Wilkinson et al., 2006;
Davy-Jow et al., 2012; Fernandes et al., 2012). Each set of scans was prepared for
analysis through the process of thresholding, segmentation, and 3D rendering. The
MIMICS interface lets you to see and rotate through the CT scans following the coronal,
sagittal and transverse plane (Fig 5). The first step was to identify and separate the hard
from the soft tissue within each scan using the thresholding and segmentation functions
in MIMICS.
Figure 5: DICOM file with CT scan views
Sagittal
Transversal Coronal

31
The region of interest was defined using grayscale values, which are determined
in Hounsfield Units (HU) based on the density of the tissue, which is the same between
different scans (Tilotta et al., 2009). A low threshold or range of values is commonly
used to select soft tissue and high thresholds for dense tissue (Lee et al., 2011). For the
purposes of this research, the soft tissue of the face and the skull was segmented using
MIMICS’ predefined density threshold, which was -700 to 225 HU for the soft tissue and
226 to 3071 HU for the skull. Segmentation refers to the process of separating the image
in multiple segments, or sets of pixels sharing the same characteristics, where a threshold
defines the boundaries. All pixels within that defined range are highlighted and a mask or
selection including only the defined pixels is created. At the end of this stage, the pixels
representing the skull were selected and highlighted in colour, with each segment having
a unique assigned colour (Fig. 6). The nasal cartilage was not included in either mask to
allow visual clarity of the bony structure. The different masks were then used to calculate
a 3D mask and rendered a 3D model of the region of interest.
Figure 6: Soft and hard tissue mask

32
Preliminary 3D models were created of the skull and the face independently to
determine if the individual met the inclusion criteria. After the final sample was
identified, two 3D models were used in this study. The first one was the skull only, to test
the different nasal projection methods without being biased by the presence of the nasal
soft tissue (Fig. 7). The transparency of the model was adjusted to high to be able to
easily identify the nasal floor for the new interpretation of Gerasimov’s nasal projection
method (Ullrich and Stephan, 2011). The second model combined the soft and hard tissue
masks, where the transparency of the soft tissue was increased to medium to visualize the
underlying hard tissue (Fig. 8).
Figure 7: 3D model of skull with Nasion and measurement
Figure 8: 3D model of soft and hard tissue

33
MIMICS does not provide the necessary tools to draw and calculate the position
of the tip of the nose. Consequently, the resulting 3D models had to be imported into
another software program. This study used Abode Illustrator, which is a vector graphic
editing software, although the majority of facial approximation studies use Adobe
Photoshop (Stephan, 2002b; 2003; Stephan and Henneberg, 2003; Rynn et al., 2010). A
measurement was taken using the basic measuring tool in MIMICS to help position the
3D model in the Frankfurt Horizontal Plane (FHP) and scale the image after it was
imported in Illustrator (Fig 7). A point was manually placed on the image to indicate
nasion to be used as the origin of a Cartesian axis. Finally, a screen shot of the model,
including the measurement and nasion, was saved in JPEG format as image A (skull
model) and image B (skull and soft tissue model). Image B had to be taken immediately
after image A, despite the risk of introducing bias, to maintain identical positioning and
view of the model to allow perfect superimposition. The screen shot of the 3D model
mimics a lateral X-ray.
Each individual has an associated image A and image B which were imported into
Illustrator as two separate working layers. Layers allow the manipulation of the elements
within one layer without affecting other layers using the lock function. In addition, each
layer can be viewed or hidden independently of each other. The following steps were
repeated for each individual. After image A was imported, two vertical guides were
positioned, using the rulers integrated within Illustrator’s worksheet, at the measured
distance on the scan to correctly scale the image up or down (Fig. 9). After the image was
correctly scaled, Illustrator provides you with the exact position of the image on the work
sheet in X and Y, and the new height and width (Fig. 10).

34
Figure 9: Image A (not to scale) with scaling guides
Figure 10: Position and size numbers after scaling
These numbers are essential to superimpose image B over image A. After image
B was imported on its own layer, the numbers from image A were imputed for image B,
to appropriately scale and position it. Finally, the zero of the horizontal and vertical ruler
was placed on Nasion and was used as the center of the coordinate system to measure the
nasal projection as a distance in X (horizontal) and Y (vertical) (Fig. 11). The X-axis was
parallel with the FHP. The unit used was millimeters (mm) and Illustrator provided
coordinates (X, Y) for any points identified. The images were then ready to be used for
testing the different nasal projection methods.
Ruler (mm)
Guides

35
Figure 11: Cartesian axis and reference point
Nasal projection testing
The literal translation from Russian of the two-tangent method in Gerasimov’s
book, The face finder, states that: “The profile of the nose is projected by two straight
lines, one at a tangent to the last third of the nasal bones and the other as a continuation of
the main direction of the point of the bony nose. The point intersection of these two lines
will generally give the position of the tip of the nose” (Gerasimov, 1971:54). A tangent
refers to a straight line, which makes contact with a curve or surface at a single point
without cutting across it. However, the shape of the nasal bone and nasal spine are rarely
a perfectly flat or curve surface where it is easy to identify the location of the tangent. As
a result, the positioning of the tangent line can be a difficult task and might be the reason
for the variable results from the two-tangent method. The new interpretation of the
method, argued to be the correct version by Ullrich and Stephan (2011), modifies the first

36
tangent from following the last third to the last 1 – 2 mm of the nasal bone. This
interpretation is also supported by Rynn and Wilkinson (2006). In addition, the second
tangent is modified from following the direction of the anterior nasal spine to “the left or
right floor of the anterior part of the nasal aperture (maxillary bone) laterally adjacent to
the anterior nasal spine and vomer bone” (Ullrich and Stephan, 2011:473).
To test Ullrich and Stephan’s (2011) claim and evaluate how each tangent
contributes to the deviation from the actual nasal tip, four tangents were drawn on the
image A (skull only) of each individual using the pen tool in Illustrator (Fig. 12). Tangent
1 follows the last third of the nasal bone and tangent 2 follows the general direction of the
nasal spine. These two tangents are exactly as defined in The face finder (Gerasimov,
1971) and used in previous validation studies (Stephan et al., 2003; López et al., 2010).
Tangent 3 follows the last 1-2 mm of the nasal bone as suggest by Rynn and Wilkinson
(2006) and Ullrich and Stephan (2011). Finally, tangent 4 follows the direction of the
nasal floor to the right of the anterior nasal spine (Ullrich and Stephan, 2011). The
method using the combination of tangent 3 and 4 represent the new interpretation of the
two-tangent method as explained by Ullrich and Stephan (2011). Method 1 uses tangent 1
and 2, and is Gerasimov’s original guideline. Finally, Method 2 and 3 represent the two
other possible tangent combinations (Table 1). The four methods, covering all the
possible tangent combination, resulted in four intersecting point, each representing the
possible location of the tip of the nose. To determine which method is the most accurate,
the four intersecting points had to be compared to a gold standard or true nasal tip.

37
Figure 12: Nasal projection tangents
Figure 13: Reference points
Table 1: Four tangent combinations
Method # 1st tangent 2nd tangent Description
1 T1 (last 1/3 bone) T2 (nasal spine) Literal translation
2 T1 T4 Combination 1
3 T3 T2 Combination 2
4 T3 (last 1-2 mm) T4 (nasal floor) New interpretation

38
The definition of the true nasal tip is paramount to testing the accuracy of the
method. One important thing to consider is that Gerasimov did not specify that the nasal
tip should be defined in the FHP (Rynn et al., 2006). As a result, for the purpose of this
research, the approximated nasal tip position was compared to two different soft tissue
reference points as the actual nasal tip position (Fig. 11). Reference point 1 was defined
as the most projecting point while the skull is in the FHP, or pronasale. This is the most
commonly used reference point in other research (Stephan et al., 2003; Rynn and
Wilkinson, 2006; López et al., 2010; Rynn et al., 2010). Reference point 2 was the point
where the nasal spine line (NSL) or second tangent crosses the surface of the soft tissue
profile in the area of the tip of the nose (Rynn et al., 2006). Consequently, for each
individual the X and Y coordinate were recorded for the four intersecting points and the
two reference points (Fig. 13).
The data recorded was then used to calculate two sets of numbers. First, the
difference between true nasal tip and the estimated nasal tip was calculated by subtracting
the coordinates of the intersecting point to the coordinates of the reference point (true –
approximated nasal tip = difference). As a result, a positive difference indicates that the
method underestimates the nasal tip and a negative difference indicates that it
overestimates the nasal tip along a specific axis. Second, the difference was used to
calculate an absolute distance between the estimated tip and the reference tip, which
allows for a better evaluation of the accuracy of each method without directionality.
Scatter plots were created to identify outliers and visualize the data distribution. A scatter
plot is used in statistics to display a data set based on Cartesian coordinates. In addition,
two box plot graphs were created using the absolute distance to confirm the presence of

39
outliers without directionality bias. Box plots also provided visual information about the
dispersion and skewness of the data. The presence of outliers can impact statistical
analysis if they are not robust against such outliers (i.e. the t-test). Consequently,
statistical analyses were performed with and without the outliers.
The recorded data was analyzed using two different statistical procedures with the
software IBM SPSS Statistics version 20. First, six repeated-measures ANOVA followed
by a pair-wise comparison were used to compare the mean absolute distance of each
method to one another, as well as the mean differences in X and Y, for reference point 1
and 2 independently. The tests determined if there is a significant statistical difference
between each method and to help identify which method is better based on the sample
mean difference. A Bonferroni correction was applied to the pair-wise comparison to
control for the problem of increased family wise error rates that arise using multiple
comparisons and to keep the Type I error rate to p <0.05. The usual assumption of
ANOVA is that the data from each method is independent. However, in situations where
there are repeated measures, this assumption is automatically violated and another
assumption has to be made. The assumption of sphericity “refers to the equality of
variance of the differences between treatment levels” (Field, 2005:428). The Mauchly's
test was used to test that the null hypothesis of equal variances of the differences, which
is rejected if the probability value is less than 0.05. When the assumption is not met the
Greenhouse-Geisser or Huynh-Feldt correction can be used to produce a valid F-ratio.
The second procedure was a one-sample t-test using the difference in X, Y and the
absolute distance between the approximated and true nasal tip. This additional analysis is
important to determine if the method can accurately determine the position of the tip of

40
the nose. The t-test examines the null hypothesis that the sample’s mean differences are
not different from zero. The test value is zero because if the methods perfectly estimate
the position of the tip of the nose, the difference with the true tip would be zero.
Consequently, the t-test using the difference in X and Y determined how each tangent
influenced the approximated nasal tip and the t-test using the absolute distance if the
method is accurate. The assumption for the t-test is that the sample has to be normally
distributed and it is not a robust method against outliers, as previously mentioned.
Statistical procedures can be used to determine normality (i.e. Kolmogorov-Smirnov
test). However, the procedure produces significant results for small deviations from
normality with large sample sizes. Nevertheless, Moore and McCabe (2006) state that a
sample size of >40 is large enough to use the t-test even if the distribution is skewed.
Overall, the ANOVA identifies if there is a difference between each method but the t-test
determines if the method is able to identify the position of the true nasal tip.
Additional variables
Two additional sets of data were collected following the initial nasal projection
method testing to help identify factors influencing the accuracy of the estimate. First, the
last 1/3 of the nasal bone of each individual was characterized as straight or curved.
Second, slight distortions of the nasal bone in frontal view, which would not have been
significant enough to necessitate its exclusion from the sample, were identified as present
or absent. As a result, it was possible to determine the effect of age, sex, nasal shape and
nasal condition on the accuracy of the estimated position of the nasal tip. An
independent-sample t-test was used to evaluate all the additional variables after removal
of outliers. Groups were identified as 0 and 1 for nasal shape (straight = 0, curved = 1),

41
nasal distortion (absent = 0, present = 1) and sex (male = 0, female = 1), and 50 years was
used as the cut off point for the age groups (<50, >=50). Individuals were separated into
these two age groups based on the time the nasal structure is affected by aging as
previously mentioned. The samples have to be independent with a normal distribution
and an equal population variance. In the same way as other t-tests, the procedure is robust
against non-normality. The Levene’s test was used to determine equality of variance,
where the null hypothesis is that all the groups have equal variance. The t-test’s null
hypothesis is that the difference between the means is due to chance.
Intraobserver error
After the data were recorded for the entire sample, the nasal projection methods
were reapplied twice to the first 10 individuals in order to test intraobserver error for a
total of three trials. The 10 individuals were initially tested on November 12th and 13th,
2012. The second trial was carried out 16 days later on November 29th, shortly after the
entire sample had been tested. Finally, the last trial was on January 14th 2013. The use of
more than two samples indicates the necessity to use a repeated-measures one-way
analysis of variance (ANOVA) with post-hoc procedures to determine if there were a
significant difference between each group. A previously mentioned, the repeated-
measures ANOVA has to meet the sphericity assumption. A Bonferroni correction will
also be used on the pairwise comparisons. If there is a difference between trial 1 and 2, it
will be indicative of the presence of a learning curve for the practitioner. If there is a
difference between trial 2 and 3, it will support the presence of intraobserver error.

42
RESULTS
The results of the statistical procedures used to analyze the data recorded will be
presented in this section starting with a graph to help visualize the recorded data,
followed by the repeated-measures ANOVAs and the t-test outcomes. Finally, the
analysis of the additional variables are presented. First, Four overlay scatter plots were
created to visualize the differences between the estimated and actual nasal tip positions
calculated using each method. Method 1 is Gerasimov’s literal translation, Method 2 and
3 are tangent combinations, and Method 4 is the new interpretation presented by Ullrich
and Stephan (2011). Figure 14 shows the calculated differences between the estimated
nasal tip from Method 1 and the actual nasal tip defined using reference points 1 (blue
circle) and 2 (green circle). The data is similarly dispersed along the X-axis for both
reference points with two outliers (individual 9011340 and 11181145). The data
represented in Figures 15 to 17, respectively Method 2, 3 and 4, is also dispersed along
the X-axis and individual 9011340 is still identified as an outlier for Method 3 and 4. The
data representing the difference between the estimated nasal tip position and reference
point 2 tend to cluster around zero on the Y-axis across all methods, which is expected
since the actual tip of the nose is defined using the 2nd tangent.

43
Figure 14: Scatterplot Method 1
Figure 15: Scatterplot Method 2
09011340
11181145

44
Figure 16: Scatterplot Method 3
Figure 17: Scatterplot Method 4
09011340
02271145 b
09011340

45
The data exhibit asymmetry, with the majority of the points situated within the
fourth quadrant for Method 1 and 2, within the third and fourth quadrant for Method 3,
and within the third quadrant for Method 4. In other words, the majority of the data is
situated forward and downward or backward and downward compared to the true nasal
tip, which is situated at (0, 0) (Fig 18). The box plots also identified individual 9011340
as an outlier across all groups (Figs. 19, 20). Individual 11181145 and 02271145 b were
deviating from the rest of the data respectively using Method 1 compared to reference
point 1 and using Method 3 compared to reference point 2. A star on the graph identifies
these three individuals. Finally, the graphs illustrate a decrease in data dispersion from
Method 1 to Method 4.
Figure 18: Nasal tip position from differences and quadrants

46
Figure 19: Boxplots of absolute distance from Ref point 1
Figure 20: Boxplots of absolute distance from Ref point 2
09011340
09011340
09011340
09011340
11181145
09011340
09011340
09011340 09011340
02271145 b
09021236

47
Repeated-measures ANOVA
The first statistical procedure performed was the repeated-measures ANOVAs.
The first ANOVA used the absolute distance and compared the mean difference of each
method to determine if there was a difference in predicting the position of pronasale
(reference point 1). The analysis indicates that there was a statistically significant
difference between the means. The assumption of sphericity was not met (W = 0.086, df
= 5, p = <0.001) but the significance was <0.001 across all F-ratios before and after
correction. The pairwise comparisons with Bonferroni correction indicated that Method 1
was statistically different (p=<0.001) from the other three, and that Method 3 was
different (p=<0.001) than Method 4. Method 2 had a mean difference of -2.092 and 1.488
compared to Methods 3 and 4 respectively, and were the only pairwise comparisons not
statistically significant (Table 2).
Table 2: Pairwise comparison distance from reference point 1
Method # Mean difference Std. error Sig
1 vs 2 9.026 1.030 <0.001
1 vs 3 6.933 1.134 <0.001
1 vs 4 10.514 1.549 <0.001
2 vs 3 -2.092 0.922 0.159
2 vs 4 1.488 0.867 0.544
3 vs 4 3.580 0.658 <0.001
The second repeated measures ANOVA also used the absolute distance but to
determine the difference in positioning the tip of the nose along the nasal spine line
(reference point 2). The procedure generated similar results as the first ANOVA.

48
Mauchly’s test was significant (p=<0.001) but the F-ratio remained significant after
correction (p=<0.001). In the same way as the pairwise comparisons of the absolute
distance to reference point 1, Method 1 continues to be statistically significantly different
from all other methods. In addition, Methods 2 and 3 are also not different from one
another. The major difference is that the mean absolute distance of Method 3 is not
statistically different from Method 4 (Table 3).
Table 3: Pairwise comparison distance from reference point 2
Method # Mean difference Std. error Sig
1 vs 2 11.986 1.352 <0.001
1 vs 3 14.439 1.190 <0.001
1 vs 4 17.495 1.887 <0.001
2 vs 3 2.444 1.368 0.473
2 vs 4 5.509 1.176 <0.001
3 vs 4 3.085 1.200 0.078
The last four repeated measures ANOVA used the difference along the X-axis and
Y-axis for both reference points. All the analysis resulted in the rejection of the
assumption of sphericity with a significance of p<0.001. Consistent with the previous
analysis, the F-ratio remained statistically significant after Greenhouse-Geiser and
Huynh-Feldt corrections (Table 4). The only pairwise comparison not statistically
significant was the mean difference along the Y-axis compared to reference point 2,
between Methods 3 and 4 (p=0.300). Now that we have identified which method is
different from each other, the t-test will determine if the method is accurate.

49
Table 4: Repeated-measures ANOVA, difference X and Y
Reference point Axis Correction * df Sig.
GG 1.911 <0.001
X HF 1.968 <0.001
GG 1.119 <0.001
1
Y HF 1.125 <0.001
GG 1.896 <0.001
X HF 1.951 <0.001
GG 1.114 <0.001
2
Y HF 1.120 <0.001
* GG = Greenhouse Geiser, HF = Huynh-Feldt
One sample t-test
The one-sample t-test compared the distance in X (forward, backward) and Y
(upward, downward) independently for every estimated nasal tip position to determine if
and in which direction the different methods over- or underestimated the true nasal tip.
Only two groups (M3R1X, M4R2Y) showed no statistically significant differences from
zero. In other words, Method 3 resulted in a nasal tip position that was not statistically
different from reference point 1 along the X-axis and Method 4 was not statistically
different from reference point 2 along the Y-axis (Table 5). All the methods had a larger
mean difference anteroposteriorly (X-axis) compared to vertically (Y-axis) with the
exception of Method 3 compared to reference point 1.

50
Table 5: T-test of differences (test value = 0)
t df Sig. Mean
Diff.
t df Sig. Mean
Diff.
M1R1X -8.614 65 <0.001 -14.3697 M3R1X 1.546 65 .127 2.0515
M1R1Y -16.077 65 <0.001 -11.0939 M3R1Y -18.199 65 <0.001 -9.2515
M1R2X -11.545 65 <0.001 -21.7591 M3R2X -3.566 65 .001 -5.3394
M1R2Y -4.034 65 <0.001 -3.5152 M3R2Y -2.155 65 .035 -1.6697
M2R1X -7.865 65 <0.001 -7.8258 M4R1X 5.323 65 <0.001 4.5773
M2R1Y -8.897 65 <0.001 -3.7394 M4R1Y -11.049 65 <0.001 -4.3985
M2R2X -9.577 65 <0.001 -10.3470 M4R2X 2.276 65 .026 2.0530
M2R2Y 4.138 65 <0.001 .5424 M4R2Y -1.071 65 .288 -.1136
The absolute distance was used to confirm the previous results without
directionality bias. The one-sample t-test performed using a test value of zero resulted in
a rejection of the null hypothesis for all eight absolute distances (Table 6). In other
words, each method resulted in a nasal estimate statistically different from the true nasal
tip. All the statistical analyses (ANOVA, t-test) were also performed after removal of
individual 9011340, identified as an outlier across all methods, without any changes to
the relationship between the data.

51
Table 6: T-test of absolute distance (test value = 0)
t df Sig Mean Diff. t df Sig. Mean Diff.
M1D1 12.100 65 <0.001 19.3667 M1D2 11.926 65 <0.001 22.9333
M2D1 12.578 65 <0.001 10.3409 M2D2 10.989 65 <0.001 10.9470
M3D1 12.301 65 <0.001 12.4333 M3D2 5.720 65 <0.001 8.5030
M4D1 15.839 65 <0.001 8.8530 M4D2 8.238 65 <0.001 5.4379
Additional analysis
The final analysis needed was to determine if there were differences in the
means caused by other variables. The difference between males and females was
tested with an independent samples t-test using the absolute distance. Three
distances failed Levene’s test for equality of variances; the distances between
Method 2 and the true nasal tip defined using reference point 1(M2D1) and 2
(M2D2) and the distance between Method 3 and the true nasal tip position using
reference point 2 (M3D2). The difference between males and females was not
statistically significant with the exception of Method 2 using reference point 1
(M2D1) (Table 7). The three other variables (age, nasal shape, nasal distortion) all
had equal variance between groups and showed no differences between the sexes.

52
Table 7: Independent samples t-test for sex
Levene's Test t-test for Equality of Means
F Sig. t df Sig. (2-tailed)
M1D1 2.559 .115 1.000 64 .321
M2D1 7.122 .010 2.215 63.610 .030
M3D1 1.745 .191 .584 64 .561
M4D1 1.537 .220 .465 64 .644
M1D2 3.200 .078 .948 64 .347
M2D2 5.096 .027 1.754 63.141 .084
M3D2 4.442 .039 1.465 61.407 .148
M4D2 2.617 .111 1.730 64 .088
Finally, with respect to intra-observer error, the Mauchly’s test of
sphericity was statistically significant (df= 2, p= 0.024). Therefore, the
assumption for the repeated-measures ANOVA was not met. However, the F-ratio
was still statistically significant after correction using Greenhouse-Geisser (F=
33.315, df= 1.698, p= <0.001) and Huynh-Feldt (F= 33.315, df= 1.768, p=
<0.001) indicating the presence of a statistical difference between the three trials.
The pairwise comparisons indicated that trial 1 was statistically different from the
rest (p= <0.001), but there was no difference between trial 2 and 3 (p= 0.728),
indicating the presence of a learning curve in performing the methods.

53
DISCUSSION/CONCLUSION
This research provides empirical evidence to evaluate two previously published
claims. First, Ullrich and Stephan (2011) stated that previous research (Stephan et al.,
2003; Rynn and Wilkinson, 2006) performed Gerasimov’s two-tangent method
incorrectly and consequently, did not provide valid accuracy testing. This critique of
nasal projection testing also applies to the study by López et al. (2010) and Rynn et al.
(2010). The two-tangent method developed by Mikhail M. Gerasimov in the 1960s is
performed by drawing a first tangent following the general direction of the last third of
the nasal bone and a second tangent following the direction of the anterior nasal spine.
The approximated nasal tip is situated at the intersection between of the two tangents.
These guidelines, used by many forensic facial approximation practitioners, are from the
English translation of Gerasimov’s book Ich suchte Gesichter (1968), known as The Face
Finder (Gerasimov, 1971). However, Ullrich and Stephan (2011) argue that Gerasimov
himself did not follow these exact guidelines. They claim that Gerasimov used the tip of
the nasal bone at rhinion (last 1-2 mm) for the first tangent and the general direction of
the anterior part of the nasal floor beside the anterior nasal spine and vomer bone (Ullrich
and Stephan, 2011).
The second claim is that Gerasimov’s two-tangent method is accurate to predict a
point on the nasal tip and not necessarily the most projecting point as defined by the
Frankfurt Horizontal Plane (FHP). Previous research (Stephan et al., 2003; López et al.,
2010) defined their gold standard as the most projecting point when the skull is placed in
the Frankfurt Horizontal Plane. However, Gerasimov did not specify how the cranium
needed to be placed and did not provide a definition of nasal tip. Rynn and Wilkinson

54
(2006) determined that the two-tangent method was accurate for approximating the tip of
the nose when it was defined using the nasal spine line and inaccurate using FHP. The
difference in nasal tip definition is the reason for poor results in the research by Stephan
et al. (2003).
The results of this research validate the statements made by Ullrich and Stephan
(2011), and confirm previous finding by Rynn and Wilkinson (2006) and ultimately
establish which method is the most accurate. To begin, the first section of this chapter
will discuss the error between tangent 1 (last third of the nasal bone) and tangent 3 (last
1-2 mm of the nasal bone), and the error between tangent 2 (anterior nasal spine) and
tangent 4 (nasal floor). Following this, the accuracy of each method to approximate the
nasal tip defined by FHP (reference point 1) compared to NSL (reference point 2) is
discussed. The third section discusses the effect of intraobserver error and the experience
of the practitioner on estimates. Finally, the last section examines in more detail the
outliers observed in the present study.
Tangent selection
The direction of the tangent following the nasal bone mostly affects the position
of the tip of the nose on the anteroposterior plane. The position of the first tangent will
increase or decrease the difference with the true tip along the X-axis (Fig. 21).
Consequently, by comparing the mean difference in position of X calculated for Method
1 versus 3 and again for Methods 2 versus 4, it is possible to determine the overall effect
of the nasal bone tangent on facial estimation of the nose. A repeated-measures ANOVA
shows that all the mean differences in the position X are statistically different from one
another (Table 4). However, the methods which use tangent 1 (last third of nasal bone)

55
consistently resulted in greater means compared to the method using tangent 2 (last 1-2
mm) independently from the other tangent or true nasal tip used (Table 4). In other
words, using the general direction of the last third of the nasal bone is less accurate. This
supports the statement made by Rynn and Wilkinson (2006) and reiterated by Ullrich and
Stephan (2011) that the general direction of the last 1-2 mm of the nasal bone should be
used for the first tangent.
Figure 21: Direction of error from tangents
In the same way, if we compare Methods 1 to 2 and Methods 3 to 4 using the
difference in Y, the effect of the other tangent can be determined (Fig. 21). A repeated-
measures ANOVA indicates that all the mean differences along the Y-axis are
statistically different from each other with the exception of one (p=0.300). The mean
difference using reference point 2 is not statistically different between Methods 3 and 4.
In other words, using the general direction of the nasal floor instead of the anterior nasal
spine does not result in a more accurate approximation of the nasal tip along the NSL.
Nonetheless, the mean difference is consistently smaller for the methods that use tangent

56
4. Consequently, despite the fact that Methods 3 and 4 do not result in statistically
different approximations, Method 4 is slightly better in positioning the tip of the nose
along the Y-axis by about 1.5mm.
Nasal projection methods
Based on the previous tangent analysis, it is expected that as a whole, Method 1
would have performed the worst and Method 4 the best. This is supported by the mean
absolute distance for each method. Method 1 has the largest means (19.3667 and 11.926),
or deviation from the true position of the nose, for both reference points. It is consistent
with the tangent analysis that identified the two tangents defined by the literal translation
as introducing the largest amount of error. Method 4 has the smallest means for both
reference points (8.8530 and 5.4379), which is again expected from the t-test and
ANOVA of the differences in the estimation of the nose tip in both the X and Y axis.
Finally, the mean difference was not found to be statistically different between Methods 2
and 3, independent of the reference point. This is consistent with the fact that these two
methods use a combination of the old and new tangent definitions. It is possible to
conclude that overall, the new interpretation of Gerasimov’s two-tangent method
provides more accurate results than the literal translation. However, the new
interpretation is only slightly better at approximating the true nasal tip as defined by
NSL, compared to the tangent combination of the last 1-2 mm of the nasal bone and the
general direction of the nasal spine by an average distance of 3.065 mm.
Despite this improvement, all the absolute distances and calculated differences in
X and Y for all the methods are statistically significantly different from zero. In other
words, none of the methods tested can correctly approximate the position of the nasal tip

57
despite one method having a significantly smaller mean difference than the others. Using
the reference point 1, all methods underestimated the tip of the nose along the vertical
plane (Y-axis). Methods 1 and 2, which both use tangent 1, consistently overestimated
the tip along the anteroposterior plane (X-axis). On the other hand, Methods 3 and 4,
which used tangent 3, tended to underestimate the position of the tip. It was anticipated,
based on the studies by Stephan et al. (2003), Rynn and Wilkinson (2006) and López et
al. (2010) that all the methods would not be able to accurately determine the position of
pronasale. On the other hand, Method 3, which used the last 1-2 mm of the nasal bone
and the nasal spine, was previously found to be highly accurate to predict a point on the
tip of the nose (Rynn and Wilkinson, 2006) but was not supported by this research. In
addition, the two studies report significantly smaller mean differences from the true tip
compared to here (Table 8). It is possible that these differences are the result of the
inexperience of this investigator as a facial approximation practitioner, the impact of
which will be discussed in more detail in the following section.
Table 8: Comparison of mean differences (mm)
Method 1 (FHP) Method 3 (FHP) Method 3 (NSL)
Stephan et al. (2003)
Current study
Rynn and Wilkinson
(2006)
Current study
Rynn and Wilkinson
(2006)
Current study
X male 6.2 -0.91 -0.16
X female 4.3
-13.372
-0.9
3.092
n/a
-4.320
Y male 7.5 -3.61 -0.34
Y female 6.7
-10.978
-3.54
-9.131
n/a
-1.565

58
Intraobserver error
The original guidelines for the two-tangent method seem to be very clear and
should be easily applicable by the practitioner. However, the guidelines were criticized
by Stephan et al. (2003), where the two-tangent method was found to be inaccurate.
According to them, “this was not surprising, since the technique seemed rather subjective
and imprecise because it relied on the “general directions” of two bones”. (Stephan et al.,
2003: 245) Similarly, Rynn et al. (2010) explained that the inaccuracy is due to the fact
that the method “utilizes lines projected at tangents to curved bone, the angles of which
are evidently indicative of the form of the nose, but the placement of which is
subjectively determined by the practitioner.” Consequently, subjectivity results in
inaccuracy (Rynn et al., 2010) and is the probable cause for the unrepeatability, as
identified by Ullrich and Stephan (2011) and Gerasimov, himself (Gerasimov, 1955). For
that reason, a significant difference between all three trials was expected. However, there
was not a statistically significant difference between the second and third trial according
to the repeated-measures ANOVA (p= 0.728). This suggests that there is a greater
learning curve for the inexperienced practitioner since the first trial was significantly
different than the following trial. Nevertheless, after that initial experience, the methods
were repeated with an average difference of 0.678 mm. The inexperience of this
researcher may account for the higher mean differences observed in this study as
compared to other studies when performed by extremely experienced practitioners of
forensic facial approximation (Table 8). In particular, a small error in the angle of the
tangent at the nasal bone results in an error of several millimetres at the other end of the
tangent.

59
Outliers
Individual 09011340, an outlier removed from the dataset, is a great example of
the need for experience by the practitioner and how the subjectivity identified by Stephan
et al. (2003) and Rynn et al. (2010) is not only caused by the curved morphology of the
nasal bones. Individual 09011340 is an 87 year old male that exhibited a very straight
nasal bone (Fig. 22), where the general direction is the same using the last third or last 1-
2 mm of the nasal bone. The tangent following the general direction of the nasal bone is
easily placed because the bone is straight. However, it greatly overestimates the true tip
of the nose. As seen in Figure 23, a modified placement of the tangent to only touch the
extreme end of the nasal bone provides significantly better results.
Figure 22: Nasal bone of Individual 09011340
Figure 23: Tangent placement for individual 09011340
General direction
Modified

60
Two additional individuals with straight nasal bones were identified in Figures 18
and 19, with an asterisk, both outliers but only for some of the methods. The placement
of the tangent resulted in the same problem as the previous example and can be solved by
using a modified tangent that follows the edge at the end of the bone, angling downward
(Fig. 24). The modified tangent is also supported by the analysis of dissected noses of six
males and six female cadavers by Anderson et al. (2008). They noticed that “the superior
border of the septal cartilage does not form a linear extension of the profile contour of the
nasal bones but angles downwards.” (Anderson et al., 2008:212)
Figure 24: Additional example of modified tangent
11181145, male, 31 years old
09021236, male 27 years old
Finally, individual 02271145b, with a curved nasal bone, was also identified as an
outlier due to the placement of the first tangent following the nasal bone. It is suggested
that an experienced practitioner, who has seen numerous nasal bones and their associated
soft tissue, could have been able to identify the issue and correctly placed the tangent.
These specific cases confirm that the guidelines provided by Gerasimov to follow the
general direction of the nasal bone is imprecise and support the claim made by the other

61
practitioners that the original guideline is not accurate (Rynn and Wilkinson, 2006;
Ullrich and Stephan, 2011)
General discussion
Helmer et al. (1993) explained that the discrepancies between facial
approximation is due to the lack of adherence by practitioners to standardized principles
and the lack of universal guidelines. This problem also affects the positioning of the nasal
tip. Practitioners have the choice between a total of six different methods with the two-
tangent method being the most commonly used. However, putting into place universal
guidelines is not necessary for successful approximations as more than one method can
be equally reliable. Ullrich and Stephan (2011) argued that previous accuracy testing of
the two-tangent method are invalid because they did not perform the method as
Gerasimov intended. They even dismissed the results of Rynn and Wilkinson (2006) who
determined that a combination of the old and newly defined tangents provides more
accurate nasal projections. On the other hand, this current research establishes that there
are no statistical differences between the tangent combination (Method 3) as tested by
Rynn and Wilkinson (2006) and the new interpretation of the two-tangent method
(Method 4). In other words, using the general direction of nasal floor or the anterior nasal
spine does not provide statistically better results. This support the fact that a universal
guideline might not be the solution to better facial approximations and that Ullrich and
Stephan (2011) may have too readily dismissed the previous research. The most
important thing is that the method is accurate, regardless of how Gerasimov truly
positioned the two tangents.

62
From a practical point of view, the tangent following the nasal floor provides
slightly better results than the nasal spine tangent. Therefore, in theory, the nasal floor
should be used for the two-tangent method. However, the craniums used for actual
forensic cases are affected by a wide range of postmortem processes and are not
necessarily in perfect condition. Since there is no statistical differences between the two
tangents, the practitioner can choose between the two tangents depending on the presence
or absence of damage on the nasal spine or the nasal floor. The fact that craniums are
often damaged emphasizes the need for a list of reliable facial feature guidelines to
choose from in situations where a number of cranial structures are missing or damaged.
However, accurate facial features do not necessarily equate to successful facial
approximations because in the end, the approximated face has to be recognized by
someone to create an investigative lead.
The nose is one of the three most significant features for recognition (Briggs and
Martakis, 1998). Rynn et al. (2010) stated that the two-tangent method has good accuracy
with an error of ± 2 mm. López et al. (2010) used a cut off point of ±5 mm to
differentiate between successful and non-successful nasal projection. However, neither
specifies their reasoning for choosing that specific cut off point. It is known that the
interrelationship of facial features is important (Bruce and Young, 1998) and that small
differences can result in substantial changes to the facial features (Enlow and Hans,
1996). Consequently, how much error can be allowed before it has a significant impact
on the recognition process? In addition, when the approximated face is disseminated in
the media, the goal is for it to be recognized by a family member or a friend and the facial
features become more important with familiarity, or when the individual is not a stranger

63
(Bruce and Young, 1998). Similarly, changes to the soft tissue of the face can influence
the perceived age of the individual (Todd et al., 1980) and can affect the recognition
process. This research very consistently positions the tip of the nose more forward and
downward compared to the true nasal tip. It is known that the nose continues to move
forward and downward with age (Albert et al., 2007), which raises the question that if the
nasal tip is overestimated will it make the individual look older and interfere with
recognition?
Nevertheless, this research provides important validating information about the
two-tangent nasal projection method. Like any research, there are limitations due to the
sample and advantages stemming from the use of CT scans. Comparable to the majority
of research in forensic facial approximation, the sample used here is from a Caucasian
population. The use of a Caucasian sample limits the extrapolation of the results to other
population groups. Within the nasal projection literature, only Rynn et al. (2010) used a
sample that included more than one ancestral group (White, Asian and African
American) and resulted in accurate nasal projections using the two-tangent method. The
other issue with the sample used for this research is that body mass index (BMI)
information was not available. It was apparent from the 3D rendering of the face that
some individuals fell within a higher BMI range than others, though that could not be
confirmed. This missing information could influenced the accuracy of the two-tangent
method for some individuals since the amount and location of fat on the nose varies
between individuals (Anderson et al., 2008). BMI has also been found to affect facial
approximations in general because of its effect on soft tissue thickness (De Greef et al.,
2009).

64
The scans used for this research were from deceased individuals and they were
scanned at 2.0 mm slice intervals with a 3.0 mm slice thickness. The type of scanner used
and parameters such as slice thickness and interval directly affects the image resolution
(Cavalcanti et al., 2004). Previous research in forensic anthropology and forensic facial
approximation have used scans with slice thicknesses ranging from 0.9 mm to 3 mm
(Cavalcanti et al., 2004; Pfaeffli et al., 2007; Ferrant et al., 2009; Ramsthaler et al., 2010;
Sakuma et al., 2010). The smaller the slice thickness, the more detailed information is
recorded and the more accurate the volume rendering. However, multislice CT scanning
of individuals to very high accuracy level means the use of potentially dangerous doses of
radiation (Quatrehomme et al., 1997; Nelson and Michael, 1998). As a result, the CT
databases are limited to patient data, incomplete scans or deceased individuals. In
addition, CT images of deceased individuals are acquires in a horizontal or supine
position, when we most often view people while in a standing upright position.
Consequently, due to gravity, the shape of the face visualize from the CT images will
differ from the typical upright face of a living individual (Claes et al., 2010).
The effect of gravity on facial soft tissues might have affected this research. The
majority of individuals included in this research resulted in larger overestimations of the
nasal tip compared to previous validation studies that used lateral radiographs (Table 8).
The overestimation might have increased due to the supine position of the individuals
during scanning. However, this problem may be avoided with the recent development of
a new type of CT scanner. Cone-beam CT (CBCT) can produce scans with slice
thicknesses as small as 0.1-0.2 mm (Sakuma et al., 2010) with significantly less radiation
than the multislice CT (Lee et al., 2011). In addition, the subject can be scanned in an

65
upright position (Claes et al., 2010). Consequently, "the 3D image of a face taken from
the CBCT may also allow a comparison between the face of a subject and the facial
reconstruction without the soft tissue distortion caused by gravity and body position."
(Sakuma et al., 2010:320) Finally, the use of CBCT can also reduce artifacts caused by
dental modifications such as fillings. CT scan of live subjects have been used in more
recent research (Tilotta et al., 2009; Lee et al., 2011) and is likely the future of accuracy
testing for anthropological and forensic facial approximation methods.
Future directions
During the last decade, the use of CT scans and 3D volume rendering has gained
popularity in the field of forensic anthropology. Identification of human remains is
sometimes based on the study of anthropometric characteristics (Cavalcanti et al., 2004).
Forensic anthropologists study the skeleton and use tested methods to determine age, sex
and ancestry. However, the majority of these methods have been developed on
populations that lived decades ago and there is a lack of recent bone collections.
However, studies have shown that volume rendering from CT scans provides accurate
information for sex determination (Ramsthaler et al., 2010) and age estimation (Ferrant et
al., 2009). There is a clear need for research using different ancestral groups but a lack of
databases available to do so. CT scans, especially with the development of CBCT, is a
solution to create new datasets of recent populations from various populations (Claes et
al., 2010; Ramsthaler et al., 2010). Improvement of the traditional anthropological
methods using these new databases will directly impact the field of forensic facial
approximation by providing more accurate biological profiles.

66
CT scanning also provides the opportunity for follow up research using the same
sample but analyzing different anatomical structures and measurements that might not be
possible from a radiograph. As an example, the difference in the nasal projection results
between this research and other validation studies might be caused by the use of deceased
individuals. However, the variability can also be caused by the subjectivity in placing the
tangent and possibly correlated lack of experience. It is realistic to assume that the
forensic facial approximation practitioner might not have seen numerous craniums with
the associated soft tissue to gain experience about the interrelationship of soft and hard
tissue. A solution needs to be provided to reduce subjectivity and eliminate the effect of
experience. The goal of Rynn et al.’s (2010) research was to create regression equations
that would provide metrical limitations to the shape of the nose while using the two-
tangent method. Despite the fact that the regression equations need to be validated, it
would be useful to determine how the new interpretation of the two-tangent method
performs within these metrical limitations using the same sample as this research.
Finally, another aspect of forensic facial approximation and nasal projection that
needs additional research relates to the process of recognition. There is a great amount of
research about facial recognition in the psychological literature (Bruce and Young, 1998).
However, there is an obvious need for additional research with practical applications for
forensic facial approximations such as investigating the maximum deviation or error
allowed in the position, size and shape of the facial features, including the nose, before it
starts affecting recognition to the point of non-identification. Overall, there is a need in
research to shift from traditional radiographs to CBCT in order to have access to highly

67
accurate reconstructions from living individuals and use that to better test the accuracy of
facial approximations based on successful recognition.
Conclusion
This research used a database of CT scans from deceased Danish individuals to
determine how to perform the two-tangent method in order to achieve the best accuracy
for approximating the position of the tip of the nose. The main goal was to compare
Gerasimov’s two-tangent method, as described in his work translated in English
(Gerasimov, 1971) to the new guidelines presented by Ullrich and Stephan (2011). The
literal translation of the two-tangent method uses the intersection of a first tangent
following the last third of the nasal bone and a second tangent following the general
direction of the nasal spine (Gerasimov, 1971). The new guideline is based on the claim
that Gerasimov did not adhere to the translated guideline but instead used the general
direction of the nasal floor and the last 1-2 mm of the nasal bone (Ullrich and Stephan,
2011). It is clear that the definition of the tangents directly correlates with the success of
the method. Similarly, the accuracy depends on the comparison to the true nose which
can be defined in multiple ways. As a result, the research also had two secondary goals to
better evaluate the success of the two-tangent method.
The first secondary goal was to determine how each tangent independently
affected the resulting nasal projection. To do so, two methods using a combination of the
translated and new tangent definition were compared. The second secondary goal was
based on the results from the accuracy study by Rynn and Wilkinson (2006). The nasal
tip is usually defined as the most projecting point when the skull is placed in the
Frankfurt Horizontal plane (FHP), also known as pronasale. However, Gerasimov did not
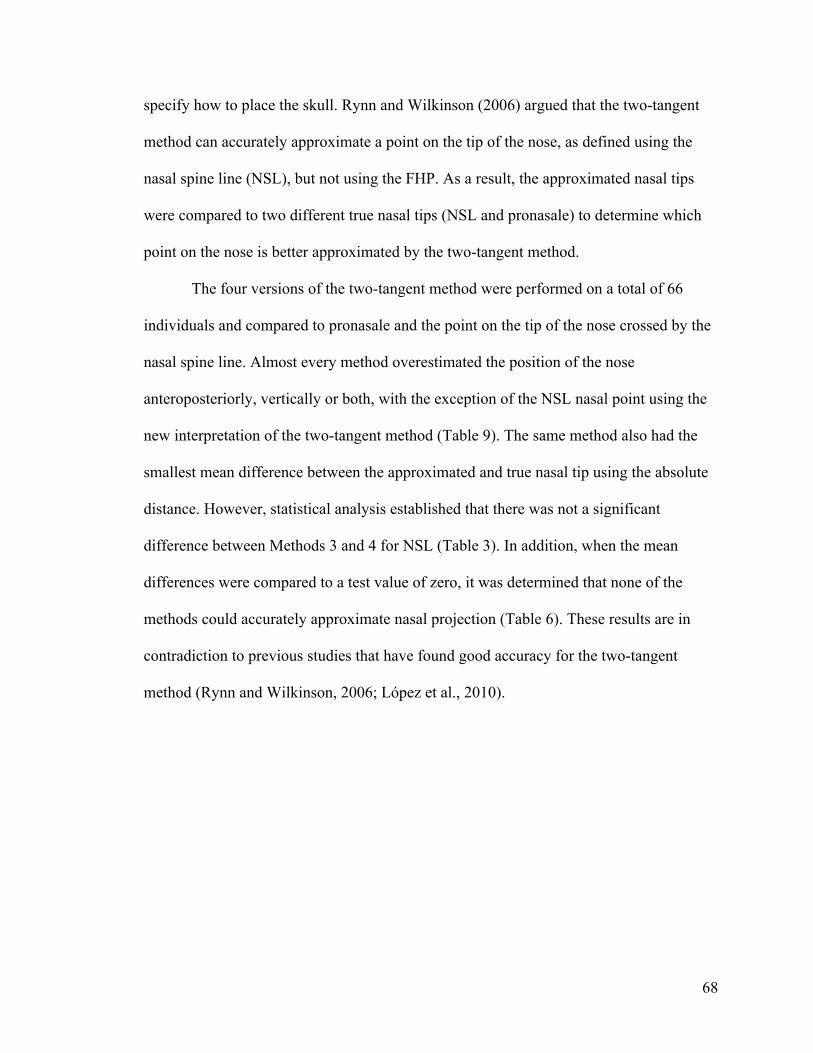
68
specify how to place the skull. Rynn and Wilkinson (2006) argued that the two-tangent
method can accurately approximate a point on the tip of the nose, as defined using the
nasal spine line (NSL), but not using the FHP. As a result, the approximated nasal tips
were compared to two different true nasal tips (NSL and pronasale) to determine which
point on the nose is better approximated by the two-tangent method.
The four versions of the two-tangent method were performed on a total of 66
individuals and compared to pronasale and the point on the tip of the nose crossed by the
nasal spine line. Almost every method overestimated the position of the nose
anteroposteriorly, vertically or both, with the exception of the NSL nasal point using the
new interpretation of the two-tangent method (Table 9). The same method also had the
smallest mean difference between the approximated and true nasal tip using the absolute
distance. However, statistical analysis established that there was not a significant
difference between Methods 3 and 4 for NSL (Table 3). In addition, when the mean
differences were compared to a test value of zero, it was determined that none of the
methods could accurately approximate nasal projection (Table 6). These results are in
contradiction to previous studies that have found good accuracy for the two-tangent
method (Rynn and Wilkinson, 2006; López et al., 2010).

69
Table 9: Summary of the data Mean difference (mm), overestimate +, underestimate --
Pronasale / FHP NSL Method* X Y Absolute X Y Absolute
1 -14.370 + -11.094 + 19.367 -21.749 + -3.515 + 22.933
2 -7.826 + -3.739 + 10.341 -10.347 + 0.542 -- 10.947
3 2.052 -- -9.252 + 12.433 -5.339 + -1.670 + 8.503
4 4.577 -- -4.398 + 8.853 2.053 -- -0.114 + 5.438
* 1= Literal translation, 2 = First combination, 3 = Second combination, 4 = New Interpretation
Despite these negative accuracy results, the research does provide answers to the
main goal and two secondary goals initially set. The main conclusions are that:
1) The new interpretation of the two-tangent method is better than the original
translation.
2) The tangent following the nasal bone causes most of deviation from the true
location of the nasal tip with greater accuracy using the last 1-2 mm.
3) The new two-tangent method is better at approximating a point on the tip of the
nose (NSL) than pronasale.
In addition, using the general direction of the nasal floor was slightly better (3.085 mm)
but not statistically different than using the anterior nasal spine. Consequently, from a
practical point a view, the nasal floor should be prioritized but the nasal spine is a good
alternative if the skull is damaged. Finally, it is important to mention that the two-tangent
method was not significantly affected by intraobserver error, but was more so by the level
of experience of the practitioner. The importance of experience is consistent with the
problem of subjectivity in placing the tangents as identified in previous research (Stephan

70
et al., 2003; Rynn et al., 2010). As a result, a good follow up would be to combine the
new interpretation of the two-tangent method with Rynn et al.’s (2010) regression
equations, which have been created to provide metrical limitations and to reduce
subjectivity in the shaping of the nasal tip.
This research helps to fill a gap in the knowledge of facial approximations by
providing empirical data to fully understand the effect of tangent positioning and
researcher experience on nasal projections using Gerasimov’s two-tangent method. It also
validated claims previously published in the forensic nasal approximation literature
(Ullrich and Stephan, 2011).

71
LITERATURE CITED
Albert AM, Ricanek K Jr., and Patterson E. 2007. A review of the literature on the aging adult skull and face: Implications for forensic science research and applications. Forensic Sci Int 172:1–9.
Anderson KJ, Henneberg M, and Norris RM. 2008. Anatomy of the nasal profile. J Anat 213:210–216.
Briggs CA, and Martakis M. 1998. Craniofacial anatomy. In: Craniofacial Identification in Forensic Medicine. New York: Hodder Arnold. p 37–48.
Bruce V, and Young A. 1998. In the eye of the beholder: the science of face perception. Oxford: Oxford University Press.
Brues AM. 1958. Identification of skeletal remains. J Crim Law Criminol Police Sci 48:551–563.
Cavalcanti M, Rocha SS, and Vannier MW. 2004. Craniofacial measurements based on 3D-CT volume rendering: implications for clinical applications. Dentomaxillofac Radiol 33:170–176.
Cavanagh D, and Steyn M. 2011. Facial reconstruction: soft tissue thickness values for South African black females. Forensic Sci Int 206:215.
Chaconas SJ. 1969. Statistical evaluation of nasal growth. Am J Orthod 56:403–414.
Chen F, Chen Y, Yu Y, Qiang Y, Liu M, Fulton D, and Chen T. 2011. Age and sex related measurement of craniofacial soft tissue thickness and nasal profile in the Chinese population. Forensic Sci Int 212:272.e1–272.e6.
Claes P, Vandermeulen D, De Greef S, Willems G, Clement JG, and Suetens P. 2010. Computerized craniofacial reconstruction: Conceptual framework and review. Forensic Sci Int 201:138–145.
Davy-Jow SL, Decker SJ, and Ford JM. 2012. A simple method of nose tip shape validation for facial approximation. Forensic Sci Int 214:208.e1–208.e3.
De Greef S, Claes P, Vandermeulen D, Mollemans W, Suetens P, and Willems G. 2006. Large-scale in-vivo Caucasian facial soft tissue thickness database for craniofacial reconstruction. Forensic Sci Int 159:S126–S146.
De Greef S, Vandermeulen D, Claes P, Suetens P, and Willems G. 2009. The influence of sex, age and body mass index on facial soft tissue depths. Forensic Sci Med Pathol 5:60–65.
Eggeling von H. 1913. Die Leistungsfähigkeit physiognomischer Rekonstruktionsversuche auf Grundlage des Schädels. Archiv Anthropol 12:44–47.

72
Enlow DH, and Hans MG. 1996. Essentials of facial growth. Philadelphia: Saunders.
Fernandes CMS, da Costa Serra M, da Silva JVL, Noritomi PY, de Sena Pereira FDA, and Melani RFH. 2012. Tests of one Brazilian facial reconstruction method using three soft tissue depth sets and familiar assessors. Forensic Sci Int 214:211.e1–211.e7.
Ferrant O, Rougé-Maillart C, Guittet L, Papin F, Clin B, Fau G, and Telmon N. 2009. Age at death estimation of adult males using coxal bone and CT scan: A preliminary study. Forensic Sci Int 186:14–21.
Field A. 2005. Discovering Statistics Using SPSS. SAGE Publications.
Friedman O. 2005. Changes Associated with the Aging Face. Facial Plast Surg Clin North Am 13:371–380.
Garlie TN, and Saunders SR. 1998. Midline Facial Tissue Thicknesses of Subadults from aLongitudinal Radiographic Study*. J Forensic Sci 44:61–67.
Gatliff BP, and Snow CC. 1979. From skull to visage. J Biocommun 6:27–30.
Gatliff BP. 1984. Facial sculpture on the skull for identification. Am J Forensic Med Pathol 5:327–332.
Genecov JS, Sinclair PM, and Dechow PC. 1990. Development of the nose and soft tissue profile. Angle Orthod 60:191–198.
George RM. 1987. The lateral craniographic method of facial reconstruction. J Forensic Sci 32:1305–1330.
George RM. 1993. Anatomical and artistic guidelines for forensic facial reconstruction. In: Helmer RP, İşcan MY, editors. Forensic analysis of the skull: craniofacial analysis, reconstruction, and identification. New York: Wiley-Liss. p 215–227.
Gerasimov MM. 1955. Vosstanovlenie lica po cerepu. Moskya: Akademii Nauk SSSR.
Gerasimov MM. 1968. Ich suchte Gesichter. Gutersloh: C. Bertelsmann Verlag.
Gerasimov MM. 1971. The face finder. London: Hutchinson & Co.
Gibson L. 2008. Forensic art essentials: a manual for law enforcement artists. Boston: Academic Press.
Guyomarc’h P, and Stephan CN. 2012. The validity of ear prediction guidelines used in facial approximation. J Forensic Sci doi: 10.1111-j.1556-4029.2012.02181.x.

73
Guyomarc’h P, Dutailly B, Couture C, and Coqueugniot H. 2012. Anatomical placement of the human eyeball in the orbit-validation using CT scans of living adults and prediction for facial approximation*. J Forensic Sci doi: 10.1111/j.1556-4029.2012.02075.x.
Helmer RP, Röhricht S, Petersen D, and Möhr F. 1993. Assessment of the reliability of facial reconstruction. In: Helmer RP, İşcan MY, editors. Forensic analysis of the skull: craniofacial analysis, reconstruction, and identification. New York: Wiley-Liss. p 229–246.
Hildebolt CF, Vannier MW, and Knapp RH. 1990. Validation study of skull three-dimensional computerized tomography measurements. Am J Phys Anthropol 82:283–294.
His W. 1895. Anatomische Forschungen über Johann Sebastian Bach Gebeine und Antliz nebst Bemerkungen über dessen Bilder. Abh MathPhysikal KI Kgl Sachs Ges Wiss 22:379–420.
Kak AC, and Slaney M. 2001. Principles of computerized tomographic imaging. Society for Industrial and Applied Mathematics.
Kollmann J, and Büchly W. 1898. Die persistenz der Rassen und die Reconstruction der Physiognomie prähistorischer Schädel. Arch fur Anthropol 22:329–359.
Krogman WM, and İşcan MY. 1986. The human skeleton in forensic medicine. Springfield: C.C. Thomas.
Lebedinskaya GV, Balueva TS, and Veselovskaya EV. 1993. Principles of facial reconstruction. In: Helmer RP, İşcan MY, editors. Forensic analysis of the skull: craniofacial analysis, reconstruction, and identification. New York: Wiley-Liss. p 183–198.
Lebedinskaya GV. 1998. Rekonstrukcija Lica po Cherepu. Moskva:Staryj Sad.
Lee W-J, Wilkinson CM, and Hwang H-S. 2011. An Accuracy Assessment of Forensic Computerized Facial Reconstruction Employing Cone-Beam Computed Tomography from Live Subjects. J Forensic Sci 57:318–327.
Lou L, Lagravere MO, Compton S, Major PW, and Flores-Mir C. 2007. Accuracy of measurements and reliability of landmark identification with computed tomography (CT) techniques in the maxillofacial area: a systematic review. Oral Surg Oral Med Oral Pathol Oral Radiol Endod 104:402–411.
López B, Schilling J, and Galdames IS. 2010. Evaluation of the pronasal point prediction methods for forensic facial reconstruction. Int J Morphol 28:1181–1188.
Macho GA. 1986. An appraisal of plastic reconstruction of the external nose. J Forensic Sci 31:1391–1403.

74
Macho GA. 1989. Descriptive morphological features of the nose - an assessment of their importance for plastic reconstruction. J Forensic Sci 34:902–911.
Manhein MH, Listi GA, Barsley RE, Musselman R, Barrow NE, and Ubelaker D. 2000. In vivo facial tissue depth measurements for children and adults*. J Forensic Sci 45:48–60.
McClintock Robinson J, Rinchuse DJ, and Zulio TG. 1986. Relationship of skeletal pattern and nasal form. Am J Orthod 89:499–506.
Montagu MFA. 1947. A study of man embracing error. Technol Rev 49:345–361.
Moore DS, and McCabe GP. 2006. Introduction to the practice of statistics. 5 ed. New York: W.H. Freeman and Company.
Neave R. 1998. Age changes to the face in adulthood. In: Clement JG, Ranson DL, editors. Craniofacial Identification in Forensic Medicine. New York: Hodder Arnold. p 225–231.
Neave RAH. 1979. Reconstruction of the head of three ancient Egyptian mummies. J Audiov Media Med 2:156–164.
Nelson LA, and Michael SD. 1998. The application of volume deformation to three-dimensional facial reconstruction: a comparison with previous techniques. Forensic Sci Int 94:167–181.
Panenková P, Beňuš R, Masnicová S, Obertová Z, and Grunt J. 2012. Facial soft tissue thicknesses of the mid-face for Slovak population. Forensic Sci Int doi: 10.1016-j.forsciint.2012.02.015.
Pfaeffli M, Vock P, Dirnhofer R, Braun M, Bolliger SA, and Thali MJ. 2007. Post-mortem radiological CT identification based on classical ante-mortem X-ray examinations. Forensic Sci Int 171:111–117.
Phillips VM, and Smuts NA. 1996. Facial reconstruction: utilization of computerized tomography to measure facial tissue thickness in a mixed racial population. Forensic Sci Int 83:51–59.
Prag J, and Neave R. 1997. Making faces: using forensic and archaeological evidence. London: British Museum Press.
Prokopec M, and Ubelaker D. 2002. FBI — Reconstructing the shape of the nose according to the skull. Forensic Science Communications 4:1–4.
Quatrehomme G, Cotin S, Subsol G, Delinguette H, Garidel Y, Grévin G, Fidrich M, Bailet P, and Ollier A. 1997. A fully three-dimensional method for facial reconstruction based on deformable models. J Forensic Sci 42:649–652.

75
Ramsthaler F, Kettner M, Gehl A, and Verhoff MA. 2010. Digital forensic osteology: Morphological sexing of skeletal remains using volume-rendered cranial CT scans. Forensic Sci Int 195:148–152.
Reichs KJ, and Craig E. 1998. Facial approximation: procedures and pitfalls. In: Reichs KJ, editor. Forensic osteology: advances in the identification of human remains. Springfield: Charles C. Thomas. p 491–532.
Rhine JS. 1990. Coming to terms with facial reproduction. J Forensic Sci 35:960–963.
Rynn C, and Wilkinson CM. 2006. Appraisal of traditional and recently proposed relationships between the hard and soft dimensions of the nose in profile. Am J Phys Anthropol 130:364–373.
Rynn C, Balueva T, and Veselovskaya E. 2012. Relationships between the skull and face. In: Wilkinson C, Rynn C, editors. Craniofacial Identification. New York: Cambridge University Press. p 193–202.
Rynn C, Wilkinson CM, and Peters HL. 2010. Prediction of nasal morphology from the skull. Forensic Sci Med Pathol 6:20–34.
Sakuma A, Ishii M, Yamamoto S, Shimofusa R, Kobayashi K, Motani H, Hayakawa M, Yajima D, Takeichi H, et al. 2010. Application of Postmortem 3D-CT Facial Reconstruction for Personal Identification*. J Forensic Sci 55:1624–1629.
Simpson E, and Henneberg M. 2002. Variation in soft-tissue thicknesses on the human face and their relation to craniometric dimensions. Am J Phys Anthropol 118:121–133.
Snow CC, Gatliff BP, and McWilliams KR. 1970. Reconstruction of facial features from the skull: an evaluation of its usefulness in forensic anthropology. Am J Phys Anthropol 33:221–228.
Starbuck JM, and Ward RE. 2007. The affect of tissue depth variation on craniofacial reconstructions. Forensic Sci Int 172:130–136.
Stephan CN, and Cicolini J. 2010. The reproducibility of facial approximation accuracy results generated from photo-spread tests. Forensic Sci Int 201:133–137.
Stephan CN, and Henneberg M. 2003. Predicting mouth width from inter-canine width - a 75% rule. J Forensic Sci 48:1–3.
Stephan CN, and Simpson EK. 2008. Facial soft tissue depths in craniofacial identification (part I): an analytical review of the published adult data*. J Forensic Sci 53:1257–1272.

76
Stephan CN, Henneberg M, and Sampson W. 2003. Predicting nose projection and pronasale position in facial approximation: A test of published methods and proposal of new guidelines. Am J Phys Anthropol 122:240–250.
Stephan CN, Norris RM, and Henneberg M. 2005. Does sexual dimorphism in facial soft tissue depths justify sex distinction in craniofacial identification? J Forensic Sci 50:1–6.
Stephan CN. 2002a. Facial approximation: globe projection guideline falsified by exophthalmommetry literature. J Forensic Sci 47:1–6.
Stephan CN. 2002b. Position of superciliare in relation to the lateral iris: testing a suggested facial approximation guideline. Forensic Sci Int 130:29–33.
Stephan CN. 2003. Facial approximation: An evaluation of mouth-width determination. Am J Phys Anthropol 121:48–57.
Stephan CN. 2005. Facial approximation: a review of the current state of play for archaeologists. Int J Osteoarchaeol 15:298–302.
Stephan CN. 2006. Beyond the sphere of the English facial approximation literature: ramifications of German papers on Western method concepts*. J Forensic Sci 51:736–739.
Stephan CN. 2010. The human masseter muscle and its biological correlates: A review of published data pertinent to face prediction. Forensic Sci Int 201:153–159.
Subtelny JD, and Rochester NY. 1959. A longitudinal study of soft tissue facial structures and their profile characteristics, defines in relation to underlying skeletal structures. Am J Orthod 45:481–507.
Suk V. 1935. Fallacies of anthropological identifications. Publ Facultae Sci Univ Masaryk:3–18.
Taylor KT. 2001. Forensic art and illustration. Boca Raton, Florida: CRC Press.
Tilotta F, Richard F, Glaunès J, Berar M, Gey S, Verdeille S, Rozenholc Y, and Gaudy JF. 2009. Construction and analysis of a head CT-scan database for craniofacial reconstruction. Forensic Sci Int 191:112.e1–112.e12.
Todd JT, Mark LS, Shaw RE, and Pittenger JB. 1980. The perception of human growth. Scientific American 242:132–144.
Tyrrell AJ, Evison MP, Chamberlain AT, and Green MA. 1997. Forensic three-dimensional facial reconstruction: Historical review and contemporary developments. J Forensic Sci 42:653–661.

77
Ullrich H, and Stephan CN. 2011. On Gerasimov’s plastic facial reconstruction technique: new insights to facilitate repeatability*. J Forensic Sci 56:470–474.
Ullrich H. 1958. Die methodischen Grundlagen des plastischen Rekonstruktionsverfahrens nach Gerasimov. Zeitschrift fur Morpholologie und Anthropologie 49:245–258.
Ullrich H. 1966. Kritische Bemerkungen zur plastischen Rekonstruktionsmethode nach Gerasimov auf Grund personlicher Erfahrugen. Ethnographisch-archäologische Zeitschrift 7:111–123.
Ullrich H. 1967. Plastische Gesichtsrekonstructionen urgeschichtlicher Menschen nach der Methode von Gerasimov. Neue Museumskunde 10:456–475.
Vannier MW, Conroy GC, Marsh JL, and Knapp RH. 1985. Three-dimensional cranial surface reconstructions using high-resolution computed tomography. Am J Phys Anthropol 67:299–311.
Verzé L. 2009. History of facial reconstruction. Acta Biomed 80:5–12.
Webb AG. 2002. Introduction to Biomedical Imaging. John Wiley & Sons.
Welcker H. 1883. Schiller's Schädel und Todtenmaske: nebst Mittheilungen über Schädel und Todtenmaske Kant's. Braunschweig: Friedrich Vieweg und Sohn.
Wilkinson C, Rynn C, Peters H, Taister M, Kau CH, and Richmond S. 2006. A blind accuracy assessment of computer-modeled forensic facial reconstruction using computed tomography data from live subjects. Forensic Sci Med Pathol 2:179–187.
Wilkinson C. 2004. Forensic facial reconstruction. Cambridge: Cambridge University Press.
Wilkinson C. 2005. Computerized forensic facial reconstruction: a review of current systems. Forensic Sci Med Pathol 1:173–177.
Zimbler M, Kokoska M, and Thomas J. 2001. Anatomy and Pathophysiology of Facial Aging. Facial Plast Surg Clin North Am 9:1–9.